Albemarle, NC Map & Demographics
Albemarle Map
Albemarle Overview
$27,698
PER CAPITA INCOME
$69,300
AVG FAMILY INCOME
$51,673
AVG HOUSEHOLD INCOME
31.4%
WAGE / INCOME GAP [ % ]
68.6¢/ $1
WAGE / INCOME GAP [ $ ]
0.45
INEQUALITY / GINI INDEX
16,444
TOTAL POPULATION
7,935
MALE POPULATION
8,509
FEMALE POPULATION
93.25
MALES / 100 FEMALES
107.23
FEMALES / 100 MALES
39.7
MEDIAN AGE
3.0
AVG FAMILY SIZE
2.4
AVG HOUSEHOLD SIZE
7,816
LABOR FORCE [ PEOPLE ]
58.2%
PERCENT IN LABOR FORCE
6.6%
UNEMPLOYMENT RATE
Albemarle Zip Codes
Income in Albemarle
Income Overview in Albemarle
Per Capita Income in Albemarle is $27,698, while median incomes of families and households are $69,300 and $51,673 respectively.
| Characteristic | Number | Measure |
| Per Capita Income | 16,444 | $27,698 |
| Median Family Income | 4,094 | $69,300 |
| Mean Family Income | 4,094 | $78,214 |
| Median Household Income | 6,535 | $51,673 |
| Mean Household Income | 6,535 | $65,557 |
| Income Deficit | 4,094 | $0 |
| Wage / Income Gap (%) | 16,444 | 31.44% |
| Wage / Income Gap ($) | 16,444 | 68.56¢ per $1 |
| Gini / Inequality Index | 16,444 | 0.45 |
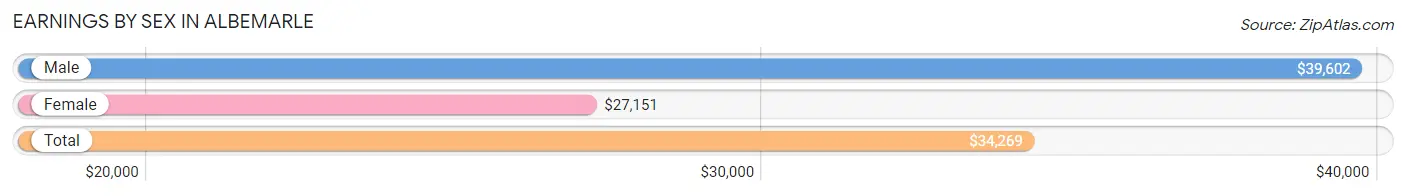
Earnings by Sex in Albemarle
Average Earnings in Albemarle are $34,269, $39,602 for men and $27,151 for women, a difference of 31.4%.
| Sex | Number | Average Earnings |
| Male | 4,311 (53.5%) | $39,602 |
| Female | 3,740 (46.5%) | $27,151 |
| Total | 8,051 (100.0%) | $34,269 |
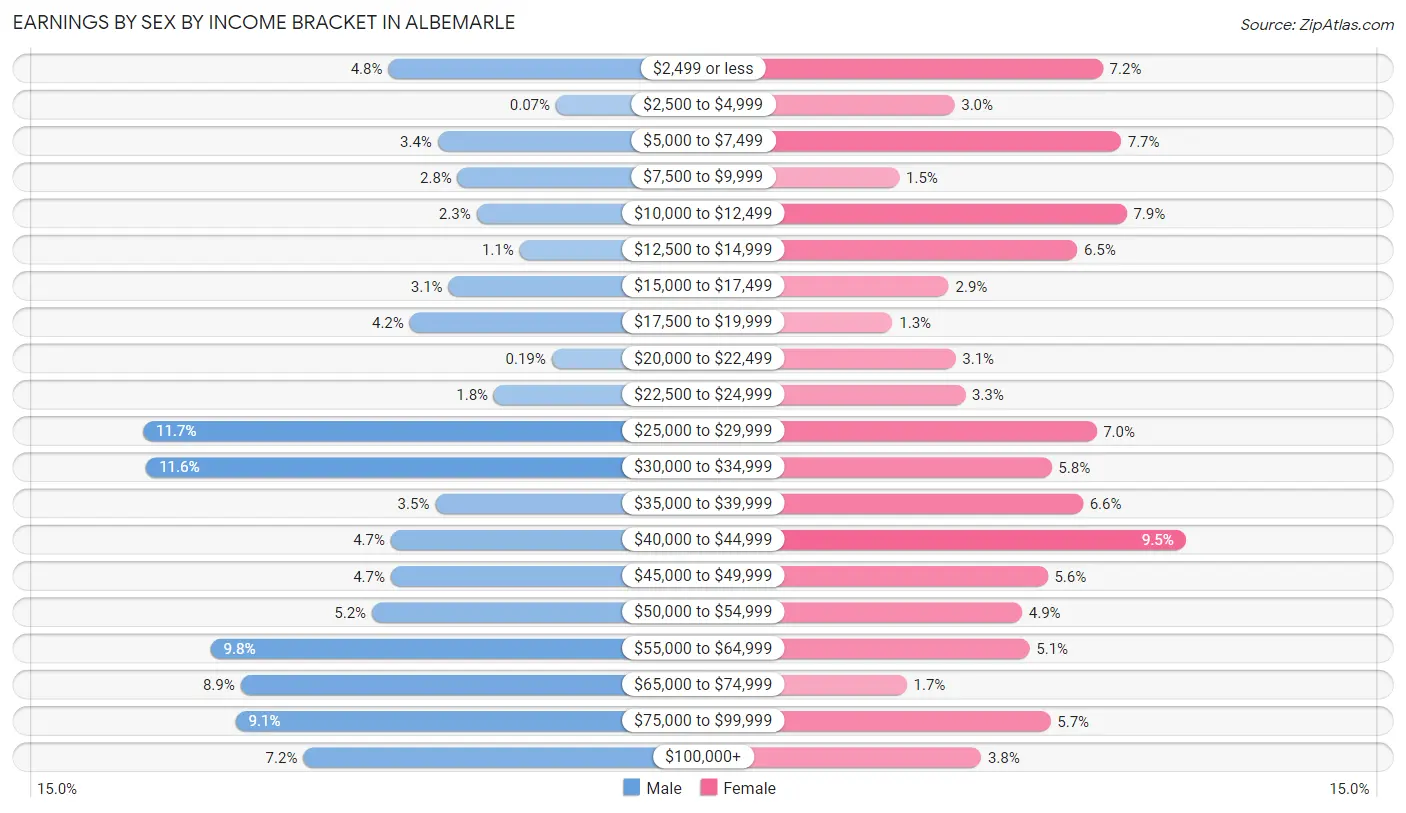
Earnings by Sex by Income Bracket in Albemarle
The most common earnings brackets in Albemarle are $25,000 to $29,999 for men (503 | 11.7%) and $40,000 to $44,999 for women (356 | 9.5%).
| Income | Male | Female |
| $2,499 or less | 206 (4.8%) | 269 (7.2%) |
| $2,500 to $4,999 | 3 (0.1%) | 113 (3.0%) |
| $5,000 to $7,499 | 146 (3.4%) | 288 (7.7%) |
| $7,500 to $9,999 | 122 (2.8%) | 55 (1.5%) |
| $10,000 to $12,499 | 99 (2.3%) | 294 (7.9%) |
| $12,500 to $14,999 | 47 (1.1%) | 242 (6.5%) |
| $15,000 to $17,499 | 133 (3.1%) | 107 (2.9%) |
| $17,500 to $19,999 | 180 (4.2%) | 48 (1.3%) |
| $20,000 to $22,499 | 8 (0.2%) | 114 (3.0%) |
| $22,500 to $24,999 | 78 (1.8%) | 124 (3.3%) |
| $25,000 to $29,999 | 503 (11.7%) | 262 (7.0%) |
| $30,000 to $34,999 | 499 (11.6%) | 215 (5.8%) |
| $35,000 to $39,999 | 149 (3.5%) | 248 (6.6%) |
| $40,000 to $44,999 | 203 (4.7%) | 356 (9.5%) |
| $45,000 to $49,999 | 203 (4.7%) | 211 (5.6%) |
| $50,000 to $54,999 | 226 (5.2%) | 184 (4.9%) |
| $55,000 to $64,999 | 421 (9.8%) | 192 (5.1%) |
| $65,000 to $74,999 | 385 (8.9%) | 63 (1.7%) |
| $75,000 to $99,999 | 391 (9.1%) | 214 (5.7%) |
| $100,000+ | 309 (7.2%) | 141 (3.8%) |
| Total | 4,311 (100.0%) | 3,740 (100.0%) |
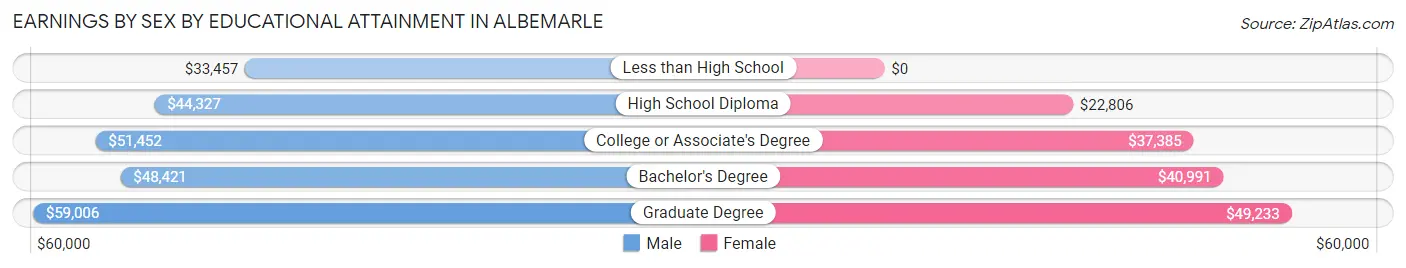
Earnings by Sex by Educational Attainment in Albemarle
Average earnings in Albemarle are $48,077 for men and $35,124 for women, a difference of 26.9%. Men with an educational attainment of graduate degree enjoy the highest average annual earnings of $59,006, while those with less than high school education earn the least with $33,457. Women with an educational attainment of graduate degree earn the most with the average annual earnings of $49,233, while those with high school diploma education have the smallest earnings of $22,806.
| Educational Attainment | Male Income | Female Income |
| Less than High School | $33,457 | $0 |
| High School Diploma | $44,327 | $22,806 |
| College or Associate's Degree | $51,452 | $37,385 |
| Bachelor's Degree | $48,421 | $40,991 |
| Graduate Degree | $59,006 | $49,233 |
| Total | $48,077 | $35,124 |
Family Income in Albemarle
Family Income Brackets in Albemarle
According to the Albemarle family income data, there are 839 families falling into the $100,000 to $149,999 income range, which is the most common income bracket and makes up 20.5% of all families. Conversely, the $200,000+ income bracket is the least frequent group with only 164 families (4.0%) belonging to this category.
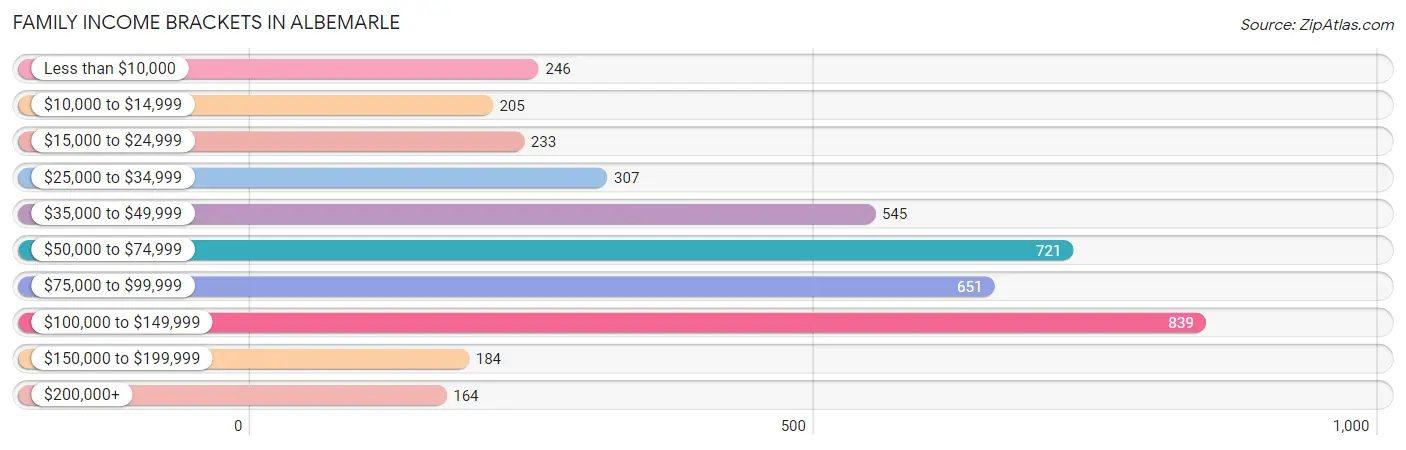
| Income Bracket | # Families | % Families |
| Less than $10,000 | 246 | 6.0% |
| $10,000 to $14,999 | 205 | 5.0% |
| $15,000 to $24,999 | 233 | 5.7% |
| $25,000 to $34,999 | 307 | 7.5% |
| $35,000 to $49,999 | 545 | 13.3% |
| $50,000 to $74,999 | 721 | 17.6% |
| $75,000 to $99,999 | 651 | 15.9% |
| $100,000 to $149,999 | 839 | 20.5% |
| $150,000 to $199,999 | 184 | 4.5% |
| $200,000+ | 164 | 4.0% |
Family Income by Famaliy Size in Albemarle
7+ person families (67 | 1.6%) account for the highest median family income in Albemarle with $136,653 per family, while 2-person families (2,197 | 53.7%) have the highest median income of $35,216 per family member.
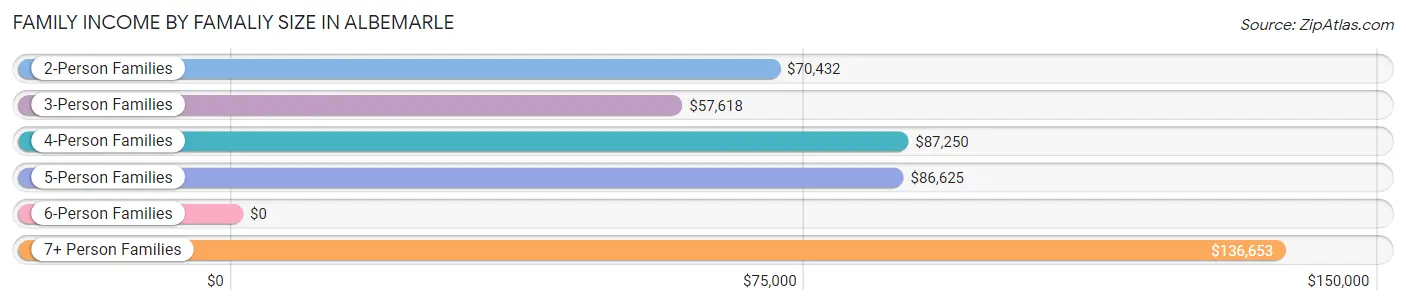
| Income Bracket | # Families | Median Income |
| 2-Person Families | 2,197 (53.7%) | $70,432 |
| 3-Person Families | 897 (21.9%) | $57,618 |
| 4-Person Families | 680 (16.6%) | $87,250 |
| 5-Person Families | 119 (2.9%) | $86,625 |
| 6-Person Families | 134 (3.3%) | $0 |
| 7+ Person Families | 67 (1.6%) | $136,653 |
| Total | 4,094 (100.0%) | $69,300 |
Family Income by Number of Earners in Albemarle
The median family income in Albemarle is $69,300, with families comprising 3+ earners (422) having the highest median family income of $125,954, while families with no earners (608) have the lowest median family income of $40,104, accounting for 10.3% and 14.8% of families, respectively.
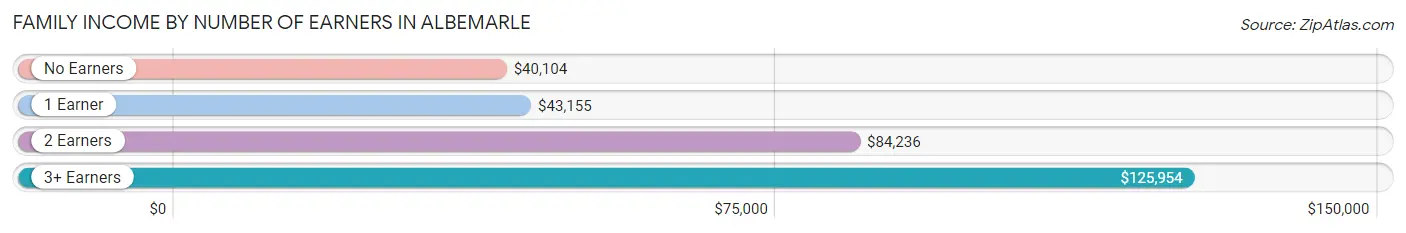
| Number of Earners | # Families | Median Income |
| No Earners | 608 (14.8%) | $40,104 |
| 1 Earner | 1,645 (40.2%) | $43,155 |
| 2 Earners | 1,419 (34.7%) | $84,236 |
| 3+ Earners | 422 (10.3%) | $125,954 |
| Total | 4,094 (100.0%) | $69,300 |
Household Income in Albemarle
Household Income Brackets in Albemarle
With 1,157 households falling in the category, the $50,000 to $74,999 income range is the most frequent in Albemarle, accounting for 17.7% of all households. In contrast, only 183 households (2.8%) fall into the $200,000+ income bracket, making it the least populous group.
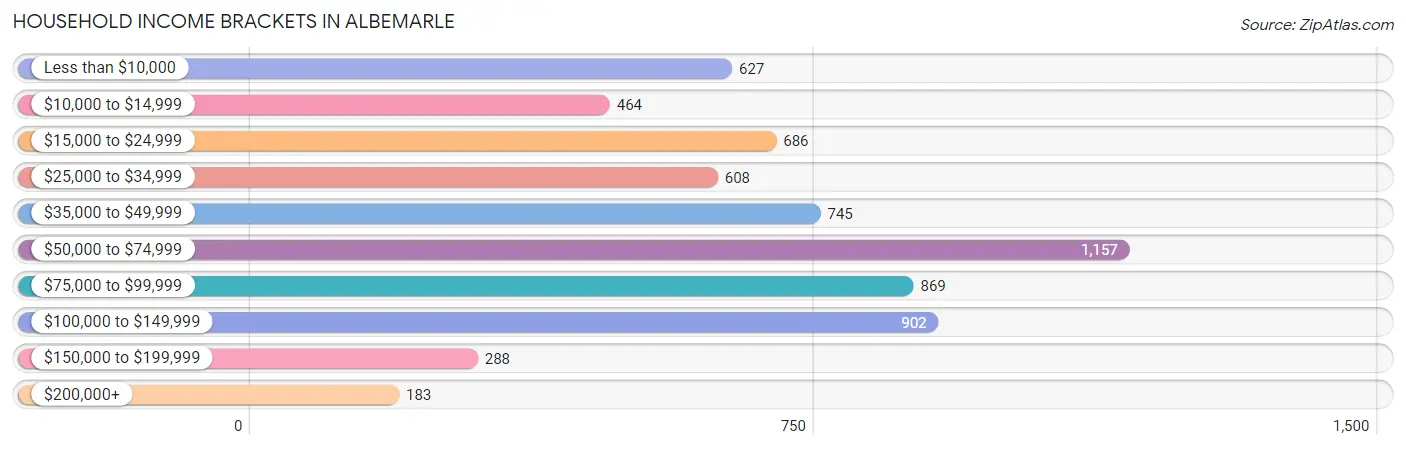
| Income Bracket | # Households | % Households |
| Less than $10,000 | 627 | 9.6% |
| $10,000 to $14,999 | 464 | 7.1% |
| $15,000 to $24,999 | 686 | 10.5% |
| $25,000 to $34,999 | 608 | 9.3% |
| $35,000 to $49,999 | 745 | 11.4% |
| $50,000 to $74,999 | 1,157 | 17.7% |
| $75,000 to $99,999 | 869 | 13.3% |
| $100,000 to $149,999 | 902 | 13.8% |
| $150,000 to $199,999 | 288 | 4.4% |
| $200,000+ | 183 | 2.8% |
Household Income by Householder Age in Albemarle
The median household income in Albemarle is $51,673, with the highest median household income of $77,754 found in the 45 to 64 years age bracket for the primary householder. A total of 2,014 households (30.8%) fall into this category. Meanwhile, the 15 to 24 years age bracket for the primary householder has the lowest median household income of $0, with 310 households (4.7%) in this group.
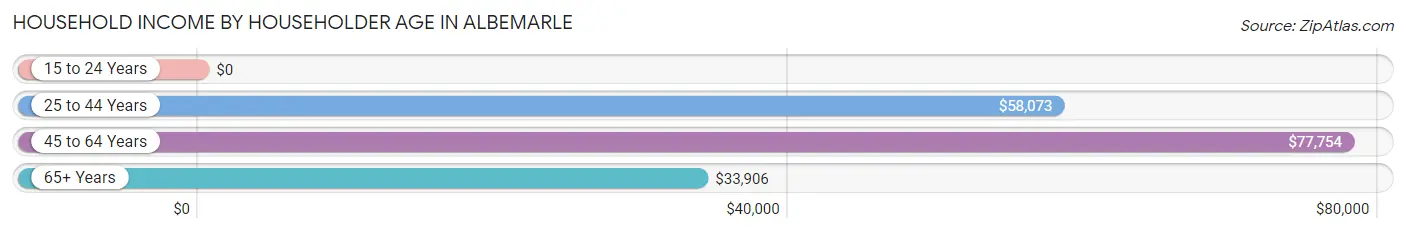
| Income Bracket | # Households | Median Income |
| 15 to 24 Years | 310 (4.7%) | $0 |
| 25 to 44 Years | 2,048 (31.3%) | $58,073 |
| 45 to 64 Years | 2,014 (30.8%) | $77,754 |
| 65+ Years | 2,163 (33.1%) | $33,906 |
| Total | 6,535 (100.0%) | $51,673 |
Poverty in Albemarle
Income Below Poverty by Sex and Age in Albemarle
With 18.4% poverty level for males and 24.7% for females among the residents of Albemarle, 5 year old males and 18 to 24 year old females are the most vulnerable to poverty, with 277 males (82.9%) and 296 females (49.0%) in their respective age groups living below the poverty level.
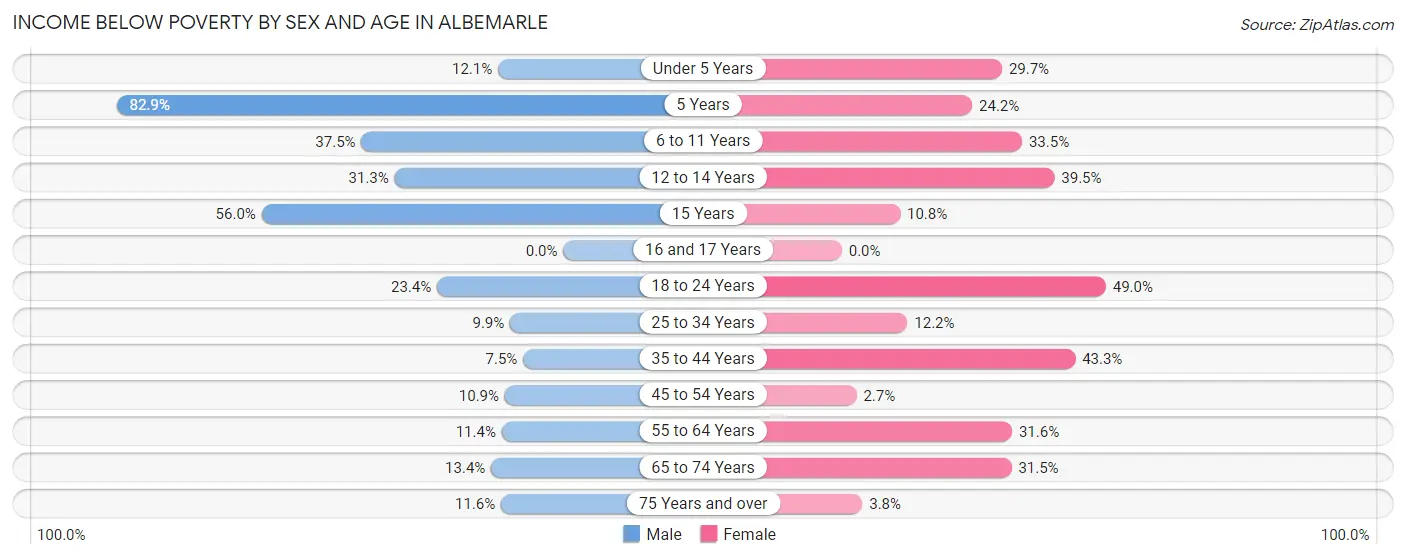
| Age Bracket | Male | Female |
| Under 5 Years | 57 (12.1%) | 99 (29.7%) |
| 5 Years | 277 (82.9%) | 15 (24.2%) |
| 6 to 11 Years | 193 (37.5%) | 195 (33.5%) |
| 12 to 14 Years | 57 (31.3%) | 116 (39.5%) |
| 15 Years | 84 (56.0%) | 8 (10.8%) |
| 16 and 17 Years | 0 (0.0%) | 0 (0.0%) |
| 18 to 24 Years | 195 (23.4%) | 296 (49.0%) |
| 25 to 34 Years | 103 (9.9%) | 141 (12.2%) |
| 35 to 44 Years | 53 (7.4%) | 454 (43.3%) |
| 45 to 54 Years | 106 (10.9%) | 23 (2.7%) |
| 55 to 64 Years | 116 (11.4%) | 332 (31.6%) |
| 65 to 74 Years | 102 (13.4%) | 296 (31.5%) |
| 75 Years and over | 78 (11.6%) | 30 (3.8%) |
| Total | 1,421 (18.4%) | 2,005 (24.7%) |
Income Above Poverty by Sex and Age in Albemarle
According to the poverty statistics in Albemarle, males aged 16 and 17 years and females aged 16 and 17 years are the age groups that are most secure financially, with 100.0% of males and 100.0% of females in these age groups living above the poverty line.
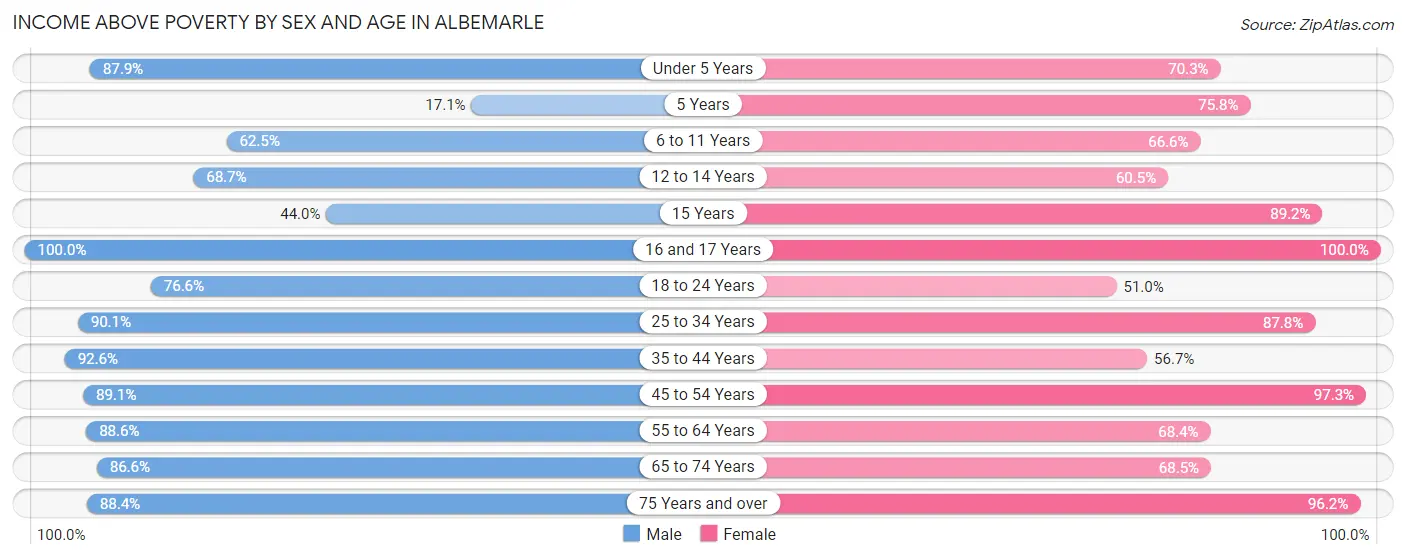
| Age Bracket | Male | Female |
| Under 5 Years | 413 (87.9%) | 234 (70.3%) |
| 5 Years | 57 (17.1%) | 47 (75.8%) |
| 6 to 11 Years | 322 (62.5%) | 388 (66.5%) |
| 12 to 14 Years | 125 (68.7%) | 178 (60.5%) |
| 15 Years | 66 (44.0%) | 66 (89.2%) |
| 16 and 17 Years | 79 (100.0%) | 342 (100.0%) |
| 18 to 24 Years | 637 (76.6%) | 308 (51.0%) |
| 25 to 34 Years | 940 (90.1%) | 1,018 (87.8%) |
| 35 to 44 Years | 658 (92.5%) | 594 (56.7%) |
| 45 to 54 Years | 870 (89.1%) | 822 (97.3%) |
| 55 to 64 Years | 898 (88.6%) | 719 (68.4%) |
| 65 to 74 Years | 659 (86.6%) | 644 (68.5%) |
| 75 Years and over | 596 (88.4%) | 760 (96.2%) |
| Total | 6,320 (81.6%) | 6,120 (75.3%) |
Income Below Poverty Among Married-Couple Families in Albemarle
The poverty statistics for married-couple families in Albemarle show that 1.9% or 44 of the total 2,330 families live below the poverty line. Families with 3 or 4 children have the highest poverty rate of 13.7%, comprising of 7 families. On the other hand, families with 1 or 2 children have the lowest poverty rate of 0.0%, which includes 0 families.
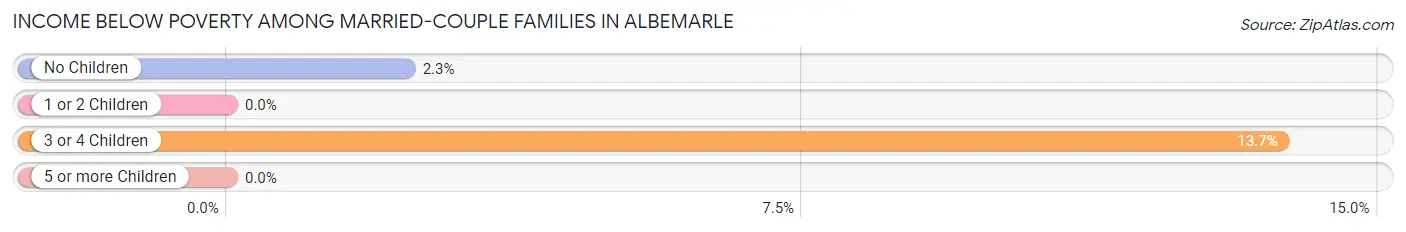
| Children | Above Poverty | Below Poverty |
| No Children | 1,557 (97.7%) | 37 (2.3%) |
| 1 or 2 Children | 672 (100.0%) | 0 (0.0%) |
| 3 or 4 Children | 44 (86.3%) | 7 (13.7%) |
| 5 or more Children | 13 (100.0%) | 0 (0.0%) |
| Total | 2,286 (98.1%) | 44 (1.9%) |
Income Below Poverty Among Single-Parent Households in Albemarle
According to the poverty data in Albemarle, 3.6% or 21 single-father households and 48.2% or 571 single-mother households are living below the poverty line. Among single-father households, those with 1 or 2 children have the highest poverty rate, with 21 households (9.2%) experiencing poverty. Likewise, among single-mother households, those with 3 or 4 children have the highest poverty rate, with 68 households (100.0%) falling below the poverty line.
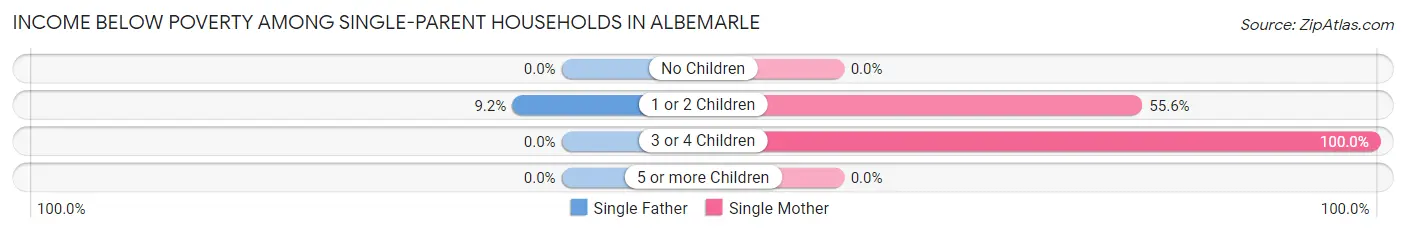
| Children | Single Father | Single Mother |
| No Children | 0 (0.0%) | 0 (0.0%) |
| 1 or 2 Children | 21 (9.2%) | 503 (55.6%) |
| 3 or 4 Children | 0 (0.0%) | 68 (100.0%) |
| 5 or more Children | 0 (0.0%) | 0 (0.0%) |
| Total | 21 (3.6%) | 571 (48.2%) |
Income Below Poverty Among Married-Couple vs Single-Parent Households in Albemarle
The poverty data for Albemarle shows that 44 of the married-couple family households (1.9%) and 592 of the single-parent households (33.6%) are living below the poverty level. Within the married-couple family households, those with 3 or 4 children have the highest poverty rate, with 7 households (13.7%) falling below the poverty line. Among the single-parent households, those with 3 or 4 children have the highest poverty rate, with 68 household (58.6%) living below poverty.
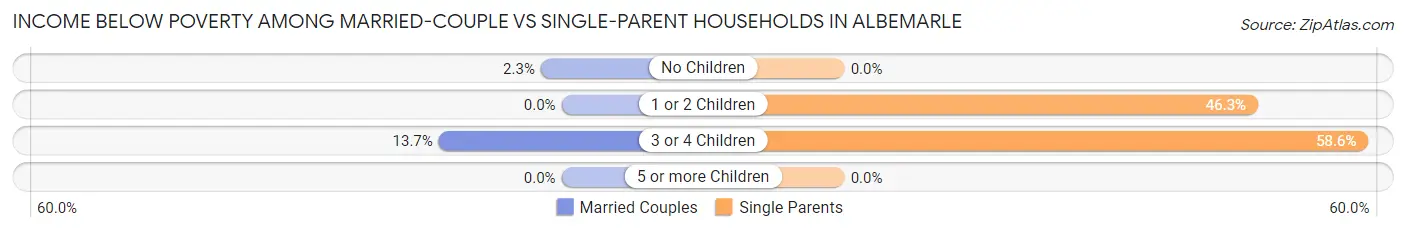
| Children | Married-Couple Families | Single-Parent Households |
| No Children | 37 (2.3%) | 0 (0.0%) |
| 1 or 2 Children | 0 (0.0%) | 524 (46.3%) |
| 3 or 4 Children | 7 (13.7%) | 68 (58.6%) |
| 5 or more Children | 0 (0.0%) | 0 (0.0%) |
| Total | 44 (1.9%) | 592 (33.6%) |
Race in Albemarle
The most populous races in Albemarle are White / Caucasian (10,640 | 64.7%), Black / African American (4,035 | 24.5%), and Hispanic or Latino (1,073 | 6.5%).
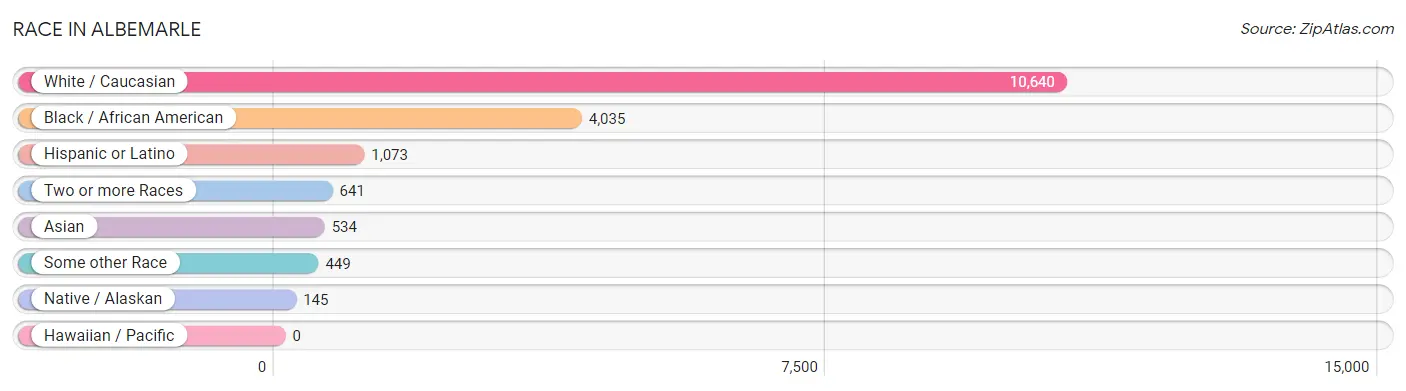
| Race | # Population | % Population |
| Asian | 534 | 3.3% |
| Black / African American | 4,035 | 24.5% |
| Hawaiian / Pacific | 0 | 0.0% |
| Hispanic or Latino | 1,073 | 6.5% |
| Native / Alaskan | 145 | 0.9% |
| White / Caucasian | 10,640 | 64.7% |
| Two or more Races | 641 | 3.9% |
| Some other Race | 449 | 2.7% |
| Total | 16,444 | 100.0% |
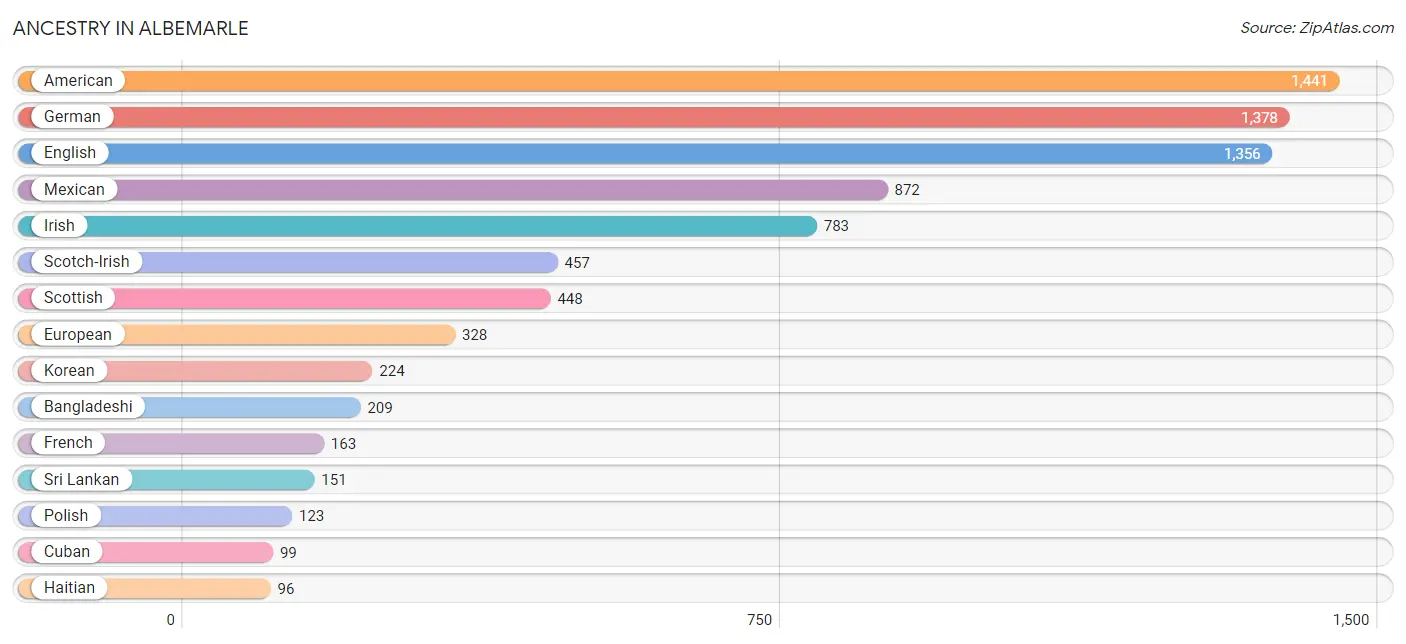
Ancestry in Albemarle
The most populous ancestries reported in Albemarle are American (1,441 | 8.8%), German (1,378 | 8.4%), English (1,356 | 8.3%), Mexican (872 | 5.3%), and Irish (783 | 4.8%), together accounting for 35.5% of all Albemarle residents.
| Ancestry | # Population | % Population |
| African | 35 | 0.2% |
| American | 1,441 | 8.8% |
| Argentinean | 10 | 0.1% |
| Austrian | 5 | 0.0% |
| Bangladeshi | 209 | 1.3% |
| British | 54 | 0.3% |
| Cherokee | 18 | 0.1% |
| Cuban | 99 | 0.6% |
| Czech | 47 | 0.3% |
| Danish | 16 | 0.1% |
| Dutch | 25 | 0.2% |
| Eastern European | 38 | 0.2% |
| English | 1,356 | 8.3% |
| European | 328 | 2.0% |
| French | 163 | 1.0% |
| French Canadian | 68 | 0.4% |
| German | 1,378 | 8.4% |
| Greek | 46 | 0.3% |
| Haitian | 96 | 0.6% |
| Hungarian | 21 | 0.1% |
| Irish | 783 | 4.8% |
| Israeli | 4 | 0.0% |
| Italian | 86 | 0.5% |
| Jamaican | 16 | 0.1% |
| Korean | 224 | 1.4% |
| Lithuanian | 32 | 0.2% |
| Mexican | 872 | 5.3% |
| Norwegian | 24 | 0.2% |
| Polish | 123 | 0.7% |
| Puerto Rican | 47 | 0.3% |
| Scandinavian | 27 | 0.2% |
| Scotch-Irish | 457 | 2.8% |
| Scottish | 448 | 2.7% |
| South American | 10 | 0.1% |
| Spaniard | 29 | 0.2% |
| Sri Lankan | 151 | 0.9% |
| Subsaharan African | 35 | 0.2% |
| Thai | 26 | 0.2% |
| Ukrainian | 21 | 0.1% |
| Welsh | 35 | 0.2% | View All 40 Rows |
Immigrants in Albemarle
The most numerous immigrant groups reported in Albemarle came from Latin America (465 | 2.8%), Central America (446 | 2.7%), Mexico (446 | 2.7%), Asia (308 | 1.9%), and South Eastern Asia (223 | 1.4%), together accounting for 11.5% of all Albemarle residents.
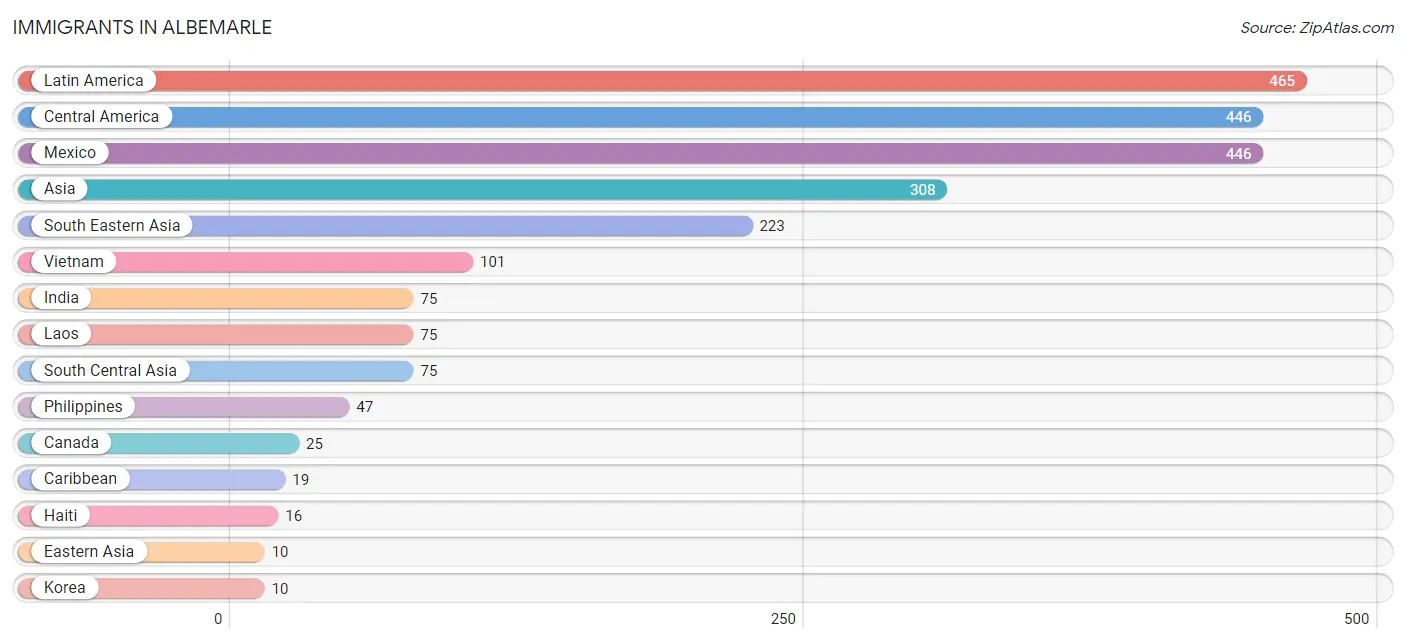
| Immigration Origin | # Population | % Population |
| Asia | 308 | 1.9% |
| Canada | 25 | 0.2% |
| Caribbean | 19 | 0.1% |
| Central America | 446 | 2.7% |
| Cuba | 3 | 0.0% |
| Eastern Asia | 10 | 0.1% |
| Haiti | 16 | 0.1% |
| India | 75 | 0.5% |
| Korea | 10 | 0.1% |
| Laos | 75 | 0.5% |
| Latin America | 465 | 2.8% |
| Mexico | 446 | 2.7% |
| Philippines | 47 | 0.3% |
| South Central Asia | 75 | 0.5% |
| South Eastern Asia | 223 | 1.4% |
| Vietnam | 101 | 0.6% | View All 16 Rows |
Sex and Age in Albemarle
Sex and Age in Albemarle
The most populous age groups in Albemarle are 5 to 9 Years (689 | 8.7%) for men and 25 to 29 Years (683 | 8.0%) for women.
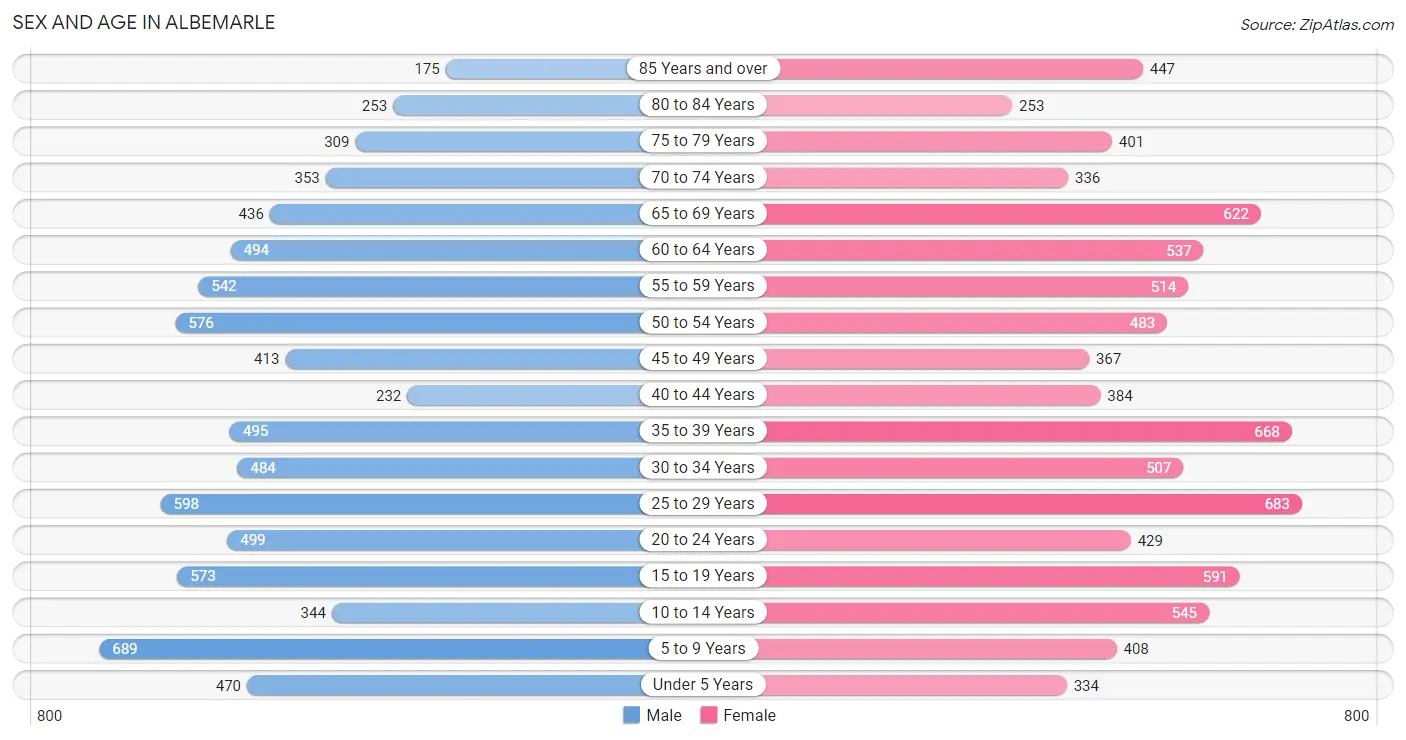
| Age Bracket | Male | Female |
| Under 5 Years | 470 (5.9%) | 334 (3.9%) |
| 5 to 9 Years | 689 (8.7%) | 408 (4.8%) |
| 10 to 14 Years | 344 (4.3%) | 545 (6.4%) |
| 15 to 19 Years | 573 (7.2%) | 591 (7.0%) |
| 20 to 24 Years | 499 (6.3%) | 429 (5.0%) |
| 25 to 29 Years | 598 (7.5%) | 683 (8.0%) |
| 30 to 34 Years | 484 (6.1%) | 507 (6.0%) |
| 35 to 39 Years | 495 (6.2%) | 668 (7.9%) |
| 40 to 44 Years | 232 (2.9%) | 384 (4.5%) |
| 45 to 49 Years | 413 (5.2%) | 367 (4.3%) |
| 50 to 54 Years | 576 (7.3%) | 483 (5.7%) |
| 55 to 59 Years | 542 (6.8%) | 514 (6.0%) |
| 60 to 64 Years | 494 (6.2%) | 537 (6.3%) |
| 65 to 69 Years | 436 (5.5%) | 622 (7.3%) |
| 70 to 74 Years | 353 (4.4%) | 336 (4.0%) |
| 75 to 79 Years | 309 (3.9%) | 401 (4.7%) |
| 80 to 84 Years | 253 (3.2%) | 253 (3.0%) |
| 85 Years and over | 175 (2.2%) | 447 (5.2%) |
| Total | 7,935 (100.0%) | 8,509 (100.0%) |
Families and Households in Albemarle
Median Family Size in Albemarle
The median family size in Albemarle is 3.00 persons per family, with single female/mother families (1,185 | 28.9%) accounting for the largest median family size of 3.19 persons per family. On the other hand, single male/father families (579 | 14.1%) represent the smallest median family size with 2.63 persons per family.
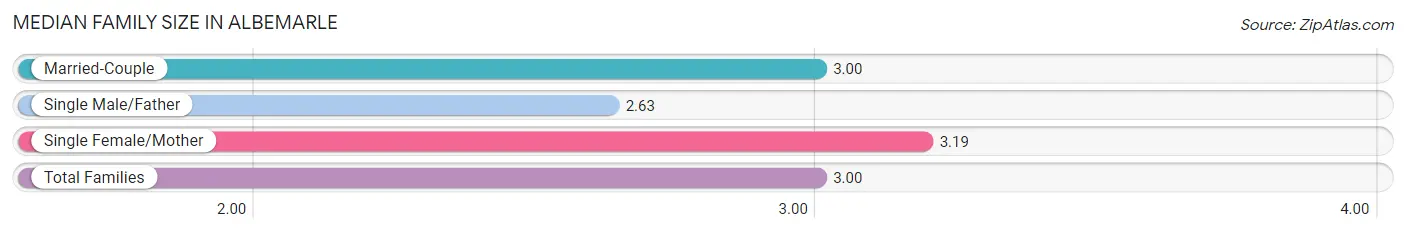
| Family Type | # Families | Family Size |
| Married-Couple | 2,330 (56.9%) | 3.00 |
| Single Male/Father | 579 (14.1%) | 2.63 |
| Single Female/Mother | 1,185 (28.9%) | 3.19 |
| Total Families | 4,094 (100.0%) | 3.00 |
Median Household Size in Albemarle
The median household size in Albemarle is 2.40 persons per household, with single female/mother households (1,185 | 18.1%) accounting for the largest median household size of 3.4 persons per household. non-family households (2,441 | 37.3%) represent the smallest median household size with 1.18 persons per household.
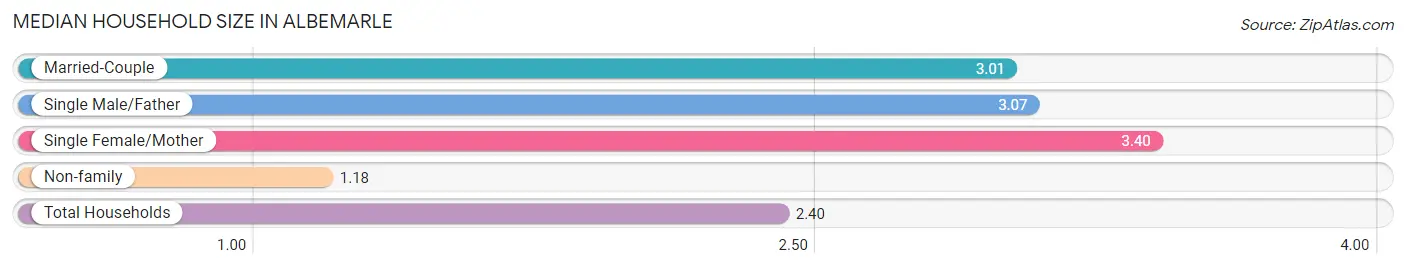
| Household Type | # Households | Household Size |
| Married-Couple | 2,330 (35.6%) | 3.01 |
| Single Male/Father | 579 (8.9%) | 3.07 |
| Single Female/Mother | 1,185 (18.1%) | 3.40 |
| Non-family | 2,441 (37.3%) | 1.18 |
| Total Households | 6,535 (100.0%) | 2.40 |
Household Size by Marriage Status in Albemarle
Out of a total of 6,535 households in Albemarle, 4,094 (62.6%) are family households, while 2,441 (37.3%) are nonfamily households. The most numerous type of family households are 2-person households, comprising 1,987, and the most common type of nonfamily households are 1-person households, comprising 2,152.
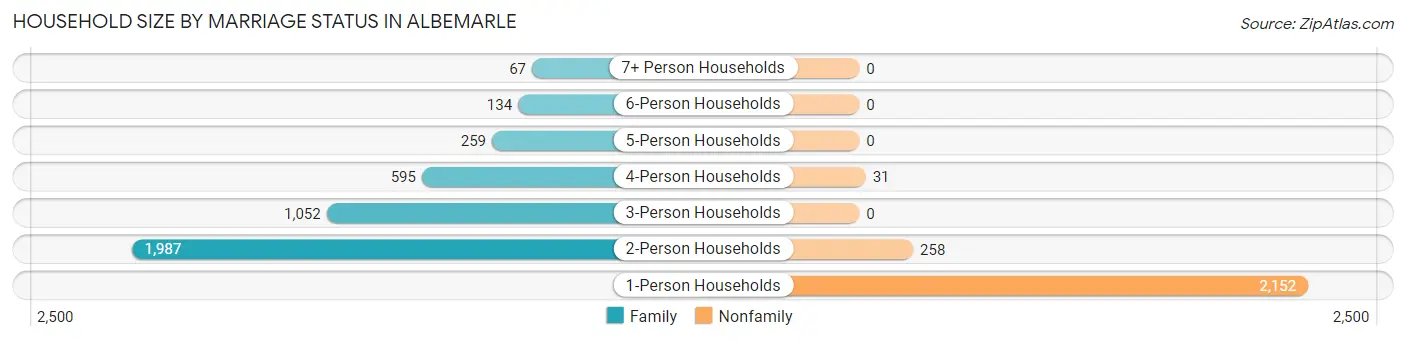
| Household Size | Family Households | Nonfamily Households |
| 1-Person Households | - | 2,152 (32.9%) |
| 2-Person Households | 1,987 (30.4%) | 258 (4.0%) |
| 3-Person Households | 1,052 (16.1%) | 0 (0.0%) |
| 4-Person Households | 595 (9.1%) | 31 (0.5%) |
| 5-Person Households | 259 (4.0%) | 0 (0.0%) |
| 6-Person Households | 134 (2.1%) | 0 (0.0%) |
| 7+ Person Households | 67 (1.0%) | 0 (0.0%) |
| Total | 4,094 (62.6%) | 2,441 (37.3%) |
Female Fertility in Albemarle
Fertility by Age in Albemarle
Average fertility rate in Albemarle is 77.0 births per 1,000 women. Women in the age bracket of 15 to 19 years have the highest fertility rate with 144.0 births per 1,000 women. Women in the age bracket of 20 to 34 years acount for 46.9% of all women with births.
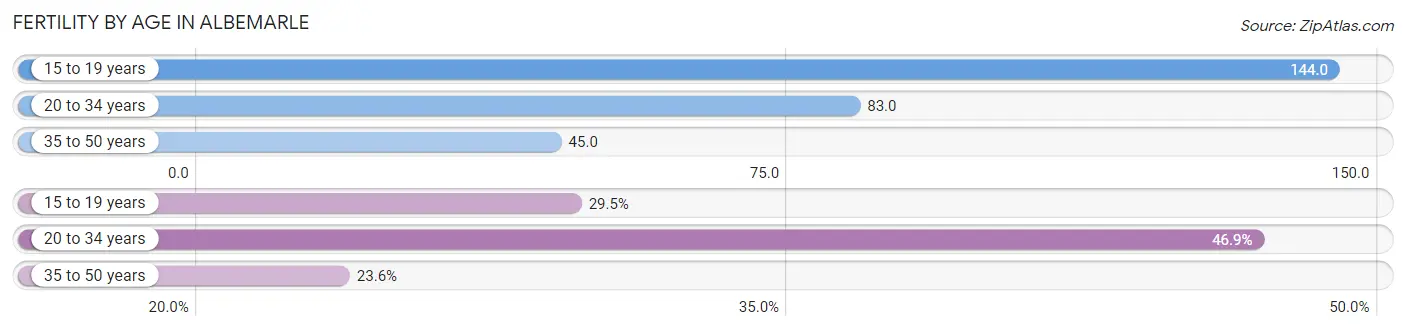
| Age Bracket | Women with Births | Births / 1,000 Women |
| 15 to 19 years | 85 (29.5%) | 144.0 |
| 20 to 34 years | 135 (46.9%) | 83.0 |
| 35 to 50 years | 68 (23.6%) | 45.0 |
| Total | 288 (100.0%) | 77.0 |
Fertility by Age by Marriage Status in Albemarle
28.5% of women with births (288) in Albemarle are married. The highest percentage of unmarried women with births falls into 15 to 19 years age bracket with 100.0% of them unmarried at the time of birth, while the lowest percentage of unmarried women with births belong to 35 to 50 years age bracket with 0.0% of them unmarried.
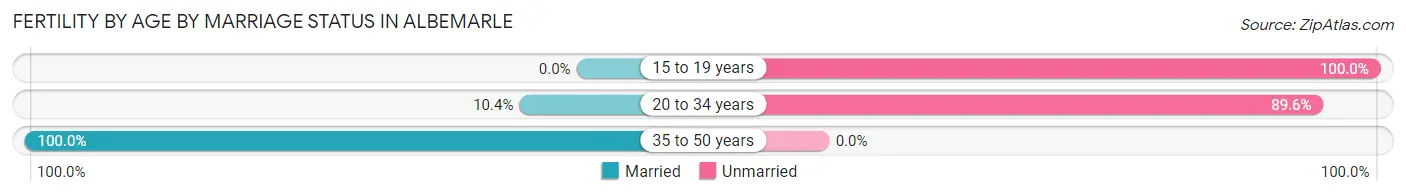
| Age Bracket | Married | Unmarried |
| 15 to 19 years | 0 (0.0%) | 85 (100.0%) |
| 20 to 34 years | 14 (10.4%) | 121 (89.6%) |
| 35 to 50 years | 68 (100.0%) | 0 (0.0%) |
| Total | 82 (28.5%) | 206 (71.5%) |
Fertility by Education in Albemarle
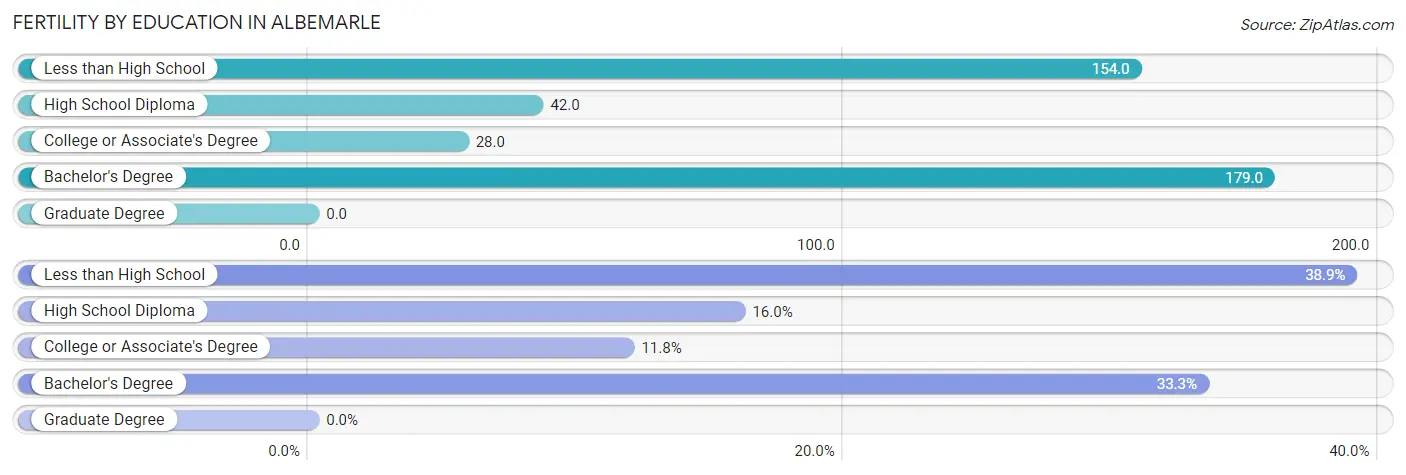
| Educational Attainment | Women with Births | Births / 1,000 Women |
| Less than High School | 112 (38.9%) | 154.0 |
| High School Diploma | 46 (16.0%) | 42.0 |
| College or Associate's Degree | 34 (11.8%) | 28.0 |
| Bachelor's Degree | 96 (33.3%) | 179.0 |
| Graduate Degree | 0 (0.0%) | 0.0 |
| Total | 288 (100.0%) | 77.0 |
Fertility by Education by Marriage Status in Albemarle
71.5% of women with births in Albemarle are unmarried. Women with the educational attainment of college or associate's degree are most likely to be married with 100.0% of them married at childbirth, while women with the educational attainment of less than high school are least likely to be married with 100.0% of them unmarried at childbirth.
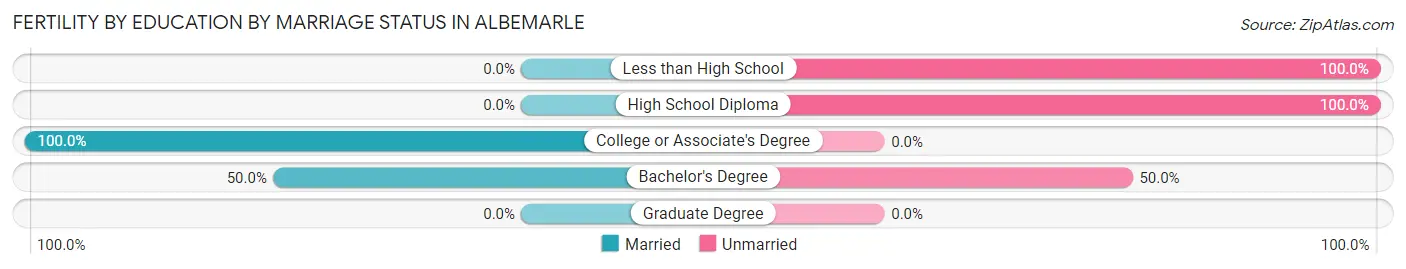
| Educational Attainment | Married | Unmarried |
| Less than High School | 0 (0.0%) | 112 (100.0%) |
| High School Diploma | 0 (0.0%) | 46 (100.0%) |
| College or Associate's Degree | 34 (100.0%) | 0 (0.0%) |
| Bachelor's Degree | 48 (50.0%) | 48 (50.0%) |
| Graduate Degree | 0 (0.0%) | 0 (0.0%) |
| Total | 82 (28.5%) | 206 (71.5%) |
Employment Characteristics in Albemarle
Employment by Class of Employer in Albemarle
Among the 7,163 employed individuals in Albemarle, private company employees (5,306 | 74.1%), not-for-profit organizations (433 | 6.0%), and local government employees (420 | 5.9%) make up the most common classes of employment.
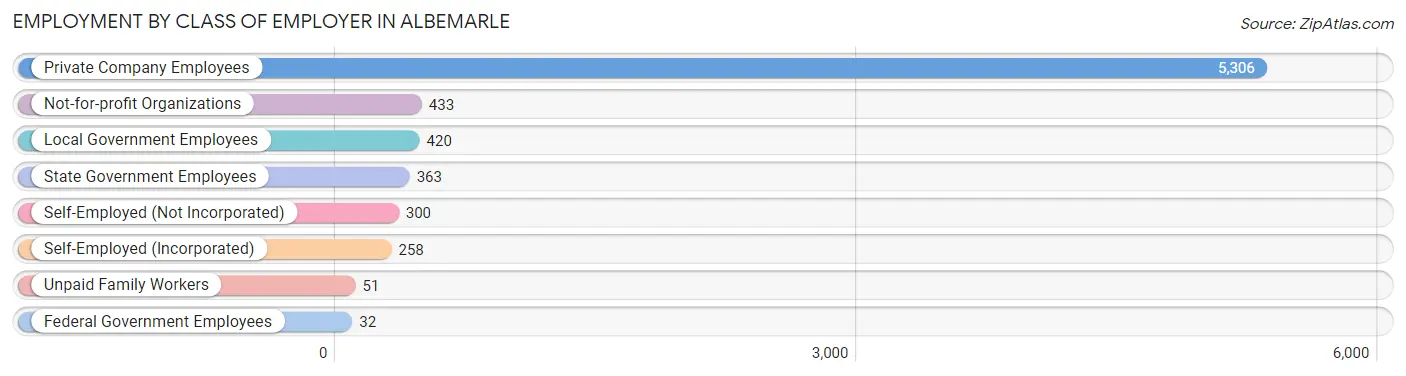
| Employer Class | # Employees | % Employees |
| Private Company Employees | 5,306 | 74.1% |
| Self-Employed (Incorporated) | 258 | 3.6% |
| Self-Employed (Not Incorporated) | 300 | 4.2% |
| Not-for-profit Organizations | 433 | 6.0% |
| Local Government Employees | 420 | 5.9% |
| State Government Employees | 363 | 5.1% |
| Federal Government Employees | 32 | 0.4% |
| Unpaid Family Workers | 51 | 0.7% |
| Total | 7,163 | 100.0% |
Employment Status by Age in Albemarle
According to the labor force statistics for Albemarle, out of the total population over 16 years of age (13,429), 58.2% or 7,816 individuals are in the labor force, with 6.6% or 516 of them unemployed. The age group with the highest labor force participation rate is 30 to 34 years, with 88.0% or 872 individuals in the labor force. Within the labor force, the 30 to 34 years age range has the highest percentage of unemployed individuals, with 16.6% or 145 of them being unemployed.
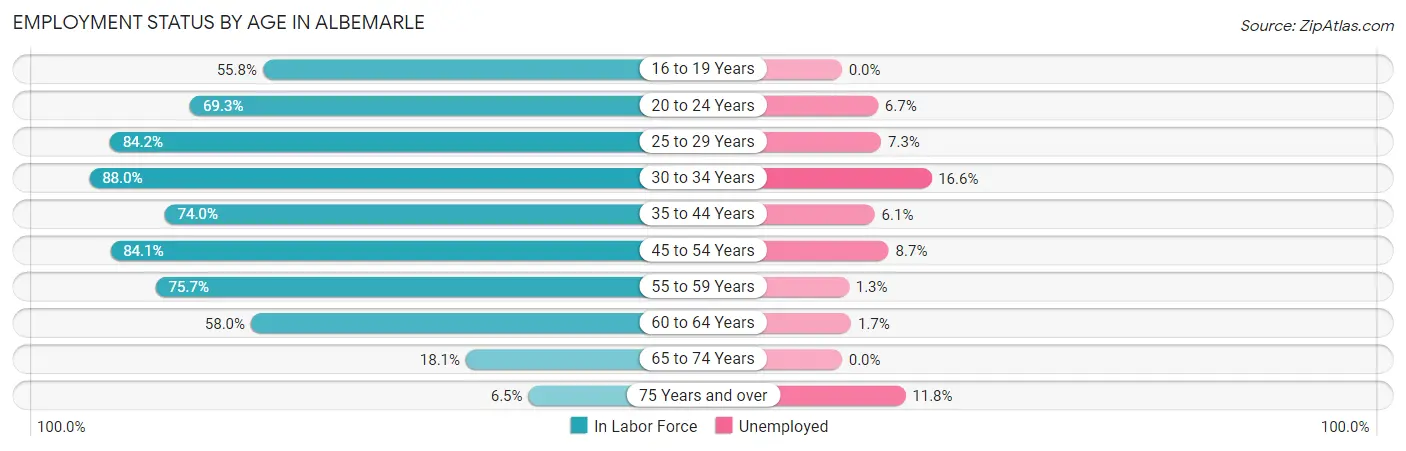
| Age Bracket | In Labor Force | Unemployed |
| 16 to 19 Years | 524 (55.8%) | 0 (0.0%) |
| 20 to 24 Years | 643 (69.3%) | 43 (6.7%) |
| 25 to 29 Years | 1,079 (84.2%) | 79 (7.3%) |
| 30 to 34 Years | 872 (88.0%) | 145 (16.6%) |
| 35 to 44 Years | 1,316 (74.0%) | 80 (6.1%) |
| 45 to 54 Years | 1,547 (84.1%) | 135 (8.7%) |
| 55 to 59 Years | 799 (75.7%) | 10 (1.3%) |
| 60 to 64 Years | 598 (58.0%) | 10 (1.7%) |
| 65 to 74 Years | 316 (18.1%) | 0 (0.0%) |
| 75 Years and over | 119 (6.5%) | 14 (11.8%) |
| Total | 7,816 (58.2%) | 516 (6.6%) |
Employment Status by Educational Attainment in Albemarle
According to labor force statistics for Albemarle, 77.9% of individuals (6,214) out of the total population between 25 and 64 years of age (7,977) are in the labor force, with 7.4% or 460 of them being unemployed. The group with the highest labor force participation rate are those with the educational attainment of bachelor's degree or higher, with 90.8% or 1,535 individuals in the labor force. Within the labor force, individuals with high school diploma education have the highest percentage of unemployment, with 13.8% or 257 of them being unemployed.
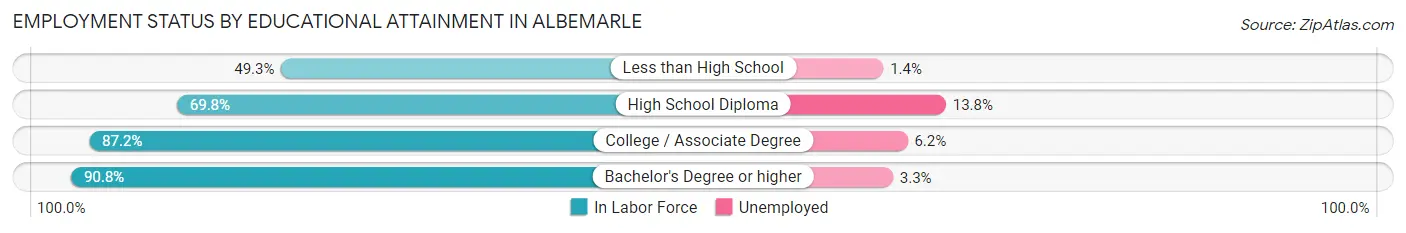
| Educational Attainment | In Labor Force | Unemployed |
| Less than High School | 444 (49.3%) | 13 (1.4%) |
| High School Diploma | 1,861 (69.8%) | 368 (13.8%) |
| College / Associate Degree | 2,373 (87.2%) | 169 (6.2%) |
| Bachelor's Degree or higher | 1,535 (90.8%) | 56 (3.3%) |
| Total | 6,214 (77.9%) | 590 (7.4%) |
Employment Occupations by Sex in Albemarle
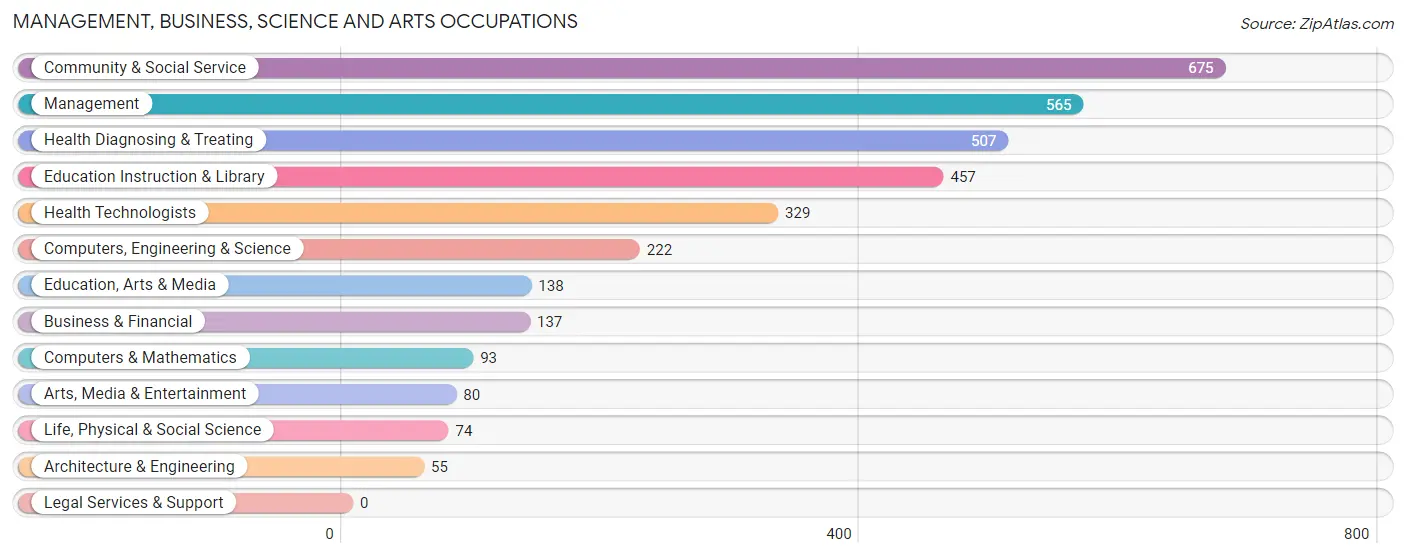
Management, Business, Science and Arts Occupations
The most common Management, Business, Science and Arts occupations in Albemarle are Community & Social Service (675 | 9.2%), Management (565 | 7.7%), Health Diagnosing & Treating (507 | 7.0%), Education Instruction & Library (457 | 6.3%), and Health Technologists (329 | 4.5%).
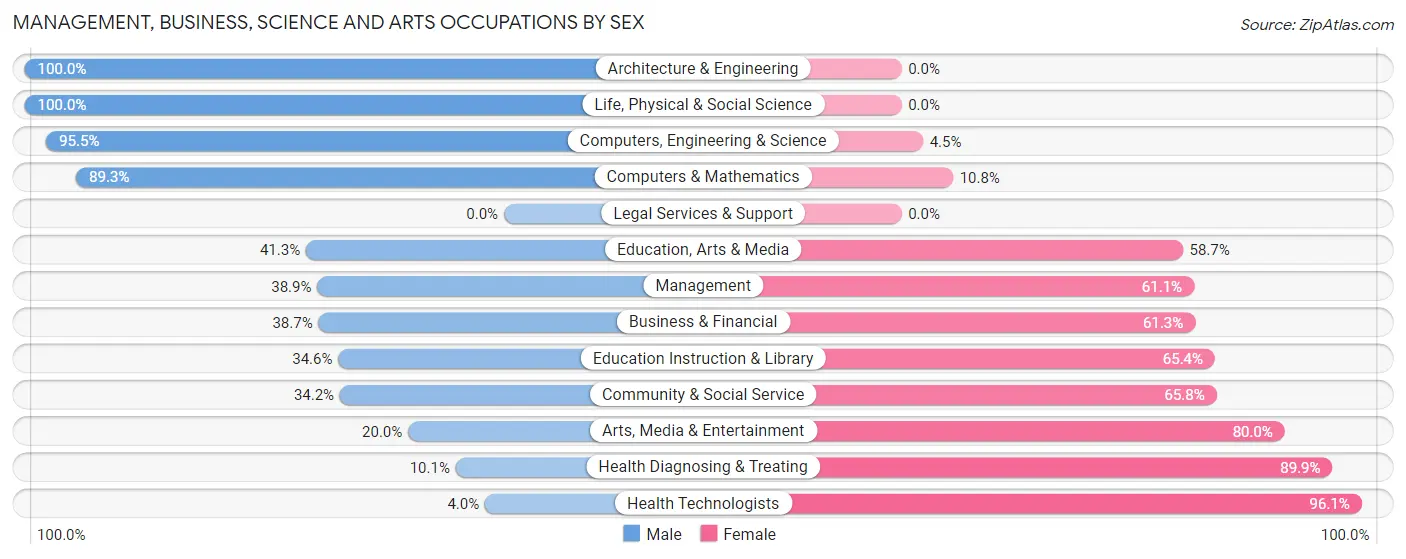
Management, Business, Science and Arts Occupations by Sex
Within the Management, Business, Science and Arts occupations in Albemarle, the most male-oriented occupations are Architecture & Engineering (100.0%), Life, Physical & Social Science (100.0%), and Computers, Engineering & Science (95.5%), while the most female-oriented occupations are Health Technologists (96.1%), Health Diagnosing & Treating (89.9%), and Arts, Media & Entertainment (80.0%).
| Occupation | Male | Female |
| Management | 220 (38.9%) | 345 (61.1%) |
| Business & Financial | 53 (38.7%) | 84 (61.3%) |
| Computers, Engineering & Science | 212 (95.5%) | 10 (4.5%) |
| Computers & Mathematics | 83 (89.2%) | 10 (10.7%) |
| Architecture & Engineering | 55 (100.0%) | 0 (0.0%) |
| Life, Physical & Social Science | 74 (100.0%) | 0 (0.0%) |
| Community & Social Service | 231 (34.2%) | 444 (65.8%) |
| Education, Arts & Media | 57 (41.3%) | 81 (58.7%) |
| Legal Services & Support | 0 (0.0%) | 0 (0.0%) |
| Education Instruction & Library | 158 (34.6%) | 299 (65.4%) |
| Arts, Media & Entertainment | 16 (20.0%) | 64 (80.0%) |
| Health Diagnosing & Treating | 51 (10.1%) | 456 (89.9%) |
| Health Technologists | 13 (4.0%) | 316 (96.1%) |
| Total (Category) | 767 (36.4%) | 1,339 (63.6%) |
| Total (Overall) | 3,960 (54.3%) | 3,338 (45.7%) |
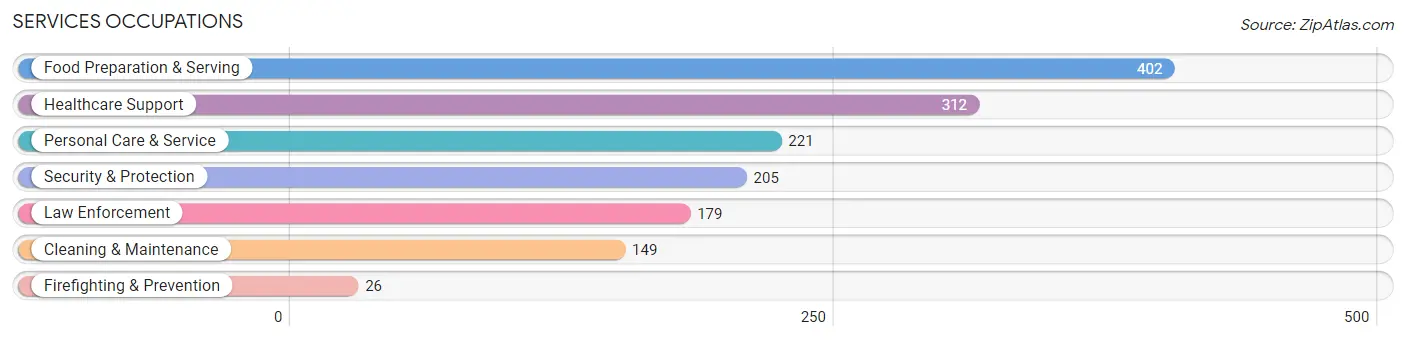
Services Occupations
The most common Services occupations in Albemarle are Food Preparation & Serving (402 | 5.5%), Healthcare Support (312 | 4.3%), Personal Care & Service (221 | 3.0%), Security & Protection (205 | 2.8%), and Law Enforcement (179 | 2.5%).
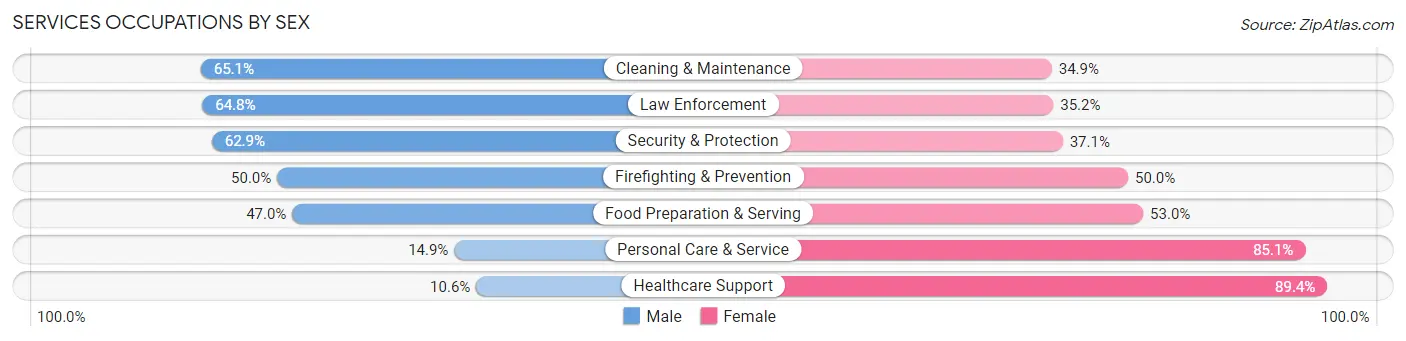
Services Occupations by Sex
Within the Services occupations in Albemarle, the most male-oriented occupations are Cleaning & Maintenance (65.1%), Law Enforcement (64.8%), and Security & Protection (62.9%), while the most female-oriented occupations are Healthcare Support (89.4%), Personal Care & Service (85.1%), and Food Preparation & Serving (53.0%).
| Occupation | Male | Female |
| Healthcare Support | 33 (10.6%) | 279 (89.4%) |
| Security & Protection | 129 (62.9%) | 76 (37.1%) |
| Firefighting & Prevention | 13 (50.0%) | 13 (50.0%) |
| Law Enforcement | 116 (64.8%) | 63 (35.2%) |
| Food Preparation & Serving | 189 (47.0%) | 213 (53.0%) |
| Cleaning & Maintenance | 97 (65.1%) | 52 (34.9%) |
| Personal Care & Service | 33 (14.9%) | 188 (85.1%) |
| Total (Category) | 481 (37.3%) | 808 (62.7%) |
| Total (Overall) | 3,960 (54.3%) | 3,338 (45.7%) |
Sales and Office Occupations
The most common Sales and Office occupations in Albemarle are Sales & Related (671 | 9.2%), and Office & Administration (572 | 7.8%).
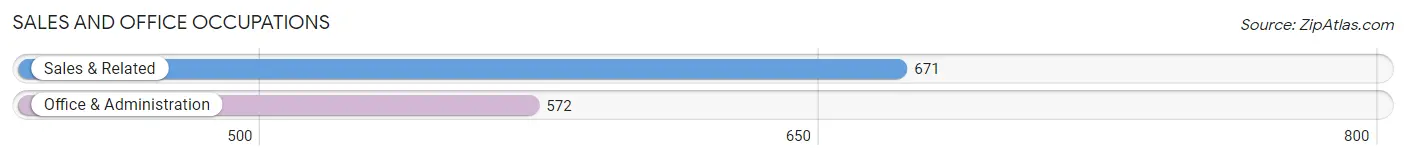
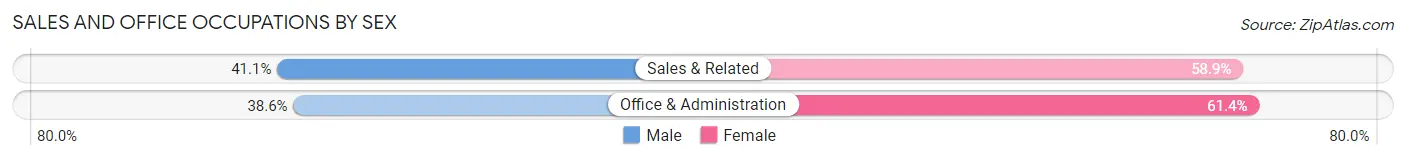
Sales and Office Occupations by Sex
| Occupation | Male | Female |
| Sales & Related | 276 (41.1%) | 395 (58.9%) |
| Office & Administration | 221 (38.6%) | 351 (61.4%) |
| Total (Category) | 497 (40.0%) | 746 (60.0%) |
| Total (Overall) | 3,960 (54.3%) | 3,338 (45.7%) |
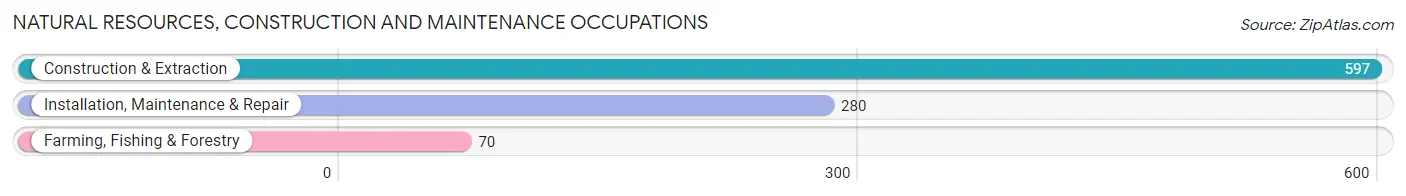
Natural Resources, Construction and Maintenance Occupations
The most common Natural Resources, Construction and Maintenance occupations in Albemarle are Construction & Extraction (597 | 8.2%), Installation, Maintenance & Repair (280 | 3.8%), and Farming, Fishing & Forestry (70 | 1.0%).
Natural Resources, Construction and Maintenance Occupations by Sex
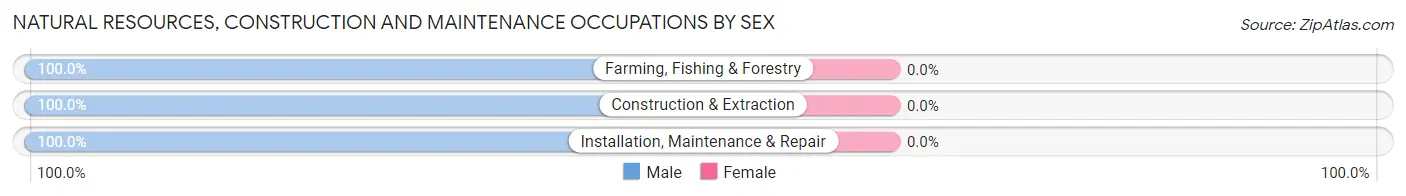
| Occupation | Male | Female |
| Farming, Fishing & Forestry | 70 (100.0%) | 0 (0.0%) |
| Construction & Extraction | 597 (100.0%) | 0 (0.0%) |
| Installation, Maintenance & Repair | 280 (100.0%) | 0 (0.0%) |
| Total (Category) | 947 (100.0%) | 0 (0.0%) |
| Total (Overall) | 3,960 (54.3%) | 3,338 (45.7%) |
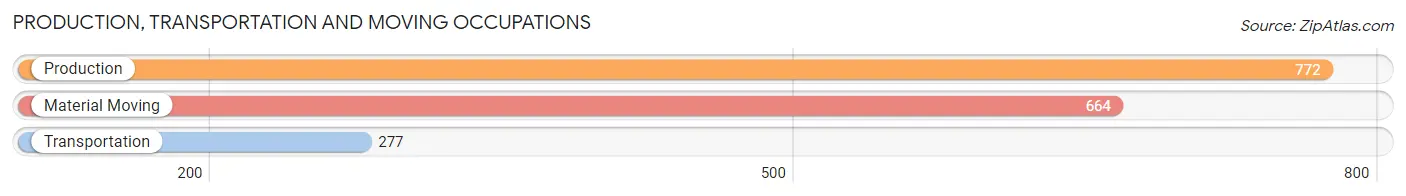
Production, Transportation and Moving Occupations
The most common Production, Transportation and Moving occupations in Albemarle are Production (772 | 10.6%), Material Moving (664 | 9.1%), and Transportation (277 | 3.8%).
Production, Transportation and Moving Occupations by Sex
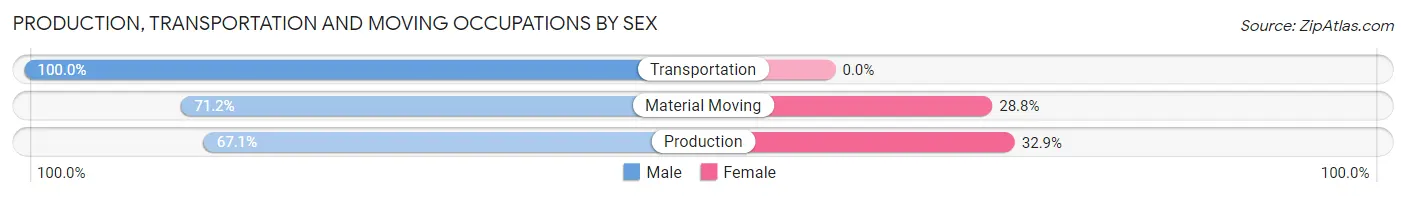
| Occupation | Male | Female |
| Production | 518 (67.1%) | 254 (32.9%) |
| Transportation | 277 (100.0%) | 0 (0.0%) |
| Material Moving | 473 (71.2%) | 191 (28.8%) |
| Total (Category) | 1,268 (74.0%) | 445 (26.0%) |
| Total (Overall) | 3,960 (54.3%) | 3,338 (45.7%) |
Employment Industries by Sex in Albemarle
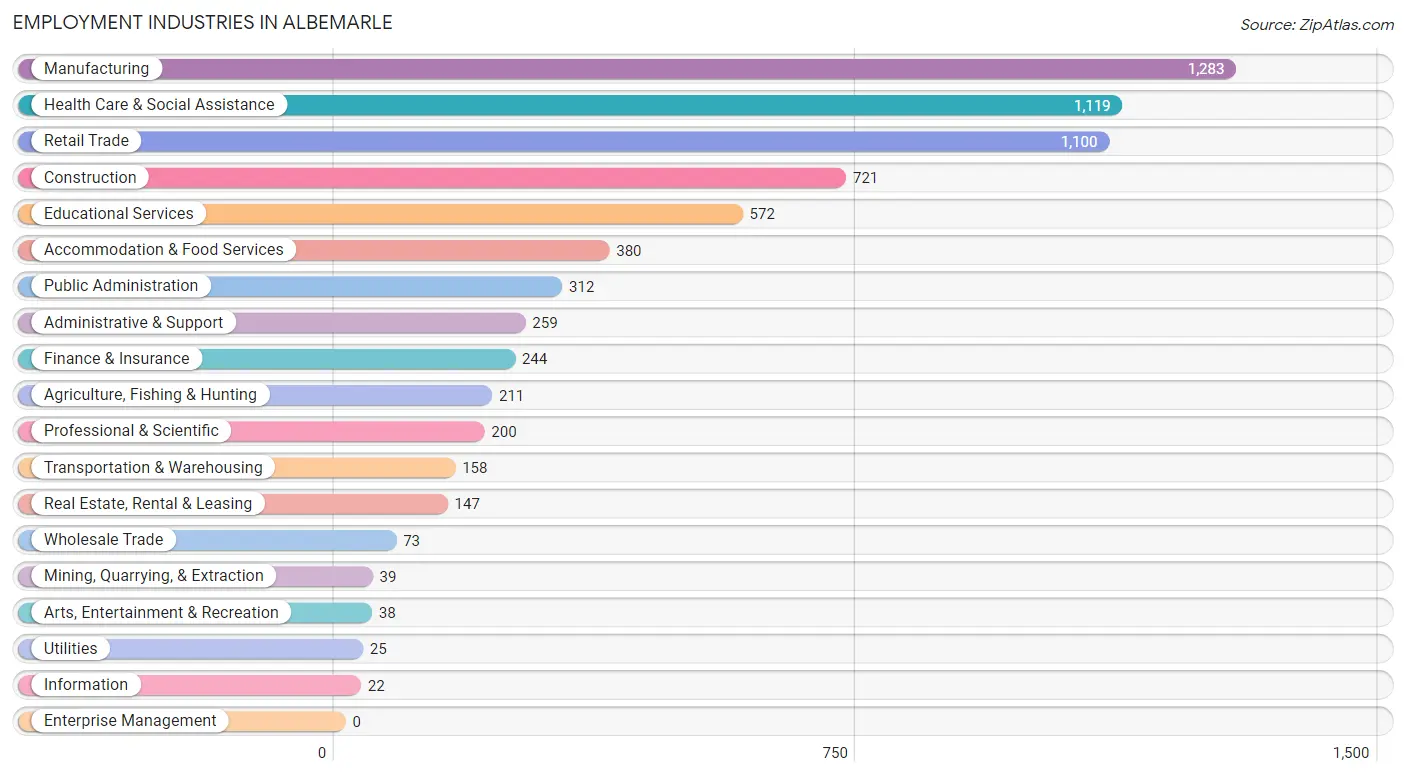
Employment Industries in Albemarle
The major employment industries in Albemarle include Manufacturing (1,283 | 17.6%), Health Care & Social Assistance (1,119 | 15.3%), Retail Trade (1,100 | 15.1%), Construction (721 | 9.9%), and Educational Services (572 | 7.8%).
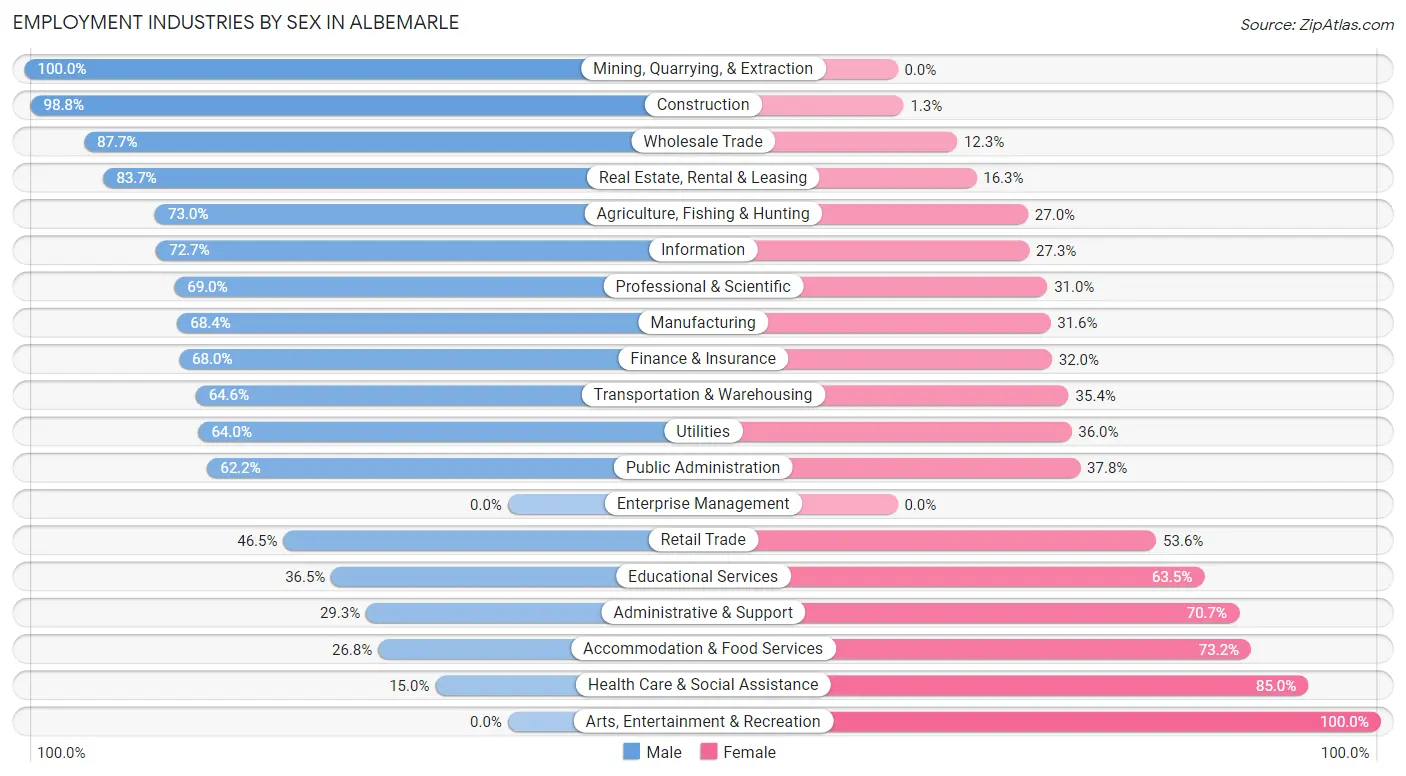
Employment Industries by Sex in Albemarle
The Albemarle industries that see more men than women are Mining, Quarrying, & Extraction (100.0%), Construction (98.8%), and Wholesale Trade (87.7%), whereas the industries that tend to have a higher number of women are Arts, Entertainment & Recreation (100.0%), Health Care & Social Assistance (85.0%), and Accommodation & Food Services (73.2%).
| Industry | Male | Female |
| Agriculture, Fishing & Hunting | 154 (73.0%) | 57 (27.0%) |
| Mining, Quarrying, & Extraction | 39 (100.0%) | 0 (0.0%) |
| Construction | 712 (98.8%) | 9 (1.3%) |
| Manufacturing | 877 (68.4%) | 406 (31.6%) |
| Wholesale Trade | 64 (87.7%) | 9 (12.3%) |
| Retail Trade | 511 (46.5%) | 589 (53.5%) |
| Transportation & Warehousing | 102 (64.6%) | 56 (35.4%) |
| Utilities | 16 (64.0%) | 9 (36.0%) |
| Information | 16 (72.7%) | 6 (27.3%) |
| Finance & Insurance | 166 (68.0%) | 78 (32.0%) |
| Real Estate, Rental & Leasing | 123 (83.7%) | 24 (16.3%) |
| Professional & Scientific | 138 (69.0%) | 62 (31.0%) |
| Enterprise Management | 0 (0.0%) | 0 (0.0%) |
| Administrative & Support | 76 (29.3%) | 183 (70.7%) |
| Educational Services | 209 (36.5%) | 363 (63.5%) |
| Health Care & Social Assistance | 168 (15.0%) | 951 (85.0%) |
| Arts, Entertainment & Recreation | 0 (0.0%) | 38 (100.0%) |
| Accommodation & Food Services | 102 (26.8%) | 278 (73.2%) |
| Public Administration | 194 (62.2%) | 118 (37.8%) |
| Total | 3,960 (54.3%) | 3,338 (45.7%) |
Education in Albemarle
School Enrollment in Albemarle
The most common levels of schooling among the 3,599 students in Albemarle are high school (896 | 24.9%), middle school (709 | 19.7%), and elementary school (654 | 18.2%).
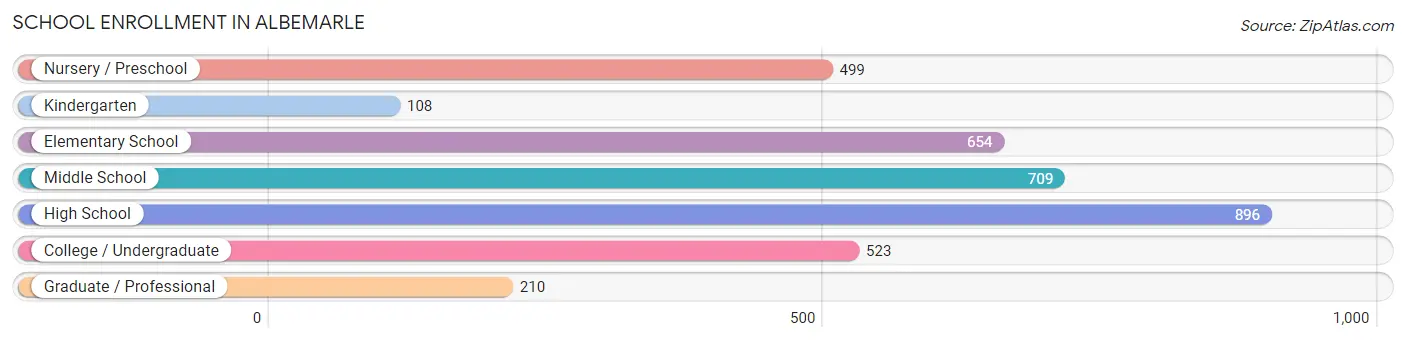
| School Level | # Students | % Students |
| Nursery / Preschool | 499 | 13.9% |
| Kindergarten | 108 | 3.0% |
| Elementary School | 654 | 18.2% |
| Middle School | 709 | 19.7% |
| High School | 896 | 24.9% |
| College / Undergraduate | 523 | 14.5% |
| Graduate / Professional | 210 | 5.8% |
| Total | 3,599 | 100.0% |
School Enrollment by Age by Funding Source in Albemarle
Out of a total of 3,599 students who are enrolled in schools in Albemarle, 619 (17.2%) attend a private institution, while the remaining 2,980 (82.8%) are enrolled in public schools. The age group of 3 to 4 year olds has the highest likelihood of being enrolled in private schools, with 140 (82.4% in the age bracket) enrolled. Conversely, the age group of 15 to 17 year olds has the lowest likelihood of being enrolled in a private school, with 595 (94.9% in the age bracket) attending a public institution.
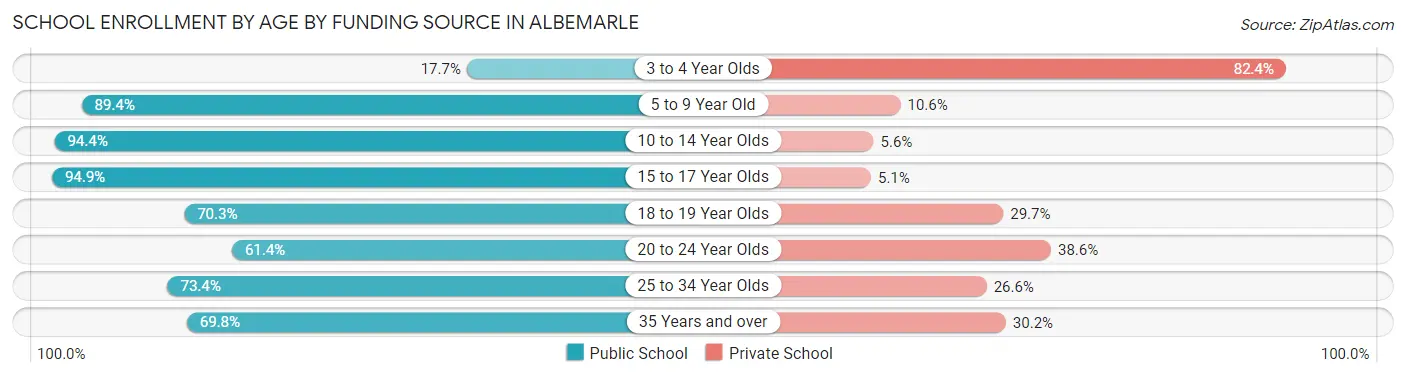
| Age Bracket | Public School | Private School |
| 3 to 4 Year Olds | 30 (17.6%) | 140 (82.4%) |
| 5 to 9 Year Old | 919 (89.4%) | 109 (10.6%) |
| 10 to 14 Year Olds | 813 (94.4%) | 48 (5.6%) |
| 15 to 17 Year Olds | 595 (94.9%) | 32 (5.1%) |
| 18 to 19 Year Olds | 137 (70.3%) | 58 (29.7%) |
| 20 to 24 Year Olds | 170 (61.4%) | 107 (38.6%) |
| 25 to 34 Year Olds | 190 (73.4%) | 69 (26.6%) |
| 35 Years and over | 127 (69.8%) | 55 (30.2%) |
| Total | 2,980 (82.8%) | 619 (17.2%) |
Educational Attainment by Field of Study in Albemarle
Education (477 | 18.7%), arts & humanities (325 | 12.8%), business (281 | 11.0%), science & technology (179 | 7.0%), and engineering (172 | 6.8%) are the most common fields of study among 2,550 individuals in Albemarle who have obtained a bachelor's degree or higher.
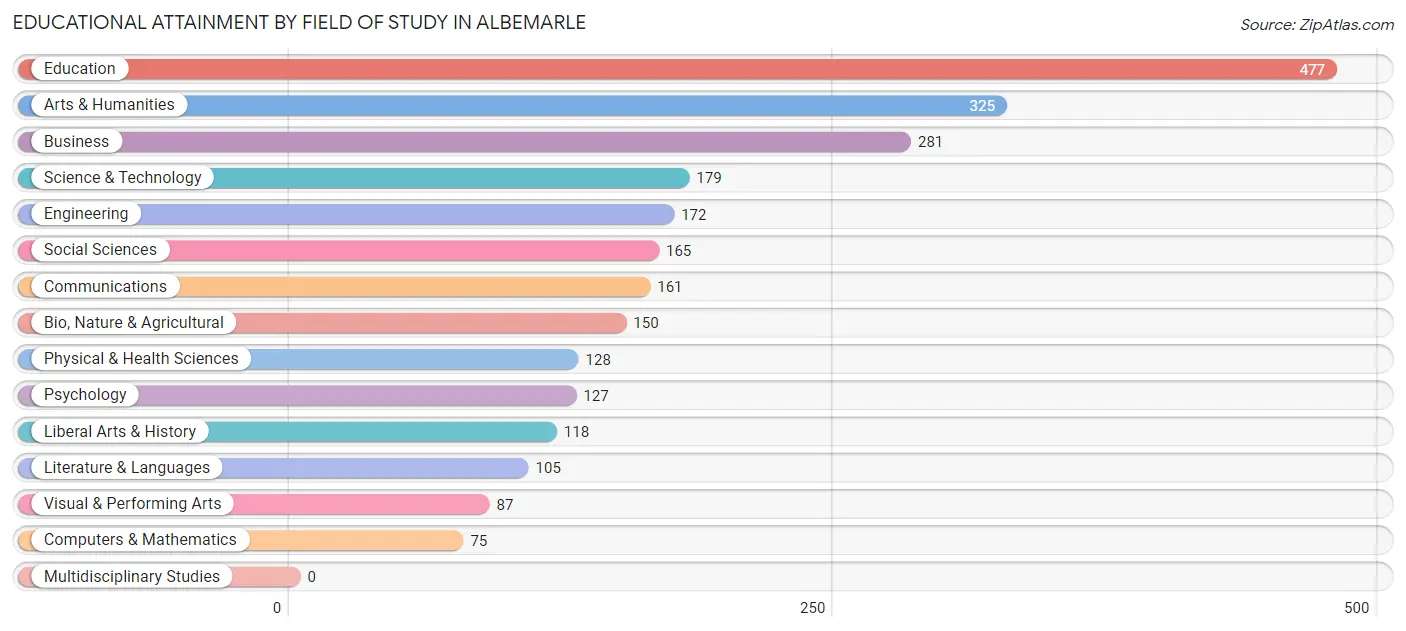
| Field of Study | # Graduates | % Graduates |
| Computers & Mathematics | 75 | 2.9% |
| Bio, Nature & Agricultural | 150 | 5.9% |
| Physical & Health Sciences | 128 | 5.0% |
| Psychology | 127 | 5.0% |
| Social Sciences | 165 | 6.5% |
| Engineering | 172 | 6.8% |
| Multidisciplinary Studies | 0 | 0.0% |
| Science & Technology | 179 | 7.0% |
| Business | 281 | 11.0% |
| Education | 477 | 18.7% |
| Literature & Languages | 105 | 4.1% |
| Liberal Arts & History | 118 | 4.6% |
| Visual & Performing Arts | 87 | 3.4% |
| Communications | 161 | 6.3% |
| Arts & Humanities | 325 | 12.8% |
| Total | 2,550 | 100.0% |
Transportation & Commute in Albemarle
Vehicle Availability by Sex in Albemarle
The most prevalent vehicle ownership categories in Albemarle are males with 2 vehicles (1,648, accounting for 42.1%) and females with 2 vehicles (1,293, making up 51.0%).
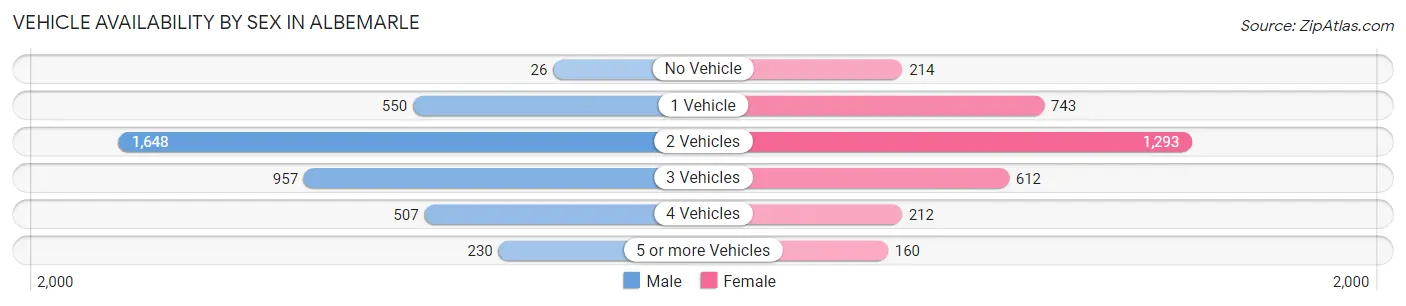
| Vehicles Available | Male | Female |
| No Vehicle | 26 (0.7%) | 214 (6.6%) |
| 1 Vehicle | 550 (14.0%) | 743 (23.0%) |
| 2 Vehicles | 1,648 (42.1%) | 1,293 (40.0%) |
| 3 Vehicles | 957 (24.4%) | 612 (18.9%) |
| 4 Vehicles | 507 (12.9%) | 212 (6.6%) |
| 5 or more Vehicles | 230 (5.9%) | 160 (5.0%) |
| Total | 3,918 (100.0%) | 3,234 (100.0%) |
Commute Time in Albemarle
The most frequently occuring commute durations in Albemarle are 10 to 14 minutes (1,633 commuters, 24.2%), 5 to 9 minutes (1,173 commuters, 17.3%), and 20 to 24 minutes (793 commuters, 11.7%).
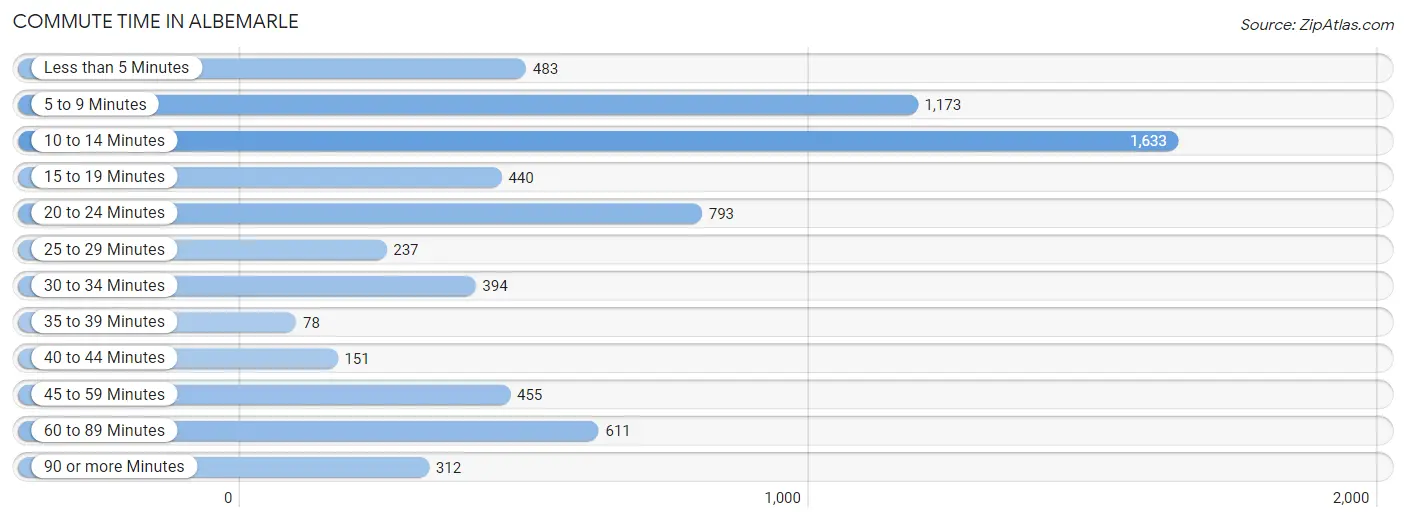
| Commute Time | # Commuters | % Commuters |
| Less than 5 Minutes | 483 | 7.1% |
| 5 to 9 Minutes | 1,173 | 17.3% |
| 10 to 14 Minutes | 1,633 | 24.2% |
| 15 to 19 Minutes | 440 | 6.5% |
| 20 to 24 Minutes | 793 | 11.7% |
| 25 to 29 Minutes | 237 | 3.5% |
| 30 to 34 Minutes | 394 | 5.8% |
| 35 to 39 Minutes | 78 | 1.1% |
| 40 to 44 Minutes | 151 | 2.2% |
| 45 to 59 Minutes | 455 | 6.7% |
| 60 to 89 Minutes | 611 | 9.0% |
| 90 or more Minutes | 312 | 4.6% |
Commute Time by Sex in Albemarle
The most common commute times in Albemarle are 10 to 14 minutes (784 commuters, 20.8%) for males and 10 to 14 minutes (849 commuters, 28.4%) for females.
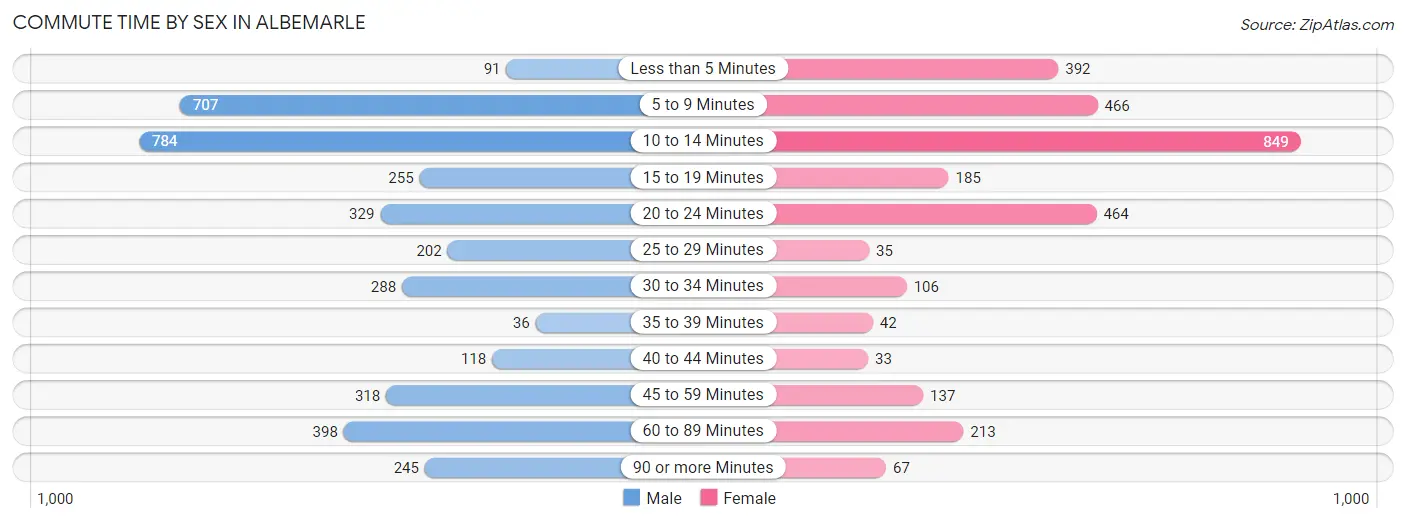
| Commute Time | Male | Female |
| Less than 5 Minutes | 91 (2.4%) | 392 (13.1%) |
| 5 to 9 Minutes | 707 (18.8%) | 466 (15.6%) |
| 10 to 14 Minutes | 784 (20.8%) | 849 (28.4%) |
| 15 to 19 Minutes | 255 (6.8%) | 185 (6.2%) |
| 20 to 24 Minutes | 329 (8.7%) | 464 (15.5%) |
| 25 to 29 Minutes | 202 (5.4%) | 35 (1.2%) |
| 30 to 34 Minutes | 288 (7.6%) | 106 (3.5%) |
| 35 to 39 Minutes | 36 (0.9%) | 42 (1.4%) |
| 40 to 44 Minutes | 118 (3.1%) | 33 (1.1%) |
| 45 to 59 Minutes | 318 (8.4%) | 137 (4.6%) |
| 60 to 89 Minutes | 398 (10.5%) | 213 (7.1%) |
| 90 or more Minutes | 245 (6.5%) | 67 (2.2%) |
Time of Departure to Work by Sex in Albemarle
The most frequent times of departure to work in Albemarle are 6:00 AM to 6:29 AM (577, 15.3%) for males and 7:30 AM to 7:59 AM (543, 18.2%) for females.
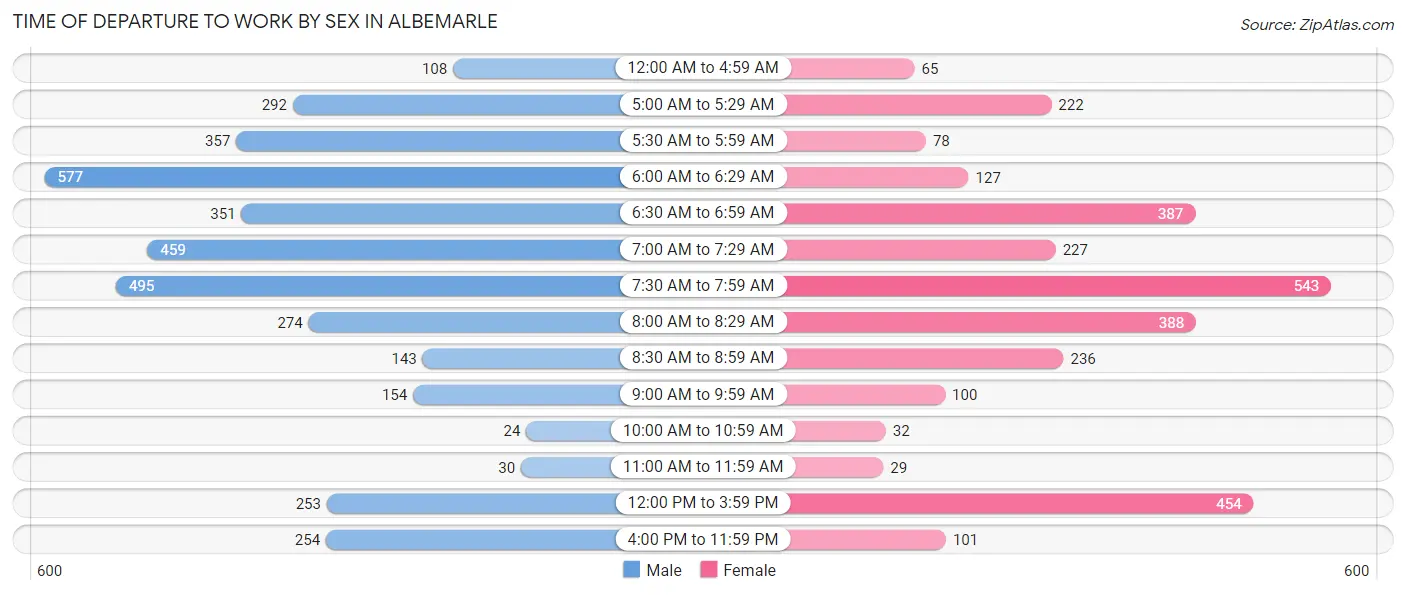
| Time of Departure | Male | Female |
| 12:00 AM to 4:59 AM | 108 (2.9%) | 65 (2.2%) |
| 5:00 AM to 5:29 AM | 292 (7.7%) | 222 (7.4%) |
| 5:30 AM to 5:59 AM | 357 (9.5%) | 78 (2.6%) |
| 6:00 AM to 6:29 AM | 577 (15.3%) | 127 (4.3%) |
| 6:30 AM to 6:59 AM | 351 (9.3%) | 387 (13.0%) |
| 7:00 AM to 7:29 AM | 459 (12.2%) | 227 (7.6%) |
| 7:30 AM to 7:59 AM | 495 (13.1%) | 543 (18.2%) |
| 8:00 AM to 8:29 AM | 274 (7.3%) | 388 (13.0%) |
| 8:30 AM to 8:59 AM | 143 (3.8%) | 236 (7.9%) |
| 9:00 AM to 9:59 AM | 154 (4.1%) | 100 (3.4%) |
| 10:00 AM to 10:59 AM | 24 (0.6%) | 32 (1.1%) |
| 11:00 AM to 11:59 AM | 30 (0.8%) | 29 (1.0%) |
| 12:00 PM to 3:59 PM | 253 (6.7%) | 454 (15.2%) |
| 4:00 PM to 11:59 PM | 254 (6.7%) | 101 (3.4%) |
| Total | 3,771 (100.0%) | 2,989 (100.0%) |
Housing Occupancy in Albemarle
Occupancy by Ownership in Albemarle
Of the total 6,535 dwellings in Albemarle, owner-occupied units account for 3,778 (57.8%), while renter-occupied units make up 2,757 (42.2%).
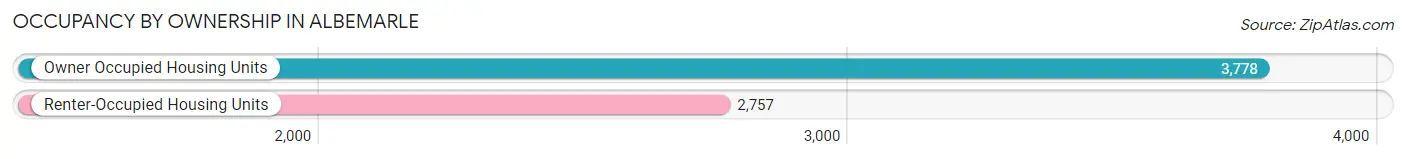
| Occupancy | # Housing Units | % Housing Units |
| Owner Occupied Housing Units | 3,778 | 57.8% |
| Renter-Occupied Housing Units | 2,757 | 42.2% |
| Total Occupied Housing Units | 6,535 | 100.0% |
Occupancy by Household Size in Albemarle
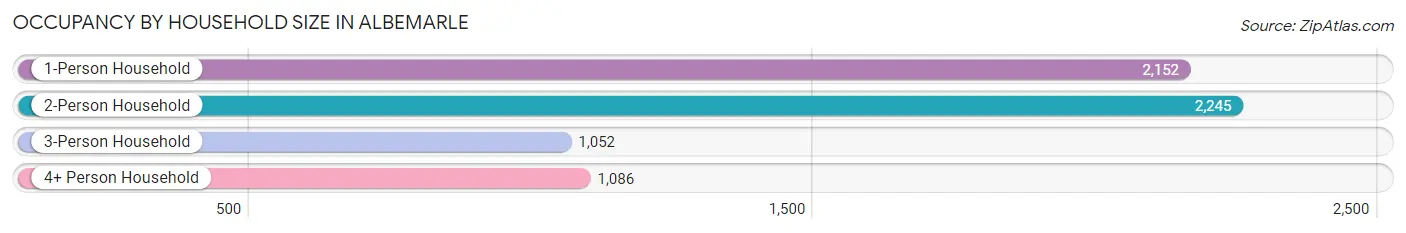
| Household Size | # Housing Units | % Housing Units |
| 1-Person Household | 2,152 | 32.9% |
| 2-Person Household | 2,245 | 34.4% |
| 3-Person Household | 1,052 | 16.1% |
| 4+ Person Household | 1,086 | 16.6% |
| Total Housing Units | 6,535 | 100.0% |
Occupancy by Ownership by Household Size in Albemarle
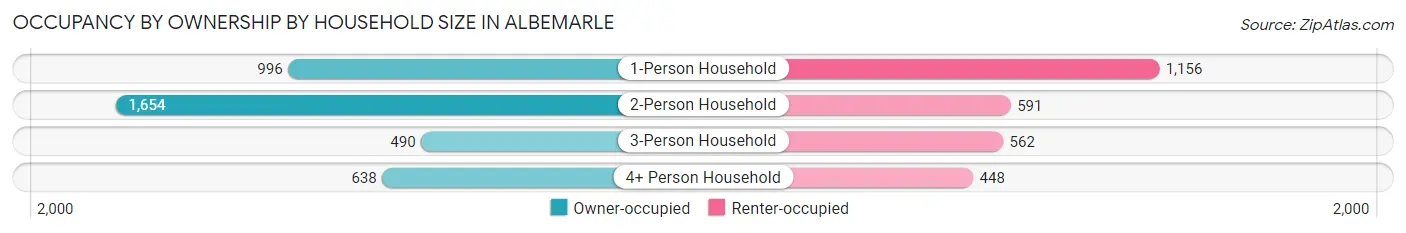
| Household Size | Owner-occupied | Renter-occupied |
| 1-Person Household | 996 (46.3%) | 1,156 (53.7%) |
| 2-Person Household | 1,654 (73.7%) | 591 (26.3%) |
| 3-Person Household | 490 (46.6%) | 562 (53.4%) |
| 4+ Person Household | 638 (58.8%) | 448 (41.2%) |
| Total Housing Units | 3,778 (57.8%) | 2,757 (42.2%) |
Occupancy by Educational Attainment in Albemarle
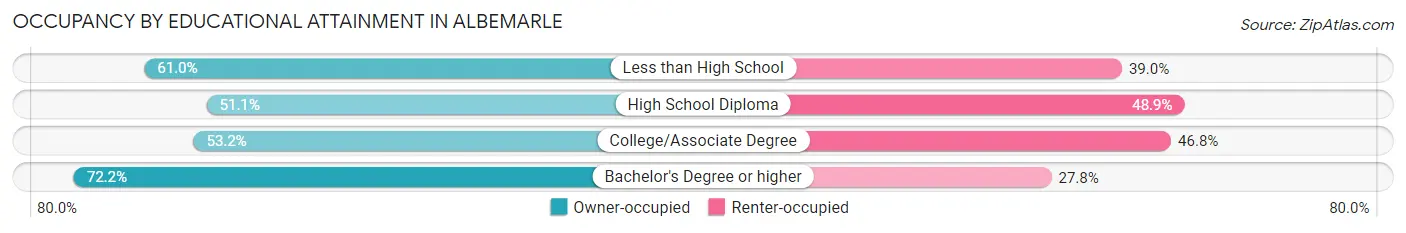
| Household Size | Owner-occupied | Renter-occupied |
| Less than High School | 532 (61.0%) | 340 (39.0%) |
| High School Diploma | 1,041 (51.1%) | 995 (48.9%) |
| College/Associate Degree | 1,159 (53.2%) | 1,019 (46.8%) |
| Bachelor's Degree or higher | 1,046 (72.2%) | 403 (27.8%) |
Occupancy by Age of Householder in Albemarle
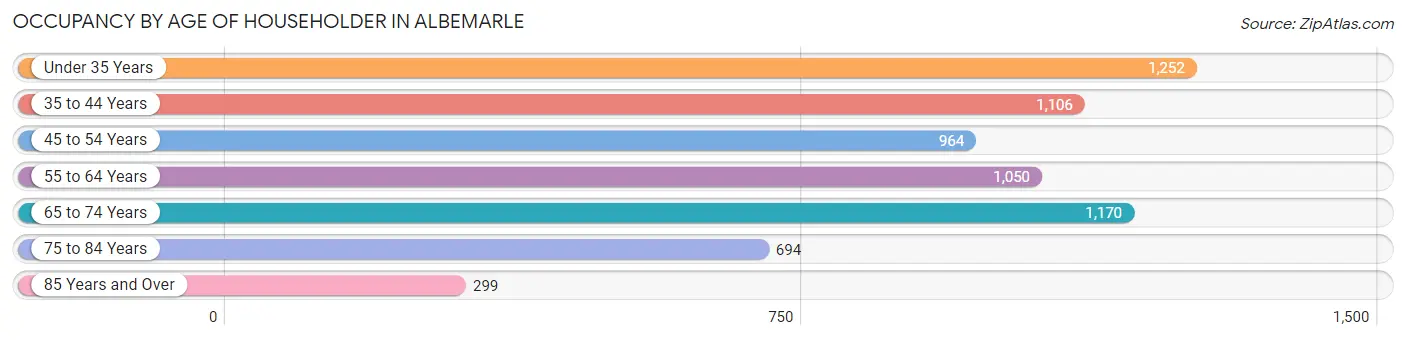
| Age Bracket | # Households | % Households |
| Under 35 Years | 1,252 | 19.2% |
| 35 to 44 Years | 1,106 | 16.9% |
| 45 to 54 Years | 964 | 14.7% |
| 55 to 64 Years | 1,050 | 16.1% |
| 65 to 74 Years | 1,170 | 17.9% |
| 75 to 84 Years | 694 | 10.6% |
| 85 Years and Over | 299 | 4.6% |
| Total | 6,535 | 100.0% |
Housing Finances in Albemarle
Median Income by Occupancy in Albemarle
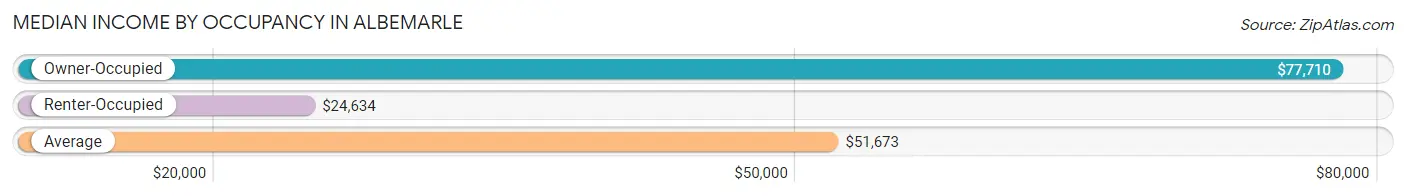
| Occupancy Type | # Households | Median Income |
| Owner-Occupied | 3,778 (57.8%) | $77,710 |
| Renter-Occupied | 2,757 (42.2%) | $24,634 |
| Average | 6,535 (100.0%) | $51,673 |
Occupancy by Householder Income Bracket in Albemarle
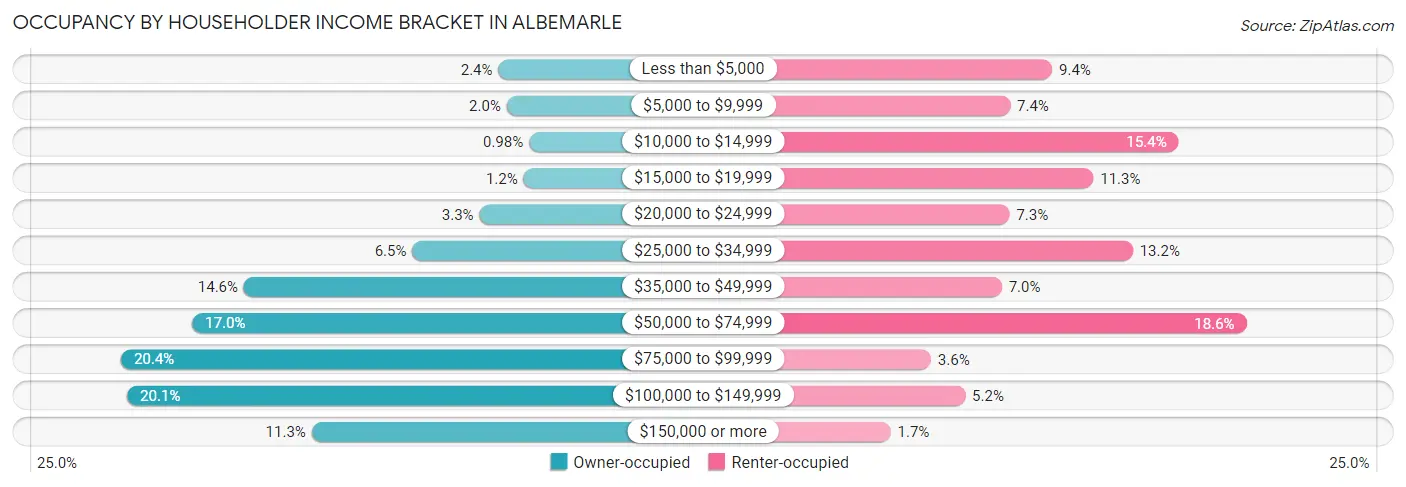
| Income Bracket | Owner-occupied | Renter-occupied |
| Less than $5,000 | 92 (2.4%) | 258 (9.4%) |
| $5,000 to $9,999 | 77 (2.0%) | 203 (7.4%) |
| $10,000 to $14,999 | 37 (1.0%) | 424 (15.4%) |
| $15,000 to $19,999 | 47 (1.2%) | 312 (11.3%) |
| $20,000 to $24,999 | 126 (3.3%) | 202 (7.3%) |
| $25,000 to $34,999 | 247 (6.5%) | 364 (13.2%) |
| $35,000 to $49,999 | 550 (14.6%) | 192 (7.0%) |
| $50,000 to $74,999 | 643 (17.0%) | 513 (18.6%) |
| $75,000 to $99,999 | 771 (20.4%) | 99 (3.6%) |
| $100,000 to $149,999 | 760 (20.1%) | 144 (5.2%) |
| $150,000 or more | 428 (11.3%) | 46 (1.7%) |
| Total | 3,778 (100.0%) | 2,757 (100.0%) |
Monthly Housing Cost Tiers in Albemarle
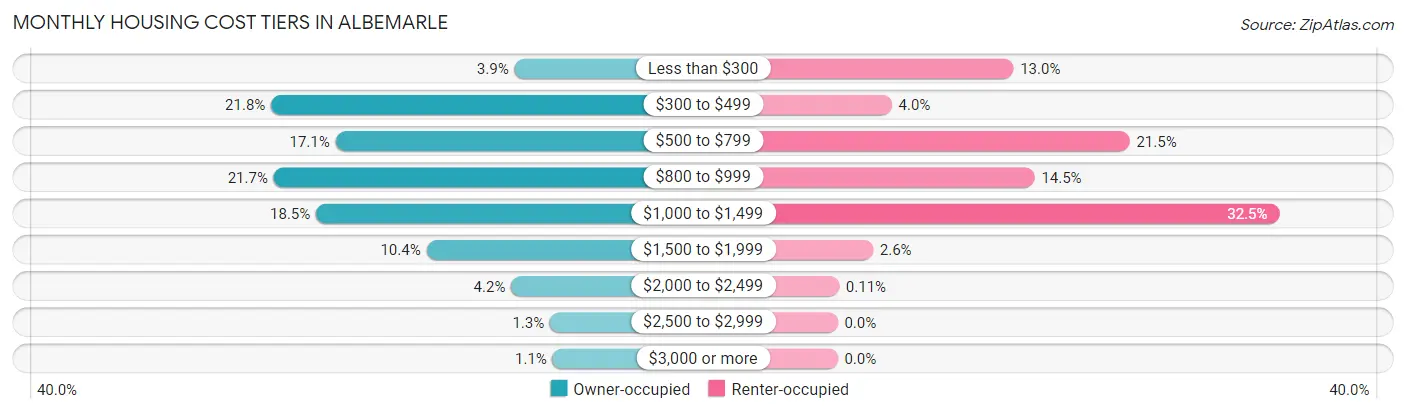
| Monthly Cost | Owner-occupied | Renter-occupied |
| Less than $300 | 148 (3.9%) | 357 (13.0%) |
| $300 to $499 | 825 (21.8%) | 110 (4.0%) |
| $500 to $799 | 646 (17.1%) | 593 (21.5%) |
| $800 to $999 | 818 (21.6%) | 400 (14.5%) |
| $1,000 to $1,499 | 700 (18.5%) | 897 (32.5%) |
| $1,500 to $1,999 | 393 (10.4%) | 72 (2.6%) |
| $2,000 to $2,499 | 157 (4.2%) | 3 (0.1%) |
| $2,500 to $2,999 | 49 (1.3%) | 0 (0.0%) |
| $3,000 or more | 42 (1.1%) | 0 (0.0%) |
| Total | 3,778 (100.0%) | 2,757 (100.0%) |
Physical Housing Characteristics in Albemarle
Housing Structures in Albemarle
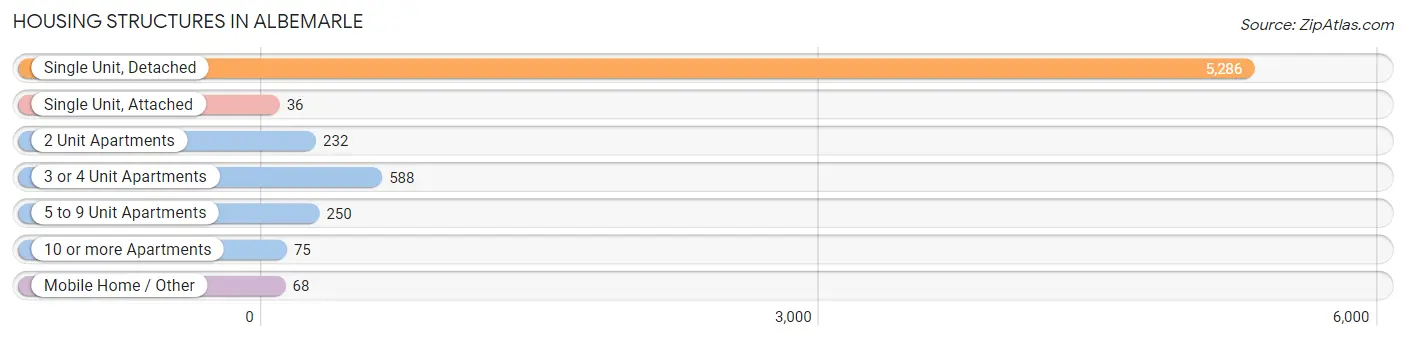
| Structure Type | # Housing Units | % Housing Units |
| Single Unit, Detached | 5,286 | 80.9% |
| Single Unit, Attached | 36 | 0.5% |
| 2 Unit Apartments | 232 | 3.5% |
| 3 or 4 Unit Apartments | 588 | 9.0% |
| 5 to 9 Unit Apartments | 250 | 3.8% |
| 10 or more Apartments | 75 | 1.1% |
| Mobile Home / Other | 68 | 1.0% |
| Total | 6,535 | 100.0% |
Housing Structures by Occupancy in Albemarle
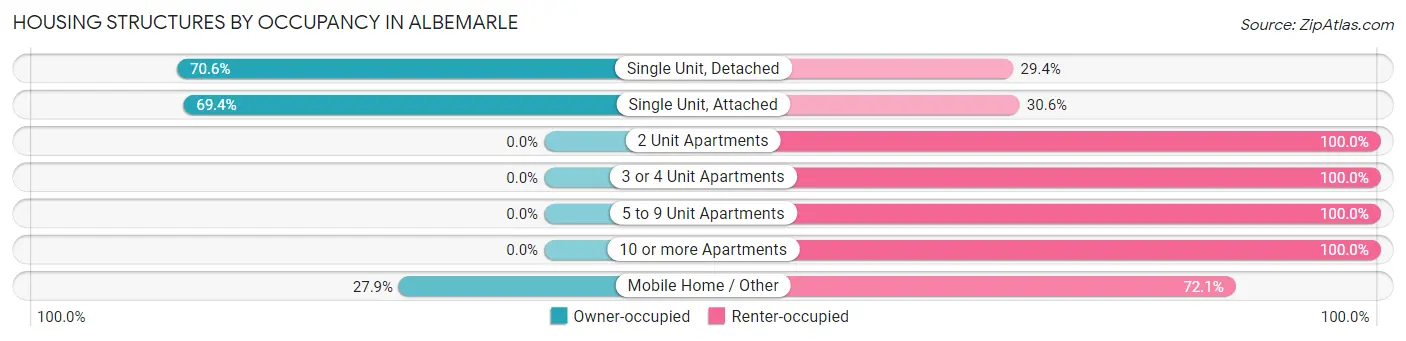
| Structure Type | Owner-occupied | Renter-occupied |
| Single Unit, Detached | 3,734 (70.6%) | 1,552 (29.4%) |
| Single Unit, Attached | 25 (69.4%) | 11 (30.6%) |
| 2 Unit Apartments | 0 (0.0%) | 232 (100.0%) |
| 3 or 4 Unit Apartments | 0 (0.0%) | 588 (100.0%) |
| 5 to 9 Unit Apartments | 0 (0.0%) | 250 (100.0%) |
| 10 or more Apartments | 0 (0.0%) | 75 (100.0%) |
| Mobile Home / Other | 19 (27.9%) | 49 (72.1%) |
| Total | 3,778 (57.8%) | 2,757 (42.2%) |
Housing Structures by Number of Rooms in Albemarle
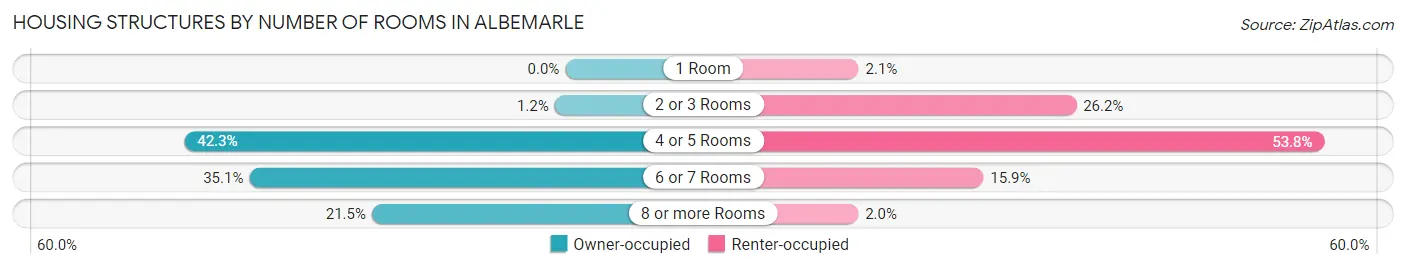
| Number of Rooms | Owner-occupied | Renter-occupied |
| 1 Room | 0 (0.0%) | 57 (2.1%) |
| 2 or 3 Rooms | 45 (1.2%) | 723 (26.2%) |
| 4 or 5 Rooms | 1,597 (42.3%) | 1,482 (53.7%) |
| 6 or 7 Rooms | 1,325 (35.1%) | 439 (15.9%) |
| 8 or more Rooms | 811 (21.5%) | 56 (2.0%) |
| Total | 3,778 (100.0%) | 2,757 (100.0%) |
Housing Structure by Heating Type in Albemarle
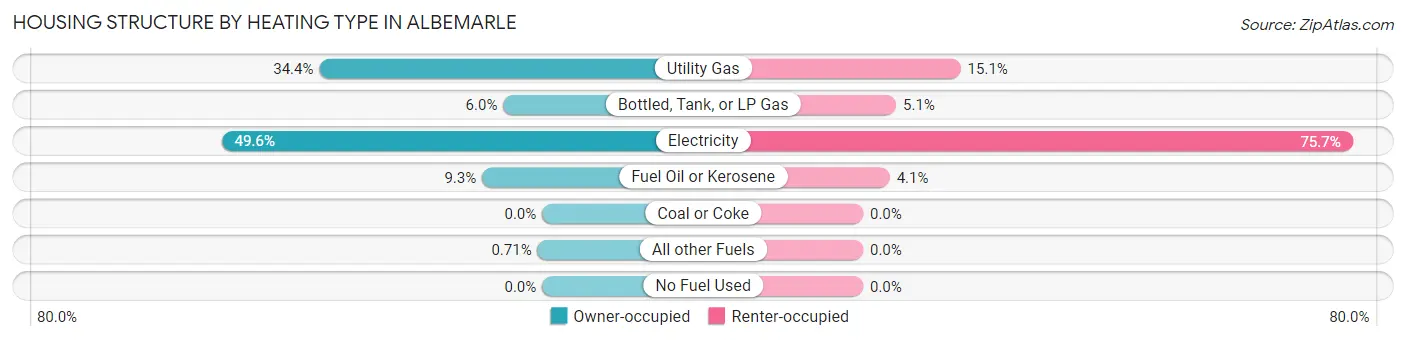
| Heating Type | Owner-occupied | Renter-occupied |
| Utility Gas | 1,301 (34.4%) | 416 (15.1%) |
| Bottled, Tank, or LP Gas | 227 (6.0%) | 141 (5.1%) |
| Electricity | 1,872 (49.5%) | 2,086 (75.7%) |
| Fuel Oil or Kerosene | 351 (9.3%) | 114 (4.1%) |
| Coal or Coke | 0 (0.0%) | 0 (0.0%) |
| All other Fuels | 27 (0.7%) | 0 (0.0%) |
| No Fuel Used | 0 (0.0%) | 0 (0.0%) |
| Total | 3,778 (100.0%) | 2,757 (100.0%) |
Household Vehicle Usage in Albemarle
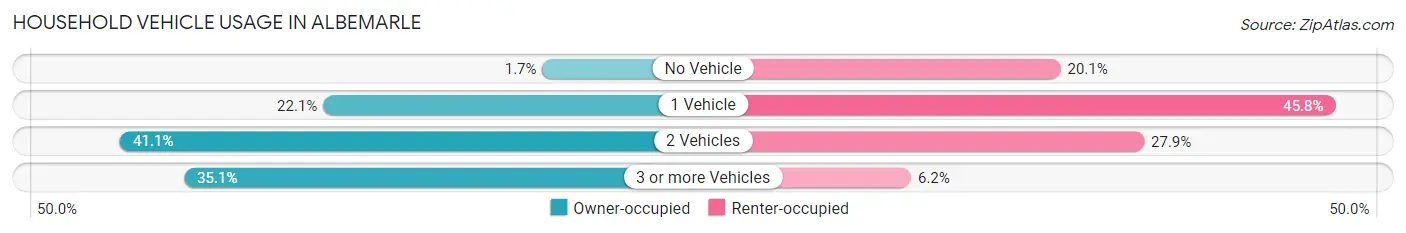
| Vehicles per Household | Owner-occupied | Renter-occupied |
| No Vehicle | 63 (1.7%) | 555 (20.1%) |
| 1 Vehicle | 836 (22.1%) | 1,262 (45.8%) |
| 2 Vehicles | 1,552 (41.1%) | 770 (27.9%) |
| 3 or more Vehicles | 1,327 (35.1%) | 170 (6.2%) |
| Total | 3,778 (100.0%) | 2,757 (100.0%) |
Real Estate & Mortgages in Albemarle
Real Estate and Mortgage Overview in Albemarle
| Characteristic | Without Mortgage | With Mortgage |
| Housing Units | 1,567 | 2,211 |
| Median Property Value | $122,100 | $181,900 |
| Median Household Income | $54,625 | $356 |
| Monthly Housing Costs | $454 | $42 |
| Real Estate Taxes | $1,182 | $7 |
Property Value by Mortgage Status in Albemarle
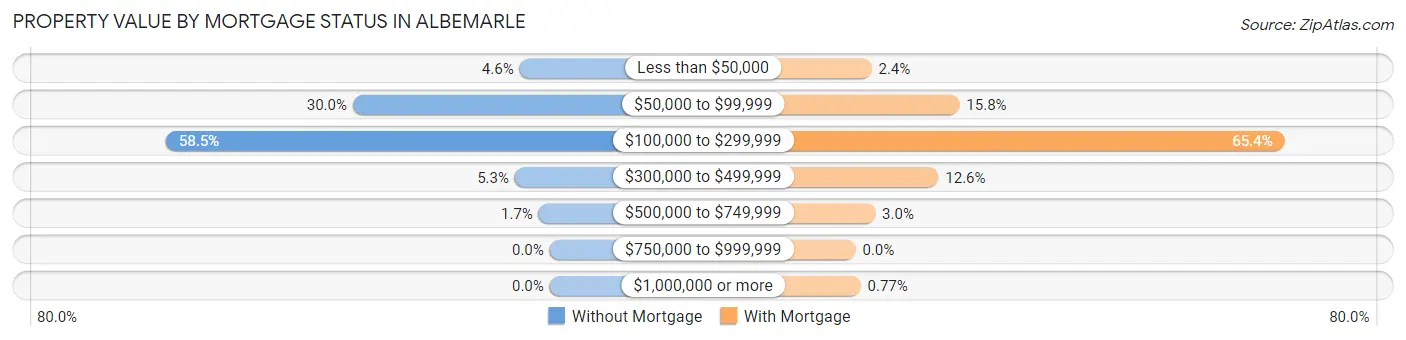
| Property Value | Without Mortgage | With Mortgage |
| Less than $50,000 | 72 (4.6%) | 54 (2.4%) |
| $50,000 to $99,999 | 470 (30.0%) | 350 (15.8%) |
| $100,000 to $299,999 | 916 (58.5%) | 1,445 (65.4%) |
| $300,000 to $499,999 | 83 (5.3%) | 279 (12.6%) |
| $500,000 to $749,999 | 26 (1.7%) | 66 (3.0%) |
| $750,000 to $999,999 | 0 (0.0%) | 0 (0.0%) |
| $1,000,000 or more | 0 (0.0%) | 17 (0.8%) |
| Total | 1,567 (100.0%) | 2,211 (100.0%) |
Household Income by Mortgage Status in Albemarle
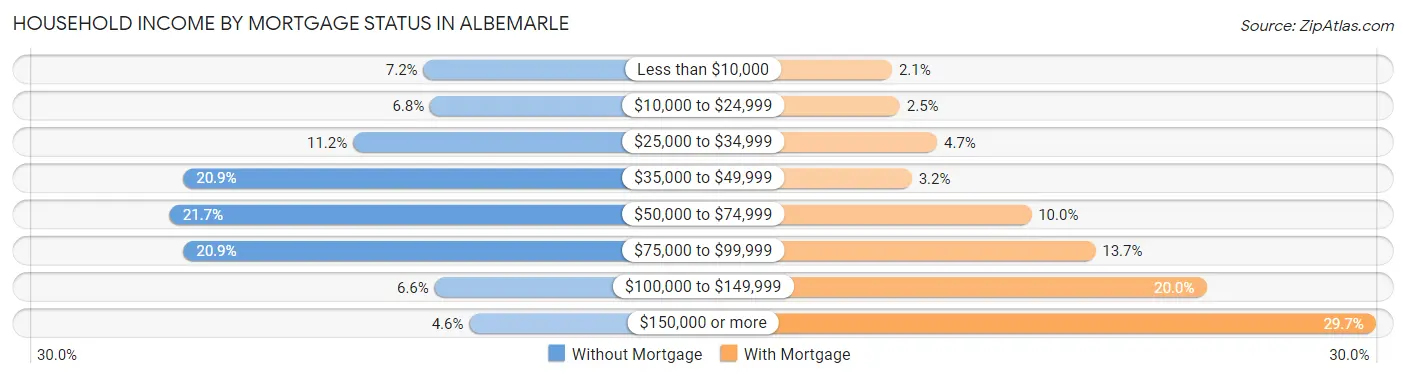
| Household Income | Without Mortgage | With Mortgage |
| Less than $10,000 | 113 (7.2%) | 46 (2.1%) |
| $10,000 to $24,999 | 107 (6.8%) | 56 (2.5%) |
| $25,000 to $34,999 | 176 (11.2%) | 103 (4.7%) |
| $35,000 to $49,999 | 328 (20.9%) | 71 (3.2%) |
| $50,000 to $74,999 | 340 (21.7%) | 222 (10.0%) |
| $75,000 to $99,999 | 328 (20.9%) | 303 (13.7%) |
| $100,000 to $149,999 | 103 (6.6%) | 443 (20.0%) |
| $150,000 or more | 72 (4.6%) | 657 (29.7%) |
| Total | 1,567 (100.0%) | 2,211 (100.0%) |
Property Value to Household Income Ratio in Albemarle
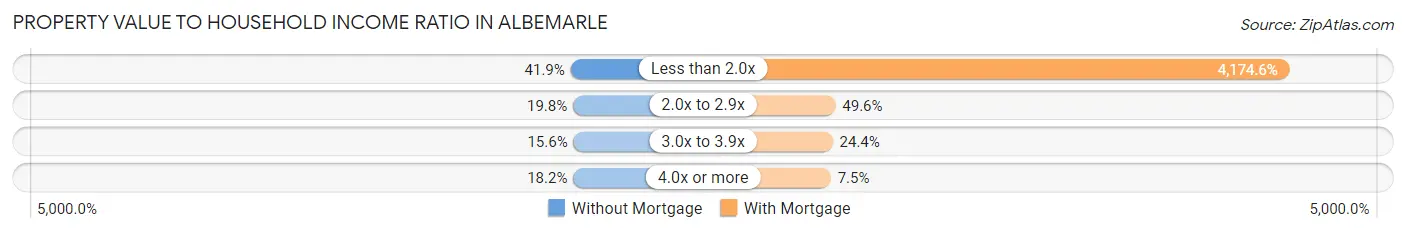
| Value-to-Income Ratio | Without Mortgage | With Mortgage |
| Less than 2.0x | 656 (41.9%) | 92,301 (4,174.6%) |
| 2.0x to 2.9x | 310 (19.8%) | 1,096 (49.6%) |
| 3.0x to 3.9x | 245 (15.6%) | 540 (24.4%) |
| 4.0x or more | 285 (18.2%) | 166 (7.5%) |
| Total | 1,567 (100.0%) | 2,211 (100.0%) |
Real Estate Taxes by Mortgage Status in Albemarle
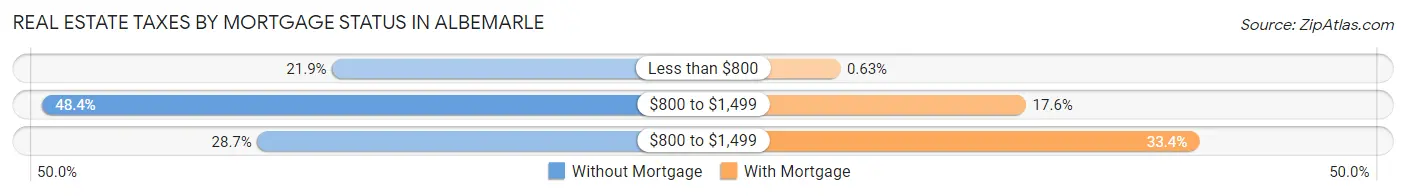
| Property Taxes | Without Mortgage | With Mortgage |
| Less than $800 | 343 (21.9%) | 14 (0.6%) |
| $800 to $1,499 | 758 (48.4%) | 389 (17.6%) |
| $800 to $1,499 | 450 (28.7%) | 739 (33.4%) |
| Total | 1,567 (100.0%) | 2,211 (100.0%) |
Health & Disability in Albemarle
Health Insurance Coverage by Age in Albemarle
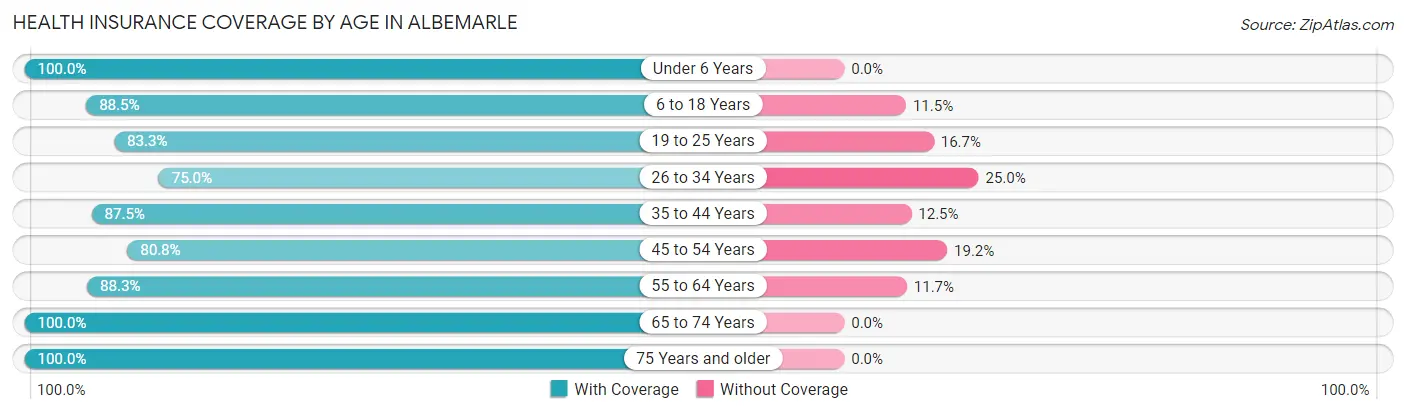
| Age Bracket | With Coverage | Without Coverage |
| Under 6 Years | 1,199 (100.0%) | 0 (0.0%) |
| 6 to 18 Years | 2,100 (88.5%) | 273 (11.5%) |
| 19 to 25 Years | 1,273 (83.3%) | 255 (16.7%) |
| 26 to 34 Years | 1,476 (75.0%) | 493 (25.0%) |
| 35 to 44 Years | 1,539 (87.5%) | 220 (12.5%) |
| 45 to 54 Years | 1,472 (80.8%) | 349 (19.2%) |
| 55 to 64 Years | 1,824 (88.3%) | 241 (11.7%) |
| 65 to 74 Years | 1,701 (100.0%) | 0 (0.0%) |
| 75 Years and older | 1,464 (100.0%) | 0 (0.0%) |
| Total | 14,048 (88.5%) | 1,831 (11.5%) |
Health Insurance Coverage by Citizenship Status in Albemarle
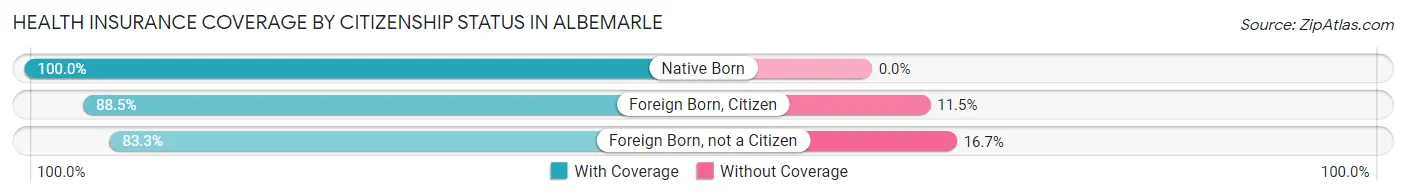
| Citizenship Status | With Coverage | Without Coverage |
| Native Born | 1,199 (100.0%) | 0 (0.0%) |
| Foreign Born, Citizen | 2,100 (88.5%) | 273 (11.5%) |
| Foreign Born, not a Citizen | 1,273 (83.3%) | 255 (16.7%) |
Health Insurance Coverage by Household Income in Albemarle
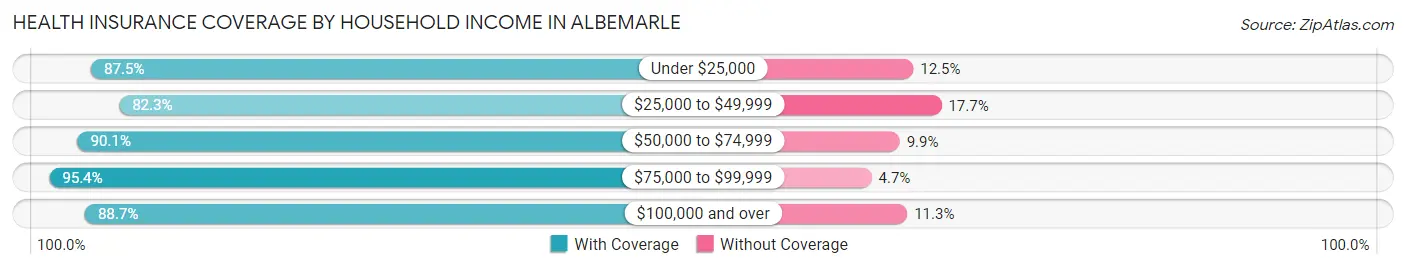
| Household Income | With Coverage | Without Coverage |
| Under $25,000 | 2,692 (87.5%) | 383 (12.5%) |
| $25,000 to $49,999 | 2,555 (82.3%) | 551 (17.7%) |
| $50,000 to $74,999 | 2,690 (90.1%) | 296 (9.9%) |
| $75,000 to $99,999 | 2,175 (95.4%) | 106 (4.6%) |
| $100,000 and over | 3,775 (88.7%) | 482 (11.3%) |
Public vs Private Health Insurance Coverage by Age in Albemarle
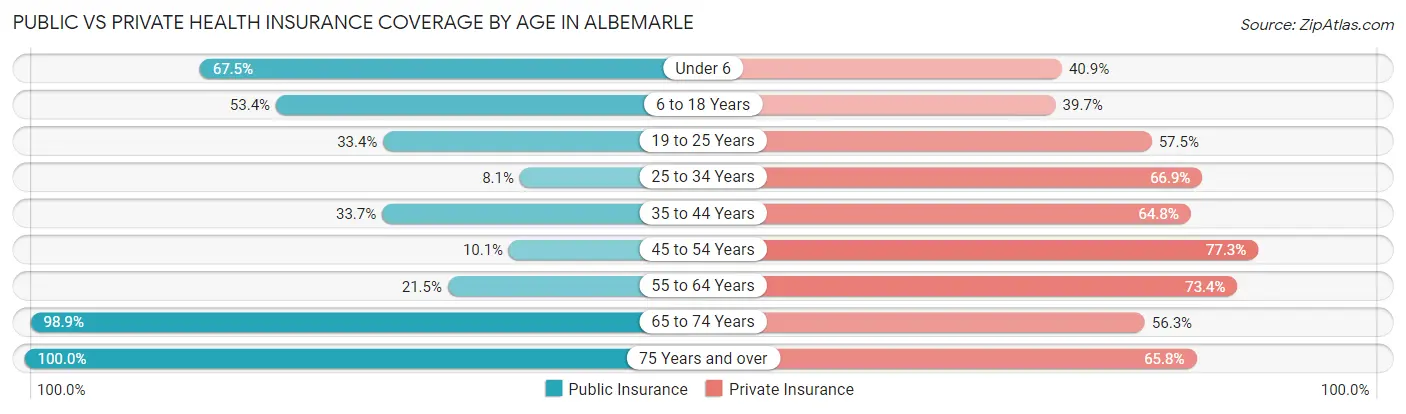
| Age Bracket | Public Insurance | Private Insurance |
| Under 6 | 809 (67.5%) | 490 (40.9%) |
| 6 to 18 Years | 1,266 (53.3%) | 942 (39.7%) |
| 19 to 25 Years | 511 (33.4%) | 879 (57.5%) |
| 25 to 34 Years | 159 (8.1%) | 1,317 (66.9%) |
| 35 to 44 Years | 592 (33.7%) | 1,139 (64.7%) |
| 45 to 54 Years | 184 (10.1%) | 1,407 (77.3%) |
| 55 to 64 Years | 443 (21.4%) | 1,516 (73.4%) |
| 65 to 74 Years | 1,682 (98.9%) | 957 (56.3%) |
| 75 Years and over | 1,464 (100.0%) | 963 (65.8%) |
| Total | 7,110 (44.8%) | 9,610 (60.5%) |
Disability Status by Sex by Age in Albemarle
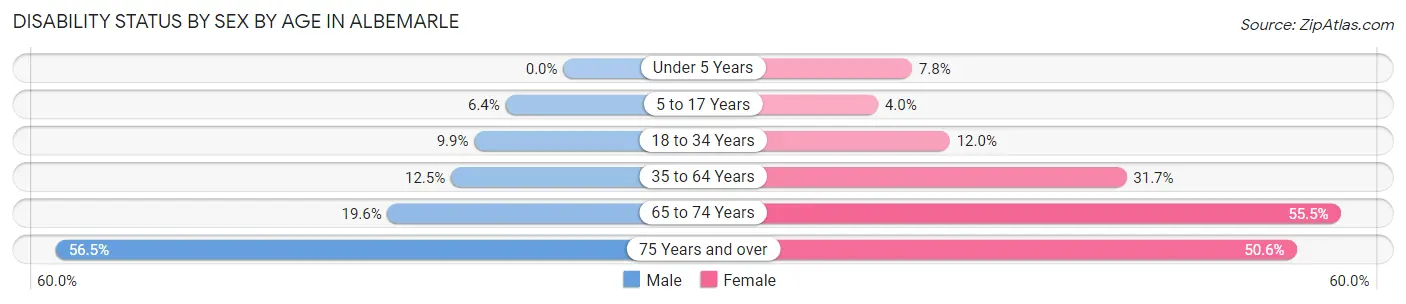
| Age Bracket | Male | Female |
| Under 5 Years | 0 (0.0%) | 26 (7.8%) |
| 5 to 17 Years | 81 (6.4%) | 55 (4.0%) |
| 18 to 34 Years | 186 (9.9%) | 212 (12.0%) |
| 35 to 64 Years | 338 (12.5%) | 933 (31.7%) |
| 65 to 74 Years | 149 (19.6%) | 522 (55.5%) |
| 75 Years and over | 381 (56.5%) | 400 (50.6%) |
Disability Class by Sex by Age in Albemarle
Disability Class: Hearing Difficulty
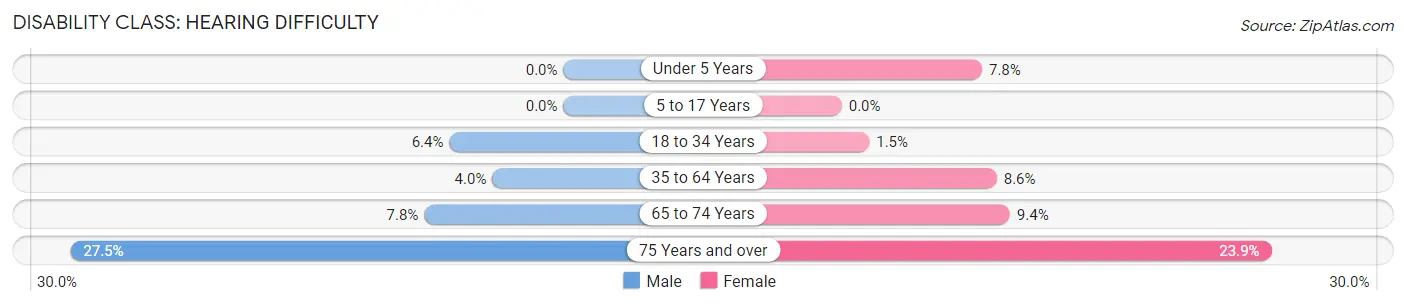
| Age Bracket | Male | Female |
| Under 5 Years | 0 (0.0%) | 26 (7.8%) |
| 5 to 17 Years | 0 (0.0%) | 0 (0.0%) |
| 18 to 34 Years | 119 (6.4%) | 27 (1.5%) |
| 35 to 64 Years | 107 (4.0%) | 254 (8.6%) |
| 65 to 74 Years | 59 (7.7%) | 88 (9.4%) |
| 75 Years and over | 185 (27.5%) | 189 (23.9%) |
Disability Class: Vision Difficulty
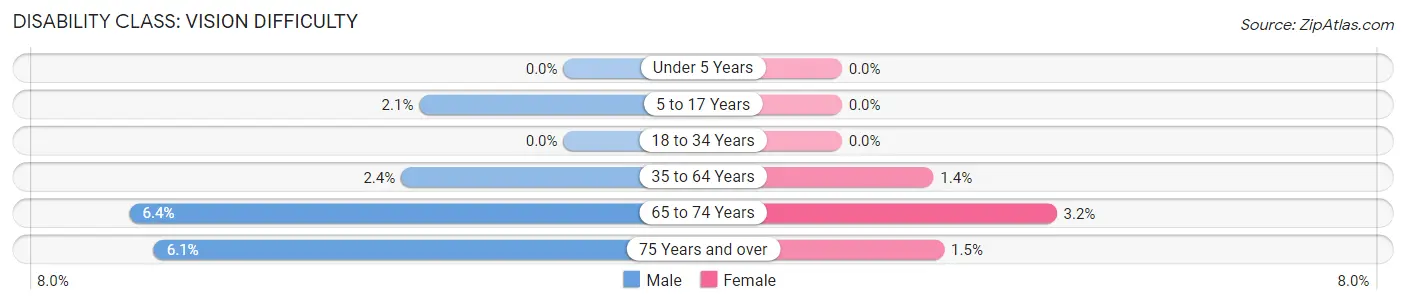
| Age Bracket | Male | Female |
| Under 5 Years | 0 (0.0%) | 0 (0.0%) |
| 5 to 17 Years | 27 (2.1%) | 0 (0.0%) |
| 18 to 34 Years | 0 (0.0%) | 0 (0.0%) |
| 35 to 64 Years | 65 (2.4%) | 40 (1.4%) |
| 65 to 74 Years | 49 (6.4%) | 30 (3.2%) |
| 75 Years and over | 41 (6.1%) | 12 (1.5%) |
Disability Class: Cognitive Difficulty
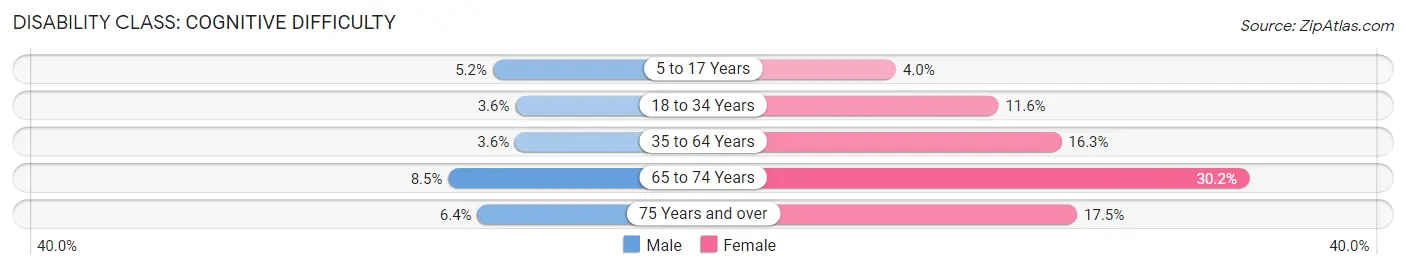
| Age Bracket | Male | Female |
| 5 to 17 Years | 66 (5.2%) | 55 (4.0%) |
| 18 to 34 Years | 67 (3.6%) | 205 (11.6%) |
| 35 to 64 Years | 97 (3.6%) | 480 (16.3%) |
| 65 to 74 Years | 65 (8.5%) | 284 (30.2%) |
| 75 Years and over | 43 (6.4%) | 138 (17.5%) |
Disability Class: Ambulatory Difficulty
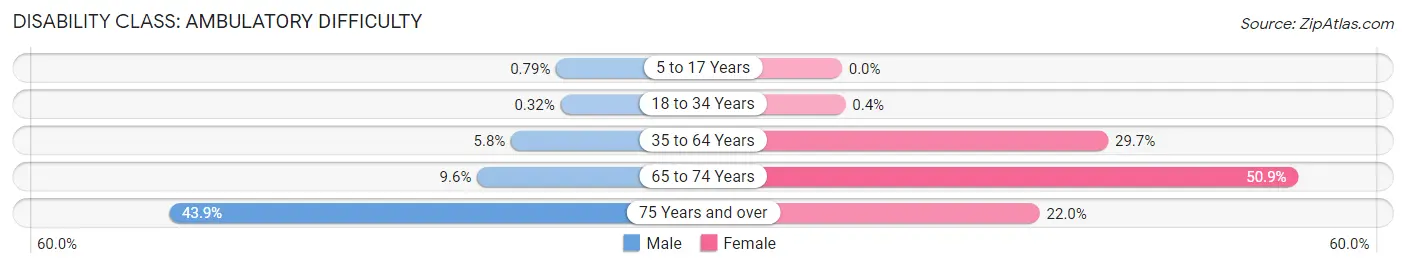
| Age Bracket | Male | Female |
| 5 to 17 Years | 10 (0.8%) | 0 (0.0%) |
| 18 to 34 Years | 6 (0.3%) | 7 (0.4%) |
| 35 to 64 Years | 157 (5.8%) | 873 (29.6%) |
| 65 to 74 Years | 73 (9.6%) | 478 (50.8%) |
| 75 Years and over | 296 (43.9%) | 174 (22.0%) |
Disability Class: Self-Care Difficulty
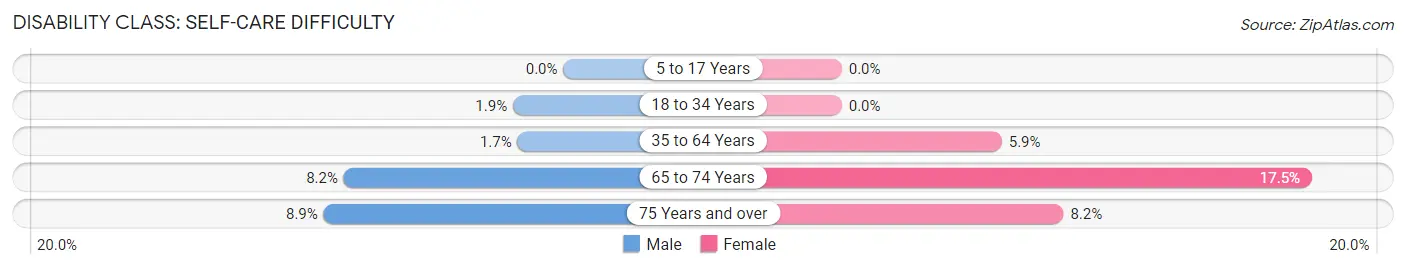
| Age Bracket | Male | Female |
| 5 to 17 Years | 0 (0.0%) | 0 (0.0%) |
| 18 to 34 Years | 35 (1.9%) | 0 (0.0%) |
| 35 to 64 Years | 46 (1.7%) | 175 (5.9%) |
| 65 to 74 Years | 62 (8.2%) | 164 (17.4%) |
| 75 Years and over | 60 (8.9%) | 65 (8.2%) |
Technology Access in Albemarle
Computing Device Access in Albemarle
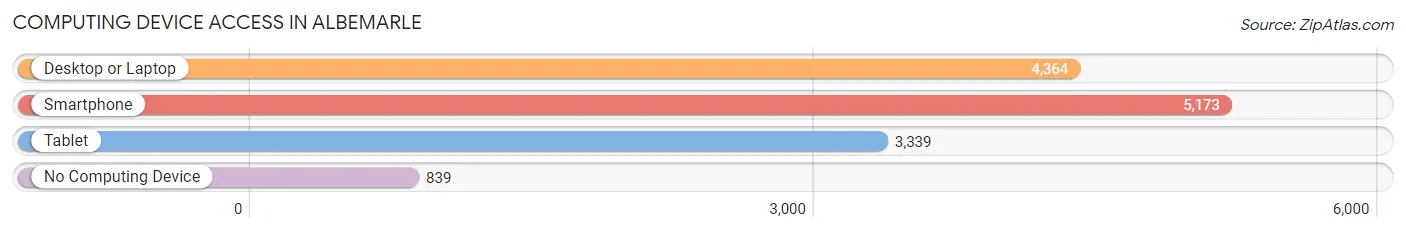
| Device Type | # Households | % Households |
| Desktop or Laptop | 4,364 | 66.8% |
| Smartphone | 5,173 | 79.2% |
| Tablet | 3,339 | 51.1% |
| No Computing Device | 839 | 12.8% |
| Total | 6,535 | 100.0% |
Internet Access in Albemarle
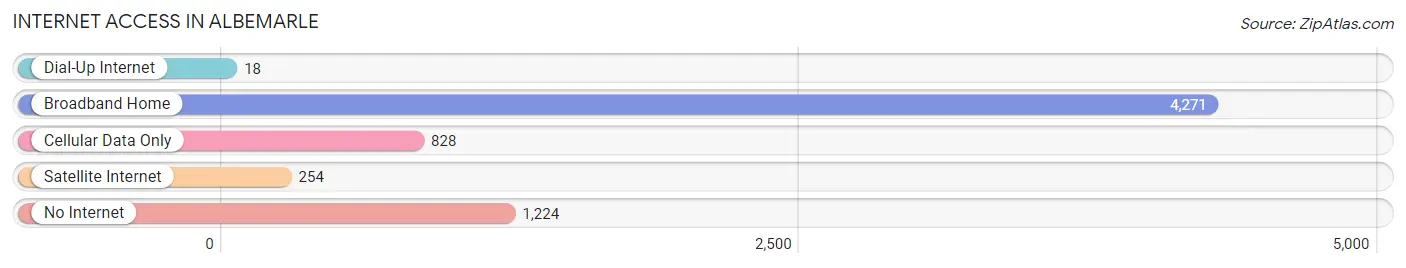
| Internet Type | # Households | % Households |
| Dial-Up Internet | 18 | 0.3% |
| Broadband Home | 4,271 | 65.4% |
| Cellular Data Only | 828 | 12.7% |
| Satellite Internet | 254 | 3.9% |
| No Internet | 1,224 | 18.7% |
| Total | 6,535 | 100.0% |
Albemarle Summary
Albemarle, North Carolina is a small city located in Stanly County, in the central part of the state. It is situated on the banks of the Yadkin River, and is the county seat of Stanly County. The city has a population of 15,903, according to the 2010 census.
History
Albemarle was founded in 1787 by the North Carolina General Assembly, and was named after George Albemarle, the first Earl of Albemarle. The city was originally a trading post, and was the site of a Revolutionary War battle in 1781. The city was incorporated in 1857, and was the site of a major Civil War battle in 1865.
Geography
Albemarle is located in the Piedmont region of North Carolina, and is situated on the banks of the Yadkin River. The city is located at the intersection of US Highway 52 and NC Highway 24/27. The city is surrounded by rolling hills and forests, and is located approximately 50 miles northeast of Charlotte.
Economy
Albemarle is a small city, and its economy is largely based on agriculture and manufacturing. The city is home to several large manufacturing companies, including Albemarle Corporation, which produces chemicals and specialty materials. The city is also home to several small businesses, including restaurants, retail stores, and service providers.
Demographics
According to the 2010 census, Albemarle has a population of 15,903. The population is predominantly white (83.3%), with African Americans making up 11.2% of the population. The median household income is $37,845, and the median age is 38.7 years.
Conclusion
Albemarle, North Carolina is a small city located in Stanly County, in the central part of the state. It is situated on the banks of the Yadkin River, and is the county seat of Stanly County. The city has a population of 15,903, according to the 2010 census. The city's economy is largely based on agriculture and manufacturing, and the population is predominantly white. Albemarle is a small city with a rich history, and is a great place to live and work.
Common Questions
What is Per Capita Income in Albemarle?
Per Capita income in Albemarle is $27,698.
What is the Median Family Income in Albemarle?
Median Family Income in Albemarle is $69,300.
What is the Median Household income in Albemarle?
Median Household Income in Albemarle is $51,673.
What is Income or Wage Gap in Albemarle?
Income or Wage Gap in Albemarle is 31.4%.
Women in Albemarle earn 68.6 cents for every dollar earned by a man.
What is Inequality or Gini Index in Albemarle?
Inequality or Gini Index in Albemarle is 0.45.
What is the Total Population of Albemarle?
Total Population of Albemarle is 16,444.
What is the Total Male Population of Albemarle?
Total Male Population of Albemarle is 7,935.
What is the Total Female Population of Albemarle?
Total Female Population of Albemarle is 8,509.
What is the Ratio of Males per 100 Females in Albemarle?
There are 93.25 Males per 100 Females in Albemarle.
What is the Ratio of Females per 100 Males in Albemarle?
There are 107.23 Females per 100 Males in Albemarle.
What is the Median Population Age in Albemarle?
Median Population Age in Albemarle is 39.7 Years.
What is the Average Family Size in Albemarle
Average Family Size in Albemarle is 3.0 People.
What is the Average Household Size in Albemarle
Average Household Size in Albemarle is 2.4 People.
How Large is the Labor Force in Albemarle?
There are 7,816 People in the Labor Forcein in Albemarle.
What is the Percentage of People in the Labor Force in Albemarle?
58.2% of People are in the Labor Force in Albemarle.
What is the Unemployment Rate in Albemarle?
Unemployment Rate in Albemarle is 6.6%.