Sullivan, MO Map & Demographics
Sullivan Map
Sullivan Overview
$31,068
PER CAPITA INCOME
$83,370
AVG FAMILY INCOME
$59,243
AVG HOUSEHOLD INCOME
41.1%
WAGE / INCOME GAP [ % ]
58.9¢/ $1
WAGE / INCOME GAP [ $ ]
0.37
INEQUALITY / GINI INDEX
6,441
TOTAL POPULATION
3,124
MALE POPULATION
3,317
FEMALE POPULATION
94.18
MALES / 100 FEMALES
106.18
FEMALES / 100 MALES
41.2
MEDIAN AGE
2.9
AVG FAMILY SIZE
2.3
AVG HOUSEHOLD SIZE
3,104
LABOR FORCE [ PEOPLE ]
60.8%
PERCENT IN LABOR FORCE
4.4%
UNEMPLOYMENT RATE
Sullivan Zip Codes
Sullivan Area Codes
Income in Sullivan
Income Overview in Sullivan
Per Capita Income in Sullivan is $31,068, while median incomes of families and households are $83,370 and $59,243 respectively.
| Characteristic | Number | Measure |
| Per Capita Income | 6,441 | $31,068 |
| Median Family Income | 1,656 | $83,370 |
| Mean Family Income | 1,656 | $82,256 |
| Median Household Income | 2,769 | $59,243 |
| Mean Household Income | 2,769 | $71,465 |
| Income Deficit | 1,656 | $0 |
| Wage / Income Gap (%) | 6,441 | 41.14% |
| Wage / Income Gap ($) | 6,441 | 58.86¢ per $1 |
| Gini / Inequality Index | 6,441 | 0.37 |
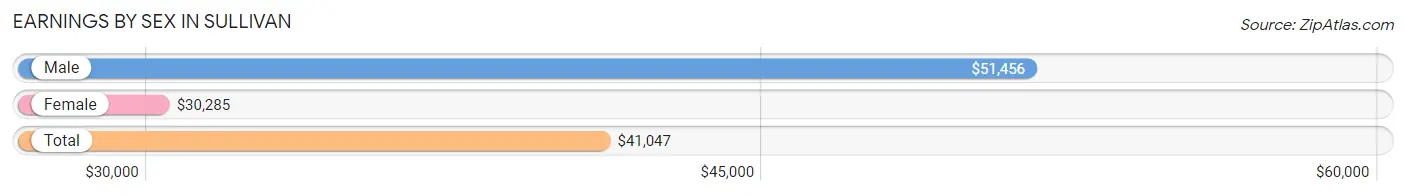
Earnings by Sex in Sullivan
Average Earnings in Sullivan are $41,047, $51,456 for men and $30,285 for women, a difference of 41.1%.
| Sex | Number | Average Earnings |
| Male | 1,651 (50.8%) | $51,456 |
| Female | 1,597 (49.2%) | $30,285 |
| Total | 3,248 (100.0%) | $41,047 |
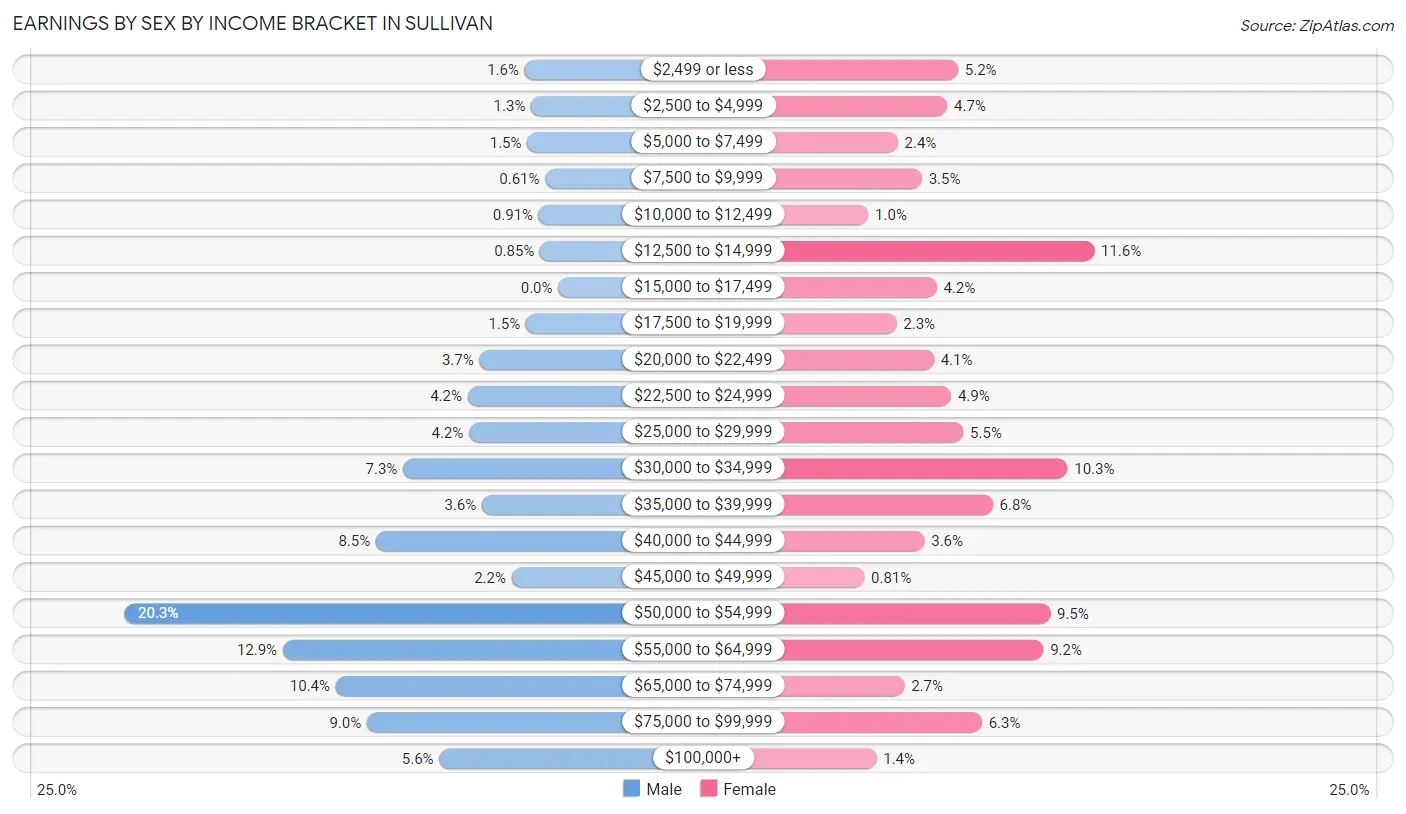
Earnings by Sex by Income Bracket in Sullivan
The most common earnings brackets in Sullivan are $50,000 to $54,999 for men (335 | 20.3%) and $12,500 to $14,999 for women (185 | 11.6%).
| Income | Male | Female |
| $2,499 or less | 26 (1.6%) | 83 (5.2%) |
| $2,500 to $4,999 | 21 (1.3%) | 75 (4.7%) |
| $5,000 to $7,499 | 24 (1.5%) | 38 (2.4%) |
| $7,500 to $9,999 | 10 (0.6%) | 56 (3.5%) |
| $10,000 to $12,499 | 15 (0.9%) | 16 (1.0%) |
| $12,500 to $14,999 | 14 (0.9%) | 185 (11.6%) |
| $15,000 to $17,499 | 0 (0.0%) | 67 (4.2%) |
| $17,500 to $19,999 | 25 (1.5%) | 37 (2.3%) |
| $20,000 to $22,499 | 61 (3.7%) | 65 (4.1%) |
| $22,500 to $24,999 | 70 (4.2%) | 78 (4.9%) |
| $25,000 to $29,999 | 69 (4.2%) | 87 (5.4%) |
| $30,000 to $34,999 | 120 (7.3%) | 165 (10.3%) |
| $35,000 to $39,999 | 59 (3.6%) | 109 (6.8%) |
| $40,000 to $44,999 | 141 (8.5%) | 58 (3.6%) |
| $45,000 to $49,999 | 36 (2.2%) | 13 (0.8%) |
| $50,000 to $54,999 | 335 (20.3%) | 152 (9.5%) |
| $55,000 to $64,999 | 213 (12.9%) | 147 (9.2%) |
| $65,000 to $74,999 | 172 (10.4%) | 43 (2.7%) |
| $75,000 to $99,999 | 148 (9.0%) | 101 (6.3%) |
| $100,000+ | 92 (5.6%) | 22 (1.4%) |
| Total | 1,651 (100.0%) | 1,597 (100.0%) |
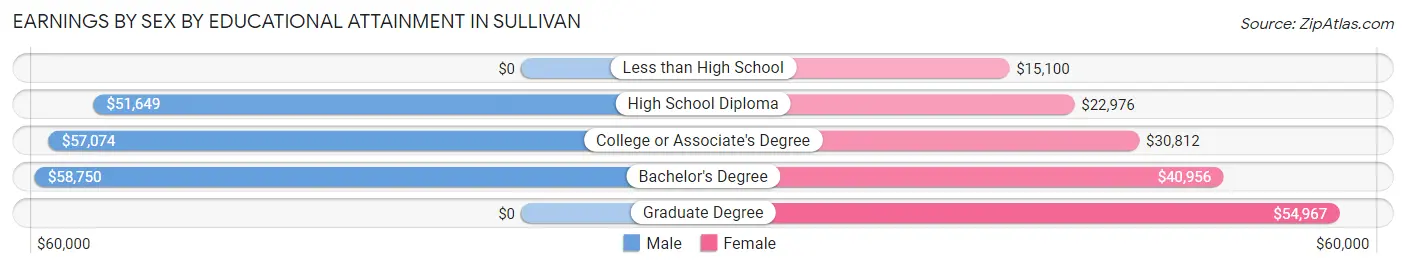
Earnings by Sex by Educational Attainment in Sullivan
Average earnings in Sullivan are $54,028 for men and $31,980 for women, a difference of 40.8%. Men with an educational attainment of bachelor's degree enjoy the highest average annual earnings of $58,750, while those with high school diploma education earn the least with $51,649. Women with an educational attainment of graduate degree earn the most with the average annual earnings of $54,967, while those with less than high school education have the smallest earnings of $15,100.
| Educational Attainment | Male Income | Female Income |
| Less than High School | - | - |
| High School Diploma | $51,649 | $22,976 |
| College or Associate's Degree | $57,074 | $30,812 |
| Bachelor's Degree | $58,750 | $40,956 |
| Graduate Degree | - | - |
| Total | $54,028 | $31,980 |
Family Income in Sullivan
Family Income Brackets in Sullivan
According to the Sullivan family income data, there are 429 families falling into the $75,000 to $99,999 income range, which is the most common income bracket and makes up 25.9% of all families. Conversely, the $200,000+ income bracket is the least frequent group with only 23 families (1.4%) belonging to this category.
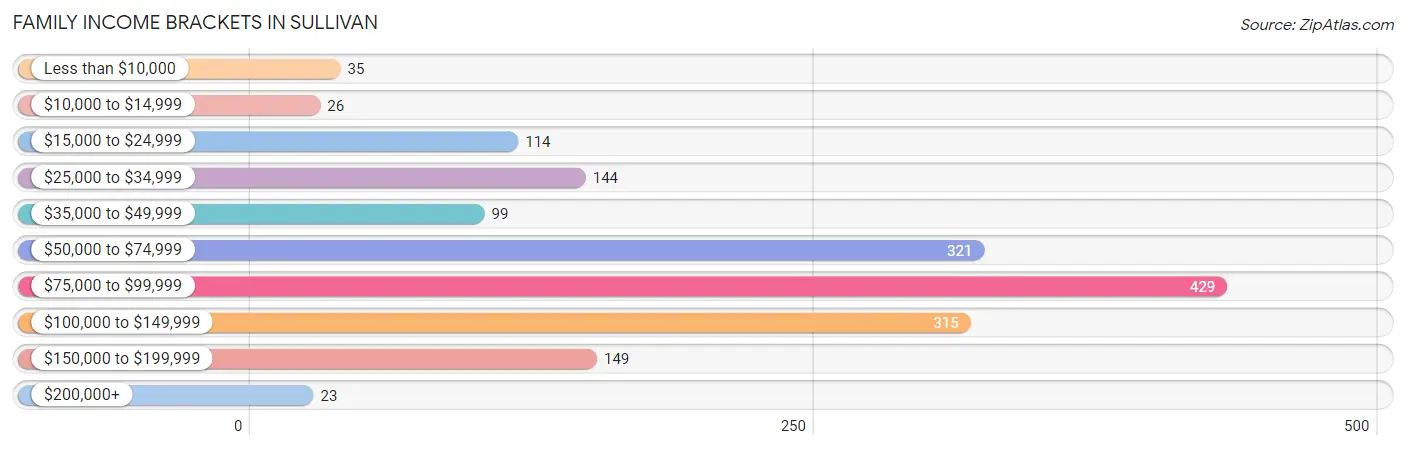
| Income Bracket | # Families | % Families |
| Less than $10,000 | 35 | 2.1% |
| $10,000 to $14,999 | 26 | 1.6% |
| $15,000 to $24,999 | 114 | 6.9% |
| $25,000 to $34,999 | 144 | 8.7% |
| $35,000 to $49,999 | 99 | 6.0% |
| $50,000 to $74,999 | 321 | 19.4% |
| $75,000 to $99,999 | 429 | 25.9% |
| $100,000 to $149,999 | 315 | 19.0% |
| $150,000 to $199,999 | 149 | 9.0% |
| $200,000+ | 23 | 1.4% |
Family Income by Famaliy Size in Sullivan
6-person families (46 | 2.8%) account for the highest median family income in Sullivan with $107,500 per family, while 3-person families (515 | 31.1%) have the highest median income of $34,208 per family member.
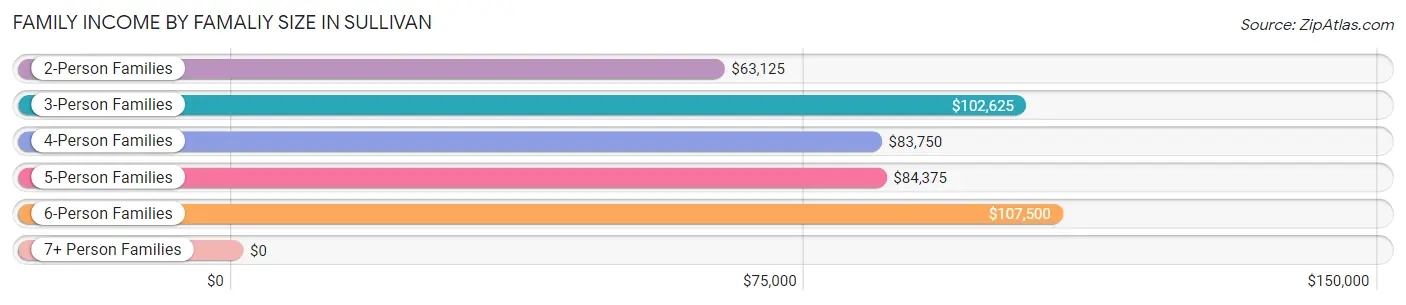
| Income Bracket | # Families | Median Income |
| 2-Person Families | 820 (49.5%) | $63,125 |
| 3-Person Families | 515 (31.1%) | $102,625 |
| 4-Person Families | 234 (14.1%) | $83,750 |
| 5-Person Families | 30 (1.8%) | $84,375 |
| 6-Person Families | 46 (2.8%) | $107,500 |
| 7+ Person Families | 11 (0.7%) | $0 |
| Total | 1,656 (100.0%) | $83,370 |
Family Income by Number of Earners in Sullivan
The median family income in Sullivan is $83,370, with families comprising 3+ earners (153) having the highest median family income of $134,904, while families with no earners (333) have the lowest median family income of $47,639, accounting for 9.2% and 20.1% of families, respectively.
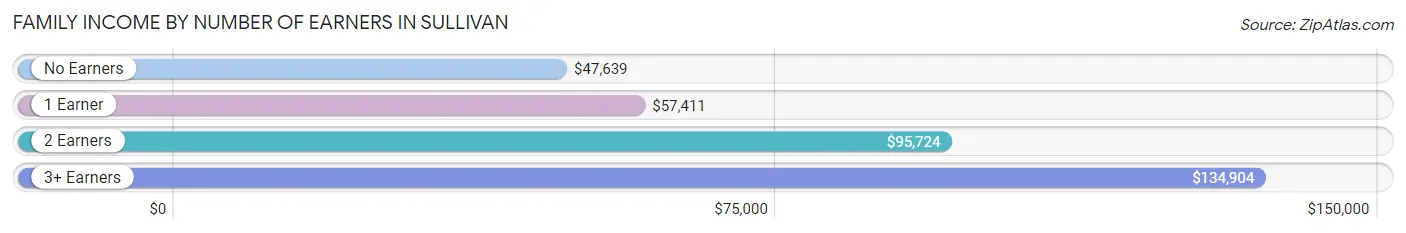
| Number of Earners | # Families | Median Income |
| No Earners | 333 (20.1%) | $47,639 |
| 1 Earner | 515 (31.1%) | $57,411 |
| 2 Earners | 655 (39.6%) | $95,724 |
| 3+ Earners | 153 (9.2%) | $134,904 |
| Total | 1,656 (100.0%) | $83,370 |
Household Income in Sullivan
Household Income Brackets in Sullivan
With 576 households falling in the category, the $75,000 to $99,999 income range is the most frequent in Sullivan, accounting for 20.8% of all households. In contrast, only 42 households (1.5%) fall into the $200,000+ income bracket, making it the least populous group.
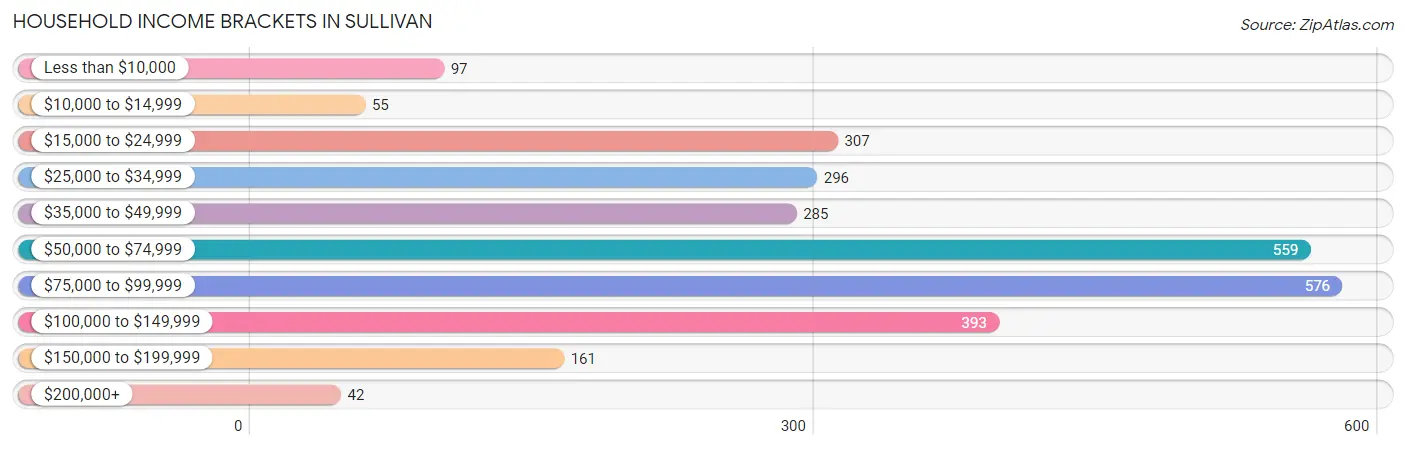
| Income Bracket | # Households | % Households |
| Less than $10,000 | 97 | 3.5% |
| $10,000 to $14,999 | 55 | 2.0% |
| $15,000 to $24,999 | 307 | 11.1% |
| $25,000 to $34,999 | 296 | 10.7% |
| $35,000 to $49,999 | 285 | 10.3% |
| $50,000 to $74,999 | 559 | 20.2% |
| $75,000 to $99,999 | 576 | 20.8% |
| $100,000 to $149,999 | 393 | 14.2% |
| $150,000 to $199,999 | 161 | 5.8% |
| $200,000+ | 42 | 1.5% |
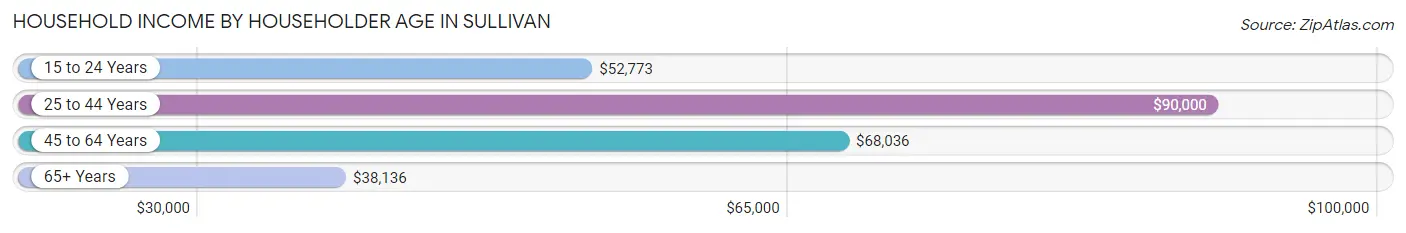
Household Income by Householder Age in Sullivan
The median household income in Sullivan is $59,243, with the highest median household income of $90,000 found in the 25 to 44 years age bracket for the primary householder. A total of 698 households (25.2%) fall into this category. Meanwhile, the 65+ years age bracket for the primary householder has the lowest median household income of $38,136, with 862 households (31.1%) in this group.
| Income Bracket | # Households | Median Income |
| 15 to 24 Years | 172 (6.2%) | $52,773 |
| 25 to 44 Years | 698 (25.2%) | $90,000 |
| 45 to 64 Years | 1,037 (37.4%) | $68,036 |
| 65+ Years | 862 (31.1%) | $38,136 |
| Total | 2,769 (100.0%) | $59,243 |
Poverty in Sullivan
Income Below Poverty by Sex and Age in Sullivan
With 5.2% poverty level for males and 13.6% for females among the residents of Sullivan, 5 year old males and under 5 year old females are the most vulnerable to poverty, with 16 males (48.5%) and 84 females (39.1%) in their respective age groups living below the poverty level.
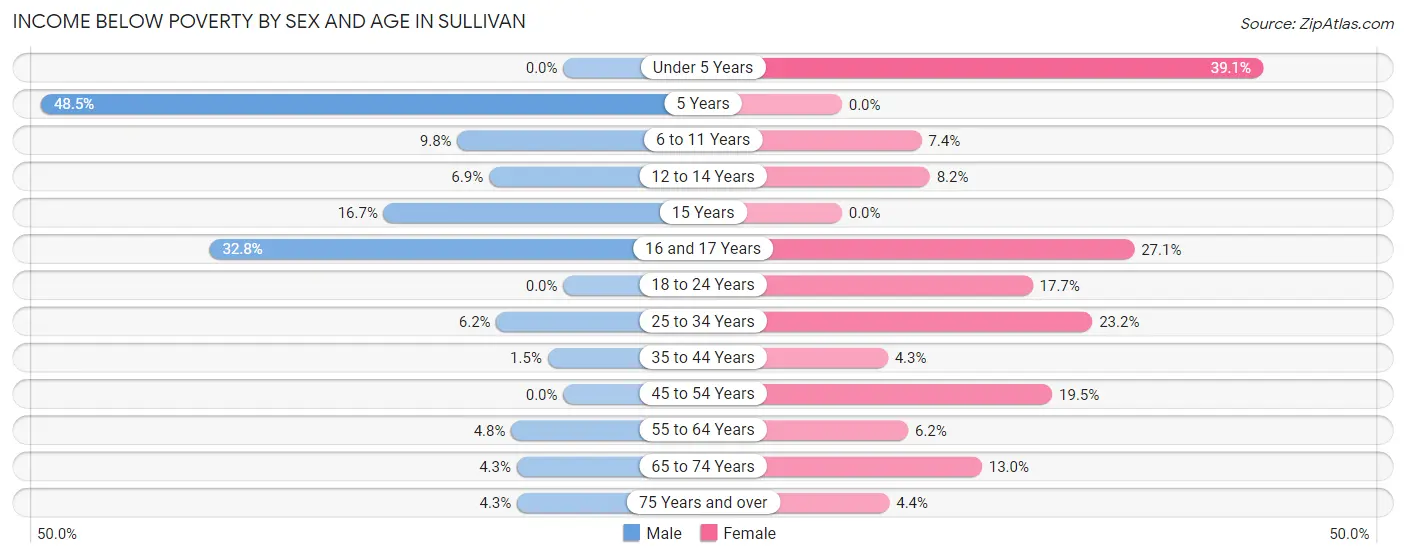
| Age Bracket | Male | Female |
| Under 5 Years | 0 (0.0%) | 84 (39.1%) |
| 5 Years | 16 (48.5%) | 0 (0.0%) |
| 6 to 11 Years | 29 (9.8%) | 17 (7.4%) |
| 12 to 14 Years | 12 (6.9%) | 4 (8.2%) |
| 15 Years | 22 (16.7%) | 0 (0.0%) |
| 16 and 17 Years | 22 (32.8%) | 19 (27.1%) |
| 18 to 24 Years | 0 (0.0%) | 34 (17.7%) |
| 25 to 34 Years | 20 (6.2%) | 109 (23.2%) |
| 35 to 44 Years | 5 (1.5%) | 15 (4.3%) |
| 45 to 54 Years | 0 (0.0%) | 65 (19.5%) |
| 55 to 64 Years | 16 (4.8%) | 26 (6.1%) |
| 65 to 74 Years | 7 (4.3%) | 43 (13.0%) |
| 75 Years and over | 10 (4.3%) | 23 (4.4%) |
| Total | 159 (5.2%) | 439 (13.6%) |
Income Above Poverty by Sex and Age in Sullivan
According to the poverty statistics in Sullivan, males aged under 5 years and females aged 5 years are the age groups that are most secure financially, with 100.0% of males and 100.0% of females in these age groups living above the poverty line.
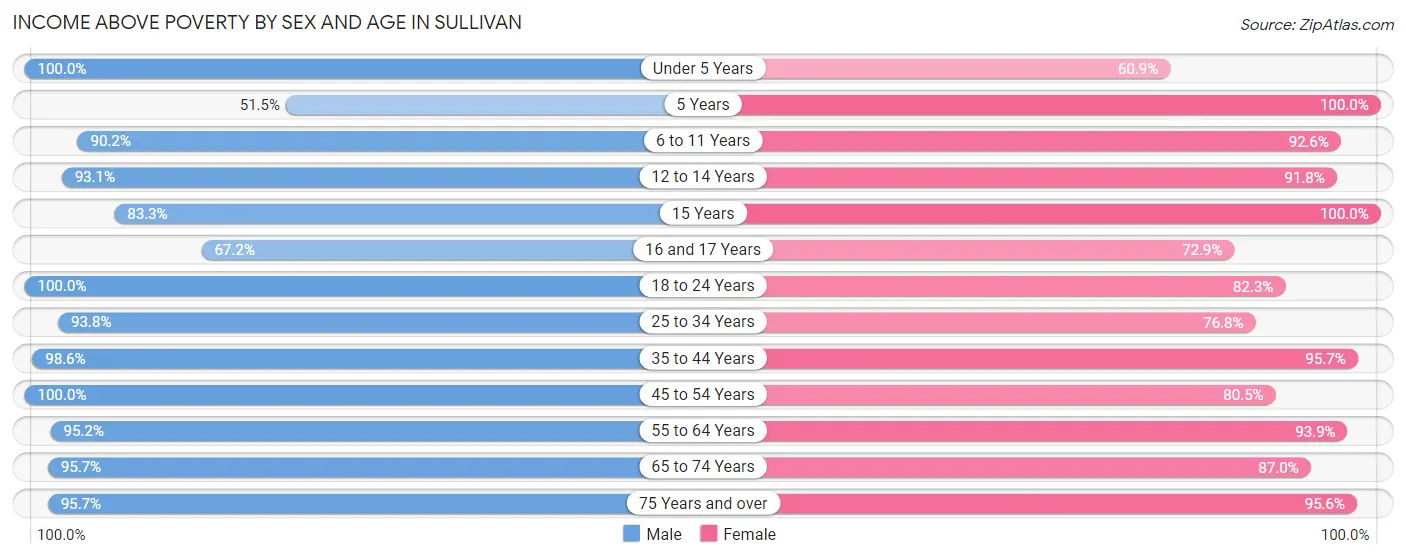
| Age Bracket | Male | Female |
| Under 5 Years | 139 (100.0%) | 131 (60.9%) |
| 5 Years | 17 (51.5%) | 24 (100.0%) |
| 6 to 11 Years | 266 (90.2%) | 213 (92.6%) |
| 12 to 14 Years | 162 (93.1%) | 45 (91.8%) |
| 15 Years | 110 (83.3%) | 11 (100.0%) |
| 16 and 17 Years | 45 (67.2%) | 51 (72.9%) |
| 18 to 24 Years | 383 (100.0%) | 158 (82.3%) |
| 25 to 34 Years | 302 (93.8%) | 360 (76.8%) |
| 35 to 44 Years | 340 (98.6%) | 337 (95.7%) |
| 45 to 54 Years | 456 (100.0%) | 268 (80.5%) |
| 55 to 64 Years | 315 (95.2%) | 397 (93.9%) |
| 65 to 74 Years | 155 (95.7%) | 288 (87.0%) |
| 75 Years and over | 223 (95.7%) | 499 (95.6%) |
| Total | 2,913 (94.8%) | 2,782 (86.4%) |
Income Below Poverty Among Married-Couple Families in Sullivan
The poverty statistics for married-couple families in Sullivan show that 0.4% or 4 of the total 1,035 families live below the poverty line. Families with 5 or more children have the highest poverty rate of 100.0%, comprising of 4 families. On the other hand, families with no children have the lowest poverty rate of 0.0%, which includes 0 families.
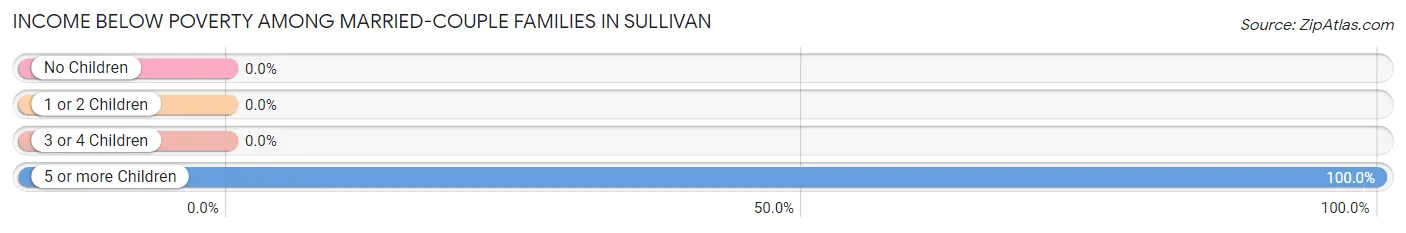
| Children | Above Poverty | Below Poverty |
| No Children | 661 (100.0%) | 0 (0.0%) |
| 1 or 2 Children | 319 (100.0%) | 0 (0.0%) |
| 3 or 4 Children | 51 (100.0%) | 0 (0.0%) |
| 5 or more Children | 0 (0.0%) | 4 (100.0%) |
| Total | 1,031 (99.6%) | 4 (0.4%) |
Income Below Poverty Among Single-Parent Households in Sullivan
According to the poverty data in Sullivan, 5.9% or 12 single-father households and 18.5% or 77 single-mother households are living below the poverty line. Among single-father households, those with no children have the highest poverty rate, with 10 households (20.0%) experiencing poverty. Likewise, among single-mother households, those with 3 or 4 children have the highest poverty rate, with 16 households (64.0%) falling below the poverty line.
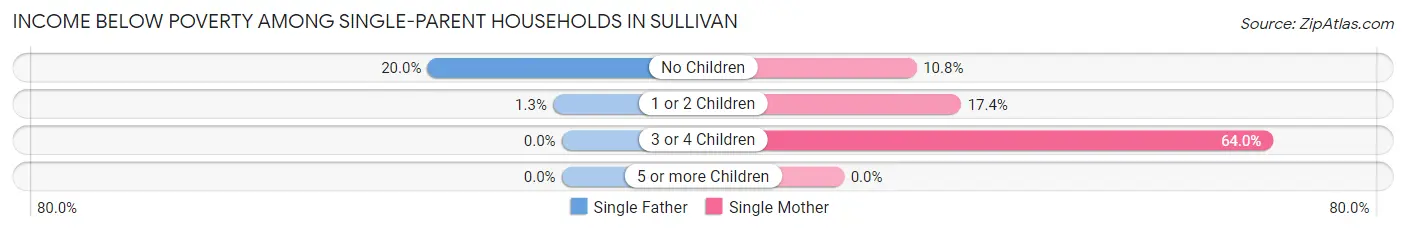
| Children | Single Father | Single Mother |
| No Children | 10 (20.0%) | 12 (10.8%) |
| 1 or 2 Children | 2 (1.3%) | 49 (17.4%) |
| 3 or 4 Children | 0 (0.0%) | 16 (64.0%) |
| 5 or more Children | 0 (0.0%) | 0 (0.0%) |
| Total | 12 (5.9%) | 77 (18.5%) |
Income Below Poverty Among Married-Couple vs Single-Parent Households in Sullivan
The poverty data for Sullivan shows that 4 of the married-couple family households (0.4%) and 89 of the single-parent households (14.3%) are living below the poverty level. Within the married-couple family households, those with 5 or more children have the highest poverty rate, with 4 households (100.0%) falling below the poverty line. Among the single-parent households, those with 3 or 4 children have the highest poverty rate, with 16 household (64.0%) living below poverty.
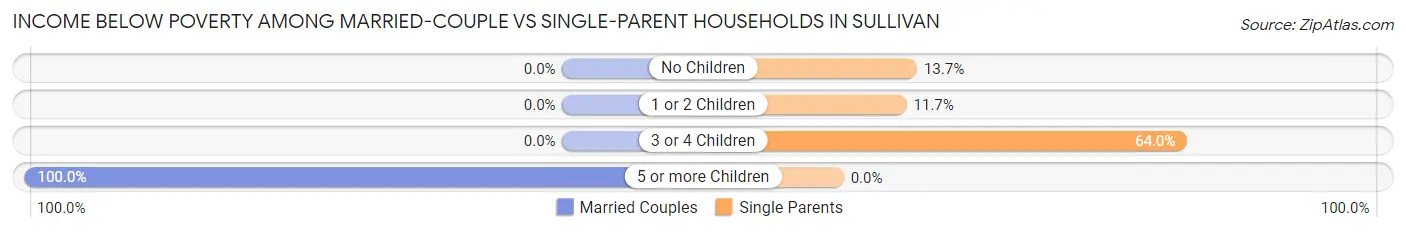
| Children | Married-Couple Families | Single-Parent Households |
| No Children | 0 (0.0%) | 22 (13.7%) |
| 1 or 2 Children | 0 (0.0%) | 51 (11.7%) |
| 3 or 4 Children | 0 (0.0%) | 16 (64.0%) |
| 5 or more Children | 4 (100.0%) | 0 (0.0%) |
| Total | 4 (0.4%) | 89 (14.3%) |
Race in Sullivan
The most populous races in Sullivan are White / Caucasian (5,817 | 90.3%), Two or more Races (454 | 7.0%), and Black / African American (117 | 1.8%).
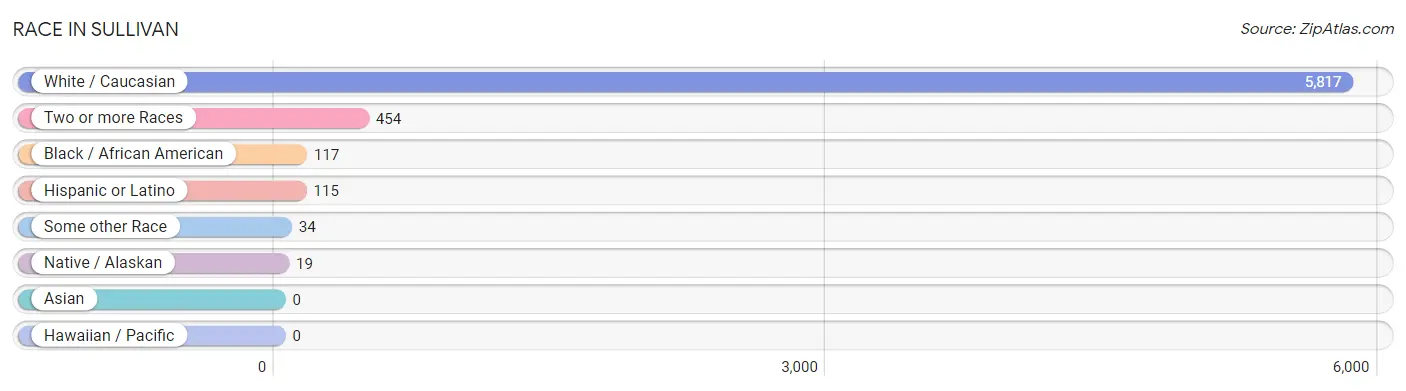
| Race | # Population | % Population |
| Asian | 0 | 0.0% |
| Black / African American | 117 | 1.8% |
| Hawaiian / Pacific | 0 | 0.0% |
| Hispanic or Latino | 115 | 1.8% |
| Native / Alaskan | 19 | 0.3% |
| White / Caucasian | 5,817 | 90.3% |
| Two or more Races | 454 | 7.0% |
| Some other Race | 34 | 0.5% |
| Total | 6,441 | 100.0% |
Ancestry in Sullivan
The most populous ancestries reported in Sullivan are German (1,562 | 24.2%), English (901 | 14.0%), Irish (709 | 11.0%), American (591 | 9.2%), and Italian (247 | 3.8%), together accounting for 62.3% of all Sullivan residents.
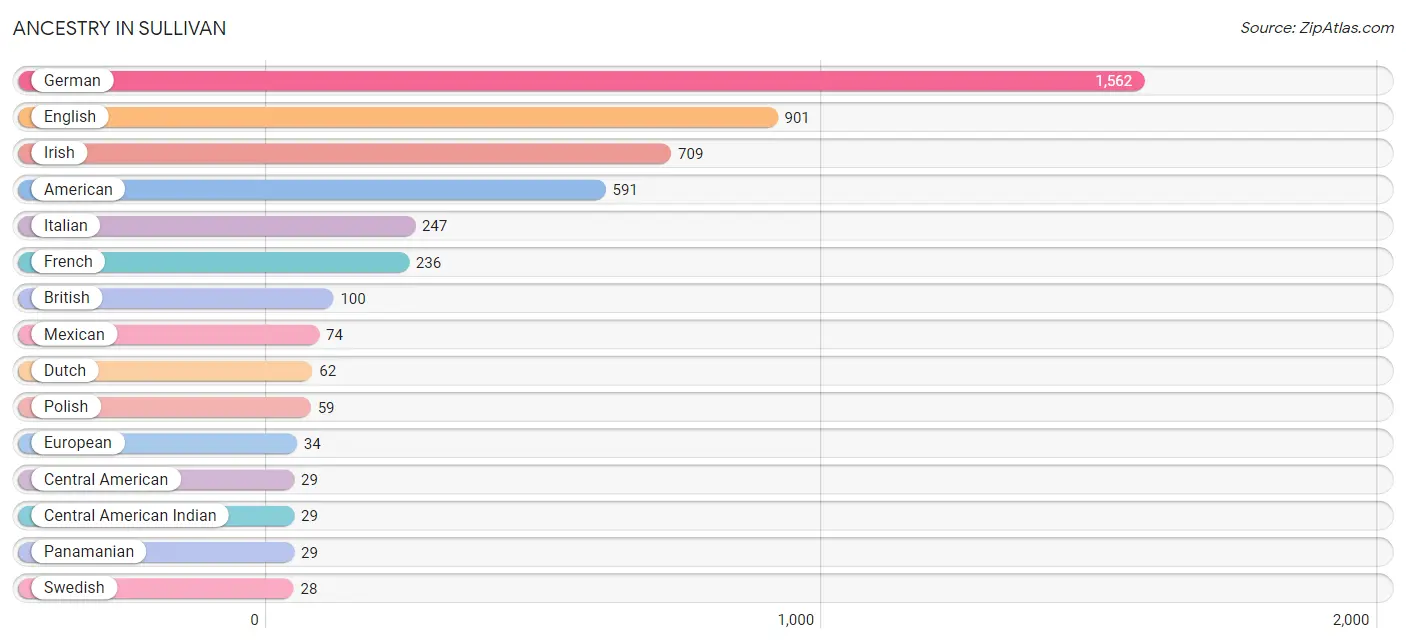
| Ancestry | # Population | % Population |
| American | 591 | 9.2% |
| Blackfeet | 3 | 0.1% |
| British | 100 | 1.5% |
| Central American | 29 | 0.4% |
| Central American Indian | 29 | 0.4% |
| Cherokee | 9 | 0.1% |
| Croatian | 7 | 0.1% |
| Czech | 7 | 0.1% |
| Danish | 12 | 0.2% |
| Dutch | 62 | 1.0% |
| English | 901 | 14.0% |
| European | 34 | 0.5% |
| Finnish | 11 | 0.2% |
| French | 236 | 3.7% |
| French Canadian | 22 | 0.3% |
| German | 1,562 | 24.2% |
| Irish | 709 | 11.0% |
| Italian | 247 | 3.8% |
| Mexican | 74 | 1.1% |
| Nigerian | 7 | 0.1% |
| Northern European | 10 | 0.2% |
| Norwegian | 11 | 0.2% |
| Panamanian | 29 | 0.4% |
| Polish | 59 | 0.9% |
| Romanian | 24 | 0.4% |
| Scottish | 2 | 0.0% |
| Spanish | 12 | 0.2% |
| Subsaharan African | 7 | 0.1% |
| Swedish | 28 | 0.4% |
| Thai | 26 | 0.4% |
| Ukrainian | 8 | 0.1% |
| Welsh | 6 | 0.1% | View All 32 Rows |
Immigrants in Sullivan
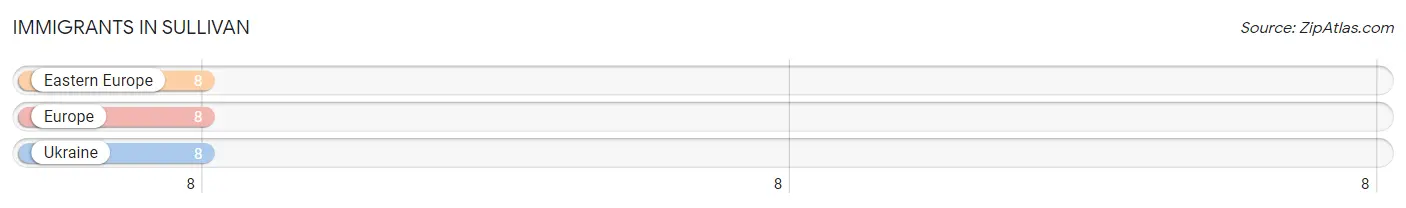
The most numerous immigrant groups reported in Sullivan came from Eastern Europe (8 | 0.1%), Europe (8 | 0.1%), and Ukraine (8 | 0.1%), together accounting for 0.4% of all Sullivan residents.
| Immigration Origin | # Population | % Population |
| Eastern Europe | 8 | 0.1% |
| Europe | 8 | 0.1% |
| Ukraine | 8 | 0.1% | View All 3 Rows |
Sex and Age in Sullivan
Sex and Age in Sullivan
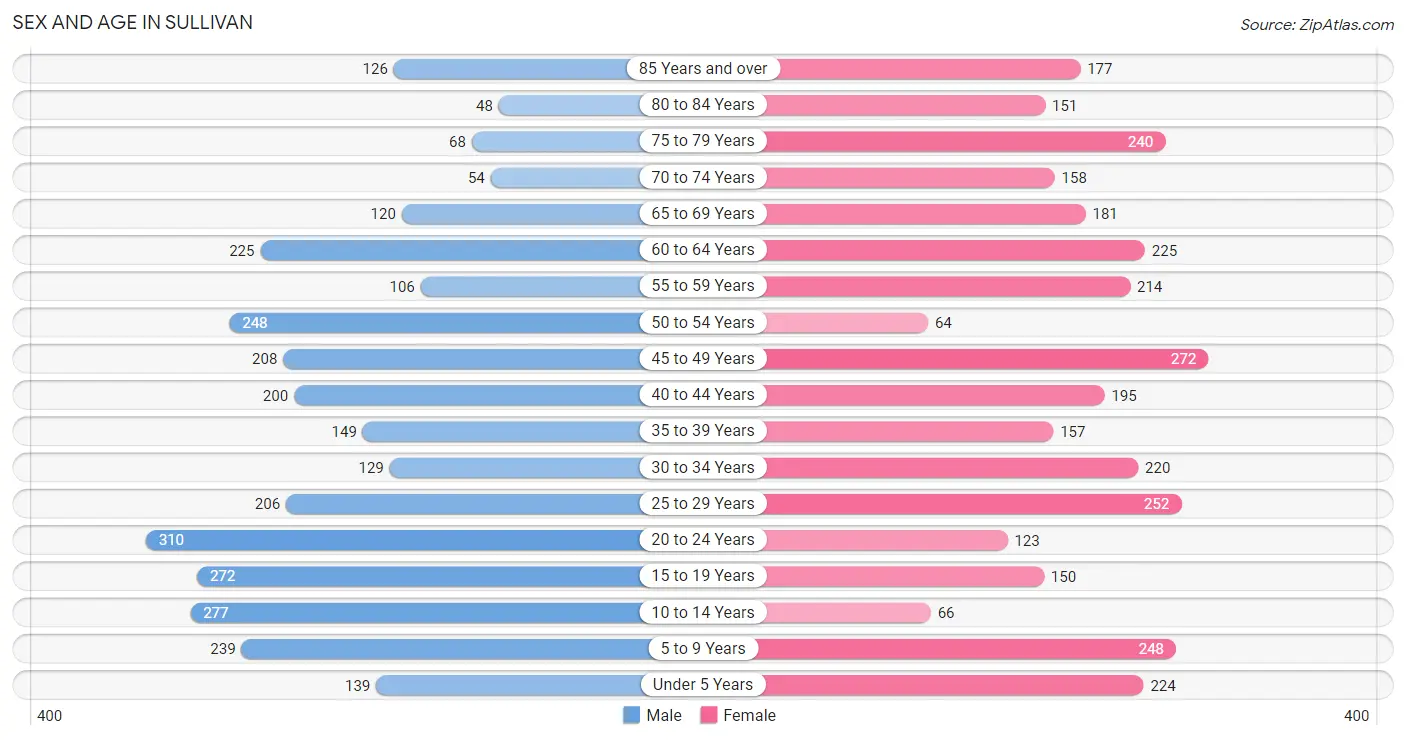
The most populous age groups in Sullivan are 20 to 24 Years (310 | 9.9%) for men and 45 to 49 Years (272 | 8.2%) for women.
| Age Bracket | Male | Female |
| Under 5 Years | 139 (4.4%) | 224 (6.8%) |
| 5 to 9 Years | 239 (7.6%) | 248 (7.5%) |
| 10 to 14 Years | 277 (8.9%) | 66 (2.0%) |
| 15 to 19 Years | 272 (8.7%) | 150 (4.5%) |
| 20 to 24 Years | 310 (9.9%) | 123 (3.7%) |
| 25 to 29 Years | 206 (6.6%) | 252 (7.6%) |
| 30 to 34 Years | 129 (4.1%) | 220 (6.6%) |
| 35 to 39 Years | 149 (4.8%) | 157 (4.7%) |
| 40 to 44 Years | 200 (6.4%) | 195 (5.9%) |
| 45 to 49 Years | 208 (6.7%) | 272 (8.2%) |
| 50 to 54 Years | 248 (7.9%) | 64 (1.9%) |
| 55 to 59 Years | 106 (3.4%) | 214 (6.5%) |
| 60 to 64 Years | 225 (7.2%) | 225 (6.8%) |
| 65 to 69 Years | 120 (3.8%) | 181 (5.5%) |
| 70 to 74 Years | 54 (1.7%) | 158 (4.8%) |
| 75 to 79 Years | 68 (2.2%) | 240 (7.2%) |
| 80 to 84 Years | 48 (1.5%) | 151 (4.5%) |
| 85 Years and over | 126 (4.0%) | 177 (5.3%) |
| Total | 3,124 (100.0%) | 3,317 (100.0%) |
Families and Households in Sullivan
Median Family Size in Sullivan
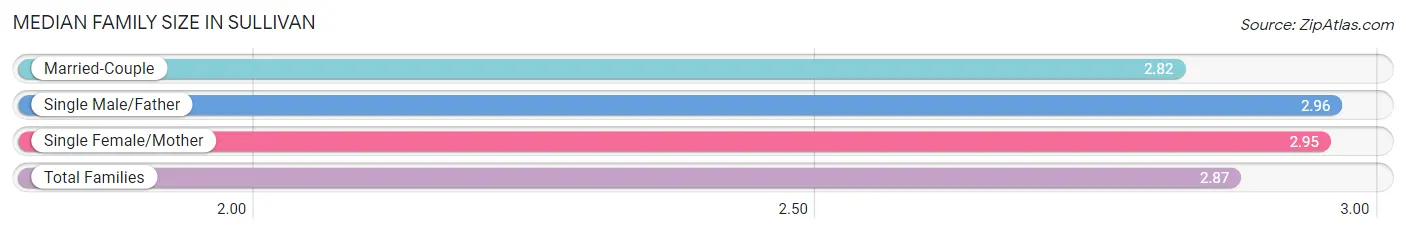
The median family size in Sullivan is 2.87 persons per family, with single male/father families (204 | 12.3%) accounting for the largest median family size of 2.96 persons per family. On the other hand, married-couple families (1,035 | 62.5%) represent the smallest median family size with 2.82 persons per family.
| Family Type | # Families | Family Size |
| Married-Couple | 1,035 (62.5%) | 2.82 |
| Single Male/Father | 204 (12.3%) | 2.96 |
| Single Female/Mother | 417 (25.2%) | 2.95 |
| Total Families | 1,656 (100.0%) | 2.87 |
Median Household Size in Sullivan
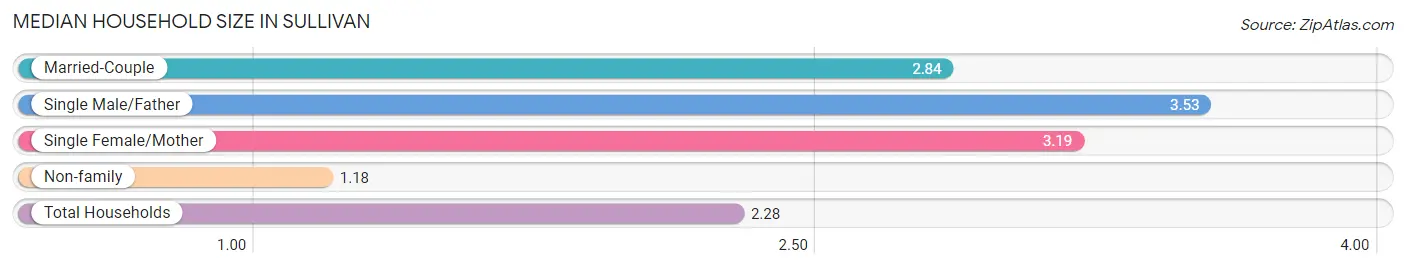
The median household size in Sullivan is 2.28 persons per household, with single male/father households (204 | 7.4%) accounting for the largest median household size of 3.53 persons per household. non-family households (1,113 | 40.2%) represent the smallest median household size with 1.18 persons per household.
| Household Type | # Households | Household Size |
| Married-Couple | 1,035 (37.4%) | 2.84 |
| Single Male/Father | 204 (7.4%) | 3.53 |
| Single Female/Mother | 417 (15.1%) | 3.19 |
| Non-family | 1,113 (40.2%) | 1.18 |
| Total Households | 2,769 (100.0%) | 2.28 |
Household Size by Marriage Status in Sullivan
Out of a total of 2,769 households in Sullivan, 1,656 (59.8%) are family households, while 1,113 (40.2%) are nonfamily households. The most numerous type of family households are 2-person households, comprising 748, and the most common type of nonfamily households are 1-person households, comprising 916.
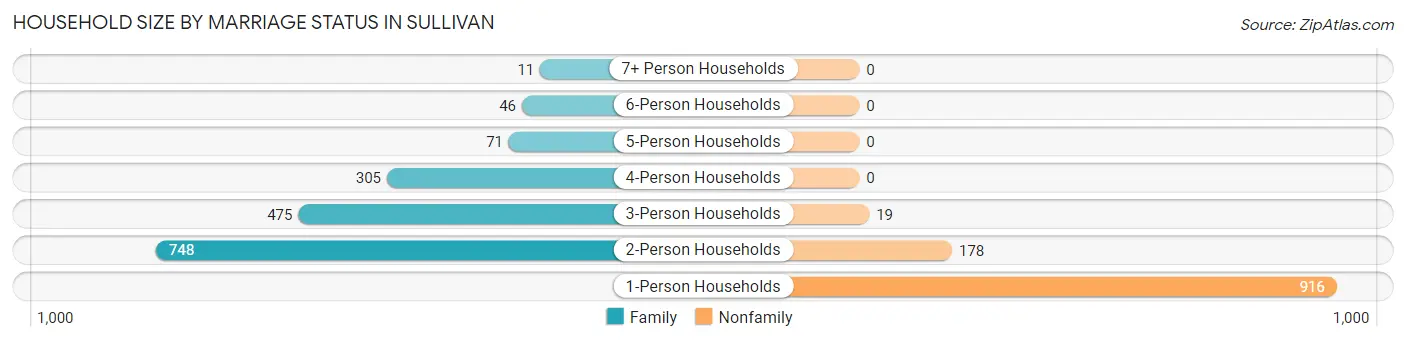
| Household Size | Family Households | Nonfamily Households |
| 1-Person Households | - | 916 (33.1%) |
| 2-Person Households | 748 (27.0%) | 178 (6.4%) |
| 3-Person Households | 475 (17.2%) | 19 (0.7%) |
| 4-Person Households | 305 (11.0%) | 0 (0.0%) |
| 5-Person Households | 71 (2.6%) | 0 (0.0%) |
| 6-Person Households | 46 (1.7%) | 0 (0.0%) |
| 7+ Person Households | 11 (0.4%) | 0 (0.0%) |
| Total | 1,656 (59.8%) | 1,113 (40.2%) |
Female Fertility in Sullivan
Fertility by Age in Sullivan
Average fertility rate in Sullivan is 75.0 births per 1,000 women. Women in the age bracket of 15 to 19 years have the highest fertility rate with 160.0 births per 1,000 women. Women in the age bracket of 20 to 34 years acount for 63.5% of all women with births.
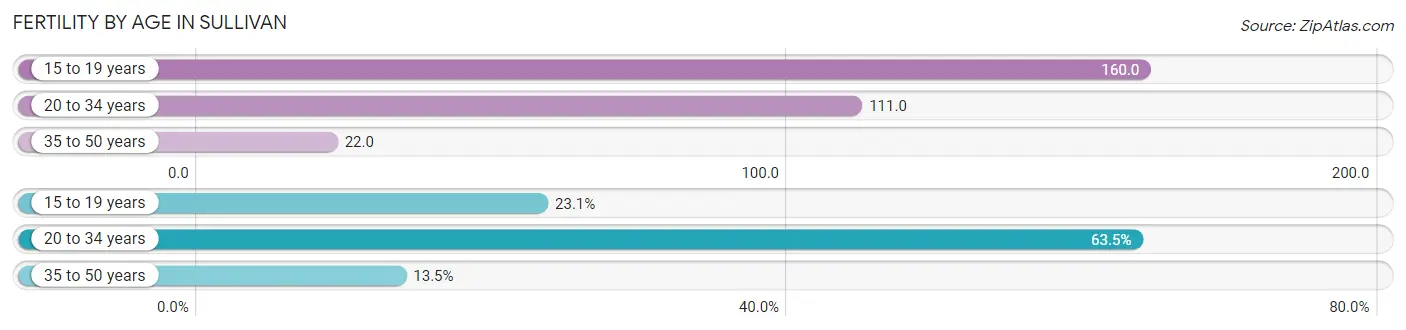
| Age Bracket | Women with Births | Births / 1,000 Women |
| 15 to 19 years | 24 (23.1%) | 160.0 |
| 20 to 34 years | 66 (63.5%) | 111.0 |
| 35 to 50 years | 14 (13.5%) | 22.0 |
| Total | 104 (100.0%) | 75.0 |
Fertility by Age by Marriage Status in Sullivan
31.7% of women with births (104) in Sullivan are married. The highest percentage of unmarried women with births falls into 15 to 19 years age bracket with 100.0% of them unmarried at the time of birth, while the lowest percentage of unmarried women with births belong to 35 to 50 years age bracket with 0.0% of them unmarried.
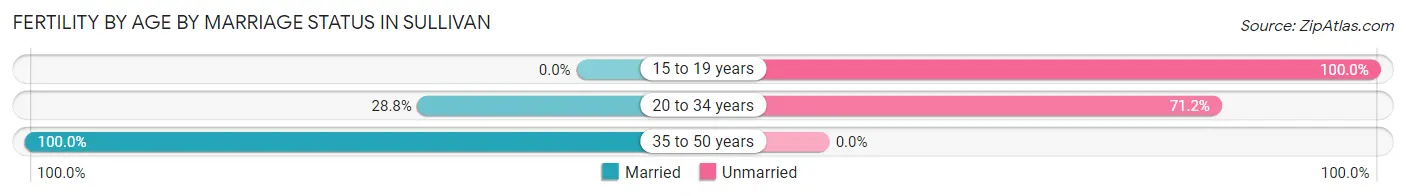
| Age Bracket | Married | Unmarried |
| 15 to 19 years | 0 (0.0%) | 24 (100.0%) |
| 20 to 34 years | 19 (28.8%) | 47 (71.2%) |
| 35 to 50 years | 14 (100.0%) | 0 (0.0%) |
| Total | 33 (31.7%) | 71 (68.3%) |
Fertility by Education in Sullivan
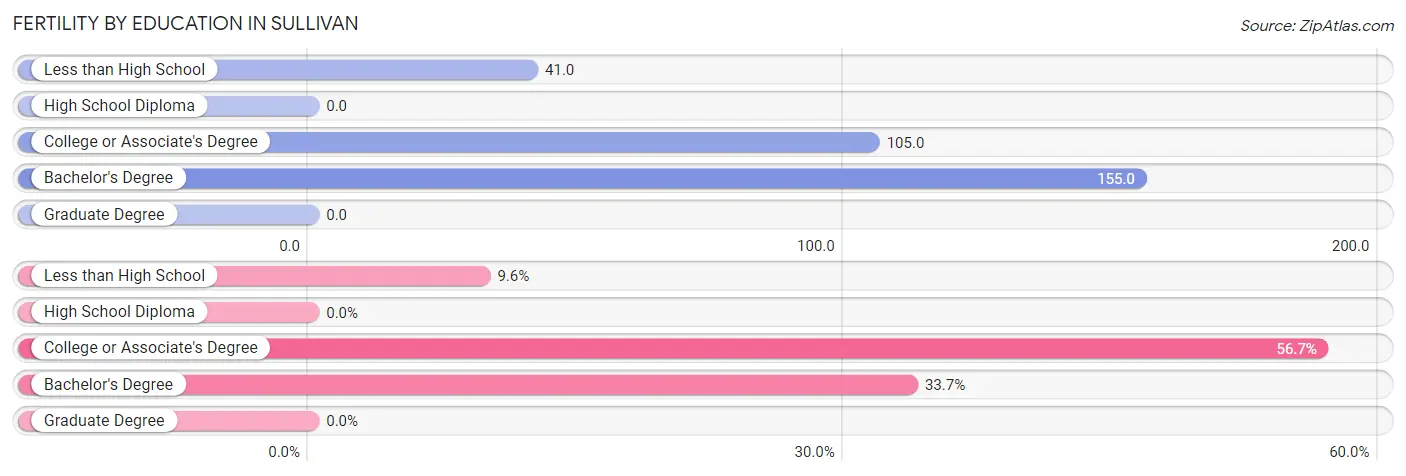
| Educational Attainment | Women with Births | Births / 1,000 Women |
| Less than High School | 10 (9.6%) | 41.0 |
| High School Diploma | 0 (0.0%) | 0.0 |
| College or Associate's Degree | 59 (56.7%) | 105.0 |
| Bachelor's Degree | 35 (33.7%) | 155.0 |
| Graduate Degree | 0 (0.0%) | 0.0 |
| Total | 104 (100.0%) | 75.0 |
Fertility by Education by Marriage Status in Sullivan
68.3% of women with births in Sullivan are unmarried. Women with the educational attainment of bachelor's degree are most likely to be married with 40.0% of them married at childbirth, while women with the educational attainment of less than high school are least likely to be married with 100.0% of them unmarried at childbirth.
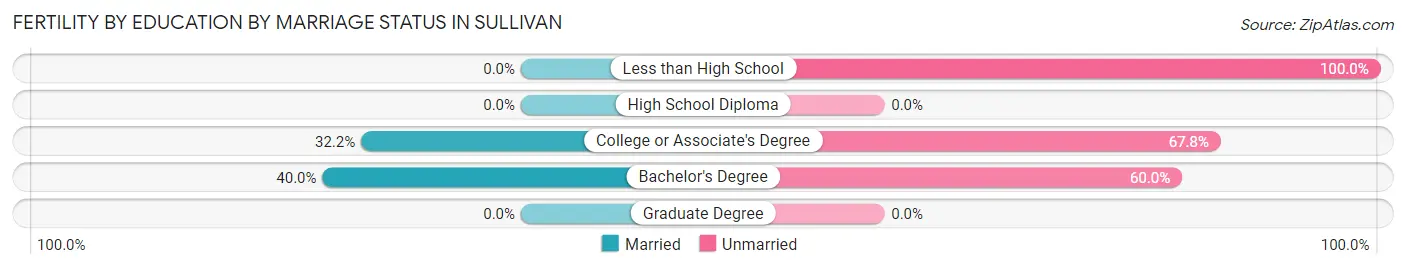
| Educational Attainment | Married | Unmarried |
| Less than High School | 0 (0.0%) | 10 (100.0%) |
| High School Diploma | 0 (0.0%) | 0 (0.0%) |
| College or Associate's Degree | 19 (32.2%) | 40 (67.8%) |
| Bachelor's Degree | 14 (40.0%) | 21 (60.0%) |
| Graduate Degree | 0 (0.0%) | 0 (0.0%) |
| Total | 33 (31.7%) | 71 (68.3%) |
Employment Characteristics in Sullivan
Employment by Class of Employer in Sullivan
Among the 2,907 employed individuals in Sullivan, private company employees (2,234 | 76.8%), not-for-profit organizations (212 | 7.3%), and local government employees (145 | 5.0%) make up the most common classes of employment.
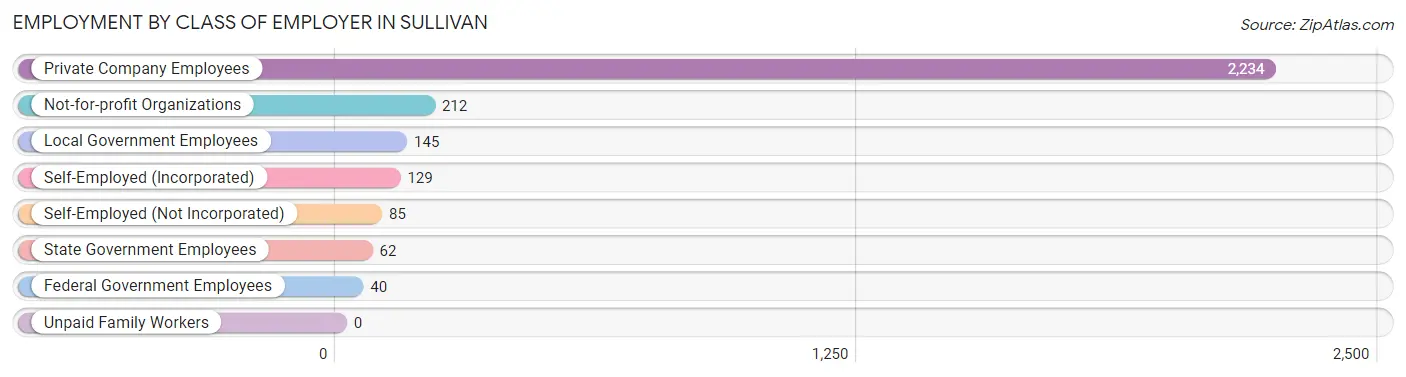
| Employer Class | # Employees | % Employees |
| Private Company Employees | 2,234 | 76.8% |
| Self-Employed (Incorporated) | 129 | 4.4% |
| Self-Employed (Not Incorporated) | 85 | 2.9% |
| Not-for-profit Organizations | 212 | 7.3% |
| Local Government Employees | 145 | 5.0% |
| State Government Employees | 62 | 2.1% |
| Federal Government Employees | 40 | 1.4% |
| Unpaid Family Workers | 0 | 0.0% |
| Total | 2,907 | 100.0% |
Employment Status by Age in Sullivan
According to the labor force statistics for Sullivan, out of the total population over 16 years of age (5,105), 60.8% or 3,104 individuals are in the labor force, with 4.4% or 137 of them unemployed. The age group with the highest labor force participation rate is 20 to 24 years, with 94.5% or 409 individuals in the labor force. Within the labor force, the 16 to 19 years age range has the highest percentage of unemployed individuals, with 19.1% or 16 of them being unemployed.
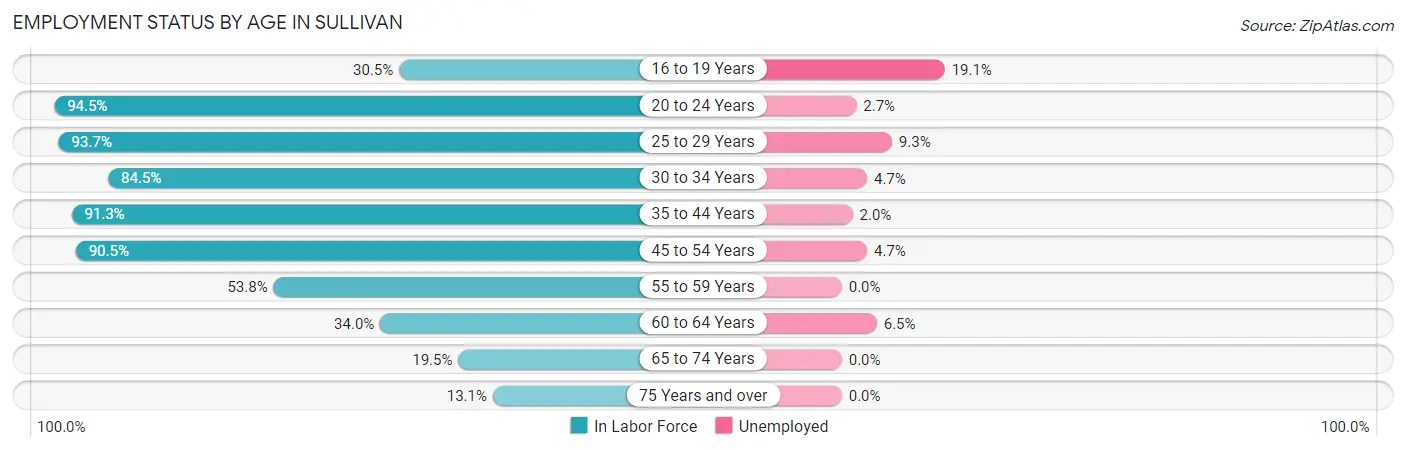
| Age Bracket | In Labor Force | Unemployed |
| 16 to 19 Years | 85 (30.5%) | 16 (19.1%) |
| 20 to 24 Years | 409 (94.5%) | 11 (2.7%) |
| 25 to 29 Years | 429 (93.7%) | 40 (9.3%) |
| 30 to 34 Years | 295 (84.5%) | 14 (4.7%) |
| 35 to 44 Years | 640 (91.3%) | 13 (2.0%) |
| 45 to 54 Years | 717 (90.5%) | 34 (4.7%) |
| 55 to 59 Years | 172 (53.8%) | 0 (0.0%) |
| 60 to 64 Years | 153 (34.0%) | 10 (6.5%) |
| 65 to 74 Years | 100 (19.5%) | 0 (0.0%) |
| 75 Years and over | 106 (13.1%) | 0 (0.0%) |
| Total | 3,104 (60.8%) | 137 (4.4%) |
Employment Status by Educational Attainment in Sullivan
According to labor force statistics for Sullivan, 78.4% of individuals (2,407) out of the total population between 25 and 64 years of age (3,070) are in the labor force, with 4.6% or 111 of them being unemployed. The group with the highest labor force participation rate are those with the educational attainment of bachelor's degree or higher, with 88.5% or 498 individuals in the labor force. Within the labor force, individuals with less than high school education have the highest percentage of unemployment, with 23.0% or 40 of them being unemployed.
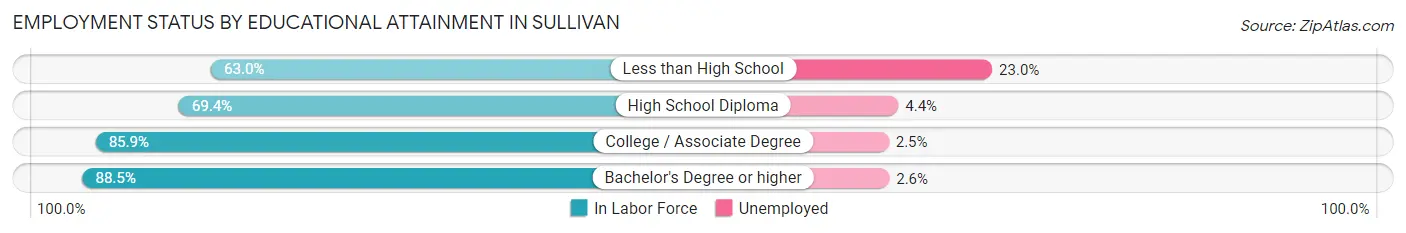
| Educational Attainment | In Labor Force | Unemployed |
| Less than High School | 174 (63.0%) | 63 (23.0%) |
| High School Diploma | 770 (69.4%) | 49 (4.4%) |
| College / Associate Degree | 964 (85.9%) | 28 (2.5%) |
| Bachelor's Degree or higher | 498 (88.5%) | 15 (2.6%) |
| Total | 2,407 (78.4%) | 141 (4.6%) |
Employment Occupations by Sex in Sullivan
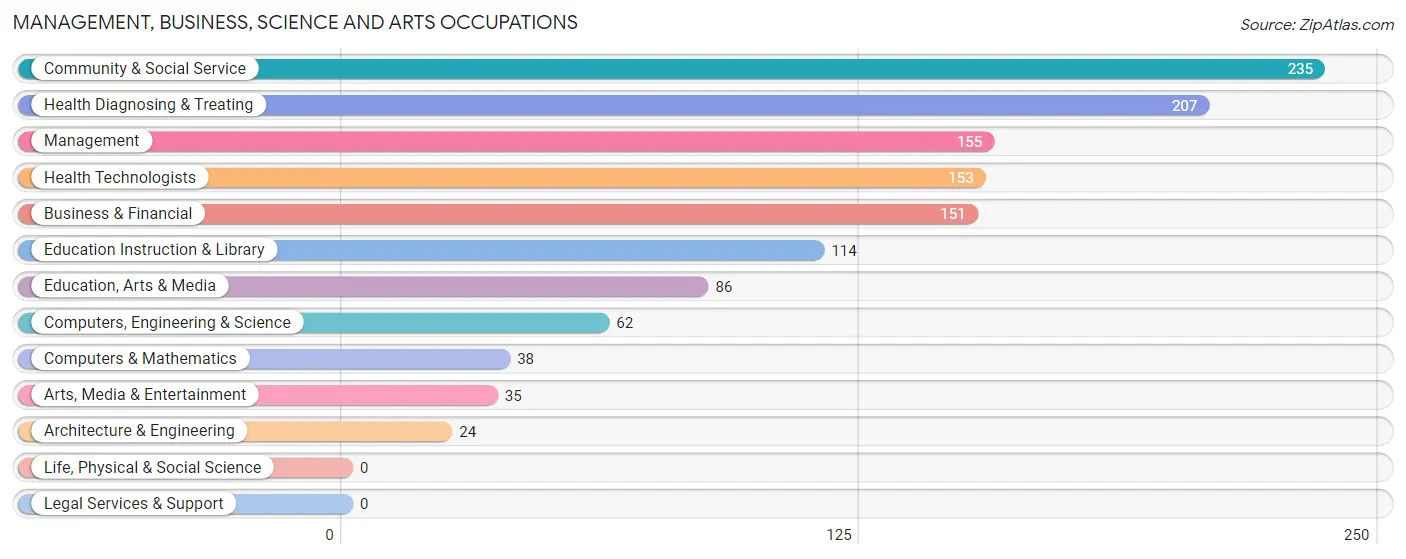
Management, Business, Science and Arts Occupations
The most common Management, Business, Science and Arts occupations in Sullivan are Community & Social Service (235 | 8.0%), Health Diagnosing & Treating (207 | 7.0%), Management (155 | 5.2%), Health Technologists (153 | 5.2%), and Business & Financial (151 | 5.1%).
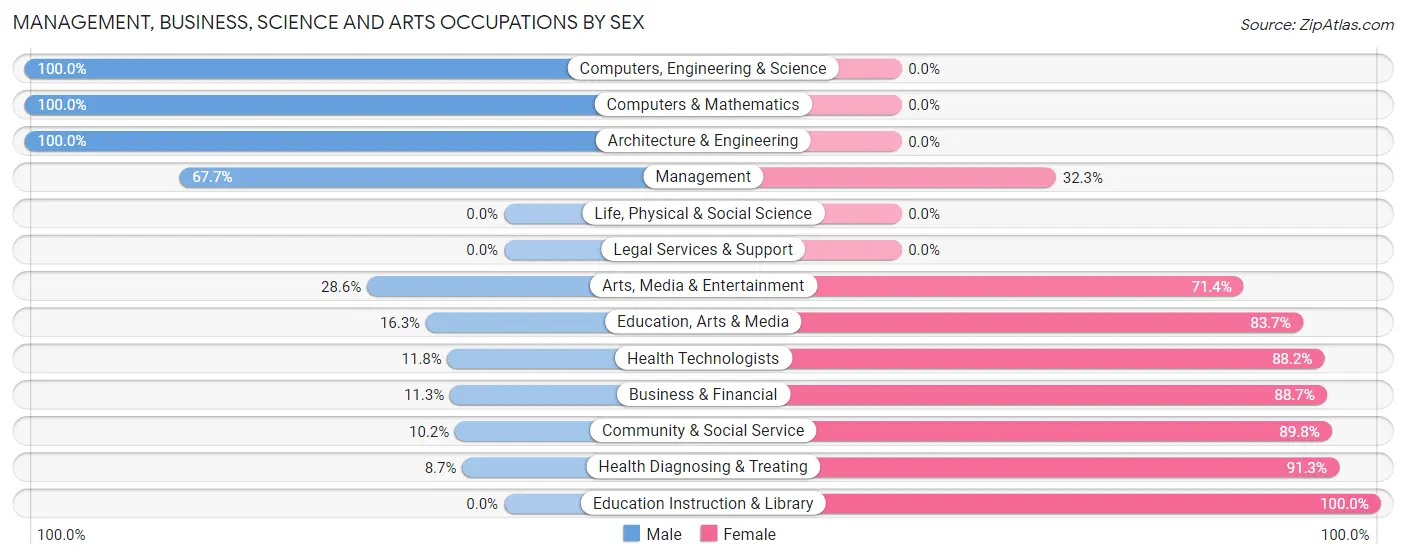
Management, Business, Science and Arts Occupations by Sex
Within the Management, Business, Science and Arts occupations in Sullivan, the most male-oriented occupations are Computers, Engineering & Science (100.0%), Computers & Mathematics (100.0%), and Architecture & Engineering (100.0%), while the most female-oriented occupations are Education Instruction & Library (100.0%), Health Diagnosing & Treating (91.3%), and Community & Social Service (89.8%).
| Occupation | Male | Female |
| Management | 105 (67.7%) | 50 (32.3%) |
| Business & Financial | 17 (11.3%) | 134 (88.7%) |
| Computers, Engineering & Science | 62 (100.0%) | 0 (0.0%) |
| Computers & Mathematics | 38 (100.0%) | 0 (0.0%) |
| Architecture & Engineering | 24 (100.0%) | 0 (0.0%) |
| Life, Physical & Social Science | 0 (0.0%) | 0 (0.0%) |
| Community & Social Service | 24 (10.2%) | 211 (89.8%) |
| Education, Arts & Media | 14 (16.3%) | 72 (83.7%) |
| Legal Services & Support | 0 (0.0%) | 0 (0.0%) |
| Education Instruction & Library | 0 (0.0%) | 114 (100.0%) |
| Arts, Media & Entertainment | 10 (28.6%) | 25 (71.4%) |
| Health Diagnosing & Treating | 18 (8.7%) | 189 (91.3%) |
| Health Technologists | 18 (11.8%) | 135 (88.2%) |
| Total (Category) | 226 (27.9%) | 584 (72.1%) |
| Total (Overall) | 1,480 (50.1%) | 1,474 (49.9%) |
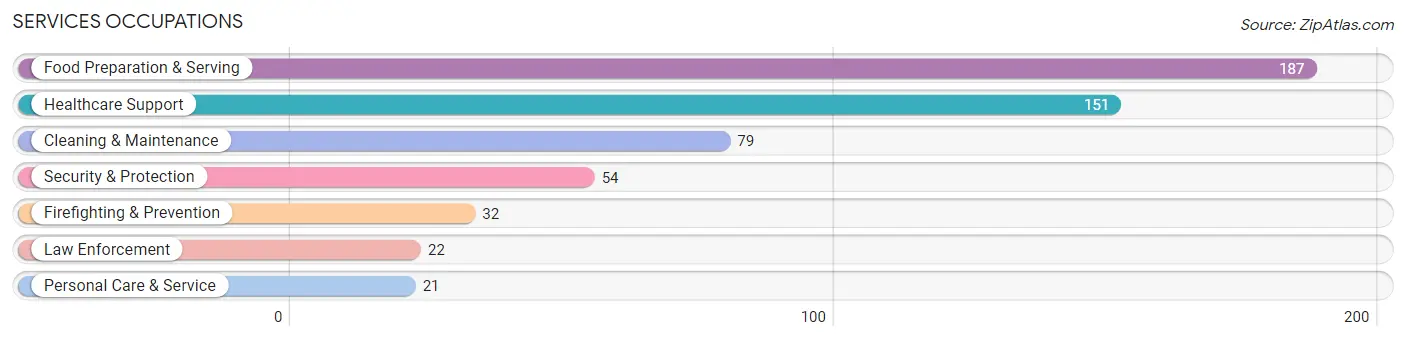
Services Occupations
The most common Services occupations in Sullivan are Food Preparation & Serving (187 | 6.3%), Healthcare Support (151 | 5.1%), Cleaning & Maintenance (79 | 2.7%), Security & Protection (54 | 1.8%), and Firefighting & Prevention (32 | 1.1%).
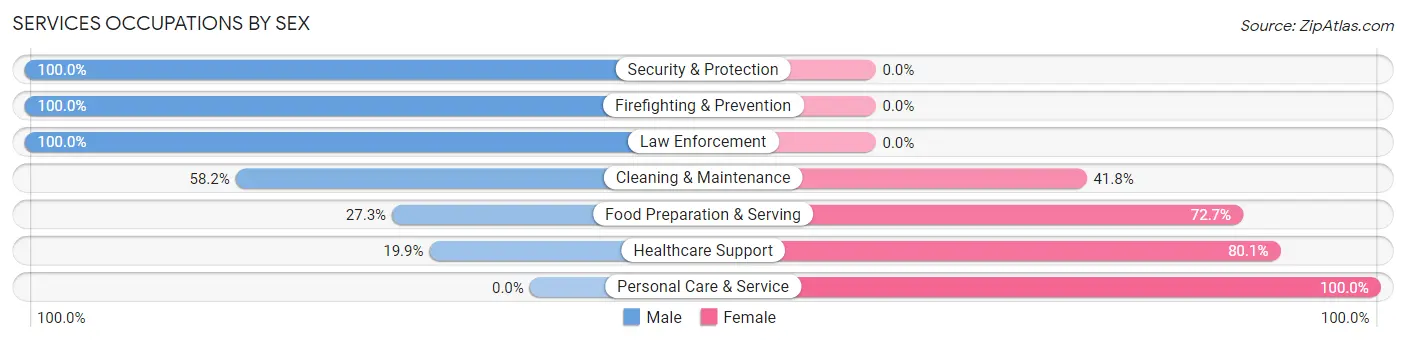
Services Occupations by Sex
Within the Services occupations in Sullivan, the most male-oriented occupations are Security & Protection (100.0%), Firefighting & Prevention (100.0%), and Law Enforcement (100.0%), while the most female-oriented occupations are Personal Care & Service (100.0%), Healthcare Support (80.1%), and Food Preparation & Serving (72.7%).
| Occupation | Male | Female |
| Healthcare Support | 30 (19.9%) | 121 (80.1%) |
| Security & Protection | 54 (100.0%) | 0 (0.0%) |
| Firefighting & Prevention | 32 (100.0%) | 0 (0.0%) |
| Law Enforcement | 22 (100.0%) | 0 (0.0%) |
| Food Preparation & Serving | 51 (27.3%) | 136 (72.7%) |
| Cleaning & Maintenance | 46 (58.2%) | 33 (41.8%) |
| Personal Care & Service | 0 (0.0%) | 21 (100.0%) |
| Total (Category) | 181 (36.8%) | 311 (63.2%) |
| Total (Overall) | 1,480 (50.1%) | 1,474 (49.9%) |
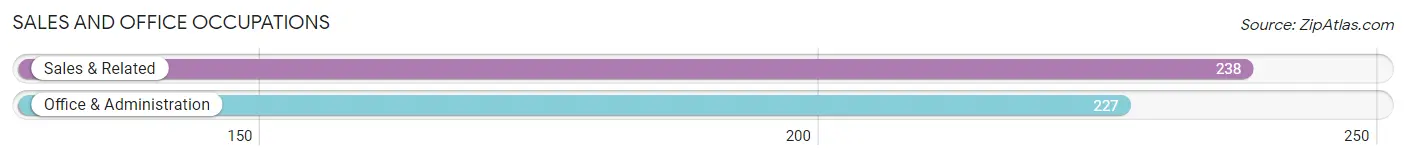
Sales and Office Occupations
The most common Sales and Office occupations in Sullivan are Sales & Related (238 | 8.1%), and Office & Administration (227 | 7.7%).
Sales and Office Occupations by Sex
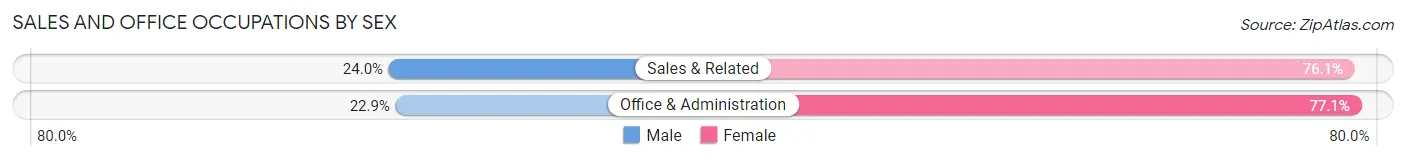
| Occupation | Male | Female |
| Sales & Related | 57 (23.9%) | 181 (76.0%) |
| Office & Administration | 52 (22.9%) | 175 (77.1%) |
| Total (Category) | 109 (23.4%) | 356 (76.6%) |
| Total (Overall) | 1,480 (50.1%) | 1,474 (49.9%) |
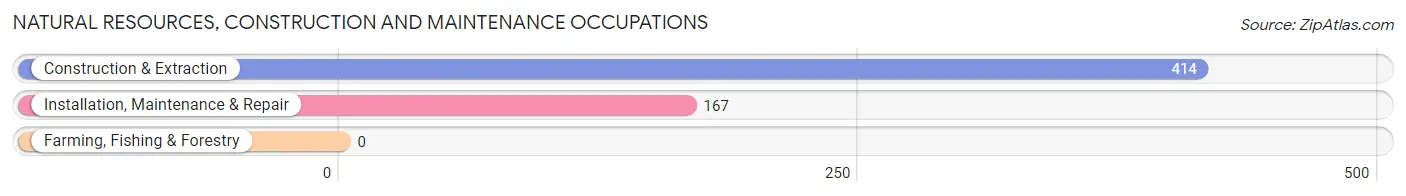
Natural Resources, Construction and Maintenance Occupations
The most common Natural Resources, Construction and Maintenance occupations in Sullivan are Construction & Extraction (414 | 14.0%), and Installation, Maintenance & Repair (167 | 5.7%).
Natural Resources, Construction and Maintenance Occupations by Sex
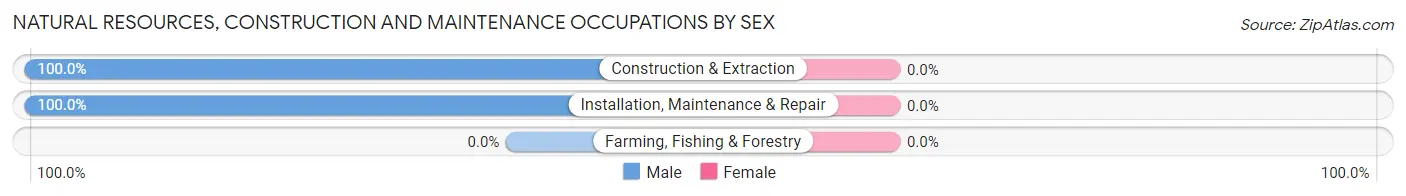
| Occupation | Male | Female |
| Farming, Fishing & Forestry | 0 (0.0%) | 0 (0.0%) |
| Construction & Extraction | 414 (100.0%) | 0 (0.0%) |
| Installation, Maintenance & Repair | 167 (100.0%) | 0 (0.0%) |
| Total (Category) | 581 (100.0%) | 0 (0.0%) |
| Total (Overall) | 1,480 (50.1%) | 1,474 (49.9%) |
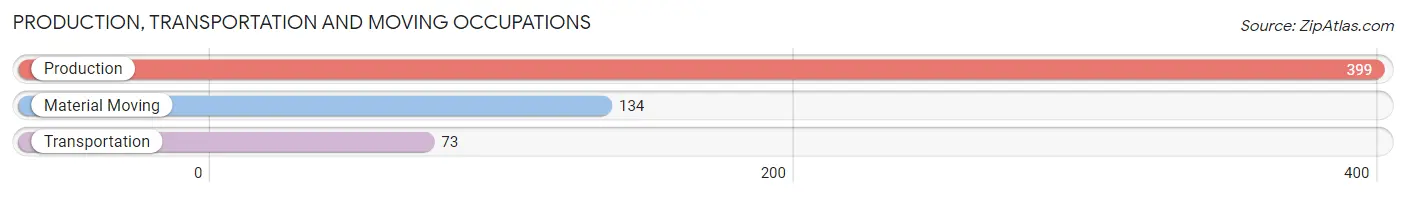
Production, Transportation and Moving Occupations
The most common Production, Transportation and Moving occupations in Sullivan are Production (399 | 13.5%), Material Moving (134 | 4.5%), and Transportation (73 | 2.5%).
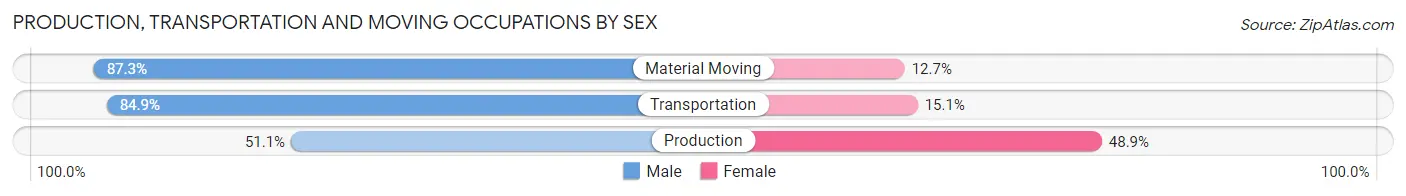
Production, Transportation and Moving Occupations by Sex
| Occupation | Male | Female |
| Production | 204 (51.1%) | 195 (48.9%) |
| Transportation | 62 (84.9%) | 11 (15.1%) |
| Material Moving | 117 (87.3%) | 17 (12.7%) |
| Total (Category) | 383 (63.2%) | 223 (36.8%) |
| Total (Overall) | 1,480 (50.1%) | 1,474 (49.9%) |
Employment Industries by Sex in Sullivan
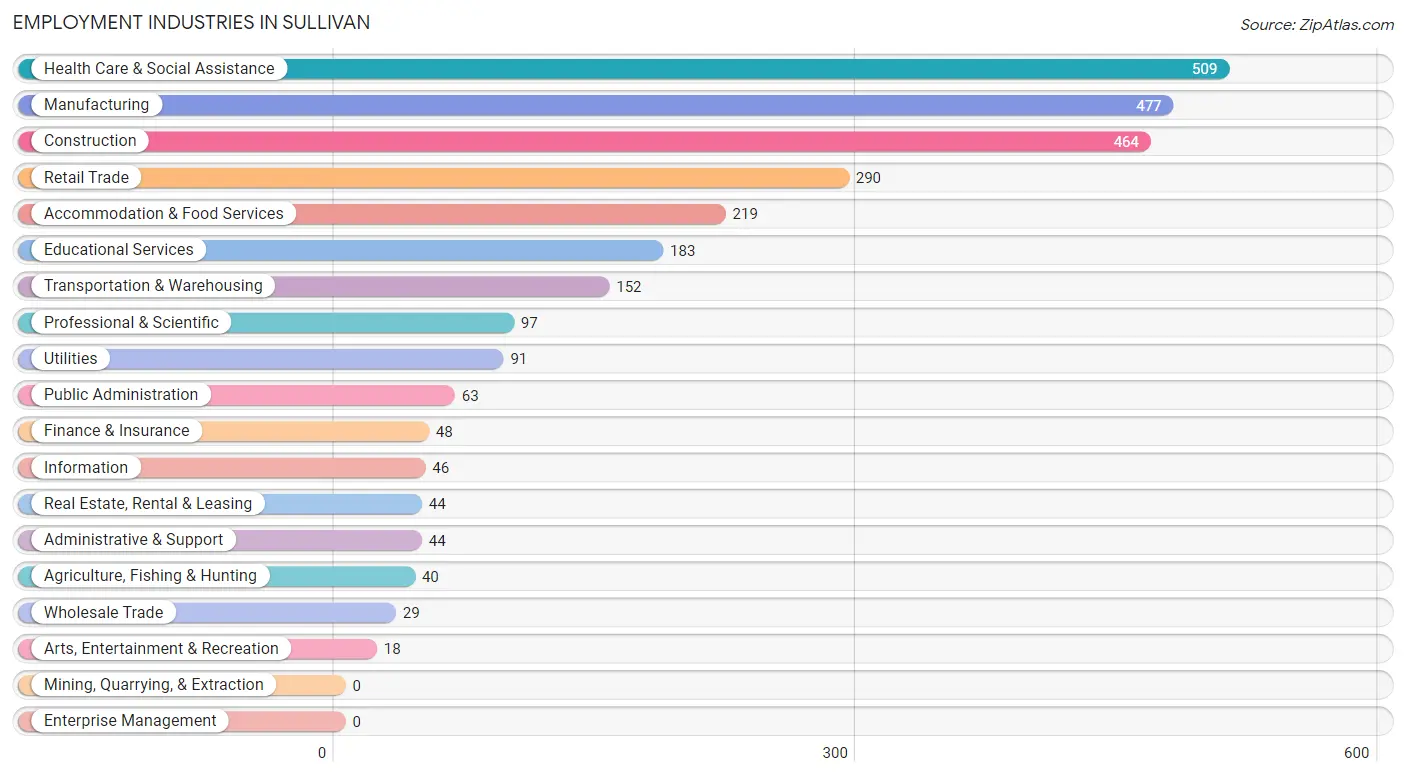
Employment Industries in Sullivan
The major employment industries in Sullivan include Health Care & Social Assistance (509 | 17.2%), Manufacturing (477 | 16.2%), Construction (464 | 15.7%), Retail Trade (290 | 9.8%), and Accommodation & Food Services (219 | 7.4%).
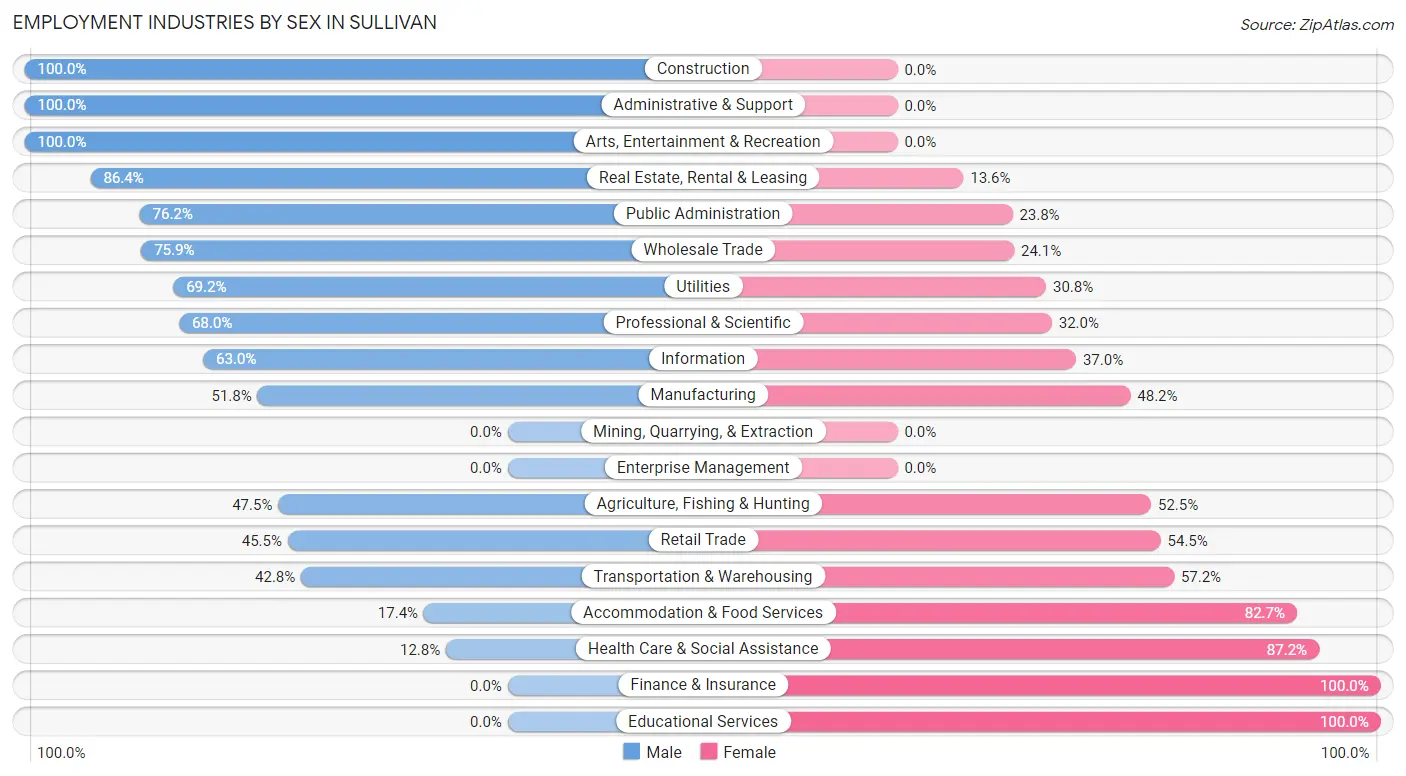
Employment Industries by Sex in Sullivan
The Sullivan industries that see more men than women are Construction (100.0%), Administrative & Support (100.0%), and Arts, Entertainment & Recreation (100.0%), whereas the industries that tend to have a higher number of women are Finance & Insurance (100.0%), Educational Services (100.0%), and Health Care & Social Assistance (87.2%).
| Industry | Male | Female |
| Agriculture, Fishing & Hunting | 19 (47.5%) | 21 (52.5%) |
| Mining, Quarrying, & Extraction | 0 (0.0%) | 0 (0.0%) |
| Construction | 464 (100.0%) | 0 (0.0%) |
| Manufacturing | 247 (51.8%) | 230 (48.2%) |
| Wholesale Trade | 22 (75.9%) | 7 (24.1%) |
| Retail Trade | 132 (45.5%) | 158 (54.5%) |
| Transportation & Warehousing | 65 (42.8%) | 87 (57.2%) |
| Utilities | 63 (69.2%) | 28 (30.8%) |
| Information | 29 (63.0%) | 17 (37.0%) |
| Finance & Insurance | 0 (0.0%) | 48 (100.0%) |
| Real Estate, Rental & Leasing | 38 (86.4%) | 6 (13.6%) |
| Professional & Scientific | 66 (68.0%) | 31 (32.0%) |
| Enterprise Management | 0 (0.0%) | 0 (0.0%) |
| Administrative & Support | 44 (100.0%) | 0 (0.0%) |
| Educational Services | 0 (0.0%) | 183 (100.0%) |
| Health Care & Social Assistance | 65 (12.8%) | 444 (87.2%) |
| Arts, Entertainment & Recreation | 18 (100.0%) | 0 (0.0%) |
| Accommodation & Food Services | 38 (17.3%) | 181 (82.7%) |
| Public Administration | 48 (76.2%) | 15 (23.8%) |
| Total | 1,480 (50.1%) | 1,474 (49.9%) |
Education in Sullivan
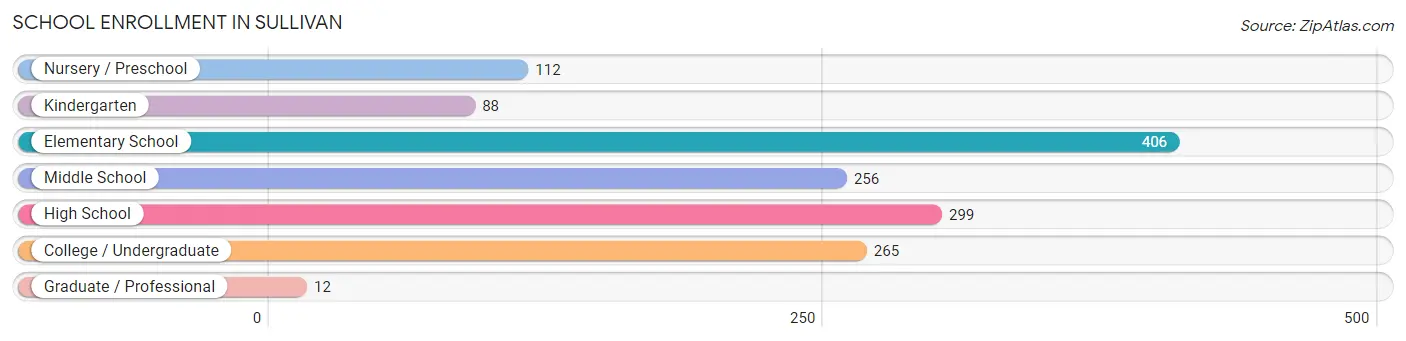
School Enrollment in Sullivan
The most common levels of schooling among the 1,438 students in Sullivan are elementary school (406 | 28.2%), high school (299 | 20.8%), and college / undergraduate (265 | 18.4%).
| School Level | # Students | % Students |
| Nursery / Preschool | 112 | 7.8% |
| Kindergarten | 88 | 6.1% |
| Elementary School | 406 | 28.2% |
| Middle School | 256 | 17.8% |
| High School | 299 | 20.8% |
| College / Undergraduate | 265 | 18.4% |
| Graduate / Professional | 12 | 0.8% |
| Total | 1,438 | 100.0% |
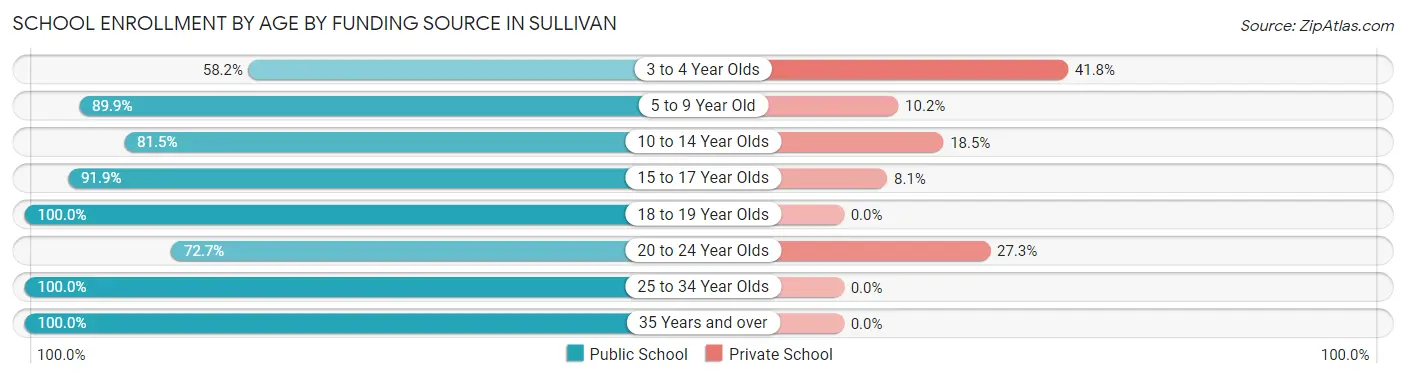
School Enrollment by Age by Funding Source in Sullivan
Out of a total of 1,438 students who are enrolled in schools in Sullivan, 196 (13.6%) attend a private institution, while the remaining 1,242 (86.4%) are enrolled in public schools. The age group of 3 to 4 year olds has the highest likelihood of being enrolled in private schools, with 38 (41.8% in the age bracket) enrolled. Conversely, the age group of 18 to 19 year olds has the lowest likelihood of being enrolled in a private school, with 99 (100.0% in the age bracket) attending a public institution.
| Age Bracket | Public School | Private School |
| 3 to 4 Year Olds | 53 (58.2%) | 38 (41.8%) |
| 5 to 9 Year Old | 425 (89.8%) | 48 (10.2%) |
| 10 to 14 Year Olds | 268 (81.5%) | 61 (18.5%) |
| 15 to 17 Year Olds | 216 (91.9%) | 19 (8.1%) |
| 18 to 19 Year Olds | 99 (100.0%) | 0 (0.0%) |
| 20 to 24 Year Olds | 80 (72.7%) | 30 (27.3%) |
| 25 to 34 Year Olds | 51 (100.0%) | 0 (0.0%) |
| 35 Years and over | 50 (100.0%) | 0 (0.0%) |
| Total | 1,242 (86.4%) | 196 (13.6%) |
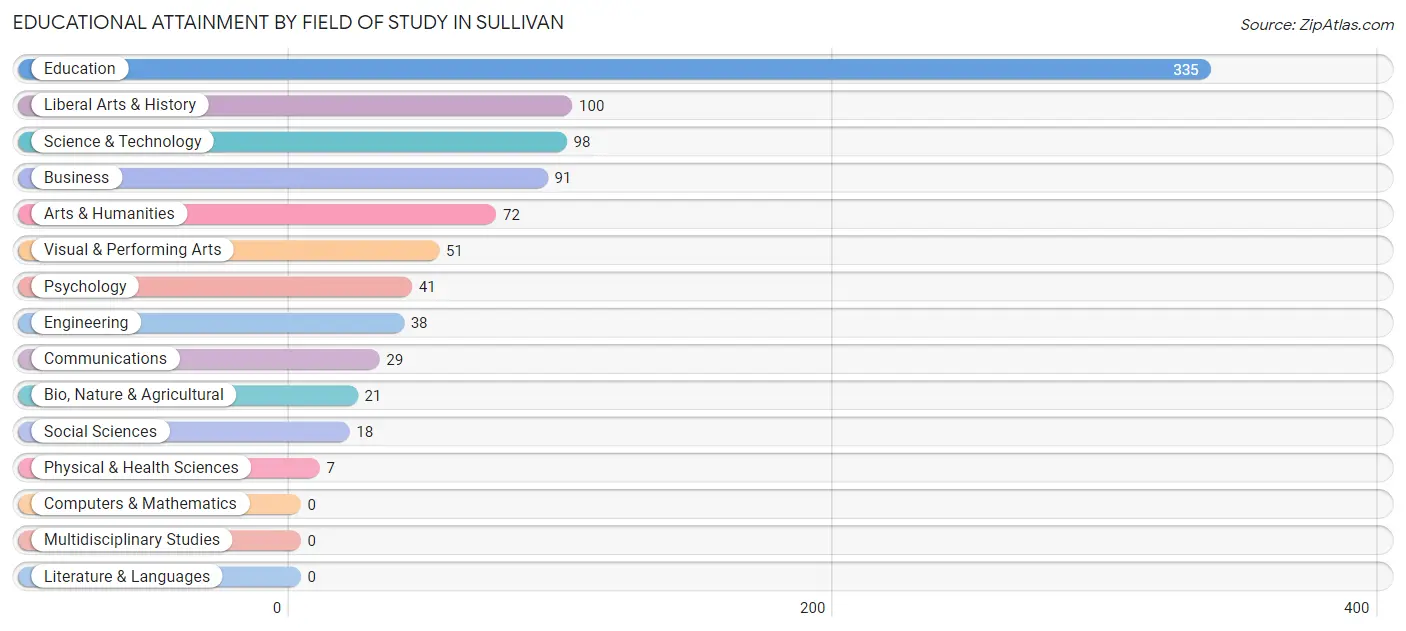
Educational Attainment by Field of Study in Sullivan
Education (335 | 37.2%), liberal arts & history (100 | 11.1%), science & technology (98 | 10.9%), business (91 | 10.1%), and arts & humanities (72 | 8.0%) are the most common fields of study among 901 individuals in Sullivan who have obtained a bachelor's degree or higher.
| Field of Study | # Graduates | % Graduates |
| Computers & Mathematics | 0 | 0.0% |
| Bio, Nature & Agricultural | 21 | 2.3% |
| Physical & Health Sciences | 7 | 0.8% |
| Psychology | 41 | 4.5% |
| Social Sciences | 18 | 2.0% |
| Engineering | 38 | 4.2% |
| Multidisciplinary Studies | 0 | 0.0% |
| Science & Technology | 98 | 10.9% |
| Business | 91 | 10.1% |
| Education | 335 | 37.2% |
| Literature & Languages | 0 | 0.0% |
| Liberal Arts & History | 100 | 11.1% |
| Visual & Performing Arts | 51 | 5.7% |
| Communications | 29 | 3.2% |
| Arts & Humanities | 72 | 8.0% |
| Total | 901 | 100.0% |
Transportation & Commute in Sullivan
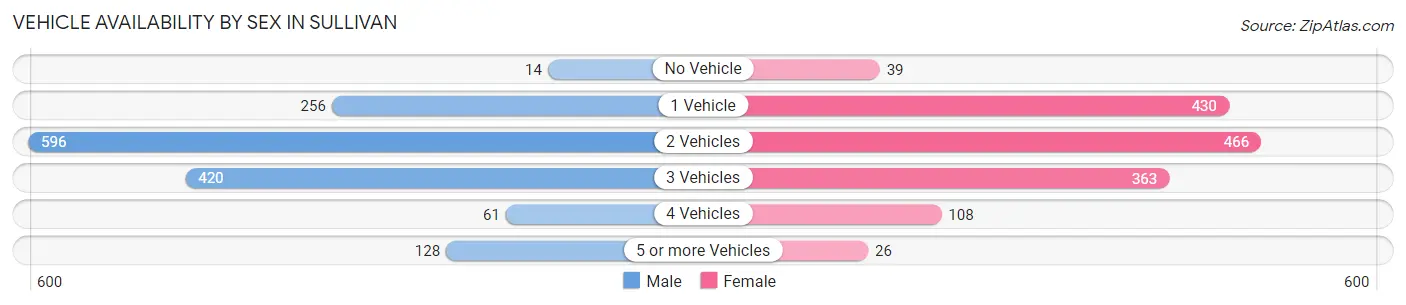
Vehicle Availability by Sex in Sullivan
The most prevalent vehicle ownership categories in Sullivan are males with 2 vehicles (596, accounting for 40.4%) and females with 2 vehicles (466, making up 41.6%).
| Vehicles Available | Male | Female |
| No Vehicle | 14 (0.9%) | 39 (2.7%) |
| 1 Vehicle | 256 (17.4%) | 430 (30.0%) |
| 2 Vehicles | 596 (40.4%) | 466 (32.5%) |
| 3 Vehicles | 420 (28.5%) | 363 (25.4%) |
| 4 Vehicles | 61 (4.1%) | 108 (7.5%) |
| 5 or more Vehicles | 128 (8.7%) | 26 (1.8%) |
| Total | 1,475 (100.0%) | 1,432 (100.0%) |
Commute Time in Sullivan
The most frequently occuring commute durations in Sullivan are 5 to 9 minutes (854 commuters, 31.3%), 10 to 14 minutes (357 commuters, 13.1%), and 30 to 34 minutes (312 commuters, 11.4%).
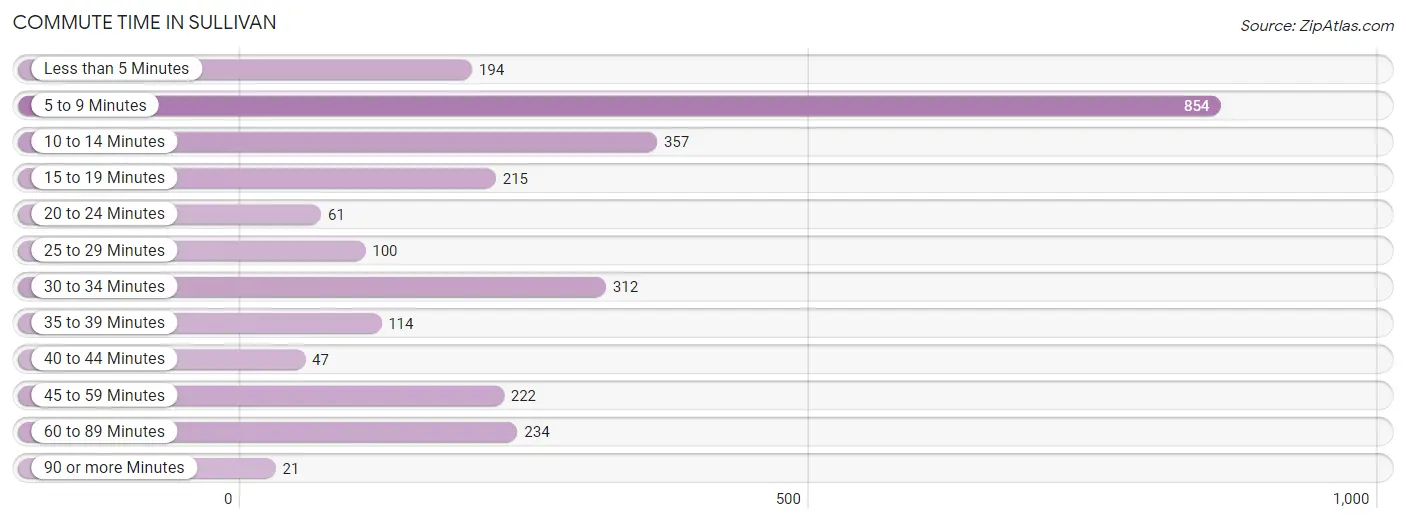
| Commute Time | # Commuters | % Commuters |
| Less than 5 Minutes | 194 | 7.1% |
| 5 to 9 Minutes | 854 | 31.3% |
| 10 to 14 Minutes | 357 | 13.1% |
| 15 to 19 Minutes | 215 | 7.9% |
| 20 to 24 Minutes | 61 | 2.2% |
| 25 to 29 Minutes | 100 | 3.7% |
| 30 to 34 Minutes | 312 | 11.4% |
| 35 to 39 Minutes | 114 | 4.2% |
| 40 to 44 Minutes | 47 | 1.7% |
| 45 to 59 Minutes | 222 | 8.1% |
| 60 to 89 Minutes | 234 | 8.6% |
| 90 or more Minutes | 21 | 0.8% |
Commute Time by Sex in Sullivan
The most common commute times in Sullivan are 30 to 34 minutes (254 commuters, 18.8%) for males and 5 to 9 minutes (745 commuters, 53.9%) for females.
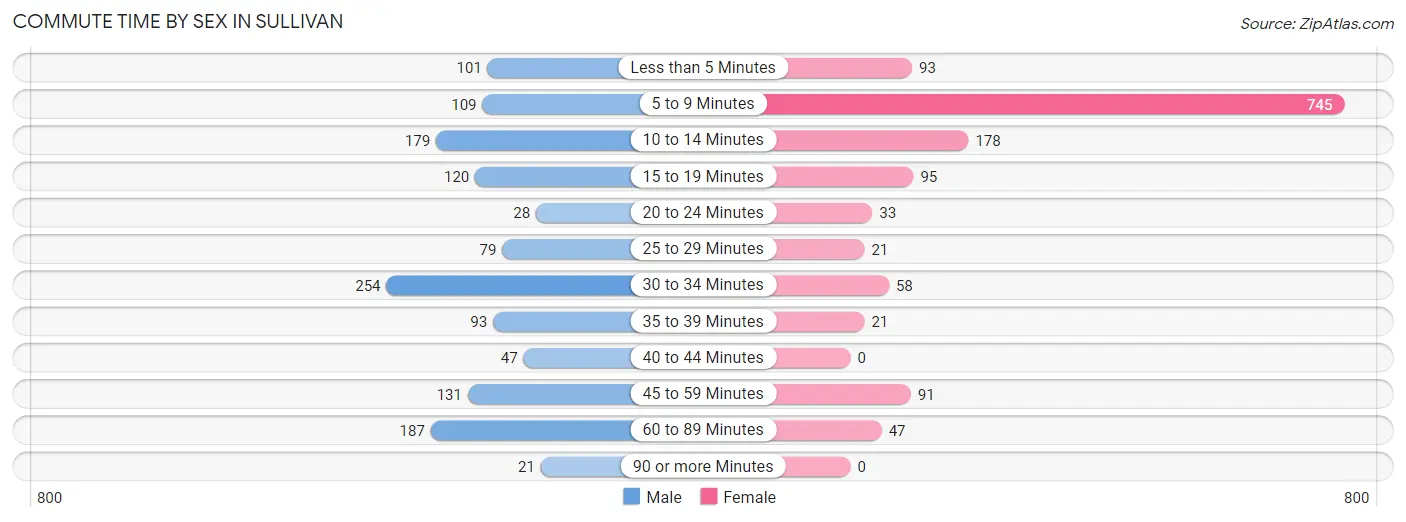
| Commute Time | Male | Female |
| Less than 5 Minutes | 101 (7.5%) | 93 (6.7%) |
| 5 to 9 Minutes | 109 (8.1%) | 745 (53.9%) |
| 10 to 14 Minutes | 179 (13.3%) | 178 (12.9%) |
| 15 to 19 Minutes | 120 (8.9%) | 95 (6.9%) |
| 20 to 24 Minutes | 28 (2.1%) | 33 (2.4%) |
| 25 to 29 Minutes | 79 (5.9%) | 21 (1.5%) |
| 30 to 34 Minutes | 254 (18.8%) | 58 (4.2%) |
| 35 to 39 Minutes | 93 (6.9%) | 21 (1.5%) |
| 40 to 44 Minutes | 47 (3.5%) | 0 (0.0%) |
| 45 to 59 Minutes | 131 (9.7%) | 91 (6.6%) |
| 60 to 89 Minutes | 187 (13.9%) | 47 (3.4%) |
| 90 or more Minutes | 21 (1.6%) | 0 (0.0%) |
Time of Departure to Work by Sex in Sullivan
The most frequent times of departure to work in Sullivan are 5:00 AM to 5:29 AM (233, 17.3%) for males and 7:30 AM to 7:59 AM (353, 25.5%) for females.
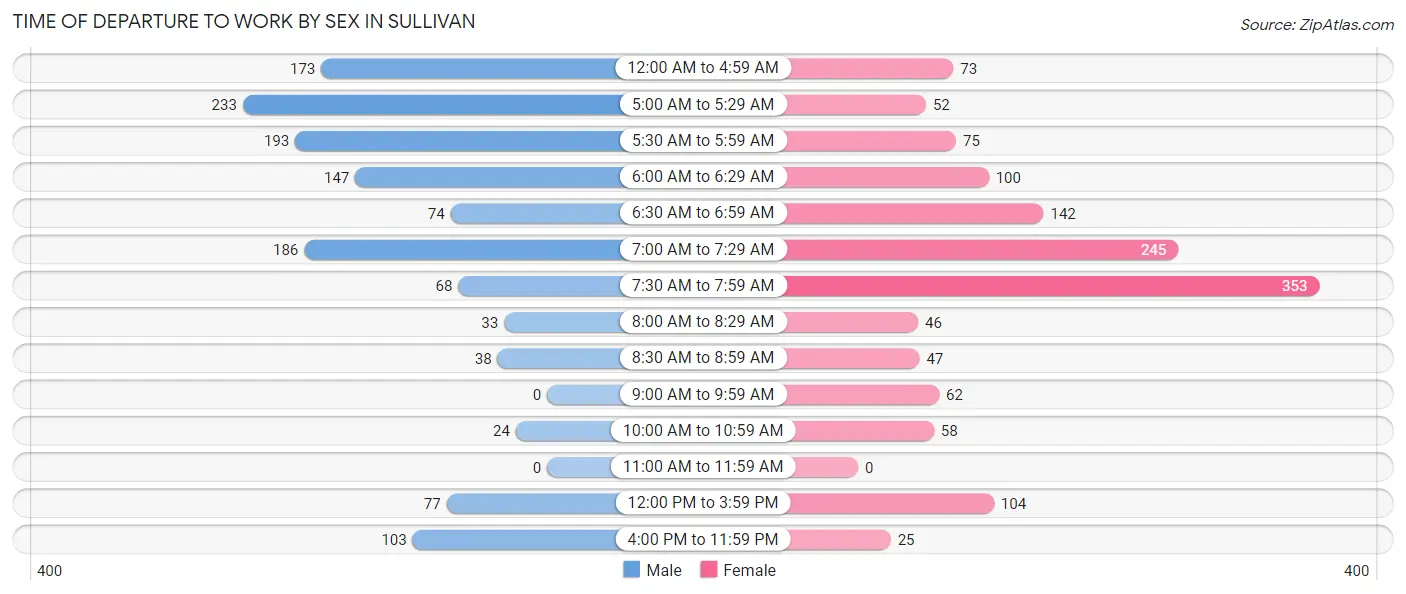
| Time of Departure | Male | Female |
| 12:00 AM to 4:59 AM | 173 (12.8%) | 73 (5.3%) |
| 5:00 AM to 5:29 AM | 233 (17.3%) | 52 (3.8%) |
| 5:30 AM to 5:59 AM | 193 (14.3%) | 75 (5.4%) |
| 6:00 AM to 6:29 AM | 147 (10.9%) | 100 (7.2%) |
| 6:30 AM to 6:59 AM | 74 (5.5%) | 142 (10.3%) |
| 7:00 AM to 7:29 AM | 186 (13.8%) | 245 (17.7%) |
| 7:30 AM to 7:59 AM | 68 (5.0%) | 353 (25.5%) |
| 8:00 AM to 8:29 AM | 33 (2.5%) | 46 (3.3%) |
| 8:30 AM to 8:59 AM | 38 (2.8%) | 47 (3.4%) |
| 9:00 AM to 9:59 AM | 0 (0.0%) | 62 (4.5%) |
| 10:00 AM to 10:59 AM | 24 (1.8%) | 58 (4.2%) |
| 11:00 AM to 11:59 AM | 0 (0.0%) | 0 (0.0%) |
| 12:00 PM to 3:59 PM | 77 (5.7%) | 104 (7.5%) |
| 4:00 PM to 11:59 PM | 103 (7.6%) | 25 (1.8%) |
| Total | 1,349 (100.0%) | 1,382 (100.0%) |
Housing Occupancy in Sullivan
Occupancy by Ownership in Sullivan
Of the total 2,769 dwellings in Sullivan, owner-occupied units account for 1,862 (67.2%), while renter-occupied units make up 907 (32.8%).
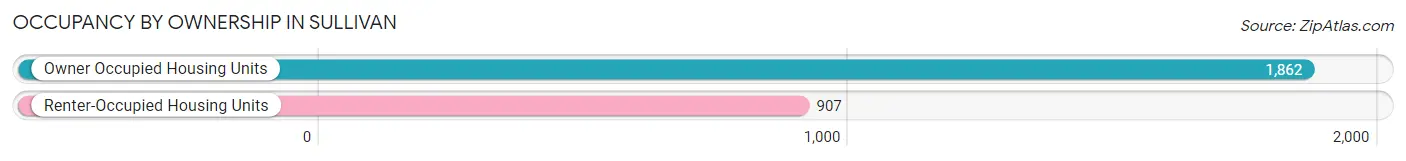
| Occupancy | # Housing Units | % Housing Units |
| Owner Occupied Housing Units | 1,862 | 67.2% |
| Renter-Occupied Housing Units | 907 | 32.8% |
| Total Occupied Housing Units | 2,769 | 100.0% |
Occupancy by Household Size in Sullivan
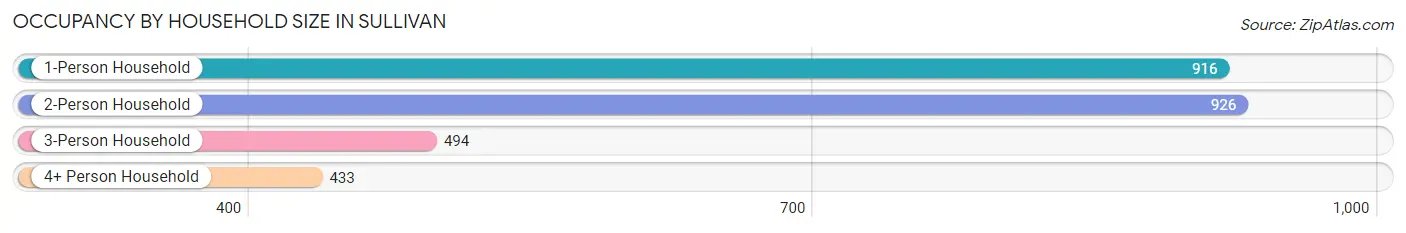
| Household Size | # Housing Units | % Housing Units |
| 1-Person Household | 916 | 33.1% |
| 2-Person Household | 926 | 33.4% |
| 3-Person Household | 494 | 17.8% |
| 4+ Person Household | 433 | 15.6% |
| Total Housing Units | 2,769 | 100.0% |
Occupancy by Ownership by Household Size in Sullivan
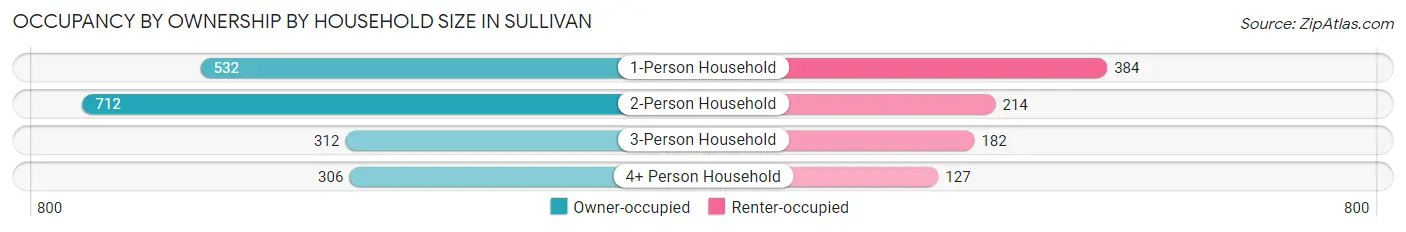
| Household Size | Owner-occupied | Renter-occupied |
| 1-Person Household | 532 (58.1%) | 384 (41.9%) |
| 2-Person Household | 712 (76.9%) | 214 (23.1%) |
| 3-Person Household | 312 (63.2%) | 182 (36.8%) |
| 4+ Person Household | 306 (70.7%) | 127 (29.3%) |
| Total Housing Units | 1,862 (67.2%) | 907 (32.8%) |
Occupancy by Educational Attainment in Sullivan
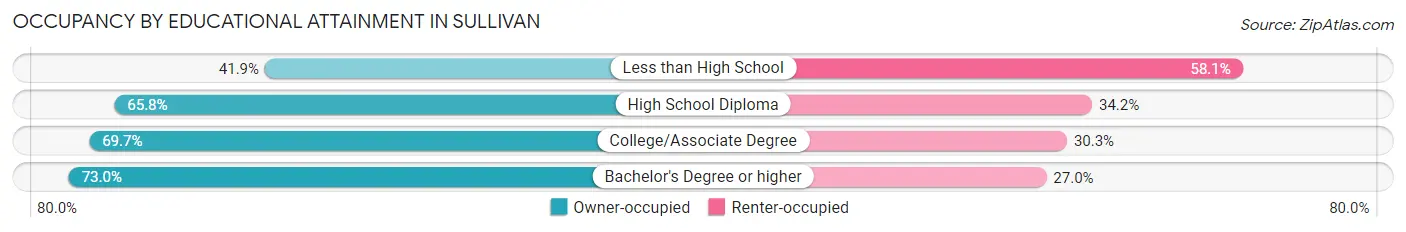
| Household Size | Owner-occupied | Renter-occupied |
| Less than High School | 93 (41.9%) | 129 (58.1%) |
| High School Diploma | 484 (65.8%) | 252 (34.2%) |
| College/Associate Degree | 793 (69.7%) | 344 (30.3%) |
| Bachelor's Degree or higher | 492 (73.0%) | 182 (27.0%) |
Occupancy by Age of Householder in Sullivan
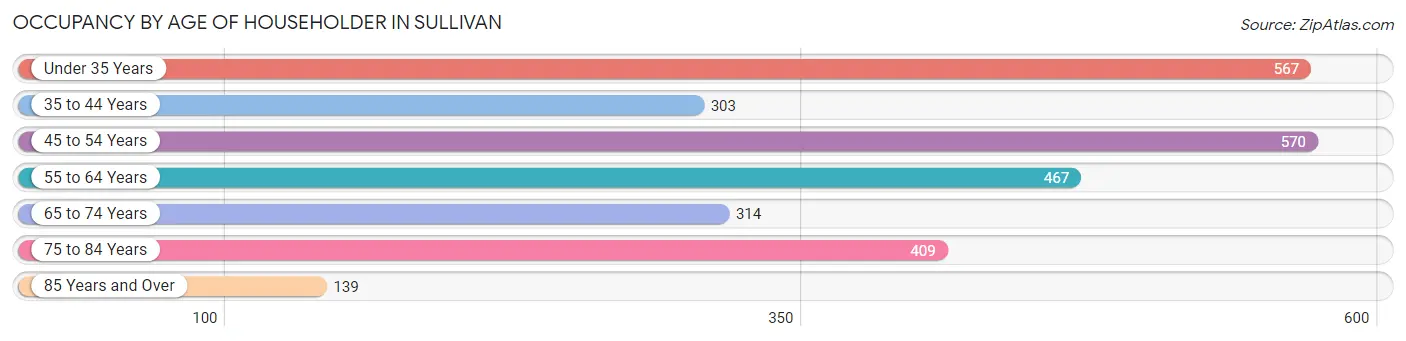
| Age Bracket | # Households | % Households |
| Under 35 Years | 567 | 20.5% |
| 35 to 44 Years | 303 | 10.9% |
| 45 to 54 Years | 570 | 20.6% |
| 55 to 64 Years | 467 | 16.9% |
| 65 to 74 Years | 314 | 11.3% |
| 75 to 84 Years | 409 | 14.8% |
| 85 Years and Over | 139 | 5.0% |
| Total | 2,769 | 100.0% |
Housing Finances in Sullivan
Median Income by Occupancy in Sullivan
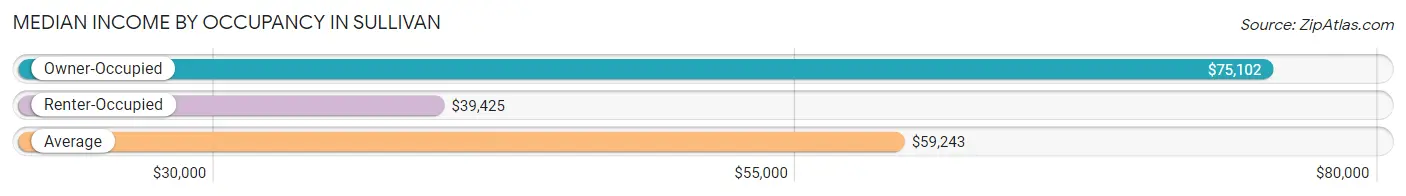
| Occupancy Type | # Households | Median Income |
| Owner-Occupied | 1,862 (67.2%) | $75,102 |
| Renter-Occupied | 907 (32.8%) | $39,425 |
| Average | 2,769 (100.0%) | $59,243 |
Occupancy by Householder Income Bracket in Sullivan
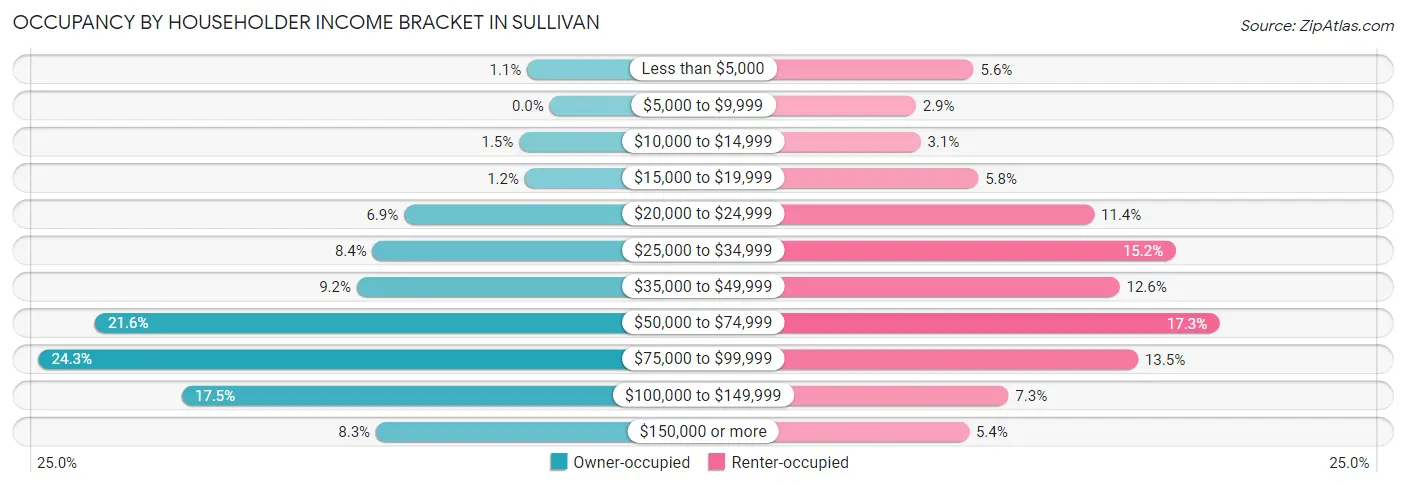
| Income Bracket | Owner-occupied | Renter-occupied |
| Less than $5,000 | 20 (1.1%) | 51 (5.6%) |
| $5,000 to $9,999 | 0 (0.0%) | 26 (2.9%) |
| $10,000 to $14,999 | 27 (1.5%) | 28 (3.1%) |
| $15,000 to $19,999 | 22 (1.2%) | 53 (5.8%) |
| $20,000 to $24,999 | 129 (6.9%) | 103 (11.4%) |
| $25,000 to $34,999 | 157 (8.4%) | 138 (15.2%) |
| $35,000 to $49,999 | 171 (9.2%) | 114 (12.6%) |
| $50,000 to $74,999 | 403 (21.6%) | 157 (17.3%) |
| $75,000 to $99,999 | 453 (24.3%) | 122 (13.5%) |
| $100,000 to $149,999 | 326 (17.5%) | 66 (7.3%) |
| $150,000 or more | 154 (8.3%) | 49 (5.4%) |
| Total | 1,862 (100.0%) | 907 (100.0%) |
Monthly Housing Cost Tiers in Sullivan
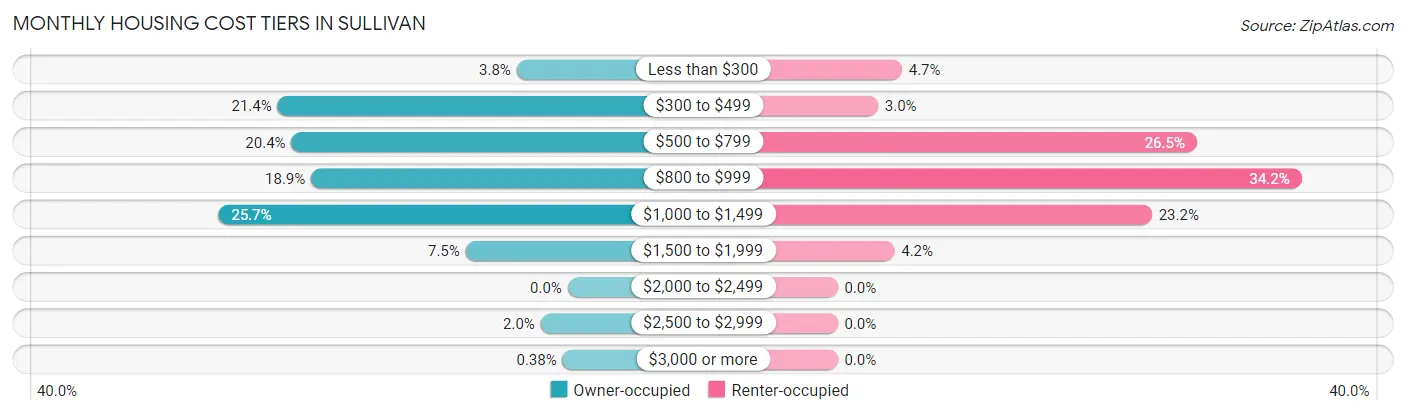
| Monthly Cost | Owner-occupied | Renter-occupied |
| Less than $300 | 70 (3.8%) | 43 (4.7%) |
| $300 to $499 | 398 (21.4%) | 27 (3.0%) |
| $500 to $799 | 379 (20.3%) | 240 (26.5%) |
| $800 to $999 | 352 (18.9%) | 310 (34.2%) |
| $1,000 to $1,499 | 479 (25.7%) | 210 (23.2%) |
| $1,500 to $1,999 | 140 (7.5%) | 38 (4.2%) |
| $2,000 to $2,499 | 0 (0.0%) | 0 (0.0%) |
| $2,500 to $2,999 | 37 (2.0%) | 0 (0.0%) |
| $3,000 or more | 7 (0.4%) | 0 (0.0%) |
| Total | 1,862 (100.0%) | 907 (100.0%) |
Physical Housing Characteristics in Sullivan
Housing Structures in Sullivan
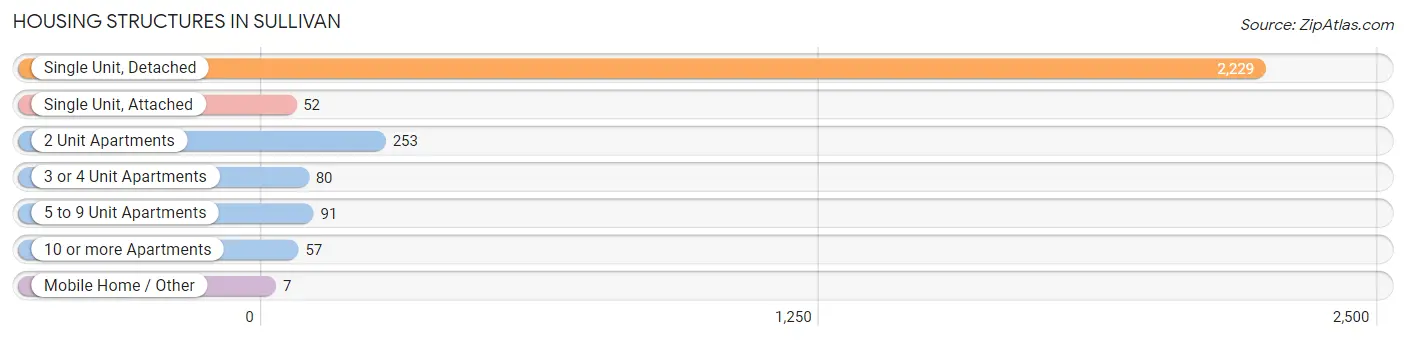
| Structure Type | # Housing Units | % Housing Units |
| Single Unit, Detached | 2,229 | 80.5% |
| Single Unit, Attached | 52 | 1.9% |
| 2 Unit Apartments | 253 | 9.1% |
| 3 or 4 Unit Apartments | 80 | 2.9% |
| 5 to 9 Unit Apartments | 91 | 3.3% |
| 10 or more Apartments | 57 | 2.1% |
| Mobile Home / Other | 7 | 0.3% |
| Total | 2,769 | 100.0% |
Housing Structures by Occupancy in Sullivan
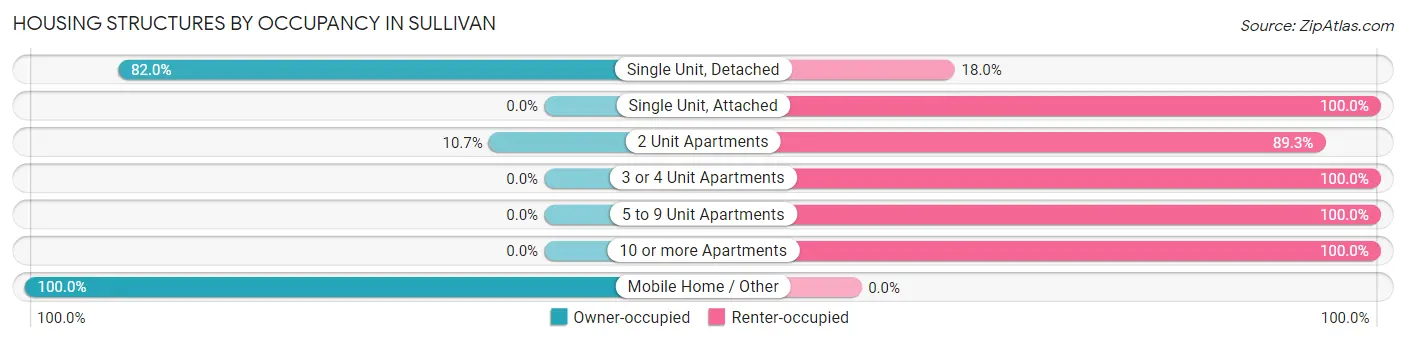
| Structure Type | Owner-occupied | Renter-occupied |
| Single Unit, Detached | 1,828 (82.0%) | 401 (18.0%) |
| Single Unit, Attached | 0 (0.0%) | 52 (100.0%) |
| 2 Unit Apartments | 27 (10.7%) | 226 (89.3%) |
| 3 or 4 Unit Apartments | 0 (0.0%) | 80 (100.0%) |
| 5 to 9 Unit Apartments | 0 (0.0%) | 91 (100.0%) |
| 10 or more Apartments | 0 (0.0%) | 57 (100.0%) |
| Mobile Home / Other | 7 (100.0%) | 0 (0.0%) |
| Total | 1,862 (67.2%) | 907 (32.8%) |
Housing Structures by Number of Rooms in Sullivan
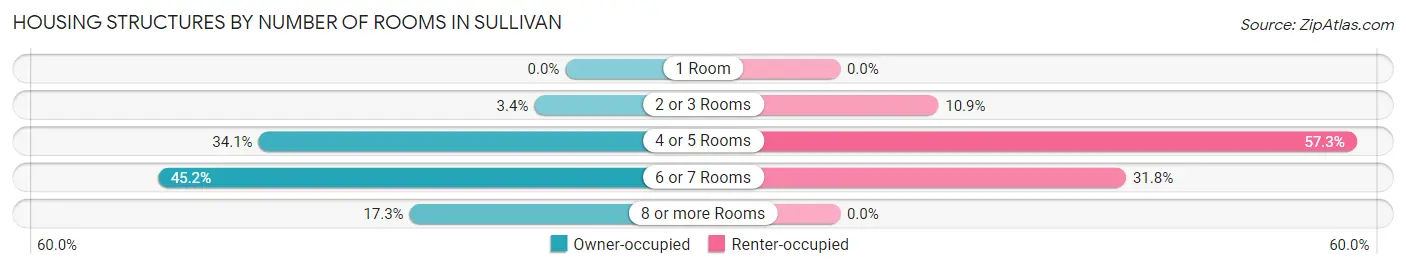
| Number of Rooms | Owner-occupied | Renter-occupied |
| 1 Room | 0 (0.0%) | 0 (0.0%) |
| 2 or 3 Rooms | 64 (3.4%) | 99 (10.9%) |
| 4 or 5 Rooms | 634 (34.1%) | 520 (57.3%) |
| 6 or 7 Rooms | 842 (45.2%) | 288 (31.8%) |
| 8 or more Rooms | 322 (17.3%) | 0 (0.0%) |
| Total | 1,862 (100.0%) | 907 (100.0%) |
Housing Structure by Heating Type in Sullivan
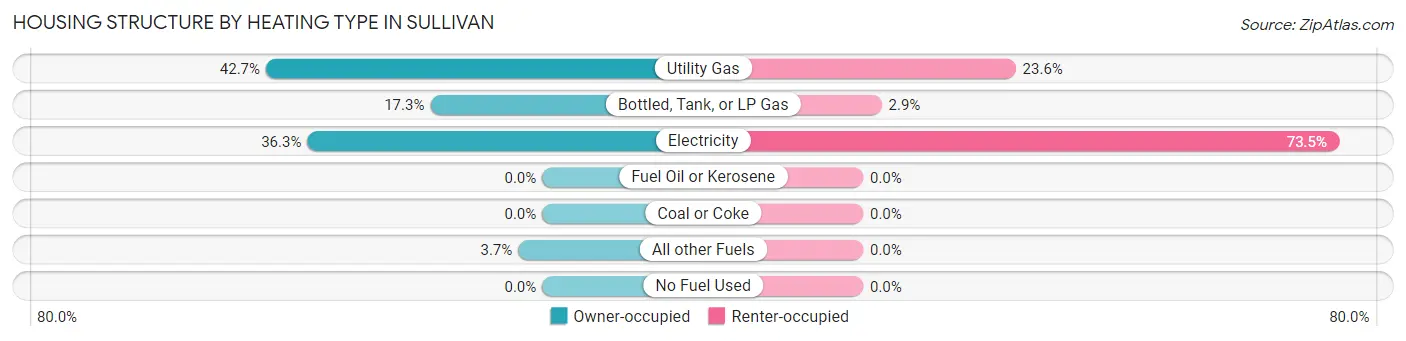
| Heating Type | Owner-occupied | Renter-occupied |
| Utility Gas | 795 (42.7%) | 214 (23.6%) |
| Bottled, Tank, or LP Gas | 322 (17.3%) | 26 (2.9%) |
| Electricity | 676 (36.3%) | 667 (73.5%) |
| Fuel Oil or Kerosene | 0 (0.0%) | 0 (0.0%) |
| Coal or Coke | 0 (0.0%) | 0 (0.0%) |
| All other Fuels | 69 (3.7%) | 0 (0.0%) |
| No Fuel Used | 0 (0.0%) | 0 (0.0%) |
| Total | 1,862 (100.0%) | 907 (100.0%) |
Household Vehicle Usage in Sullivan
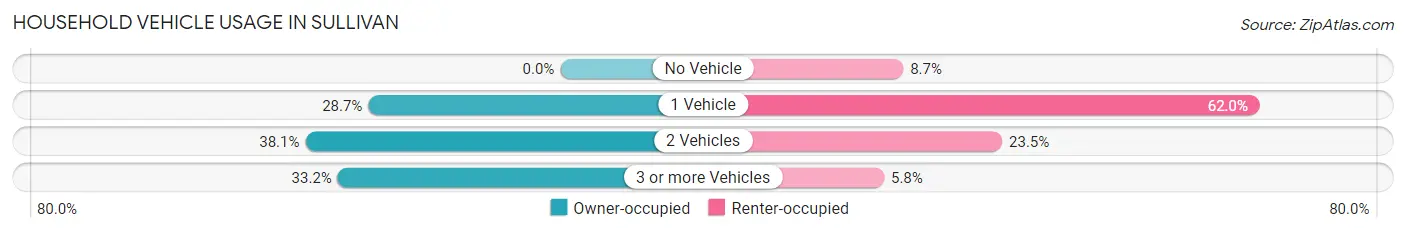
| Vehicles per Household | Owner-occupied | Renter-occupied |
| No Vehicle | 0 (0.0%) | 79 (8.7%) |
| 1 Vehicle | 534 (28.7%) | 562 (62.0%) |
| 2 Vehicles | 709 (38.1%) | 213 (23.5%) |
| 3 or more Vehicles | 619 (33.2%) | 53 (5.8%) |
| Total | 1,862 (100.0%) | 907 (100.0%) |
Real Estate & Mortgages in Sullivan
Real Estate and Mortgage Overview in Sullivan
| Characteristic | Without Mortgage | With Mortgage |
| Housing Units | 763 | 1,099 |
| Median Property Value | $120,400 | $147,600 |
| Median Household Income | $59,890 | $126 |
| Monthly Housing Costs | $460 | $7 |
| Real Estate Taxes | $1,215 | $0 |
Property Value by Mortgage Status in Sullivan
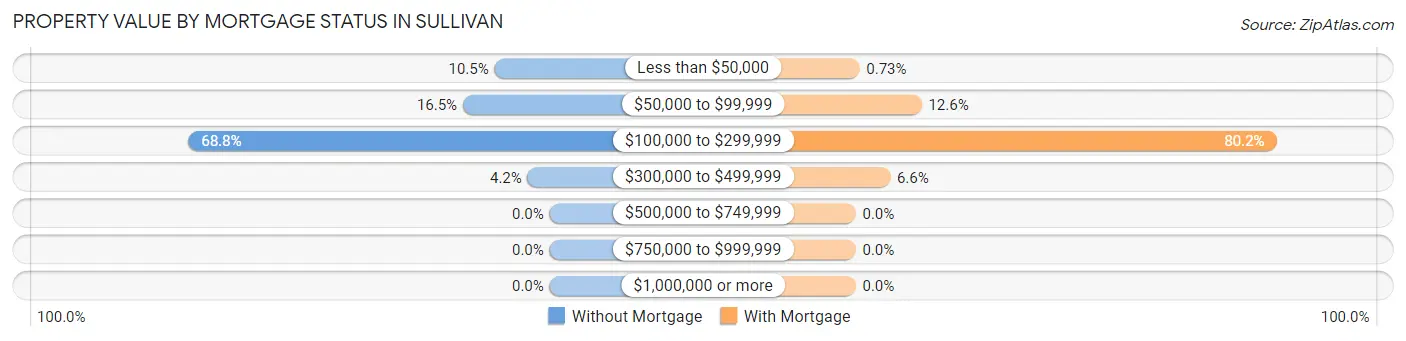
| Property Value | Without Mortgage | With Mortgage |
| Less than $50,000 | 80 (10.5%) | 8 (0.7%) |
| $50,000 to $99,999 | 126 (16.5%) | 138 (12.6%) |
| $100,000 to $299,999 | 525 (68.8%) | 881 (80.2%) |
| $300,000 to $499,999 | 32 (4.2%) | 72 (6.6%) |
| $500,000 to $749,999 | 0 (0.0%) | 0 (0.0%) |
| $750,000 to $999,999 | 0 (0.0%) | 0 (0.0%) |
| $1,000,000 or more | 0 (0.0%) | 0 (0.0%) |
| Total | 763 (100.0%) | 1,099 (100.0%) |
Household Income by Mortgage Status in Sullivan
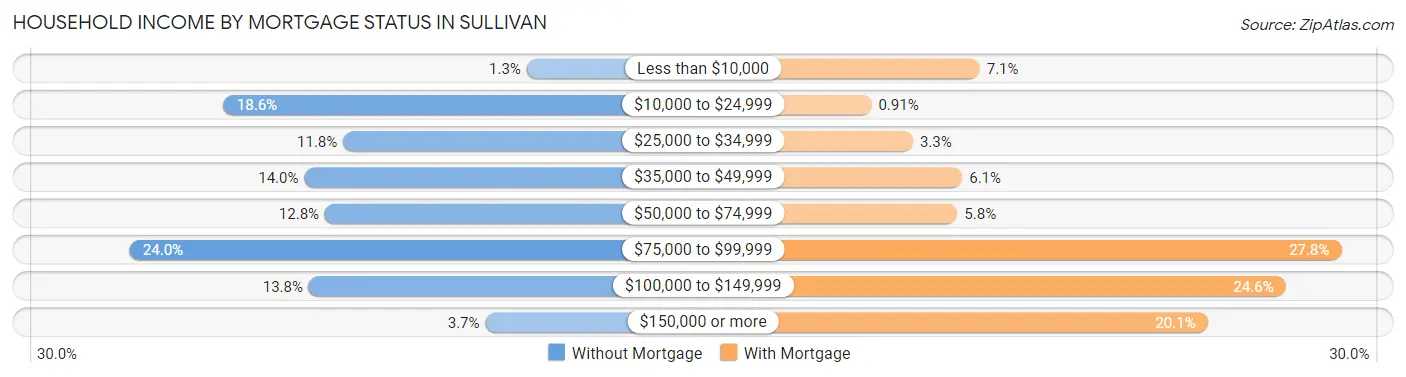
| Household Income | Without Mortgage | With Mortgage |
| Less than $10,000 | 10 (1.3%) | 78 (7.1%) |
| $10,000 to $24,999 | 142 (18.6%) | 10 (0.9%) |
| $25,000 to $34,999 | 90 (11.8%) | 36 (3.3%) |
| $35,000 to $49,999 | 107 (14.0%) | 67 (6.1%) |
| $50,000 to $74,999 | 98 (12.8%) | 64 (5.8%) |
| $75,000 to $99,999 | 183 (24.0%) | 305 (27.8%) |
| $100,000 to $149,999 | 105 (13.8%) | 270 (24.6%) |
| $150,000 or more | 28 (3.7%) | 221 (20.1%) |
| Total | 763 (100.0%) | 1,099 (100.0%) |
Property Value to Household Income Ratio in Sullivan
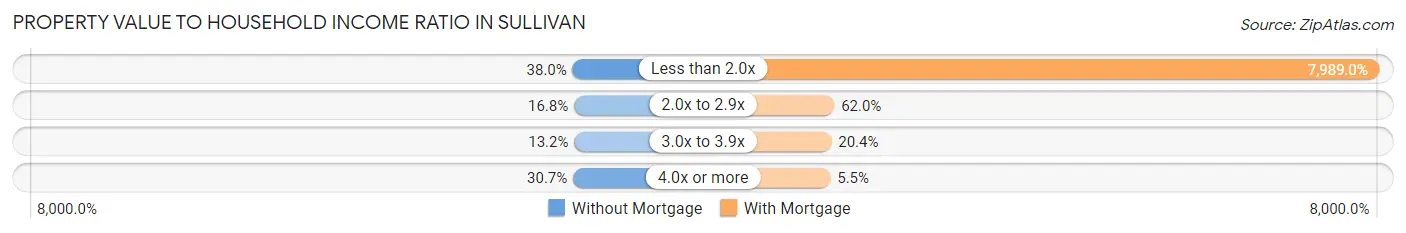
| Value-to-Income Ratio | Without Mortgage | With Mortgage |
| Less than 2.0x | 290 (38.0%) | 87,799 (7,989.0%) |
| 2.0x to 2.9x | 128 (16.8%) | 681 (62.0%) |
| 3.0x to 3.9x | 101 (13.2%) | 224 (20.4%) |
| 4.0x or more | 234 (30.7%) | 60 (5.5%) |
| Total | 763 (100.0%) | 1,099 (100.0%) |
Real Estate Taxes by Mortgage Status in Sullivan
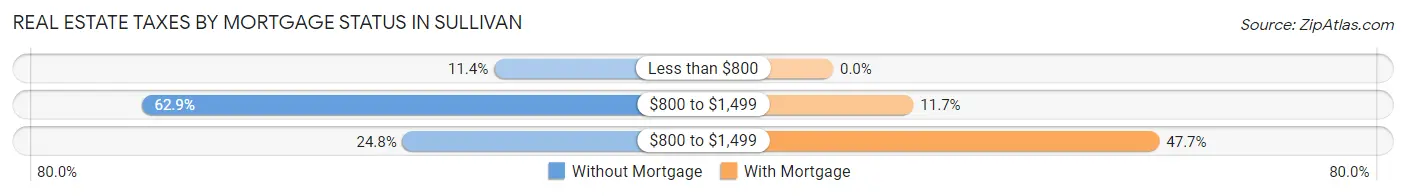
| Property Taxes | Without Mortgage | With Mortgage |
| Less than $800 | 87 (11.4%) | 0 (0.0%) |
| $800 to $1,499 | 480 (62.9%) | 129 (11.7%) |
| $800 to $1,499 | 189 (24.8%) | 524 (47.7%) |
| Total | 763 (100.0%) | 1,099 (100.0%) |
Health & Disability in Sullivan
Health Insurance Coverage by Age in Sullivan
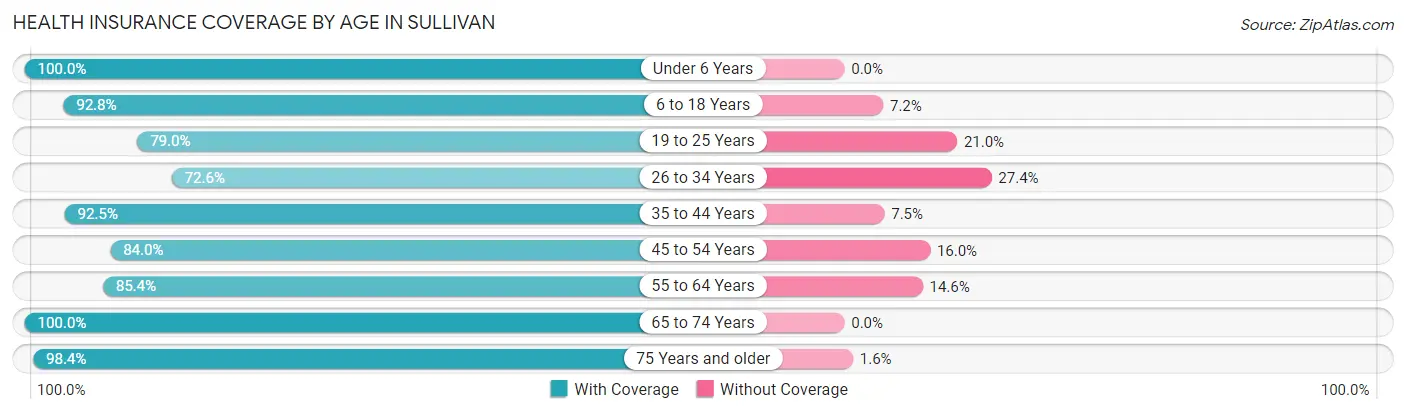
| Age Bracket | With Coverage | Without Coverage |
| Under 6 Years | 431 (100.0%) | 0 (0.0%) |
| 6 to 18 Years | 1,015 (92.8%) | 79 (7.2%) |
| 19 to 25 Years | 440 (79.0%) | 117 (21.0%) |
| 26 to 34 Years | 537 (72.6%) | 203 (27.4%) |
| 35 to 44 Years | 645 (92.5%) | 52 (7.5%) |
| 45 to 54 Years | 663 (84.0%) | 126 (16.0%) |
| 55 to 64 Years | 644 (85.4%) | 110 (14.6%) |
| 65 to 74 Years | 493 (100.0%) | 0 (0.0%) |
| 75 Years and older | 743 (98.4%) | 12 (1.6%) |
| Total | 5,611 (88.9%) | 699 (11.1%) |
Health Insurance Coverage by Citizenship Status in Sullivan
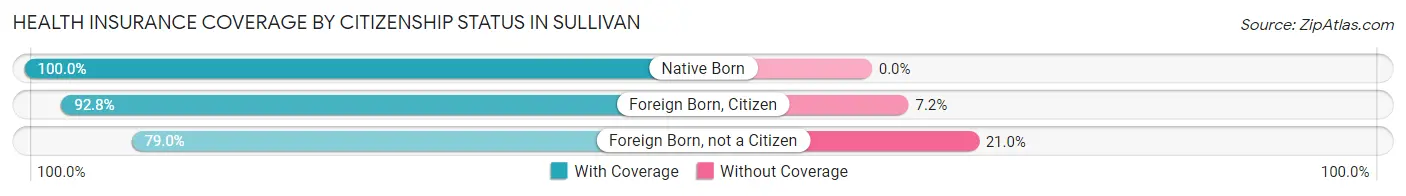
| Citizenship Status | With Coverage | Without Coverage |
| Native Born | 431 (100.0%) | 0 (0.0%) |
| Foreign Born, Citizen | 1,015 (92.8%) | 79 (7.2%) |
| Foreign Born, not a Citizen | 440 (79.0%) | 117 (21.0%) |
Health Insurance Coverage by Household Income in Sullivan
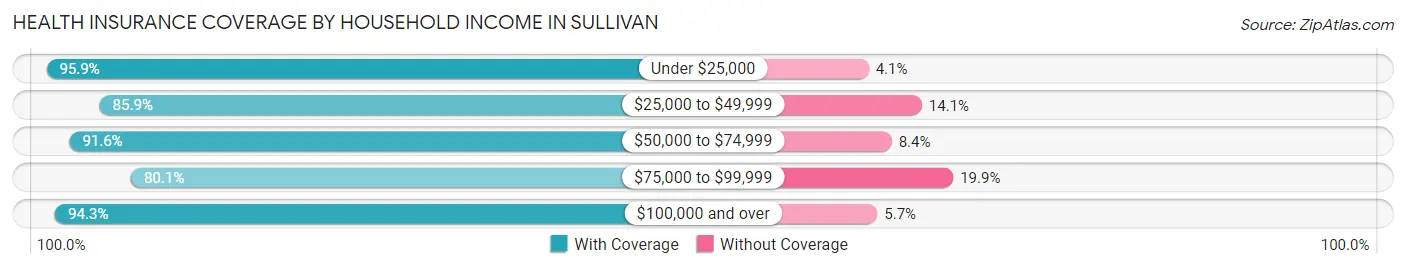
| Household Income | With Coverage | Without Coverage |
| Under $25,000 | 679 (95.9%) | 29 (4.1%) |
| $25,000 to $49,999 | 971 (85.9%) | 159 (14.1%) |
| $50,000 to $74,999 | 937 (91.6%) | 86 (8.4%) |
| $75,000 to $99,999 | 1,289 (80.1%) | 321 (19.9%) |
| $100,000 and over | 1,713 (94.3%) | 104 (5.7%) |
Public vs Private Health Insurance Coverage by Age in Sullivan
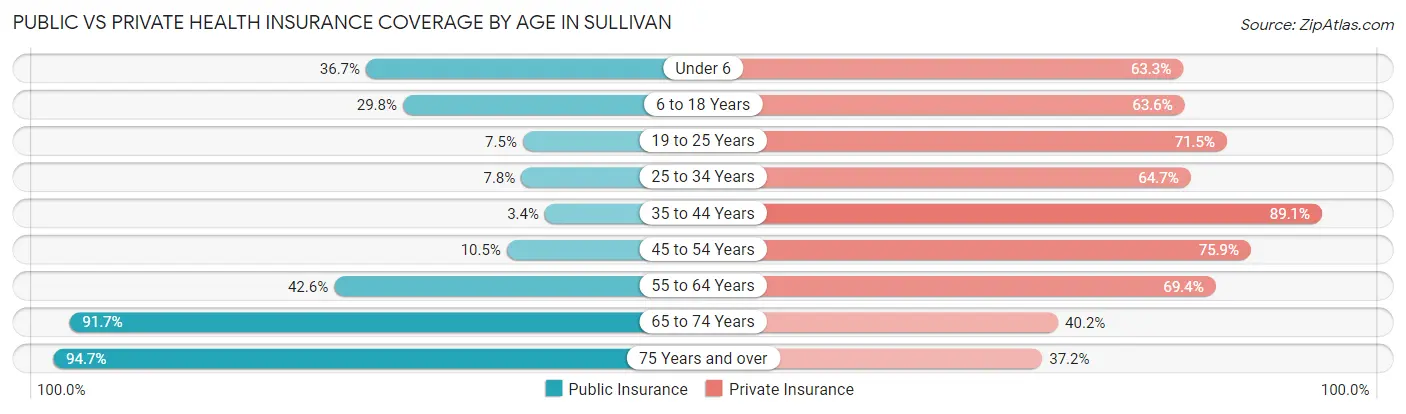
| Age Bracket | Public Insurance | Private Insurance |
| Under 6 | 158 (36.7%) | 273 (63.3%) |
| 6 to 18 Years | 326 (29.8%) | 696 (63.6%) |
| 19 to 25 Years | 42 (7.5%) | 398 (71.5%) |
| 25 to 34 Years | 58 (7.8%) | 479 (64.7%) |
| 35 to 44 Years | 24 (3.4%) | 621 (89.1%) |
| 45 to 54 Years | 83 (10.5%) | 599 (75.9%) |
| 55 to 64 Years | 321 (42.6%) | 523 (69.4%) |
| 65 to 74 Years | 452 (91.7%) | 198 (40.2%) |
| 75 Years and over | 715 (94.7%) | 281 (37.2%) |
| Total | 2,179 (34.5%) | 4,068 (64.5%) |
Disability Status by Sex by Age in Sullivan
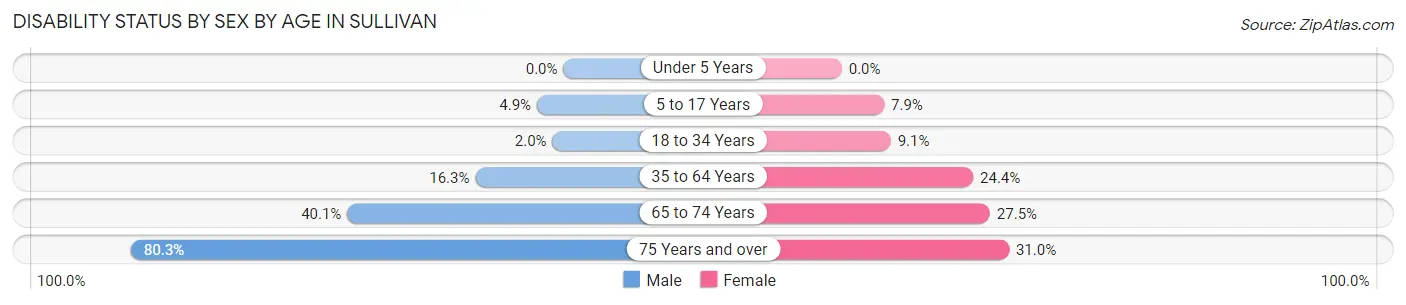
| Age Bracket | Male | Female |
| Under 5 Years | 0 (0.0%) | 0 (0.0%) |
| 5 to 17 Years | 35 (4.9%) | 31 (7.9%) |
| 18 to 34 Years | 14 (2.0%) | 60 (9.1%) |
| 35 to 64 Years | 185 (16.3%) | 270 (24.4%) |
| 65 to 74 Years | 65 (40.1%) | 91 (27.5%) |
| 75 Years and over | 187 (80.3%) | 162 (31.0%) |
Disability Class by Sex by Age in Sullivan
Disability Class: Hearing Difficulty
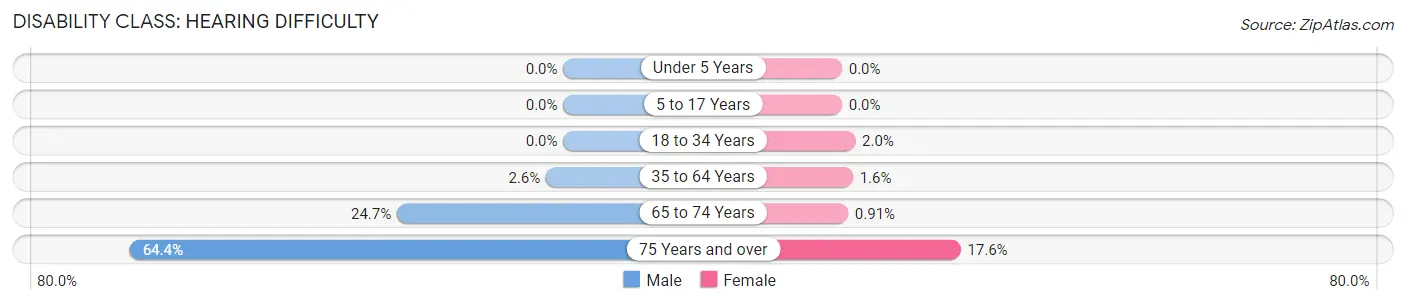
| Age Bracket | Male | Female |
| Under 5 Years | 0 (0.0%) | 0 (0.0%) |
| 5 to 17 Years | 0 (0.0%) | 0 (0.0%) |
| 18 to 34 Years | 0 (0.0%) | 13 (2.0%) |
| 35 to 64 Years | 29 (2.6%) | 18 (1.6%) |
| 65 to 74 Years | 40 (24.7%) | 3 (0.9%) |
| 75 Years and over | 150 (64.4%) | 92 (17.6%) |
Disability Class: Vision Difficulty
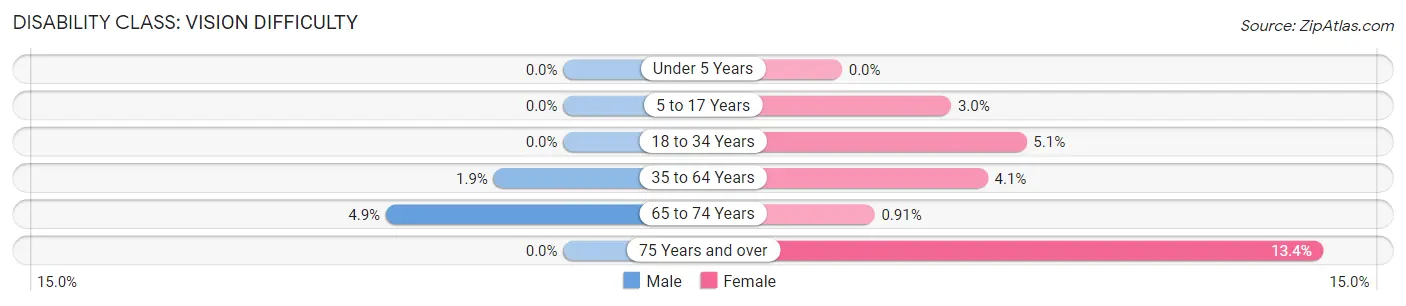
| Age Bracket | Male | Female |
| Under 5 Years | 0 (0.0%) | 0 (0.0%) |
| 5 to 17 Years | 0 (0.0%) | 12 (3.0%) |
| 18 to 34 Years | 0 (0.0%) | 34 (5.1%) |
| 35 to 64 Years | 22 (1.9%) | 45 (4.1%) |
| 65 to 74 Years | 8 (4.9%) | 3 (0.9%) |
| 75 Years and over | 0 (0.0%) | 70 (13.4%) |
Disability Class: Cognitive Difficulty
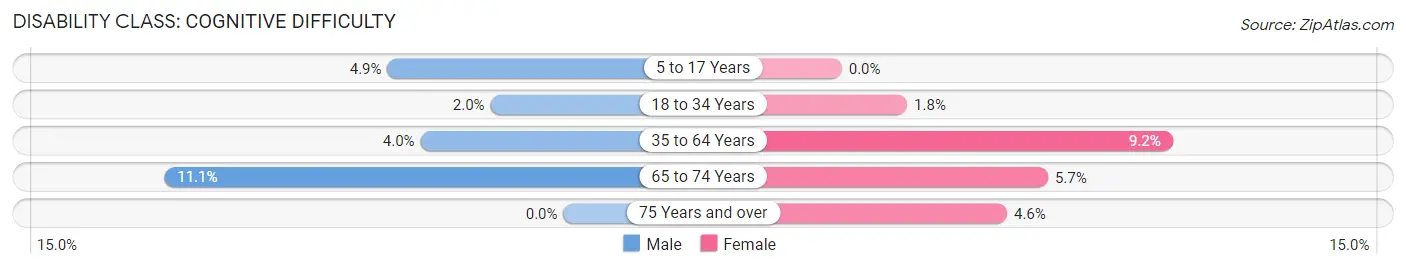
| Age Bracket | Male | Female |
| 5 to 17 Years | 35 (4.9%) | 0 (0.0%) |
| 18 to 34 Years | 14 (2.0%) | 12 (1.8%) |
| 35 to 64 Years | 45 (4.0%) | 102 (9.2%) |
| 65 to 74 Years | 18 (11.1%) | 19 (5.7%) |
| 75 Years and over | 0 (0.0%) | 24 (4.6%) |
Disability Class: Ambulatory Difficulty
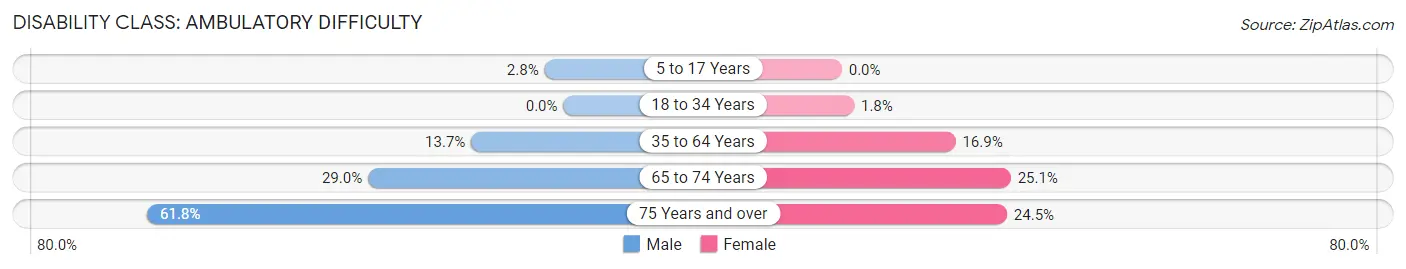
| Age Bracket | Male | Female |
| 5 to 17 Years | 20 (2.8%) | 0 (0.0%) |
| 18 to 34 Years | 0 (0.0%) | 12 (1.8%) |
| 35 to 64 Years | 155 (13.7%) | 187 (16.9%) |
| 65 to 74 Years | 47 (29.0%) | 83 (25.1%) |
| 75 Years and over | 144 (61.8%) | 128 (24.5%) |
Disability Class: Self-Care Difficulty
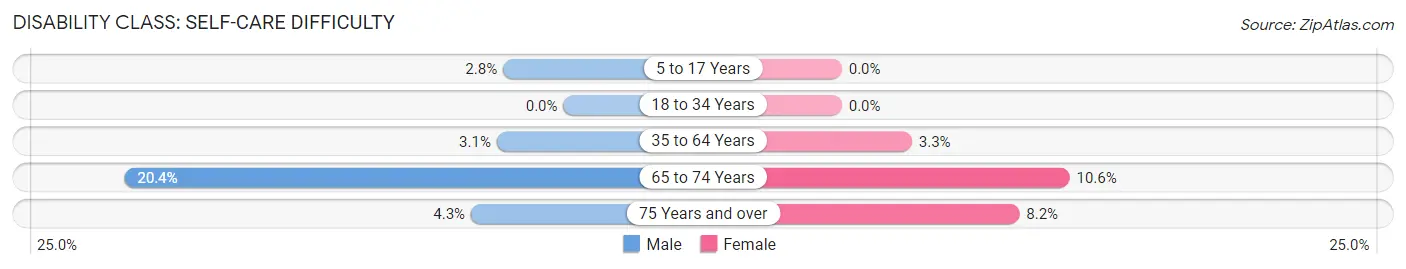
| Age Bracket | Male | Female |
| 5 to 17 Years | 20 (2.8%) | 0 (0.0%) |
| 18 to 34 Years | 0 (0.0%) | 0 (0.0%) |
| 35 to 64 Years | 35 (3.1%) | 36 (3.3%) |
| 65 to 74 Years | 33 (20.4%) | 35 (10.6%) |
| 75 Years and over | 10 (4.3%) | 43 (8.2%) |
Technology Access in Sullivan
Computing Device Access in Sullivan
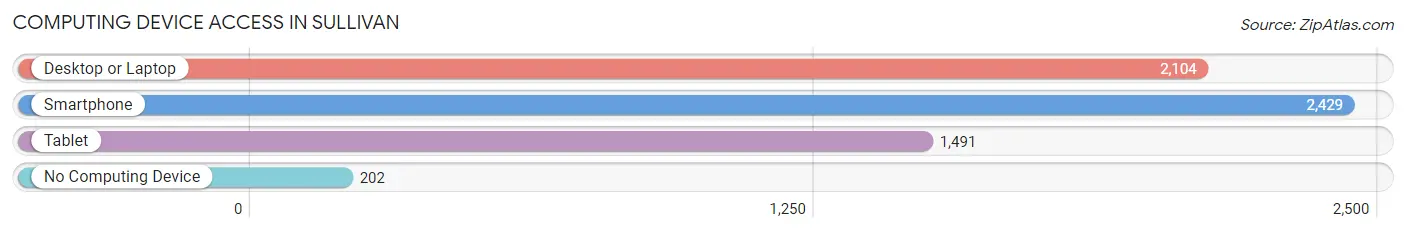
| Device Type | # Households | % Households |
| Desktop or Laptop | 2,104 | 76.0% |
| Smartphone | 2,429 | 87.7% |
| Tablet | 1,491 | 53.8% |
| No Computing Device | 202 | 7.3% |
| Total | 2,769 | 100.0% |
Internet Access in Sullivan
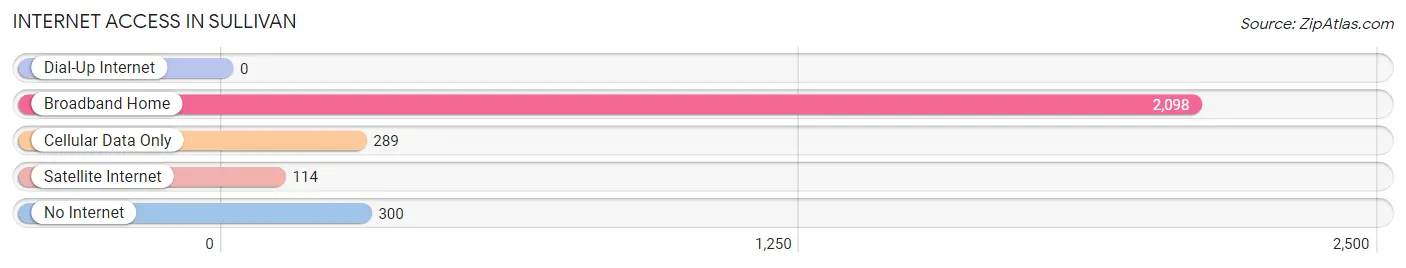
| Internet Type | # Households | % Households |
| Dial-Up Internet | 0 | 0.0% |
| Broadband Home | 2,098 | 75.8% |
| Cellular Data Only | 289 | 10.4% |
| Satellite Internet | 114 | 4.1% |
| No Internet | 300 | 10.8% |
| Total | 2,769 | 100.0% |
Sullivan Summary
Sullivan, Missouri is a small city located in Franklin County, Missouri. It is situated in the eastern part of the state, approximately 50 miles southwest of St. Louis. The city has a population of approximately 8,000 people and is the county seat of Franklin County.
History
The area that is now Sullivan was first settled in 1819 by a group of settlers from Kentucky. The settlement was originally known as “New Design” and was located near the Meramec River. In 1820, the settlement was renamed “Sullivan” in honor of Major General John Sullivan, a Revolutionary War hero.
In 1821, the first post office was established in Sullivan and the town was officially incorporated in 1845. During the Civil War, Sullivan was a major supply center for the Confederate Army. After the war, the town experienced a period of growth and prosperity. In 1876, the St. Louis and San Francisco Railroad was built through Sullivan, connecting the town to St. Louis and other major cities.
Geography
Sullivan is located in the eastern part of Missouri, approximately 50 miles southwest of St. Louis. The city is situated in the Ozark Mountains and is surrounded by rolling hills and forests. The Meramec River runs through the city and is a popular destination for fishing and other outdoor activities.
The climate in Sullivan is humid subtropical, with hot, humid summers and mild winters. The average annual temperature is around 57 degrees Fahrenheit. The average annual precipitation is around 40 inches.
Economy
Sullivan’s economy is largely based on agriculture and manufacturing. The city is home to several large manufacturing companies, including a steel mill, a paper mill, and a plastics plant. Agriculture is also an important part of the local economy, with corn, soybeans, and wheat being the main crops.
The city is also home to several small businesses, including restaurants, retail stores, and service providers. Sullivan is also home to a number of tourist attractions, including the Meramec Caverns, a popular cave system.
Demographics
As of the 2010 census, Sullivan had a population of 8,000 people. The racial makeup of the city was 95.3% White, 1.2% African American, 0.7% Native American, 0.4% Asian, 0.1% Pacific Islander, and 1.3% from other races. Hispanic or Latino of any race were 2.2% of the population.
The median household income in Sullivan was $37,000, and the median family income was $45,000. The per capita income was $19,000. About 11.5% of the population was below the poverty line.
Sullivan is served by the Franklin County School District, which includes four elementary schools, one middle school, and one high school. The city is also home to several private schools, including a Catholic school and a Christian school.
Common Questions
What is Per Capita Income in Sullivan?
Per Capita income in Sullivan is $31,068.
What is the Median Family Income in Sullivan?
Median Family Income in Sullivan is $83,370.
What is the Median Household income in Sullivan?
Median Household Income in Sullivan is $59,243.
What is Income or Wage Gap in Sullivan?
Income or Wage Gap in Sullivan is 41.1%.
Women in Sullivan earn 58.9 cents for every dollar earned by a man.
What is Inequality or Gini Index in Sullivan?
Inequality or Gini Index in Sullivan is 0.37.
What is the Total Population of Sullivan?
Total Population of Sullivan is 6,441.
What is the Total Male Population of Sullivan?
Total Male Population of Sullivan is 3,124.
What is the Total Female Population of Sullivan?
Total Female Population of Sullivan is 3,317.
What is the Ratio of Males per 100 Females in Sullivan?
There are 94.18 Males per 100 Females in Sullivan.
What is the Ratio of Females per 100 Males in Sullivan?
There are 106.18 Females per 100 Males in Sullivan.
What is the Median Population Age in Sullivan?
Median Population Age in Sullivan is 41.2 Years.
What is the Average Family Size in Sullivan
Average Family Size in Sullivan is 2.9 People.
What is the Average Household Size in Sullivan
Average Household Size in Sullivan is 2.3 People.
How Large is the Labor Force in Sullivan?
There are 3,104 People in the Labor Forcein in Sullivan.
What is the Percentage of People in the Labor Force in Sullivan?
60.8% of People are in the Labor Force in Sullivan.
What is the Unemployment Rate in Sullivan?
Unemployment Rate in Sullivan is 4.4%.