Desloge, MO Map & Demographics
Desloge Map
Desloge Overview
$27,471
PER CAPITA INCOME
$63,097
AVG FAMILY INCOME
$60,354
AVG HOUSEHOLD INCOME
30.6%
WAGE / INCOME GAP [ % ]
69.4¢/ $1
WAGE / INCOME GAP [ $ ]
0.34
INEQUALITY / GINI INDEX
4,875
TOTAL POPULATION
2,485
MALE POPULATION
2,390
FEMALE POPULATION
103.97
MALES / 100 FEMALES
96.18
FEMALES / 100 MALES
35.9
MEDIAN AGE
2.7
AVG FAMILY SIZE
2.3
AVG HOUSEHOLD SIZE
2,655
LABOR FORCE [ PEOPLE ]
66.0%
PERCENT IN LABOR FORCE
7.3%
UNEMPLOYMENT RATE
Desloge Area Codes
Income in Desloge
Income Overview in Desloge
Per Capita Income in Desloge is $27,471, while median incomes of families and households are $63,097 and $60,354 respectively.
| Characteristic | Number | Measure |
| Per Capita Income | 4,875 | $27,471 |
| Median Family Income | 1,435 | $63,097 |
| Mean Family Income | 1,435 | $74,813 |
| Median Household Income | 2,059 | $60,354 |
| Mean Household Income | 2,059 | $66,415 |
| Income Deficit | 1,435 | $0 |
| Wage / Income Gap (%) | 4,875 | 30.58% |
| Wage / Income Gap ($) | 4,875 | 69.42¢ per $1 |
| Gini / Inequality Index | 4,875 | 0.34 |
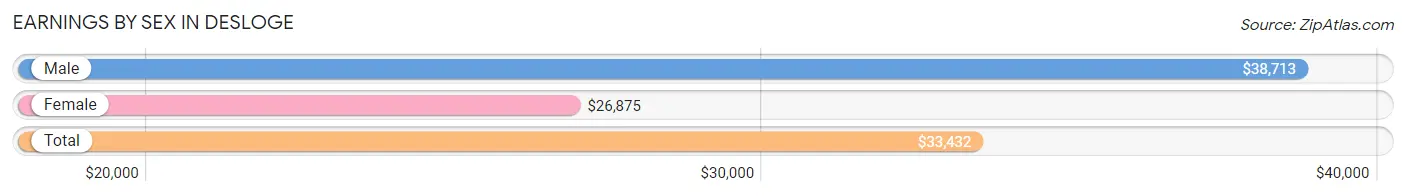
Earnings by Sex in Desloge
Average Earnings in Desloge are $33,432, $38,713 for men and $26,875 for women, a difference of 30.6%.
| Sex | Number | Average Earnings |
| Male | 1,355 (51.6%) | $38,713 |
| Female | 1,273 (48.4%) | $26,875 |
| Total | 2,628 (100.0%) | $33,432 |
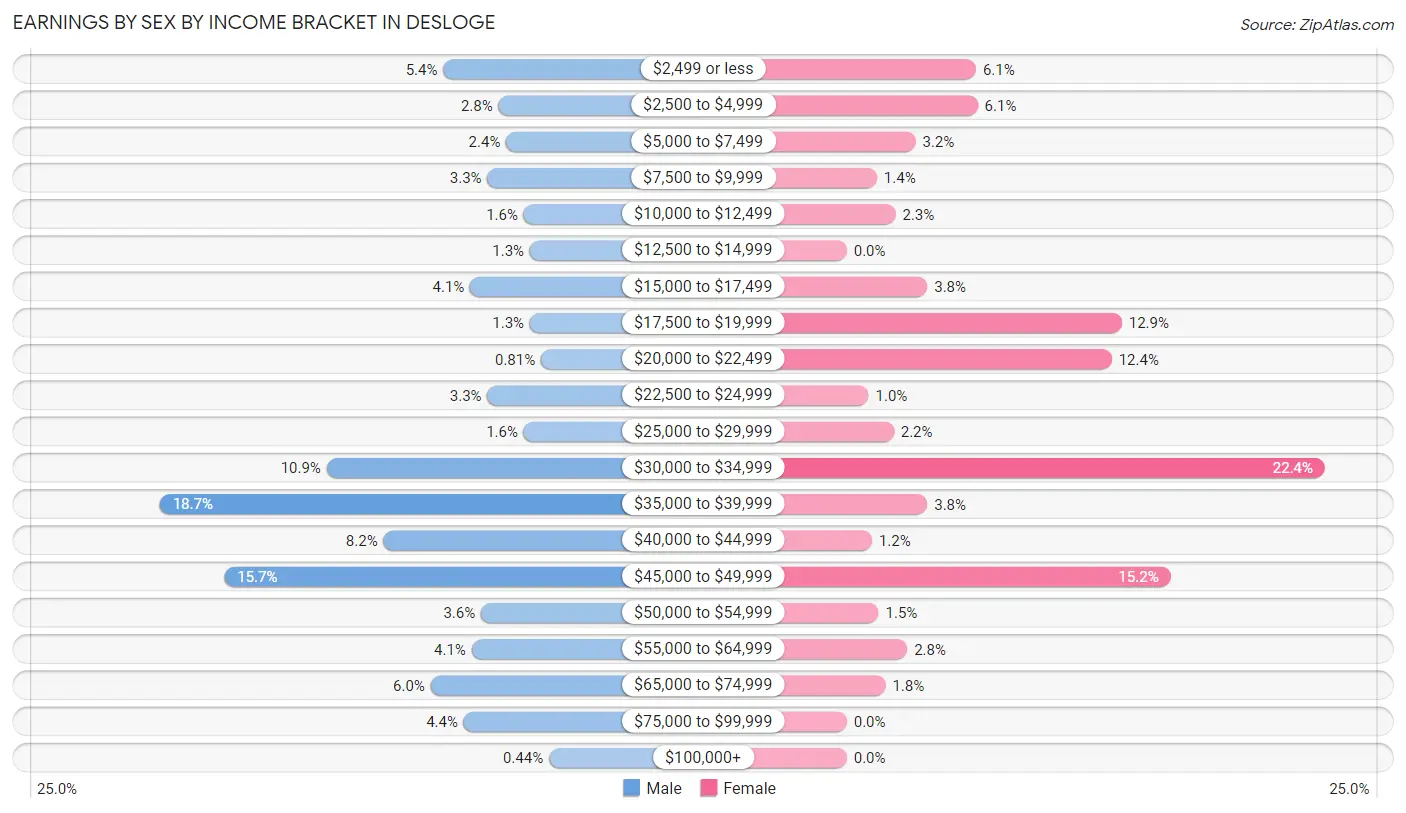
Earnings by Sex by Income Bracket in Desloge
The most common earnings brackets in Desloge are $35,000 to $39,999 for men (253 | 18.7%) and $30,000 to $34,999 for women (285 | 22.4%).
| Income | Male | Female |
| $2,499 or less | 73 (5.4%) | 77 (6.0%) |
| $2,500 to $4,999 | 38 (2.8%) | 78 (6.1%) |
| $5,000 to $7,499 | 33 (2.4%) | 41 (3.2%) |
| $7,500 to $9,999 | 45 (3.3%) | 18 (1.4%) |
| $10,000 to $12,499 | 22 (1.6%) | 29 (2.3%) |
| $12,500 to $14,999 | 18 (1.3%) | 0 (0.0%) |
| $15,000 to $17,499 | 56 (4.1%) | 48 (3.8%) |
| $17,500 to $19,999 | 18 (1.3%) | 164 (12.9%) |
| $20,000 to $22,499 | 11 (0.8%) | 158 (12.4%) |
| $22,500 to $24,999 | 45 (3.3%) | 13 (1.0%) |
| $25,000 to $29,999 | 22 (1.6%) | 28 (2.2%) |
| $30,000 to $34,999 | 147 (10.8%) | 285 (22.4%) |
| $35,000 to $39,999 | 253 (18.7%) | 48 (3.8%) |
| $40,000 to $44,999 | 111 (8.2%) | 15 (1.2%) |
| $45,000 to $49,999 | 212 (15.7%) | 193 (15.2%) |
| $50,000 to $54,999 | 49 (3.6%) | 19 (1.5%) |
| $55,000 to $64,999 | 55 (4.1%) | 36 (2.8%) |
| $65,000 to $74,999 | 81 (6.0%) | 23 (1.8%) |
| $75,000 to $99,999 | 60 (4.4%) | 0 (0.0%) |
| $100,000+ | 6 (0.4%) | 0 (0.0%) |
| Total | 1,355 (100.0%) | 1,273 (100.0%) |
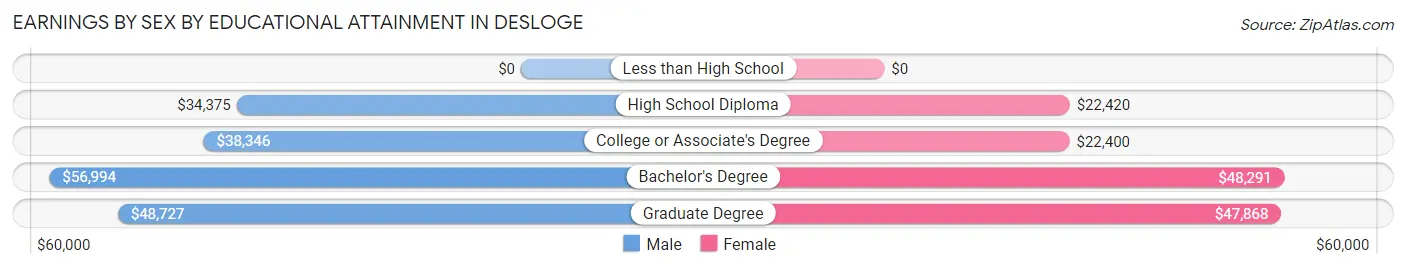
Earnings by Sex by Educational Attainment in Desloge
Average earnings in Desloge are $39,241 for men and $26,071 for women, a difference of 33.6%. Men with an educational attainment of bachelor's degree enjoy the highest average annual earnings of $56,994, while those with high school diploma education earn the least with $34,375. Women with an educational attainment of bachelor's degree earn the most with the average annual earnings of $48,291, while those with college or associate's degree education have the smallest earnings of $22,400.
| Educational Attainment | Male Income | Female Income |
| Less than High School | - | - |
| High School Diploma | $34,375 | $22,420 |
| College or Associate's Degree | $38,346 | $22,400 |
| Bachelor's Degree | $56,994 | $48,291 |
| Graduate Degree | $48,727 | $47,868 |
| Total | $39,241 | $26,071 |
Family Income in Desloge
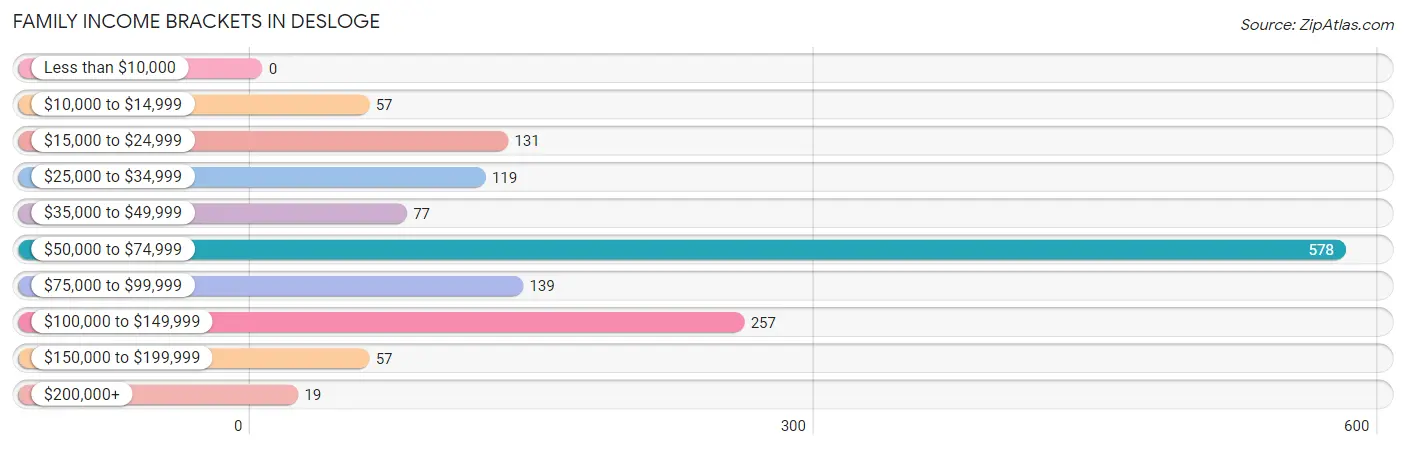
Family Income Brackets in Desloge
According to the Desloge family income data, there are 578 families falling into the $50,000 to $74,999 income range, which is the most common income bracket and makes up 40.3% of all families.
| Income Bracket | # Families | % Families |
| Less than $10,000 | 0 | 0.0% |
| $10,000 to $14,999 | 57 | 4.0% |
| $15,000 to $24,999 | 131 | 9.1% |
| $25,000 to $34,999 | 119 | 8.3% |
| $35,000 to $49,999 | 77 | 5.4% |
| $50,000 to $74,999 | 578 | 40.3% |
| $75,000 to $99,999 | 139 | 9.7% |
| $100,000 to $149,999 | 257 | 17.9% |
| $150,000 to $199,999 | 57 | 4.0% |
| $200,000+ | 19 | 1.3% |
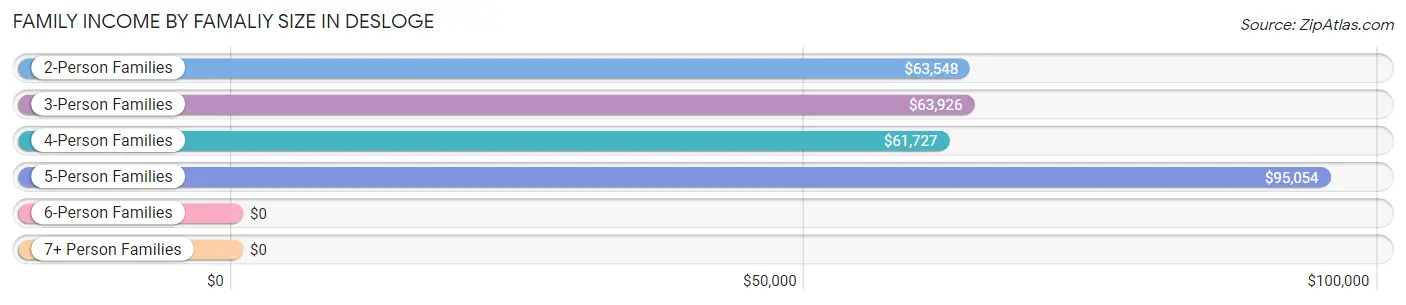
Family Income by Famaliy Size in Desloge
5-person families (93 | 6.5%) account for the highest median family income in Desloge with $95,054 per family, while 2-person families (660 | 46.0%) have the highest median income of $31,774 per family member.
| Income Bracket | # Families | Median Income |
| 2-Person Families | 660 (46.0%) | $63,548 |
| 3-Person Families | 443 (30.9%) | $63,926 |
| 4-Person Families | 239 (16.7%) | $61,727 |
| 5-Person Families | 93 (6.5%) | $95,054 |
| 6-Person Families | 0 (0.0%) | $0 |
| 7+ Person Families | 0 (0.0%) | $0 |
| Total | 1,435 (100.0%) | $63,097 |
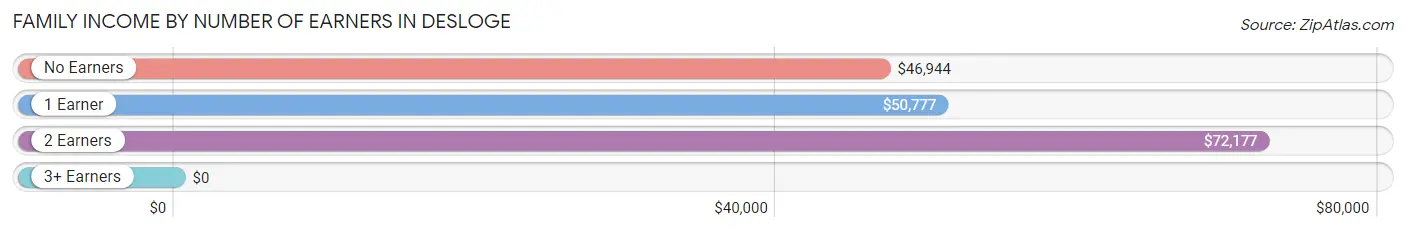
Family Income by Number of Earners in Desloge
| Number of Earners | # Families | Median Income |
| No Earners | 246 (17.1%) | $46,944 |
| 1 Earner | 445 (31.0%) | $50,777 |
| 2 Earners | 576 (40.1%) | $72,177 |
| 3+ Earners | 168 (11.7%) | $0 |
| Total | 1,435 (100.0%) | $63,097 |
Household Income in Desloge
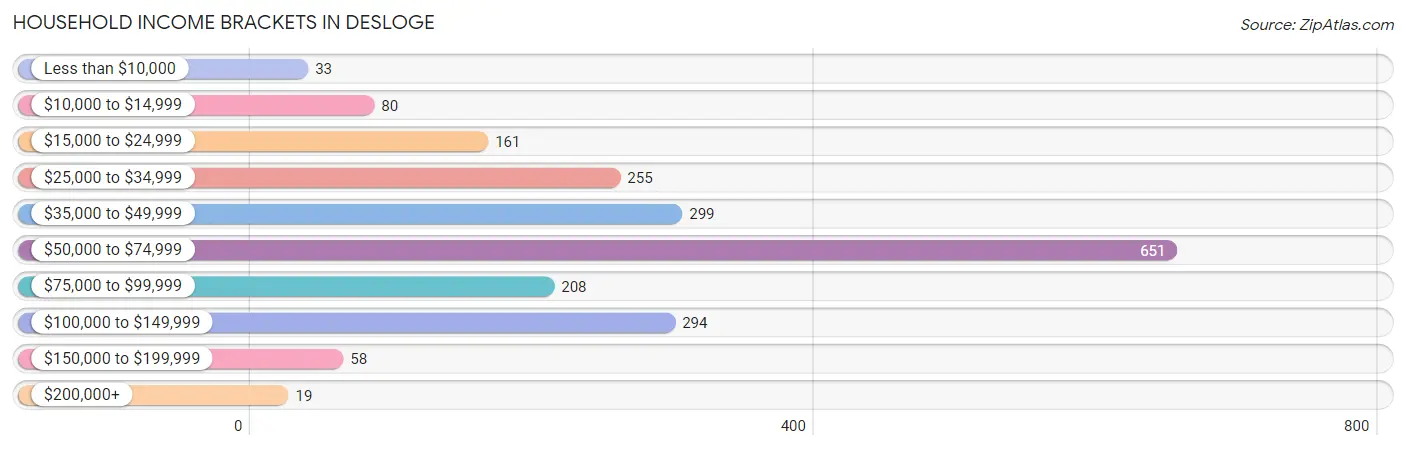
Household Income Brackets in Desloge
With 651 households falling in the category, the $50,000 to $74,999 income range is the most frequent in Desloge, accounting for 31.6% of all households. In contrast, only 19 households (0.9%) fall into the $200,000+ income bracket, making it the least populous group.
| Income Bracket | # Households | % Households |
| Less than $10,000 | 33 | 1.6% |
| $10,000 to $14,999 | 80 | 3.9% |
| $15,000 to $24,999 | 161 | 7.8% |
| $25,000 to $34,999 | 255 | 12.4% |
| $35,000 to $49,999 | 299 | 14.5% |
| $50,000 to $74,999 | 651 | 31.6% |
| $75,000 to $99,999 | 208 | 10.1% |
| $100,000 to $149,999 | 294 | 14.3% |
| $150,000 to $199,999 | 58 | 2.8% |
| $200,000+ | 19 | 0.9% |
Household Income by Householder Age in Desloge
The median household income in Desloge is $60,354, with the highest median household income of $71,875 found in the 45 to 64 years age bracket for the primary householder. A total of 671 households (32.6%) fall into this category. Meanwhile, the 15 to 24 years age bracket for the primary householder has the lowest median household income of $40,962, with 78 households (3.8%) in this group.
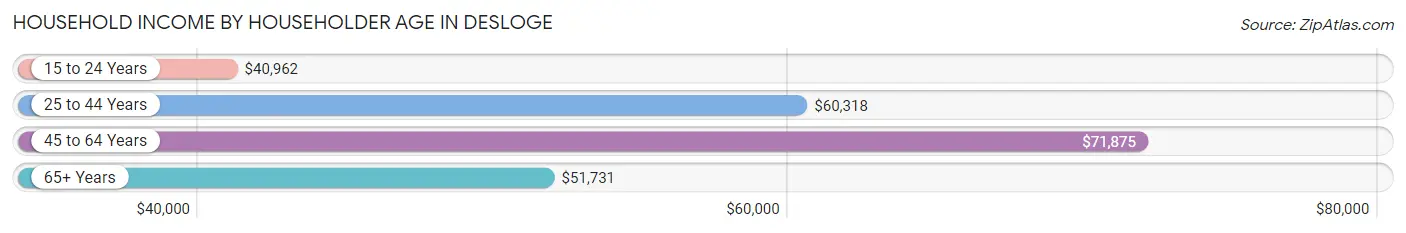
| Income Bracket | # Households | Median Income |
| 15 to 24 Years | 78 (3.8%) | $40,962 |
| 25 to 44 Years | 804 (39.1%) | $60,318 |
| 45 to 64 Years | 671 (32.6%) | $71,875 |
| 65+ Years | 506 (24.6%) | $51,731 |
| Total | 2,059 (100.0%) | $60,354 |
Poverty in Desloge
Income Below Poverty by Sex and Age in Desloge
With 18.7% poverty level for males and 12.8% for females among the residents of Desloge, 12 to 14 year old males and 15 year old females are the most vulnerable to poverty, with 21 males (53.8%) and 20 females (100.0%) in their respective age groups living below the poverty level.
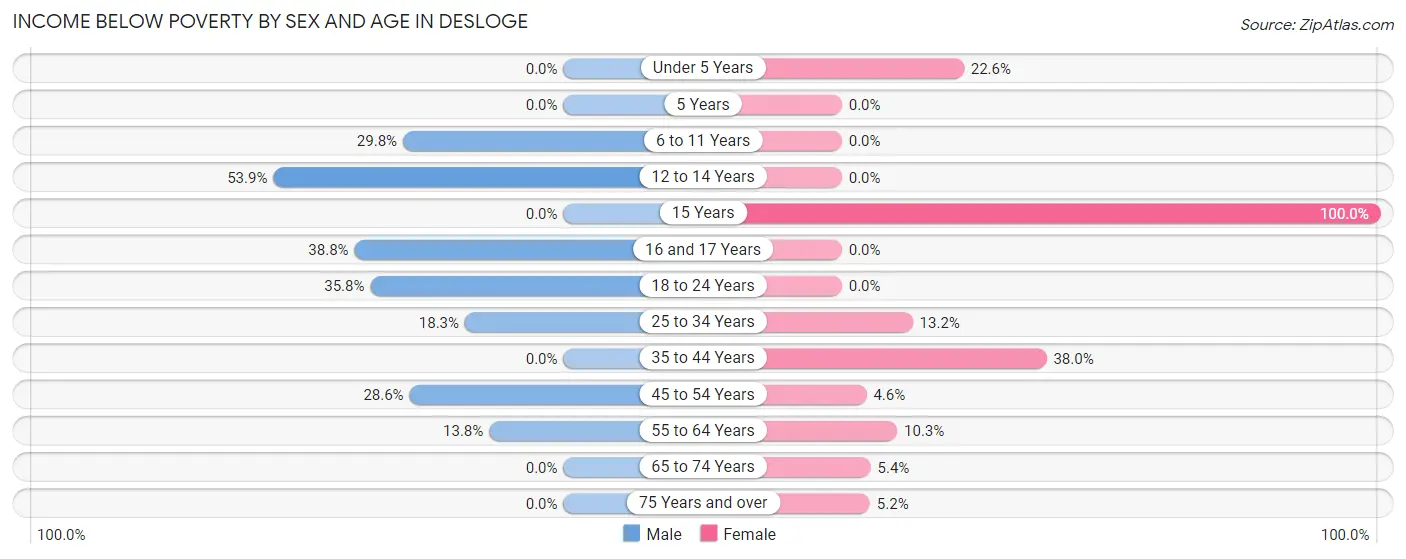
| Age Bracket | Male | Female |
| Under 5 Years | 0 (0.0%) | 36 (22.6%) |
| 5 Years | 0 (0.0%) | 0 (0.0%) |
| 6 to 11 Years | 134 (29.8%) | 0 (0.0%) |
| 12 to 14 Years | 21 (53.8%) | 0 (0.0%) |
| 15 Years | 0 (0.0%) | 20 (100.0%) |
| 16 and 17 Years | 19 (38.8%) | 0 (0.0%) |
| 18 to 24 Years | 43 (35.8%) | 0 (0.0%) |
| 25 to 34 Years | 119 (18.3%) | 66 (13.2%) |
| 35 to 44 Years | 0 (0.0%) | 117 (38.0%) |
| 45 to 54 Years | 94 (28.6%) | 12 (4.6%) |
| 55 to 64 Years | 27 (13.8%) | 23 (10.3%) |
| 65 to 74 Years | 0 (0.0%) | 16 (5.3%) |
| 75 Years and over | 0 (0.0%) | 12 (5.2%) |
| Total | 457 (18.7%) | 302 (12.8%) |
Income Above Poverty by Sex and Age in Desloge
According to the poverty statistics in Desloge, males aged 5 years and females aged 6 to 11 years are the age groups that are most secure financially, with 100.0% of males and 100.0% of females in these age groups living above the poverty line.
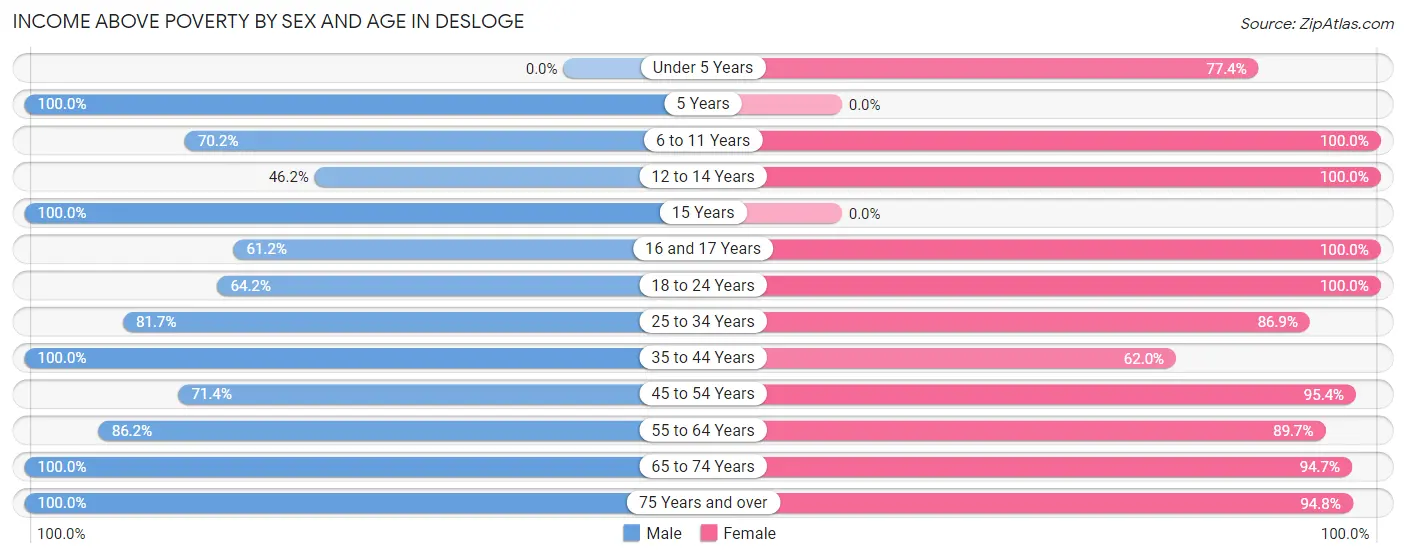
| Age Bracket | Male | Female |
| Under 5 Years | 0 (0.0%) | 123 (77.4%) |
| 5 Years | 15 (100.0%) | 0 (0.0%) |
| 6 to 11 Years | 316 (70.2%) | 89 (100.0%) |
| 12 to 14 Years | 18 (46.2%) | 47 (100.0%) |
| 15 Years | 34 (100.0%) | 0 (0.0%) |
| 16 and 17 Years | 30 (61.2%) | 107 (100.0%) |
| 18 to 24 Years | 77 (64.2%) | 105 (100.0%) |
| 25 to 34 Years | 532 (81.7%) | 436 (86.9%) |
| 35 to 44 Years | 245 (100.0%) | 191 (62.0%) |
| 45 to 54 Years | 235 (71.4%) | 250 (95.4%) |
| 55 to 64 Years | 169 (86.2%) | 201 (89.7%) |
| 65 to 74 Years | 198 (100.0%) | 283 (94.7%) |
| 75 Years and over | 122 (100.0%) | 218 (94.8%) |
| Total | 1,991 (81.3%) | 2,050 (87.2%) |
Income Below Poverty Among Married-Couple Families in Desloge
The poverty statistics for married-couple families in Desloge show that 5.8% or 64 of the total 1,108 families live below the poverty line. Families with 1 or 2 children have the highest poverty rate of 10.4%, comprising of 54 families. On the other hand, families with 3 or 4 children have the lowest poverty rate of 0.0%, which includes 0 families.
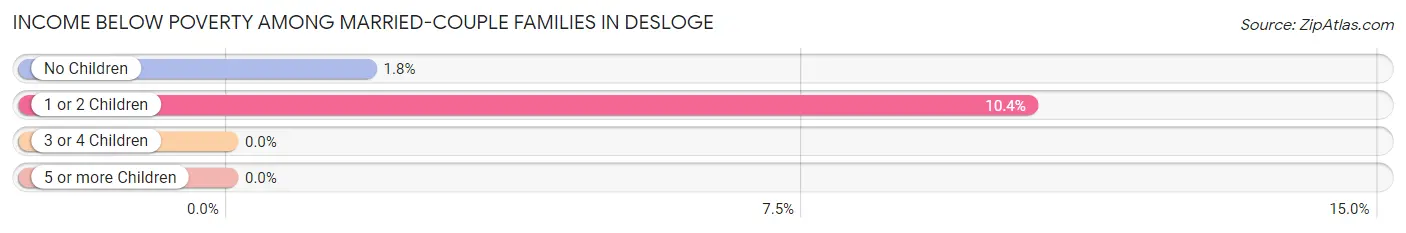
| Children | Above Poverty | Below Poverty |
| No Children | 541 (98.2%) | 10 (1.8%) |
| 1 or 2 Children | 463 (89.6%) | 54 (10.4%) |
| 3 or 4 Children | 40 (100.0%) | 0 (0.0%) |
| 5 or more Children | 0 (0.0%) | 0 (0.0%) |
| Total | 1,044 (94.2%) | 64 (5.8%) |
Income Below Poverty Among Single-Parent Households in Desloge
According to the poverty data in Desloge, 43.6% or 58 single-father households and 34.0% or 66 single-mother households are living below the poverty line. Among single-father households, those with no children have the highest poverty rate, with 40 households (51.9%) experiencing poverty. Likewise, among single-mother households, those with 1 or 2 children have the highest poverty rate, with 66 households (66.0%) falling below the poverty line.
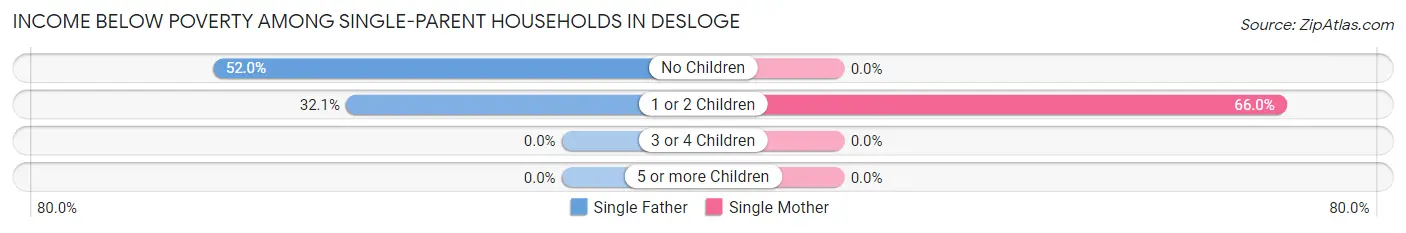
| Children | Single Father | Single Mother |
| No Children | 40 (51.9%) | 0 (0.0%) |
| 1 or 2 Children | 18 (32.1%) | 66 (66.0%) |
| 3 or 4 Children | 0 (0.0%) | 0 (0.0%) |
| 5 or more Children | 0 (0.0%) | 0 (0.0%) |
| Total | 58 (43.6%) | 66 (34.0%) |
Income Below Poverty Among Married-Couple vs Single-Parent Households in Desloge
The poverty data for Desloge shows that 64 of the married-couple family households (5.8%) and 124 of the single-parent households (37.9%) are living below the poverty level. Within the married-couple family households, those with 1 or 2 children have the highest poverty rate, with 54 households (10.4%) falling below the poverty line. Among the single-parent households, those with 1 or 2 children have the highest poverty rate, with 84 household (53.8%) living below poverty.
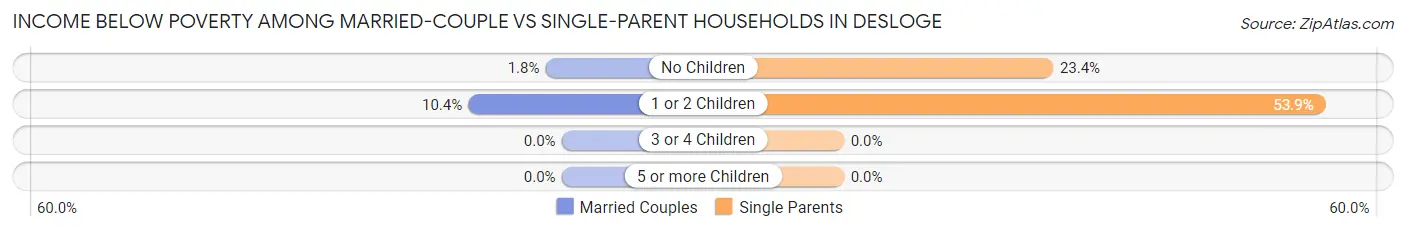
| Children | Married-Couple Families | Single-Parent Households |
| No Children | 10 (1.8%) | 40 (23.4%) |
| 1 or 2 Children | 54 (10.4%) | 84 (53.8%) |
| 3 or 4 Children | 0 (0.0%) | 0 (0.0%) |
| 5 or more Children | 0 (0.0%) | 0 (0.0%) |
| Total | 64 (5.8%) | 124 (37.9%) |
Race in Desloge
The most populous races in Desloge are White / Caucasian (4,712 | 96.7%), Two or more Races (148 | 3.0%), and Hispanic or Latino (73 | 1.5%).
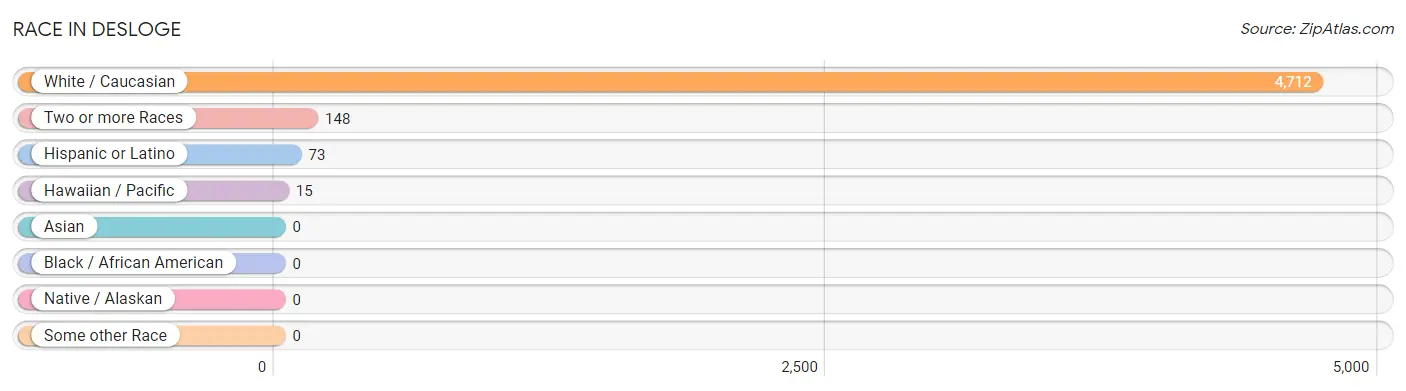
| Race | # Population | % Population |
| Asian | 0 | 0.0% |
| Black / African American | 0 | 0.0% |
| Hawaiian / Pacific | 15 | 0.3% |
| Hispanic or Latino | 73 | 1.5% |
| Native / Alaskan | 0 | 0.0% |
| White / Caucasian | 4,712 | 96.7% |
| Two or more Races | 148 | 3.0% |
| Some other Race | 0 | 0.0% |
| Total | 4,875 | 100.0% |
Ancestry in Desloge
The most populous ancestries reported in Desloge are American (1,510 | 31.0%), English (489 | 10.0%), German (468 | 9.6%), Irish (268 | 5.5%), and Italian (131 | 2.7%), together accounting for 58.8% of all Desloge residents.
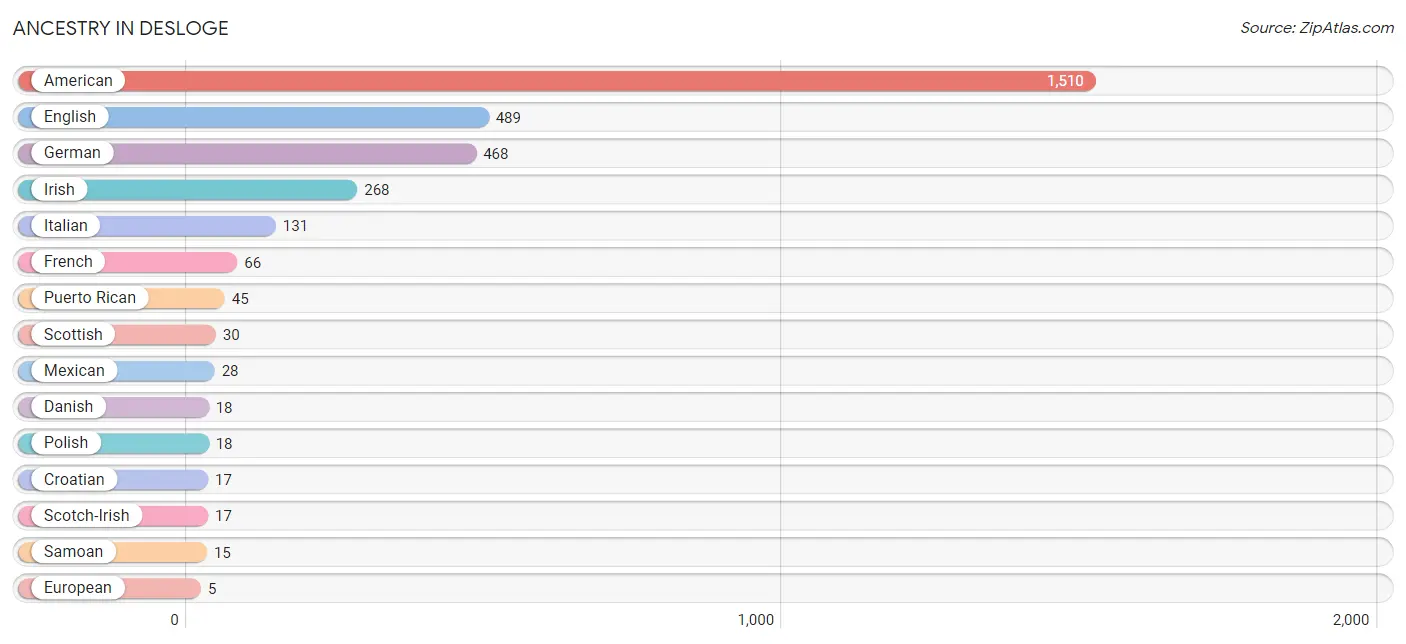
| Ancestry | # Population | % Population |
| American | 1,510 | 31.0% |
| Croatian | 17 | 0.4% |
| Danish | 18 | 0.4% |
| English | 489 | 10.0% |
| European | 5 | 0.1% |
| French | 66 | 1.3% |
| German | 468 | 9.6% |
| Irish | 268 | 5.5% |
| Italian | 131 | 2.7% |
| Mexican | 28 | 0.6% |
| Polish | 18 | 0.4% |
| Puerto Rican | 45 | 0.9% |
| Samoan | 15 | 0.3% |
| Scotch-Irish | 17 | 0.4% |
| Scottish | 30 | 0.6% | View All 15 Rows |
Immigrants in Desloge

| Immigration Origin | # Population | % Population | View All 0 Rows |
Sex and Age in Desloge
Sex and Age in Desloge
The most populous age groups in Desloge are 30 to 34 Years (347 | 14.0%) for men and 30 to 34 Years (352 | 14.7%) for women.
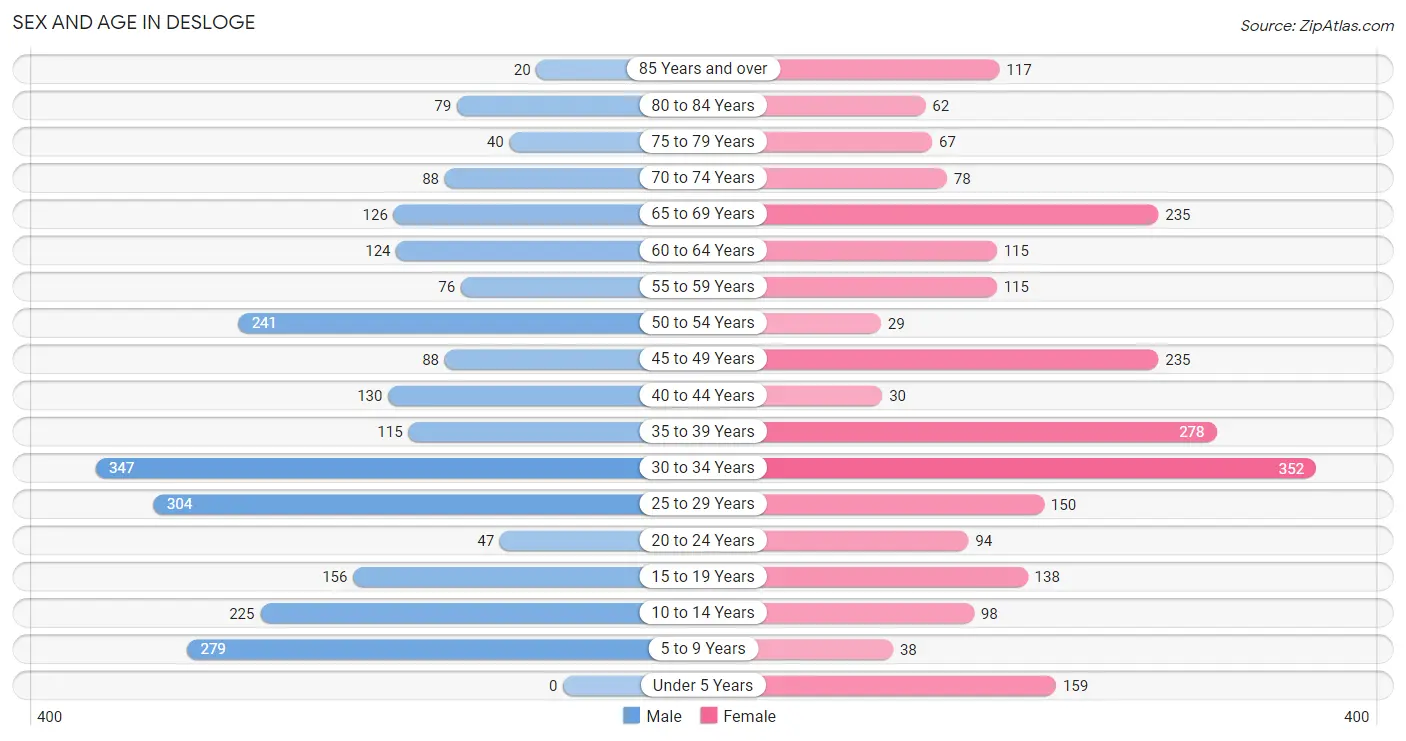
| Age Bracket | Male | Female |
| Under 5 Years | 0 (0.0%) | 159 (6.7%) |
| 5 to 9 Years | 279 (11.2%) | 38 (1.6%) |
| 10 to 14 Years | 225 (9.0%) | 98 (4.1%) |
| 15 to 19 Years | 156 (6.3%) | 138 (5.8%) |
| 20 to 24 Years | 47 (1.9%) | 94 (3.9%) |
| 25 to 29 Years | 304 (12.2%) | 150 (6.3%) |
| 30 to 34 Years | 347 (14.0%) | 352 (14.7%) |
| 35 to 39 Years | 115 (4.6%) | 278 (11.6%) |
| 40 to 44 Years | 130 (5.2%) | 30 (1.3%) |
| 45 to 49 Years | 88 (3.5%) | 235 (9.8%) |
| 50 to 54 Years | 241 (9.7%) | 29 (1.2%) |
| 55 to 59 Years | 76 (3.1%) | 115 (4.8%) |
| 60 to 64 Years | 124 (5.0%) | 115 (4.8%) |
| 65 to 69 Years | 126 (5.1%) | 235 (9.8%) |
| 70 to 74 Years | 88 (3.5%) | 78 (3.3%) |
| 75 to 79 Years | 40 (1.6%) | 67 (2.8%) |
| 80 to 84 Years | 79 (3.2%) | 62 (2.6%) |
| 85 Years and over | 20 (0.8%) | 117 (4.9%) |
| Total | 2,485 (100.0%) | 2,390 (100.0%) |
Families and Households in Desloge
Median Family Size in Desloge
The median family size in Desloge is 2.73 persons per family, with single male/father families (133 | 9.3%) accounting for the largest median family size of 2.79 persons per family. On the other hand, single female/mother families (194 | 13.5%) represent the smallest median family size with 2.43 persons per family.
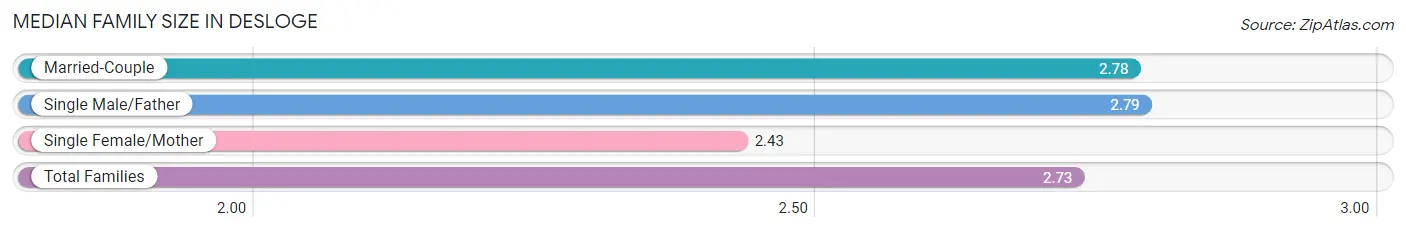
| Family Type | # Families | Family Size |
| Married-Couple | 1,108 (77.2%) | 2.78 |
| Single Male/Father | 133 (9.3%) | 2.79 |
| Single Female/Mother | 194 (13.5%) | 2.43 |
| Total Families | 1,435 (100.0%) | 2.73 |
Median Household Size in Desloge
The median household size in Desloge is 2.33 persons per household, with single male/father households (133 | 6.5%) accounting for the largest median household size of 3.76 persons per household. non-family households (624 | 30.3%) represent the smallest median household size with 1.10 persons per household.
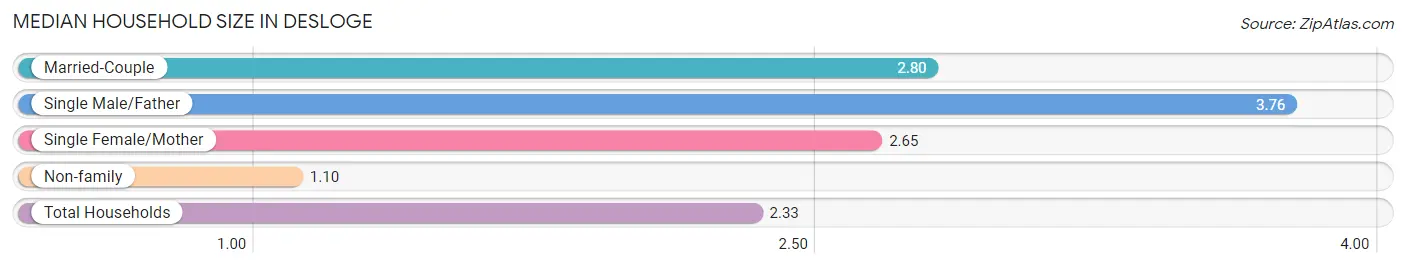
| Household Type | # Households | Household Size |
| Married-Couple | 1,108 (53.8%) | 2.80 |
| Single Male/Father | 133 (6.5%) | 3.76 |
| Single Female/Mother | 194 (9.4%) | 2.65 |
| Non-family | 624 (30.3%) | 1.10 |
| Total Households | 2,059 (100.0%) | 2.33 |
Household Size by Marriage Status in Desloge
Out of a total of 2,059 households in Desloge, 1,435 (69.7%) are family households, while 624 (30.3%) are nonfamily households. The most numerous type of family households are 2-person households, comprising 608, and the most common type of nonfamily households are 1-person households, comprising 557.
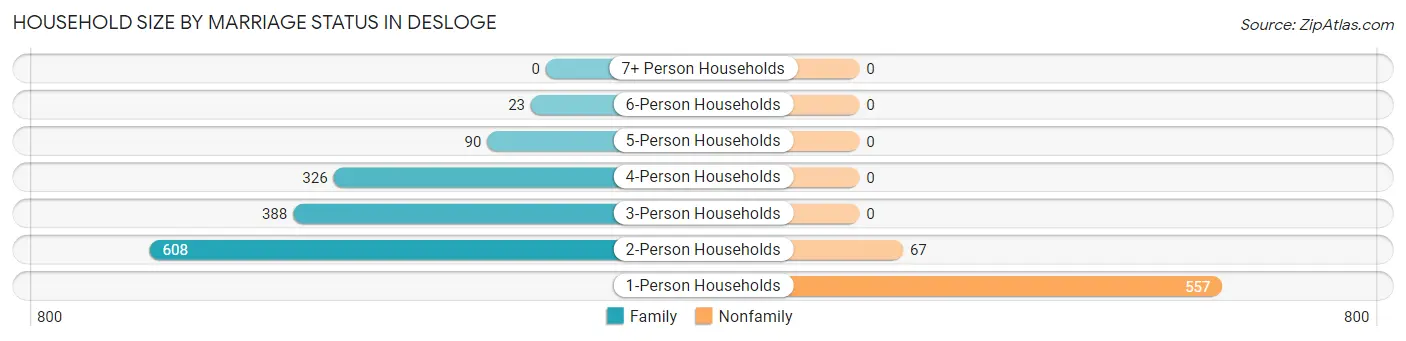
| Household Size | Family Households | Nonfamily Households |
| 1-Person Households | - | 557 (27.1%) |
| 2-Person Households | 608 (29.5%) | 67 (3.3%) |
| 3-Person Households | 388 (18.8%) | 0 (0.0%) |
| 4-Person Households | 326 (15.8%) | 0 (0.0%) |
| 5-Person Households | 90 (4.4%) | 0 (0.0%) |
| 6-Person Households | 23 (1.1%) | 0 (0.0%) |
| 7+ Person Households | 0 (0.0%) | 0 (0.0%) |
| Total | 1,435 (69.7%) | 624 (30.3%) |
Female Fertility in Desloge
Fertility by Age in Desloge
Average fertility rate in Desloge is 87.0 births per 1,000 women. Women in the age bracket of 35 to 50 years have the highest fertility rate with 142.0 births per 1,000 women. Women in the age bracket of 35 to 50 years acount for 69.9% of all women with births.
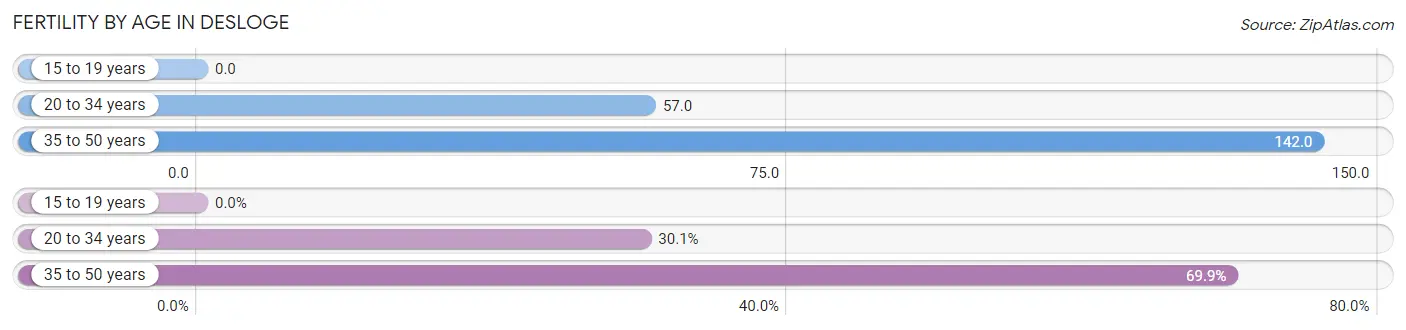
| Age Bracket | Women with Births | Births / 1,000 Women |
| 15 to 19 years | 0 (0.0%) | 0.0 |
| 20 to 34 years | 34 (30.1%) | 57.0 |
| 35 to 50 years | 79 (69.9%) | 142.0 |
| Total | 113 (100.0%) | 87.0 |
Fertility by Age by Marriage Status in Desloge
69.9% of women with births (113) in Desloge are married. The highest percentage of unmarried women with births falls into 20 to 34 years age bracket with 100.0% of them unmarried at the time of birth, while the lowest percentage of unmarried women with births belong to 35 to 50 years age bracket with 0.0% of them unmarried.
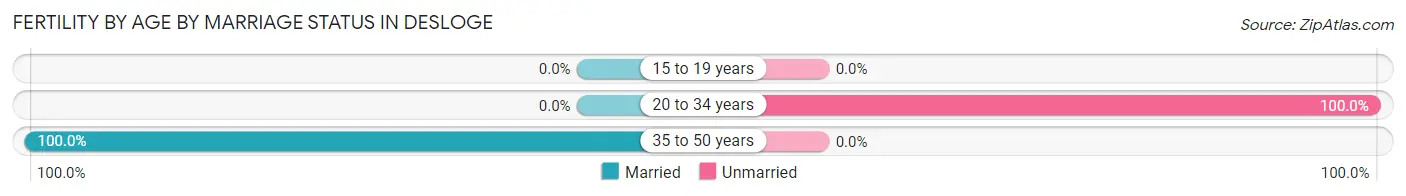
| Age Bracket | Married | Unmarried |
| 15 to 19 years | 0 (0.0%) | 0 (0.0%) |
| 20 to 34 years | 0 (0.0%) | 34 (100.0%) |
| 35 to 50 years | 79 (100.0%) | 0 (0.0%) |
| Total | 79 (69.9%) | 34 (30.1%) |
Fertility by Education in Desloge
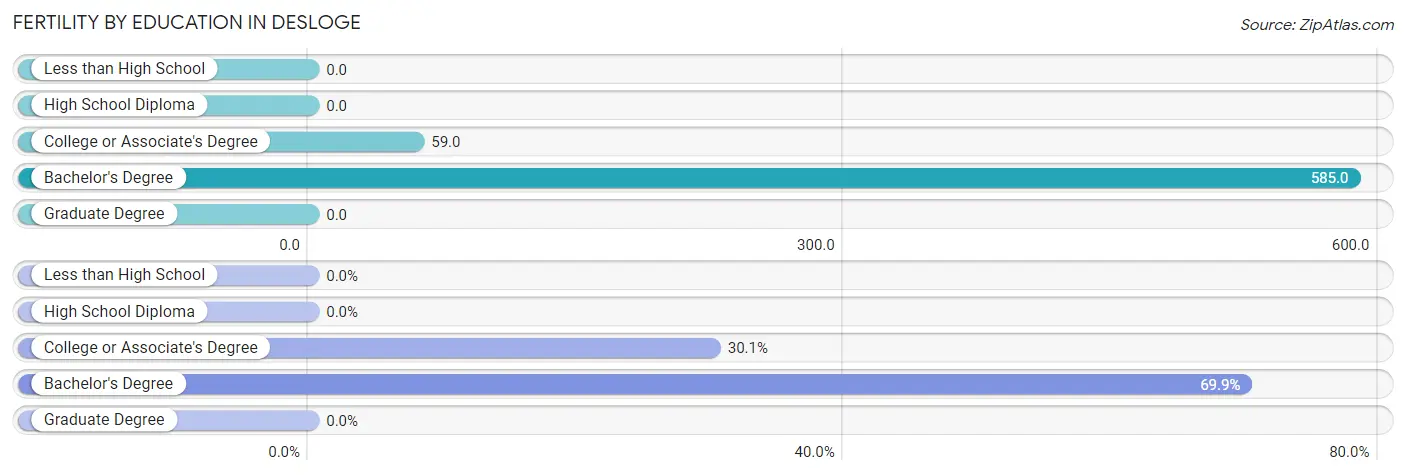
| Educational Attainment | Women with Births | Births / 1,000 Women |
| Less than High School | 0 (0.0%) | 0.0 |
| High School Diploma | 0 (0.0%) | 0.0 |
| College or Associate's Degree | 34 (30.1%) | 59.0 |
| Bachelor's Degree | 79 (69.9%) | 585.0 |
| Graduate Degree | 0 (0.0%) | 0.0 |
| Total | 113 (100.0%) | 87.0 |
Fertility by Education by Marriage Status in Desloge
30.1% of women with births in Desloge are unmarried. Women with the educational attainment of bachelor's degree are most likely to be married with 100.0% of them married at childbirth, while women with the educational attainment of college or associate's degree are least likely to be married with 100.0% of them unmarried at childbirth.
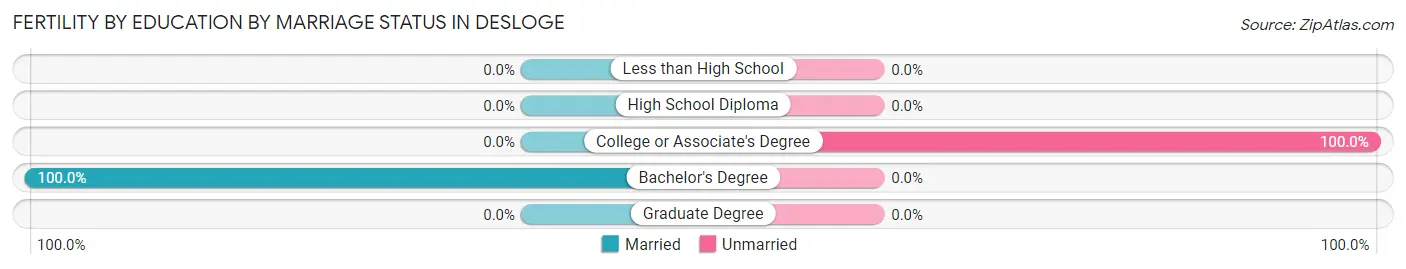
| Educational Attainment | Married | Unmarried |
| Less than High School | 0 (0.0%) | 0 (0.0%) |
| High School Diploma | 0 (0.0%) | 0 (0.0%) |
| College or Associate's Degree | 0 (0.0%) | 34 (100.0%) |
| Bachelor's Degree | 79 (100.0%) | 0 (0.0%) |
| Graduate Degree | 0 (0.0%) | 0 (0.0%) |
| Total | 79 (69.9%) | 34 (30.1%) |
Employment Characteristics in Desloge
Employment by Class of Employer in Desloge
Among the 2,449 employed individuals in Desloge, private company employees (1,634 | 66.7%), local government employees (346 | 14.1%), and not-for-profit organizations (153 | 6.2%) make up the most common classes of employment.
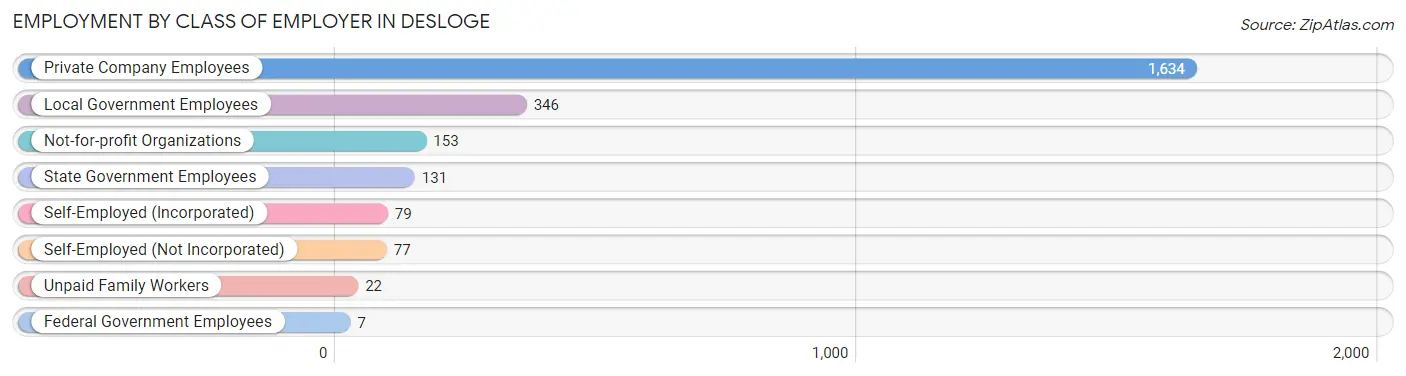
| Employer Class | # Employees | % Employees |
| Private Company Employees | 1,634 | 66.7% |
| Self-Employed (Incorporated) | 79 | 3.2% |
| Self-Employed (Not Incorporated) | 77 | 3.1% |
| Not-for-profit Organizations | 153 | 6.2% |
| Local Government Employees | 346 | 14.1% |
| State Government Employees | 131 | 5.3% |
| Federal Government Employees | 7 | 0.3% |
| Unpaid Family Workers | 22 | 0.9% |
| Total | 2,449 | 100.0% |
Employment Status by Age in Desloge
According to the labor force statistics for Desloge, out of the total population over 16 years of age (4,022), 66.0% or 2,655 individuals are in the labor force, with 7.3% or 194 of them unemployed. The age group with the highest labor force participation rate is 30 to 34 years, with 93.6% or 654 individuals in the labor force. Within the labor force, the 60 to 64 years age range has the highest percentage of unemployed individuals, with 17.3% or 23 of them being unemployed.
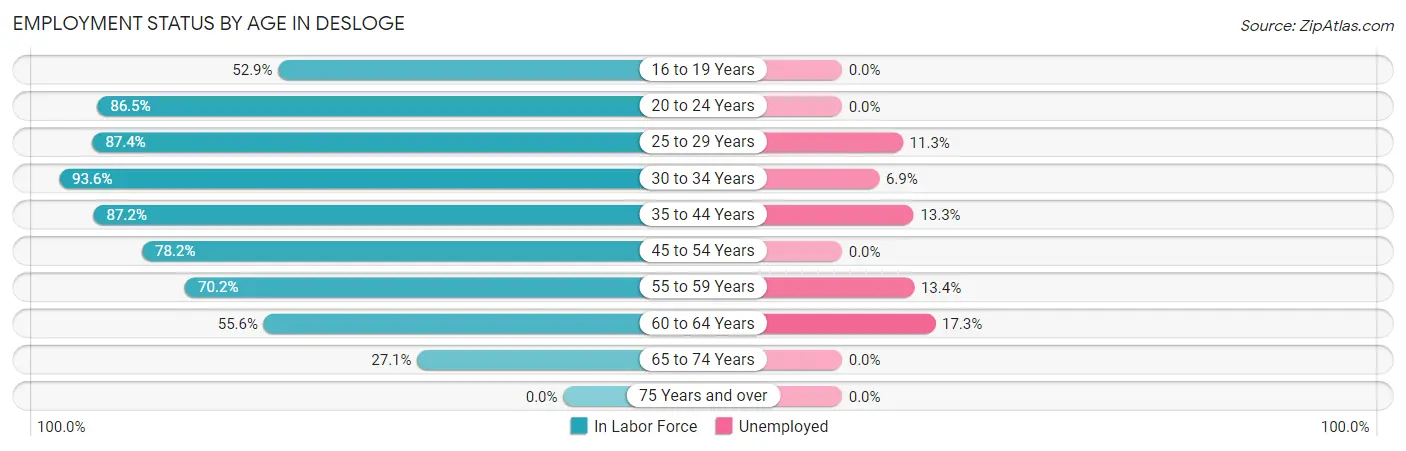
| Age Bracket | In Labor Force | Unemployed |
| 16 to 19 Years | 127 (52.9%) | 0 (0.0%) |
| 20 to 24 Years | 122 (86.5%) | 0 (0.0%) |
| 25 to 29 Years | 397 (87.4%) | 45 (11.3%) |
| 30 to 34 Years | 654 (93.6%) | 45 (6.9%) |
| 35 to 44 Years | 482 (87.2%) | 64 (13.3%) |
| 45 to 54 Years | 464 (78.2%) | 0 (0.0%) |
| 55 to 59 Years | 134 (70.2%) | 18 (13.4%) |
| 60 to 64 Years | 133 (55.6%) | 23 (17.3%) |
| 65 to 74 Years | 143 (27.1%) | 0 (0.0%) |
| 75 Years and over | 0 (0.0%) | 0 (0.0%) |
| Total | 2,655 (66.0%) | 194 (7.3%) |
Employment Status by Educational Attainment in Desloge
According to labor force statistics for Desloge, 83.0% of individuals (2,265) out of the total population between 25 and 64 years of age (2,729) are in the labor force, with 8.6% or 195 of them being unemployed. The group with the highest labor force participation rate are those with the educational attainment of bachelor's degree or higher, with 88.5% or 424 individuals in the labor force. Within the labor force, individuals with high school diploma education have the highest percentage of unemployment, with 17.7% or 132 of them being unemployed.
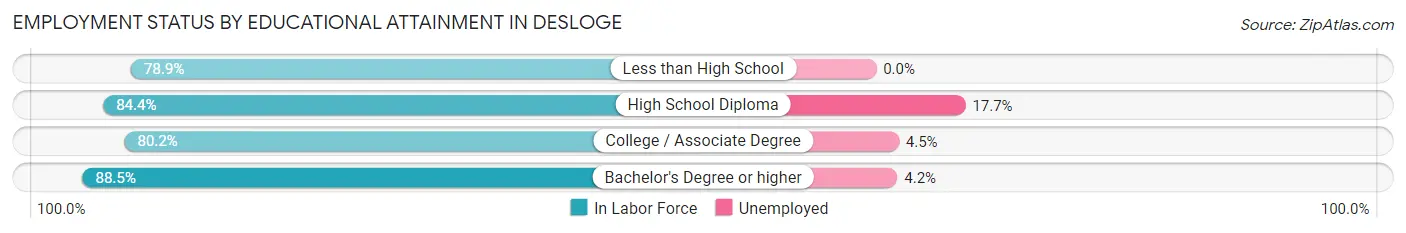
| Educational Attainment | In Labor Force | Unemployed |
| Less than High School | 90 (78.9%) | 0 (0.0%) |
| High School Diploma | 744 (84.4%) | 156 (17.7%) |
| College / Associate Degree | 1,006 (80.2%) | 56 (4.5%) |
| Bachelor's Degree or higher | 424 (88.5%) | 20 (4.2%) |
| Total | 2,265 (83.0%) | 235 (8.6%) |
Employment Occupations by Sex in Desloge
Management, Business, Science and Arts Occupations
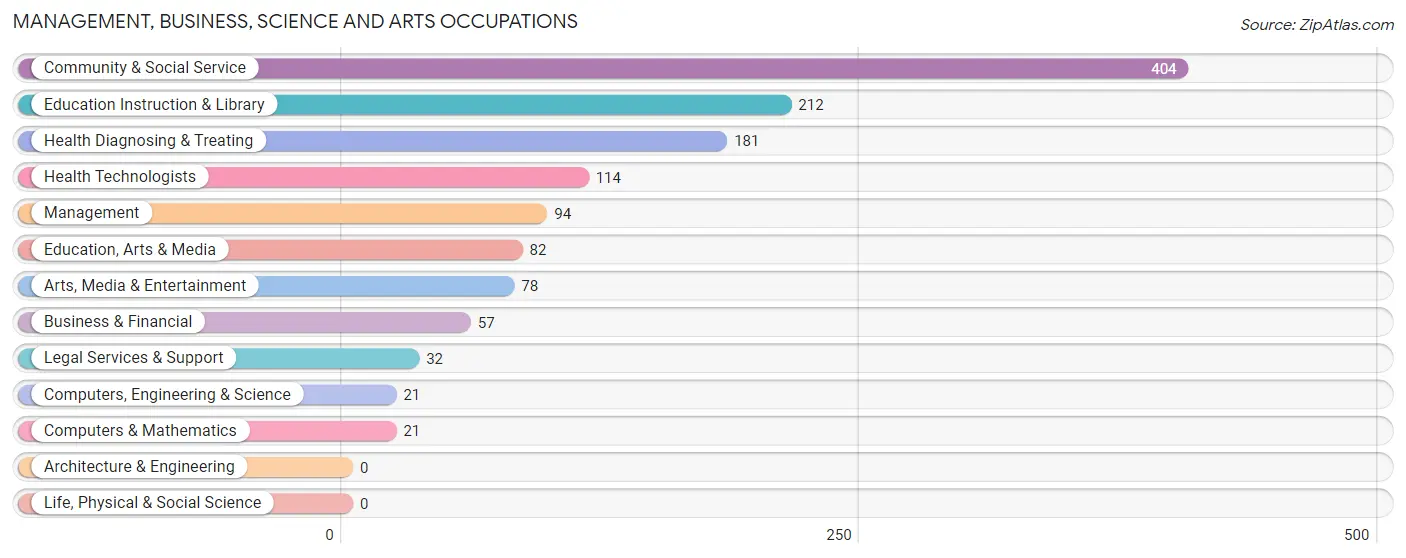
The most common Management, Business, Science and Arts occupations in Desloge are Community & Social Service (404 | 16.4%), Education Instruction & Library (212 | 8.6%), Health Diagnosing & Treating (181 | 7.3%), Health Technologists (114 | 4.6%), and Management (94 | 3.8%).
Management, Business, Science and Arts Occupations by Sex
Within the Management, Business, Science and Arts occupations in Desloge, the most male-oriented occupations are Business & Financial (73.7%), Arts, Media & Entertainment (67.9%), and Education Instruction & Library (59.0%), while the most female-oriented occupations are Computers, Engineering & Science (100.0%), Computers & Mathematics (100.0%), and Education, Arts & Media (100.0%).
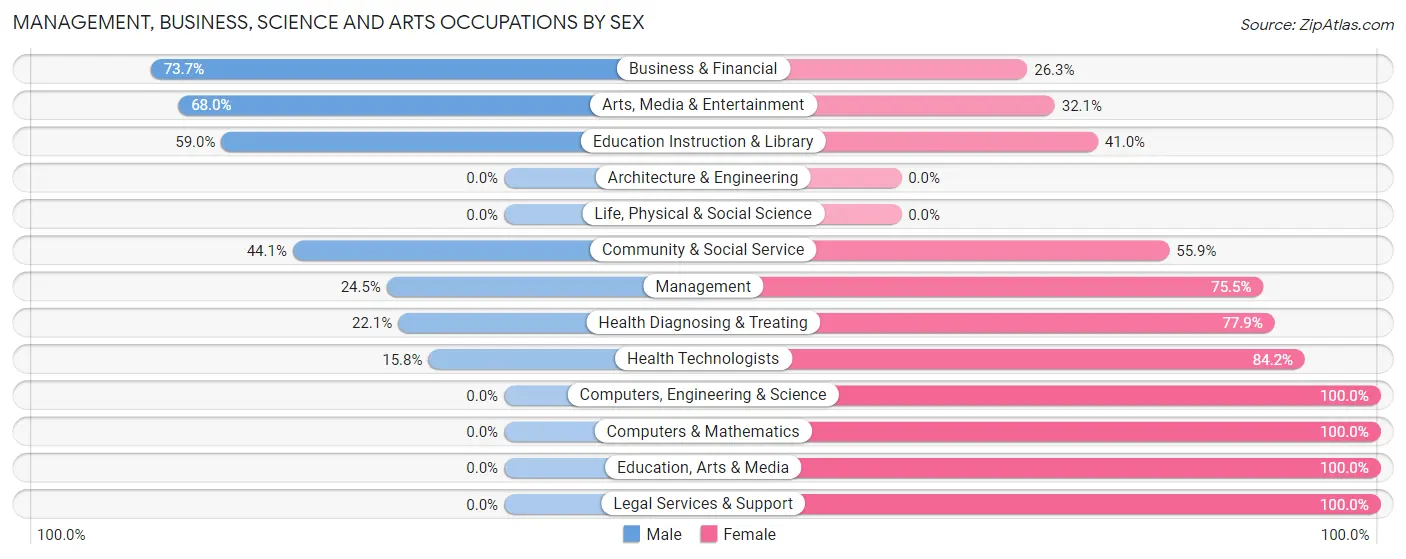
| Occupation | Male | Female |
| Management | 23 (24.5%) | 71 (75.5%) |
| Business & Financial | 42 (73.7%) | 15 (26.3%) |
| Computers, Engineering & Science | 0 (0.0%) | 21 (100.0%) |
| Computers & Mathematics | 0 (0.0%) | 21 (100.0%) |
| Architecture & Engineering | 0 (0.0%) | 0 (0.0%) |
| Life, Physical & Social Science | 0 (0.0%) | 0 (0.0%) |
| Community & Social Service | 178 (44.1%) | 226 (55.9%) |
| Education, Arts & Media | 0 (0.0%) | 82 (100.0%) |
| Legal Services & Support | 0 (0.0%) | 32 (100.0%) |
| Education Instruction & Library | 125 (59.0%) | 87 (41.0%) |
| Arts, Media & Entertainment | 53 (67.9%) | 25 (32.1%) |
| Health Diagnosing & Treating | 40 (22.1%) | 141 (77.9%) |
| Health Technologists | 18 (15.8%) | 96 (84.2%) |
| Total (Category) | 283 (37.4%) | 474 (62.6%) |
| Total (Overall) | 1,257 (51.1%) | 1,204 (48.9%) |
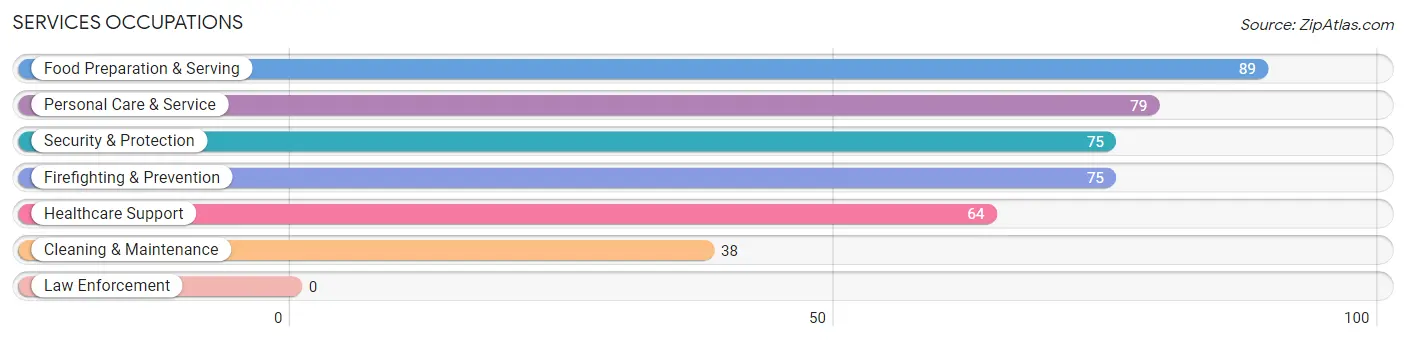
Services Occupations
The most common Services occupations in Desloge are Food Preparation & Serving (89 | 3.6%), Personal Care & Service (79 | 3.2%), Security & Protection (75 | 3.0%), Firefighting & Prevention (75 | 3.0%), and Healthcare Support (64 | 2.6%).
Services Occupations by Sex
Within the Services occupations in Desloge, the most male-oriented occupations are Cleaning & Maintenance (100.0%), Food Preparation & Serving (58.4%), and Healthcare Support (26.6%), while the most female-oriented occupations are Personal Care & Service (100.0%), Security & Protection (78.7%), and Firefighting & Prevention (78.7%).
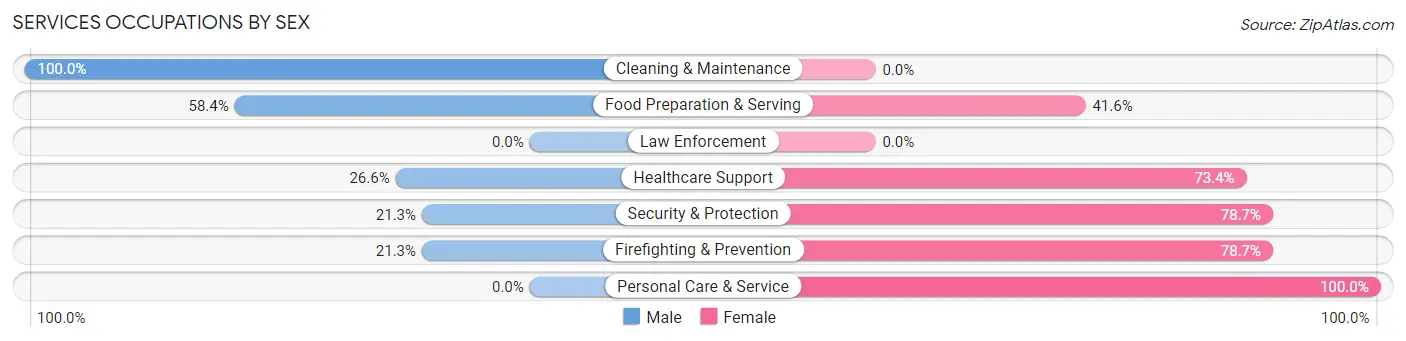
| Occupation | Male | Female |
| Healthcare Support | 17 (26.6%) | 47 (73.4%) |
| Security & Protection | 16 (21.3%) | 59 (78.7%) |
| Firefighting & Prevention | 16 (21.3%) | 59 (78.7%) |
| Law Enforcement | 0 (0.0%) | 0 (0.0%) |
| Food Preparation & Serving | 52 (58.4%) | 37 (41.6%) |
| Cleaning & Maintenance | 38 (100.0%) | 0 (0.0%) |
| Personal Care & Service | 0 (0.0%) | 79 (100.0%) |
| Total (Category) | 123 (35.6%) | 222 (64.3%) |
| Total (Overall) | 1,257 (51.1%) | 1,204 (48.9%) |
Sales and Office Occupations
The most common Sales and Office occupations in Desloge are Sales & Related (643 | 26.1%), and Office & Administration (238 | 9.7%).

Sales and Office Occupations by Sex

| Occupation | Male | Female |
| Sales & Related | 421 (65.5%) | 222 (34.5%) |
| Office & Administration | 25 (10.5%) | 213 (89.5%) |
| Total (Category) | 446 (50.6%) | 435 (49.4%) |
| Total (Overall) | 1,257 (51.1%) | 1,204 (48.9%) |
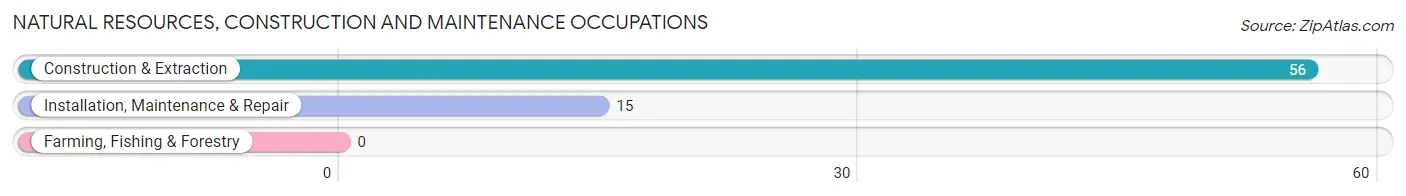
Natural Resources, Construction and Maintenance Occupations
The most common Natural Resources, Construction and Maintenance occupations in Desloge are Construction & Extraction (56 | 2.3%), and Installation, Maintenance & Repair (15 | 0.6%).
Natural Resources, Construction and Maintenance Occupations by Sex

| Occupation | Male | Female |
| Farming, Fishing & Forestry | 0 (0.0%) | 0 (0.0%) |
| Construction & Extraction | 56 (100.0%) | 0 (0.0%) |
| Installation, Maintenance & Repair | 15 (100.0%) | 0 (0.0%) |
| Total (Category) | 71 (100.0%) | 0 (0.0%) |
| Total (Overall) | 1,257 (51.1%) | 1,204 (48.9%) |
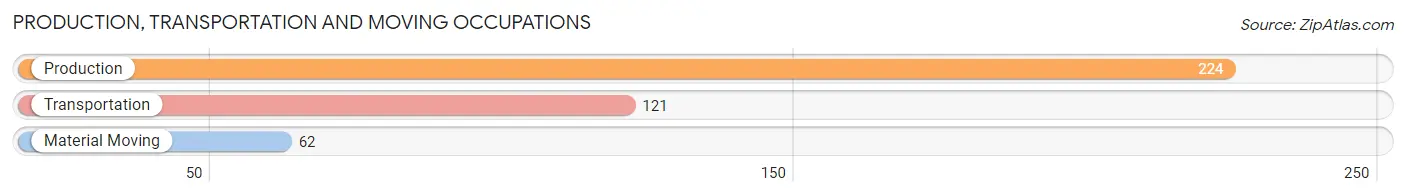
Production, Transportation and Moving Occupations
The most common Production, Transportation and Moving occupations in Desloge are Production (224 | 9.1%), Transportation (121 | 4.9%), and Material Moving (62 | 2.5%).
Production, Transportation and Moving Occupations by Sex
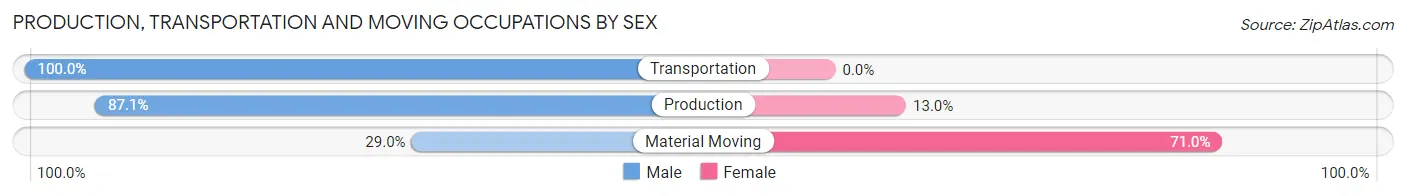
| Occupation | Male | Female |
| Production | 195 (87.1%) | 29 (13.0%) |
| Transportation | 121 (100.0%) | 0 (0.0%) |
| Material Moving | 18 (29.0%) | 44 (71.0%) |
| Total (Category) | 334 (82.1%) | 73 (17.9%) |
| Total (Overall) | 1,257 (51.1%) | 1,204 (48.9%) |
Employment Industries by Sex in Desloge
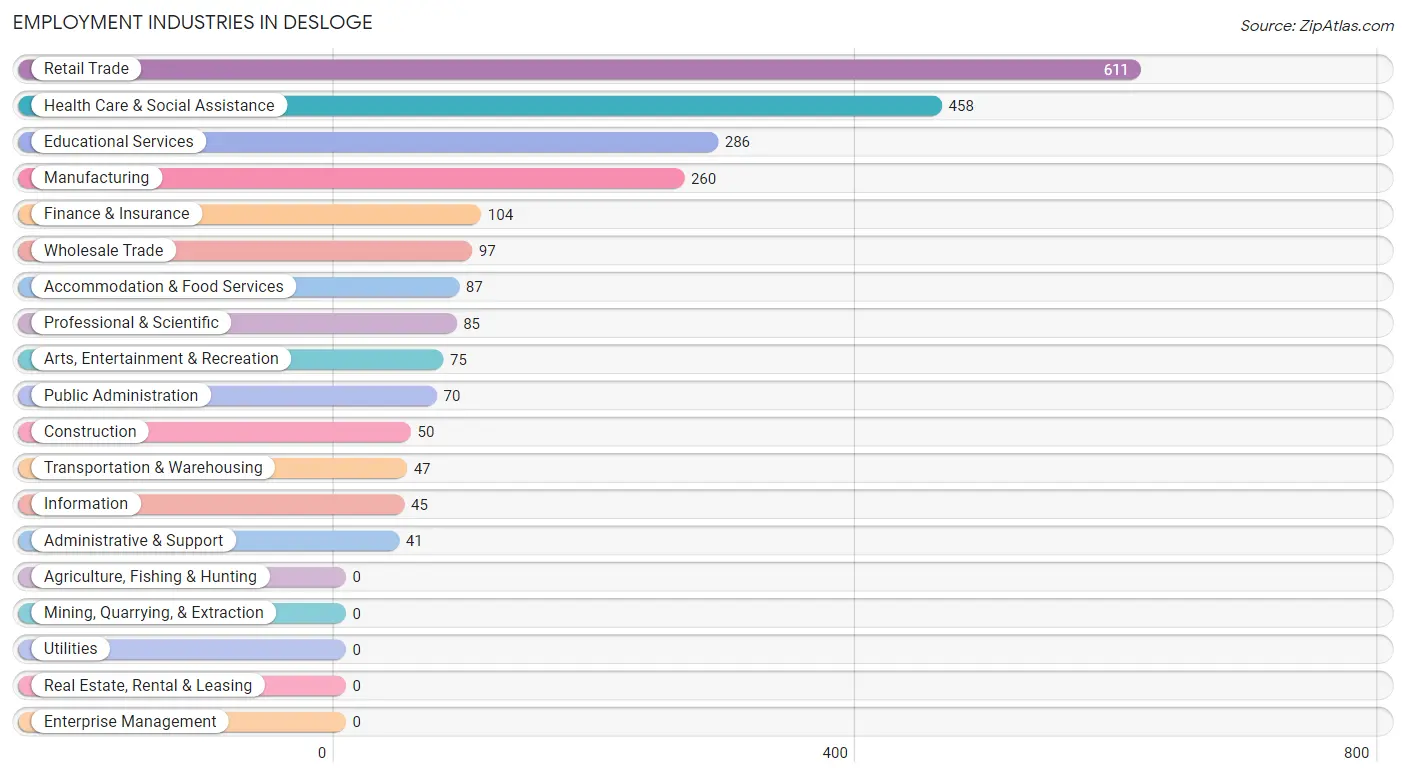
Employment Industries in Desloge
The major employment industries in Desloge include Retail Trade (611 | 24.8%), Health Care & Social Assistance (458 | 18.6%), Educational Services (286 | 11.6%), Manufacturing (260 | 10.6%), and Finance & Insurance (104 | 4.2%).
Employment Industries by Sex in Desloge
The Desloge industries that see more men than women are Construction (100.0%), Transportation & Warehousing (100.0%), and Information (100.0%), whereas the industries that tend to have a higher number of women are Professional & Scientific (100.0%), Administrative & Support (100.0%), and Health Care & Social Assistance (89.1%).
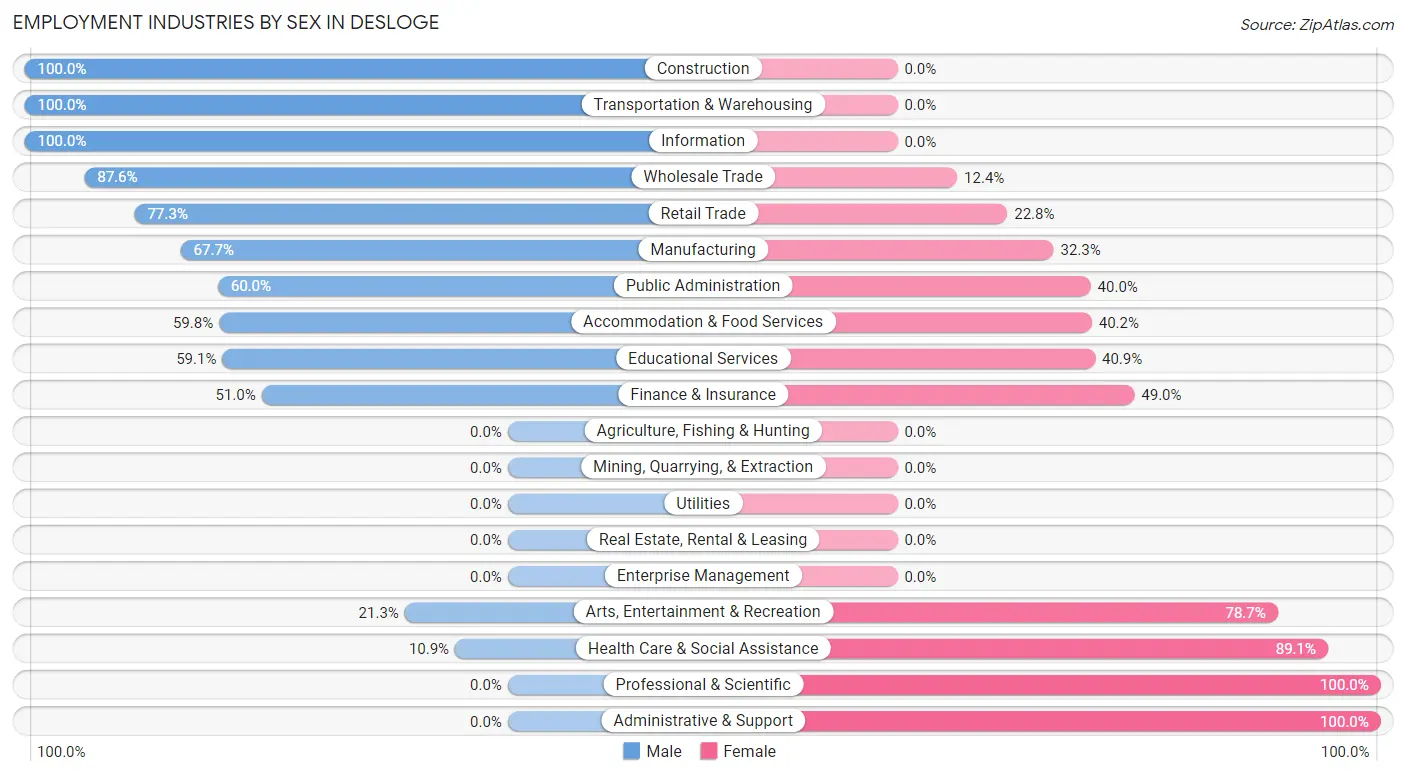
| Industry | Male | Female |
| Agriculture, Fishing & Hunting | 0 (0.0%) | 0 (0.0%) |
| Mining, Quarrying, & Extraction | 0 (0.0%) | 0 (0.0%) |
| Construction | 50 (100.0%) | 0 (0.0%) |
| Manufacturing | 176 (67.7%) | 84 (32.3%) |
| Wholesale Trade | 85 (87.6%) | 12 (12.4%) |
| Retail Trade | 472 (77.2%) | 139 (22.8%) |
| Transportation & Warehousing | 47 (100.0%) | 0 (0.0%) |
| Utilities | 0 (0.0%) | 0 (0.0%) |
| Information | 45 (100.0%) | 0 (0.0%) |
| Finance & Insurance | 53 (51.0%) | 51 (49.0%) |
| Real Estate, Rental & Leasing | 0 (0.0%) | 0 (0.0%) |
| Professional & Scientific | 0 (0.0%) | 85 (100.0%) |
| Enterprise Management | 0 (0.0%) | 0 (0.0%) |
| Administrative & Support | 0 (0.0%) | 41 (100.0%) |
| Educational Services | 169 (59.1%) | 117 (40.9%) |
| Health Care & Social Assistance | 50 (10.9%) | 408 (89.1%) |
| Arts, Entertainment & Recreation | 16 (21.3%) | 59 (78.7%) |
| Accommodation & Food Services | 52 (59.8%) | 35 (40.2%) |
| Public Administration | 42 (60.0%) | 28 (40.0%) |
| Total | 1,257 (51.1%) | 1,204 (48.9%) |
Education in Desloge
School Enrollment in Desloge
The most common levels of schooling among the 975 students in Desloge are middle school (332 | 34.1%), elementary school (272 | 27.9%), and high school (245 | 25.1%).
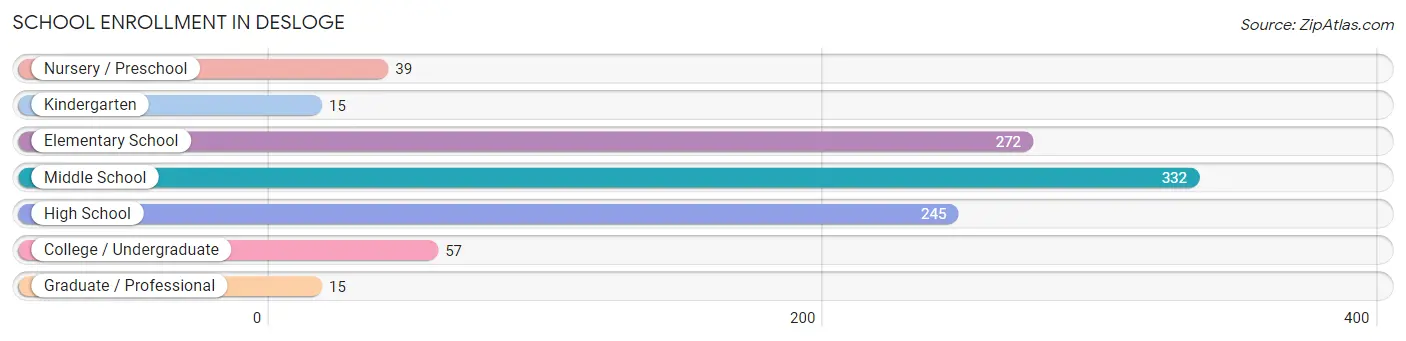
| School Level | # Students | % Students |
| Nursery / Preschool | 39 | 4.0% |
| Kindergarten | 15 | 1.5% |
| Elementary School | 272 | 27.9% |
| Middle School | 332 | 34.1% |
| High School | 245 | 25.1% |
| College / Undergraduate | 57 | 5.9% |
| Graduate / Professional | 15 | 1.5% |
| Total | 975 | 100.0% |
School Enrollment by Age by Funding Source in Desloge
Out of a total of 975 students who are enrolled in schools in Desloge, 134 (13.7%) attend a private institution, while the remaining 841 (86.3%) are enrolled in public schools. The age group of 3 to 4 year olds has the highest likelihood of being enrolled in private schools, with 39 (100.0% in the age bracket) enrolled. Conversely, the age group of 15 to 17 year olds has the lowest likelihood of being enrolled in a private school, with 210 (100.0% in the age bracket) attending a public institution.
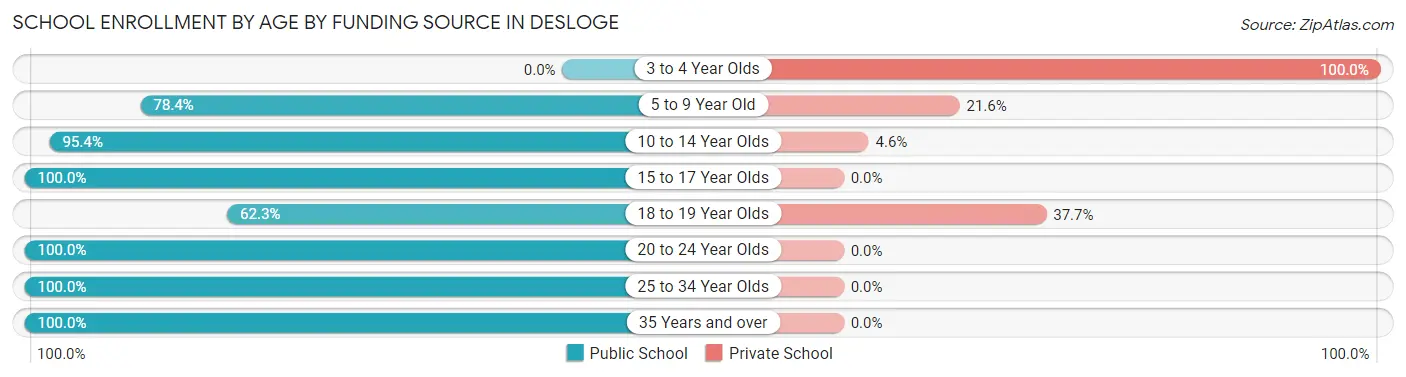
| Age Bracket | Public School | Private School |
| 3 to 4 Year Olds | 0 (0.0%) | 39 (100.0%) |
| 5 to 9 Year Old | 218 (78.4%) | 60 (21.6%) |
| 10 to 14 Year Olds | 308 (95.4%) | 15 (4.6%) |
| 15 to 17 Year Olds | 210 (100.0%) | 0 (0.0%) |
| 18 to 19 Year Olds | 33 (62.3%) | 20 (37.7%) |
| 20 to 24 Year Olds | 12 (100.0%) | 0 (0.0%) |
| 25 to 34 Year Olds | 24 (100.0%) | 0 (0.0%) |
| 35 Years and over | 36 (100.0%) | 0 (0.0%) |
| Total | 841 (86.3%) | 134 (13.7%) |
Educational Attainment by Field of Study in Desloge
Education (273 | 35.9%), arts & humanities (115 | 15.1%), liberal arts & history (65 | 8.6%), social sciences (50 | 6.6%), and business (48 | 6.3%) are the most common fields of study among 760 individuals in Desloge who have obtained a bachelor's degree or higher.
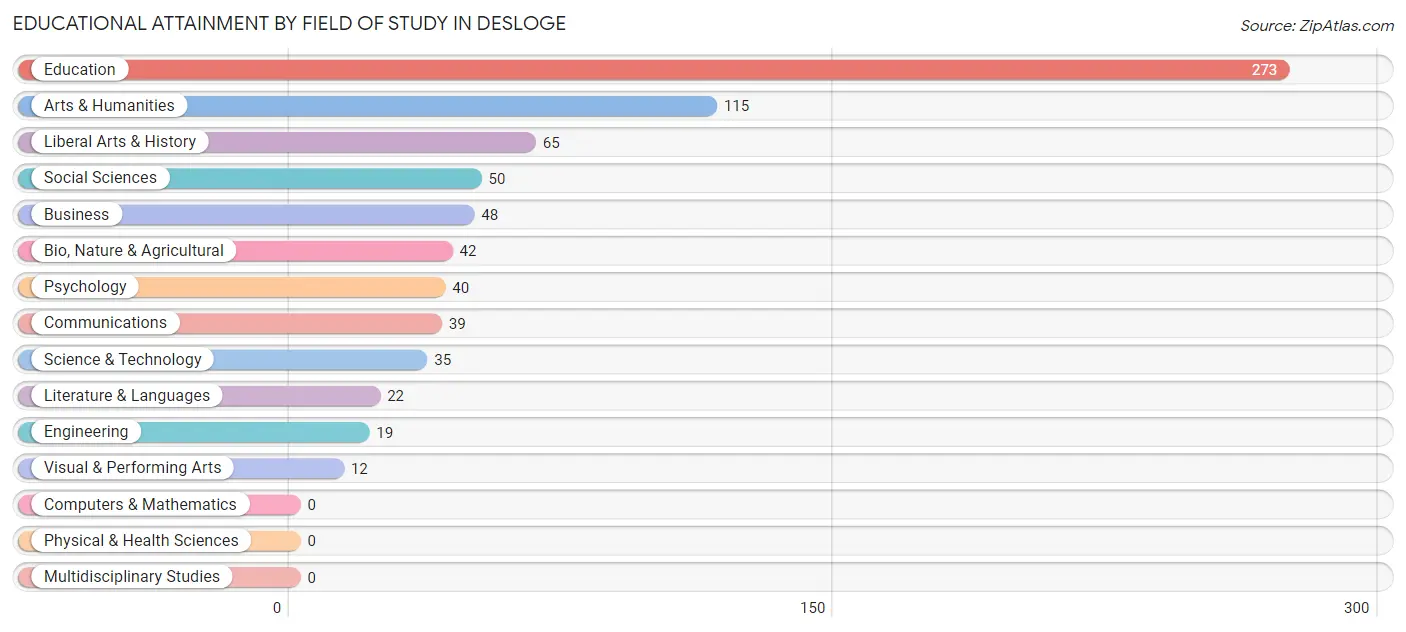
| Field of Study | # Graduates | % Graduates |
| Computers & Mathematics | 0 | 0.0% |
| Bio, Nature & Agricultural | 42 | 5.5% |
| Physical & Health Sciences | 0 | 0.0% |
| Psychology | 40 | 5.3% |
| Social Sciences | 50 | 6.6% |
| Engineering | 19 | 2.5% |
| Multidisciplinary Studies | 0 | 0.0% |
| Science & Technology | 35 | 4.6% |
| Business | 48 | 6.3% |
| Education | 273 | 35.9% |
| Literature & Languages | 22 | 2.9% |
| Liberal Arts & History | 65 | 8.6% |
| Visual & Performing Arts | 12 | 1.6% |
| Communications | 39 | 5.1% |
| Arts & Humanities | 115 | 15.1% |
| Total | 760 | 100.0% |
Transportation & Commute in Desloge
Vehicle Availability by Sex in Desloge
The most prevalent vehicle ownership categories in Desloge are males with 2 vehicles (442, accounting for 35.5%) and females with 2 vehicles (574, making up 36.7%).
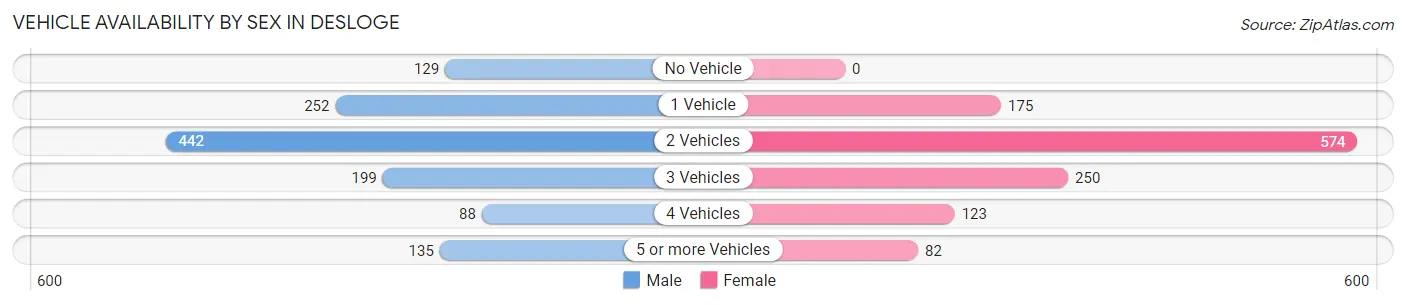
| Vehicles Available | Male | Female |
| No Vehicle | 129 (10.4%) | 0 (0.0%) |
| 1 Vehicle | 252 (20.2%) | 175 (14.5%) |
| 2 Vehicles | 442 (35.5%) | 574 (47.7%) |
| 3 Vehicles | 199 (16.0%) | 250 (20.8%) |
| 4 Vehicles | 88 (7.1%) | 123 (10.2%) |
| 5 or more Vehicles | 135 (10.8%) | 82 (6.8%) |
| Total | 1,245 (100.0%) | 1,204 (100.0%) |
Commute Time in Desloge
The most frequently occuring commute durations in Desloge are 5 to 9 minutes (537 commuters, 23.9%), 10 to 14 minutes (418 commuters, 18.6%), and 15 to 19 minutes (417 commuters, 18.6%).
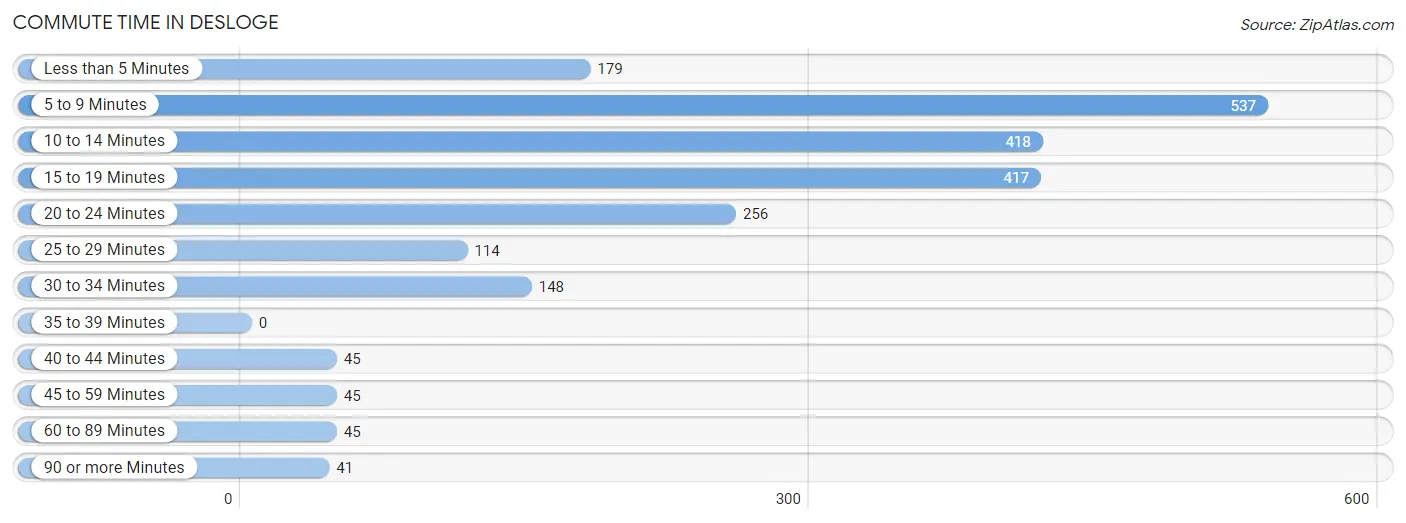
| Commute Time | # Commuters | % Commuters |
| Less than 5 Minutes | 179 | 8.0% |
| 5 to 9 Minutes | 537 | 23.9% |
| 10 to 14 Minutes | 418 | 18.6% |
| 15 to 19 Minutes | 417 | 18.6% |
| 20 to 24 Minutes | 256 | 11.4% |
| 25 to 29 Minutes | 114 | 5.1% |
| 30 to 34 Minutes | 148 | 6.6% |
| 35 to 39 Minutes | 0 | 0.0% |
| 40 to 44 Minutes | 45 | 2.0% |
| 45 to 59 Minutes | 45 | 2.0% |
| 60 to 89 Minutes | 45 | 2.0% |
| 90 or more Minutes | 41 | 1.8% |
Commute Time by Sex in Desloge
The most common commute times in Desloge are 5 to 9 minutes (386 commuters, 32.0%) for males and 10 to 14 minutes (257 commuters, 24.7%) for females.
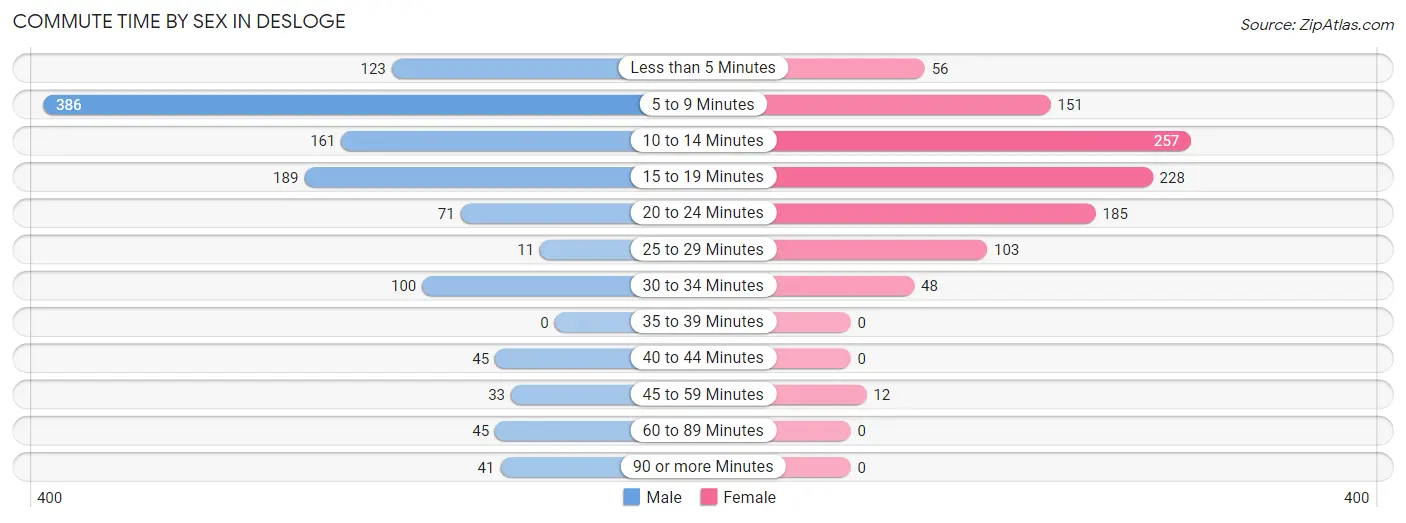
| Commute Time | Male | Female |
| Less than 5 Minutes | 123 (10.2%) | 56 (5.4%) |
| 5 to 9 Minutes | 386 (32.0%) | 151 (14.5%) |
| 10 to 14 Minutes | 161 (13.4%) | 257 (24.7%) |
| 15 to 19 Minutes | 189 (15.7%) | 228 (21.9%) |
| 20 to 24 Minutes | 71 (5.9%) | 185 (17.8%) |
| 25 to 29 Minutes | 11 (0.9%) | 103 (9.9%) |
| 30 to 34 Minutes | 100 (8.3%) | 48 (4.6%) |
| 35 to 39 Minutes | 0 (0.0%) | 0 (0.0%) |
| 40 to 44 Minutes | 45 (3.7%) | 0 (0.0%) |
| 45 to 59 Minutes | 33 (2.7%) | 12 (1.1%) |
| 60 to 89 Minutes | 45 (3.7%) | 0 (0.0%) |
| 90 or more Minutes | 41 (3.4%) | 0 (0.0%) |
Time of Departure to Work by Sex in Desloge
The most frequent times of departure to work in Desloge are 12:00 PM to 3:59 PM (267, 22.2%) for males and 7:00 AM to 7:29 AM (272, 26.2%) for females.
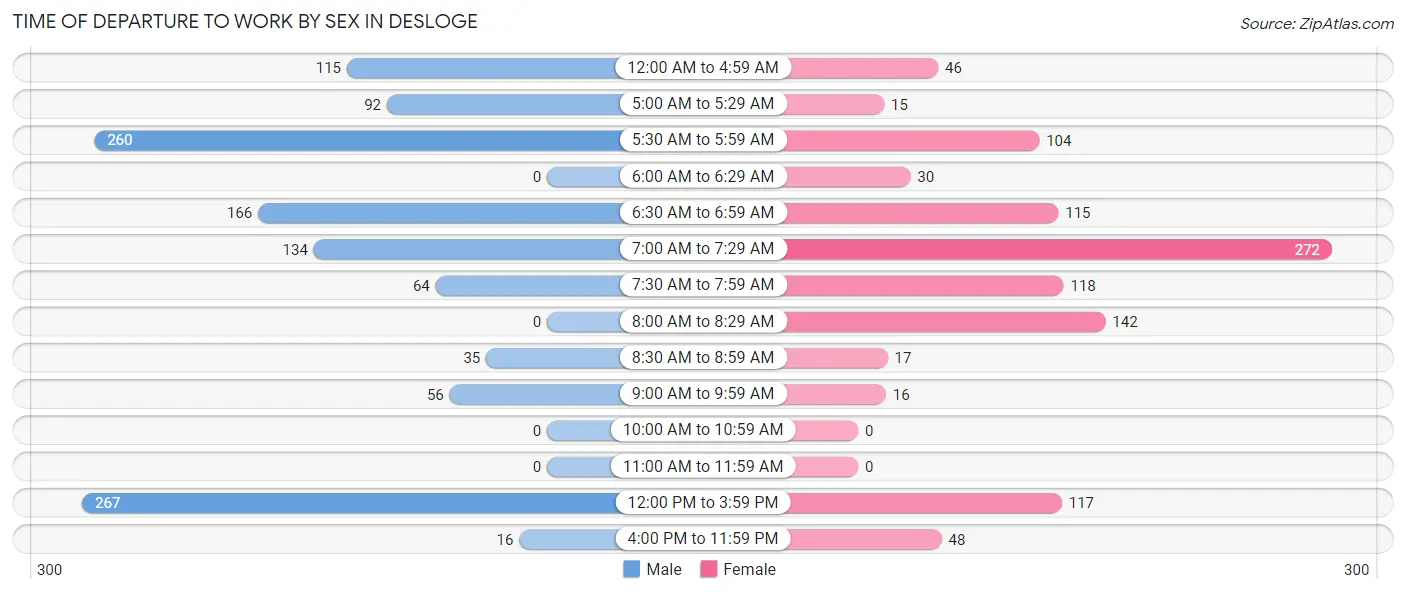
| Time of Departure | Male | Female |
| 12:00 AM to 4:59 AM | 115 (9.5%) | 46 (4.4%) |
| 5:00 AM to 5:29 AM | 92 (7.6%) | 15 (1.4%) |
| 5:30 AM to 5:59 AM | 260 (21.6%) | 104 (10.0%) |
| 6:00 AM to 6:29 AM | 0 (0.0%) | 30 (2.9%) |
| 6:30 AM to 6:59 AM | 166 (13.8%) | 115 (11.1%) |
| 7:00 AM to 7:29 AM | 134 (11.1%) | 272 (26.2%) |
| 7:30 AM to 7:59 AM | 64 (5.3%) | 118 (11.4%) |
| 8:00 AM to 8:29 AM | 0 (0.0%) | 142 (13.7%) |
| 8:30 AM to 8:59 AM | 35 (2.9%) | 17 (1.6%) |
| 9:00 AM to 9:59 AM | 56 (4.6%) | 16 (1.5%) |
| 10:00 AM to 10:59 AM | 0 (0.0%) | 0 (0.0%) |
| 11:00 AM to 11:59 AM | 0 (0.0%) | 0 (0.0%) |
| 12:00 PM to 3:59 PM | 267 (22.2%) | 117 (11.3%) |
| 4:00 PM to 11:59 PM | 16 (1.3%) | 48 (4.6%) |
| Total | 1,205 (100.0%) | 1,040 (100.0%) |
Housing Occupancy in Desloge
Occupancy by Ownership in Desloge
Of the total 2,059 dwellings in Desloge, owner-occupied units account for 1,446 (70.2%), while renter-occupied units make up 613 (29.8%).
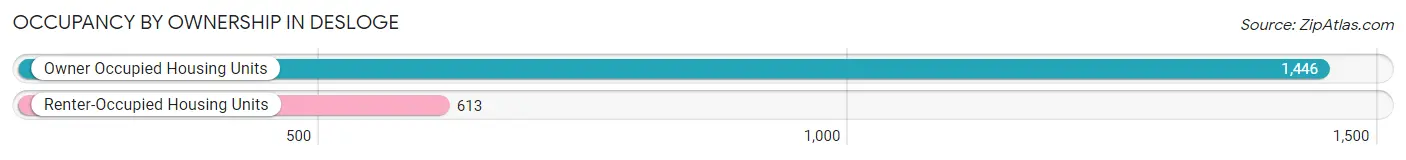
| Occupancy | # Housing Units | % Housing Units |
| Owner Occupied Housing Units | 1,446 | 70.2% |
| Renter-Occupied Housing Units | 613 | 29.8% |
| Total Occupied Housing Units | 2,059 | 100.0% |
Occupancy by Household Size in Desloge
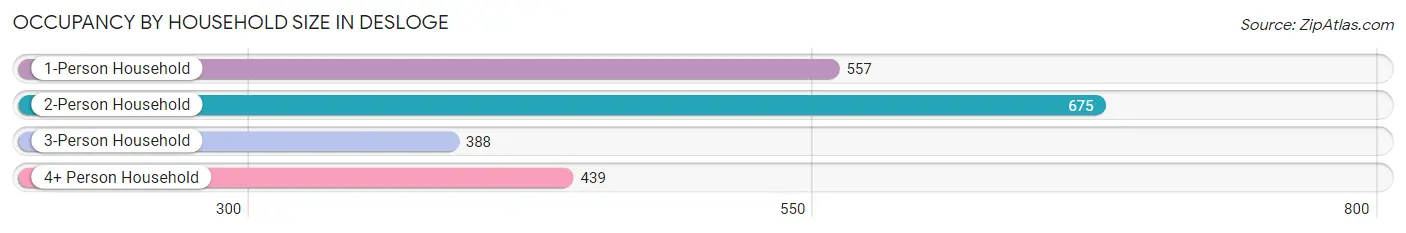
| Household Size | # Housing Units | % Housing Units |
| 1-Person Household | 557 | 27.1% |
| 2-Person Household | 675 | 32.8% |
| 3-Person Household | 388 | 18.8% |
| 4+ Person Household | 439 | 21.3% |
| Total Housing Units | 2,059 | 100.0% |
Occupancy by Ownership by Household Size in Desloge
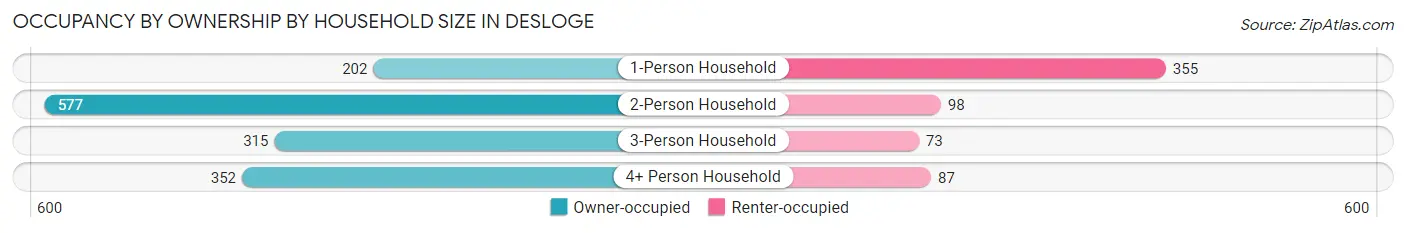
| Household Size | Owner-occupied | Renter-occupied |
| 1-Person Household | 202 (36.3%) | 355 (63.7%) |
| 2-Person Household | 577 (85.5%) | 98 (14.5%) |
| 3-Person Household | 315 (81.2%) | 73 (18.8%) |
| 4+ Person Household | 352 (80.2%) | 87 (19.8%) |
| Total Housing Units | 1,446 (70.2%) | 613 (29.8%) |
Occupancy by Educational Attainment in Desloge
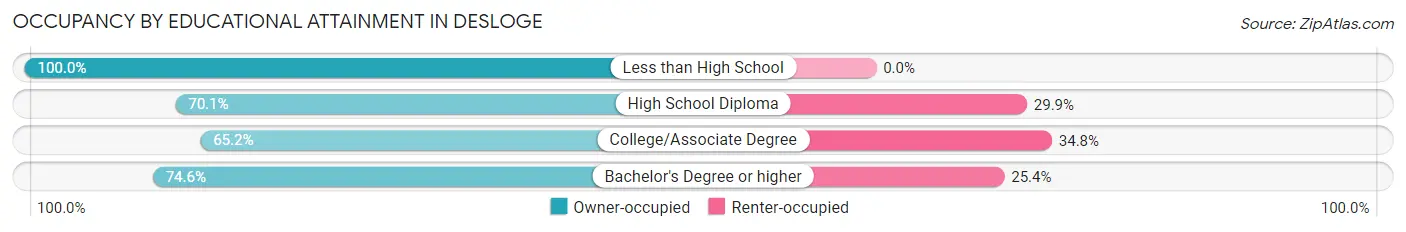
| Household Size | Owner-occupied | Renter-occupied |
| Less than High School | 74 (100.0%) | 0 (0.0%) |
| High School Diploma | 453 (70.1%) | 193 (29.9%) |
| College/Associate Degree | 552 (65.2%) | 295 (34.8%) |
| Bachelor's Degree or higher | 367 (74.6%) | 125 (25.4%) |
Occupancy by Age of Householder in Desloge
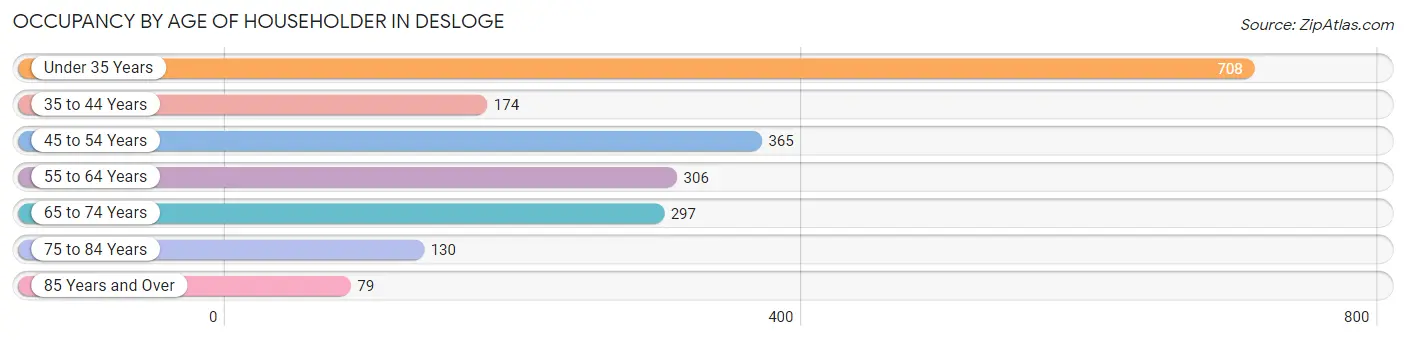
| Age Bracket | # Households | % Households |
| Under 35 Years | 708 | 34.4% |
| 35 to 44 Years | 174 | 8.5% |
| 45 to 54 Years | 365 | 17.7% |
| 55 to 64 Years | 306 | 14.9% |
| 65 to 74 Years | 297 | 14.4% |
| 75 to 84 Years | 130 | 6.3% |
| 85 Years and Over | 79 | 3.8% |
| Total | 2,059 | 100.0% |
Housing Finances in Desloge
Median Income by Occupancy in Desloge
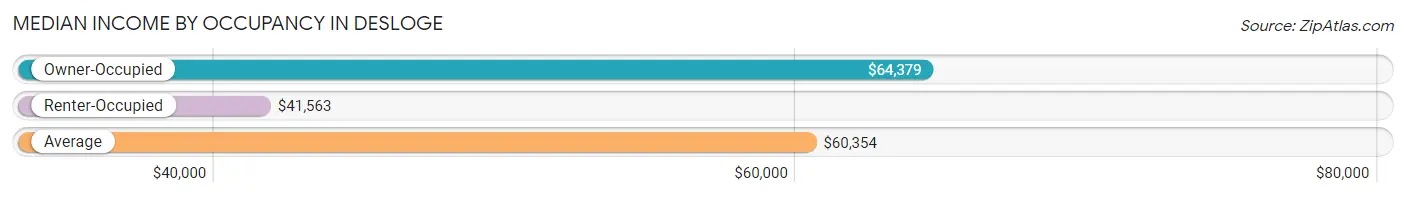
| Occupancy Type | # Households | Median Income |
| Owner-Occupied | 1,446 (70.2%) | $64,379 |
| Renter-Occupied | 613 (29.8%) | $41,563 |
| Average | 2,059 (100.0%) | $60,354 |
Occupancy by Householder Income Bracket in Desloge
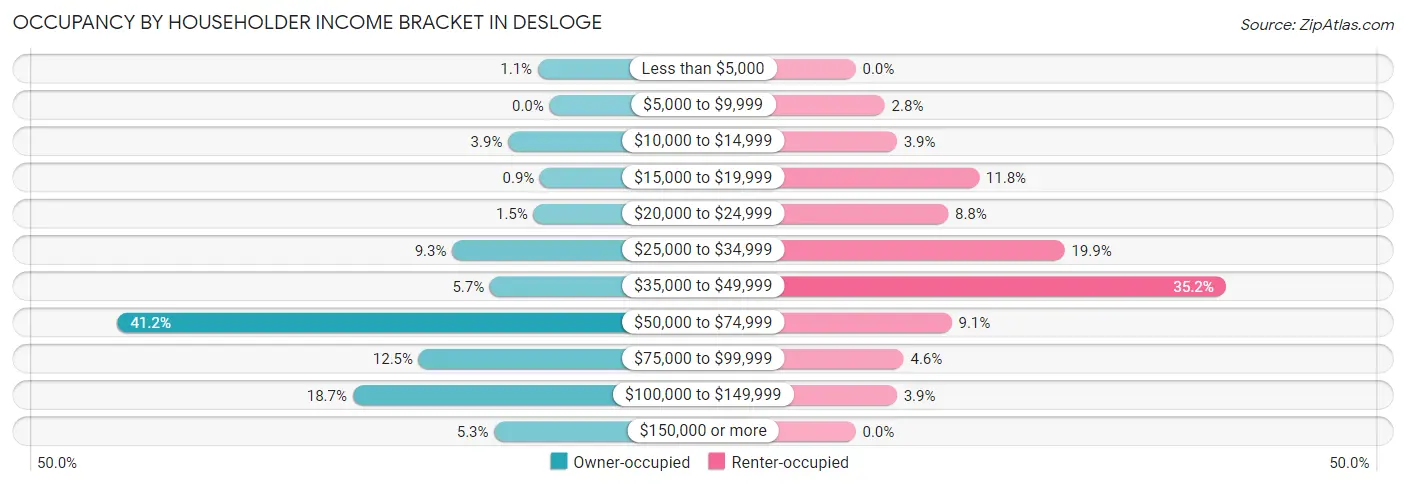
| Income Bracket | Owner-occupied | Renter-occupied |
| Less than $5,000 | 16 (1.1%) | 0 (0.0%) |
| $5,000 to $9,999 | 0 (0.0%) | 17 (2.8%) |
| $10,000 to $14,999 | 57 (3.9%) | 24 (3.9%) |
| $15,000 to $19,999 | 13 (0.9%) | 72 (11.7%) |
| $20,000 to $24,999 | 22 (1.5%) | 54 (8.8%) |
| $25,000 to $34,999 | 134 (9.3%) | 122 (19.9%) |
| $35,000 to $49,999 | 82 (5.7%) | 216 (35.2%) |
| $50,000 to $74,999 | 595 (41.1%) | 56 (9.1%) |
| $75,000 to $99,999 | 180 (12.4%) | 28 (4.6%) |
| $100,000 to $149,999 | 271 (18.7%) | 24 (3.9%) |
| $150,000 or more | 76 (5.3%) | 0 (0.0%) |
| Total | 1,446 (100.0%) | 613 (100.0%) |
Monthly Housing Cost Tiers in Desloge
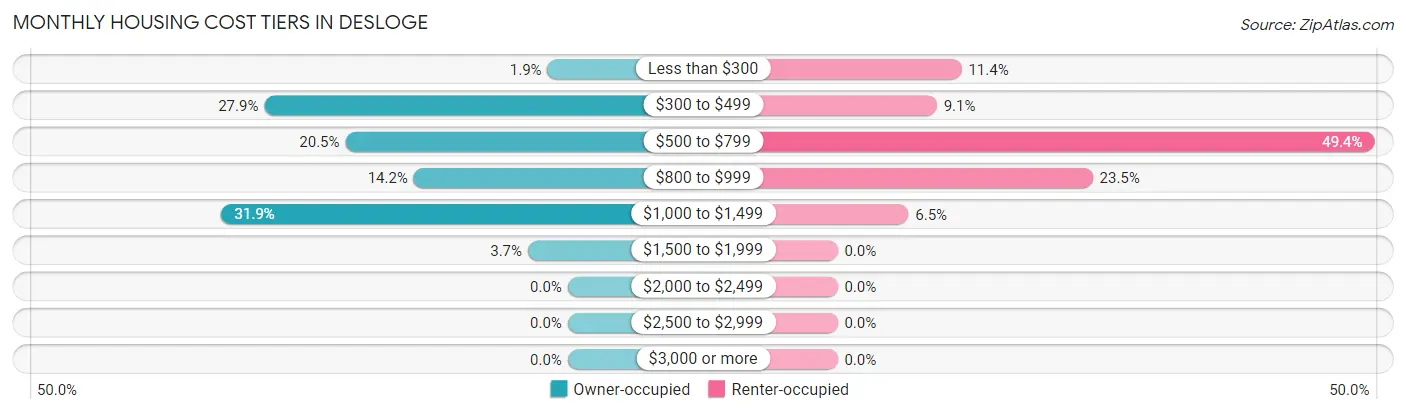
| Monthly Cost | Owner-occupied | Renter-occupied |
| Less than $300 | 27 (1.9%) | 70 (11.4%) |
| $300 to $499 | 404 (27.9%) | 56 (9.1%) |
| $500 to $799 | 296 (20.5%) | 303 (49.4%) |
| $800 to $999 | 205 (14.2%) | 144 (23.5%) |
| $1,000 to $1,499 | 461 (31.9%) | 40 (6.5%) |
| $1,500 to $1,999 | 53 (3.7%) | 0 (0.0%) |
| $2,000 to $2,499 | 0 (0.0%) | 0 (0.0%) |
| $2,500 to $2,999 | 0 (0.0%) | 0 (0.0%) |
| $3,000 or more | 0 (0.0%) | 0 (0.0%) |
| Total | 1,446 (100.0%) | 613 (100.0%) |
Physical Housing Characteristics in Desloge
Housing Structures in Desloge
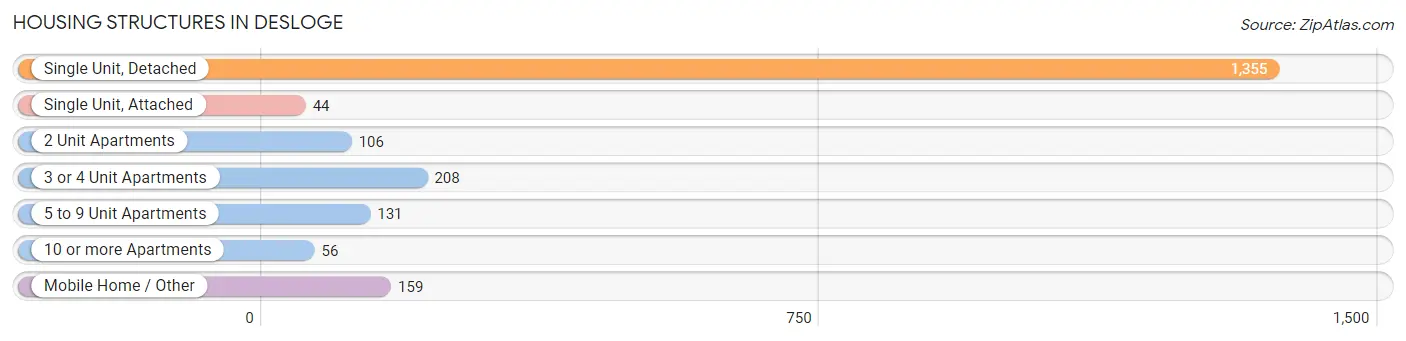
| Structure Type | # Housing Units | % Housing Units |
| Single Unit, Detached | 1,355 | 65.8% |
| Single Unit, Attached | 44 | 2.1% |
| 2 Unit Apartments | 106 | 5.1% |
| 3 or 4 Unit Apartments | 208 | 10.1% |
| 5 to 9 Unit Apartments | 131 | 6.4% |
| 10 or more Apartments | 56 | 2.7% |
| Mobile Home / Other | 159 | 7.7% |
| Total | 2,059 | 100.0% |
Housing Structures by Occupancy in Desloge
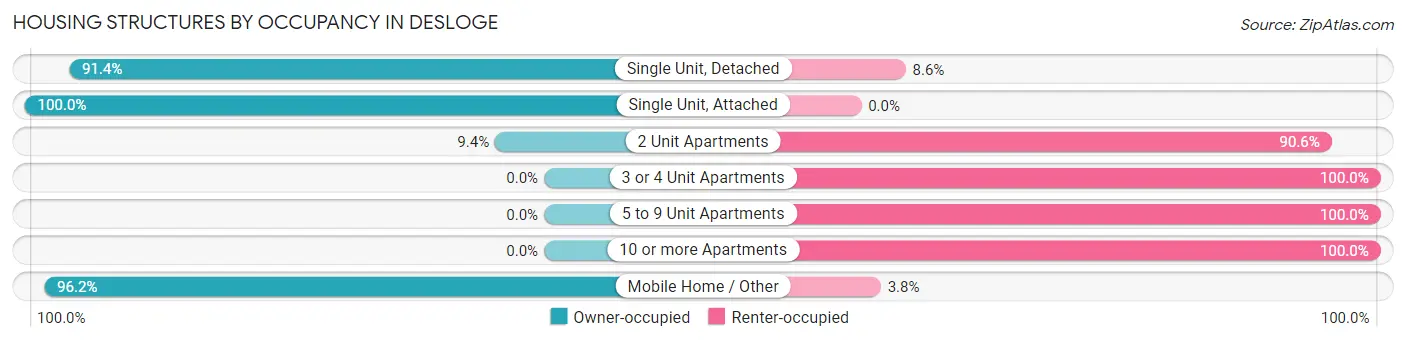
| Structure Type | Owner-occupied | Renter-occupied |
| Single Unit, Detached | 1,239 (91.4%) | 116 (8.6%) |
| Single Unit, Attached | 44 (100.0%) | 0 (0.0%) |
| 2 Unit Apartments | 10 (9.4%) | 96 (90.6%) |
| 3 or 4 Unit Apartments | 0 (0.0%) | 208 (100.0%) |
| 5 to 9 Unit Apartments | 0 (0.0%) | 131 (100.0%) |
| 10 or more Apartments | 0 (0.0%) | 56 (100.0%) |
| Mobile Home / Other | 153 (96.2%) | 6 (3.8%) |
| Total | 1,446 (70.2%) | 613 (29.8%) |
Housing Structures by Number of Rooms in Desloge
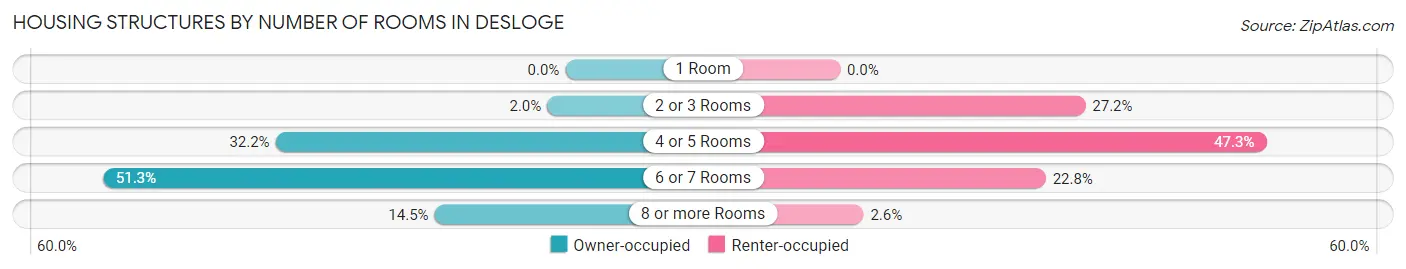
| Number of Rooms | Owner-occupied | Renter-occupied |
| 1 Room | 0 (0.0%) | 0 (0.0%) |
| 2 or 3 Rooms | 29 (2.0%) | 167 (27.2%) |
| 4 or 5 Rooms | 465 (32.2%) | 290 (47.3%) |
| 6 or 7 Rooms | 742 (51.3%) | 140 (22.8%) |
| 8 or more Rooms | 210 (14.5%) | 16 (2.6%) |
| Total | 1,446 (100.0%) | 613 (100.0%) |
Housing Structure by Heating Type in Desloge
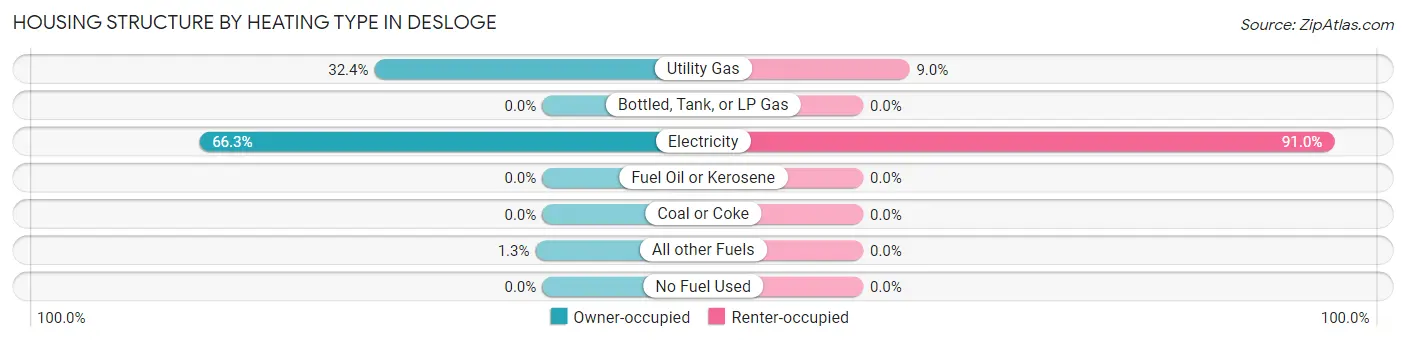
| Heating Type | Owner-occupied | Renter-occupied |
| Utility Gas | 469 (32.4%) | 55 (9.0%) |
| Bottled, Tank, or LP Gas | 0 (0.0%) | 0 (0.0%) |
| Electricity | 958 (66.2%) | 558 (91.0%) |
| Fuel Oil or Kerosene | 0 (0.0%) | 0 (0.0%) |
| Coal or Coke | 0 (0.0%) | 0 (0.0%) |
| All other Fuels | 19 (1.3%) | 0 (0.0%) |
| No Fuel Used | 0 (0.0%) | 0 (0.0%) |
| Total | 1,446 (100.0%) | 613 (100.0%) |
Household Vehicle Usage in Desloge
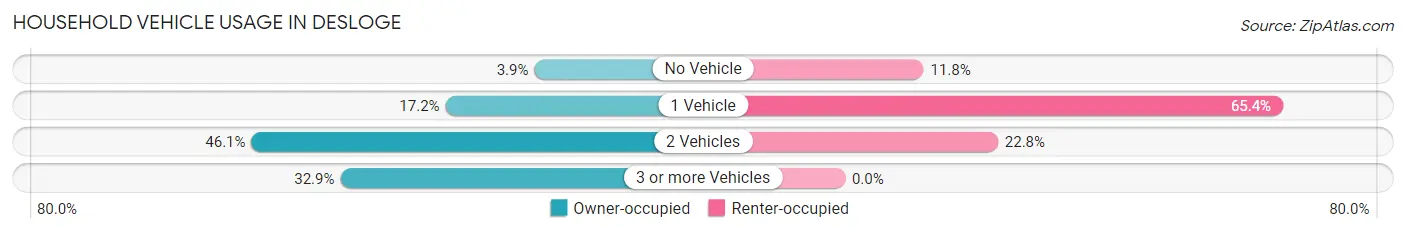
| Vehicles per Household | Owner-occupied | Renter-occupied |
| No Vehicle | 56 (3.9%) | 72 (11.7%) |
| 1 Vehicle | 248 (17.2%) | 401 (65.4%) |
| 2 Vehicles | 667 (46.1%) | 140 (22.8%) |
| 3 or more Vehicles | 475 (32.9%) | 0 (0.0%) |
| Total | 1,446 (100.0%) | 613 (100.0%) |
Real Estate & Mortgages in Desloge
Real Estate and Mortgage Overview in Desloge
| Characteristic | Without Mortgage | With Mortgage |
| Housing Units | 531 | 915 |
| Median Property Value | $89,700 | $119,800 |
| Median Household Income | $64,406 | $42 |
| Monthly Housing Costs | $401 | $0 |
| Real Estate Taxes | $1,112 | $0 |
Property Value by Mortgage Status in Desloge
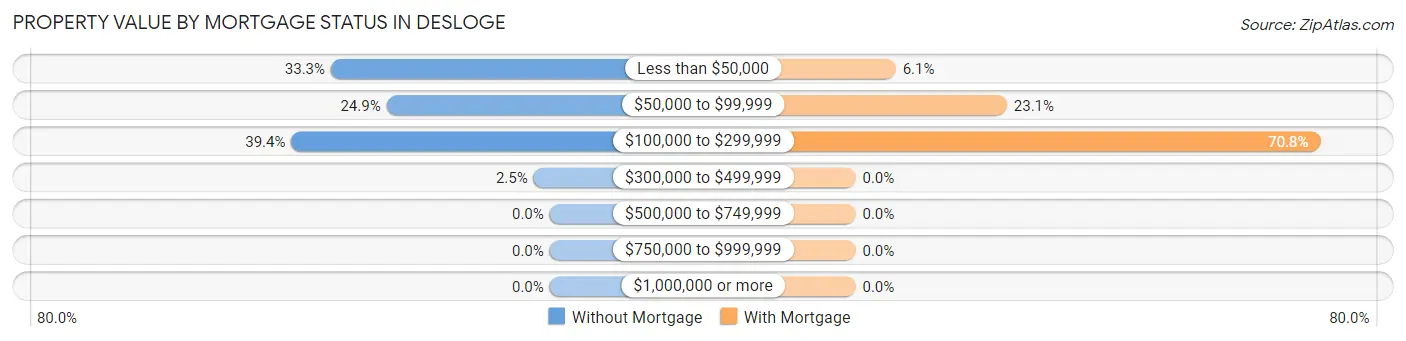
| Property Value | Without Mortgage | With Mortgage |
| Less than $50,000 | 177 (33.3%) | 56 (6.1%) |
| $50,000 to $99,999 | 132 (24.9%) | 211 (23.1%) |
| $100,000 to $299,999 | 209 (39.4%) | 648 (70.8%) |
| $300,000 to $499,999 | 13 (2.5%) | 0 (0.0%) |
| $500,000 to $749,999 | 0 (0.0%) | 0 (0.0%) |
| $750,000 to $999,999 | 0 (0.0%) | 0 (0.0%) |
| $1,000,000 or more | 0 (0.0%) | 0 (0.0%) |
| Total | 531 (100.0%) | 915 (100.0%) |
Household Income by Mortgage Status in Desloge
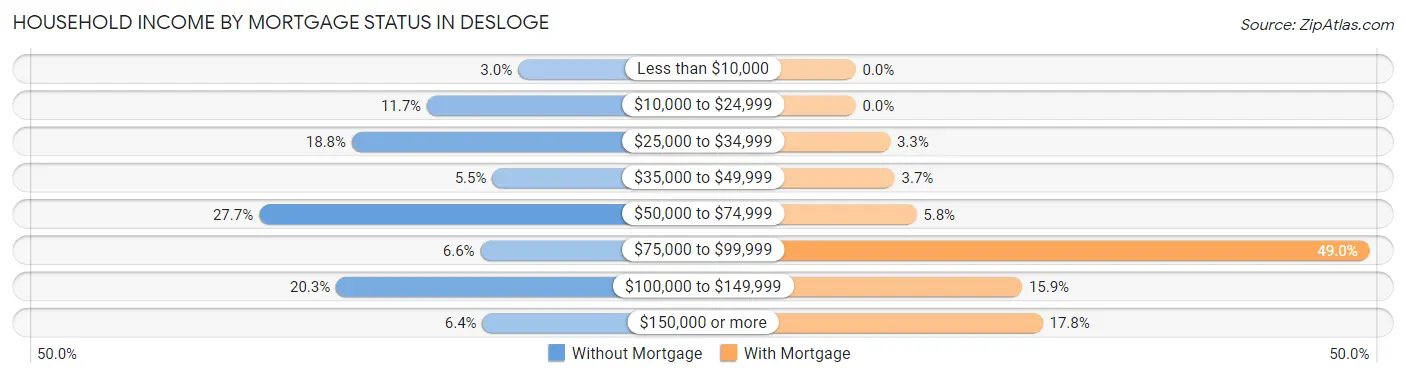
| Household Income | Without Mortgage | With Mortgage |
| Less than $10,000 | 16 (3.0%) | 0 (0.0%) |
| $10,000 to $24,999 | 62 (11.7%) | 0 (0.0%) |
| $25,000 to $34,999 | 100 (18.8%) | 30 (3.3%) |
| $35,000 to $49,999 | 29 (5.5%) | 34 (3.7%) |
| $50,000 to $74,999 | 147 (27.7%) | 53 (5.8%) |
| $75,000 to $99,999 | 35 (6.6%) | 448 (49.0%) |
| $100,000 to $149,999 | 108 (20.3%) | 145 (15.9%) |
| $150,000 or more | 34 (6.4%) | 163 (17.8%) |
| Total | 531 (100.0%) | 915 (100.0%) |
Property Value to Household Income Ratio in Desloge
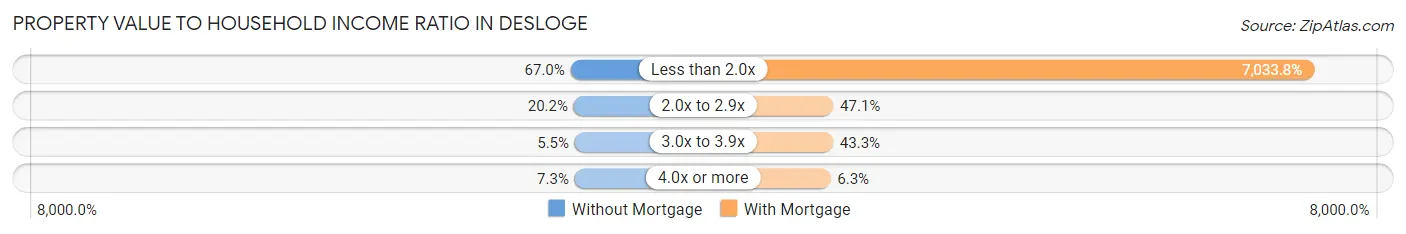
| Value-to-Income Ratio | Without Mortgage | With Mortgage |
| Less than 2.0x | 356 (67.0%) | 64,359 (7,033.8%) |
| 2.0x to 2.9x | 107 (20.2%) | 431 (47.1%) |
| 3.0x to 3.9x | 29 (5.5%) | 396 (43.3%) |
| 4.0x or more | 39 (7.3%) | 58 (6.3%) |
| Total | 531 (100.0%) | 915 (100.0%) |
Real Estate Taxes by Mortgage Status in Desloge
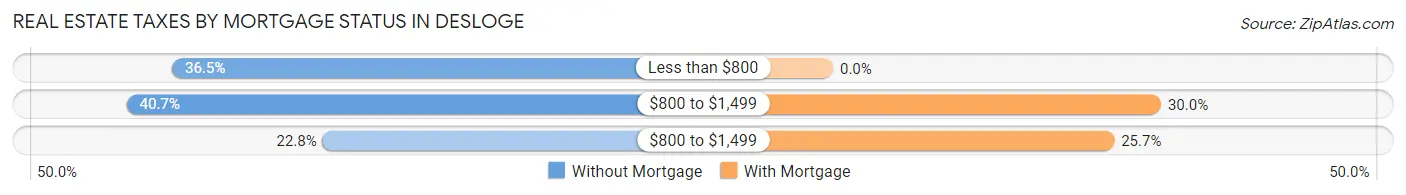
| Property Taxes | Without Mortgage | With Mortgage |
| Less than $800 | 194 (36.5%) | 0 (0.0%) |
| $800 to $1,499 | 216 (40.7%) | 274 (29.9%) |
| $800 to $1,499 | 121 (22.8%) | 235 (25.7%) |
| Total | 531 (100.0%) | 915 (100.0%) |
Health & Disability in Desloge
Health Insurance Coverage by Age in Desloge
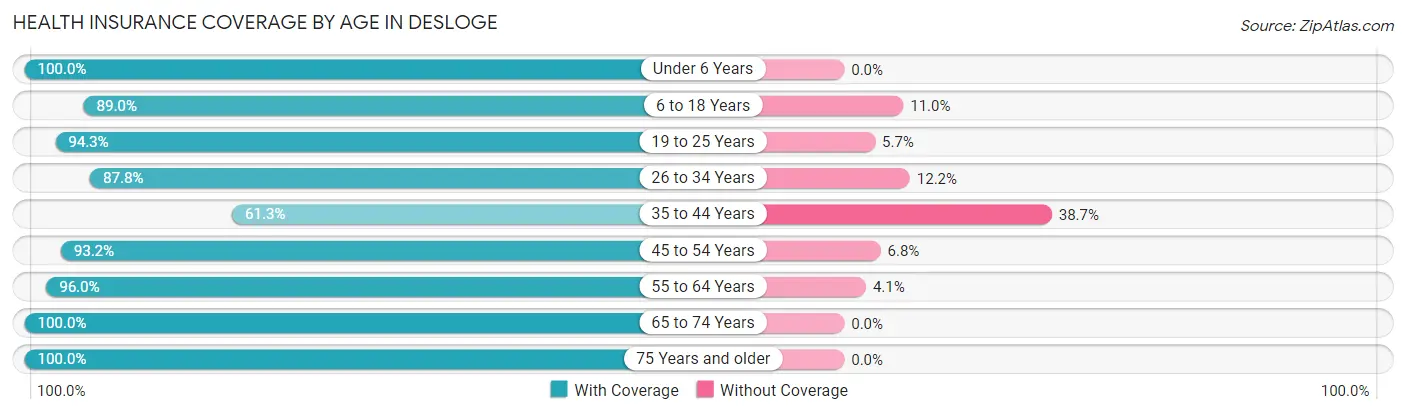
| Age Bracket | With Coverage | Without Coverage |
| Under 6 Years | 174 (100.0%) | 0 (0.0%) |
| 6 to 18 Years | 808 (89.0%) | 100 (11.0%) |
| 19 to 25 Years | 197 (94.3%) | 12 (5.7%) |
| 26 to 34 Years | 962 (87.8%) | 134 (12.2%) |
| 35 to 44 Years | 339 (61.3%) | 214 (38.7%) |
| 45 to 54 Years | 551 (93.2%) | 40 (6.8%) |
| 55 to 64 Years | 403 (96.0%) | 17 (4.1%) |
| 65 to 74 Years | 497 (100.0%) | 0 (0.0%) |
| 75 Years and older | 352 (100.0%) | 0 (0.0%) |
| Total | 4,283 (89.2%) | 517 (10.8%) |
Health Insurance Coverage by Citizenship Status in Desloge
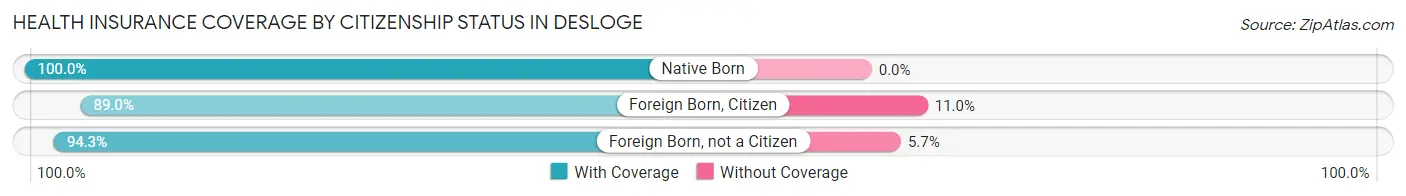
| Citizenship Status | With Coverage | Without Coverage |
| Native Born | 174 (100.0%) | 0 (0.0%) |
| Foreign Born, Citizen | 808 (89.0%) | 100 (11.0%) |
| Foreign Born, not a Citizen | 197 (94.3%) | 12 (5.7%) |
Health Insurance Coverage by Household Income in Desloge
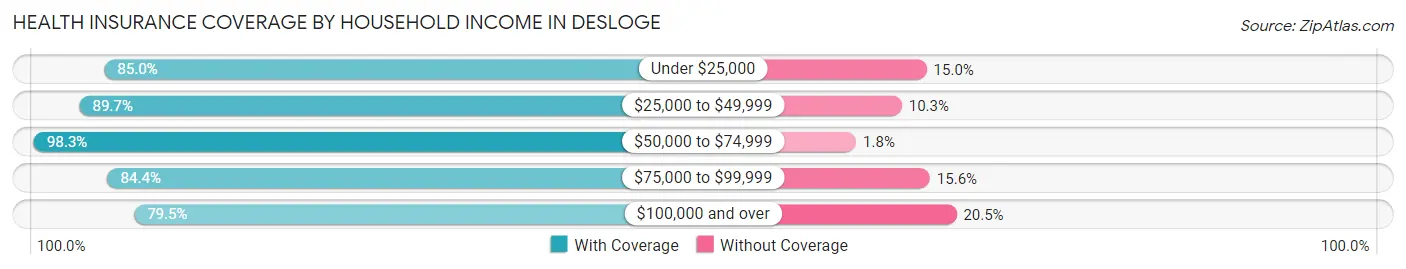
| Household Income | With Coverage | Without Coverage |
| Under $25,000 | 483 (85.0%) | 85 (15.0%) |
| $25,000 to $49,999 | 871 (89.7%) | 100 (10.3%) |
| $50,000 to $74,999 | 1,628 (98.3%) | 29 (1.8%) |
| $75,000 to $99,999 | 450 (84.4%) | 83 (15.6%) |
| $100,000 and over | 851 (79.5%) | 220 (20.5%) |
Public vs Private Health Insurance Coverage by Age in Desloge
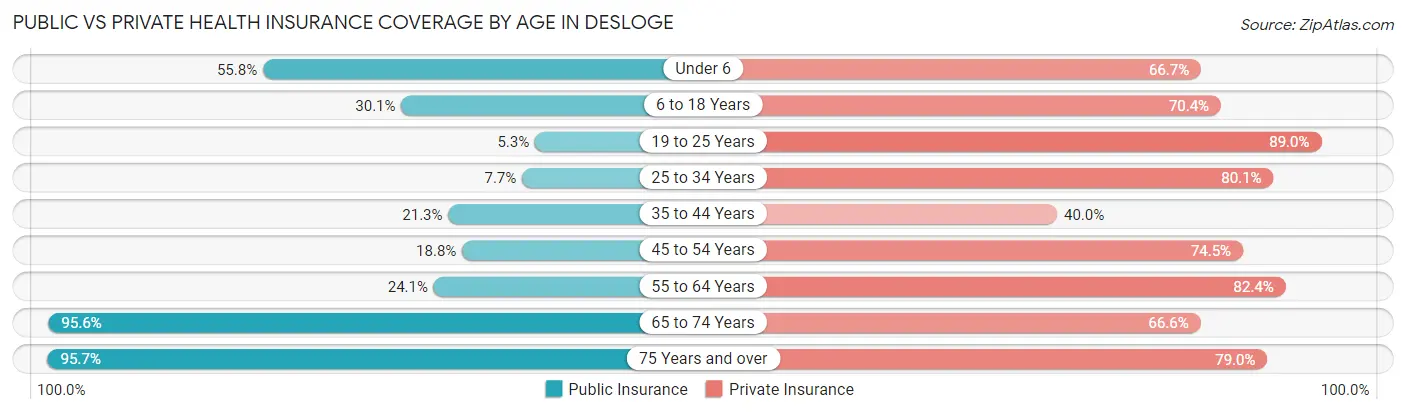
| Age Bracket | Public Insurance | Private Insurance |
| Under 6 | 97 (55.7%) | 116 (66.7%) |
| 6 to 18 Years | 273 (30.1%) | 639 (70.4%) |
| 19 to 25 Years | 11 (5.3%) | 186 (89.0%) |
| 25 to 34 Years | 84 (7.7%) | 878 (80.1%) |
| 35 to 44 Years | 118 (21.3%) | 221 (40.0%) |
| 45 to 54 Years | 111 (18.8%) | 440 (74.5%) |
| 55 to 64 Years | 101 (24.0%) | 346 (82.4%) |
| 65 to 74 Years | 475 (95.6%) | 331 (66.6%) |
| 75 Years and over | 337 (95.7%) | 278 (79.0%) |
| Total | 1,607 (33.5%) | 3,435 (71.6%) |
Disability Status by Sex by Age in Desloge
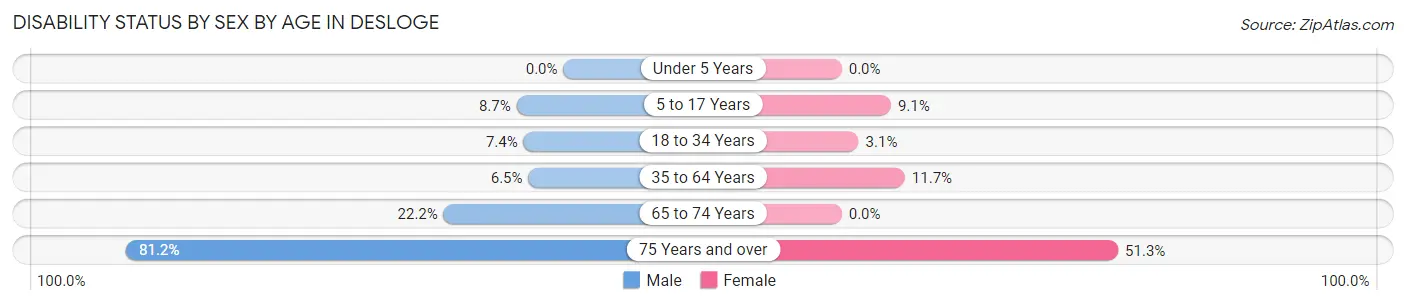
| Age Bracket | Male | Female |
| Under 5 Years | 0 (0.0%) | 0 (0.0%) |
| 5 to 17 Years | 51 (8.7%) | 24 (9.1%) |
| 18 to 34 Years | 57 (7.4%) | 19 (3.1%) |
| 35 to 64 Years | 50 (6.5%) | 93 (11.7%) |
| 65 to 74 Years | 44 (22.2%) | 0 (0.0%) |
| 75 Years and over | 99 (81.1%) | 118 (51.3%) |
Disability Class by Sex by Age in Desloge
Disability Class: Hearing Difficulty
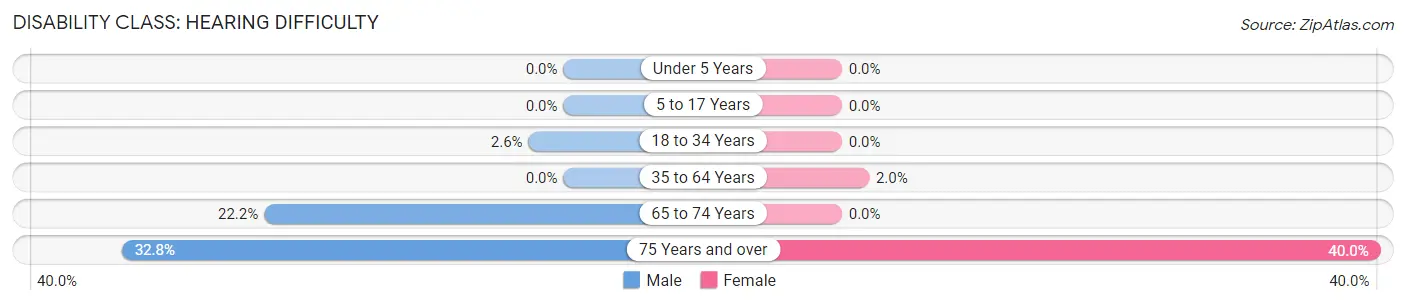
| Age Bracket | Male | Female |
| Under 5 Years | 0 (0.0%) | 0 (0.0%) |
| 5 to 17 Years | 0 (0.0%) | 0 (0.0%) |
| 18 to 34 Years | 20 (2.6%) | 0 (0.0%) |
| 35 to 64 Years | 0 (0.0%) | 16 (2.0%) |
| 65 to 74 Years | 44 (22.2%) | 0 (0.0%) |
| 75 Years and over | 40 (32.8%) | 92 (40.0%) |
Disability Class: Vision Difficulty
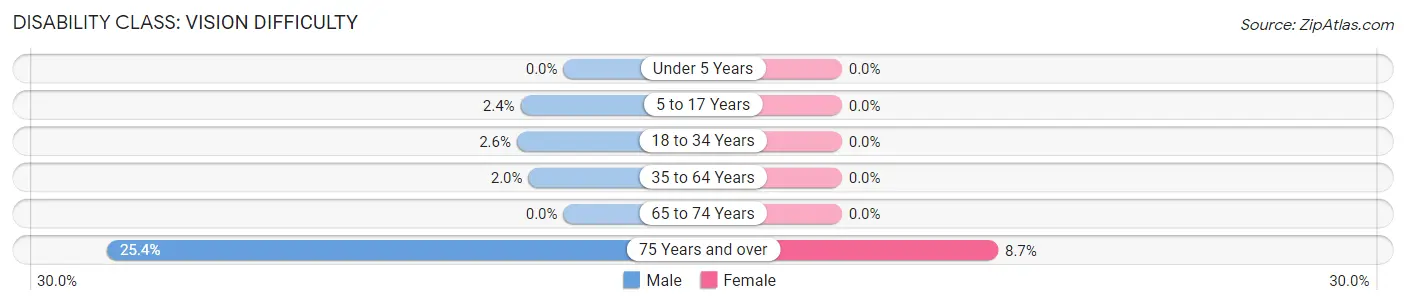
| Age Bracket | Male | Female |
| Under 5 Years | 0 (0.0%) | 0 (0.0%) |
| 5 to 17 Years | 14 (2.4%) | 0 (0.0%) |
| 18 to 34 Years | 20 (2.6%) | 0 (0.0%) |
| 35 to 64 Years | 15 (1.9%) | 0 (0.0%) |
| 65 to 74 Years | 0 (0.0%) | 0 (0.0%) |
| 75 Years and over | 31 (25.4%) | 20 (8.7%) |
Disability Class: Cognitive Difficulty
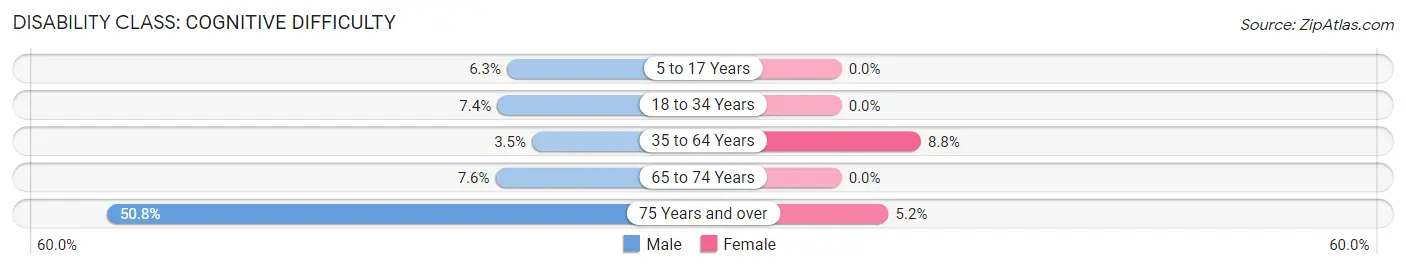
| Age Bracket | Male | Female |
| 5 to 17 Years | 37 (6.3%) | 0 (0.0%) |
| 18 to 34 Years | 57 (7.4%) | 0 (0.0%) |
| 35 to 64 Years | 27 (3.5%) | 70 (8.8%) |
| 65 to 74 Years | 15 (7.6%) | 0 (0.0%) |
| 75 Years and over | 62 (50.8%) | 12 (5.2%) |
Disability Class: Ambulatory Difficulty
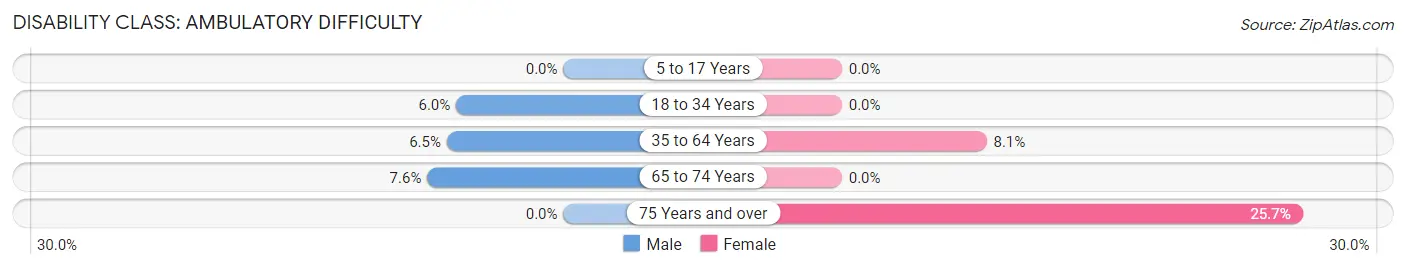
| Age Bracket | Male | Female |
| 5 to 17 Years | 0 (0.0%) | 0 (0.0%) |
| 18 to 34 Years | 46 (6.0%) | 0 (0.0%) |
| 35 to 64 Years | 50 (6.5%) | 64 (8.1%) |
| 65 to 74 Years | 15 (7.6%) | 0 (0.0%) |
| 75 Years and over | 0 (0.0%) | 59 (25.7%) |
Disability Class: Self-Care Difficulty
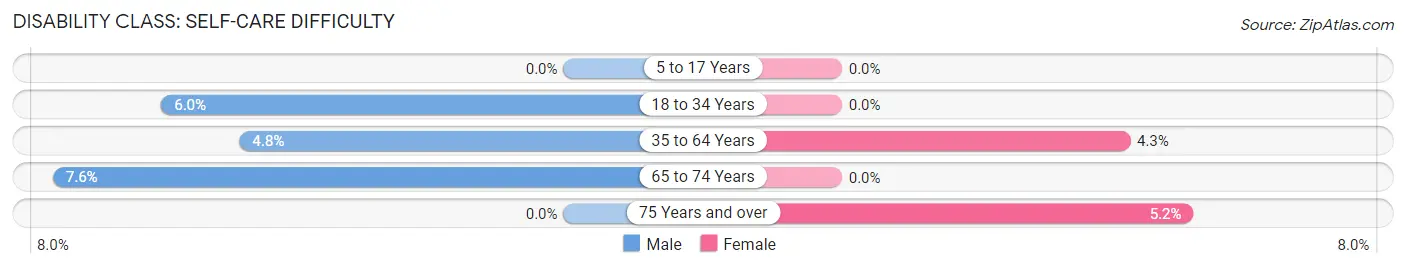
| Age Bracket | Male | Female |
| 5 to 17 Years | 0 (0.0%) | 0 (0.0%) |
| 18 to 34 Years | 46 (6.0%) | 0 (0.0%) |
| 35 to 64 Years | 37 (4.8%) | 34 (4.3%) |
| 65 to 74 Years | 15 (7.6%) | 0 (0.0%) |
| 75 Years and over | 0 (0.0%) | 12 (5.2%) |
Technology Access in Desloge
Computing Device Access in Desloge
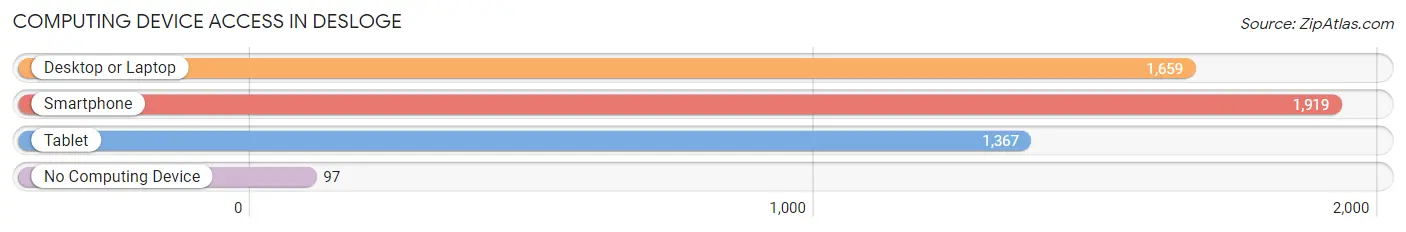
| Device Type | # Households | % Households |
| Desktop or Laptop | 1,659 | 80.6% |
| Smartphone | 1,919 | 93.2% |
| Tablet | 1,367 | 66.4% |
| No Computing Device | 97 | 4.7% |
| Total | 2,059 | 100.0% |
Internet Access in Desloge
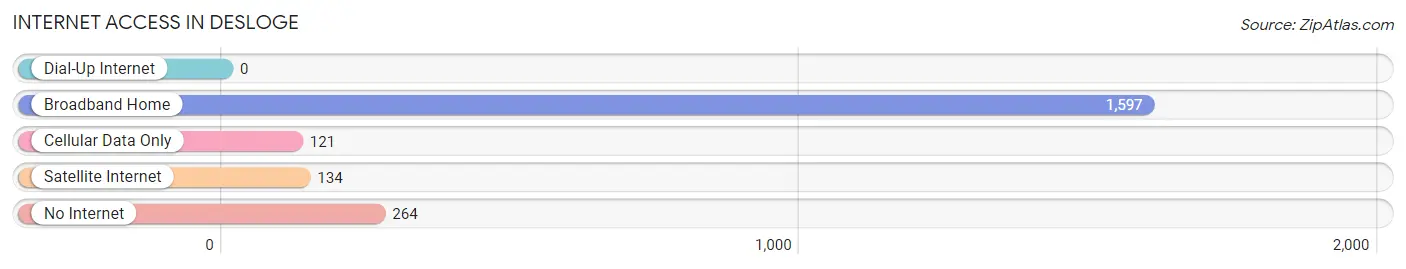
| Internet Type | # Households | % Households |
| Dial-Up Internet | 0 | 0.0% |
| Broadband Home | 1,597 | 77.6% |
| Cellular Data Only | 121 | 5.9% |
| Satellite Internet | 134 | 6.5% |
| No Internet | 264 | 12.8% |
| Total | 2,059 | 100.0% |
Desloge Summary
Desloge, Missouri is a small city located in St. Francois County in the southeastern part of the state. It is situated about 70 miles south of St. Louis and is part of the Farmington Micropolitan Statistical Area. The city has a population of approximately 8,000 people and is known for its rich history, diverse geography, and vibrant economy.
History
Desloge was founded in 1876 by French immigrant, Francis Desloge. He purchased the land from the government and began to develop the area. Desloge was a successful businessman and entrepreneur who established a number of businesses in the area, including a general store, a hotel, and a coal mine. He also built a railroad line that connected Desloge to the nearby town of Farmington.
The city was officially incorporated in 1887 and quickly grew in population and prosperity. By the early 1900s, Desloge had become a thriving community with a variety of businesses, including a bank, a newspaper, and a number of churches. The city also had a thriving agricultural industry, with many local farmers growing corn, wheat, and other crops.
In the mid-1900s, Desloge began to experience a decline in population and economic activity. This was due in part to the decline of the coal mining industry, as well as the closure of the railroad line. However, the city has since experienced a resurgence in recent years, with a number of new businesses and developments being established.
Geography
Desloge is located in the southeastern part of Missouri, about 70 miles south of St. Louis. The city is situated in the Ozark Mountains and is surrounded by rolling hills and forests. The city is also located near the Big River, which provides a number of recreational opportunities for residents and visitors alike.
The climate in Desloge is generally mild, with hot summers and cold winters. The average temperature in the summer is around 80 degrees Fahrenheit, while the average temperature in the winter is around 40 degrees Fahrenheit.
Economy
Desloge has a diverse economy that is largely driven by the manufacturing and service industries. The city is home to a number of manufacturing companies, including a steel mill, a paper mill, and a plastics plant. The service industry is also important to the local economy, with a number of healthcare, retail, and hospitality businesses located in the city.
The city also has a thriving agricultural industry, with many local farmers growing corn, wheat, and other crops. The city is also home to a number of small businesses, including restaurants, shops, and other services.
Demographics
As of the 2010 census, Desloge had a population of 8,000 people. The racial makeup of the city was 94.3% White, 2.2% African American, 0.7% Native American, 0.4% Asian, and 2.4% from other races. The median household income in Desloge was $37,000, and the median age was 38.
Desloge is a small city with a rich history, diverse geography, and vibrant economy. The city has a number of businesses and industries that provide employment opportunities for its residents, as well as a number of recreational activities for visitors and locals alike. Desloge is a great place to live, work, and play.
Common Questions
What is Per Capita Income in Desloge?
Per Capita income in Desloge is $27,471.
What is the Median Family Income in Desloge?
Median Family Income in Desloge is $63,097.
What is the Median Household income in Desloge?
Median Household Income in Desloge is $60,354.
What is Income or Wage Gap in Desloge?
Income or Wage Gap in Desloge is 30.6%.
Women in Desloge earn 69.4 cents for every dollar earned by a man.
What is Inequality or Gini Index in Desloge?
Inequality or Gini Index in Desloge is 0.34.
What is the Total Population of Desloge?
Total Population of Desloge is 4,875.
What is the Total Male Population of Desloge?
Total Male Population of Desloge is 2,485.
What is the Total Female Population of Desloge?
Total Female Population of Desloge is 2,390.
What is the Ratio of Males per 100 Females in Desloge?
There are 103.97 Males per 100 Females in Desloge.
What is the Ratio of Females per 100 Males in Desloge?
There are 96.18 Females per 100 Males in Desloge.
What is the Median Population Age in Desloge?
Median Population Age in Desloge is 35.9 Years.
What is the Average Family Size in Desloge
Average Family Size in Desloge is 2.7 People.
What is the Average Household Size in Desloge
Average Household Size in Desloge is 2.3 People.
How Large is the Labor Force in Desloge?
There are 2,655 People in the Labor Forcein in Desloge.
What is the Percentage of People in the Labor Force in Desloge?
66.0% of People are in the Labor Force in Desloge.
What is the Unemployment Rate in Desloge?
Unemployment Rate in Desloge is 7.3%.