Chillicothe, MO Map & Demographics
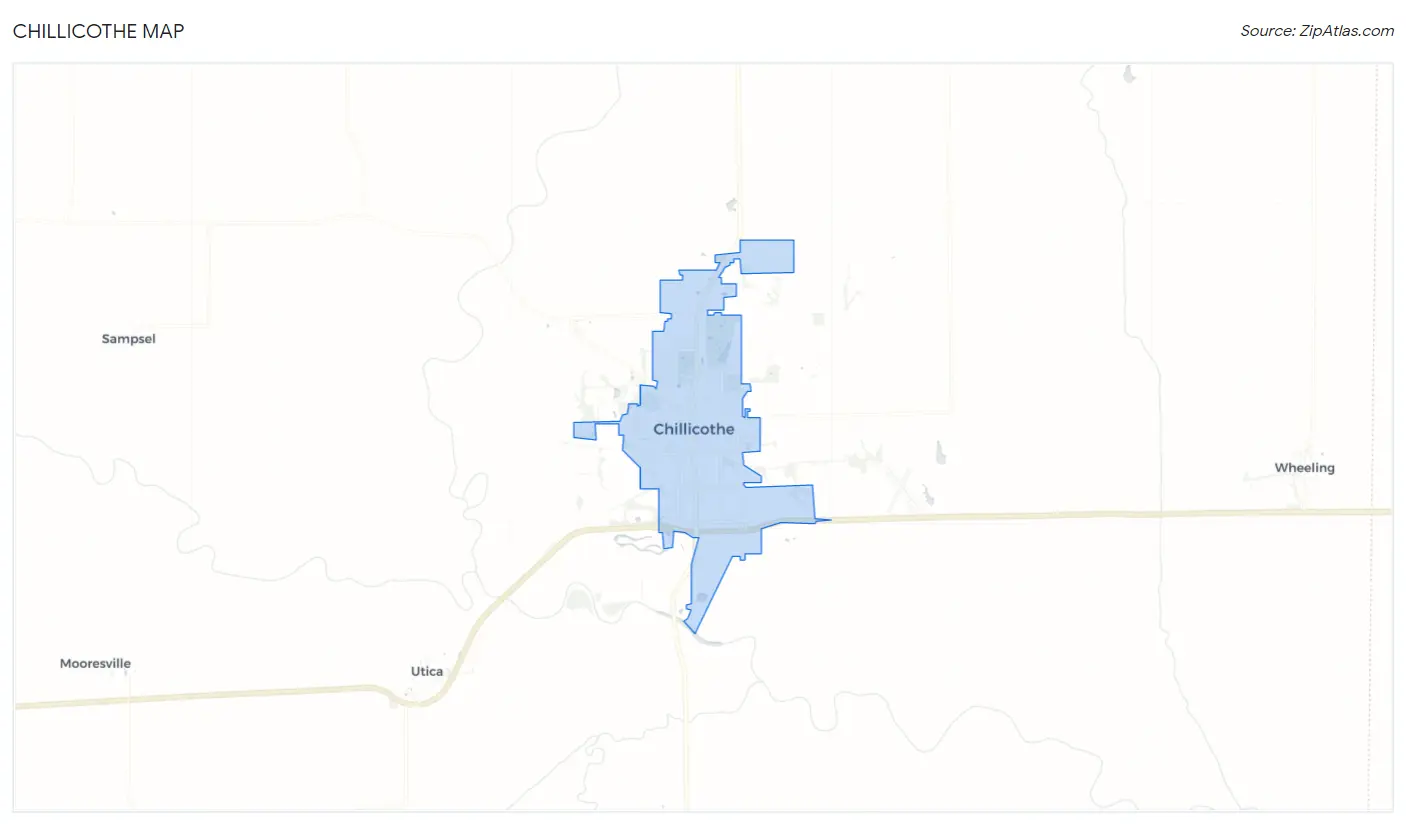
Chillicothe Map
Chillicothe Overview
$29,396
PER CAPITA INCOME
$68,272
AVG FAMILY INCOME
$54,119
AVG HOUSEHOLD INCOME
30.0%
WAGE / INCOME GAP [ % ]
70.0¢/ $1
WAGE / INCOME GAP [ $ ]
$7,918
FAMILY INCOME DEFICIT
0.46
INEQUALITY / GINI INDEX
9,091
TOTAL POPULATION
3,917
MALE POPULATION
5,174
FEMALE POPULATION
75.71
MALES / 100 FEMALES
132.09
FEMALES / 100 MALES
38.0
MEDIAN AGE
2.9
AVG FAMILY SIZE
2.2
AVG HOUSEHOLD SIZE
3,840
LABOR FORCE [ PEOPLE ]
52.1%
PERCENT IN LABOR FORCE
3.5%
UNEMPLOYMENT RATE
Chillicothe Zip Codes
Chillicothe Area Codes
Income in Chillicothe
Income Overview in Chillicothe
Per Capita Income in Chillicothe is $29,396, while median incomes of families and households are $68,272 and $54,119 respectively.
| Characteristic | Number | Measure |
| Per Capita Income | 9,091 | $29,396 |
| Median Family Income | 2,092 | $68,272 |
| Mean Family Income | 2,092 | $88,649 |
| Median Household Income | 3,466 | $54,119 |
| Mean Household Income | 3,466 | $72,591 |
| Income Deficit | 2,092 | $7,918 |
| Wage / Income Gap (%) | 9,091 | 30.02% |
| Wage / Income Gap ($) | 9,091 | 69.98¢ per $1 |
| Gini / Inequality Index | 9,091 | 0.46 |
Earnings by Sex in Chillicothe
Average Earnings in Chillicothe are $34,763, $42,733 for men and $29,903 for women, a difference of 30.0%.
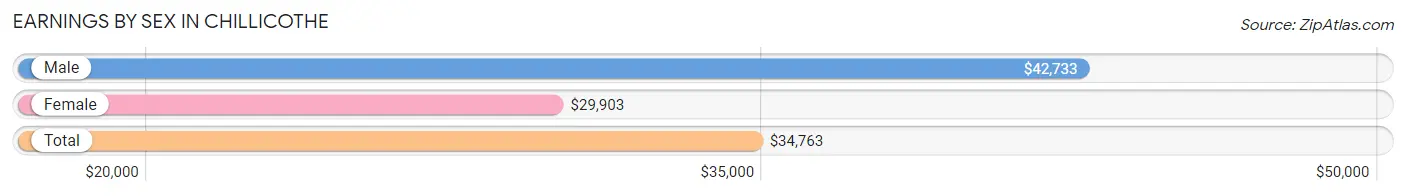
| Sex | Number | Average Earnings |
| Male | 2,046 (50.2%) | $42,733 |
| Female | 2,033 (49.8%) | $29,903 |
| Total | 4,079 (100.0%) | $34,763 |
Earnings by Sex by Income Bracket in Chillicothe
The most common earnings brackets in Chillicothe are $100,000+ for men (240 | 11.7%) and $35,000 to $39,999 for women (246 | 12.1%).
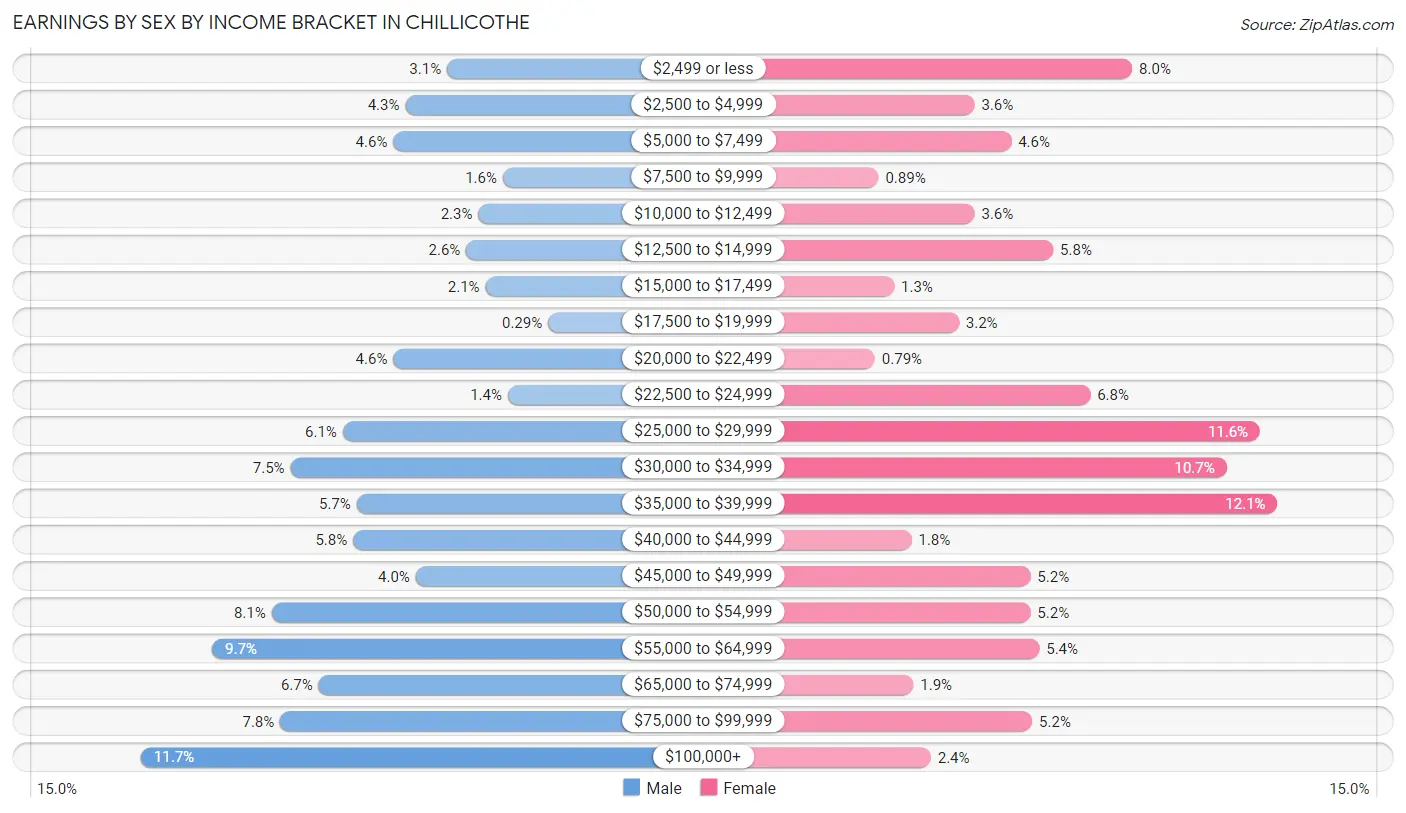
| Income | Male | Female |
| $2,499 or less | 64 (3.1%) | 163 (8.0%) |
| $2,500 to $4,999 | 88 (4.3%) | 73 (3.6%) |
| $5,000 to $7,499 | 95 (4.6%) | 94 (4.6%) |
| $7,500 to $9,999 | 32 (1.6%) | 18 (0.9%) |
| $10,000 to $12,499 | 46 (2.2%) | 73 (3.6%) |
| $12,500 to $14,999 | 53 (2.6%) | 118 (5.8%) |
| $15,000 to $17,499 | 42 (2.1%) | 27 (1.3%) |
| $17,500 to $19,999 | 6 (0.3%) | 64 (3.2%) |
| $20,000 to $22,499 | 95 (4.6%) | 16 (0.8%) |
| $22,500 to $24,999 | 29 (1.4%) | 139 (6.8%) |
| $25,000 to $29,999 | 124 (6.1%) | 236 (11.6%) |
| $30,000 to $34,999 | 154 (7.5%) | 217 (10.7%) |
| $35,000 to $39,999 | 116 (5.7%) | 246 (12.1%) |
| $40,000 to $44,999 | 118 (5.8%) | 37 (1.8%) |
| $45,000 to $49,999 | 82 (4.0%) | 105 (5.2%) |
| $50,000 to $54,999 | 165 (8.1%) | 105 (5.2%) |
| $55,000 to $64,999 | 199 (9.7%) | 110 (5.4%) |
| $65,000 to $74,999 | 138 (6.7%) | 38 (1.9%) |
| $75,000 to $99,999 | 160 (7.8%) | 106 (5.2%) |
| $100,000+ | 240 (11.7%) | 48 (2.4%) |
| Total | 2,046 (100.0%) | 2,033 (100.0%) |
Earnings by Sex by Educational Attainment in Chillicothe
Average earnings in Chillicothe are $43,382 for men and $31,776 for women, a difference of 26.8%. Men with an educational attainment of graduate degree enjoy the highest average annual earnings of $58,861, while those with high school diploma education earn the least with $35,300. Women with an educational attainment of graduate degree earn the most with the average annual earnings of $52,125, while those with less than high school education have the smallest earnings of $22,611.
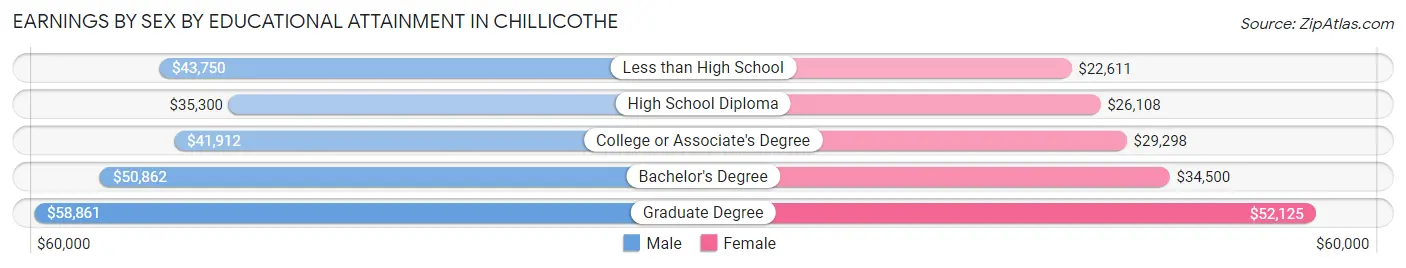
| Educational Attainment | Male Income | Female Income |
| Less than High School | $43,750 | $22,611 |
| High School Diploma | $35,300 | $26,108 |
| College or Associate's Degree | $41,912 | $29,298 |
| Bachelor's Degree | $50,862 | $34,500 |
| Graduate Degree | $58,861 | $52,125 |
| Total | $43,382 | $31,776 |
Family Income in Chillicothe
Family Income Brackets in Chillicothe
According to the Chillicothe family income data, there are 517 families falling into the $50,000 to $74,999 income range, which is the most common income bracket and makes up 24.7% of all families. Conversely, the $10,000 to $14,999 income bracket is the least frequent group with only 21 families (1.0%) belonging to this category.
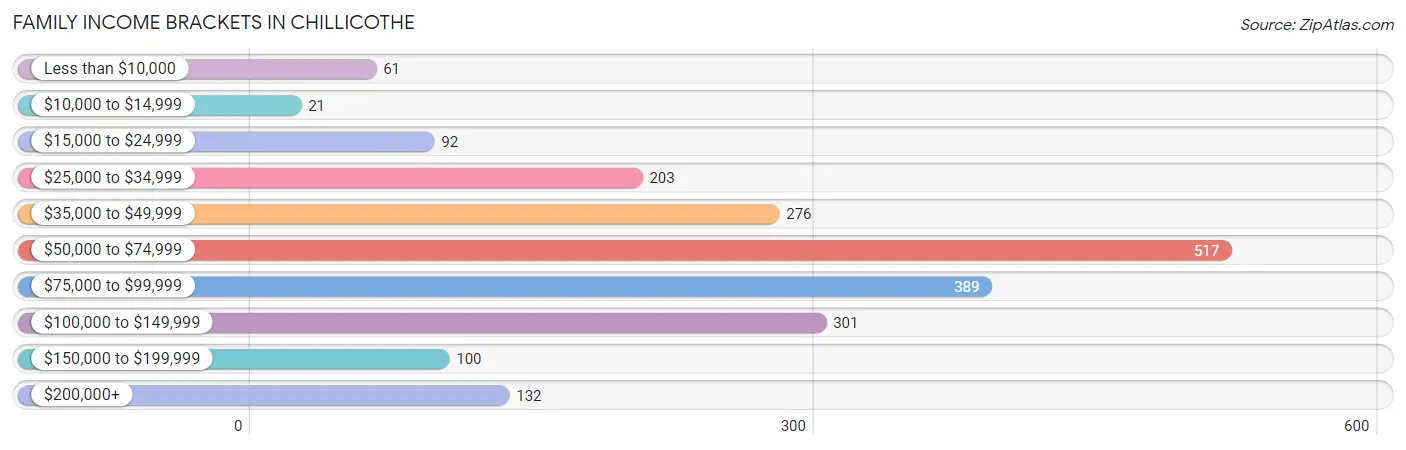
| Income Bracket | # Families | % Families |
| Less than $10,000 | 61 | 2.9% |
| $10,000 to $14,999 | 21 | 1.0% |
| $15,000 to $24,999 | 92 | 4.4% |
| $25,000 to $34,999 | 203 | 9.7% |
| $35,000 to $49,999 | 276 | 13.2% |
| $50,000 to $74,999 | 517 | 24.7% |
| $75,000 to $99,999 | 389 | 18.6% |
| $100,000 to $149,999 | 301 | 14.4% |
| $150,000 to $199,999 | 100 | 4.8% |
| $200,000+ | 132 | 6.3% |
Family Income by Famaliy Size in Chillicothe
4-person families (306 | 14.6%) account for the highest median family income in Chillicothe with $103,000 per family, while 2-person families (1,096 | 52.4%) have the highest median income of $29,760 per family member.
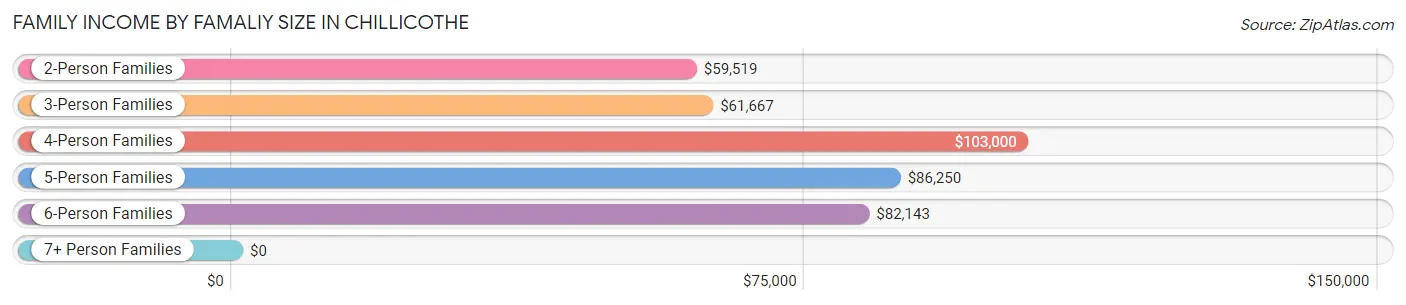
| Income Bracket | # Families | Median Income |
| 2-Person Families | 1,096 (52.4%) | $59,519 |
| 3-Person Families | 468 (22.4%) | $61,667 |
| 4-Person Families | 306 (14.6%) | $103,000 |
| 5-Person Families | 150 (7.2%) | $86,250 |
| 6-Person Families | 38 (1.8%) | $82,143 |
| 7+ Person Families | 34 (1.6%) | $0 |
| Total | 2,092 (100.0%) | $68,272 |
Family Income by Number of Earners in Chillicothe
The median family income in Chillicothe is $68,272, with families comprising 3+ earners (196) having the highest median family income of $158,056, while families with no earners (397) have the lowest median family income of $43,750, accounting for 9.4% and 19.0% of families, respectively.
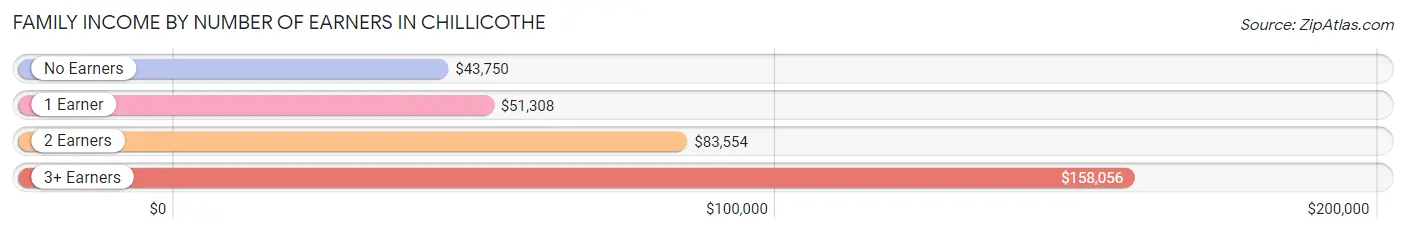
| Number of Earners | # Families | Median Income |
| No Earners | 397 (19.0%) | $43,750 |
| 1 Earner | 612 (29.2%) | $51,308 |
| 2 Earners | 887 (42.4%) | $83,554 |
| 3+ Earners | 196 (9.4%) | $158,056 |
| Total | 2,092 (100.0%) | $68,272 |
Household Income in Chillicothe
Household Income Brackets in Chillicothe
With 766 households falling in the category, the $50,000 to $74,999 income range is the most frequent in Chillicothe, accounting for 22.1% of all households. In contrast, only 101 households (2.9%) fall into the $10,000 to $14,999 income bracket, making it the least populous group.
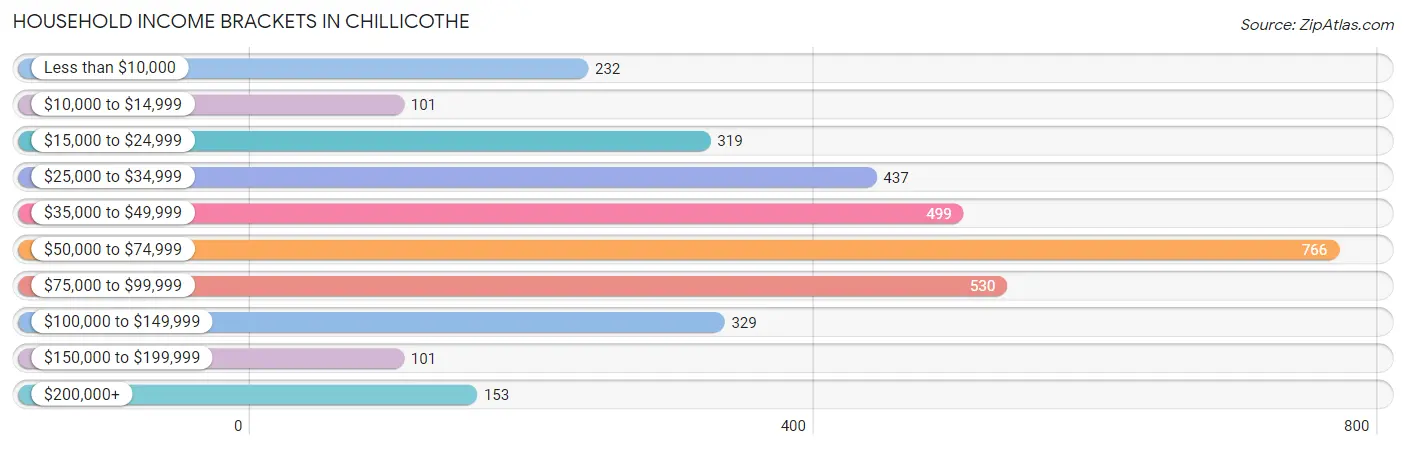
| Income Bracket | # Households | % Households |
| Less than $10,000 | 232 | 6.7% |
| $10,000 to $14,999 | 101 | 2.9% |
| $15,000 to $24,999 | 319 | 9.2% |
| $25,000 to $34,999 | 437 | 12.6% |
| $35,000 to $49,999 | 499 | 14.4% |
| $50,000 to $74,999 | 766 | 22.1% |
| $75,000 to $99,999 | 530 | 15.3% |
| $100,000 to $149,999 | 329 | 9.5% |
| $150,000 to $199,999 | 101 | 2.9% |
| $200,000+ | 153 | 4.4% |
Household Income by Householder Age in Chillicothe
The median household income in Chillicothe is $54,119, with the highest median household income of $59,263 found in the 45 to 64 years age bracket for the primary householder. A total of 1,121 households (32.3%) fall into this category. Meanwhile, the 15 to 24 years age bracket for the primary householder has the lowest median household income of $35,750, with 183 households (5.3%) in this group.
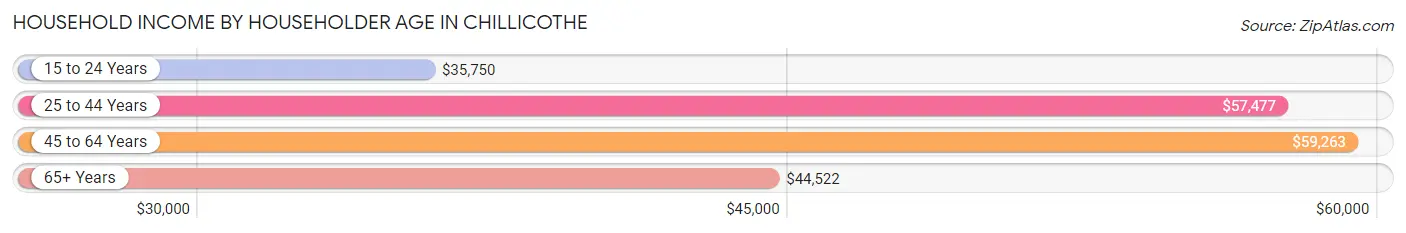
| Income Bracket | # Households | Median Income |
| 15 to 24 Years | 183 (5.3%) | $35,750 |
| 25 to 44 Years | 1,123 (32.4%) | $57,477 |
| 45 to 64 Years | 1,121 (32.3%) | $59,263 |
| 65+ Years | 1,039 (30.0%) | $44,522 |
| Total | 3,466 (100.0%) | $54,119 |
Poverty in Chillicothe
Income Below Poverty by Sex and Age in Chillicothe
With 11.4% poverty level for males and 14.3% for females among the residents of Chillicothe, 12 to 14 year old males and 55 to 64 year old females are the most vulnerable to poverty, with 81 males (57.0%) and 144 females (24.6%) in their respective age groups living below the poverty level.
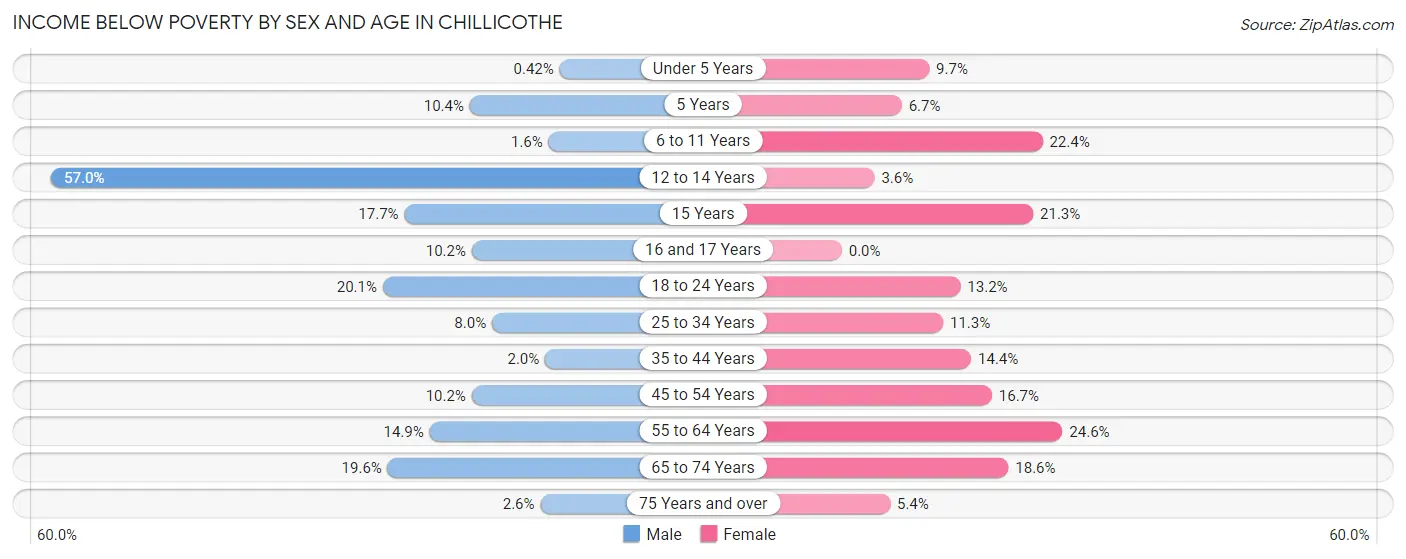
| Age Bracket | Male | Female |
| Under 5 Years | 1 (0.4%) | 22 (9.7%) |
| 5 Years | 5 (10.4%) | 3 (6.7%) |
| 6 to 11 Years | 6 (1.6%) | 59 (22.4%) |
| 12 to 14 Years | 81 (57.0%) | 8 (3.6%) |
| 15 Years | 20 (17.7%) | 13 (21.3%) |
| 16 and 17 Years | 5 (10.2%) | 0 (0.0%) |
| 18 to 24 Years | 73 (20.1%) | 49 (13.2%) |
| 25 to 34 Years | 42 (8.0%) | 61 (11.3%) |
| 35 to 44 Years | 10 (2.0%) | 54 (14.4%) |
| 45 to 54 Years | 34 (10.2%) | 68 (16.7%) |
| 55 to 64 Years | 83 (14.9%) | 144 (24.6%) |
| 65 to 74 Years | 73 (19.6%) | 74 (18.5%) |
| 75 Years and over | 7 (2.6%) | 28 (5.4%) |
| Total | 440 (11.4%) | 583 (14.3%) |
Income Above Poverty by Sex and Age in Chillicothe
According to the poverty statistics in Chillicothe, males aged under 5 years and females aged 16 and 17 years are the age groups that are most secure financially, with 99.6% of males and 100.0% of females in these age groups living above the poverty line.
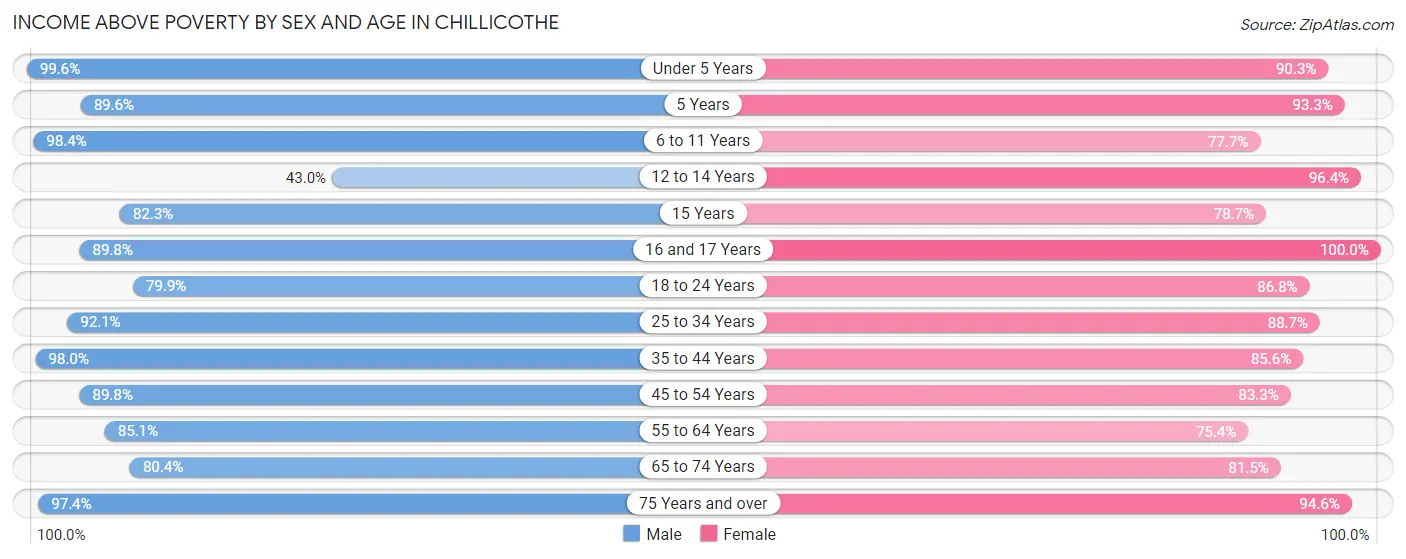
| Age Bracket | Male | Female |
| Under 5 Years | 235 (99.6%) | 204 (90.3%) |
| 5 Years | 43 (89.6%) | 42 (93.3%) |
| 6 to 11 Years | 359 (98.4%) | 205 (77.6%) |
| 12 to 14 Years | 61 (43.0%) | 212 (96.4%) |
| 15 Years | 93 (82.3%) | 48 (78.7%) |
| 16 and 17 Years | 44 (89.8%) | 61 (100.0%) |
| 18 to 24 Years | 290 (79.9%) | 322 (86.8%) |
| 25 to 34 Years | 486 (92.0%) | 480 (88.7%) |
| 35 to 44 Years | 482 (98.0%) | 321 (85.6%) |
| 45 to 54 Years | 299 (89.8%) | 339 (83.3%) |
| 55 to 64 Years | 474 (85.1%) | 442 (75.4%) |
| 65 to 74 Years | 300 (80.4%) | 325 (81.5%) |
| 75 Years and over | 266 (97.4%) | 493 (94.6%) |
| Total | 3,432 (88.6%) | 3,494 (85.7%) |
Income Below Poverty Among Married-Couple Families in Chillicothe
The poverty statistics for married-couple families in Chillicothe show that 3.1% or 47 of the total 1,538 families live below the poverty line. Families with 5 or more children have the highest poverty rate of 14.7%, comprising of 5 families. On the other hand, families with 3 or 4 children have the lowest poverty rate of 0.0%, which includes 0 families.
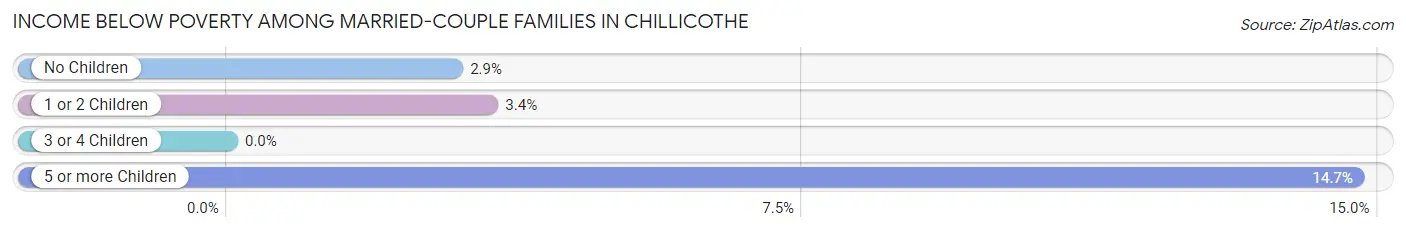
| Children | Above Poverty | Below Poverty |
| No Children | 859 (97.1%) | 26 (2.9%) |
| 1 or 2 Children | 455 (96.6%) | 16 (3.4%) |
| 3 or 4 Children | 148 (100.0%) | 0 (0.0%) |
| 5 or more Children | 29 (85.3%) | 5 (14.7%) |
| Total | 1,491 (96.9%) | 47 (3.1%) |
Income Below Poverty Among Single-Parent Households in Chillicothe
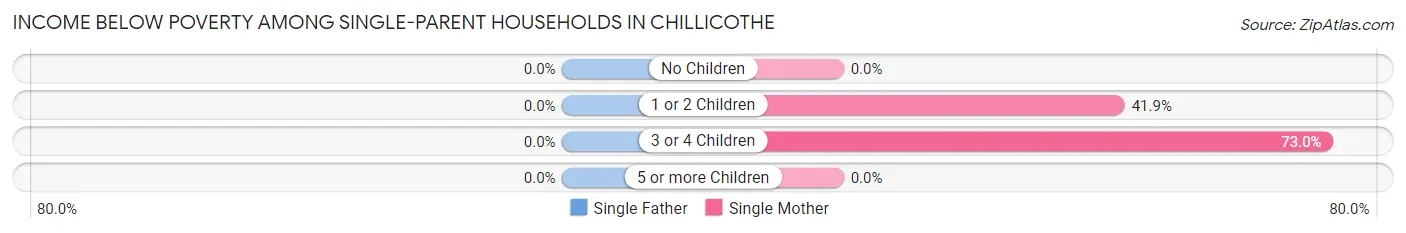
| Children | Single Father | Single Mother |
| No Children | 0 (0.0%) | 0 (0.0%) |
| 1 or 2 Children | 0 (0.0%) | 98 (41.9%) |
| 3 or 4 Children | 0 (0.0%) | 27 (73.0%) |
| 5 or more Children | 0 (0.0%) | 0 (0.0%) |
| Total | 0 (0.0%) | 125 (32.1%) |
Income Below Poverty Among Married-Couple vs Single-Parent Households in Chillicothe
The poverty data for Chillicothe shows that 47 of the married-couple family households (3.1%) and 125 of the single-parent households (22.6%) are living below the poverty level. Within the married-couple family households, those with 5 or more children have the highest poverty rate, with 5 households (14.7%) falling below the poverty line. Among the single-parent households, those with 3 or 4 children have the highest poverty rate, with 27 household (43.5%) living below poverty.
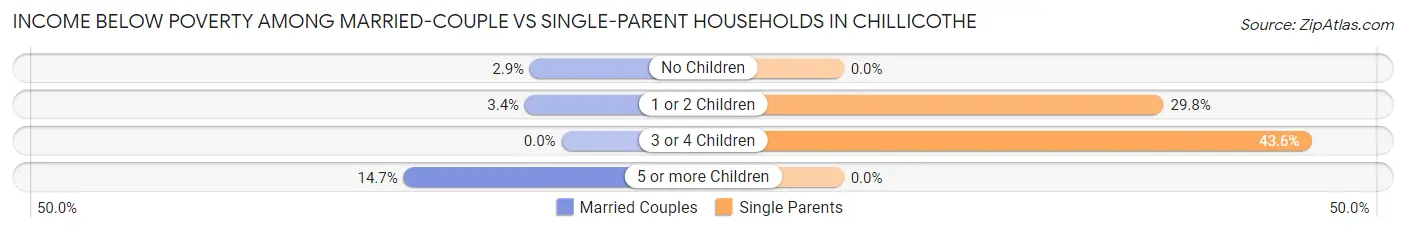
| Children | Married-Couple Families | Single-Parent Households |
| No Children | 26 (2.9%) | 0 (0.0%) |
| 1 or 2 Children | 16 (3.4%) | 98 (29.8%) |
| 3 or 4 Children | 0 (0.0%) | 27 (43.5%) |
| 5 or more Children | 5 (14.7%) | 0 (0.0%) |
| Total | 47 (3.1%) | 125 (22.6%) |
Race in Chillicothe
The most populous races in Chillicothe are White / Caucasian (8,183 | 90.0%), Black / African American (410 | 4.5%), and Two or more Races (346 | 3.8%).
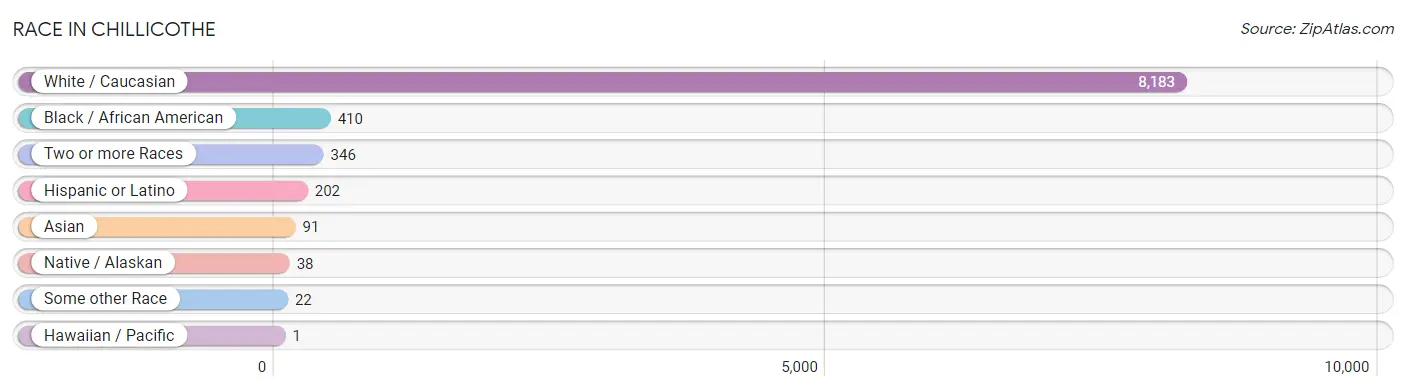
| Race | # Population | % Population |
| Asian | 91 | 1.0% |
| Black / African American | 410 | 4.5% |
| Hawaiian / Pacific | 1 | 0.0% |
| Hispanic or Latino | 202 | 2.2% |
| Native / Alaskan | 38 | 0.4% |
| White / Caucasian | 8,183 | 90.0% |
| Two or more Races | 346 | 3.8% |
| Some other Race | 22 | 0.2% |
| Total | 9,091 | 100.0% |
Ancestry in Chillicothe
The most populous ancestries reported in Chillicothe are German (1,139 | 12.5%), Irish (818 | 9.0%), English (790 | 8.7%), American (705 | 7.7%), and Scottish (134 | 1.5%), together accounting for 39.4% of all Chillicothe residents.
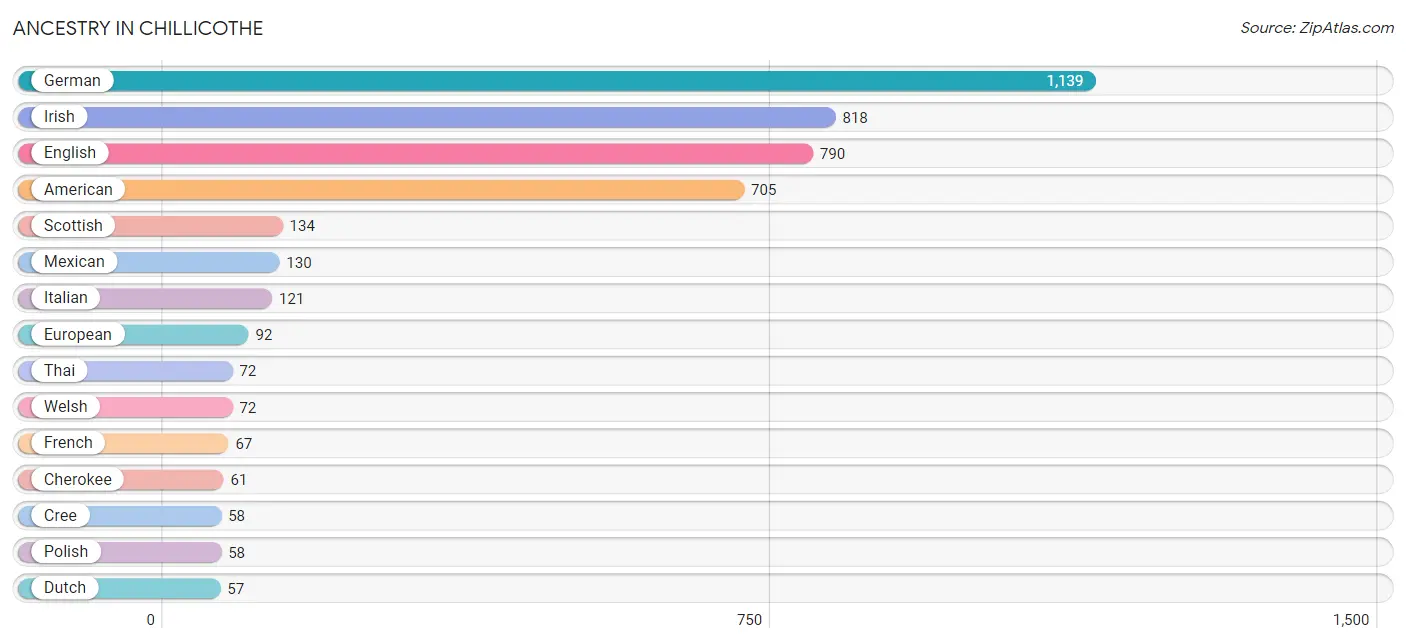
| Ancestry | # Population | % Population |
| African | 18 | 0.2% |
| Alaska Native | 2 | 0.0% |
| American | 705 | 7.7% |
| Apache | 1 | 0.0% |
| Austrian | 15 | 0.2% |
| Belgian | 1 | 0.0% |
| Bhutanese | 15 | 0.2% |
| Brazilian | 11 | 0.1% |
| British | 12 | 0.1% |
| Burmese | 15 | 0.2% |
| Central American | 5 | 0.1% |
| Cherokee | 61 | 0.7% |
| Cree | 58 | 0.6% |
| Croatian | 19 | 0.2% |
| Cuban | 5 | 0.1% |
| Danish | 8 | 0.1% |
| Dutch | 57 | 0.6% |
| English | 790 | 8.7% |
| European | 92 | 1.0% |
| Finnish | 8 | 0.1% |
| French | 67 | 0.7% |
| German | 1,139 | 12.5% |
| Greek | 7 | 0.1% |
| Guatemalan | 5 | 0.1% |
| Irish | 818 | 9.0% |
| Italian | 121 | 1.3% |
| Korean | 12 | 0.1% |
| Mexican | 130 | 1.4% |
| Paiute | 1 | 0.0% |
| Pennsylvania German | 9 | 0.1% |
| Polish | 58 | 0.6% |
| Puerto Rican | 30 | 0.3% |
| Russian | 7 | 0.1% |
| Scotch-Irish | 38 | 0.4% |
| Scottish | 134 | 1.5% |
| Shoshone | 9 | 0.1% |
| Sioux | 14 | 0.2% |
| Spanish | 1 | 0.0% |
| Sri Lankan | 24 | 0.3% |
| Subsaharan African | 18 | 0.2% |
| Swedish | 35 | 0.4% |
| Swiss | 7 | 0.1% |
| Thai | 72 | 0.8% |
| Ukrainian | 7 | 0.1% |
| Welsh | 72 | 0.8% | View All 45 Rows |
Immigrants in Chillicothe
The most numerous immigrant groups reported in Chillicothe came from Latin America (46 | 0.5%), South America (46 | 0.5%), Guyana (35 | 0.4%), Europe (24 | 0.3%), and Asia (14 | 0.2%), together accounting for 1.8% of all Chillicothe residents.
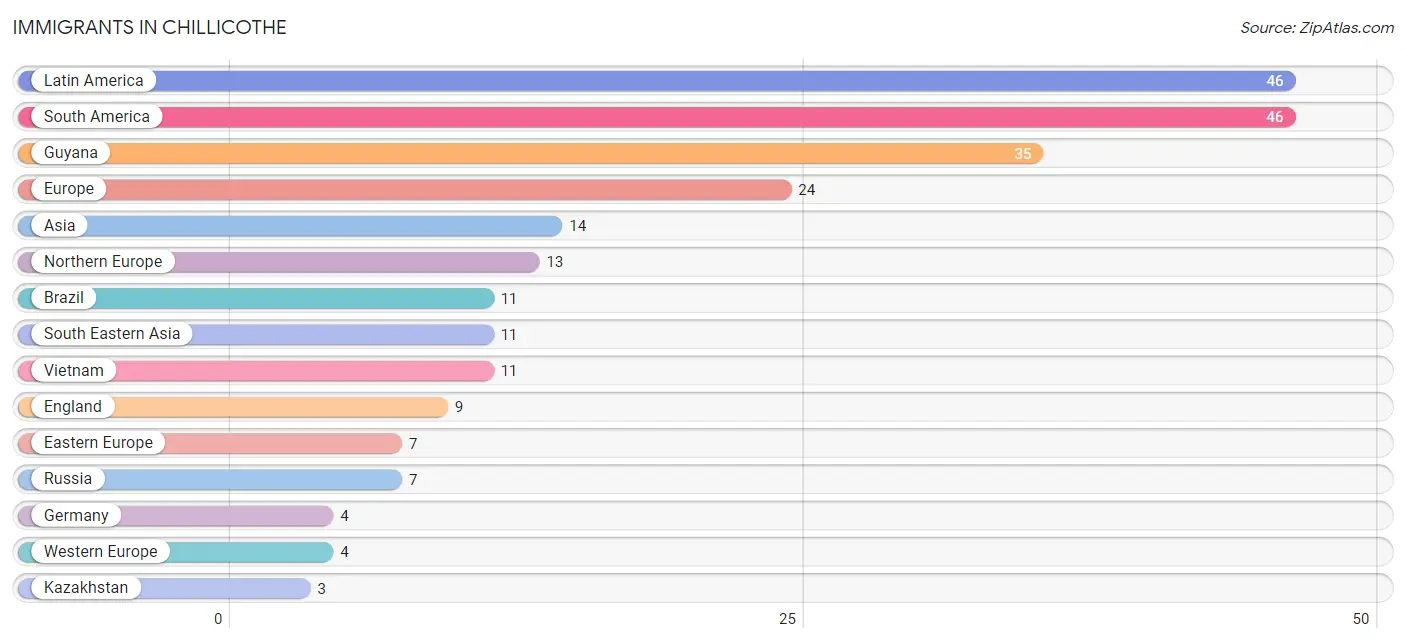
| Immigration Origin | # Population | % Population |
| Asia | 14 | 0.2% |
| Brazil | 11 | 0.1% |
| Eastern Europe | 7 | 0.1% |
| England | 9 | 0.1% |
| Europe | 24 | 0.3% |
| Germany | 4 | 0.0% |
| Guyana | 35 | 0.4% |
| Kazakhstan | 3 | 0.0% |
| Latin America | 46 | 0.5% |
| Northern Europe | 13 | 0.1% |
| Russia | 7 | 0.1% |
| South America | 46 | 0.5% |
| South Central Asia | 3 | 0.0% |
| South Eastern Asia | 11 | 0.1% |
| Vietnam | 11 | 0.1% |
| Western Europe | 4 | 0.0% | View All 16 Rows |
Sex and Age in Chillicothe
Sex and Age in Chillicothe
The most populous age groups in Chillicothe are 25 to 29 Years (347 | 8.9%) for men and 30 to 34 Years (498 | 9.6%) for women.
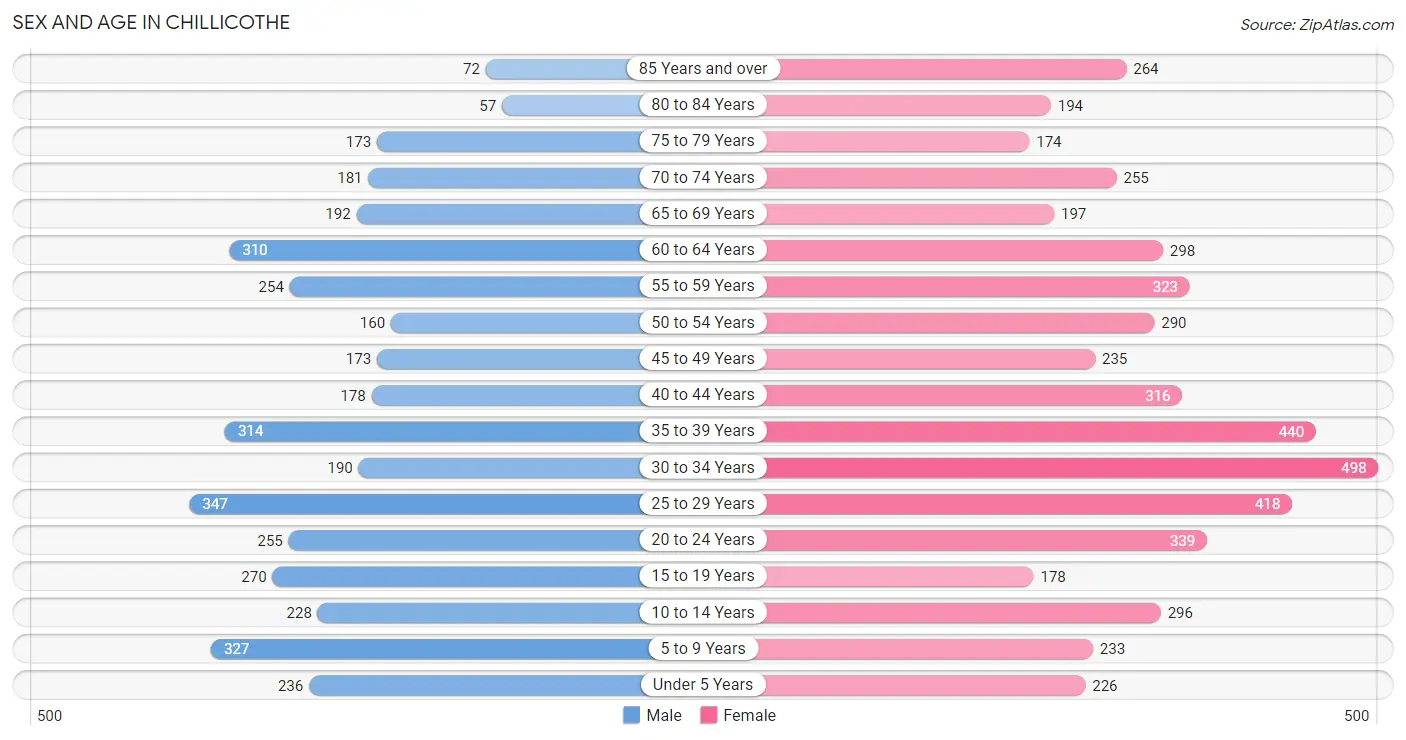
| Age Bracket | Male | Female |
| Under 5 Years | 236 (6.0%) | 226 (4.4%) |
| 5 to 9 Years | 327 (8.4%) | 233 (4.5%) |
| 10 to 14 Years | 228 (5.8%) | 296 (5.7%) |
| 15 to 19 Years | 270 (6.9%) | 178 (3.4%) |
| 20 to 24 Years | 255 (6.5%) | 339 (6.6%) |
| 25 to 29 Years | 347 (8.9%) | 418 (8.1%) |
| 30 to 34 Years | 190 (4.9%) | 498 (9.6%) |
| 35 to 39 Years | 314 (8.0%) | 440 (8.5%) |
| 40 to 44 Years | 178 (4.5%) | 316 (6.1%) |
| 45 to 49 Years | 173 (4.4%) | 235 (4.5%) |
| 50 to 54 Years | 160 (4.1%) | 290 (5.6%) |
| 55 to 59 Years | 254 (6.5%) | 323 (6.2%) |
| 60 to 64 Years | 310 (7.9%) | 298 (5.8%) |
| 65 to 69 Years | 192 (4.9%) | 197 (3.8%) |
| 70 to 74 Years | 181 (4.6%) | 255 (4.9%) |
| 75 to 79 Years | 173 (4.4%) | 174 (3.4%) |
| 80 to 84 Years | 57 (1.5%) | 194 (3.7%) |
| 85 Years and over | 72 (1.8%) | 264 (5.1%) |
| Total | 3,917 (100.0%) | 5,174 (100.0%) |
Families and Households in Chillicothe
Median Family Size in Chillicothe
The median family size in Chillicothe is 2.91 persons per family, with married-couple families (1,538 | 73.5%) accounting for the largest median family size of 3 persons per family. On the other hand, single male/father families (164 | 7.8%) represent the smallest median family size with 2.27 persons per family.
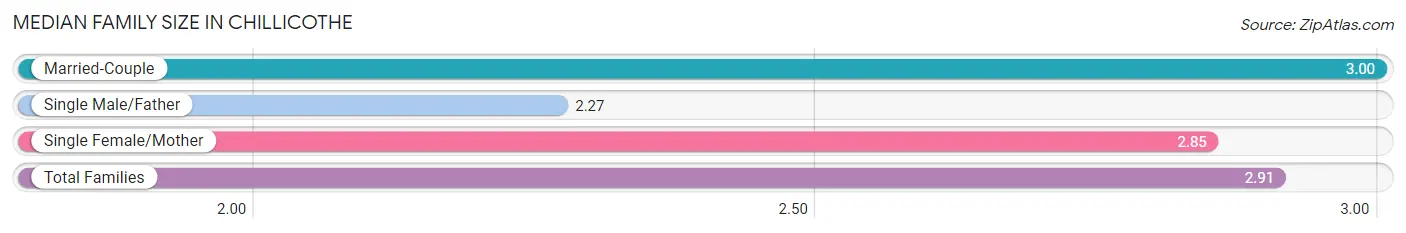
| Family Type | # Families | Family Size |
| Married-Couple | 1,538 (73.5%) | 3.00 |
| Single Male/Father | 164 (7.8%) | 2.27 |
| Single Female/Mother | 390 (18.6%) | 2.85 |
| Total Families | 2,092 (100.0%) | 2.91 |
Median Household Size in Chillicothe
The median household size in Chillicothe is 2.25 persons per household, with married-couple households (1,538 | 44.4%) accounting for the largest median household size of 3 persons per household. non-family households (1,374 | 39.6%) represent the smallest median household size with 1.19 persons per household.
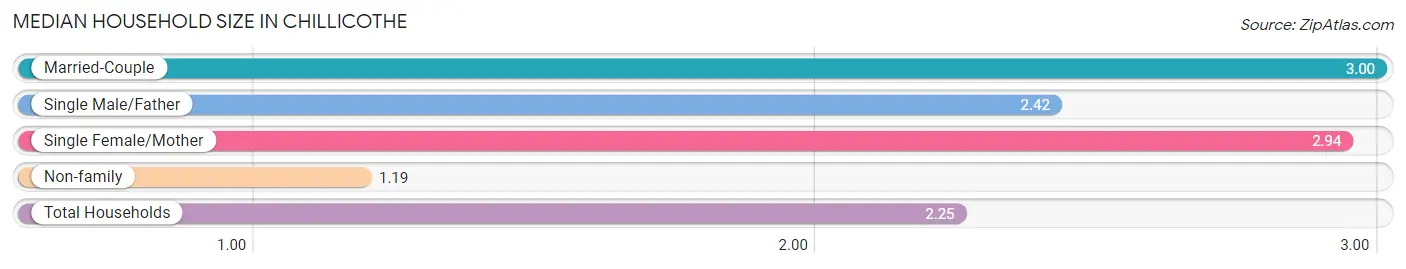
| Household Type | # Households | Household Size |
| Married-Couple | 1,538 (44.4%) | 3.00 |
| Single Male/Father | 164 (4.7%) | 2.42 |
| Single Female/Mother | 390 (11.3%) | 2.94 |
| Non-family | 1,374 (39.6%) | 1.19 |
| Total Households | 3,466 (100.0%) | 2.25 |
Household Size by Marriage Status in Chillicothe
Out of a total of 3,466 households in Chillicothe, 2,092 (60.4%) are family households, while 1,374 (39.6%) are nonfamily households. The most numerous type of family households are 2-person households, comprising 1,054, and the most common type of nonfamily households are 1-person households, comprising 1,145.
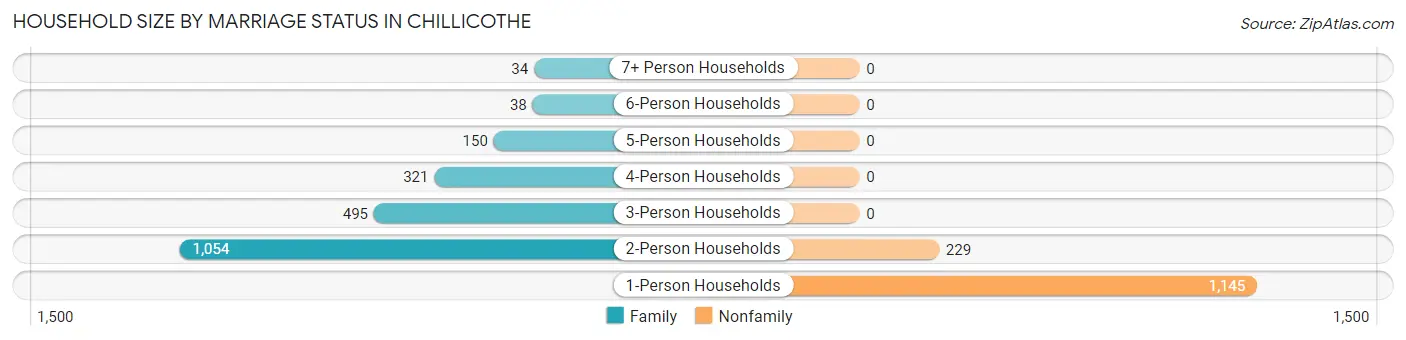
| Household Size | Family Households | Nonfamily Households |
| 1-Person Households | - | 1,145 (33.0%) |
| 2-Person Households | 1,054 (30.4%) | 229 (6.6%) |
| 3-Person Households | 495 (14.3%) | 0 (0.0%) |
| 4-Person Households | 321 (9.3%) | 0 (0.0%) |
| 5-Person Households | 150 (4.3%) | 0 (0.0%) |
| 6-Person Households | 38 (1.1%) | 0 (0.0%) |
| 7+ Person Households | 34 (1.0%) | 0 (0.0%) |
| Total | 2,092 (60.4%) | 1,374 (39.6%) |
Female Fertility in Chillicothe
Fertility by Age in Chillicothe
Average fertility rate in Chillicothe is 51.0 births per 1,000 women. Women in the age bracket of 20 to 34 years have the highest fertility rate with 96.0 births per 1,000 women. Women in the age bracket of 20 to 34 years acount for 96.0% of all women with births.
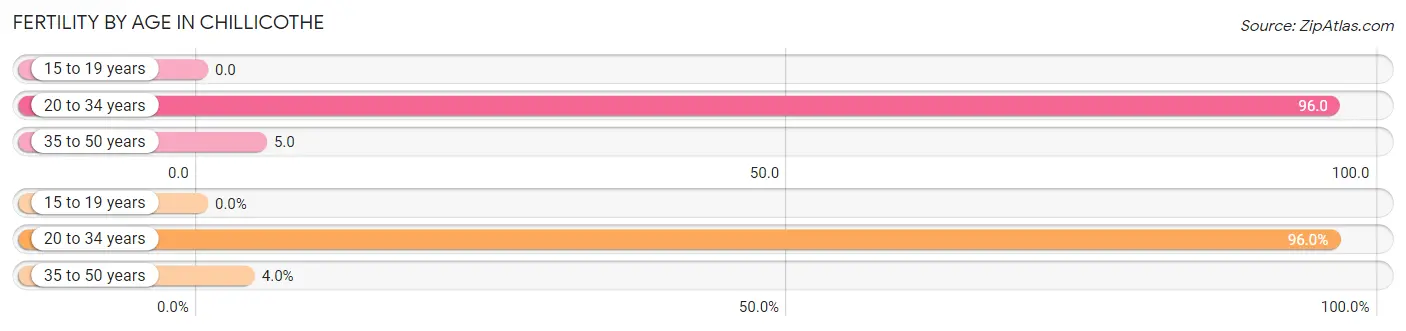
| Age Bracket | Women with Births | Births / 1,000 Women |
| 15 to 19 years | 0 (0.0%) | 0.0 |
| 20 to 34 years | 121 (96.0%) | 96.0 |
| 35 to 50 years | 5 (4.0%) | 5.0 |
| Total | 126 (100.0%) | 51.0 |
Fertility by Age by Marriage Status in Chillicothe
86.5% of women with births (126) in Chillicothe are married. The highest percentage of unmarried women with births falls into 20 to 34 years age bracket with 14.1% of them unmarried at the time of birth, while the lowest percentage of unmarried women with births belong to 35 to 50 years age bracket with 0.0% of them unmarried.
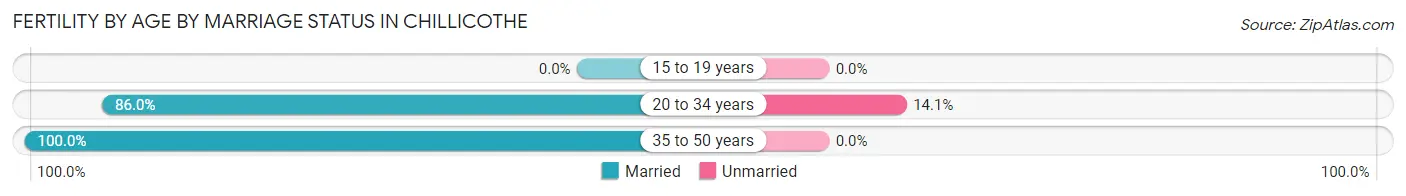
| Age Bracket | Married | Unmarried |
| 15 to 19 years | 0 (0.0%) | 0 (0.0%) |
| 20 to 34 years | 104 (86.0%) | 17 (14.1%) |
| 35 to 50 years | 5 (100.0%) | 0 (0.0%) |
| Total | 109 (86.5%) | 17 (13.5%) |
Fertility by Education in Chillicothe
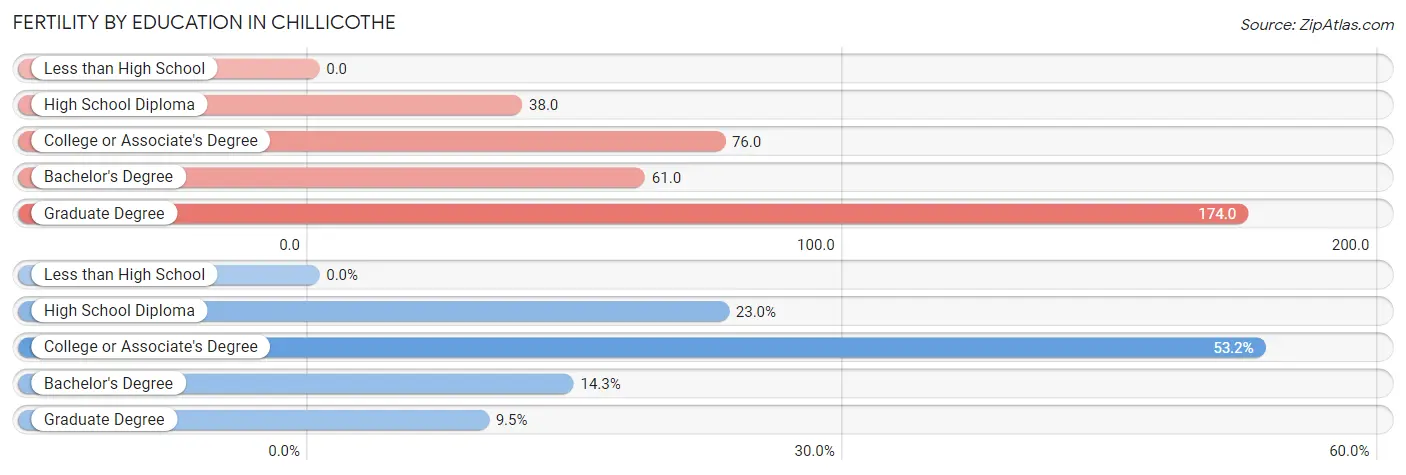
| Educational Attainment | Women with Births | Births / 1,000 Women |
| Less than High School | 0 (0.0%) | 0.0 |
| High School Diploma | 29 (23.0%) | 38.0 |
| College or Associate's Degree | 67 (53.2%) | 76.0 |
| Bachelor's Degree | 18 (14.3%) | 61.0 |
| Graduate Degree | 12 (9.5%) | 174.0 |
| Total | 126 (100.0%) | 51.0 |
Fertility by Education by Marriage Status in Chillicothe
13.5% of women with births in Chillicothe are unmarried. Women with the educational attainment of high school diploma are most likely to be married with 100.0% of them married at childbirth, while women with the educational attainment of college or associate's degree are least likely to be married with 25.4% of them unmarried at childbirth.
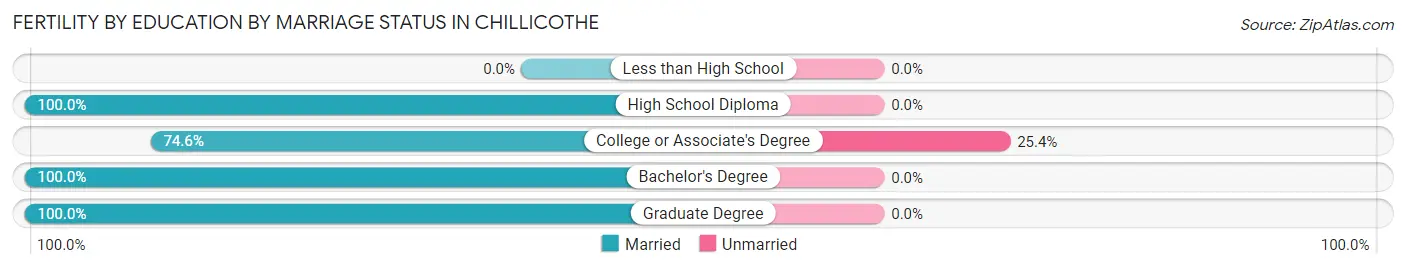
| Educational Attainment | Married | Unmarried |
| Less than High School | 0 (0.0%) | 0 (0.0%) |
| High School Diploma | 29 (100.0%) | 0 (0.0%) |
| College or Associate's Degree | 50 (74.6%) | 17 (25.4%) |
| Bachelor's Degree | 18 (100.0%) | 0 (0.0%) |
| Graduate Degree | 12 (100.0%) | 0 (0.0%) |
| Total | 109 (86.5%) | 17 (13.5%) |
Employment Characteristics in Chillicothe
Employment by Class of Employer in Chillicothe
Among the 3,677 employed individuals in Chillicothe, private company employees (2,378 | 64.7%), state government employees (301 | 8.2%), and not-for-profit organizations (293 | 8.0%) make up the most common classes of employment.
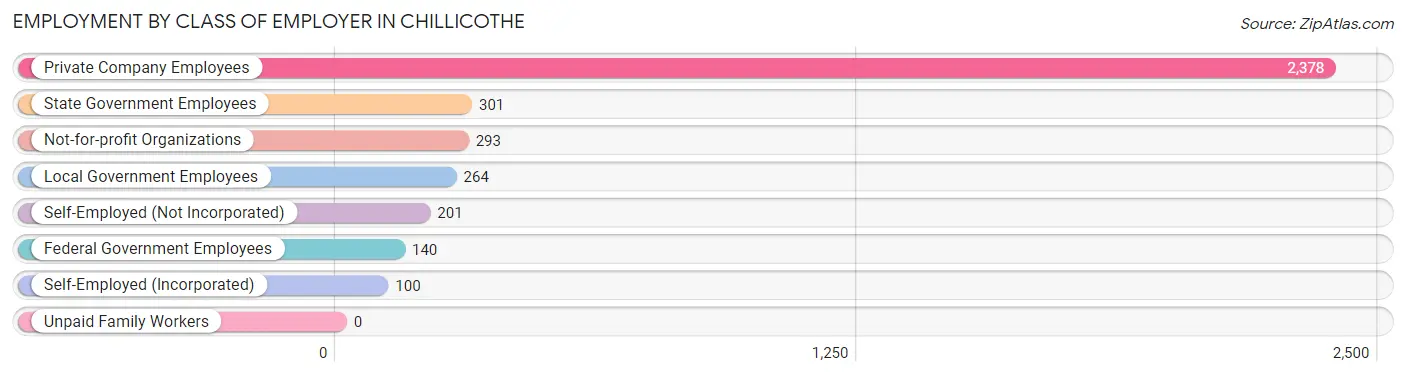
| Employer Class | # Employees | % Employees |
| Private Company Employees | 2,378 | 64.7% |
| Self-Employed (Incorporated) | 100 | 2.7% |
| Self-Employed (Not Incorporated) | 201 | 5.5% |
| Not-for-profit Organizations | 293 | 8.0% |
| Local Government Employees | 264 | 7.2% |
| State Government Employees | 301 | 8.2% |
| Federal Government Employees | 140 | 3.8% |
| Unpaid Family Workers | 0 | 0.0% |
| Total | 3,677 | 100.0% |
Employment Status by Age in Chillicothe
According to the labor force statistics for Chillicothe, out of the total population over 16 years of age (7,371), 52.1% or 3,840 individuals are in the labor force, with 3.5% or 134 of them unemployed. The age group with the highest labor force participation rate is 20 to 24 years, with 81.3% or 483 individuals in the labor force. Within the labor force, the 16 to 19 years age range has the highest percentage of unemployed individuals, with 23.1% or 37 of them being unemployed.
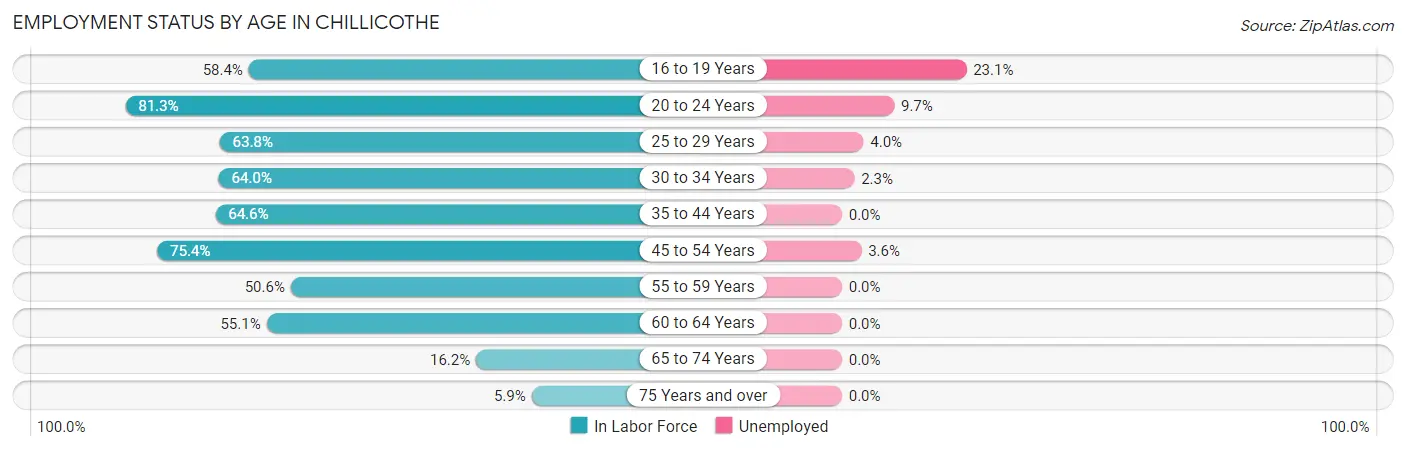
| Age Bracket | In Labor Force | Unemployed |
| 16 to 19 Years | 160 (58.4%) | 37 (23.1%) |
| 20 to 24 Years | 483 (81.3%) | 47 (9.7%) |
| 25 to 29 Years | 488 (63.8%) | 20 (4.0%) |
| 30 to 34 Years | 440 (64.0%) | 10 (2.3%) |
| 35 to 44 Years | 806 (64.6%) | 0 (0.0%) |
| 45 to 54 Years | 647 (75.4%) | 23 (3.6%) |
| 55 to 59 Years | 292 (50.6%) | 0 (0.0%) |
| 60 to 64 Years | 335 (55.1%) | 0 (0.0%) |
| 65 to 74 Years | 134 (16.2%) | 0 (0.0%) |
| 75 Years and over | 55 (5.9%) | 0 (0.0%) |
| Total | 3,840 (52.1%) | 134 (3.5%) |
Employment Status by Educational Attainment in Chillicothe
According to labor force statistics for Chillicothe, 63.4% of individuals (3,008) out of the total population between 25 and 64 years of age (4,744) are in the labor force, with 1.7% or 51 of them being unemployed. The group with the highest labor force participation rate are those with the educational attainment of bachelor's degree or higher, with 95.0% or 931 individuals in the labor force. Within the labor force, individuals with less than high school education have the highest percentage of unemployment, with 4.4% or 10 of them being unemployed.
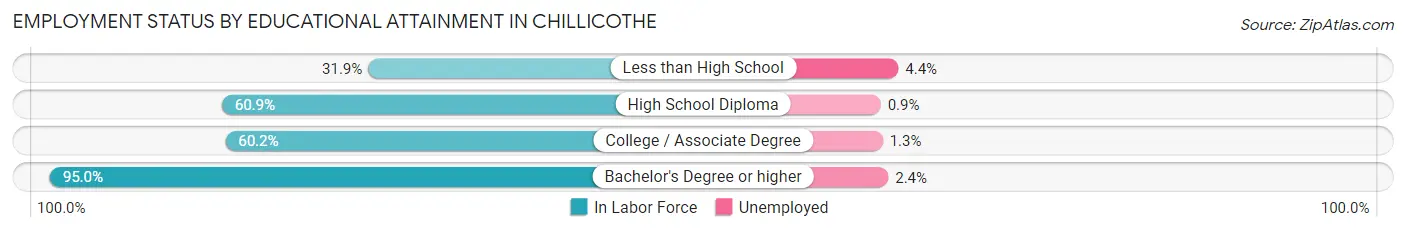
| Educational Attainment | In Labor Force | Unemployed |
| Less than High School | 227 (31.9%) | 31 (4.4%) |
| High School Diploma | 1,060 (60.9%) | 16 (0.9%) |
| College / Associate Degree | 789 (60.2%) | 17 (1.3%) |
| Bachelor's Degree or higher | 931 (95.0%) | 24 (2.4%) |
| Total | 3,008 (63.4%) | 81 (1.7%) |
Employment Occupations by Sex in Chillicothe
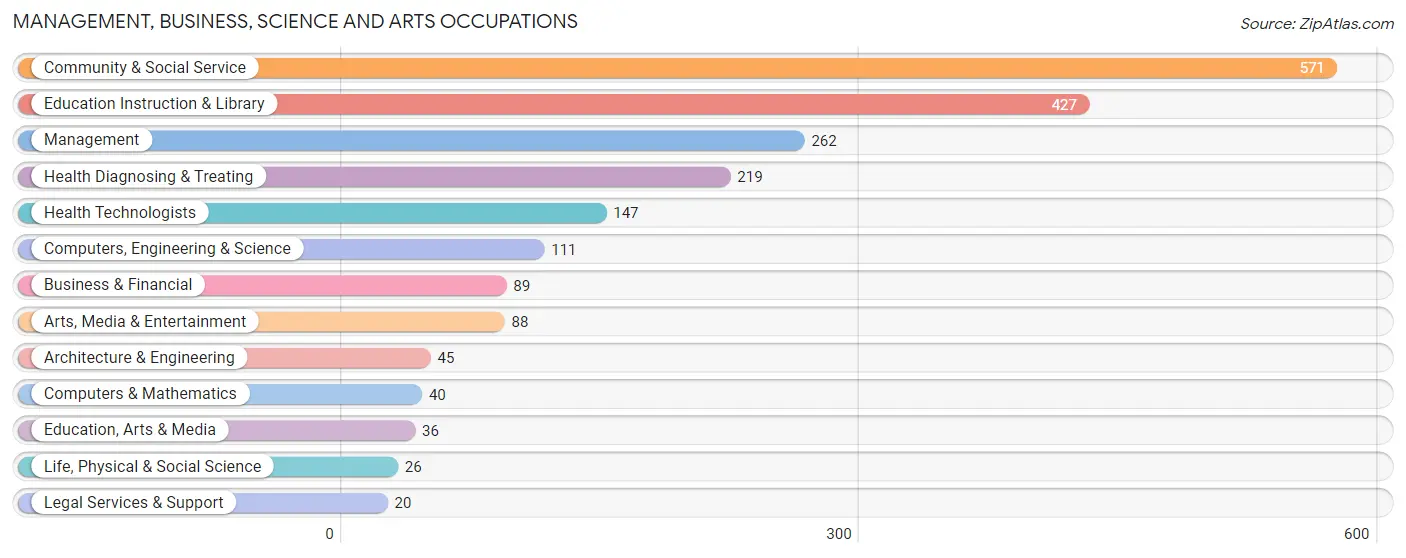
Management, Business, Science and Arts Occupations
The most common Management, Business, Science and Arts occupations in Chillicothe are Community & Social Service (571 | 15.5%), Education Instruction & Library (427 | 11.6%), Management (262 | 7.1%), Health Diagnosing & Treating (219 | 6.0%), and Health Technologists (147 | 4.0%).
Management, Business, Science and Arts Occupations by Sex
Within the Management, Business, Science and Arts occupations in Chillicothe, the most male-oriented occupations are Computers & Mathematics (85.0%), Arts, Media & Entertainment (77.3%), and Management (72.5%), while the most female-oriented occupations are Education, Arts & Media (100.0%), Legal Services & Support (95.0%), and Health Technologists (80.9%).
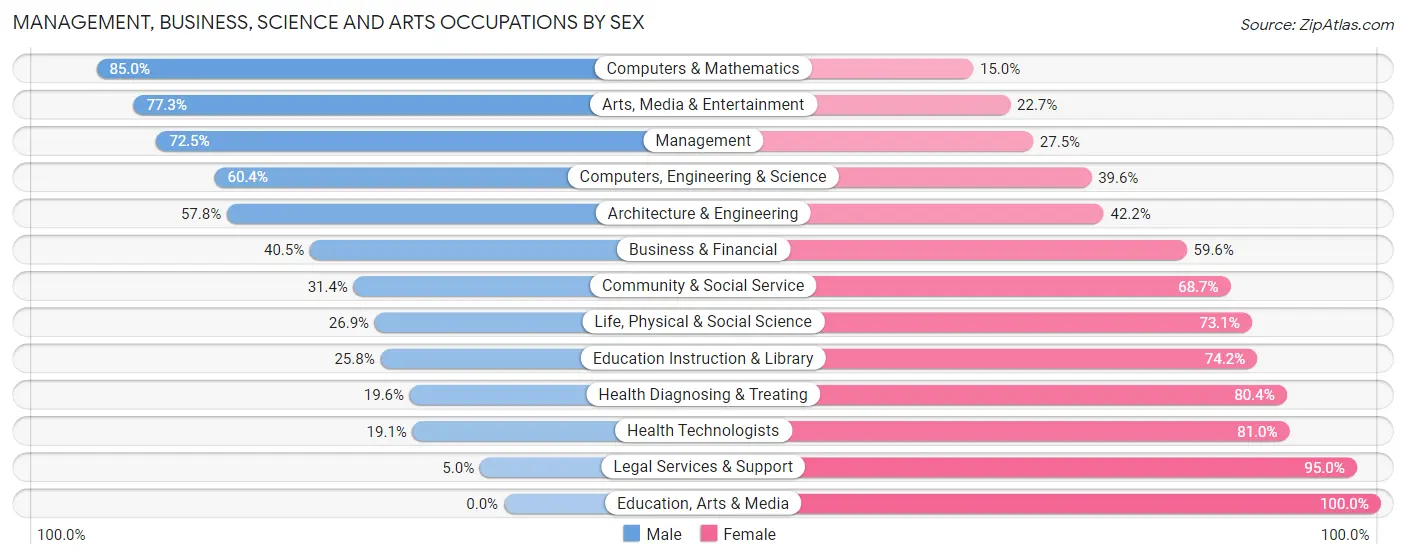
| Occupation | Male | Female |
| Management | 190 (72.5%) | 72 (27.5%) |
| Business & Financial | 36 (40.5%) | 53 (59.6%) |
| Computers, Engineering & Science | 67 (60.4%) | 44 (39.6%) |
| Computers & Mathematics | 34 (85.0%) | 6 (15.0%) |
| Architecture & Engineering | 26 (57.8%) | 19 (42.2%) |
| Life, Physical & Social Science | 7 (26.9%) | 19 (73.1%) |
| Community & Social Service | 179 (31.4%) | 392 (68.6%) |
| Education, Arts & Media | 0 (0.0%) | 36 (100.0%) |
| Legal Services & Support | 1 (5.0%) | 19 (95.0%) |
| Education Instruction & Library | 110 (25.8%) | 317 (74.2%) |
| Arts, Media & Entertainment | 68 (77.3%) | 20 (22.7%) |
| Health Diagnosing & Treating | 43 (19.6%) | 176 (80.4%) |
| Health Technologists | 28 (19.1%) | 119 (80.9%) |
| Total (Category) | 515 (41.1%) | 737 (58.9%) |
| Total (Overall) | 1,943 (52.9%) | 1,730 (47.1%) |
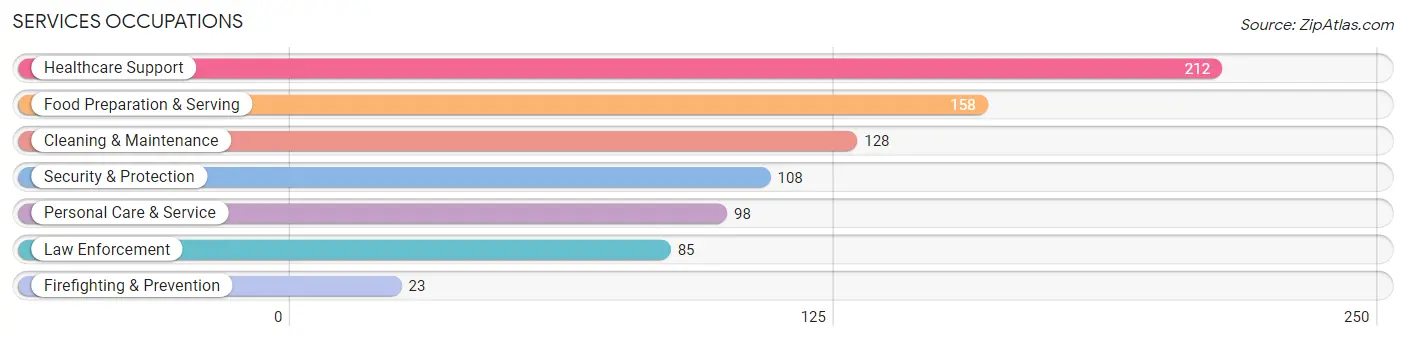
Services Occupations
The most common Services occupations in Chillicothe are Healthcare Support (212 | 5.8%), Food Preparation & Serving (158 | 4.3%), Cleaning & Maintenance (128 | 3.5%), Security & Protection (108 | 2.9%), and Personal Care & Service (98 | 2.7%).
Services Occupations by Sex
Within the Services occupations in Chillicothe, the most male-oriented occupations are Firefighting & Prevention (100.0%), Cleaning & Maintenance (91.4%), and Security & Protection (78.7%), while the most female-oriented occupations are Healthcare Support (100.0%), Personal Care & Service (89.8%), and Food Preparation & Serving (53.2%).
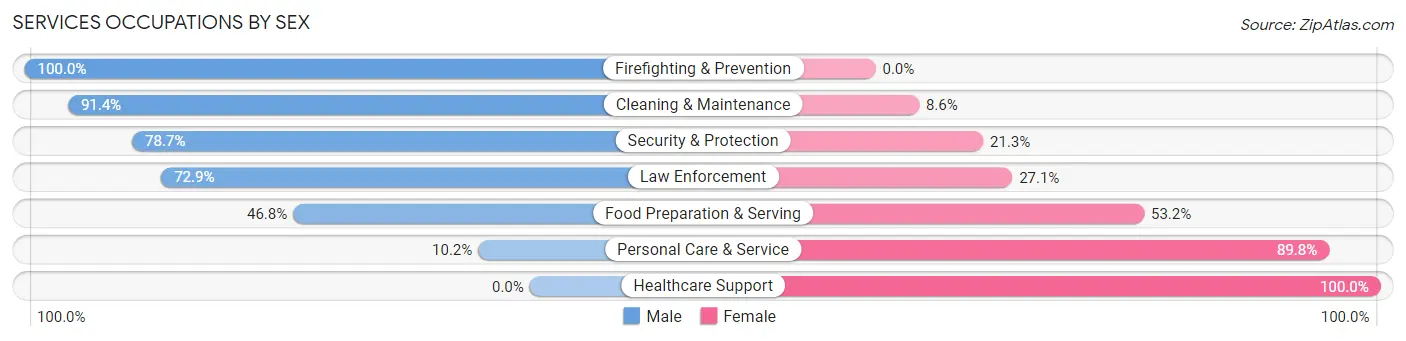
| Occupation | Male | Female |
| Healthcare Support | 0 (0.0%) | 212 (100.0%) |
| Security & Protection | 85 (78.7%) | 23 (21.3%) |
| Firefighting & Prevention | 23 (100.0%) | 0 (0.0%) |
| Law Enforcement | 62 (72.9%) | 23 (27.1%) |
| Food Preparation & Serving | 74 (46.8%) | 84 (53.2%) |
| Cleaning & Maintenance | 117 (91.4%) | 11 (8.6%) |
| Personal Care & Service | 10 (10.2%) | 88 (89.8%) |
| Total (Category) | 286 (40.6%) | 418 (59.4%) |
| Total (Overall) | 1,943 (52.9%) | 1,730 (47.1%) |
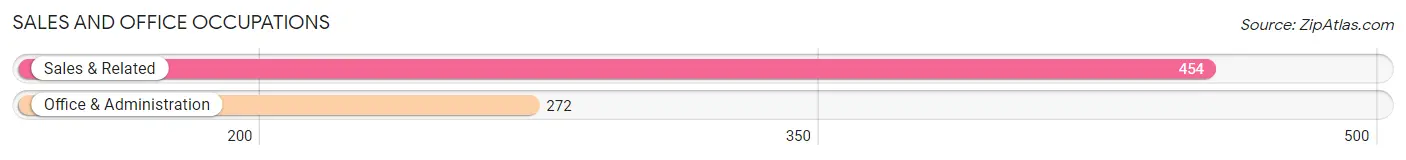
Sales and Office Occupations
The most common Sales and Office occupations in Chillicothe are Sales & Related (454 | 12.4%), and Office & Administration (272 | 7.4%).
Sales and Office Occupations by Sex
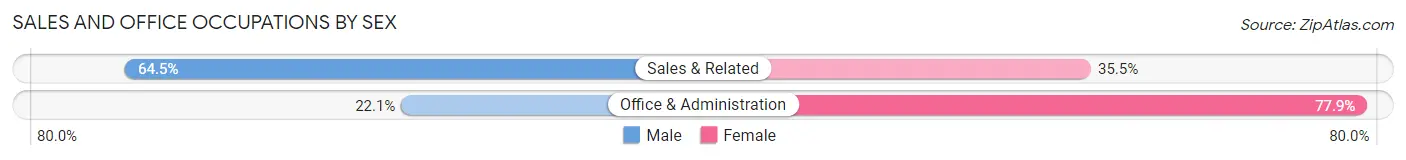
| Occupation | Male | Female |
| Sales & Related | 293 (64.5%) | 161 (35.5%) |
| Office & Administration | 60 (22.1%) | 212 (77.9%) |
| Total (Category) | 353 (48.6%) | 373 (51.4%) |
| Total (Overall) | 1,943 (52.9%) | 1,730 (47.1%) |
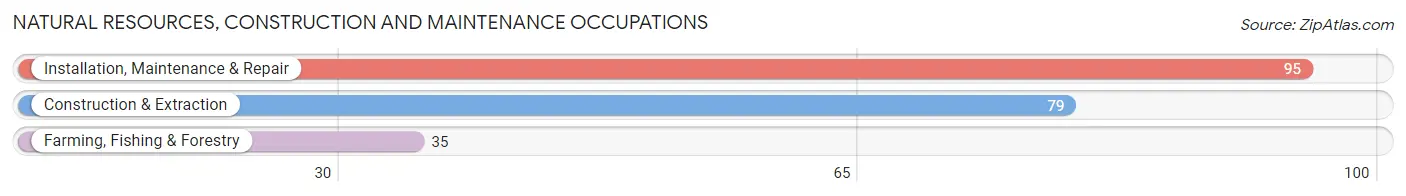
Natural Resources, Construction and Maintenance Occupations
The most common Natural Resources, Construction and Maintenance occupations in Chillicothe are Installation, Maintenance & Repair (95 | 2.6%), Construction & Extraction (79 | 2.1%), and Farming, Fishing & Forestry (35 | 0.9%).
Natural Resources, Construction and Maintenance Occupations by Sex
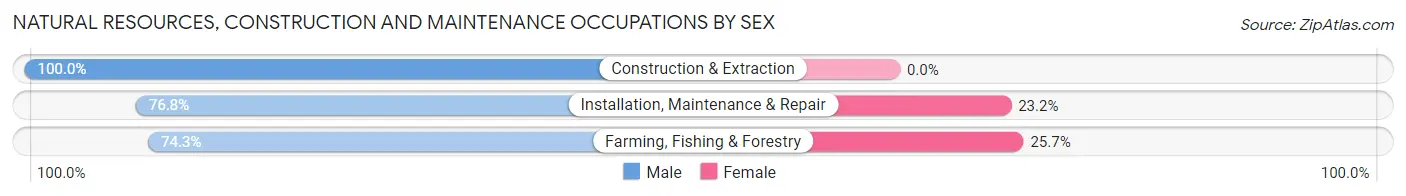
| Occupation | Male | Female |
| Farming, Fishing & Forestry | 26 (74.3%) | 9 (25.7%) |
| Construction & Extraction | 79 (100.0%) | 0 (0.0%) |
| Installation, Maintenance & Repair | 73 (76.8%) | 22 (23.2%) |
| Total (Category) | 178 (85.2%) | 31 (14.8%) |
| Total (Overall) | 1,943 (52.9%) | 1,730 (47.1%) |
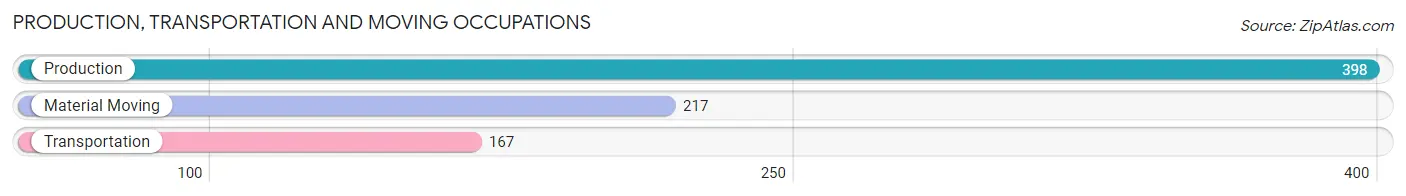
Production, Transportation and Moving Occupations
The most common Production, Transportation and Moving occupations in Chillicothe are Production (398 | 10.8%), Material Moving (217 | 5.9%), and Transportation (167 | 4.5%).
Production, Transportation and Moving Occupations by Sex
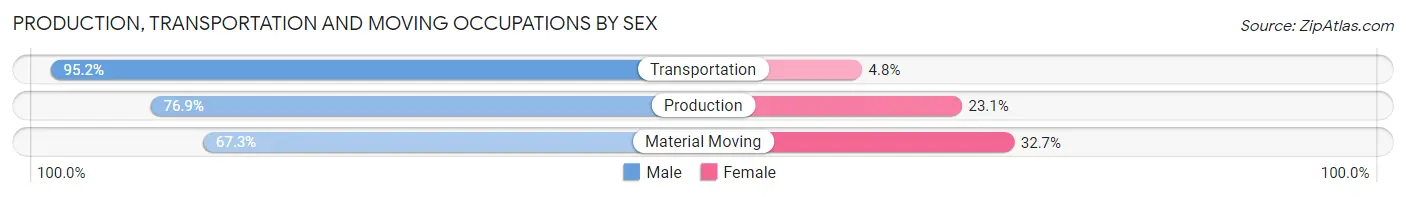
| Occupation | Male | Female |
| Production | 306 (76.9%) | 92 (23.1%) |
| Transportation | 159 (95.2%) | 8 (4.8%) |
| Material Moving | 146 (67.3%) | 71 (32.7%) |
| Total (Category) | 611 (78.1%) | 171 (21.9%) |
| Total (Overall) | 1,943 (52.9%) | 1,730 (47.1%) |
Employment Industries by Sex in Chillicothe
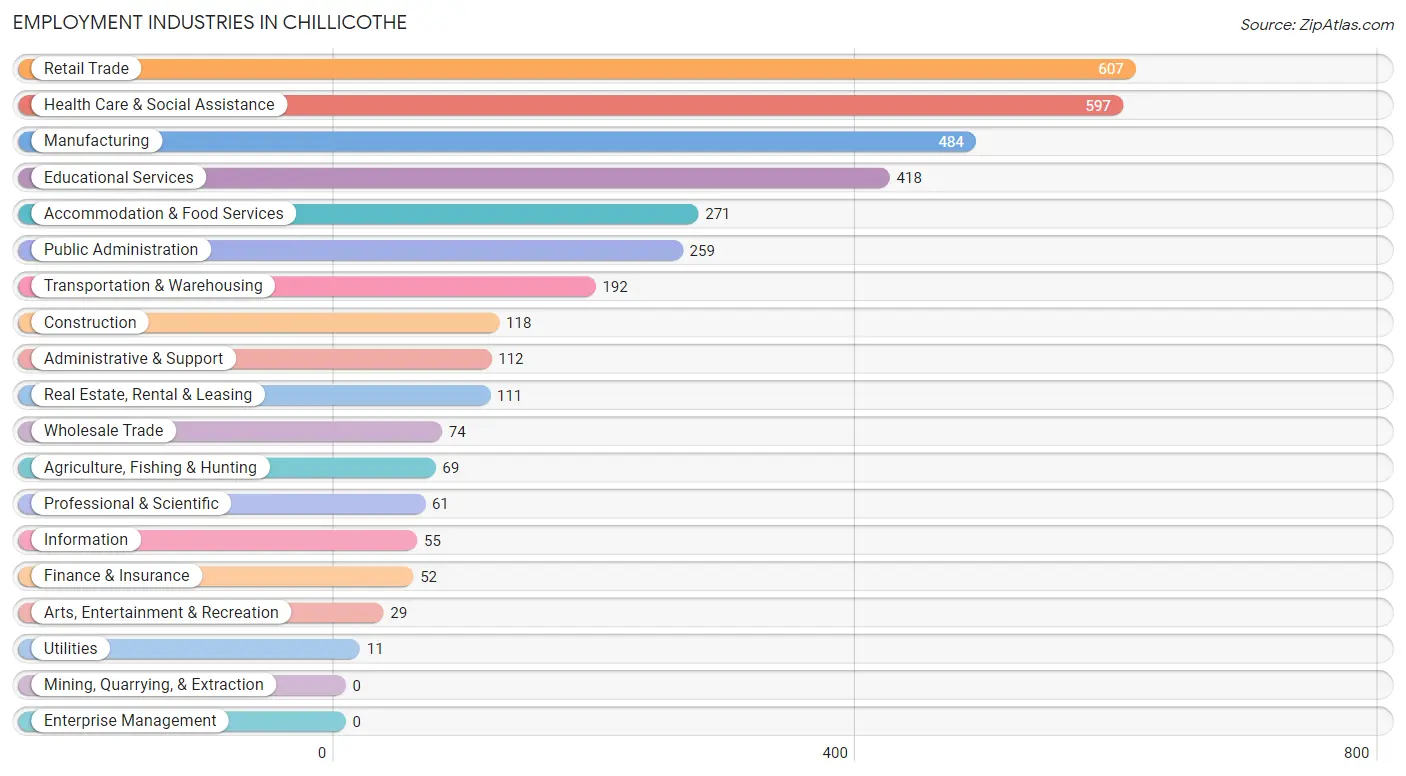
Employment Industries in Chillicothe
The major employment industries in Chillicothe include Retail Trade (607 | 16.5%), Health Care & Social Assistance (597 | 16.3%), Manufacturing (484 | 13.2%), Educational Services (418 | 11.4%), and Accommodation & Food Services (271 | 7.4%).
Employment Industries by Sex in Chillicothe
The Chillicothe industries that see more men than women are Wholesale Trade (100.0%), Utilities (100.0%), and Construction (95.8%), whereas the industries that tend to have a higher number of women are Health Care & Social Assistance (87.1%), Arts, Entertainment & Recreation (79.3%), and Educational Services (69.6%).
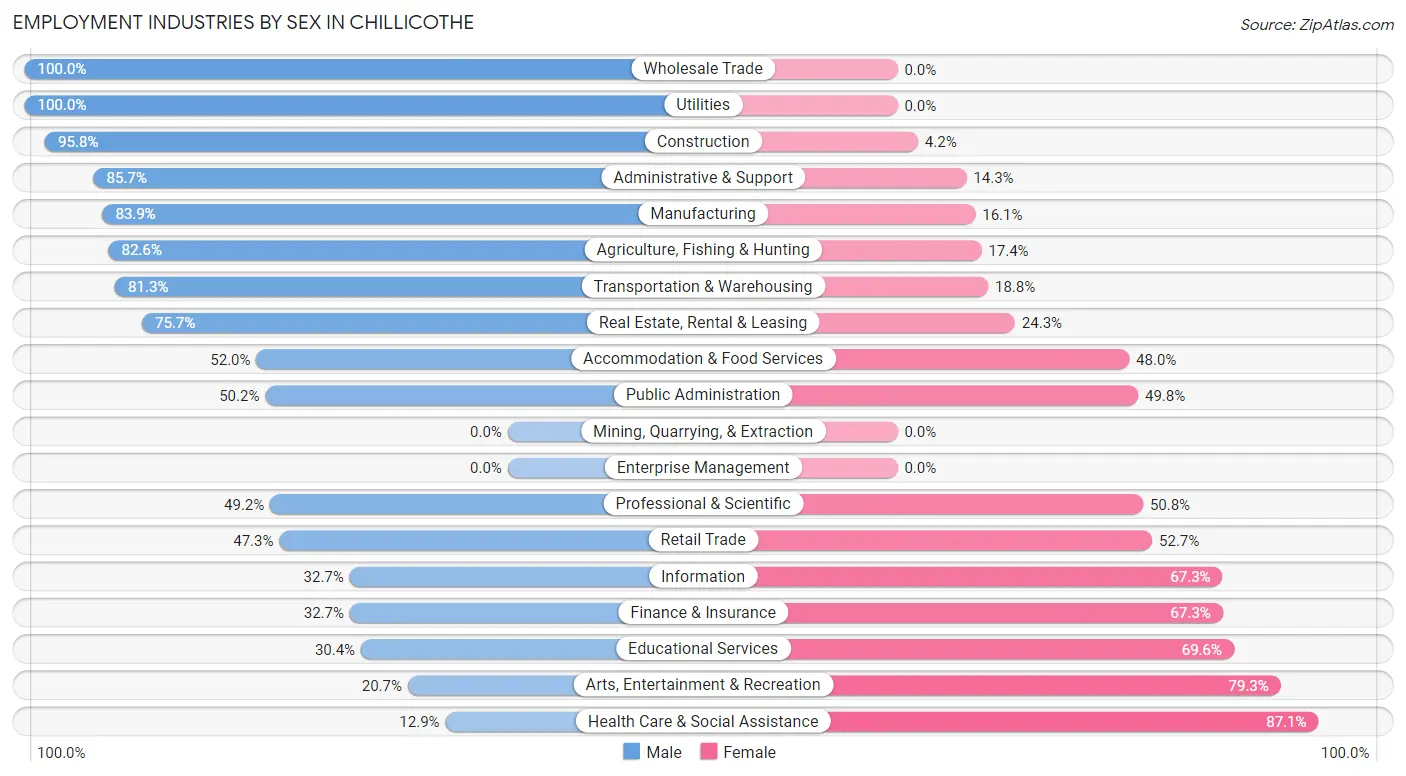
| Industry | Male | Female |
| Agriculture, Fishing & Hunting | 57 (82.6%) | 12 (17.4%) |
| Mining, Quarrying, & Extraction | 0 (0.0%) | 0 (0.0%) |
| Construction | 113 (95.8%) | 5 (4.2%) |
| Manufacturing | 406 (83.9%) | 78 (16.1%) |
| Wholesale Trade | 74 (100.0%) | 0 (0.0%) |
| Retail Trade | 287 (47.3%) | 320 (52.7%) |
| Transportation & Warehousing | 156 (81.2%) | 36 (18.8%) |
| Utilities | 11 (100.0%) | 0 (0.0%) |
| Information | 18 (32.7%) | 37 (67.3%) |
| Finance & Insurance | 17 (32.7%) | 35 (67.3%) |
| Real Estate, Rental & Leasing | 84 (75.7%) | 27 (24.3%) |
| Professional & Scientific | 30 (49.2%) | 31 (50.8%) |
| Enterprise Management | 0 (0.0%) | 0 (0.0%) |
| Administrative & Support | 96 (85.7%) | 16 (14.3%) |
| Educational Services | 127 (30.4%) | 291 (69.6%) |
| Health Care & Social Assistance | 77 (12.9%) | 520 (87.1%) |
| Arts, Entertainment & Recreation | 6 (20.7%) | 23 (79.3%) |
| Accommodation & Food Services | 141 (52.0%) | 130 (48.0%) |
| Public Administration | 130 (50.2%) | 129 (49.8%) |
| Total | 1,943 (52.9%) | 1,730 (47.1%) |
Education in Chillicothe
School Enrollment in Chillicothe
The most common levels of schooling among the 1,998 students in Chillicothe are high school (524 | 26.2%), middle school (516 | 25.8%), and elementary school (379 | 19.0%).
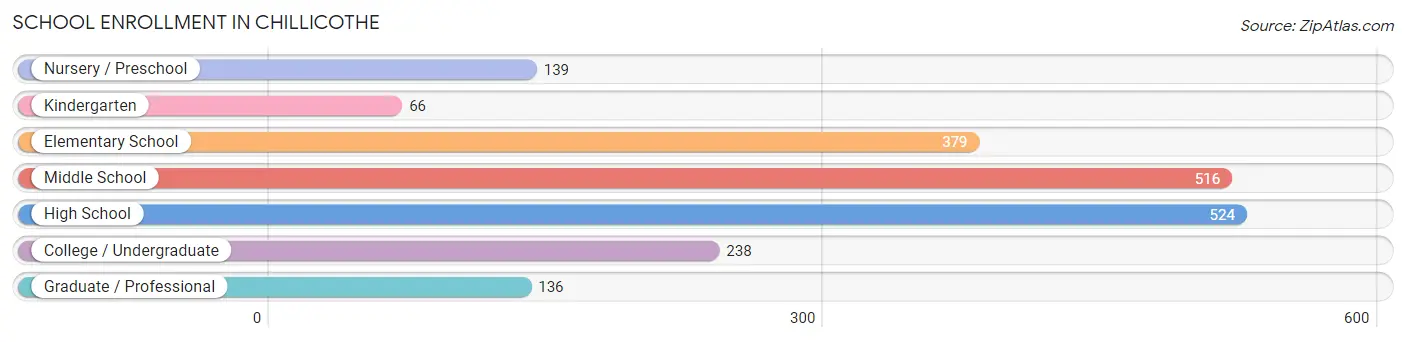
| School Level | # Students | % Students |
| Nursery / Preschool | 139 | 7.0% |
| Kindergarten | 66 | 3.3% |
| Elementary School | 379 | 19.0% |
| Middle School | 516 | 25.8% |
| High School | 524 | 26.2% |
| College / Undergraduate | 238 | 11.9% |
| Graduate / Professional | 136 | 6.8% |
| Total | 1,998 | 100.0% |
School Enrollment by Age by Funding Source in Chillicothe
Out of a total of 1,998 students who are enrolled in schools in Chillicothe, 326 (16.3%) attend a private institution, while the remaining 1,672 (83.7%) are enrolled in public schools. The age group of 35 years and over has the highest likelihood of being enrolled in private schools, with 84 (47.5% in the age bracket) enrolled. Conversely, the age group of 18 to 19 year olds has the lowest likelihood of being enrolled in a private school, with 74 (100.0% in the age bracket) attending a public institution.
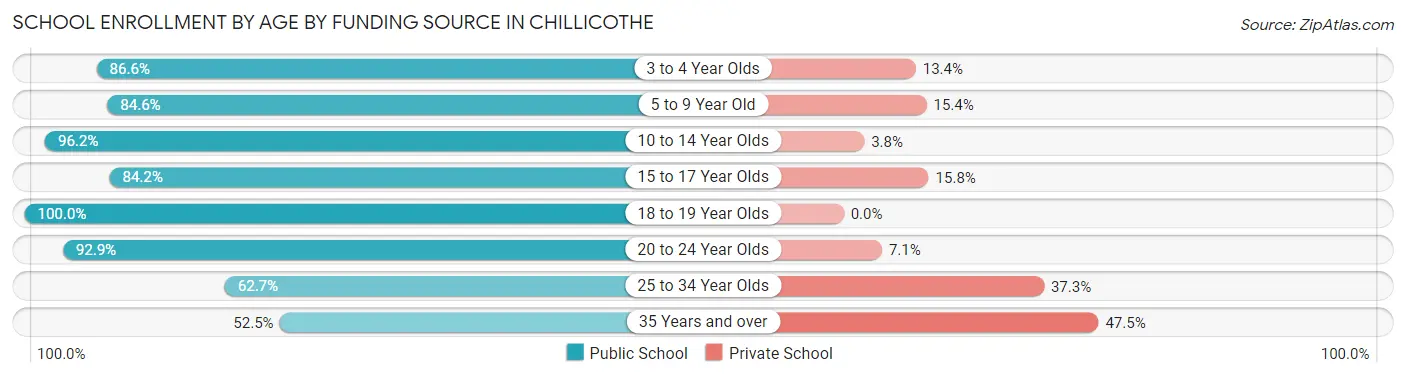
| Age Bracket | Public School | Private School |
| 3 to 4 Year Olds | 58 (86.6%) | 9 (13.4%) |
| 5 to 9 Year Old | 466 (84.6%) | 85 (15.4%) |
| 10 to 14 Year Olds | 504 (96.2%) | 20 (3.8%) |
| 15 to 17 Year Olds | 234 (84.2%) | 44 (15.8%) |
| 18 to 19 Year Olds | 74 (100.0%) | 0 (0.0%) |
| 20 to 24 Year Olds | 117 (92.9%) | 9 (7.1%) |
| 25 to 34 Year Olds | 126 (62.7%) | 75 (37.3%) |
| 35 Years and over | 93 (52.5%) | 84 (47.5%) |
| Total | 1,672 (83.7%) | 326 (16.3%) |
Educational Attainment by Field of Study in Chillicothe
Science & technology (255 | 19.4%), education (253 | 19.2%), business (244 | 18.5%), visual & performing arts (113 | 8.6%), and bio, nature & agricultural (97 | 7.4%) are the most common fields of study among 1,318 individuals in Chillicothe who have obtained a bachelor's degree or higher.
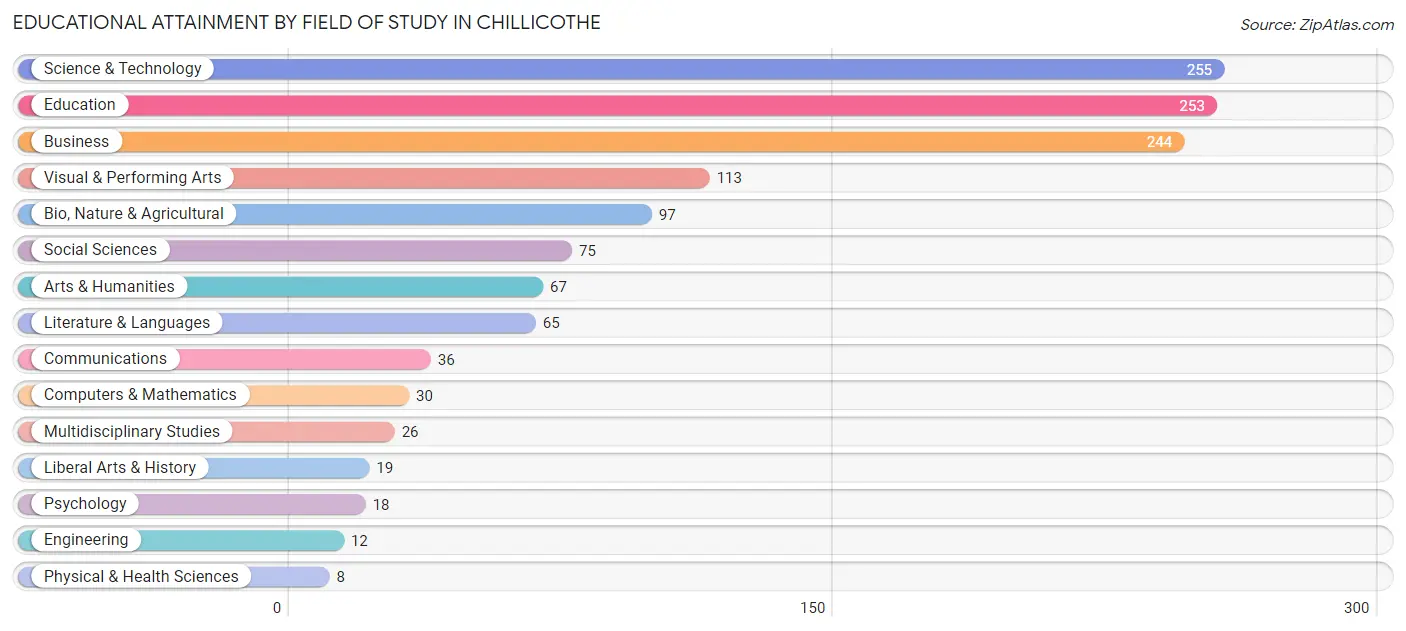
| Field of Study | # Graduates | % Graduates |
| Computers & Mathematics | 30 | 2.3% |
| Bio, Nature & Agricultural | 97 | 7.4% |
| Physical & Health Sciences | 8 | 0.6% |
| Psychology | 18 | 1.4% |
| Social Sciences | 75 | 5.7% |
| Engineering | 12 | 0.9% |
| Multidisciplinary Studies | 26 | 2.0% |
| Science & Technology | 255 | 19.4% |
| Business | 244 | 18.5% |
| Education | 253 | 19.2% |
| Literature & Languages | 65 | 4.9% |
| Liberal Arts & History | 19 | 1.4% |
| Visual & Performing Arts | 113 | 8.6% |
| Communications | 36 | 2.7% |
| Arts & Humanities | 67 | 5.1% |
| Total | 1,318 | 100.0% |
Transportation & Commute in Chillicothe
Vehicle Availability by Sex in Chillicothe
The most prevalent vehicle ownership categories in Chillicothe are males with 2 vehicles (787, accounting for 40.1%) and females with 2 vehicles (798, making up 46.3%).
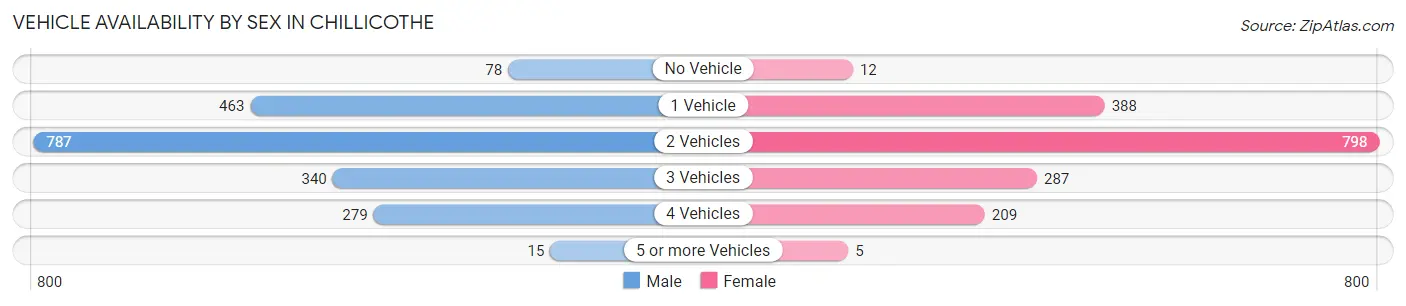
| Vehicles Available | Male | Female |
| No Vehicle | 78 (4.0%) | 12 (0.7%) |
| 1 Vehicle | 463 (23.6%) | 388 (22.8%) |
| 2 Vehicles | 787 (40.1%) | 798 (47.0%) |
| 3 Vehicles | 340 (17.3%) | 287 (16.9%) |
| 4 Vehicles | 279 (14.2%) | 209 (12.3%) |
| 5 or more Vehicles | 15 (0.8%) | 5 (0.3%) |
| Total | 1,962 (100.0%) | 1,699 (100.0%) |
Commute Time in Chillicothe
The most frequently occuring commute durations in Chillicothe are 5 to 9 minutes (1,215 commuters, 34.3%), 10 to 14 minutes (956 commuters, 27.0%), and 30 to 34 minutes (348 commuters, 9.8%).
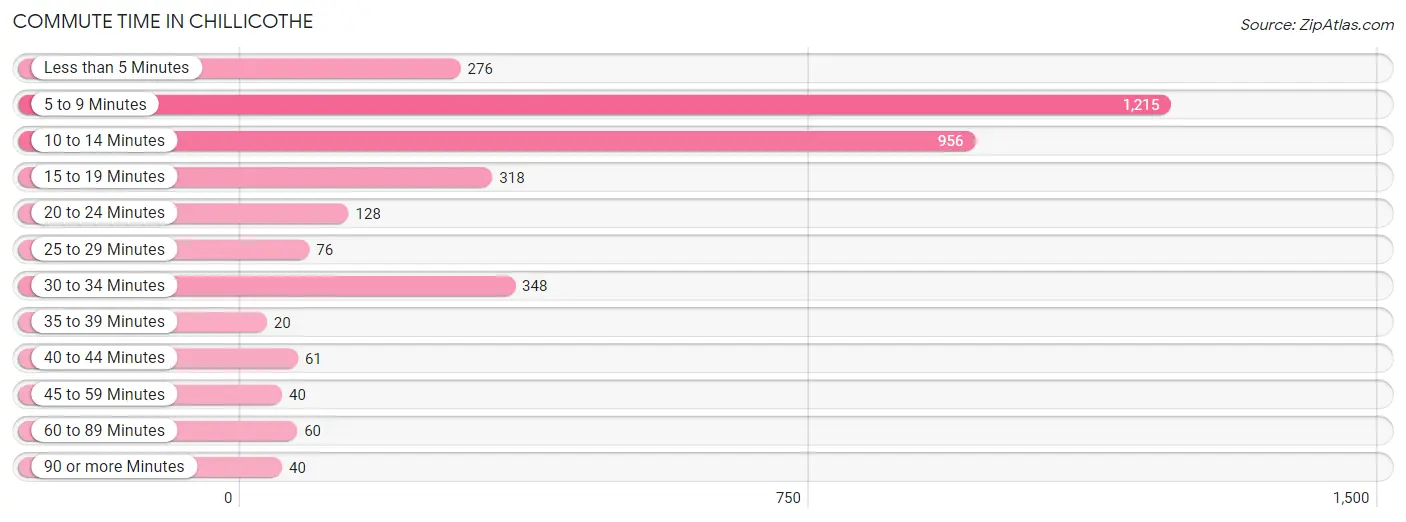
| Commute Time | # Commuters | % Commuters |
| Less than 5 Minutes | 276 | 7.8% |
| 5 to 9 Minutes | 1,215 | 34.3% |
| 10 to 14 Minutes | 956 | 27.0% |
| 15 to 19 Minutes | 318 | 9.0% |
| 20 to 24 Minutes | 128 | 3.6% |
| 25 to 29 Minutes | 76 | 2.1% |
| 30 to 34 Minutes | 348 | 9.8% |
| 35 to 39 Minutes | 20 | 0.6% |
| 40 to 44 Minutes | 61 | 1.7% |
| 45 to 59 Minutes | 40 | 1.1% |
| 60 to 89 Minutes | 60 | 1.7% |
| 90 or more Minutes | 40 | 1.1% |
Commute Time by Sex in Chillicothe
The most common commute times in Chillicothe are 10 to 14 minutes (661 commuters, 34.5%) for males and 5 to 9 minutes (582 commuters, 35.9%) for females.
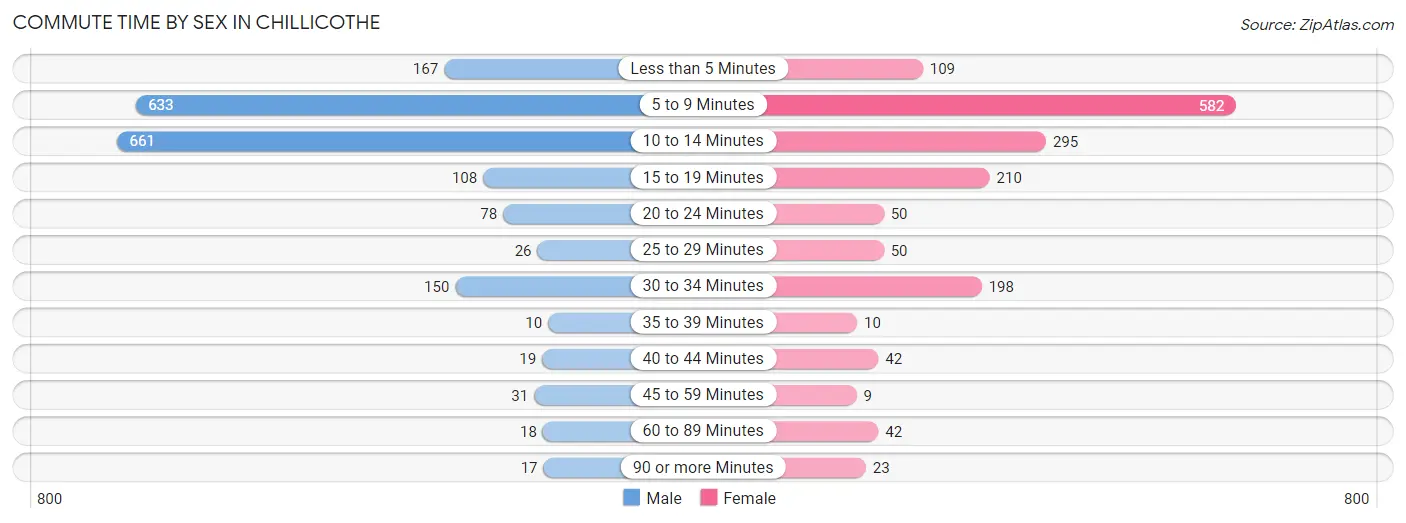
| Commute Time | Male | Female |
| Less than 5 Minutes | 167 (8.7%) | 109 (6.7%) |
| 5 to 9 Minutes | 633 (33.0%) | 582 (35.9%) |
| 10 to 14 Minutes | 661 (34.5%) | 295 (18.2%) |
| 15 to 19 Minutes | 108 (5.6%) | 210 (13.0%) |
| 20 to 24 Minutes | 78 (4.1%) | 50 (3.1%) |
| 25 to 29 Minutes | 26 (1.4%) | 50 (3.1%) |
| 30 to 34 Minutes | 150 (7.8%) | 198 (12.2%) |
| 35 to 39 Minutes | 10 (0.5%) | 10 (0.6%) |
| 40 to 44 Minutes | 19 (1.0%) | 42 (2.6%) |
| 45 to 59 Minutes | 31 (1.6%) | 9 (0.6%) |
| 60 to 89 Minutes | 18 (0.9%) | 42 (2.6%) |
| 90 or more Minutes | 17 (0.9%) | 23 (1.4%) |
Time of Departure to Work by Sex in Chillicothe
The most frequent times of departure to work in Chillicothe are 7:30 AM to 7:59 AM (376, 19.6%) for males and 7:00 AM to 7:29 AM (424, 26.2%) for females.
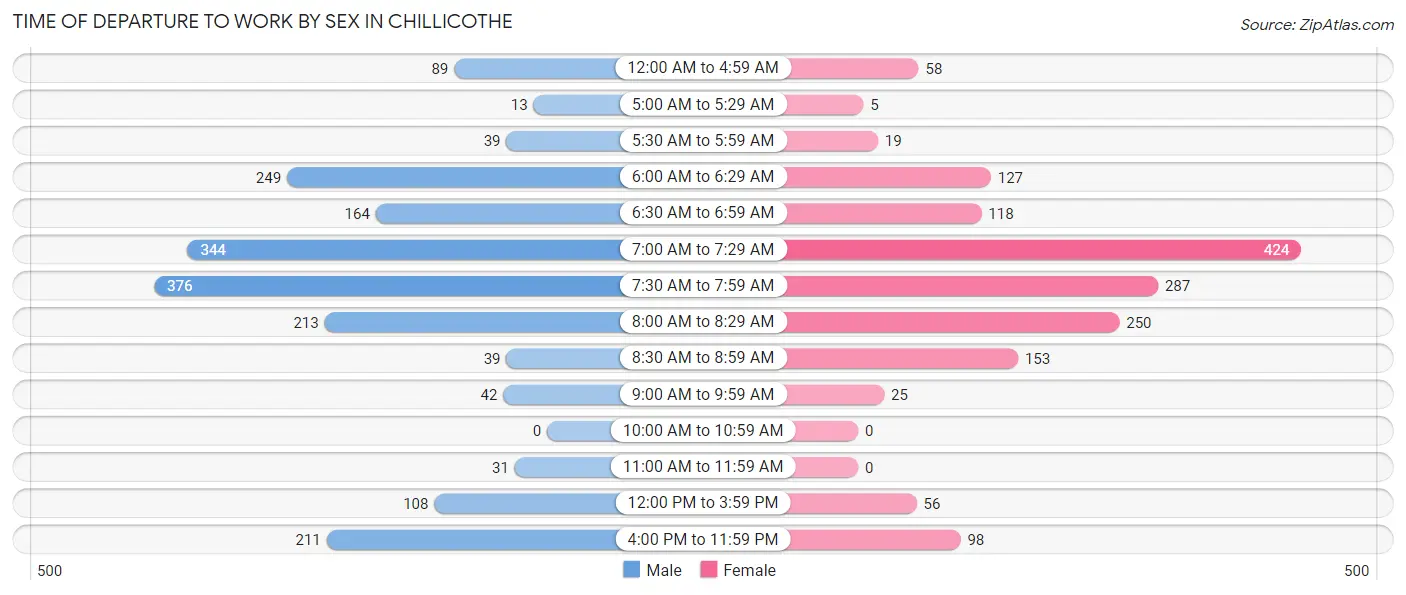
| Time of Departure | Male | Female |
| 12:00 AM to 4:59 AM | 89 (4.6%) | 58 (3.6%) |
| 5:00 AM to 5:29 AM | 13 (0.7%) | 5 (0.3%) |
| 5:30 AM to 5:59 AM | 39 (2.0%) | 19 (1.2%) |
| 6:00 AM to 6:29 AM | 249 (13.0%) | 127 (7.8%) |
| 6:30 AM to 6:59 AM | 164 (8.6%) | 118 (7.3%) |
| 7:00 AM to 7:29 AM | 344 (17.9%) | 424 (26.2%) |
| 7:30 AM to 7:59 AM | 376 (19.6%) | 287 (17.7%) |
| 8:00 AM to 8:29 AM | 213 (11.1%) | 250 (15.4%) |
| 8:30 AM to 8:59 AM | 39 (2.0%) | 153 (9.4%) |
| 9:00 AM to 9:59 AM | 42 (2.2%) | 25 (1.5%) |
| 10:00 AM to 10:59 AM | 0 (0.0%) | 0 (0.0%) |
| 11:00 AM to 11:59 AM | 31 (1.6%) | 0 (0.0%) |
| 12:00 PM to 3:59 PM | 108 (5.6%) | 56 (3.5%) |
| 4:00 PM to 11:59 PM | 211 (11.0%) | 98 (6.0%) |
| Total | 1,918 (100.0%) | 1,620 (100.0%) |
Housing Occupancy in Chillicothe
Occupancy by Ownership in Chillicothe
Of the total 3,466 dwellings in Chillicothe, owner-occupied units account for 2,103 (60.7%), while renter-occupied units make up 1,363 (39.3%).
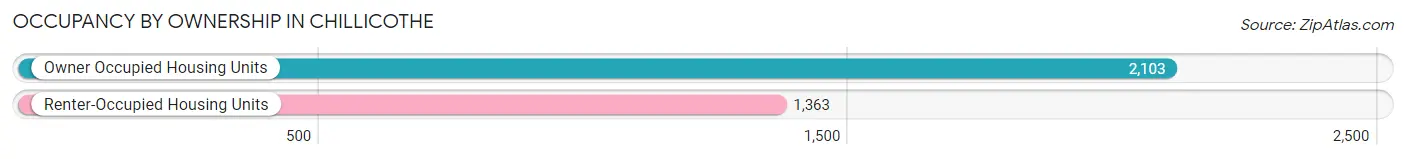
| Occupancy | # Housing Units | % Housing Units |
| Owner Occupied Housing Units | 2,103 | 60.7% |
| Renter-Occupied Housing Units | 1,363 | 39.3% |
| Total Occupied Housing Units | 3,466 | 100.0% |
Occupancy by Household Size in Chillicothe
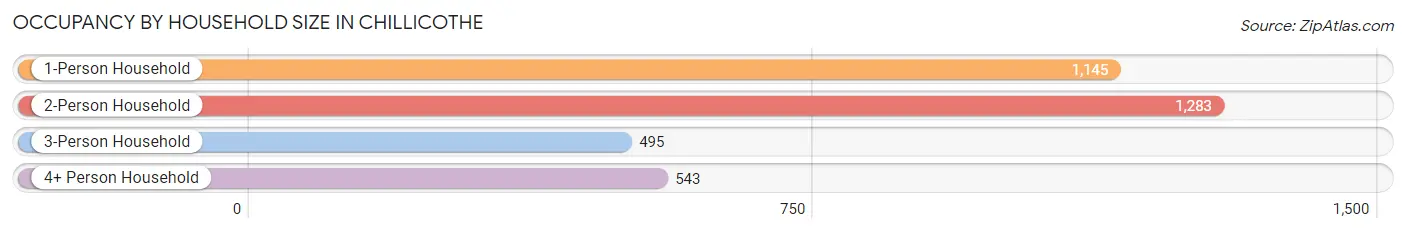
| Household Size | # Housing Units | % Housing Units |
| 1-Person Household | 1,145 | 33.0% |
| 2-Person Household | 1,283 | 37.0% |
| 3-Person Household | 495 | 14.3% |
| 4+ Person Household | 543 | 15.7% |
| Total Housing Units | 3,466 | 100.0% |
Occupancy by Ownership by Household Size in Chillicothe
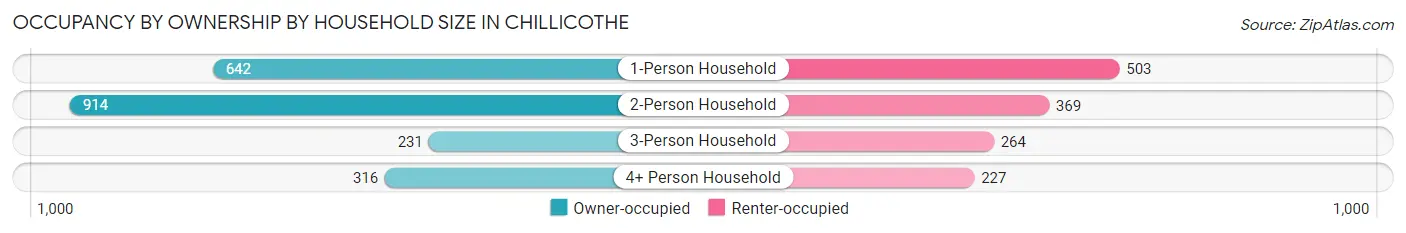
| Household Size | Owner-occupied | Renter-occupied |
| 1-Person Household | 642 (56.1%) | 503 (43.9%) |
| 2-Person Household | 914 (71.2%) | 369 (28.8%) |
| 3-Person Household | 231 (46.7%) | 264 (53.3%) |
| 4+ Person Household | 316 (58.2%) | 227 (41.8%) |
| Total Housing Units | 2,103 (60.7%) | 1,363 (39.3%) |
Occupancy by Educational Attainment in Chillicothe
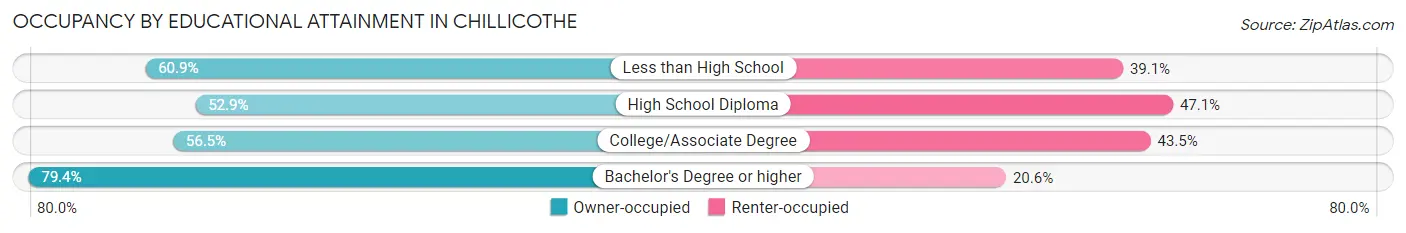
| Household Size | Owner-occupied | Renter-occupied |
| Less than High School | 227 (60.9%) | 146 (39.1%) |
| High School Diploma | 732 (52.9%) | 651 (47.1%) |
| College/Associate Degree | 527 (56.5%) | 406 (43.5%) |
| Bachelor's Degree or higher | 617 (79.4%) | 160 (20.6%) |
Occupancy by Age of Householder in Chillicothe
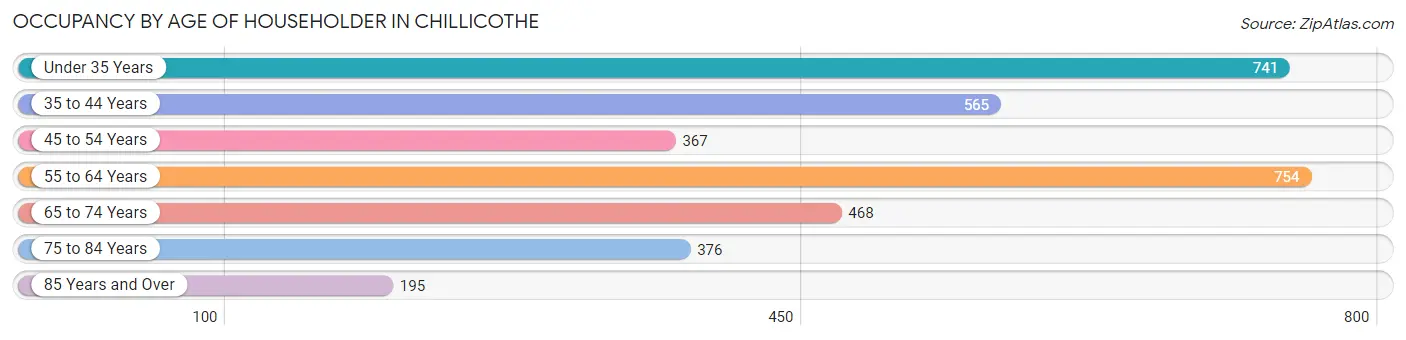
| Age Bracket | # Households | % Households |
| Under 35 Years | 741 | 21.4% |
| 35 to 44 Years | 565 | 16.3% |
| 45 to 54 Years | 367 | 10.6% |
| 55 to 64 Years | 754 | 21.7% |
| 65 to 74 Years | 468 | 13.5% |
| 75 to 84 Years | 376 | 10.8% |
| 85 Years and Over | 195 | 5.6% |
| Total | 3,466 | 100.0% |
Housing Finances in Chillicothe
Median Income by Occupancy in Chillicothe
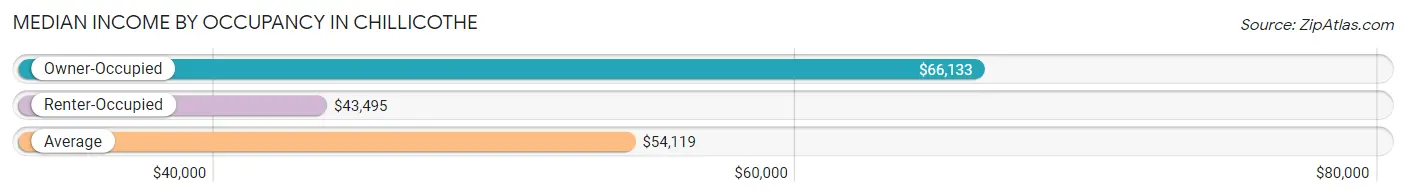
| Occupancy Type | # Households | Median Income |
| Owner-Occupied | 2,103 (60.7%) | $66,133 |
| Renter-Occupied | 1,363 (39.3%) | $43,495 |
| Average | 3,466 (100.0%) | $54,119 |
Occupancy by Householder Income Bracket in Chillicothe
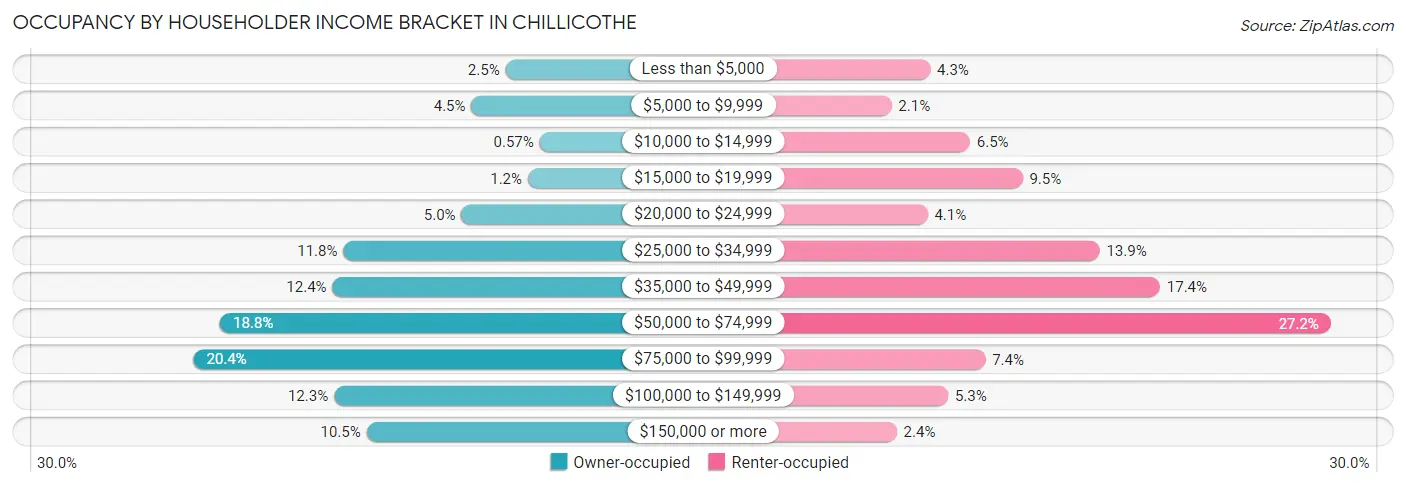
| Income Bracket | Owner-occupied | Renter-occupied |
| Less than $5,000 | 53 (2.5%) | 58 (4.3%) |
| $5,000 to $9,999 | 94 (4.5%) | 28 (2.1%) |
| $10,000 to $14,999 | 12 (0.6%) | 89 (6.5%) |
| $15,000 to $19,999 | 26 (1.2%) | 130 (9.5%) |
| $20,000 to $24,999 | 106 (5.0%) | 56 (4.1%) |
| $25,000 to $34,999 | 248 (11.8%) | 190 (13.9%) |
| $35,000 to $49,999 | 261 (12.4%) | 237 (17.4%) |
| $50,000 to $74,999 | 396 (18.8%) | 370 (27.2%) |
| $75,000 to $99,999 | 428 (20.3%) | 101 (7.4%) |
| $100,000 to $149,999 | 259 (12.3%) | 72 (5.3%) |
| $150,000 or more | 220 (10.5%) | 32 (2.4%) |
| Total | 2,103 (100.0%) | 1,363 (100.0%) |
Monthly Housing Cost Tiers in Chillicothe
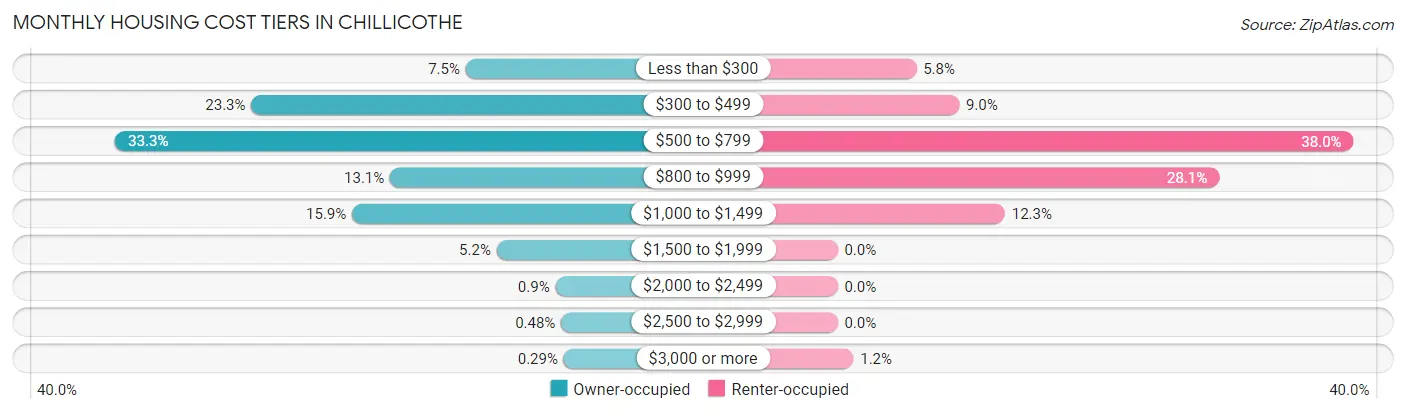
| Monthly Cost | Owner-occupied | Renter-occupied |
| Less than $300 | 158 (7.5%) | 79 (5.8%) |
| $300 to $499 | 490 (23.3%) | 122 (8.9%) |
| $500 to $799 | 701 (33.3%) | 518 (38.0%) |
| $800 to $999 | 275 (13.1%) | 383 (28.1%) |
| $1,000 to $1,499 | 334 (15.9%) | 168 (12.3%) |
| $1,500 to $1,999 | 110 (5.2%) | 0 (0.0%) |
| $2,000 to $2,499 | 19 (0.9%) | 0 (0.0%) |
| $2,500 to $2,999 | 10 (0.5%) | 0 (0.0%) |
| $3,000 or more | 6 (0.3%) | 16 (1.2%) |
| Total | 2,103 (100.0%) | 1,363 (100.0%) |
Physical Housing Characteristics in Chillicothe
Housing Structures in Chillicothe
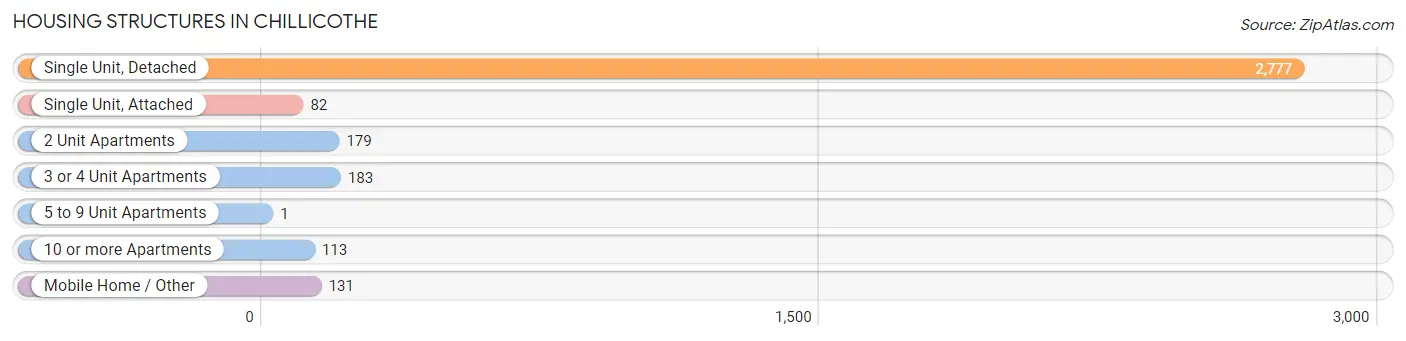
| Structure Type | # Housing Units | % Housing Units |
| Single Unit, Detached | 2,777 | 80.1% |
| Single Unit, Attached | 82 | 2.4% |
| 2 Unit Apartments | 179 | 5.2% |
| 3 or 4 Unit Apartments | 183 | 5.3% |
| 5 to 9 Unit Apartments | 1 | 0.0% |
| 10 or more Apartments | 113 | 3.3% |
| Mobile Home / Other | 131 | 3.8% |
| Total | 3,466 | 100.0% |
Housing Structures by Occupancy in Chillicothe
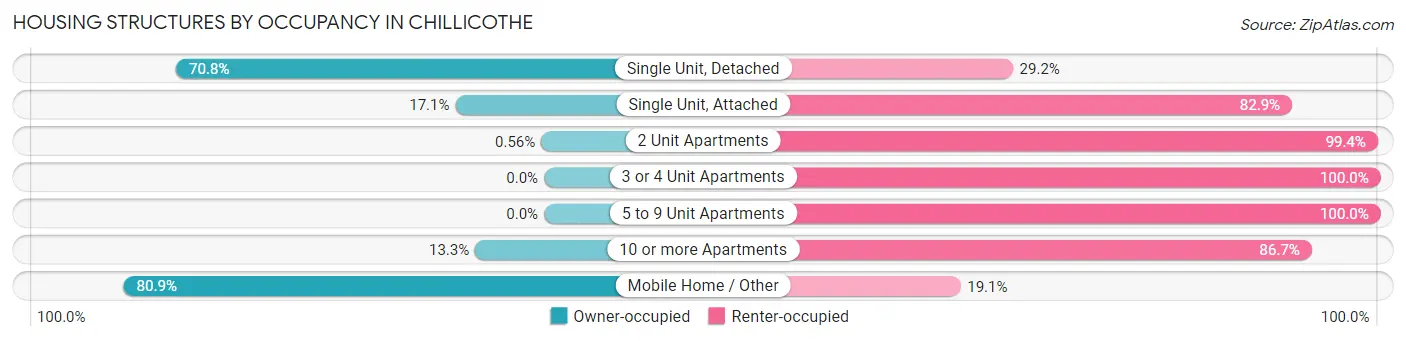
| Structure Type | Owner-occupied | Renter-occupied |
| Single Unit, Detached | 1,967 (70.8%) | 810 (29.2%) |
| Single Unit, Attached | 14 (17.1%) | 68 (82.9%) |
| 2 Unit Apartments | 1 (0.6%) | 178 (99.4%) |
| 3 or 4 Unit Apartments | 0 (0.0%) | 183 (100.0%) |
| 5 to 9 Unit Apartments | 0 (0.0%) | 1 (100.0%) |
| 10 or more Apartments | 15 (13.3%) | 98 (86.7%) |
| Mobile Home / Other | 106 (80.9%) | 25 (19.1%) |
| Total | 2,103 (60.7%) | 1,363 (39.3%) |
Housing Structures by Number of Rooms in Chillicothe
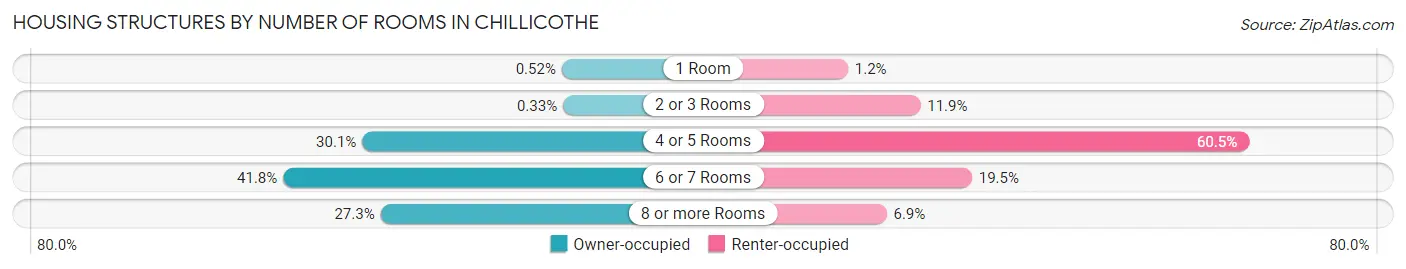
| Number of Rooms | Owner-occupied | Renter-occupied |
| 1 Room | 11 (0.5%) | 16 (1.2%) |
| 2 or 3 Rooms | 7 (0.3%) | 162 (11.9%) |
| 4 or 5 Rooms | 632 (30.0%) | 825 (60.5%) |
| 6 or 7 Rooms | 878 (41.7%) | 266 (19.5%) |
| 8 or more Rooms | 575 (27.3%) | 94 (6.9%) |
| Total | 2,103 (100.0%) | 1,363 (100.0%) |
Housing Structure by Heating Type in Chillicothe
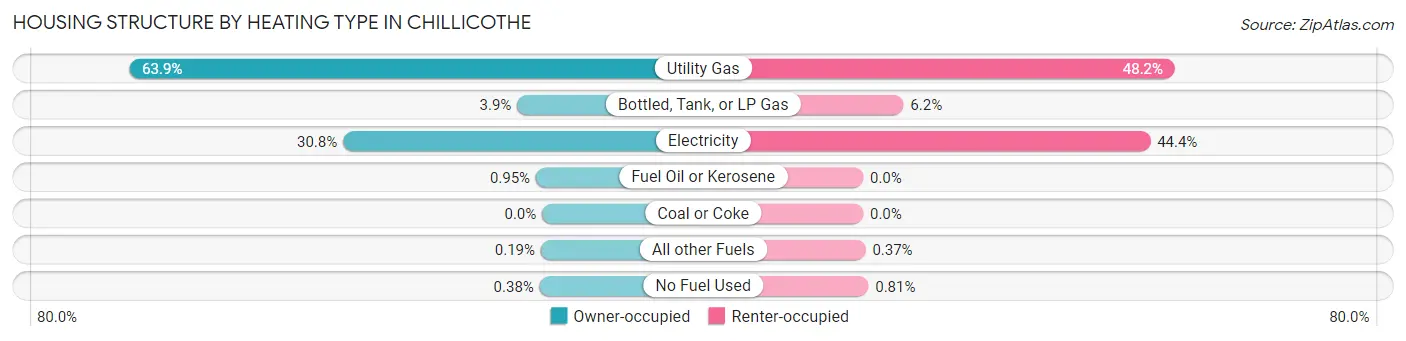
| Heating Type | Owner-occupied | Renter-occupied |
| Utility Gas | 1,343 (63.9%) | 657 (48.2%) |
| Bottled, Tank, or LP Gas | 81 (3.8%) | 85 (6.2%) |
| Electricity | 647 (30.8%) | 605 (44.4%) |
| Fuel Oil or Kerosene | 20 (0.9%) | 0 (0.0%) |
| Coal or Coke | 0 (0.0%) | 0 (0.0%) |
| All other Fuels | 4 (0.2%) | 5 (0.4%) |
| No Fuel Used | 8 (0.4%) | 11 (0.8%) |
| Total | 2,103 (100.0%) | 1,363 (100.0%) |
Household Vehicle Usage in Chillicothe
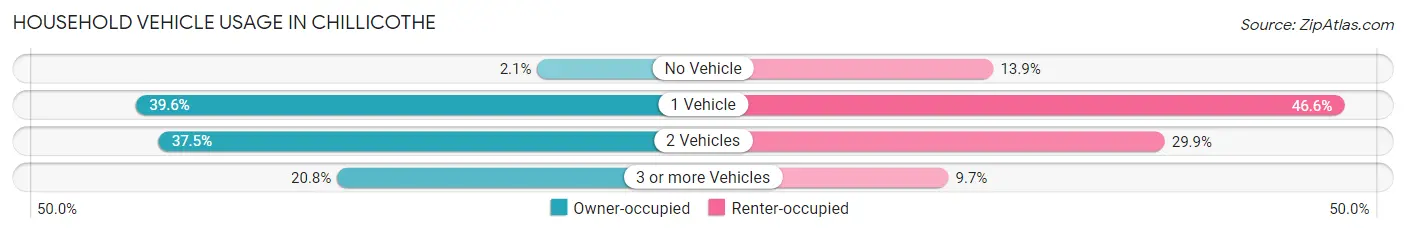
| Vehicles per Household | Owner-occupied | Renter-occupied |
| No Vehicle | 45 (2.1%) | 189 (13.9%) |
| 1 Vehicle | 832 (39.6%) | 635 (46.6%) |
| 2 Vehicles | 788 (37.5%) | 407 (29.9%) |
| 3 or more Vehicles | 438 (20.8%) | 132 (9.7%) |
| Total | 2,103 (100.0%) | 1,363 (100.0%) |
Real Estate & Mortgages in Chillicothe
Real Estate and Mortgage Overview in Chillicothe
| Characteristic | Without Mortgage | With Mortgage |
| Housing Units | 1,122 | 981 |
| Median Property Value | $125,000 | $122,200 |
| Median Household Income | $59,583 | $116 |
| Monthly Housing Costs | $469 | $6 |
| Real Estate Taxes | $1,377 | $11 |
Property Value by Mortgage Status in Chillicothe
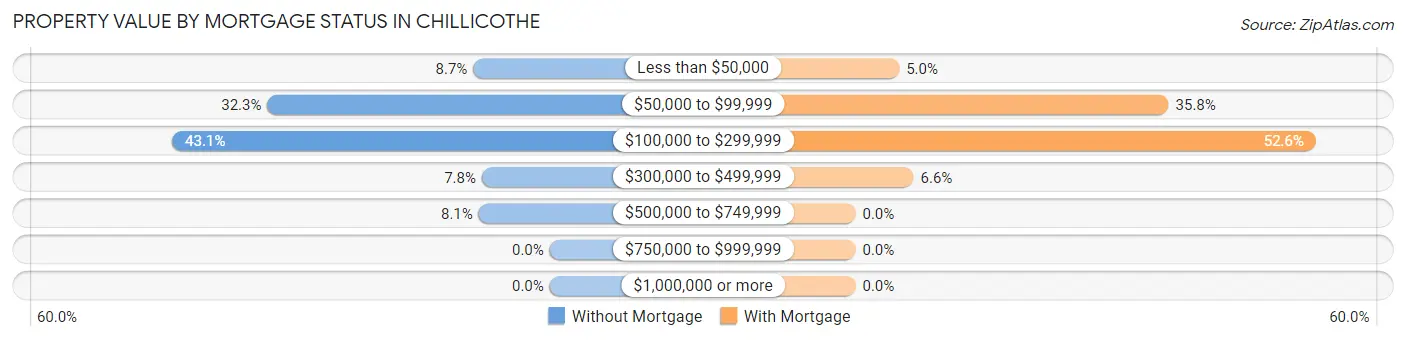
| Property Value | Without Mortgage | With Mortgage |
| Less than $50,000 | 98 (8.7%) | 49 (5.0%) |
| $50,000 to $99,999 | 362 (32.3%) | 351 (35.8%) |
| $100,000 to $299,999 | 484 (43.1%) | 516 (52.6%) |
| $300,000 to $499,999 | 87 (7.7%) | 65 (6.6%) |
| $500,000 to $749,999 | 91 (8.1%) | 0 (0.0%) |
| $750,000 to $999,999 | 0 (0.0%) | 0 (0.0%) |
| $1,000,000 or more | 0 (0.0%) | 0 (0.0%) |
| Total | 1,122 (100.0%) | 981 (100.0%) |
Household Income by Mortgage Status in Chillicothe
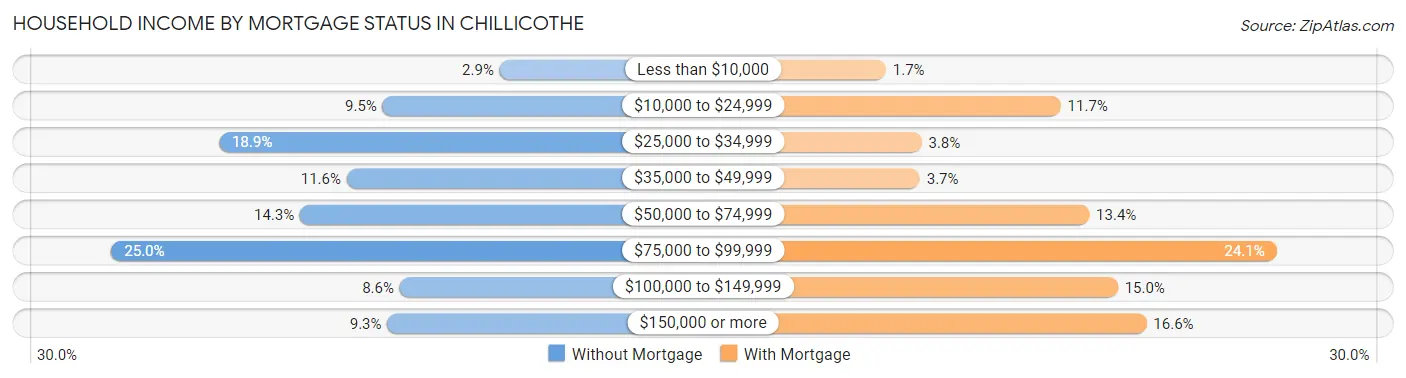
| Household Income | Without Mortgage | With Mortgage |
| Less than $10,000 | 32 (2.9%) | 17 (1.7%) |
| $10,000 to $24,999 | 107 (9.5%) | 115 (11.7%) |
| $25,000 to $34,999 | 212 (18.9%) | 37 (3.8%) |
| $35,000 to $49,999 | 130 (11.6%) | 36 (3.7%) |
| $50,000 to $74,999 | 160 (14.3%) | 131 (13.4%) |
| $75,000 to $99,999 | 281 (25.0%) | 236 (24.1%) |
| $100,000 to $149,999 | 96 (8.6%) | 147 (15.0%) |
| $150,000 or more | 104 (9.3%) | 163 (16.6%) |
| Total | 1,122 (100.0%) | 981 (100.0%) |
Property Value to Household Income Ratio in Chillicothe
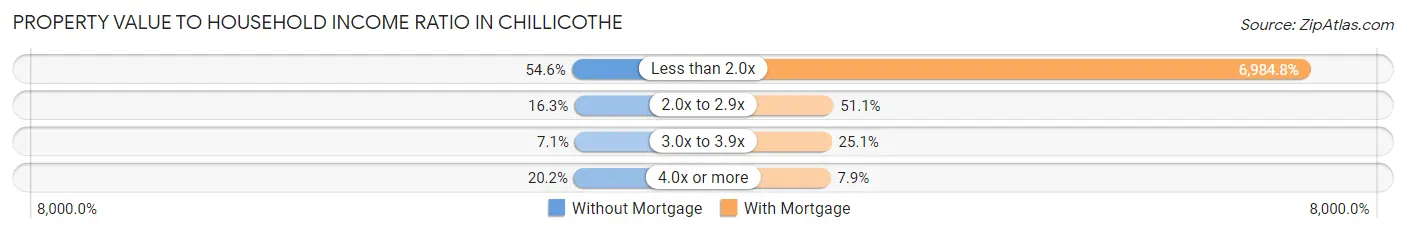
| Value-to-Income Ratio | Without Mortgage | With Mortgage |
| Less than 2.0x | 612 (54.5%) | 68,521 (6,984.8%) |
| 2.0x to 2.9x | 183 (16.3%) | 501 (51.1%) |
| 3.0x to 3.9x | 80 (7.1%) | 246 (25.1%) |
| 4.0x or more | 227 (20.2%) | 77 (7.9%) |
| Total | 1,122 (100.0%) | 981 (100.0%) |
Real Estate Taxes by Mortgage Status in Chillicothe
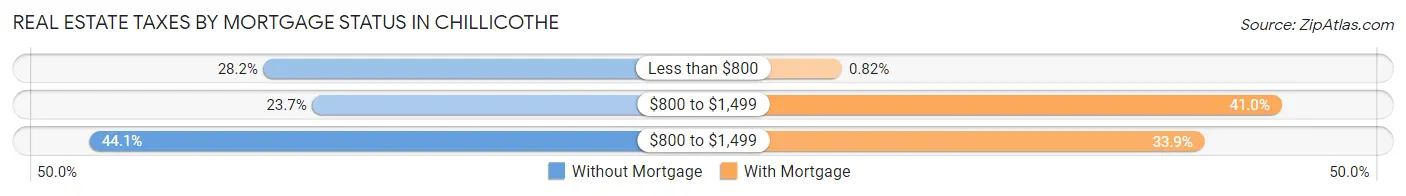
| Property Taxes | Without Mortgage | With Mortgage |
| Less than $800 | 316 (28.2%) | 8 (0.8%) |
| $800 to $1,499 | 266 (23.7%) | 402 (41.0%) |
| $800 to $1,499 | 495 (44.1%) | 333 (33.9%) |
| Total | 1,122 (100.0%) | 981 (100.0%) |
Health & Disability in Chillicothe
Health Insurance Coverage by Age in Chillicothe
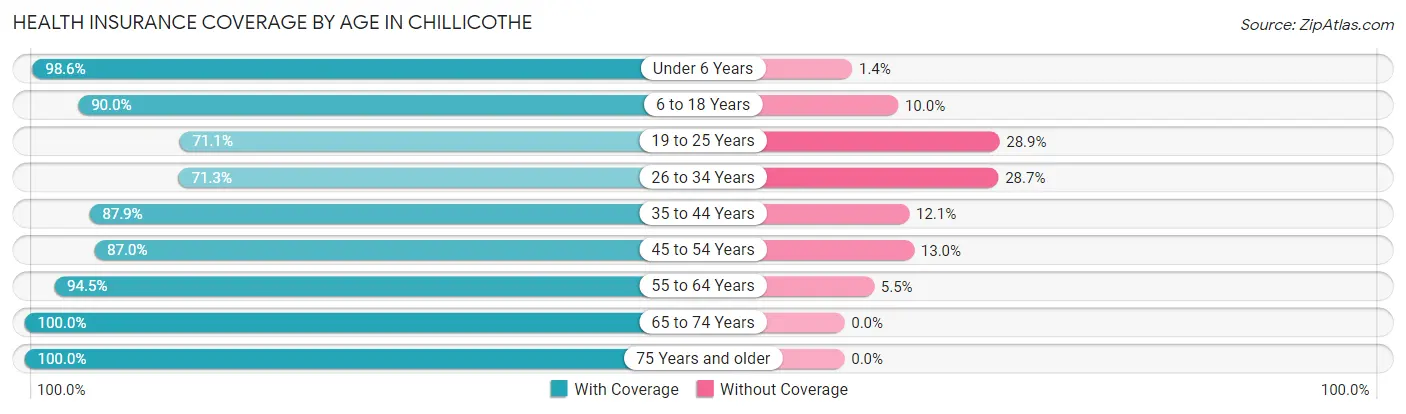
| Age Bracket | With Coverage | Without Coverage |
| Under 6 Years | 547 (98.6%) | 8 (1.4%) |
| 6 to 18 Years | 1,214 (90.0%) | 135 (10.0%) |
| 19 to 25 Years | 492 (71.1%) | 200 (28.9%) |
| 26 to 34 Years | 720 (71.3%) | 290 (28.7%) |
| 35 to 44 Years | 757 (87.9%) | 104 (12.1%) |
| 45 to 54 Years | 644 (87.0%) | 96 (13.0%) |
| 55 to 64 Years | 1,080 (94.5%) | 63 (5.5%) |
| 65 to 74 Years | 772 (100.0%) | 0 (0.0%) |
| 75 Years and older | 794 (100.0%) | 0 (0.0%) |
| Total | 7,020 (88.7%) | 896 (11.3%) |
Health Insurance Coverage by Citizenship Status in Chillicothe
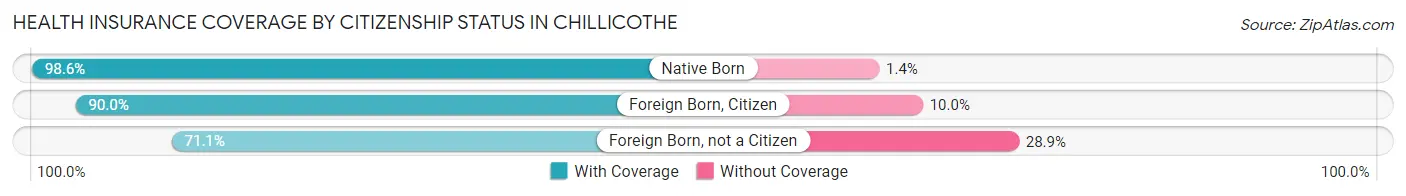
| Citizenship Status | With Coverage | Without Coverage |
| Native Born | 547 (98.6%) | 8 (1.4%) |
| Foreign Born, Citizen | 1,214 (90.0%) | 135 (10.0%) |
| Foreign Born, not a Citizen | 492 (71.1%) | 200 (28.9%) |
Health Insurance Coverage by Household Income in Chillicothe
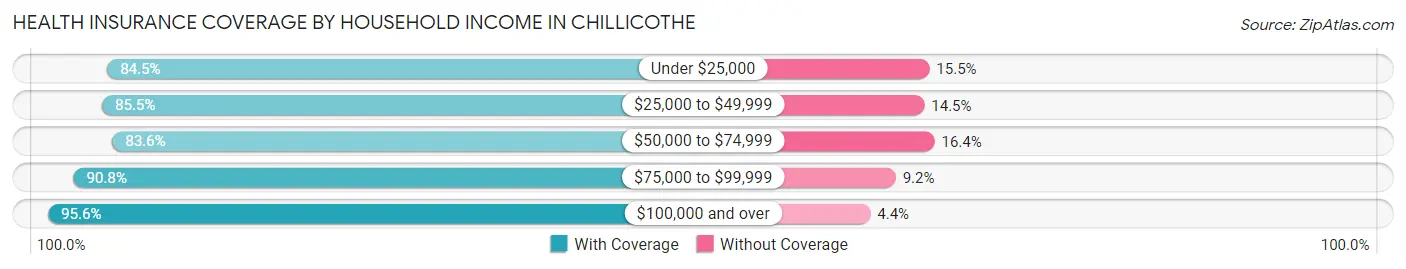
| Household Income | With Coverage | Without Coverage |
| Under $25,000 | 786 (84.5%) | 144 (15.5%) |
| $25,000 to $49,999 | 1,529 (85.5%) | 260 (14.5%) |
| $50,000 to $74,999 | 1,403 (83.6%) | 276 (16.4%) |
| $75,000 to $99,999 | 1,258 (90.8%) | 127 (9.2%) |
| $100,000 and over | 1,881 (95.6%) | 87 (4.4%) |
Public vs Private Health Insurance Coverage by Age in Chillicothe
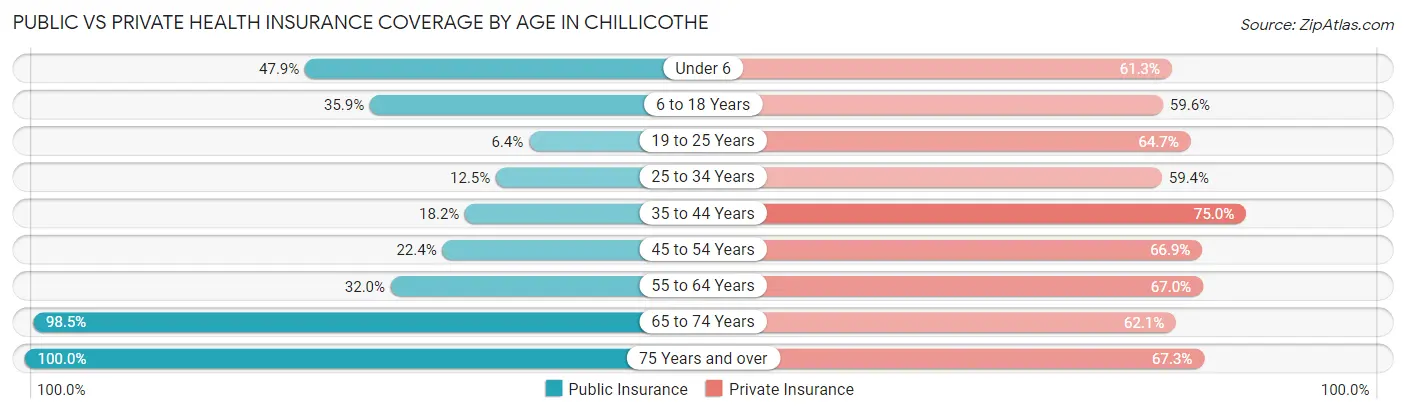
| Age Bracket | Public Insurance | Private Insurance |
| Under 6 | 266 (47.9%) | 340 (61.3%) |
| 6 to 18 Years | 484 (35.9%) | 804 (59.6%) |
| 19 to 25 Years | 44 (6.4%) | 448 (64.7%) |
| 25 to 34 Years | 126 (12.5%) | 600 (59.4%) |
| 35 to 44 Years | 157 (18.2%) | 646 (75.0%) |
| 45 to 54 Years | 166 (22.4%) | 495 (66.9%) |
| 55 to 64 Years | 366 (32.0%) | 766 (67.0%) |
| 65 to 74 Years | 760 (98.5%) | 479 (62.1%) |
| 75 Years and over | 794 (100.0%) | 534 (67.2%) |
| Total | 3,163 (40.0%) | 5,112 (64.6%) |
Disability Status by Sex by Age in Chillicothe
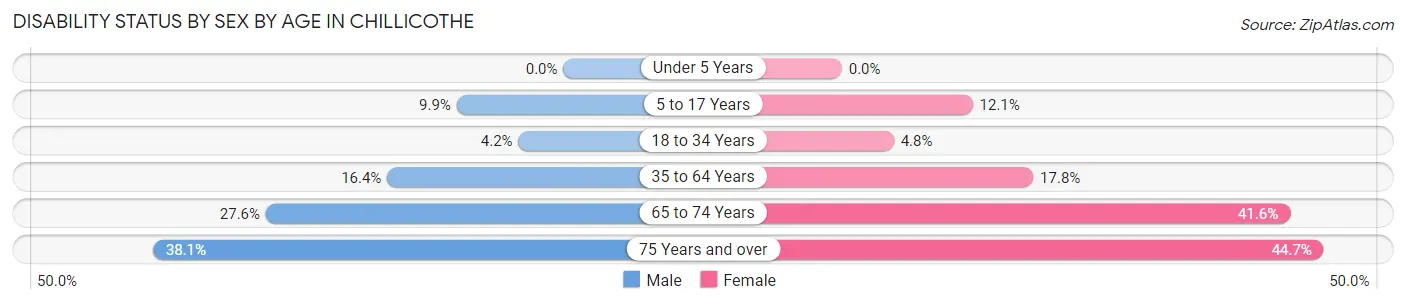
| Age Bracket | Male | Female |
| Under 5 Years | 0 (0.0%) | 0 (0.0%) |
| 5 to 17 Years | 71 (9.9%) | 79 (12.1%) |
| 18 to 34 Years | 36 (4.2%) | 44 (4.8%) |
| 35 to 64 Years | 225 (16.4%) | 243 (17.8%) |
| 65 to 74 Years | 103 (27.6%) | 166 (41.6%) |
| 75 Years and over | 104 (38.1%) | 233 (44.7%) |
Disability Class by Sex by Age in Chillicothe
Disability Class: Hearing Difficulty
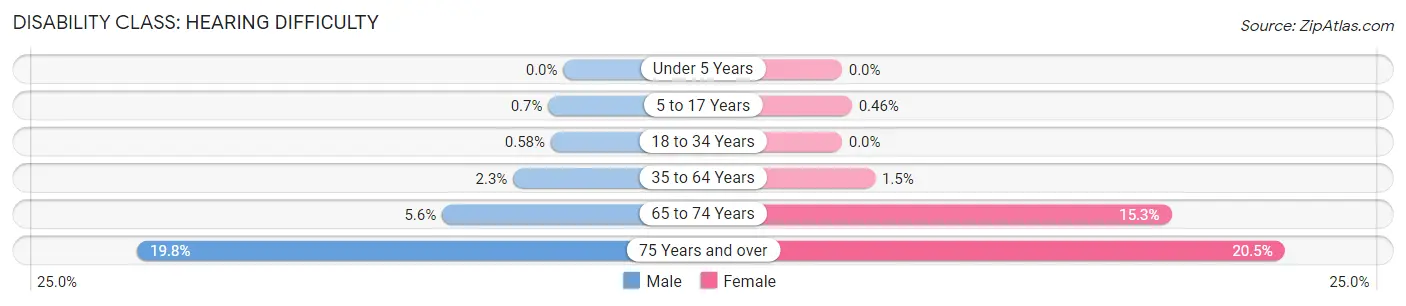
| Age Bracket | Male | Female |
| Under 5 Years | 0 (0.0%) | 0 (0.0%) |
| 5 to 17 Years | 5 (0.7%) | 3 (0.5%) |
| 18 to 34 Years | 5 (0.6%) | 0 (0.0%) |
| 35 to 64 Years | 32 (2.3%) | 21 (1.5%) |
| 65 to 74 Years | 21 (5.6%) | 61 (15.3%) |
| 75 Years and over | 54 (19.8%) | 107 (20.5%) |
Disability Class: Vision Difficulty
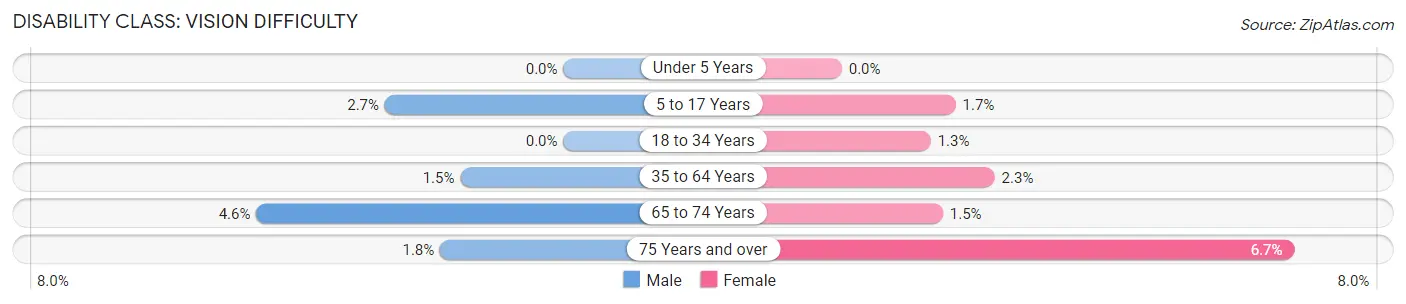
| Age Bracket | Male | Female |
| Under 5 Years | 0 (0.0%) | 0 (0.0%) |
| 5 to 17 Years | 19 (2.6%) | 11 (1.7%) |
| 18 to 34 Years | 0 (0.0%) | 12 (1.3%) |
| 35 to 64 Years | 21 (1.5%) | 31 (2.3%) |
| 65 to 74 Years | 17 (4.6%) | 6 (1.5%) |
| 75 Years and over | 5 (1.8%) | 35 (6.7%) |
Disability Class: Cognitive Difficulty
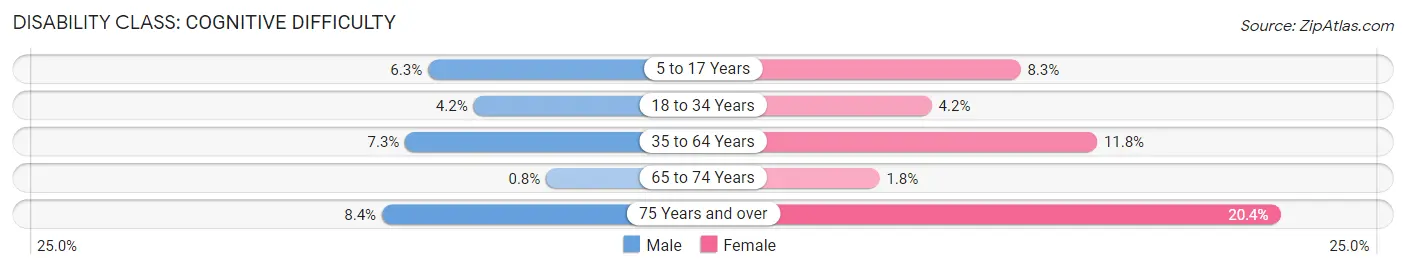
| Age Bracket | Male | Female |
| 5 to 17 Years | 45 (6.3%) | 54 (8.3%) |
| 18 to 34 Years | 36 (4.2%) | 38 (4.2%) |
| 35 to 64 Years | 101 (7.3%) | 162 (11.8%) |
| 65 to 74 Years | 3 (0.8%) | 7 (1.8%) |
| 75 Years and over | 23 (8.4%) | 106 (20.3%) |
Disability Class: Ambulatory Difficulty
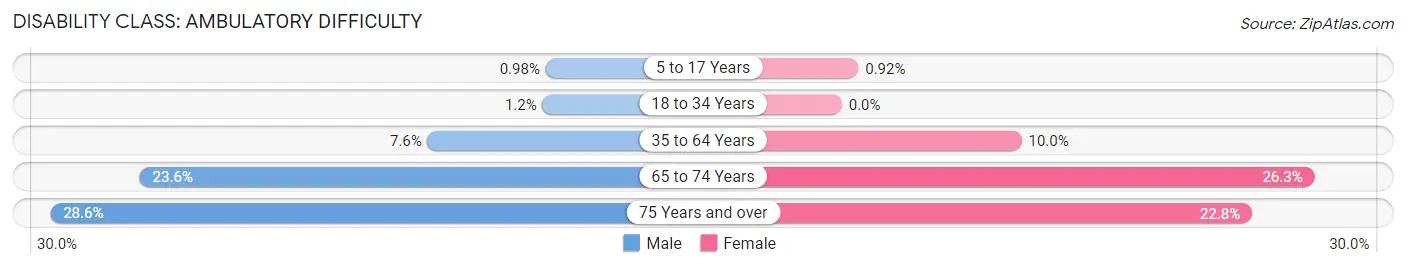
| Age Bracket | Male | Female |
| 5 to 17 Years | 7 (1.0%) | 6 (0.9%) |
| 18 to 34 Years | 10 (1.2%) | 0 (0.0%) |
| 35 to 64 Years | 104 (7.6%) | 137 (10.0%) |
| 65 to 74 Years | 88 (23.6%) | 105 (26.3%) |
| 75 Years and over | 78 (28.6%) | 119 (22.8%) |
Disability Class: Self-Care Difficulty
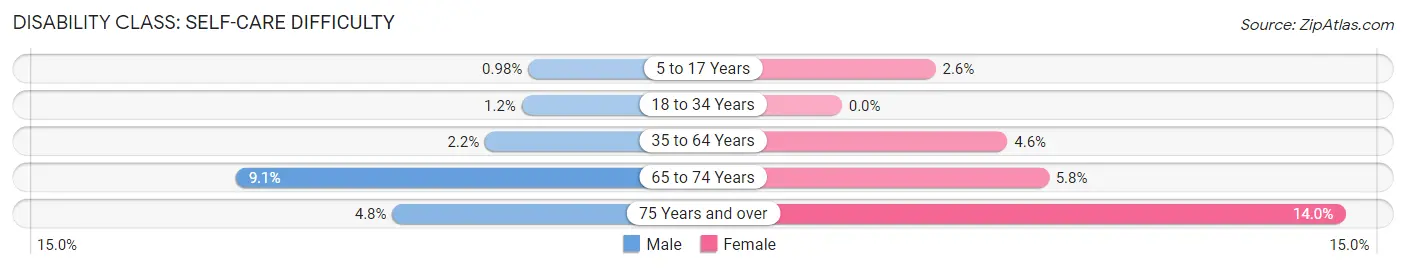
| Age Bracket | Male | Female |
| 5 to 17 Years | 7 (1.0%) | 17 (2.6%) |
| 18 to 34 Years | 10 (1.2%) | 0 (0.0%) |
| 35 to 64 Years | 30 (2.2%) | 63 (4.6%) |
| 65 to 74 Years | 34 (9.1%) | 23 (5.8%) |
| 75 Years and over | 13 (4.8%) | 73 (14.0%) |
Technology Access in Chillicothe
Computing Device Access in Chillicothe
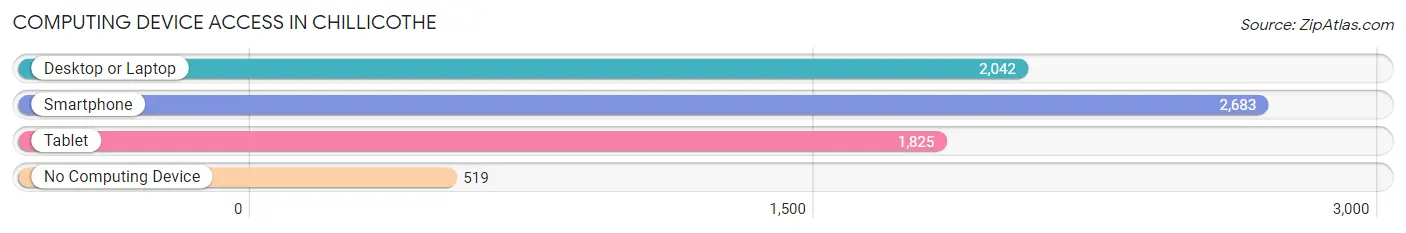
| Device Type | # Households | % Households |
| Desktop or Laptop | 2,042 | 58.9% |
| Smartphone | 2,683 | 77.4% |
| Tablet | 1,825 | 52.6% |
| No Computing Device | 519 | 15.0% |
| Total | 3,466 | 100.0% |
Internet Access in Chillicothe
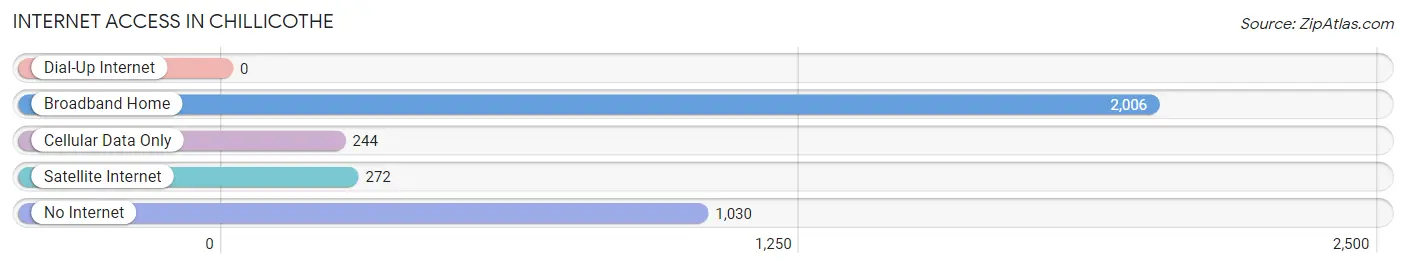
| Internet Type | # Households | % Households |
| Dial-Up Internet | 0 | 0.0% |
| Broadband Home | 2,006 | 57.9% |
| Cellular Data Only | 244 | 7.0% |
| Satellite Internet | 272 | 7.9% |
| No Internet | 1,030 | 29.7% |
| Total | 3,466 | 100.0% |
Chillicothe Summary
Chillicothe, Missouri is a small city located in Livingston County, Missouri. It is the county seat of Livingston County and is located approximately 80 miles northeast of Kansas City. The city has a population of 8,945 as of the 2010 census.
History
Chillicothe was founded in 1837 by settlers from Kentucky and Virginia. The city was named after the Shawnee Indian Chief, Chillicothe, who had a village in the area. The city was incorporated in 1855 and was the first city in Livingston County.
In the late 1800s, Chillicothe was a major stop on the Hannibal and St. Joseph Railroad. The railroad brought many new settlers to the area and helped to spur the growth of the city.
In the early 1900s, Chillicothe was a major center for the production of tobacco. The city was home to several tobacco warehouses and factories. The tobacco industry was a major employer in the city and helped to fuel the local economy.
Geography
Chillicothe is located in the northwest corner of Livingston County, Missouri. The city is situated on the Grand River, which flows through the city. The city is located approximately 80 miles northeast of Kansas City.
The city has a total area of 4.2 square miles, all of which is land. The city has a humid continental climate, with hot, humid summers and cold, dry winters.
Economy
The economy of Chillicothe is largely based on agriculture and manufacturing. The city is home to several manufacturing plants, including a Tyson Foods plant and a ConAgra Foods plant. The city is also home to several agricultural businesses, including a large dairy farm and several grain elevators.
The city is also home to several retail businesses, including several restaurants, grocery stores, and clothing stores. The city is also home to several medical facilities, including a hospital and several clinics.
Demographics
As of the 2010 census, the population of Chillicothe was 8,945. The racial makeup of the city was 92.3% White, 4.2% African American, 0.3% Native American, 0.7% Asian, 0.1% Pacific Islander, 0.7% from other races, and 1.9% from two or more races. Hispanic or Latino of any race were 2.2% of the population.
The median household income in Chillicothe was $37,917, and the median family income was $45,938. The per capita income for the city was $19,945. About 11.3% of families and 14.2% of the population were below the poverty line, including 19.2% of those under age 18 and 8.2% of those age 65 or over.
Common Questions
What is Per Capita Income in Chillicothe?
Per Capita income in Chillicothe is $29,396.
What is the Median Family Income in Chillicothe?
Median Family Income in Chillicothe is $68,272.
What is the Median Household income in Chillicothe?
Median Household Income in Chillicothe is $54,119.
What is Income or Wage Gap in Chillicothe?
Income or Wage Gap in Chillicothe is 30.0%.
Women in Chillicothe earn 70.0 cents for every dollar earned by a man.
What is Family Income Deficit in Chillicothe?
Family Income Deficit in Chillicothe is $7,918.
Families that are below poverty line in Chillicothe earn $7,918 less on average than the poverty threshold level.
What is Inequality or Gini Index in Chillicothe?
Inequality or Gini Index in Chillicothe is 0.46.
What is the Total Population of Chillicothe?
Total Population of Chillicothe is 9,091.
What is the Total Male Population of Chillicothe?
Total Male Population of Chillicothe is 3,917.
What is the Total Female Population of Chillicothe?
Total Female Population of Chillicothe is 5,174.
What is the Ratio of Males per 100 Females in Chillicothe?
There are 75.71 Males per 100 Females in Chillicothe.
What is the Ratio of Females per 100 Males in Chillicothe?
There are 132.09 Females per 100 Males in Chillicothe.
What is the Median Population Age in Chillicothe?
Median Population Age in Chillicothe is 38.0 Years.
What is the Average Family Size in Chillicothe
Average Family Size in Chillicothe is 2.9 People.
What is the Average Household Size in Chillicothe
Average Household Size in Chillicothe is 2.2 People.
How Large is the Labor Force in Chillicothe?
There are 3,840 People in the Labor Forcein in Chillicothe.
What is the Percentage of People in the Labor Force in Chillicothe?
52.1% of People are in the Labor Force in Chillicothe.
What is the Unemployment Rate in Chillicothe?
Unemployment Rate in Chillicothe is 3.5%.