Velda City, MO Map & Demographics
Velda City Map
Velda City Overview
$20,490
PER CAPITA INCOME
$47,917
AVG FAMILY INCOME
$44,432
AVG HOUSEHOLD INCOME
0.33
INEQUALITY / GINI INDEX
1,254
TOTAL POPULATION
570
MALE POPULATION
684
FEMALE POPULATION
83.33
MALES / 100 FEMALES
120.00
FEMALES / 100 MALES
41.6
MEDIAN AGE
3.0
AVG FAMILY SIZE
2.4
AVG HOUSEHOLD SIZE
561
LABOR FORCE [ PEOPLE ]
57.2%
PERCENT IN LABOR FORCE
4.5%
UNEMPLOYMENT RATE
Velda City Area Codes
Income in Velda City
Income Overview in Velda City
Per Capita Income in Velda City is $20,490, while median incomes of families and households are $47,917 and $44,432 respectively.
| Characteristic | Number | Measure |
| Per Capita Income | 1,254 | $20,490 |
| Median Family Income | 347 | $47,917 |
| Mean Family Income | 347 | $53,835 |
| Median Household Income | 517 | $44,432 |
| Mean Household Income | 517 | $48,037 |
| Income Deficit | 347 | $0 |
| Wage / Income Gap (%) | 1,254 | 0.00% |
| Wage / Income Gap ($) | 1,254 | 100.00¢ per $1 |
| Gini / Inequality Index | 1,254 | 0.33 |
Earnings by Sex in Velda City
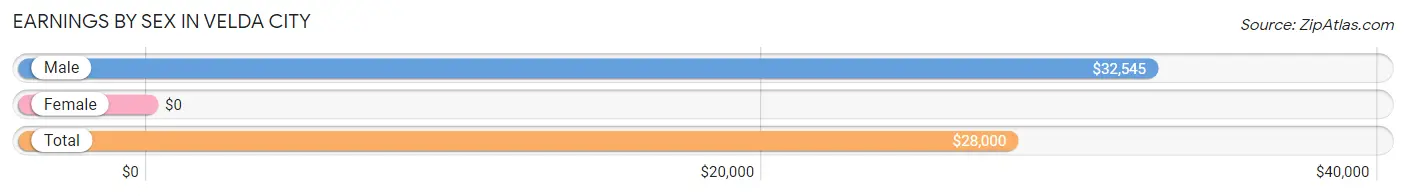
| Sex | Number | Average Earnings |
| Male | 239 (40.5%) | $32,545 |
| Female | 351 (59.5%) | $0 |
| Total | 590 (100.0%) | $28,000 |
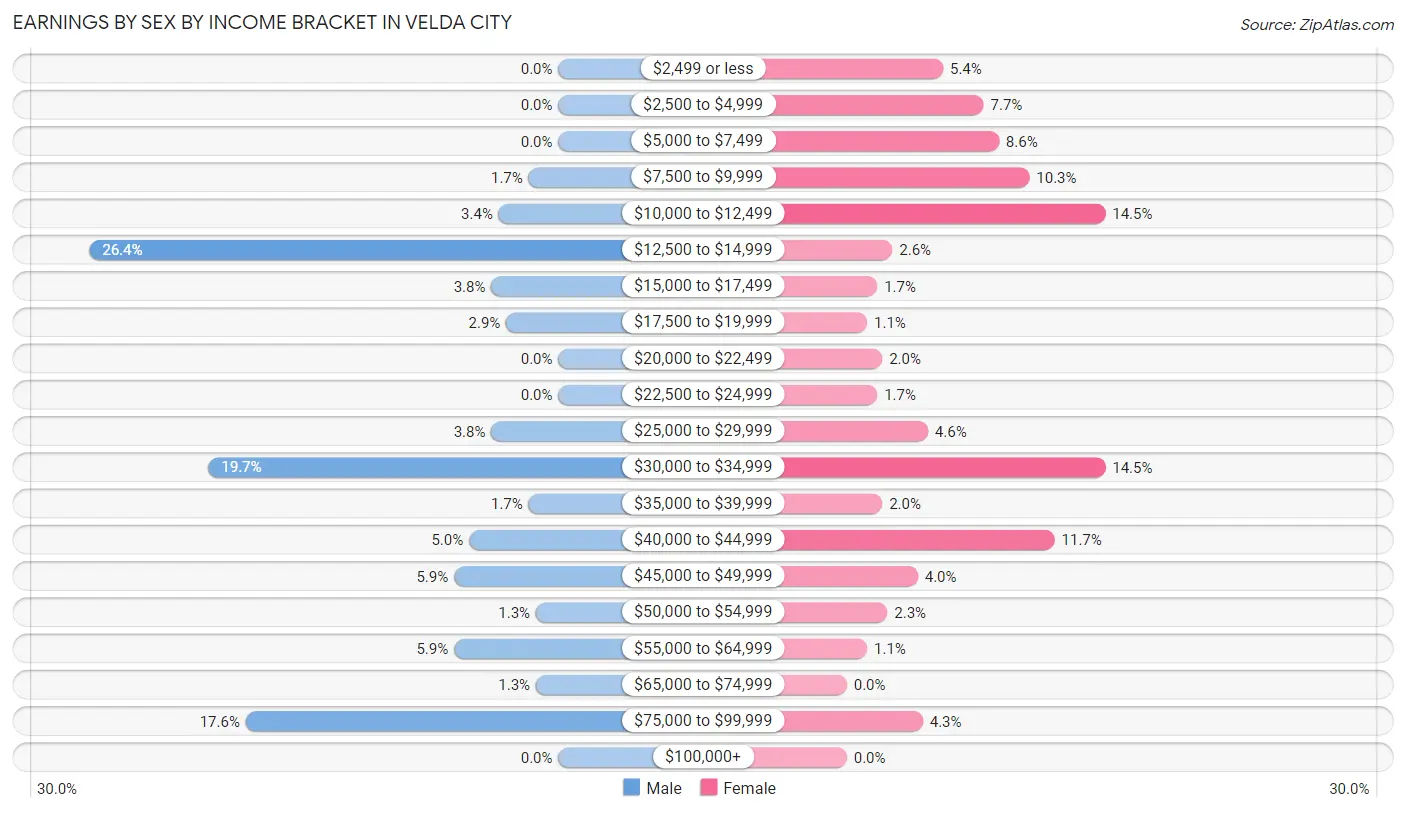
Earnings by Sex by Income Bracket in Velda City
The most common earnings brackets in Velda City are $12,500 to $14,999 for men (63 | 26.4%) and $10,000 to $12,499 for women (51 | 14.5%).
| Income | Male | Female |
| $2,499 or less | 0 (0.0%) | 19 (5.4%) |
| $2,500 to $4,999 | 0 (0.0%) | 27 (7.7%) |
| $5,000 to $7,499 | 0 (0.0%) | 30 (8.6%) |
| $7,500 to $9,999 | 4 (1.7%) | 36 (10.3%) |
| $10,000 to $12,499 | 8 (3.4%) | 51 (14.5%) |
| $12,500 to $14,999 | 63 (26.4%) | 9 (2.6%) |
| $15,000 to $17,499 | 9 (3.8%) | 6 (1.7%) |
| $17,500 to $19,999 | 7 (2.9%) | 4 (1.1%) |
| $20,000 to $22,499 | 0 (0.0%) | 7 (2.0%) |
| $22,500 to $24,999 | 0 (0.0%) | 6 (1.7%) |
| $25,000 to $29,999 | 9 (3.8%) | 16 (4.6%) |
| $30,000 to $34,999 | 47 (19.7%) | 51 (14.5%) |
| $35,000 to $39,999 | 4 (1.7%) | 7 (2.0%) |
| $40,000 to $44,999 | 12 (5.0%) | 41 (11.7%) |
| $45,000 to $49,999 | 14 (5.9%) | 14 (4.0%) |
| $50,000 to $54,999 | 3 (1.3%) | 8 (2.3%) |
| $55,000 to $64,999 | 14 (5.9%) | 4 (1.1%) |
| $65,000 to $74,999 | 3 (1.3%) | 0 (0.0%) |
| $75,000 to $99,999 | 42 (17.6%) | 15 (4.3%) |
| $100,000+ | 0 (0.0%) | 0 (0.0%) |
| Total | 239 (100.0%) | 351 (100.0%) |
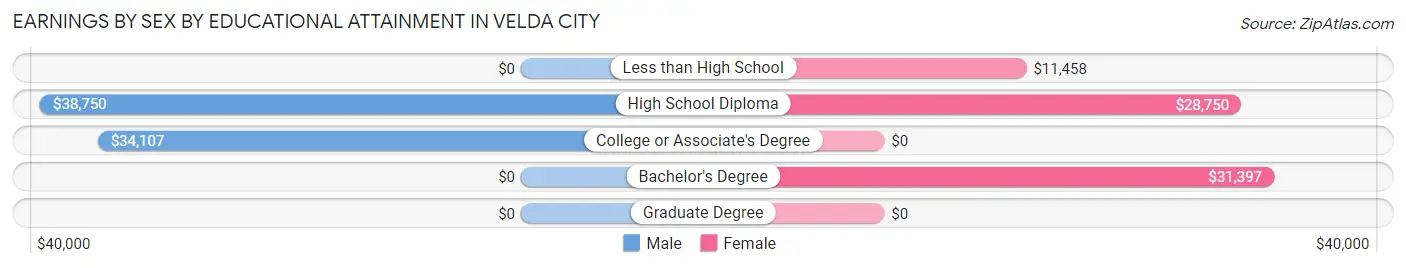
Earnings by Sex by Educational Attainment in Velda City
Average earnings in Velda City are $40,104 for men and $30,221 for women, a difference of 24.6%. Men with an educational attainment of high school diploma enjoy the highest average annual earnings of $38,750, while those with college or associate's degree education earn the least with $34,107. Women with an educational attainment of bachelor's degree earn the most with the average annual earnings of $31,397, while those with less than high school education have the smallest earnings of $11,458.
| Educational Attainment | Male Income | Female Income |
| Less than High School | - | - |
| High School Diploma | $38,750 | $28,750 |
| College or Associate's Degree | $34,107 | $0 |
| Bachelor's Degree | - | - |
| Graduate Degree | - | - |
| Total | $40,104 | $30,221 |
Family Income in Velda City
Family Income Brackets in Velda City
According to the Velda City family income data, there are 85 families falling into the $35,000 to $49,999 income range, which is the most common income bracket and makes up 24.5% of all families.
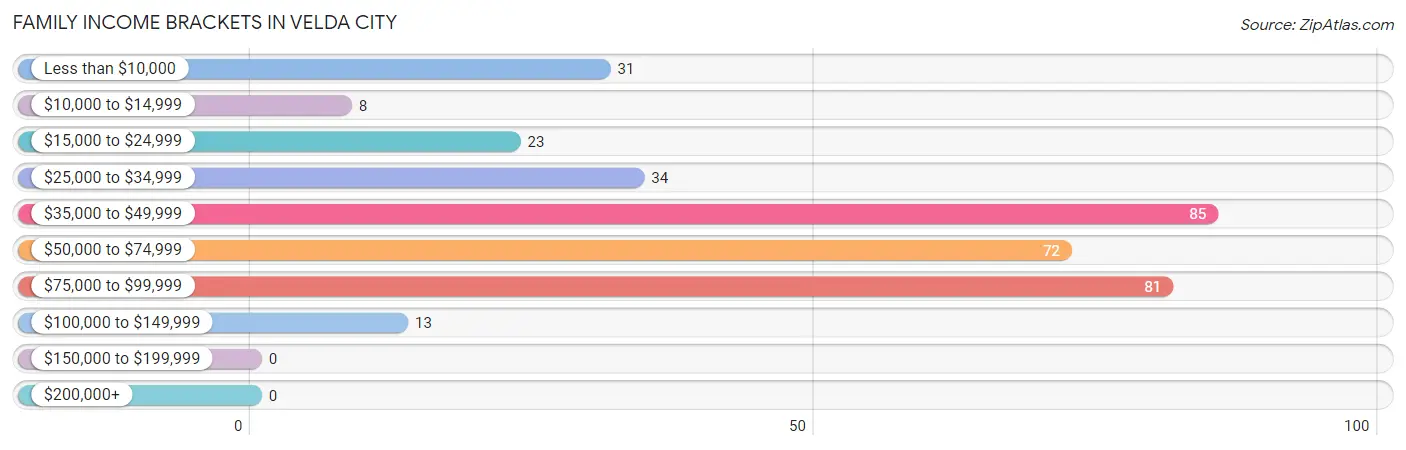
| Income Bracket | # Families | % Families |
| Less than $10,000 | 31 | 8.9% |
| $10,000 to $14,999 | 8 | 2.3% |
| $15,000 to $24,999 | 23 | 6.6% |
| $25,000 to $34,999 | 34 | 9.8% |
| $35,000 to $49,999 | 85 | 24.5% |
| $50,000 to $74,999 | 72 | 20.7% |
| $75,000 to $99,999 | 81 | 23.3% |
| $100,000 to $149,999 | 13 | 3.7% |
| $150,000 to $199,999 | 0 | 0.0% |
| $200,000+ | 0 | 0.0% |
Family Income by Famaliy Size in Velda City
3-person families (79 | 22.8%) account for the highest median family income in Velda City with $58,750 per family, while 2-person families (191 | 55.0%) have the highest median income of $23,144 per family member.
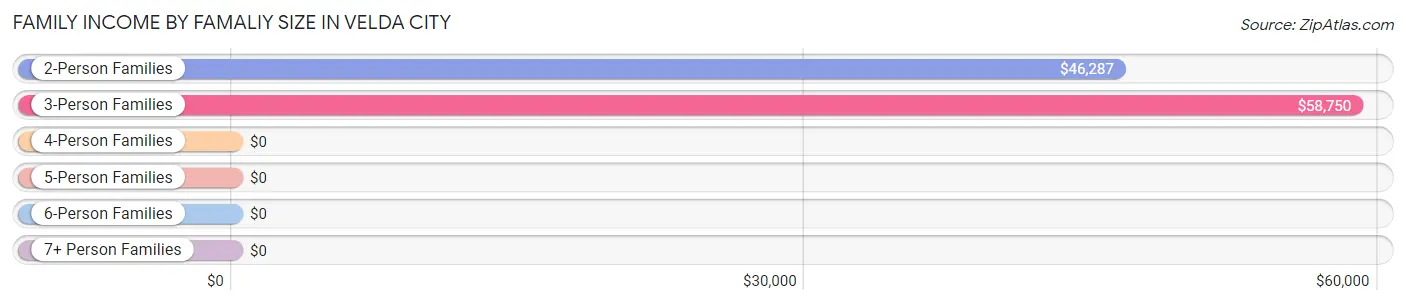
| Income Bracket | # Families | Median Income |
| 2-Person Families | 191 (55.0%) | $46,287 |
| 3-Person Families | 79 (22.8%) | $58,750 |
| 4-Person Families | 65 (18.7%) | $0 |
| 5-Person Families | 2 (0.6%) | $0 |
| 6-Person Families | 3 (0.9%) | $0 |
| 7+ Person Families | 7 (2.0%) | $0 |
| Total | 347 (100.0%) | $47,917 |
Family Income by Number of Earners in Velda City
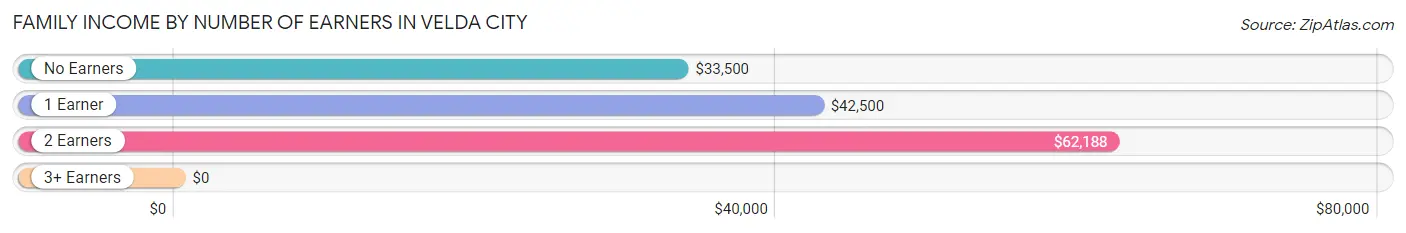
| Number of Earners | # Families | Median Income |
| No Earners | 78 (22.5%) | $33,500 |
| 1 Earner | 136 (39.2%) | $42,500 |
| 2 Earners | 127 (36.6%) | $62,188 |
| 3+ Earners | 6 (1.7%) | $0 |
| Total | 347 (100.0%) | $47,917 |
Household Income in Velda City
Household Income Brackets in Velda City
With 120 households falling in the category, the $35,000 to $49,999 income range is the most frequent in Velda City, accounting for 23.2% of all households.
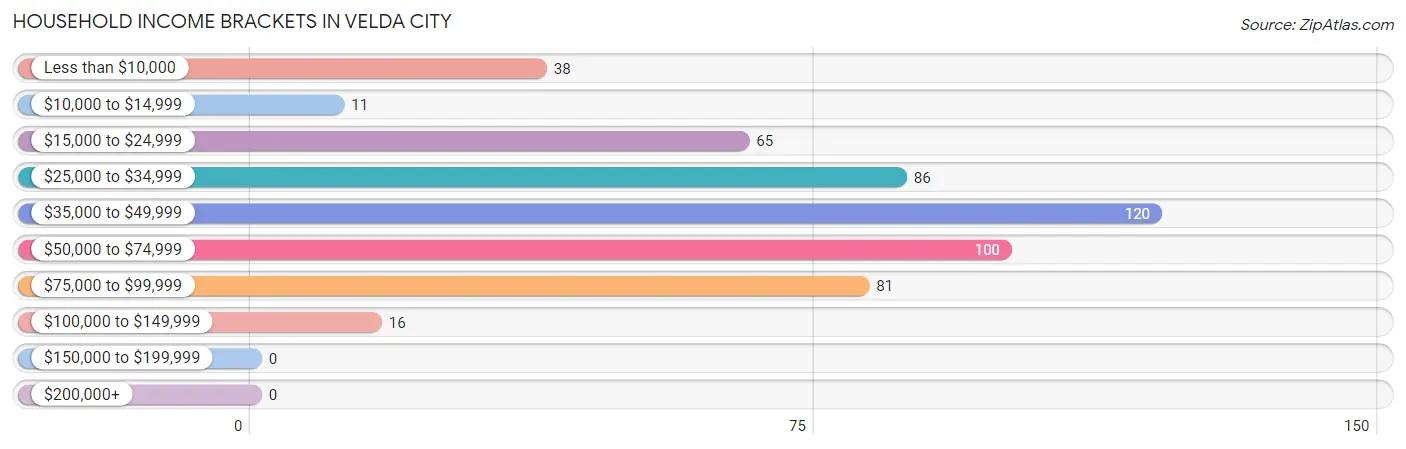
| Income Bracket | # Households | % Households |
| Less than $10,000 | 38 | 7.4% |
| $10,000 to $14,999 | 11 | 2.1% |
| $15,000 to $24,999 | 65 | 12.6% |
| $25,000 to $34,999 | 86 | 16.6% |
| $35,000 to $49,999 | 120 | 23.2% |
| $50,000 to $74,999 | 100 | 19.3% |
| $75,000 to $99,999 | 81 | 15.7% |
| $100,000 to $149,999 | 16 | 3.1% |
| $150,000 to $199,999 | 0 | 0.0% |
| $200,000+ | 0 | 0.0% |
Household Income by Householder Age in Velda City
The median household income in Velda City is $44,432, with the highest median household income of $49,792 found in the 45 to 64 years age bracket for the primary householder. A total of 200 households (38.7%) fall into this category. Meanwhile, the 15 to 24 years age bracket for the primary householder has the lowest median household income of $0, with 19 households (3.7%) in this group.
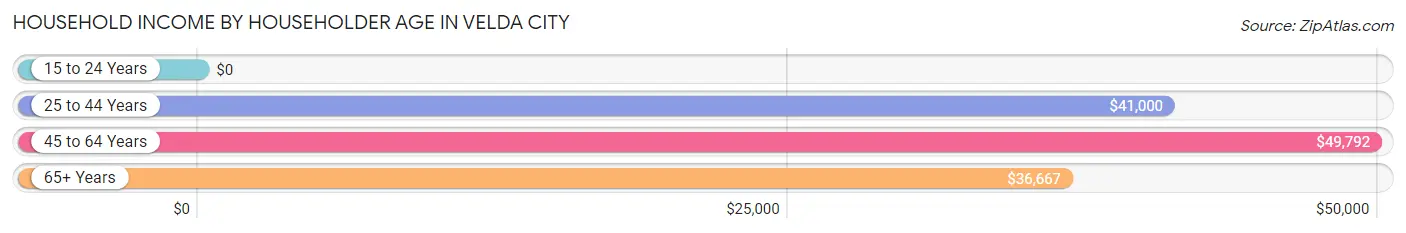
| Income Bracket | # Households | Median Income |
| 15 to 24 Years | 19 (3.7%) | $0 |
| 25 to 44 Years | 142 (27.5%) | $41,000 |
| 45 to 64 Years | 200 (38.7%) | $49,792 |
| 65+ Years | 156 (30.2%) | $36,667 |
| Total | 517 (100.0%) | $44,432 |
Poverty in Velda City
Income Below Poverty by Sex and Age in Velda City
With 16.8% poverty level for males and 17.5% for females among the residents of Velda City, 12 to 14 year old males and 5 year old females are the most vulnerable to poverty, with 36 males (100.0%) and 9 females (50.0%) in their respective age groups living below the poverty level.
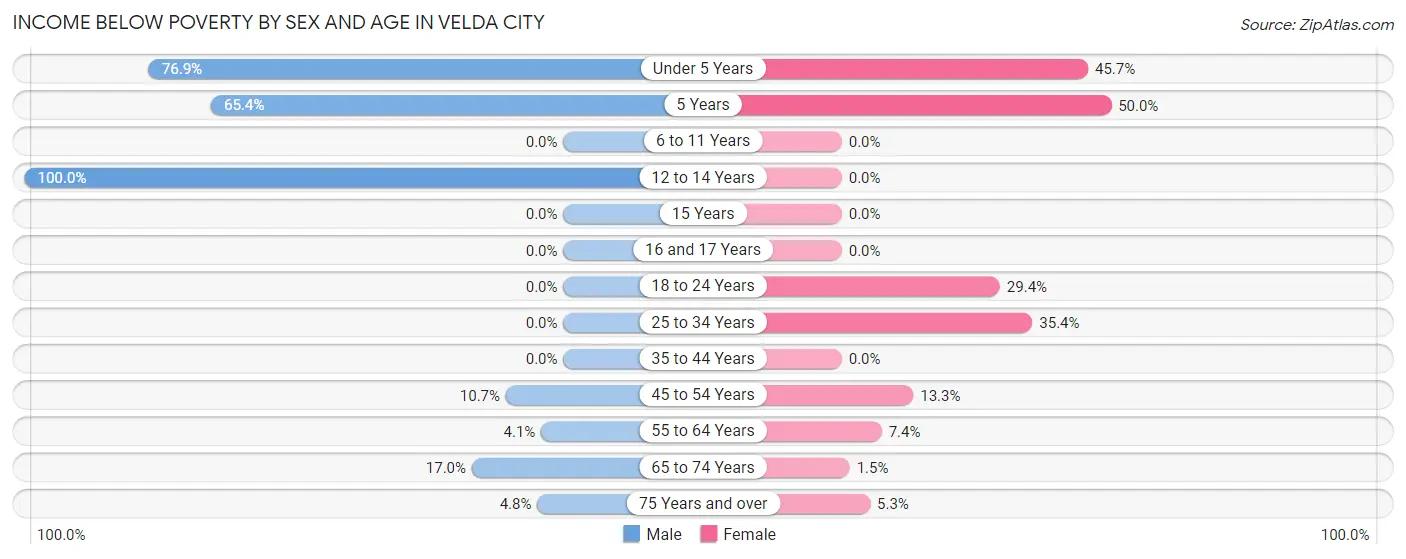
| Age Bracket | Male | Female |
| Under 5 Years | 20 (76.9%) | 32 (45.7%) |
| 5 Years | 17 (65.4%) | 9 (50.0%) |
| 6 to 11 Years | 0 (0.0%) | 0 (0.0%) |
| 12 to 14 Years | 36 (100.0%) | 0 (0.0%) |
| 15 Years | 0 (0.0%) | 0 (0.0%) |
| 16 and 17 Years | 0 (0.0%) | 0 (0.0%) |
| 18 to 24 Years | 0 (0.0%) | 27 (29.3%) |
| 25 to 34 Years | 0 (0.0%) | 29 (35.4%) |
| 35 to 44 Years | 0 (0.0%) | 0 (0.0%) |
| 45 to 54 Years | 8 (10.7%) | 13 (13.3%) |
| 55 to 64 Years | 3 (4.1%) | 6 (7.4%) |
| 65 to 74 Years | 9 (17.0%) | 1 (1.5%) |
| 75 Years and over | 3 (4.8%) | 3 (5.3%) |
| Total | 96 (16.8%) | 120 (17.5%) |
Income Above Poverty by Sex and Age in Velda City
According to the poverty statistics in Velda City, males aged 6 to 11 years and females aged 6 to 11 years are the age groups that are most secure financially, with 100.0% of males and 100.0% of females in these age groups living above the poverty line.
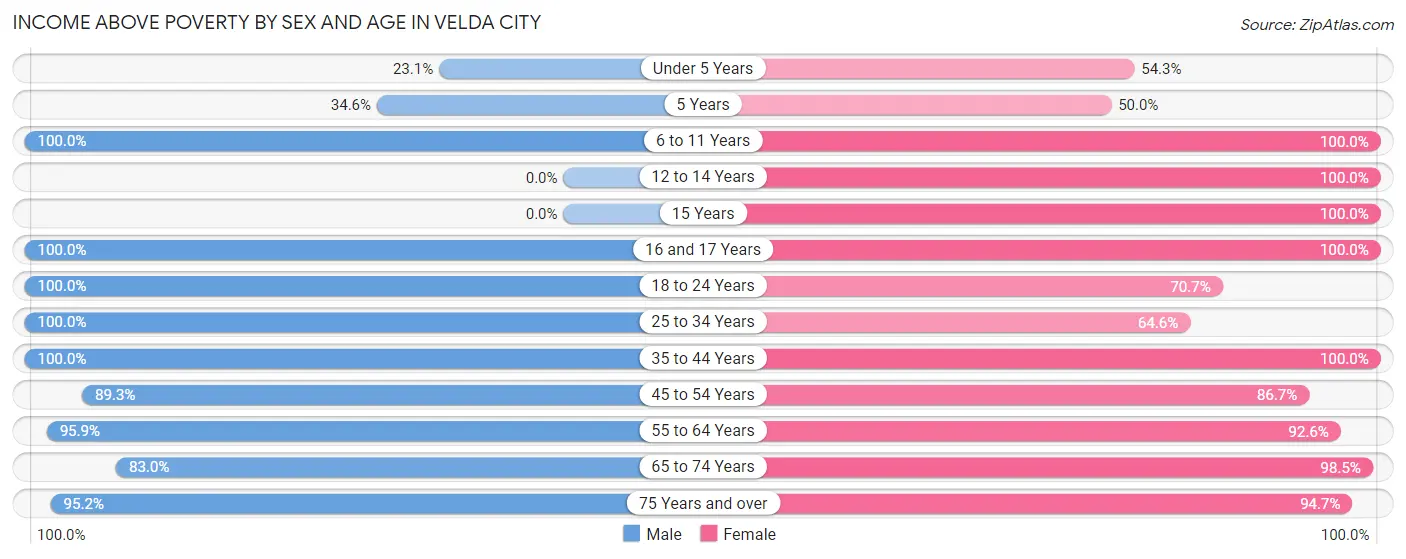
| Age Bracket | Male | Female |
| Under 5 Years | 6 (23.1%) | 38 (54.3%) |
| 5 Years | 9 (34.6%) | 9 (50.0%) |
| 6 to 11 Years | 45 (100.0%) | 41 (100.0%) |
| 12 to 14 Years | 0 (0.0%) | 2 (100.0%) |
| 15 Years | 0 (0.0%) | 10 (100.0%) |
| 16 and 17 Years | 11 (100.0%) | 18 (100.0%) |
| 18 to 24 Years | 72 (100.0%) | 65 (70.7%) |
| 25 to 34 Years | 35 (100.0%) | 53 (64.6%) |
| 35 to 44 Years | 56 (100.0%) | 47 (100.0%) |
| 45 to 54 Years | 67 (89.3%) | 85 (86.7%) |
| 55 to 64 Years | 70 (95.9%) | 75 (92.6%) |
| 65 to 74 Years | 44 (83.0%) | 67 (98.5%) |
| 75 Years and over | 59 (95.2%) | 54 (94.7%) |
| Total | 474 (83.2%) | 564 (82.5%) |
Income Below Poverty Among Married-Couple Families in Velda City
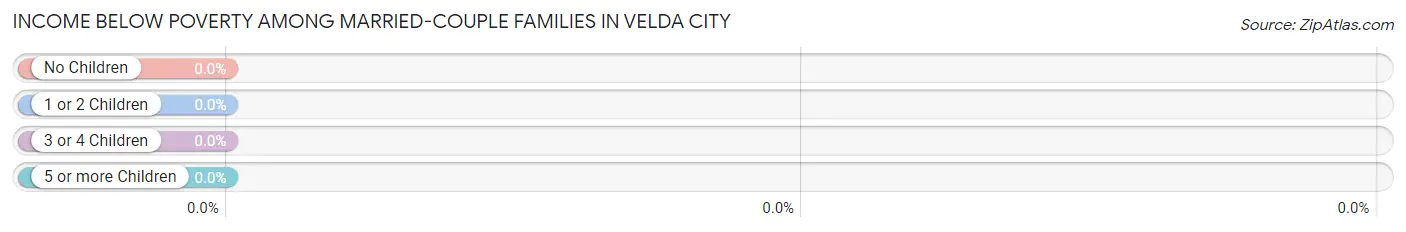
| Children | Above Poverty | Below Poverty |
| No Children | 98 (100.0%) | 0 (0.0%) |
| 1 or 2 Children | 30 (100.0%) | 0 (0.0%) |
| 3 or 4 Children | 8 (100.0%) | 0 (0.0%) |
| 5 or more Children | 2 (100.0%) | 0 (0.0%) |
| Total | 138 (100.0%) | 0 (0.0%) |
Income Below Poverty Among Single-Parent Households in Velda City
According to the poverty data in Velda City, 19.1% or 8 single-father households and 30.5% or 51 single-mother households are living below the poverty line. Among single-father households, those with 1 or 2 children have the highest poverty rate, with 8 households (50.0%) experiencing poverty. Likewise, among single-mother households, those with 3 or 4 children have the highest poverty rate, with 20 households (100.0%) falling below the poverty line.
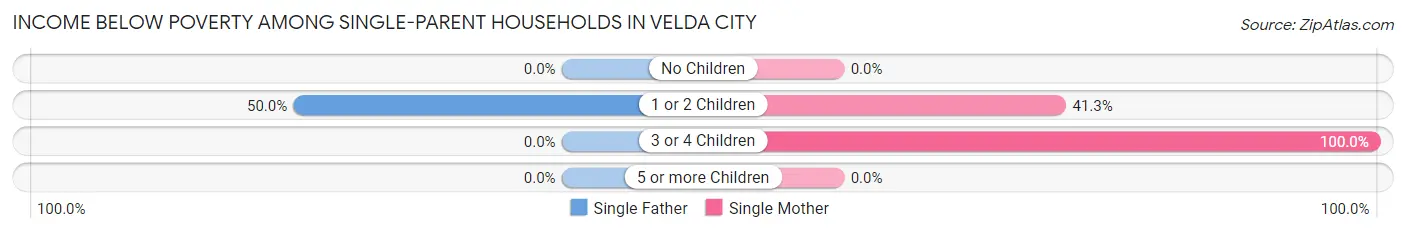
| Children | Single Father | Single Mother |
| No Children | 0 (0.0%) | 0 (0.0%) |
| 1 or 2 Children | 8 (50.0%) | 31 (41.3%) |
| 3 or 4 Children | 0 (0.0%) | 20 (100.0%) |
| 5 or more Children | 0 (0.0%) | 0 (0.0%) |
| Total | 8 (19.1%) | 51 (30.5%) |
Income Below Poverty Among Married-Couple vs Single-Parent Households in Velda City
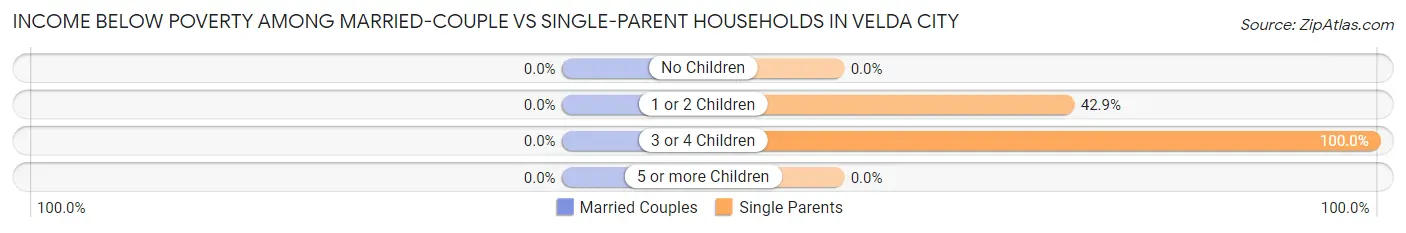
| Children | Married-Couple Families | Single-Parent Households |
| No Children | 0 (0.0%) | 0 (0.0%) |
| 1 or 2 Children | 0 (0.0%) | 39 (42.9%) |
| 3 or 4 Children | 0 (0.0%) | 20 (100.0%) |
| 5 or more Children | 0 (0.0%) | 0 (0.0%) |
| Total | 0 (0.0%) | 59 (28.2%) |
Race in Velda City
The most populous races in Velda City are Black / African American (1,196 | 95.4%), White / Caucasian (42 | 3.4%), and Hispanic or Latino (12 | 1.0%).
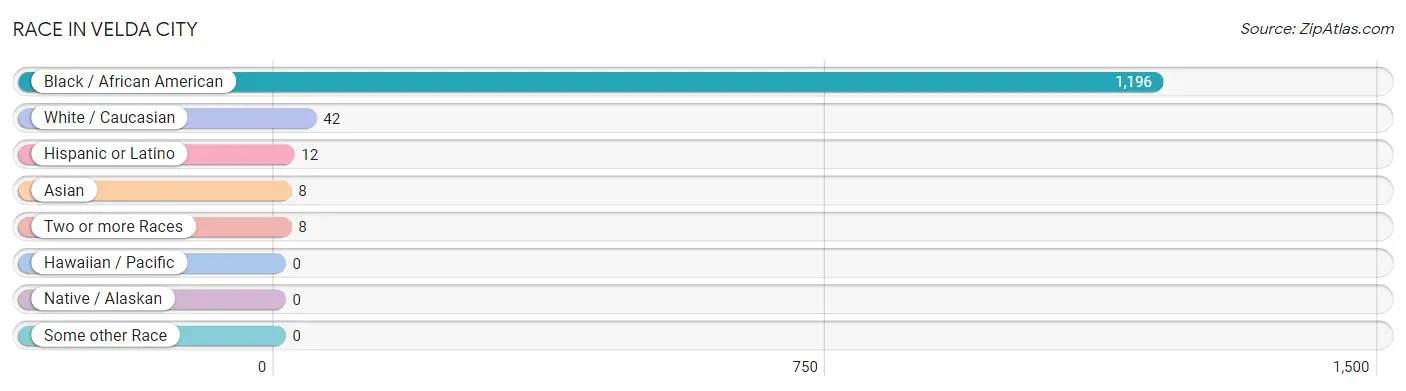
| Race | # Population | % Population |
| Asian | 8 | 0.6% |
| Black / African American | 1,196 | 95.4% |
| Hawaiian / Pacific | 0 | 0.0% |
| Hispanic or Latino | 12 | 1.0% |
| Native / Alaskan | 0 | 0.0% |
| White / Caucasian | 42 | 3.4% |
| Two or more Races | 8 | 0.6% |
| Some other Race | 0 | 0.0% |
| Total | 1,254 | 100.0% |
Ancestry in Velda City
The most populous ancestries reported in Velda City are American (134 | 10.7%), African (18 | 1.4%), Subsaharan African (18 | 1.4%), Mexican (12 | 1.0%), and Sri Lankan (8 | 0.6%), together accounting for 15.2% of all Velda City residents.
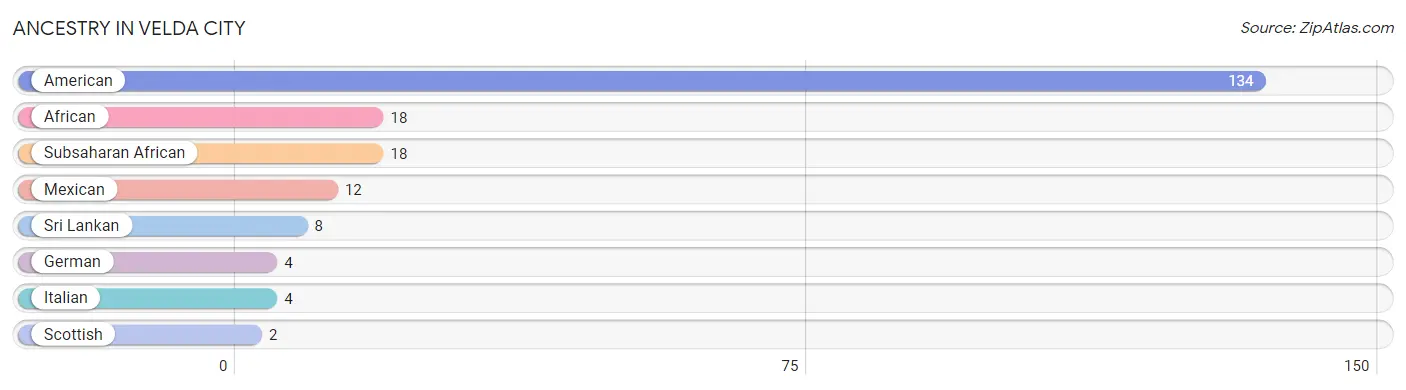
| Ancestry | # Population | % Population |
| African | 18 | 1.4% |
| American | 134 | 10.7% |
| German | 4 | 0.3% |
| Italian | 4 | 0.3% |
| Mexican | 12 | 1.0% |
| Scottish | 2 | 0.2% |
| Sri Lankan | 8 | 0.6% |
| Subsaharan African | 18 | 1.4% | View All 8 Rows |
Immigrants in Velda City
The most numerous immigrant groups reported in Velda City came from Asia (8 | 0.6%), South Eastern Asia (8 | 0.6%), Vietnam (8 | 0.6%), Central America (3 | 0.2%), and Latin America (3 | 0.2%), together accounting for 2.4% of all Velda City residents.
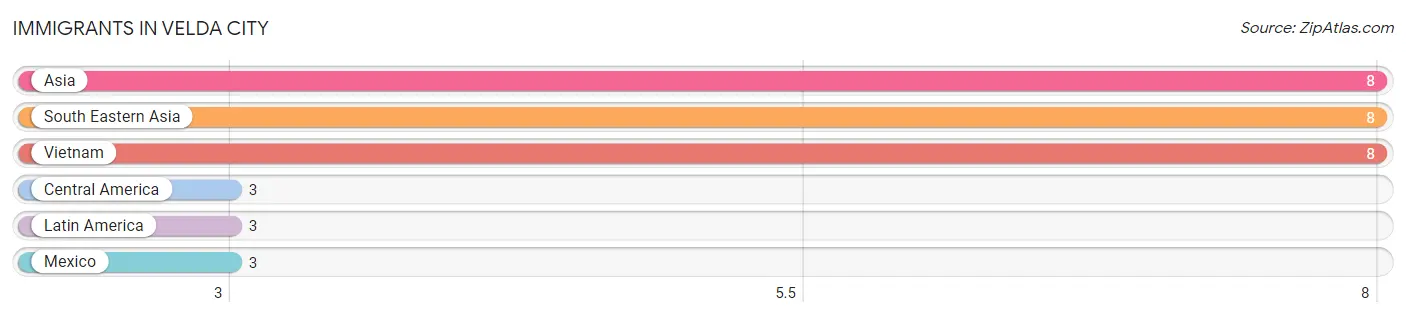
| Immigration Origin | # Population | % Population |
| Asia | 8 | 0.6% |
| Central America | 3 | 0.2% |
| Latin America | 3 | 0.2% |
| Mexico | 3 | 0.2% |
| South Eastern Asia | 8 | 0.6% |
| Vietnam | 8 | 0.6% | View All 6 Rows |
Sex and Age in Velda City
Sex and Age in Velda City
The most populous age groups in Velda City are 20 to 24 Years (64 | 11.2%) for men and 50 to 54 Years (85 | 12.4%) for women.
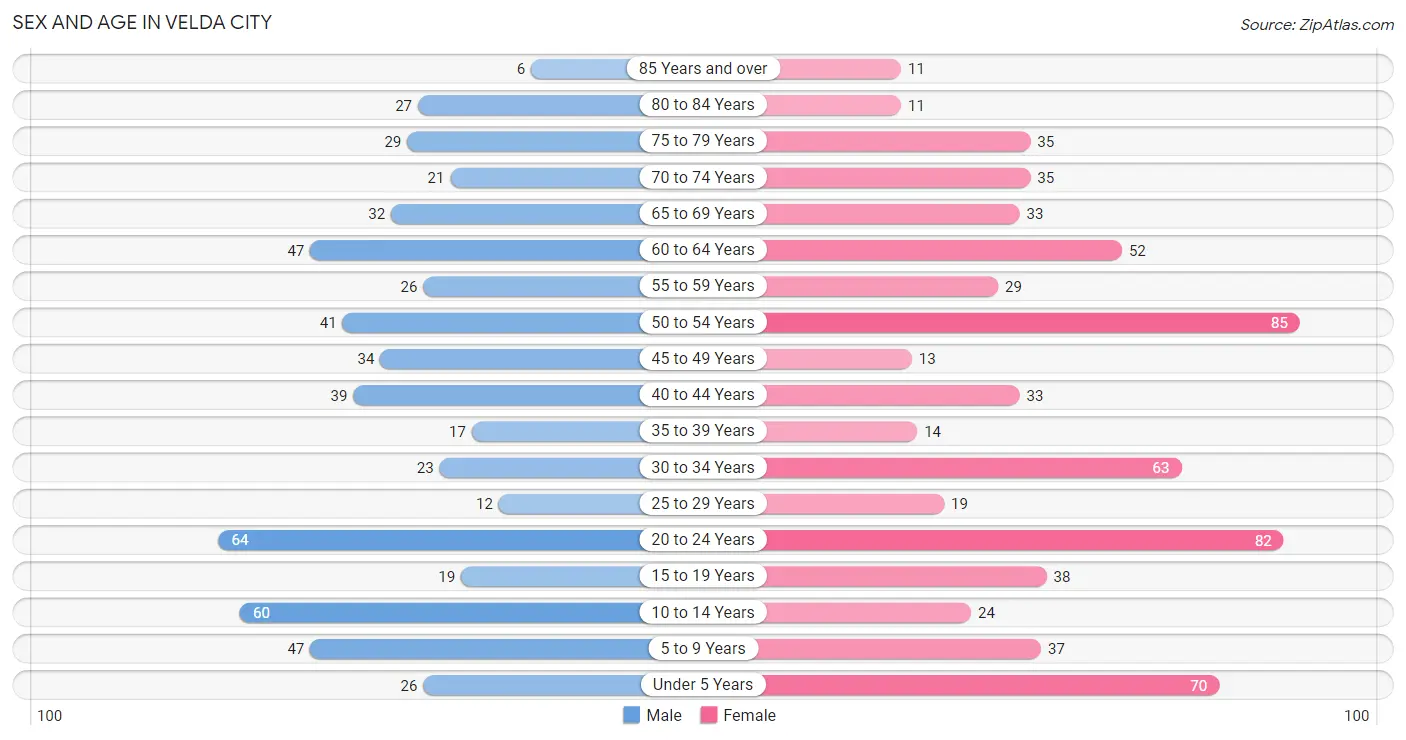
| Age Bracket | Male | Female |
| Under 5 Years | 26 (4.6%) | 70 (10.2%) |
| 5 to 9 Years | 47 (8.3%) | 37 (5.4%) |
| 10 to 14 Years | 60 (10.5%) | 24 (3.5%) |
| 15 to 19 Years | 19 (3.3%) | 38 (5.6%) |
| 20 to 24 Years | 64 (11.2%) | 82 (12.0%) |
| 25 to 29 Years | 12 (2.1%) | 19 (2.8%) |
| 30 to 34 Years | 23 (4.0%) | 63 (9.2%) |
| 35 to 39 Years | 17 (3.0%) | 14 (2.1%) |
| 40 to 44 Years | 39 (6.8%) | 33 (4.8%) |
| 45 to 49 Years | 34 (6.0%) | 13 (1.9%) |
| 50 to 54 Years | 41 (7.2%) | 85 (12.4%) |
| 55 to 59 Years | 26 (4.6%) | 29 (4.2%) |
| 60 to 64 Years | 47 (8.3%) | 52 (7.6%) |
| 65 to 69 Years | 32 (5.6%) | 33 (4.8%) |
| 70 to 74 Years | 21 (3.7%) | 35 (5.1%) |
| 75 to 79 Years | 29 (5.1%) | 35 (5.1%) |
| 80 to 84 Years | 27 (4.7%) | 11 (1.6%) |
| 85 Years and over | 6 (1.1%) | 11 (1.6%) |
| Total | 570 (100.0%) | 684 (100.0%) |
Families and Households in Velda City
Median Family Size in Velda City
The median family size in Velda City is 3.01 persons per family, with married-couple families (138 | 39.8%) accounting for the largest median family size of 3.31 persons per family. On the other hand, single male/father families (42 | 12.1%) represent the smallest median family size with 2.31 persons per family.
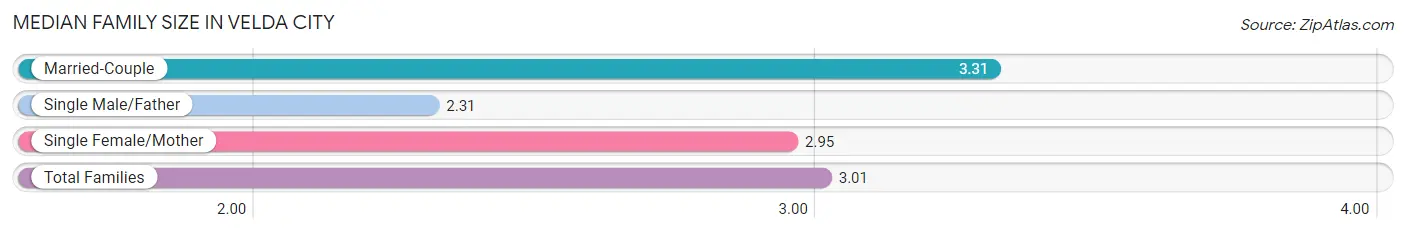
| Family Type | # Families | Family Size |
| Married-Couple | 138 (39.8%) | 3.31 |
| Single Male/Father | 42 (12.1%) | 2.31 |
| Single Female/Mother | 167 (48.1%) | 2.95 |
| Total Families | 347 (100.0%) | 3.01 |
Median Household Size in Velda City
The median household size in Velda City is 2.43 persons per household, with married-couple households (138 | 26.7%) accounting for the largest median household size of 3.31 persons per household. non-family households (170 | 32.9%) represent the smallest median household size with 1.14 persons per household.
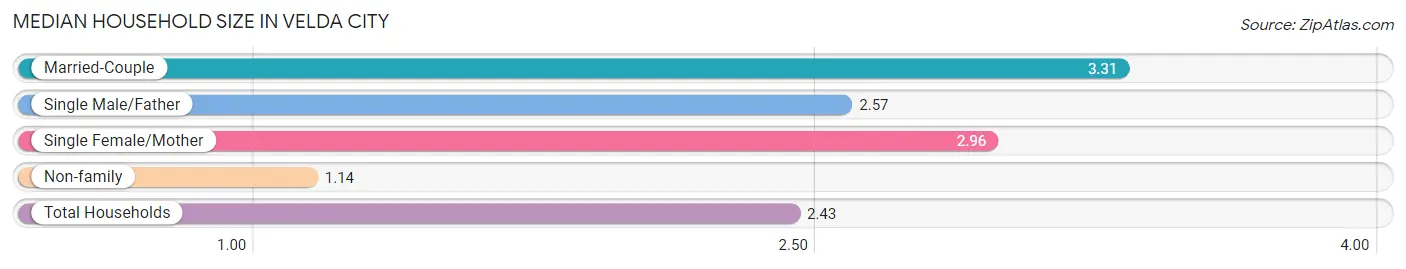
| Household Type | # Households | Household Size |
| Married-Couple | 138 (26.7%) | 3.31 |
| Single Male/Father | 42 (8.1%) | 2.57 |
| Single Female/Mother | 167 (32.3%) | 2.96 |
| Non-family | 170 (32.9%) | 1.14 |
| Total Households | 517 (100.0%) | 2.43 |
Household Size by Marriage Status in Velda City
Out of a total of 517 households in Velda City, 347 (67.1%) are family households, while 170 (32.9%) are nonfamily households. The most numerous type of family households are 2-person households, comprising 177, and the most common type of nonfamily households are 1-person households, comprising 146.
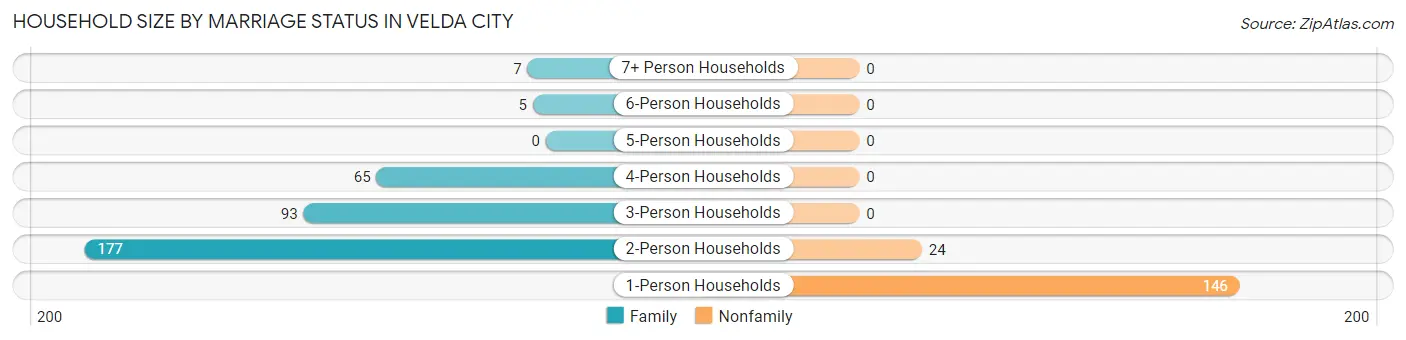
| Household Size | Family Households | Nonfamily Households |
| 1-Person Households | - | 146 (28.2%) |
| 2-Person Households | 177 (34.2%) | 24 (4.6%) |
| 3-Person Households | 93 (18.0%) | 0 (0.0%) |
| 4-Person Households | 65 (12.6%) | 0 (0.0%) |
| 5-Person Households | 0 (0.0%) | 0 (0.0%) |
| 6-Person Households | 5 (1.0%) | 0 (0.0%) |
| 7+ Person Households | 7 (1.3%) | 0 (0.0%) |
| Total | 347 (67.1%) | 170 (32.9%) |
Female Fertility in Velda City
Fertility by Age in Velda City
Average fertility rate in Velda City is 56.0 births per 1,000 women. Women in the age bracket of 20 to 34 years have the highest fertility rate with 104.0 births per 1,000 women. Women in the age bracket of 20 to 34 years acount for 100.0% of all women with births.
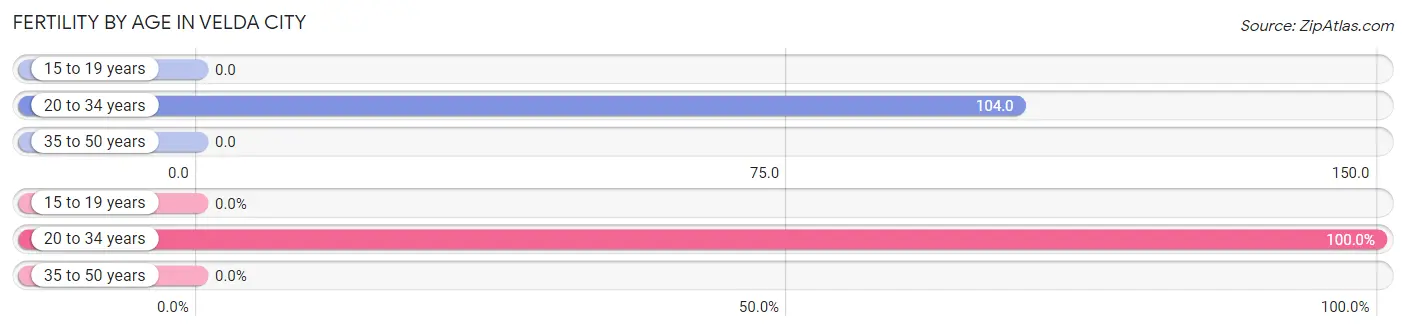
| Age Bracket | Women with Births | Births / 1,000 Women |
| 15 to 19 years | 0 (0.0%) | 0.0 |
| 20 to 34 years | 17 (100.0%) | 104.0 |
| 35 to 50 years | 0 (0.0%) | 0.0 |
| Total | 17 (100.0%) | 56.0 |
Fertility by Age by Marriage Status in Velda City
47.1% of women with births (17) in Velda City are married. The highest percentage of unmarried women with births falls into 20 to 34 years age bracket with 52.9% of them unmarried at the time of birth, while the lowest percentage of unmarried women with births belong to 20 to 34 years age bracket with 52.9% of them unmarried.
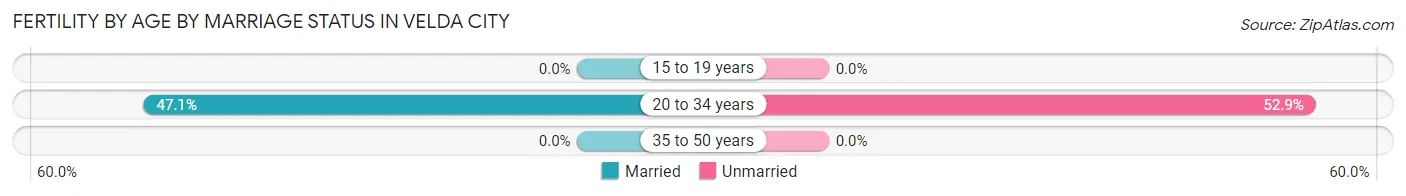
| Age Bracket | Married | Unmarried |
| 15 to 19 years | 0 (0.0%) | 0 (0.0%) |
| 20 to 34 years | 8 (47.1%) | 9 (52.9%) |
| 35 to 50 years | 0 (0.0%) | 0 (0.0%) |
| Total | 8 (47.1%) | 9 (52.9%) |
Fertility by Education in Velda City
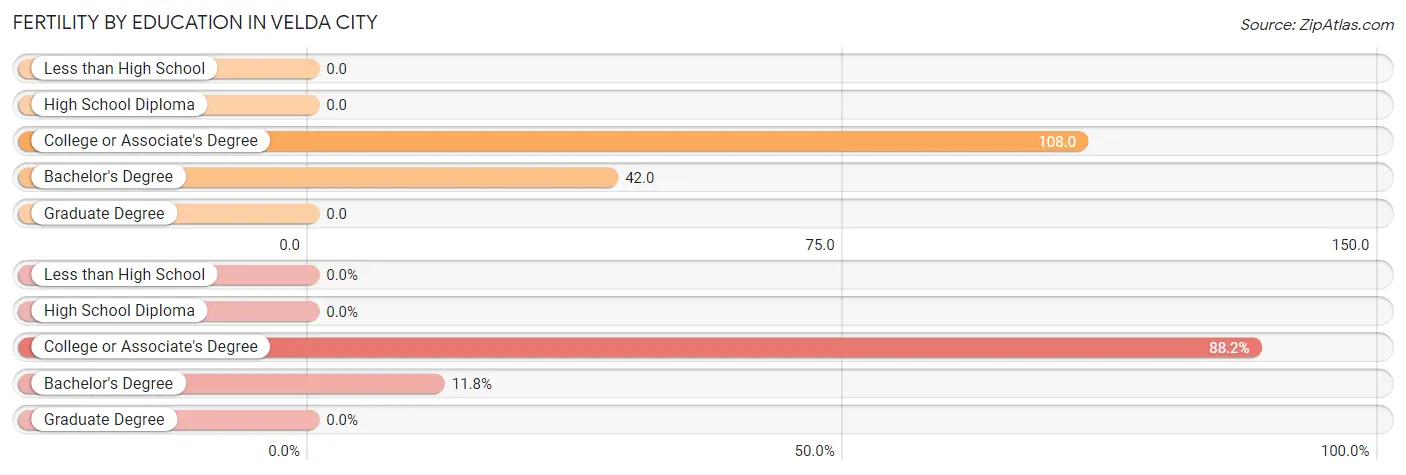
| Educational Attainment | Women with Births | Births / 1,000 Women |
| Less than High School | 0 (0.0%) | 0.0 |
| High School Diploma | 0 (0.0%) | 0.0 |
| College or Associate's Degree | 15 (88.2%) | 108.0 |
| Bachelor's Degree | 2 (11.8%) | 42.0 |
| Graduate Degree | 0 (0.0%) | 0.0 |
| Total | 17 (100.0%) | 56.0 |
Fertility by Education by Marriage Status in Velda City
52.9% of women with births in Velda City are unmarried. Women with the educational attainment of bachelor's degree are most likely to be married with 100.0% of them married at childbirth, while women with the educational attainment of college or associate's degree are least likely to be married with 60.0% of them unmarried at childbirth.
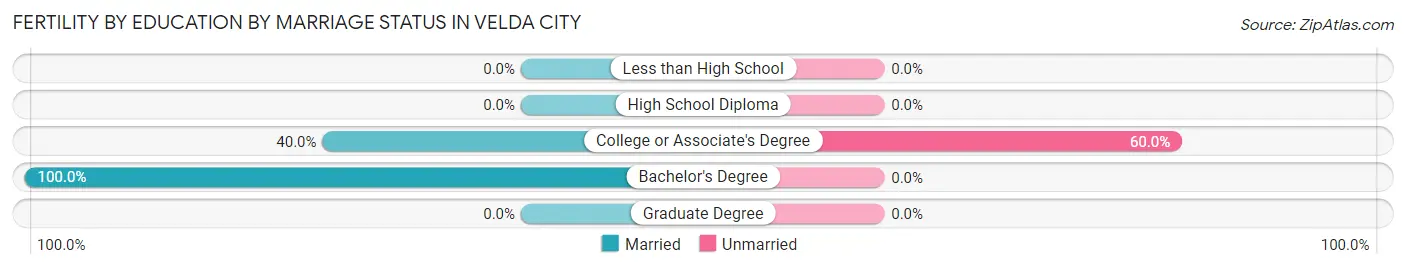
| Educational Attainment | Married | Unmarried |
| Less than High School | 0 (0.0%) | 0 (0.0%) |
| High School Diploma | 0 (0.0%) | 0 (0.0%) |
| College or Associate's Degree | 6 (40.0%) | 9 (60.0%) |
| Bachelor's Degree | 2 (100.0%) | 0 (0.0%) |
| Graduate Degree | 0 (0.0%) | 0 (0.0%) |
| Total | 8 (47.1%) | 9 (52.9%) |
Employment Characteristics in Velda City
Employment by Class of Employer in Velda City
Among the 519 employed individuals in Velda City, private company employees (353 | 68.0%), state government employees (69 | 13.3%), and not-for-profit organizations (30 | 5.8%) make up the most common classes of employment.
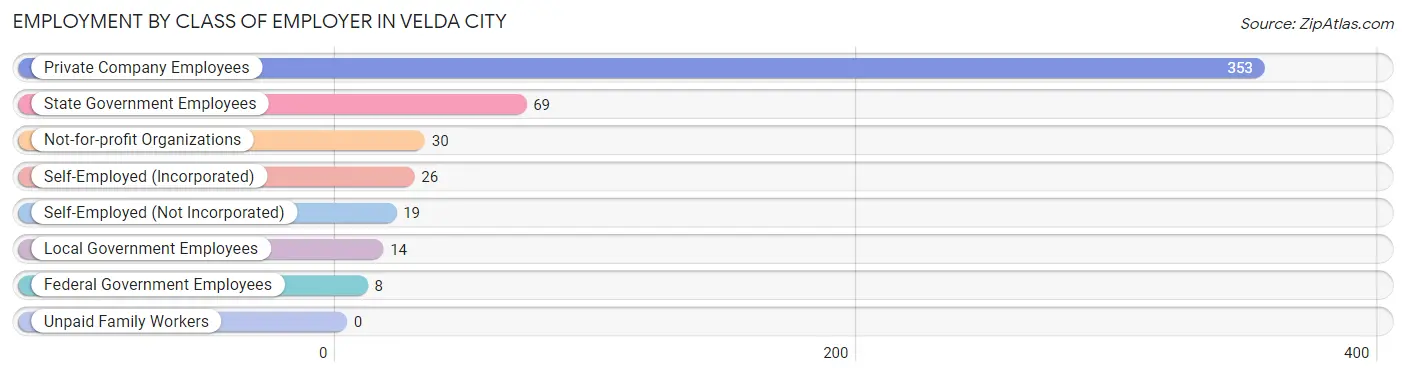
| Employer Class | # Employees | % Employees |
| Private Company Employees | 353 | 68.0% |
| Self-Employed (Incorporated) | 26 | 5.0% |
| Self-Employed (Not Incorporated) | 19 | 3.7% |
| Not-for-profit Organizations | 30 | 5.8% |
| Local Government Employees | 14 | 2.7% |
| State Government Employees | 69 | 13.3% |
| Federal Government Employees | 8 | 1.5% |
| Unpaid Family Workers | 0 | 0.0% |
| Total | 519 | 100.0% |
Employment Status by Age in Velda City
According to the labor force statistics for Velda City, out of the total population over 16 years of age (980), 57.2% or 561 individuals are in the labor force, with 4.5% or 25 of them unemployed. The age group with the highest labor force participation rate is 25 to 29 years, with 100.0% or 31 individuals in the labor force. Within the labor force, the 20 to 24 years age range has the highest percentage of unemployed individuals, with 18.5% or 23 of them being unemployed.
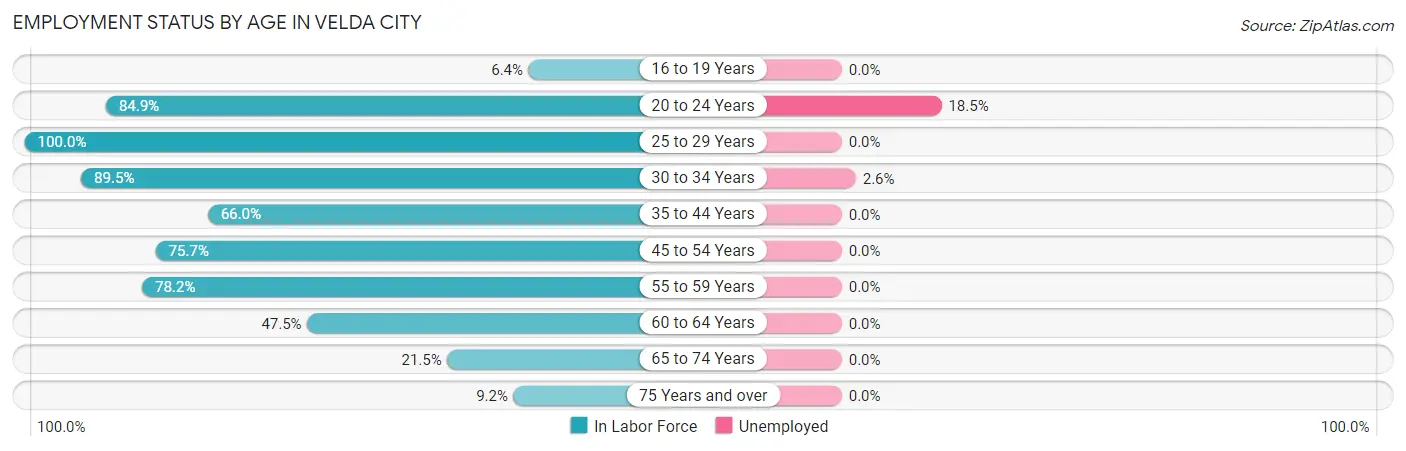
| Age Bracket | In Labor Force | Unemployed |
| 16 to 19 Years | 3 (6.4%) | 0 (0.0%) |
| 20 to 24 Years | 124 (84.9%) | 23 (18.5%) |
| 25 to 29 Years | 31 (100.0%) | 0 (0.0%) |
| 30 to 34 Years | 77 (89.5%) | 2 (2.6%) |
| 35 to 44 Years | 68 (66.0%) | 0 (0.0%) |
| 45 to 54 Years | 131 (75.7%) | 0 (0.0%) |
| 55 to 59 Years | 43 (78.2%) | 0 (0.0%) |
| 60 to 64 Years | 47 (47.5%) | 0 (0.0%) |
| 65 to 74 Years | 26 (21.5%) | 0 (0.0%) |
| 75 Years and over | 11 (9.2%) | 0 (0.0%) |
| Total | 561 (57.2%) | 25 (4.5%) |
Employment Status by Educational Attainment in Velda City
According to labor force statistics for Velda City, 72.6% of individuals (397) out of the total population between 25 and 64 years of age (547) are in the labor force, with 0.5% or 2 of them being unemployed. The group with the highest labor force participation rate are those with the educational attainment of bachelor's degree or higher, with 90.9% or 80 individuals in the labor force. Within the labor force, individuals with bachelor's degree or higher education have the highest percentage of unemployment, with 2.5% or 2 of them being unemployed.
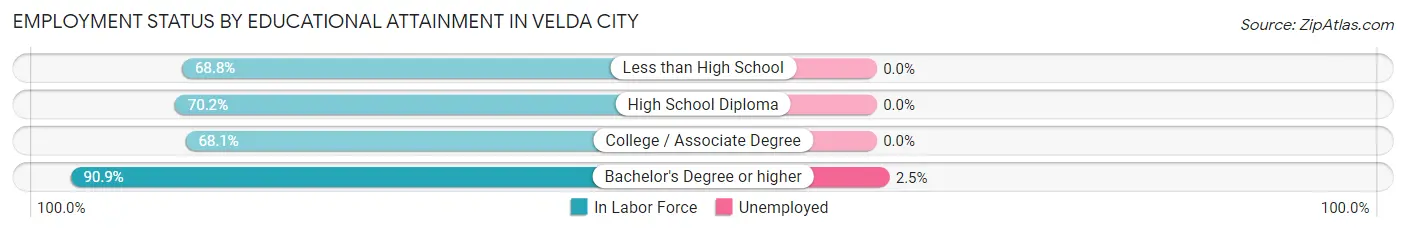
| Educational Attainment | In Labor Force | Unemployed |
| Less than High School | 33 (68.8%) | 0 (0.0%) |
| High School Diploma | 139 (70.2%) | 0 (0.0%) |
| College / Associate Degree | 145 (68.1%) | 0 (0.0%) |
| Bachelor's Degree or higher | 80 (90.9%) | 2 (2.5%) |
| Total | 397 (72.6%) | 3 (0.5%) |
Employment Occupations by Sex in Velda City
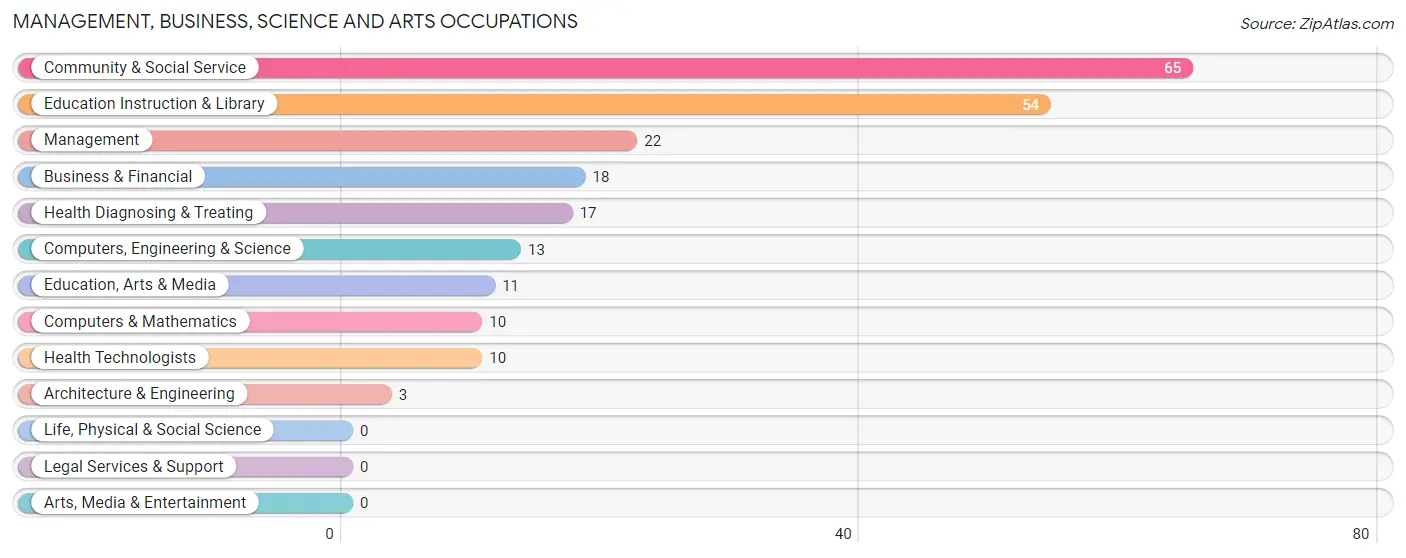
Management, Business, Science and Arts Occupations
The most common Management, Business, Science and Arts occupations in Velda City are Community & Social Service (65 | 12.1%), Education Instruction & Library (54 | 10.1%), Management (22 | 4.1%), Business & Financial (18 | 3.4%), and Health Diagnosing & Treating (17 | 3.2%).
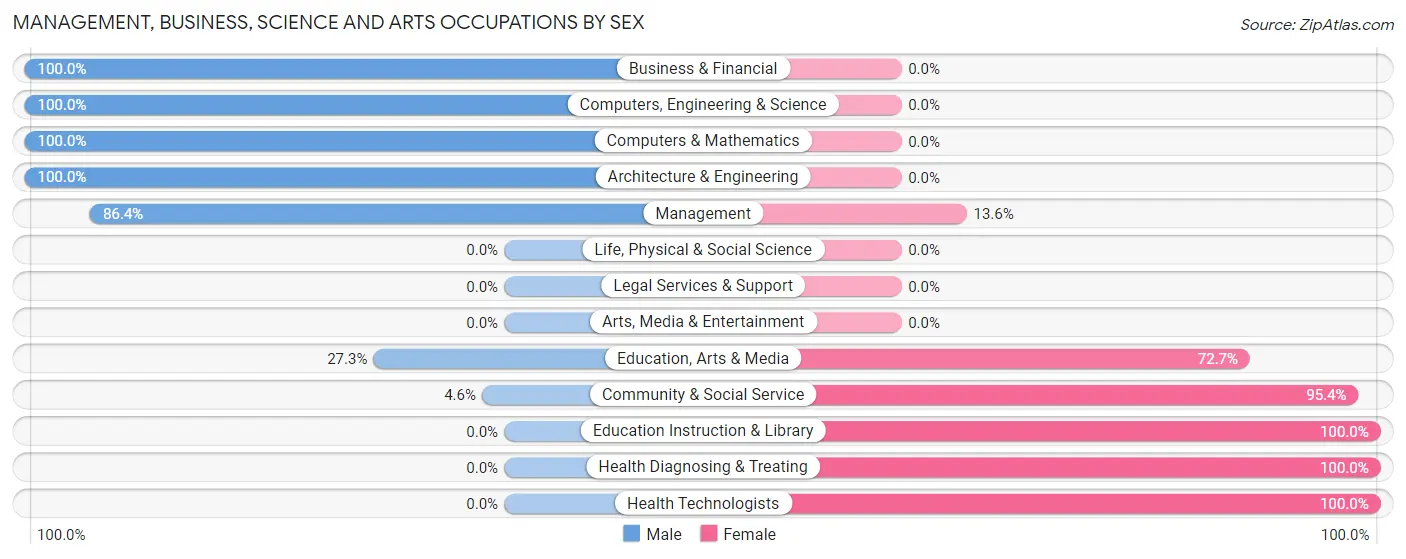
Management, Business, Science and Arts Occupations by Sex
Within the Management, Business, Science and Arts occupations in Velda City, the most male-oriented occupations are Business & Financial (100.0%), Computers, Engineering & Science (100.0%), and Computers & Mathematics (100.0%), while the most female-oriented occupations are Education Instruction & Library (100.0%), Health Diagnosing & Treating (100.0%), and Health Technologists (100.0%).
| Occupation | Male | Female |
| Management | 19 (86.4%) | 3 (13.6%) |
| Business & Financial | 18 (100.0%) | 0 (0.0%) |
| Computers, Engineering & Science | 13 (100.0%) | 0 (0.0%) |
| Computers & Mathematics | 10 (100.0%) | 0 (0.0%) |
| Architecture & Engineering | 3 (100.0%) | 0 (0.0%) |
| Life, Physical & Social Science | 0 (0.0%) | 0 (0.0%) |
| Community & Social Service | 3 (4.6%) | 62 (95.4%) |
| Education, Arts & Media | 3 (27.3%) | 8 (72.7%) |
| Legal Services & Support | 0 (0.0%) | 0 (0.0%) |
| Education Instruction & Library | 0 (0.0%) | 54 (100.0%) |
| Arts, Media & Entertainment | 0 (0.0%) | 0 (0.0%) |
| Health Diagnosing & Treating | 0 (0.0%) | 17 (100.0%) |
| Health Technologists | 0 (0.0%) | 10 (100.0%) |
| Total (Category) | 53 (39.3%) | 82 (60.7%) |
| Total (Overall) | 232 (43.3%) | 304 (56.7%) |
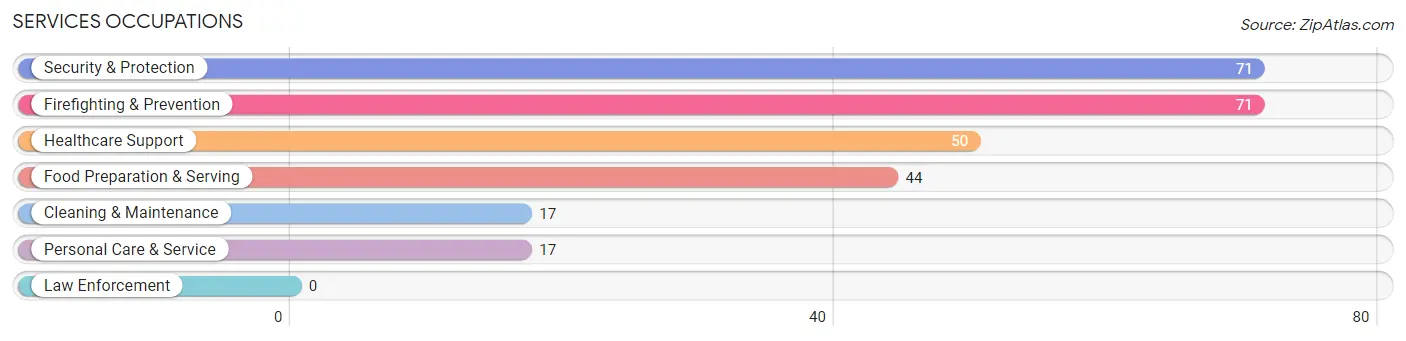
Services Occupations
The most common Services occupations in Velda City are Security & Protection (71 | 13.3%), Firefighting & Prevention (71 | 13.3%), Healthcare Support (50 | 9.3%), Food Preparation & Serving (44 | 8.2%), and Cleaning & Maintenance (17 | 3.2%).
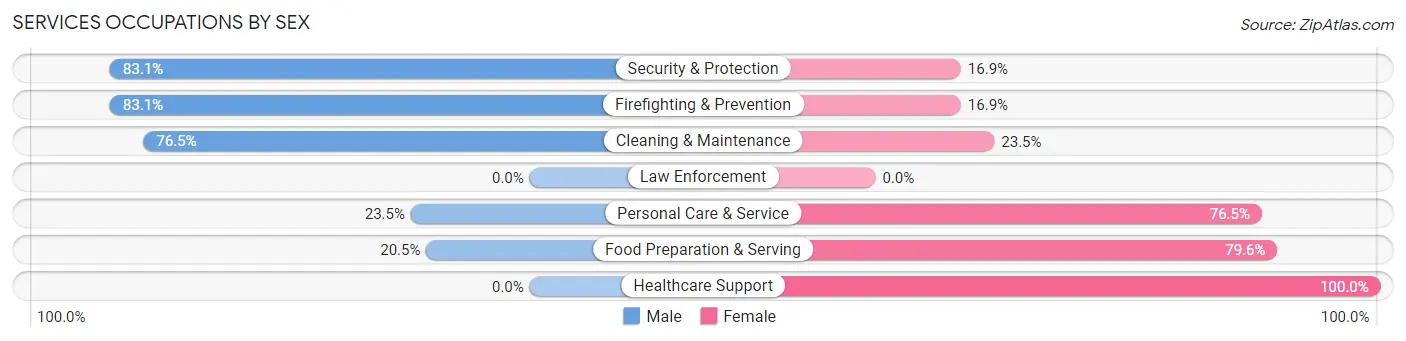
Services Occupations by Sex
Within the Services occupations in Velda City, the most male-oriented occupations are Security & Protection (83.1%), Firefighting & Prevention (83.1%), and Cleaning & Maintenance (76.5%), while the most female-oriented occupations are Healthcare Support (100.0%), Food Preparation & Serving (79.5%), and Personal Care & Service (76.5%).
| Occupation | Male | Female |
| Healthcare Support | 0 (0.0%) | 50 (100.0%) |
| Security & Protection | 59 (83.1%) | 12 (16.9%) |
| Firefighting & Prevention | 59 (83.1%) | 12 (16.9%) |
| Law Enforcement | 0 (0.0%) | 0 (0.0%) |
| Food Preparation & Serving | 9 (20.4%) | 35 (79.5%) |
| Cleaning & Maintenance | 13 (76.5%) | 4 (23.5%) |
| Personal Care & Service | 4 (23.5%) | 13 (76.5%) |
| Total (Category) | 85 (42.7%) | 114 (57.3%) |
| Total (Overall) | 232 (43.3%) | 304 (56.7%) |
Sales and Office Occupations
The most common Sales and Office occupations in Velda City are Sales & Related (65 | 12.1%), and Office & Administration (28 | 5.2%).
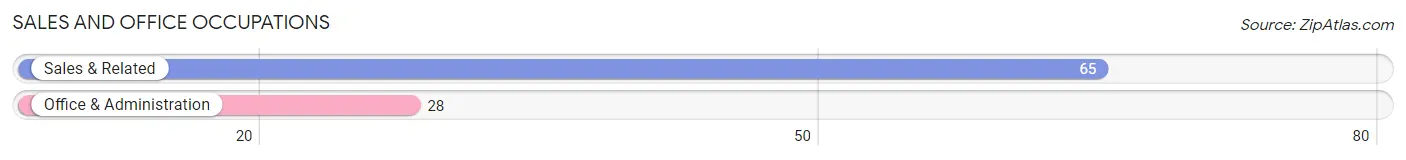
Sales and Office Occupations by Sex

| Occupation | Male | Female |
| Sales & Related | 18 (27.7%) | 47 (72.3%) |
| Office & Administration | 0 (0.0%) | 28 (100.0%) |
| Total (Category) | 18 (19.4%) | 75 (80.6%) |
| Total (Overall) | 232 (43.3%) | 304 (56.7%) |
Natural Resources, Construction and Maintenance Occupations
The most common Natural Resources, Construction and Maintenance occupations in Velda City are Construction & Extraction (7 | 1.3%), and Installation, Maintenance & Repair (5 | 0.9%).
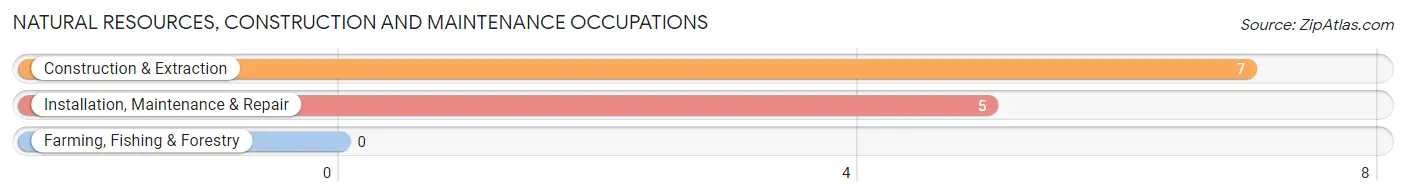
Natural Resources, Construction and Maintenance Occupations by Sex
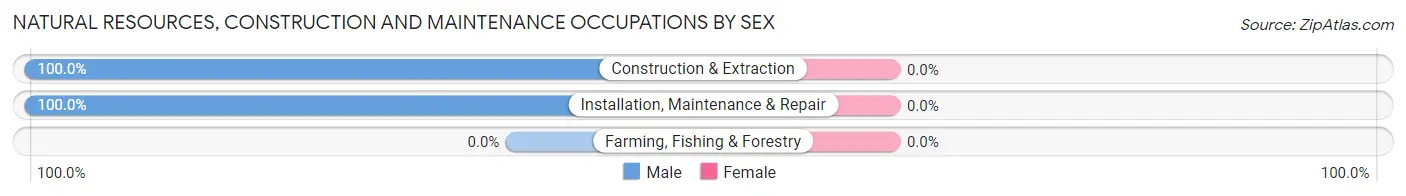
| Occupation | Male | Female |
| Farming, Fishing & Forestry | 0 (0.0%) | 0 (0.0%) |
| Construction & Extraction | 7 (100.0%) | 0 (0.0%) |
| Installation, Maintenance & Repair | 5 (100.0%) | 0 (0.0%) |
| Total (Category) | 12 (100.0%) | 0 (0.0%) |
| Total (Overall) | 232 (43.3%) | 304 (56.7%) |
Production, Transportation and Moving Occupations
The most common Production, Transportation and Moving occupations in Velda City are Production (55 | 10.3%), Material Moving (38 | 7.1%), and Transportation (4 | 0.7%).
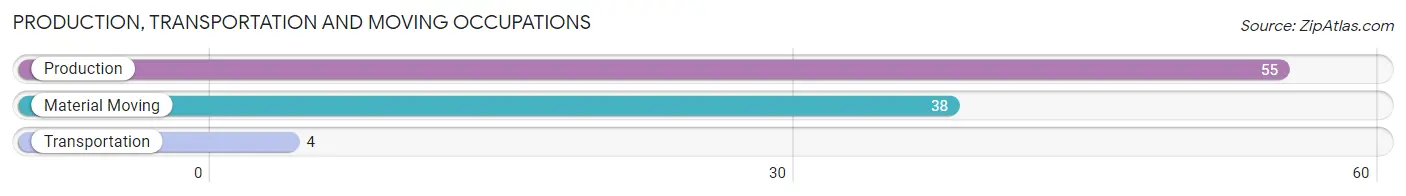
Production, Transportation and Moving Occupations by Sex
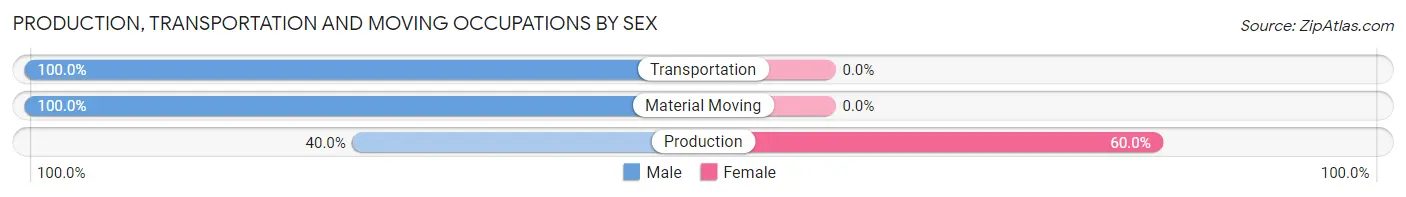
| Occupation | Male | Female |
| Production | 22 (40.0%) | 33 (60.0%) |
| Transportation | 4 (100.0%) | 0 (0.0%) |
| Material Moving | 38 (100.0%) | 0 (0.0%) |
| Total (Category) | 64 (66.0%) | 33 (34.0%) |
| Total (Overall) | 232 (43.3%) | 304 (56.7%) |
Employment Industries by Sex in Velda City
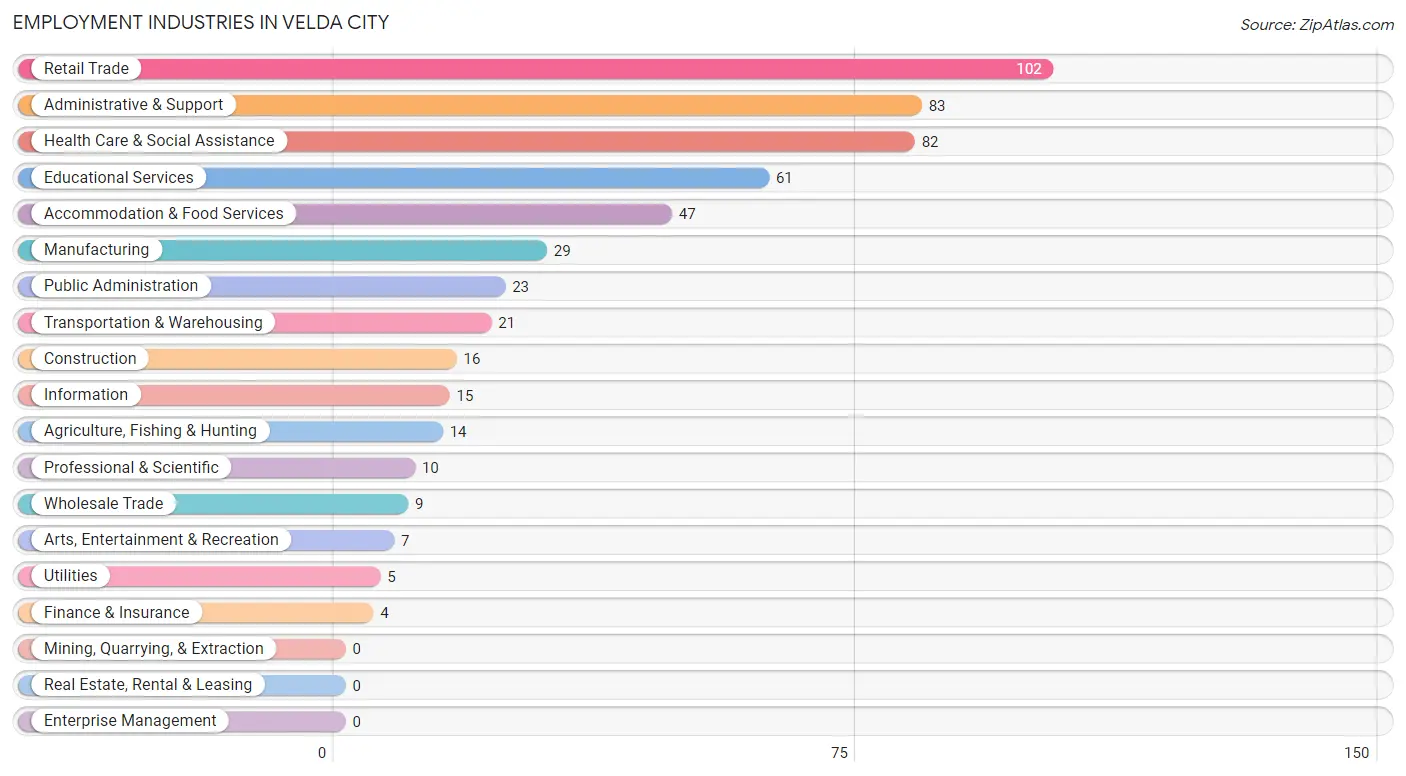
Employment Industries in Velda City
The major employment industries in Velda City include Retail Trade (102 | 19.0%), Administrative & Support (83 | 15.5%), Health Care & Social Assistance (82 | 15.3%), Educational Services (61 | 11.4%), and Accommodation & Food Services (47 | 8.8%).
Employment Industries by Sex in Velda City
The Velda City industries that see more men than women are Agriculture, Fishing & Hunting (100.0%), Construction (100.0%), and Wholesale Trade (100.0%), whereas the industries that tend to have a higher number of women are Information (100.0%), Arts, Entertainment & Recreation (100.0%), and Public Administration (100.0%).
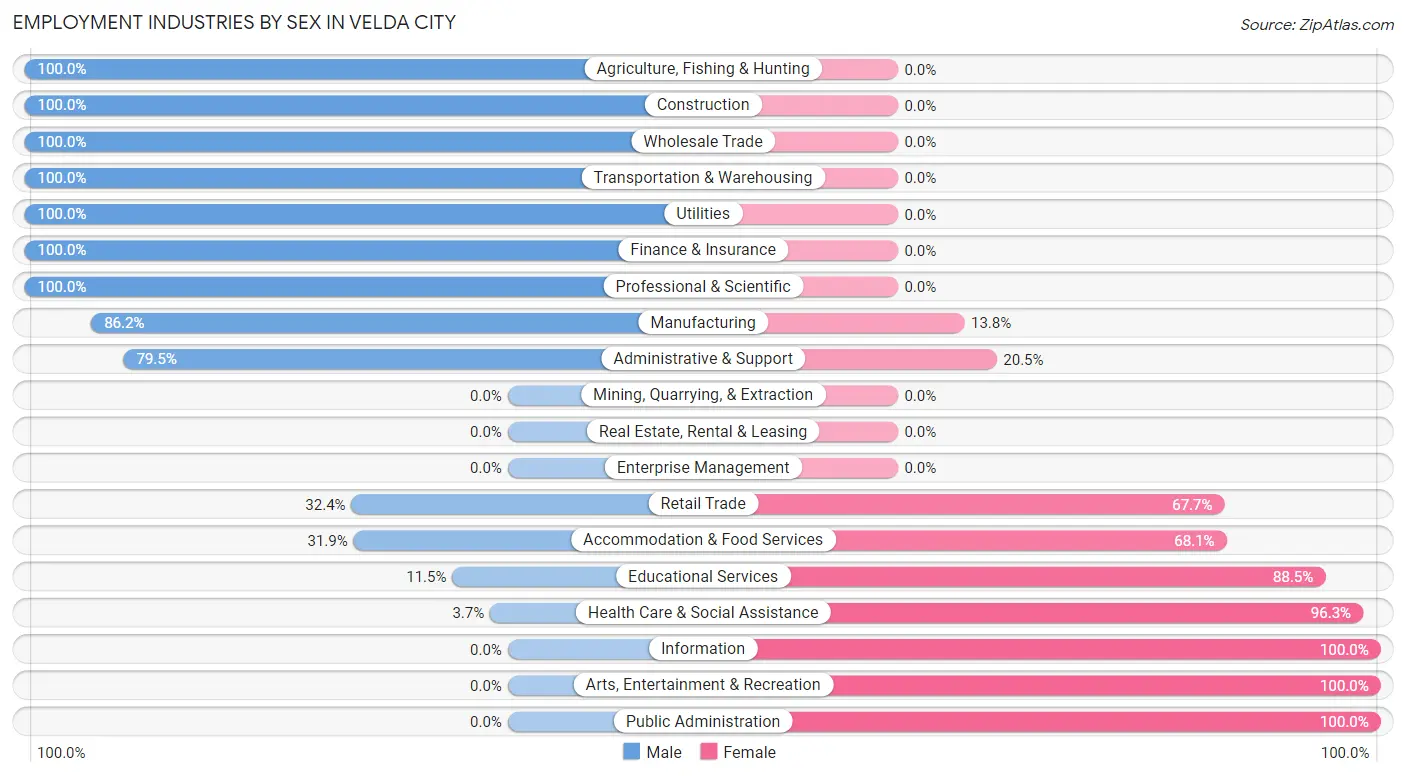
| Industry | Male | Female |
| Agriculture, Fishing & Hunting | 14 (100.0%) | 0 (0.0%) |
| Mining, Quarrying, & Extraction | 0 (0.0%) | 0 (0.0%) |
| Construction | 16 (100.0%) | 0 (0.0%) |
| Manufacturing | 25 (86.2%) | 4 (13.8%) |
| Wholesale Trade | 9 (100.0%) | 0 (0.0%) |
| Retail Trade | 33 (32.4%) | 69 (67.6%) |
| Transportation & Warehousing | 21 (100.0%) | 0 (0.0%) |
| Utilities | 5 (100.0%) | 0 (0.0%) |
| Information | 0 (0.0%) | 15 (100.0%) |
| Finance & Insurance | 4 (100.0%) | 0 (0.0%) |
| Real Estate, Rental & Leasing | 0 (0.0%) | 0 (0.0%) |
| Professional & Scientific | 10 (100.0%) | 0 (0.0%) |
| Enterprise Management | 0 (0.0%) | 0 (0.0%) |
| Administrative & Support | 66 (79.5%) | 17 (20.5%) |
| Educational Services | 7 (11.5%) | 54 (88.5%) |
| Health Care & Social Assistance | 3 (3.7%) | 79 (96.3%) |
| Arts, Entertainment & Recreation | 0 (0.0%) | 7 (100.0%) |
| Accommodation & Food Services | 15 (31.9%) | 32 (68.1%) |
| Public Administration | 0 (0.0%) | 23 (100.0%) |
| Total | 232 (43.3%) | 304 (56.7%) |
Education in Velda City
School Enrollment in Velda City
The most common levels of schooling among the 253 students in Velda City are elementary school (61 | 24.1%), middle school (60 | 23.7%), and kindergarten (54 | 21.3%).
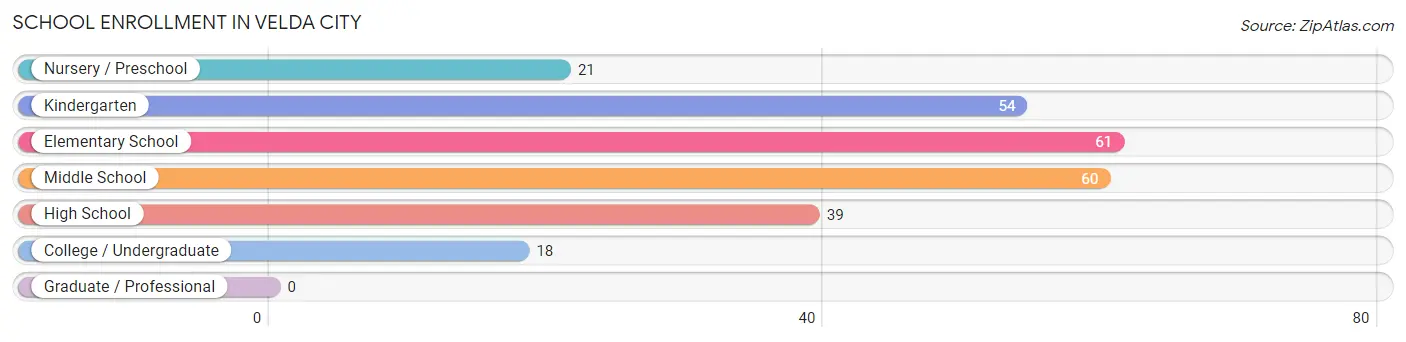
| School Level | # Students | % Students |
| Nursery / Preschool | 21 | 8.3% |
| Kindergarten | 54 | 21.3% |
| Elementary School | 61 | 24.1% |
| Middle School | 60 | 23.7% |
| High School | 39 | 15.4% |
| College / Undergraduate | 18 | 7.1% |
| Graduate / Professional | 0 | 0.0% |
| Total | 253 | 100.0% |
School Enrollment by Age by Funding Source in Velda City
Out of a total of 253 students who are enrolled in schools in Velda City, 23 (9.1%) attend a private institution, while the remaining 230 (90.9%) are enrolled in public schools. The age group of 20 to 24 year olds has the highest likelihood of being enrolled in private schools, with 5 (45.5% in the age bracket) enrolled. Conversely, the age group of 3 to 4 year olds has the lowest likelihood of being enrolled in a private school, with 28 (100.0% in the age bracket) attending a public institution.
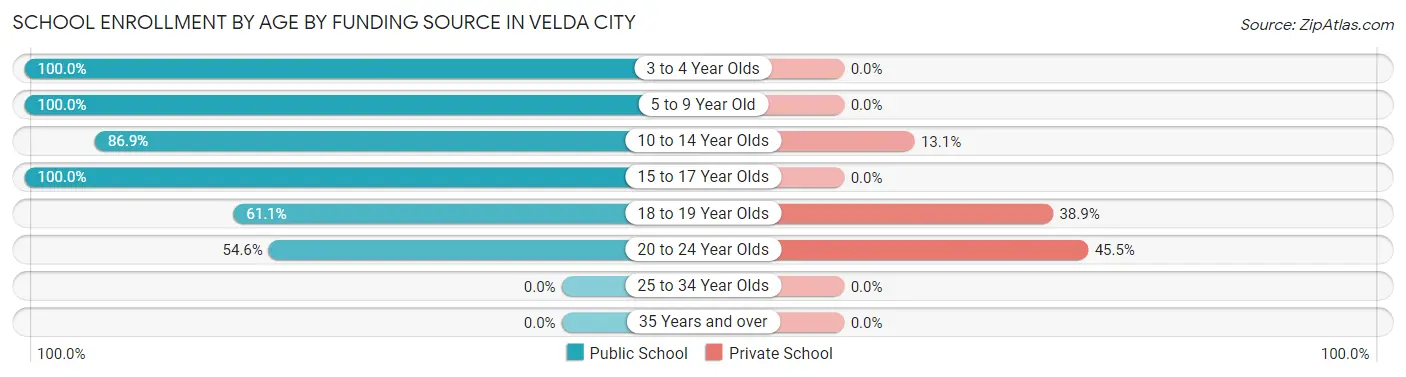
| Age Bracket | Public School | Private School |
| 3 to 4 Year Olds | 28 (100.0%) | 0 (0.0%) |
| 5 to 9 Year Old | 84 (100.0%) | 0 (0.0%) |
| 10 to 14 Year Olds | 73 (86.9%) | 11 (13.1%) |
| 15 to 17 Year Olds | 28 (100.0%) | 0 (0.0%) |
| 18 to 19 Year Olds | 11 (61.1%) | 7 (38.9%) |
| 20 to 24 Year Olds | 6 (54.5%) | 5 (45.5%) |
| 25 to 34 Year Olds | 0 (0.0%) | 0 (0.0%) |
| 35 Years and over | 0 (0.0%) | 0 (0.0%) |
| Total | 230 (90.9%) | 23 (9.1%) |
Educational Attainment by Field of Study in Velda City
Business (59 | 50.4%), education (22 | 18.8%), science & technology (10 | 8.6%), computers & mathematics (9 | 7.7%), and arts & humanities (8 | 6.8%) are the most common fields of study among 117 individuals in Velda City who have obtained a bachelor's degree or higher.
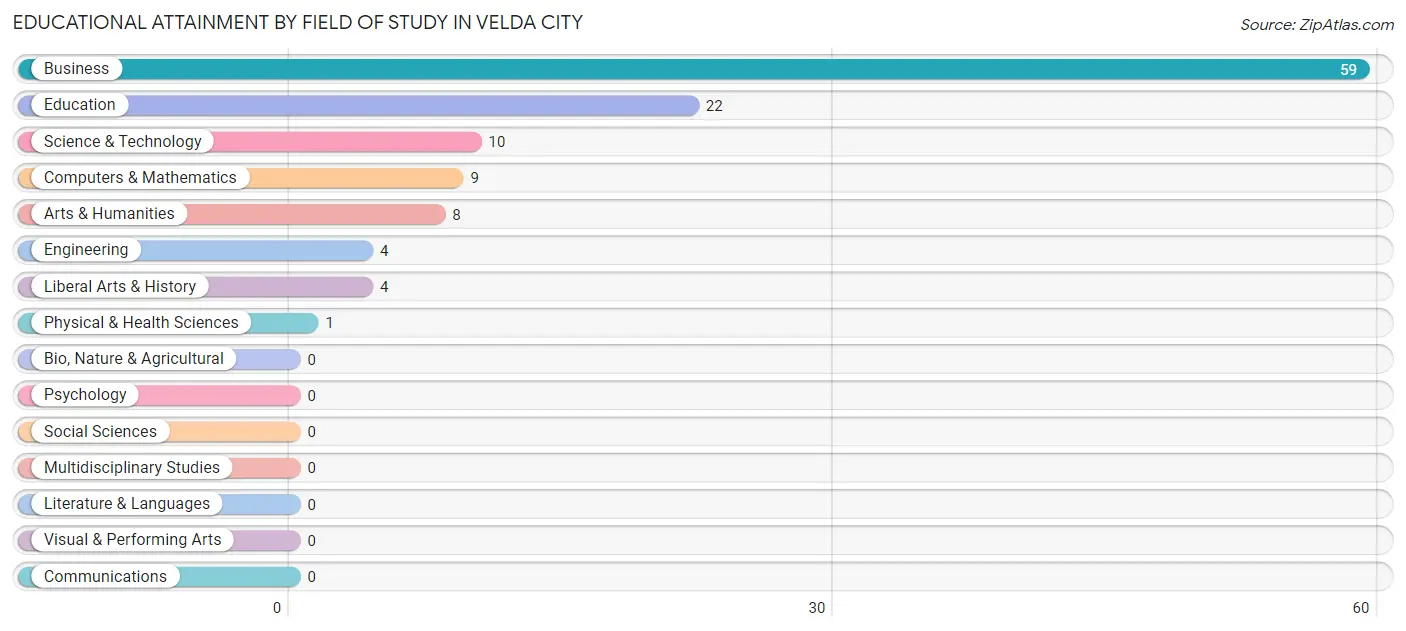
| Field of Study | # Graduates | % Graduates |
| Computers & Mathematics | 9 | 7.7% |
| Bio, Nature & Agricultural | 0 | 0.0% |
| Physical & Health Sciences | 1 | 0.9% |
| Psychology | 0 | 0.0% |
| Social Sciences | 0 | 0.0% |
| Engineering | 4 | 3.4% |
| Multidisciplinary Studies | 0 | 0.0% |
| Science & Technology | 10 | 8.6% |
| Business | 59 | 50.4% |
| Education | 22 | 18.8% |
| Literature & Languages | 0 | 0.0% |
| Liberal Arts & History | 4 | 3.4% |
| Visual & Performing Arts | 0 | 0.0% |
| Communications | 0 | 0.0% |
| Arts & Humanities | 8 | 6.8% |
| Total | 117 | 100.0% |
Transportation & Commute in Velda City
Vehicle Availability by Sex in Velda City
The most prevalent vehicle ownership categories in Velda City are males with 2 vehicles (136, accounting for 62.1%) and females with 2 vehicles (114, making up 45.3%).
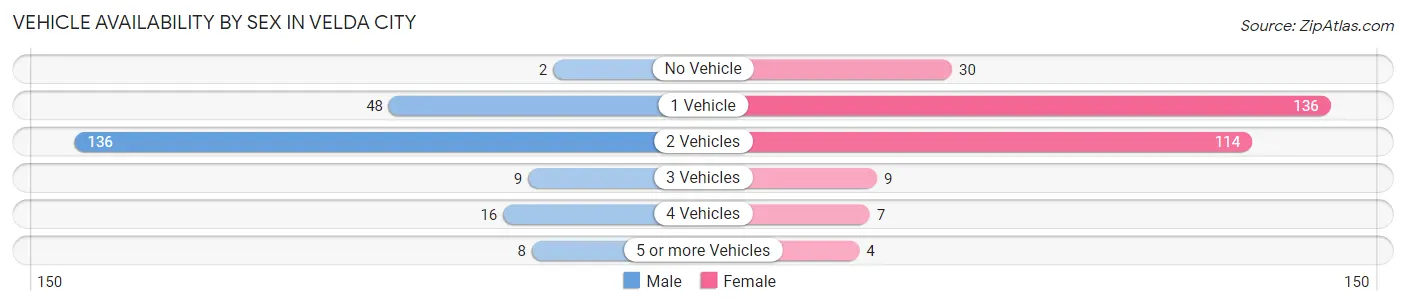
| Vehicles Available | Male | Female |
| No Vehicle | 2 (0.9%) | 30 (10.0%) |
| 1 Vehicle | 48 (21.9%) | 136 (45.3%) |
| 2 Vehicles | 136 (62.1%) | 114 (38.0%) |
| 3 Vehicles | 9 (4.1%) | 9 (3.0%) |
| 4 Vehicles | 16 (7.3%) | 7 (2.3%) |
| 5 or more Vehicles | 8 (3.6%) | 4 (1.3%) |
| Total | 219 (100.0%) | 300 (100.0%) |
Commute Time in Velda City
The most frequently occuring commute durations in Velda City are 20 to 24 minutes (152 commuters, 30.9%), 15 to 19 minutes (123 commuters, 25.0%), and 30 to 34 minutes (89 commuters, 18.1%).
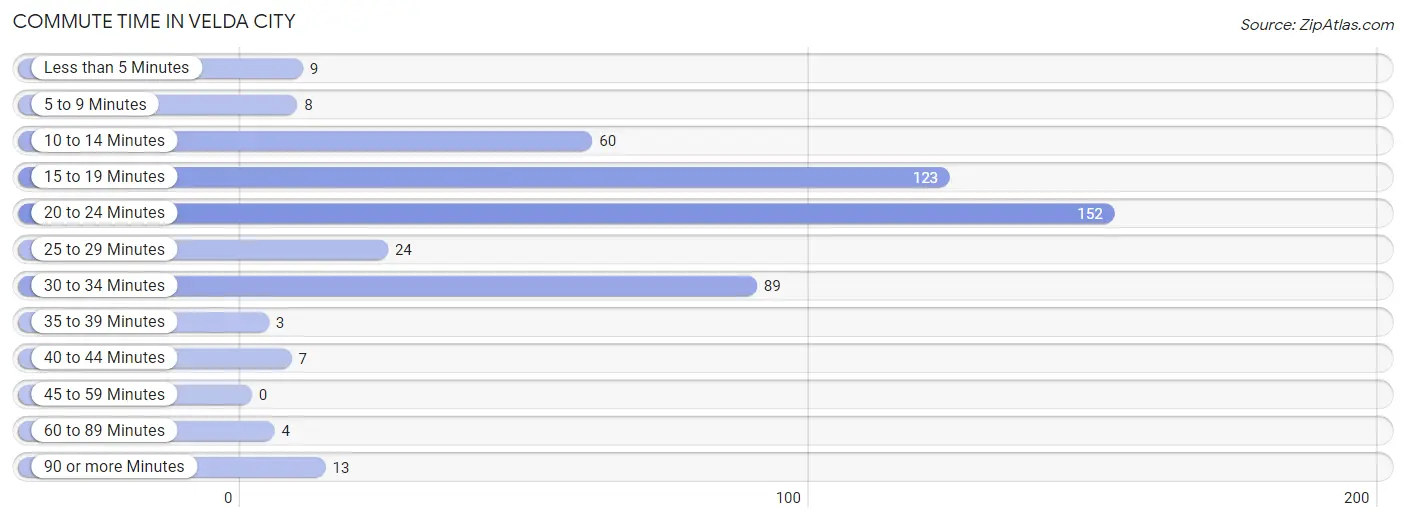
| Commute Time | # Commuters | % Commuters |
| Less than 5 Minutes | 9 | 1.8% |
| 5 to 9 Minutes | 8 | 1.6% |
| 10 to 14 Minutes | 60 | 12.2% |
| 15 to 19 Minutes | 123 | 25.0% |
| 20 to 24 Minutes | 152 | 30.9% |
| 25 to 29 Minutes | 24 | 4.9% |
| 30 to 34 Minutes | 89 | 18.1% |
| 35 to 39 Minutes | 3 | 0.6% |
| 40 to 44 Minutes | 7 | 1.4% |
| 45 to 59 Minutes | 0 | 0.0% |
| 60 to 89 Minutes | 4 | 0.8% |
| 90 or more Minutes | 13 | 2.6% |
Commute Time by Sex in Velda City
The most common commute times in Velda City are 20 to 24 minutes (101 commuters, 50.0%) for males and 15 to 19 minutes (104 commuters, 35.9%) for females.
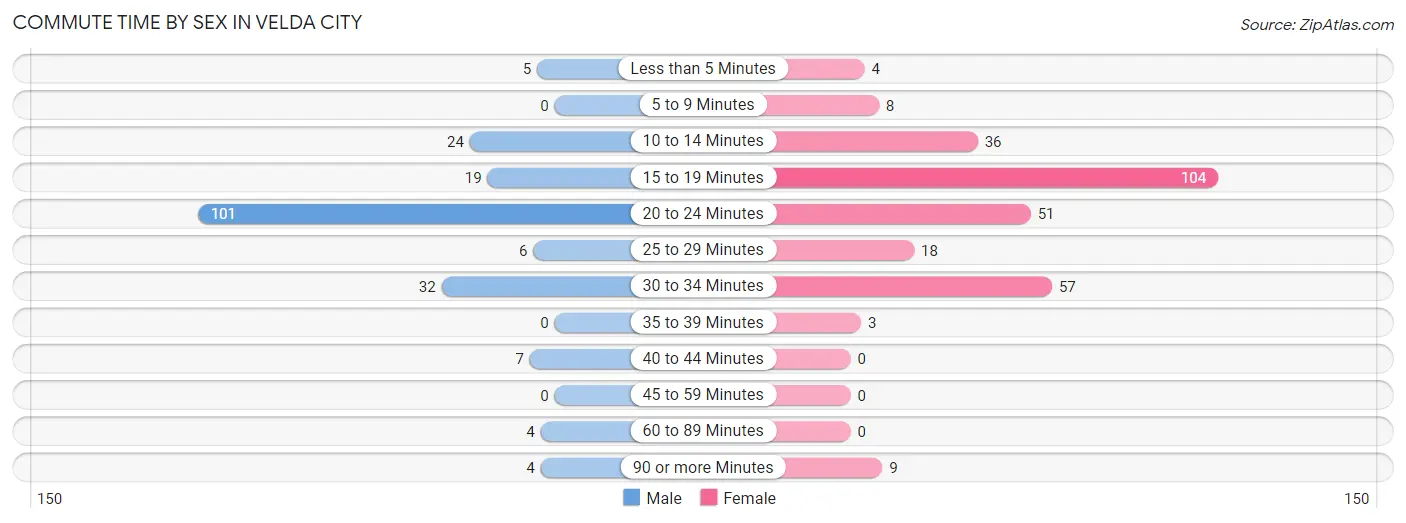
| Commute Time | Male | Female |
| Less than 5 Minutes | 5 (2.5%) | 4 (1.4%) |
| 5 to 9 Minutes | 0 (0.0%) | 8 (2.8%) |
| 10 to 14 Minutes | 24 (11.9%) | 36 (12.4%) |
| 15 to 19 Minutes | 19 (9.4%) | 104 (35.9%) |
| 20 to 24 Minutes | 101 (50.0%) | 51 (17.6%) |
| 25 to 29 Minutes | 6 (3.0%) | 18 (6.2%) |
| 30 to 34 Minutes | 32 (15.8%) | 57 (19.7%) |
| 35 to 39 Minutes | 0 (0.0%) | 3 (1.0%) |
| 40 to 44 Minutes | 7 (3.5%) | 0 (0.0%) |
| 45 to 59 Minutes | 0 (0.0%) | 0 (0.0%) |
| 60 to 89 Minutes | 4 (2.0%) | 0 (0.0%) |
| 90 or more Minutes | 4 (2.0%) | 9 (3.1%) |
Time of Departure to Work by Sex in Velda City
The most frequent times of departure to work in Velda City are 12:00 PM to 3:59 PM (92, 45.5%) for males and 7:00 AM to 7:29 AM (68, 23.4%) for females.
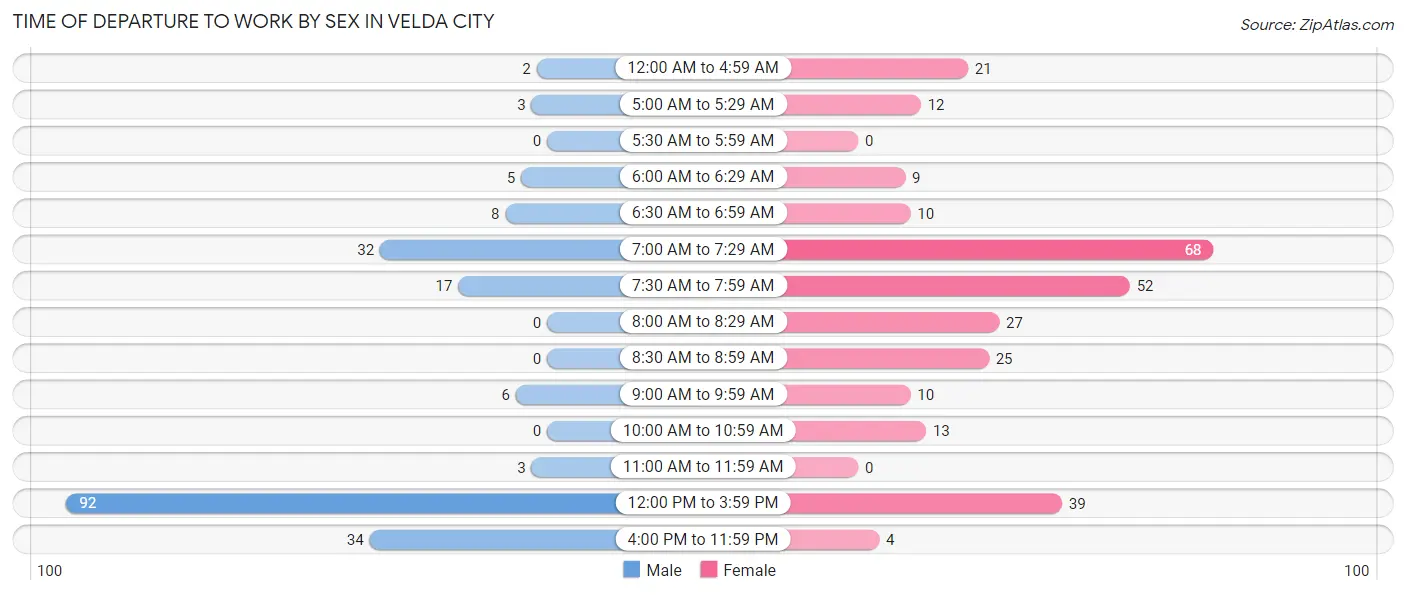
| Time of Departure | Male | Female |
| 12:00 AM to 4:59 AM | 2 (1.0%) | 21 (7.2%) |
| 5:00 AM to 5:29 AM | 3 (1.5%) | 12 (4.1%) |
| 5:30 AM to 5:59 AM | 0 (0.0%) | 0 (0.0%) |
| 6:00 AM to 6:29 AM | 5 (2.5%) | 9 (3.1%) |
| 6:30 AM to 6:59 AM | 8 (4.0%) | 10 (3.5%) |
| 7:00 AM to 7:29 AM | 32 (15.8%) | 68 (23.4%) |
| 7:30 AM to 7:59 AM | 17 (8.4%) | 52 (17.9%) |
| 8:00 AM to 8:29 AM | 0 (0.0%) | 27 (9.3%) |
| 8:30 AM to 8:59 AM | 0 (0.0%) | 25 (8.6%) |
| 9:00 AM to 9:59 AM | 6 (3.0%) | 10 (3.5%) |
| 10:00 AM to 10:59 AM | 0 (0.0%) | 13 (4.5%) |
| 11:00 AM to 11:59 AM | 3 (1.5%) | 0 (0.0%) |
| 12:00 PM to 3:59 PM | 92 (45.5%) | 39 (13.5%) |
| 4:00 PM to 11:59 PM | 34 (16.8%) | 4 (1.4%) |
| Total | 202 (100.0%) | 290 (100.0%) |
Housing Occupancy in Velda City
Occupancy by Ownership in Velda City
Of the total 517 dwellings in Velda City, owner-occupied units account for 326 (63.1%), while renter-occupied units make up 191 (36.9%).
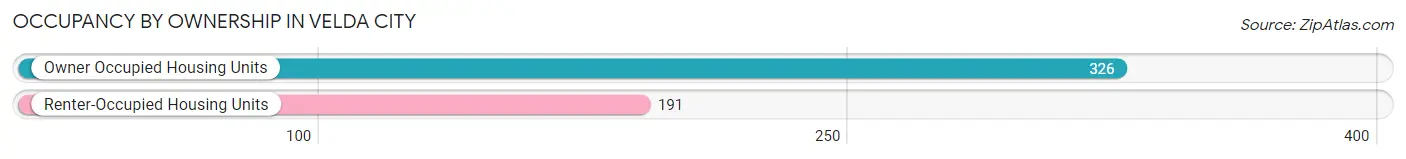
| Occupancy | # Housing Units | % Housing Units |
| Owner Occupied Housing Units | 326 | 63.1% |
| Renter-Occupied Housing Units | 191 | 36.9% |
| Total Occupied Housing Units | 517 | 100.0% |
Occupancy by Household Size in Velda City
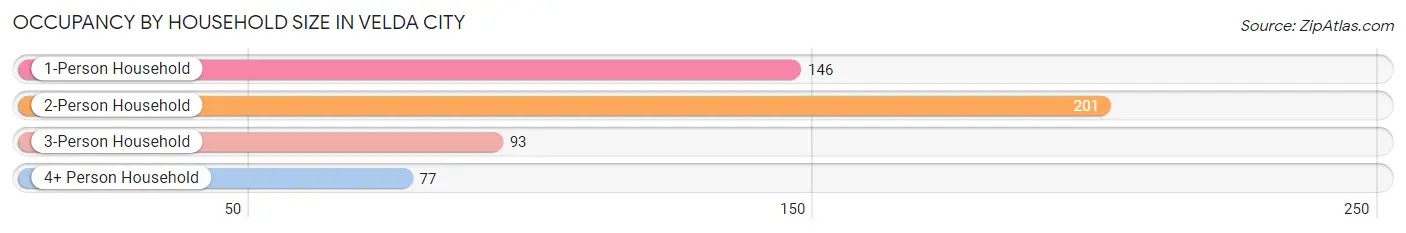
| Household Size | # Housing Units | % Housing Units |
| 1-Person Household | 146 | 28.2% |
| 2-Person Household | 201 | 38.9% |
| 3-Person Household | 93 | 18.0% |
| 4+ Person Household | 77 | 14.9% |
| Total Housing Units | 517 | 100.0% |
Occupancy by Ownership by Household Size in Velda City
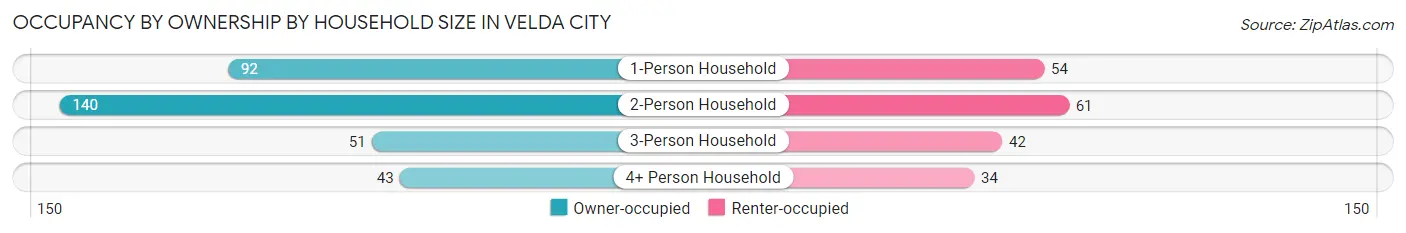
| Household Size | Owner-occupied | Renter-occupied |
| 1-Person Household | 92 (63.0%) | 54 (37.0%) |
| 2-Person Household | 140 (69.7%) | 61 (30.3%) |
| 3-Person Household | 51 (54.8%) | 42 (45.2%) |
| 4+ Person Household | 43 (55.8%) | 34 (44.2%) |
| Total Housing Units | 326 (63.1%) | 191 (36.9%) |
Occupancy by Educational Attainment in Velda City
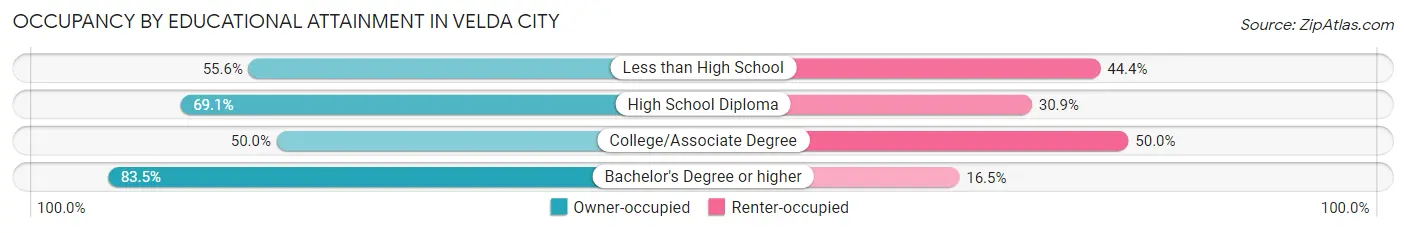
| Household Size | Owner-occupied | Renter-occupied |
| Less than High School | 35 (55.6%) | 28 (44.4%) |
| High School Diploma | 121 (69.1%) | 54 (30.9%) |
| College/Associate Degree | 94 (50.0%) | 94 (50.0%) |
| Bachelor's Degree or higher | 76 (83.5%) | 15 (16.5%) |
Occupancy by Age of Householder in Velda City
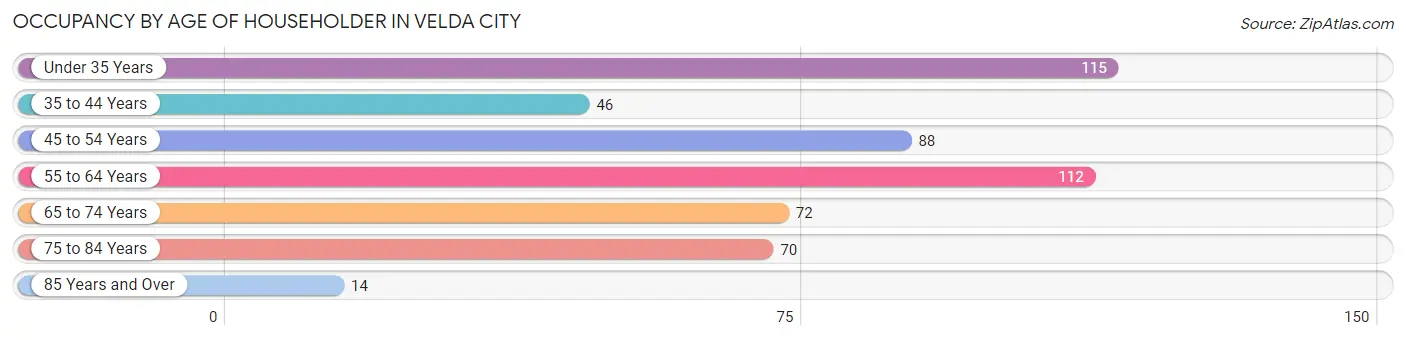
| Age Bracket | # Households | % Households |
| Under 35 Years | 115 | 22.2% |
| 35 to 44 Years | 46 | 8.9% |
| 45 to 54 Years | 88 | 17.0% |
| 55 to 64 Years | 112 | 21.7% |
| 65 to 74 Years | 72 | 13.9% |
| 75 to 84 Years | 70 | 13.5% |
| 85 Years and Over | 14 | 2.7% |
| Total | 517 | 100.0% |
Housing Finances in Velda City
Median Income by Occupancy in Velda City
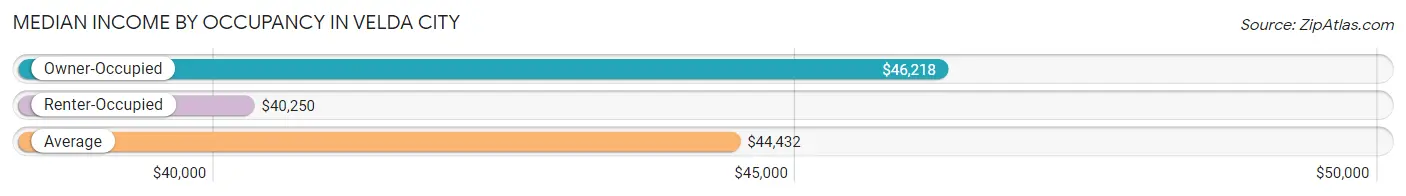
| Occupancy Type | # Households | Median Income |
| Owner-Occupied | 326 (63.1%) | $46,218 |
| Renter-Occupied | 191 (36.9%) | $40,250 |
| Average | 517 (100.0%) | $44,432 |
Occupancy by Householder Income Bracket in Velda City
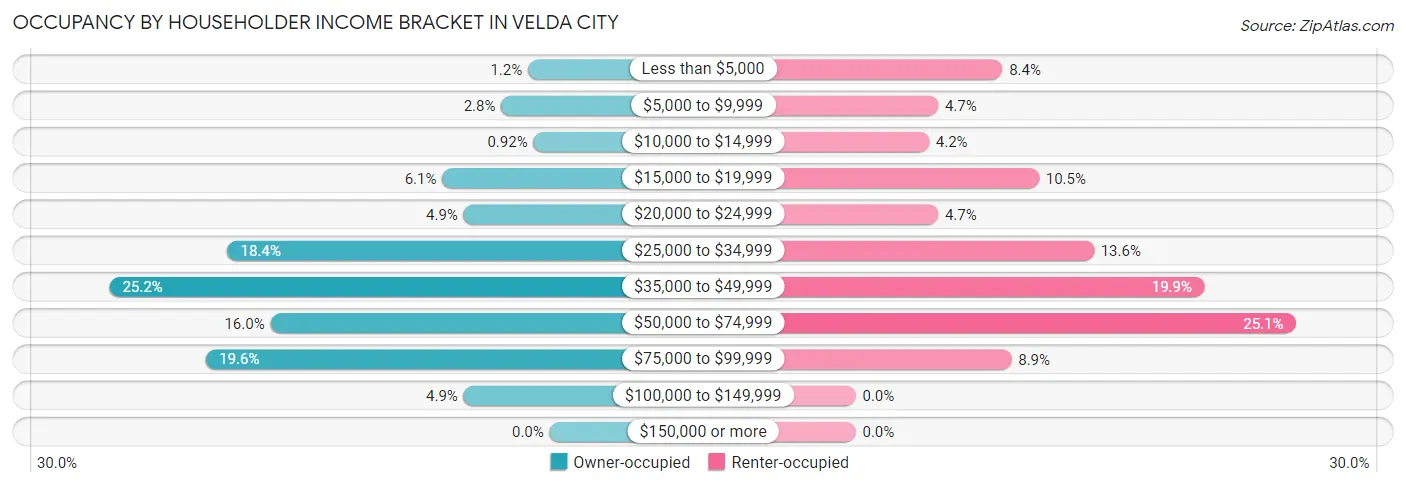
| Income Bracket | Owner-occupied | Renter-occupied |
| Less than $5,000 | 4 (1.2%) | 16 (8.4%) |
| $5,000 to $9,999 | 9 (2.8%) | 9 (4.7%) |
| $10,000 to $14,999 | 3 (0.9%) | 8 (4.2%) |
| $15,000 to $19,999 | 20 (6.1%) | 20 (10.5%) |
| $20,000 to $24,999 | 16 (4.9%) | 9 (4.7%) |
| $25,000 to $34,999 | 60 (18.4%) | 26 (13.6%) |
| $35,000 to $49,999 | 82 (25.2%) | 38 (19.9%) |
| $50,000 to $74,999 | 52 (16.0%) | 48 (25.1%) |
| $75,000 to $99,999 | 64 (19.6%) | 17 (8.9%) |
| $100,000 to $149,999 | 16 (4.9%) | 0 (0.0%) |
| $150,000 or more | 0 (0.0%) | 0 (0.0%) |
| Total | 326 (100.0%) | 191 (100.0%) |
Monthly Housing Cost Tiers in Velda City
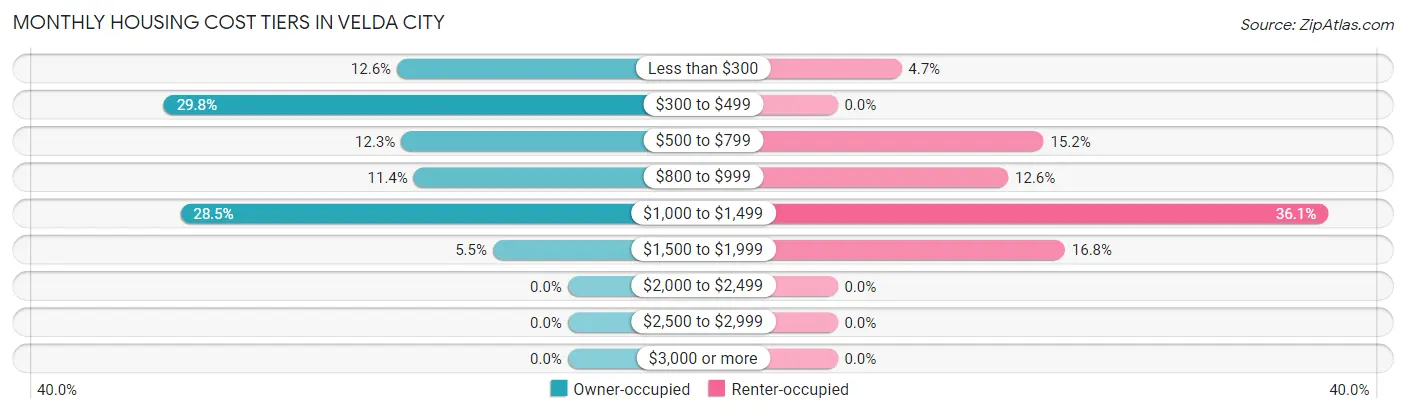
| Monthly Cost | Owner-occupied | Renter-occupied |
| Less than $300 | 41 (12.6%) | 9 (4.7%) |
| $300 to $499 | 97 (29.7%) | 0 (0.0%) |
| $500 to $799 | 40 (12.3%) | 29 (15.2%) |
| $800 to $999 | 37 (11.4%) | 24 (12.6%) |
| $1,000 to $1,499 | 93 (28.5%) | 69 (36.1%) |
| $1,500 to $1,999 | 18 (5.5%) | 32 (16.8%) |
| $2,000 to $2,499 | 0 (0.0%) | 0 (0.0%) |
| $2,500 to $2,999 | 0 (0.0%) | 0 (0.0%) |
| $3,000 or more | 0 (0.0%) | 0 (0.0%) |
| Total | 326 (100.0%) | 191 (100.0%) |
Physical Housing Characteristics in Velda City
Housing Structures in Velda City
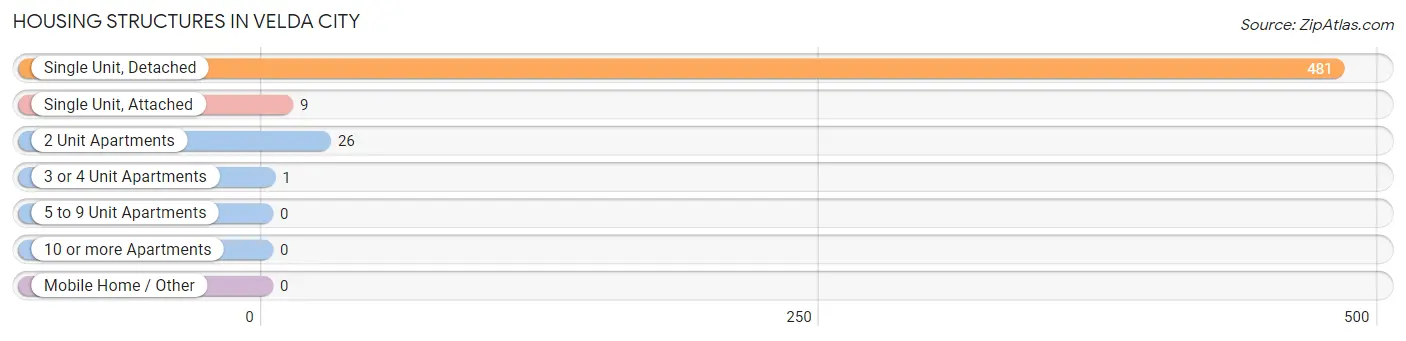
| Structure Type | # Housing Units | % Housing Units |
| Single Unit, Detached | 481 | 93.0% |
| Single Unit, Attached | 9 | 1.7% |
| 2 Unit Apartments | 26 | 5.0% |
| 3 or 4 Unit Apartments | 1 | 0.2% |
| 5 to 9 Unit Apartments | 0 | 0.0% |
| 10 or more Apartments | 0 | 0.0% |
| Mobile Home / Other | 0 | 0.0% |
| Total | 517 | 100.0% |
Housing Structures by Occupancy in Velda City
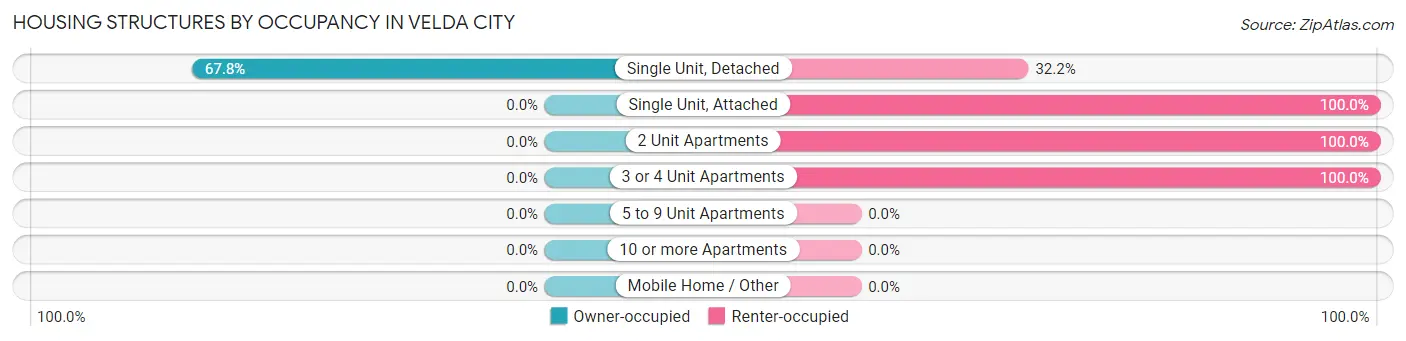
| Structure Type | Owner-occupied | Renter-occupied |
| Single Unit, Detached | 326 (67.8%) | 155 (32.2%) |
| Single Unit, Attached | 0 (0.0%) | 9 (100.0%) |
| 2 Unit Apartments | 0 (0.0%) | 26 (100.0%) |
| 3 or 4 Unit Apartments | 0 (0.0%) | 1 (100.0%) |
| 5 to 9 Unit Apartments | 0 (0.0%) | 0 (0.0%) |
| 10 or more Apartments | 0 (0.0%) | 0 (0.0%) |
| Mobile Home / Other | 0 (0.0%) | 0 (0.0%) |
| Total | 326 (63.1%) | 191 (36.9%) |
Housing Structures by Number of Rooms in Velda City
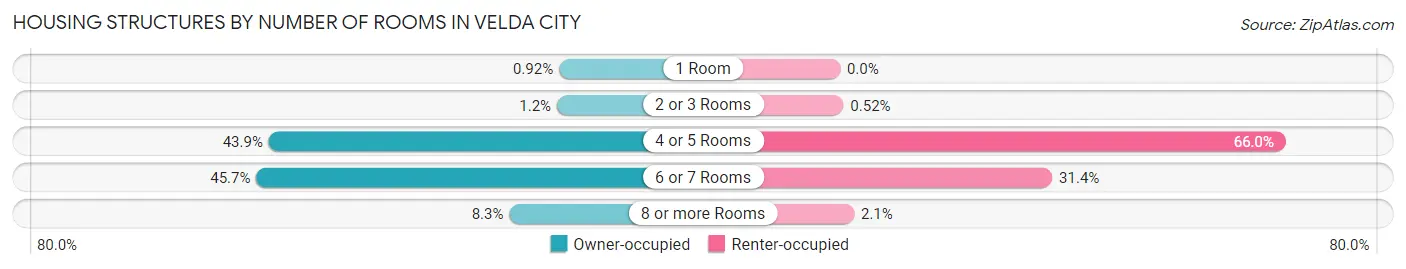
| Number of Rooms | Owner-occupied | Renter-occupied |
| 1 Room | 3 (0.9%) | 0 (0.0%) |
| 2 or 3 Rooms | 4 (1.2%) | 1 (0.5%) |
| 4 or 5 Rooms | 143 (43.9%) | 126 (66.0%) |
| 6 or 7 Rooms | 149 (45.7%) | 60 (31.4%) |
| 8 or more Rooms | 27 (8.3%) | 4 (2.1%) |
| Total | 326 (100.0%) | 191 (100.0%) |
Housing Structure by Heating Type in Velda City
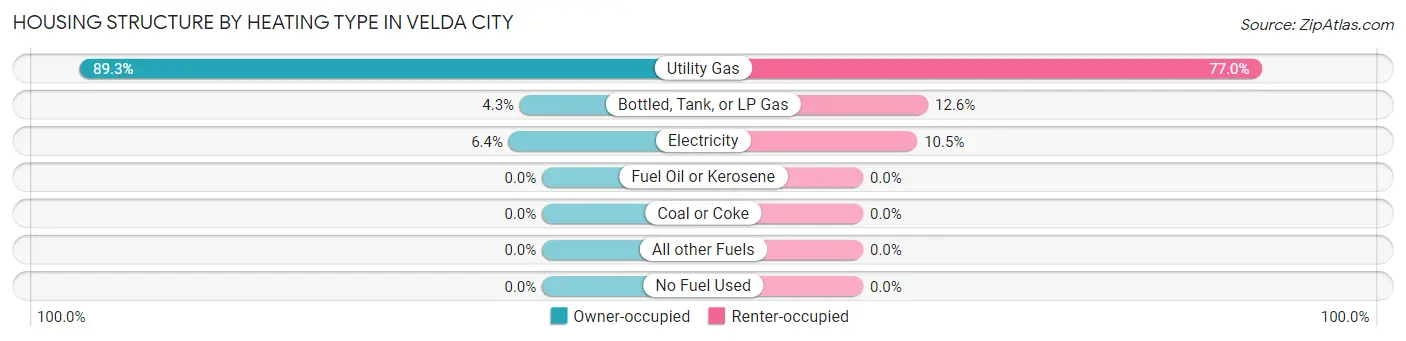
| Heating Type | Owner-occupied | Renter-occupied |
| Utility Gas | 291 (89.3%) | 147 (77.0%) |
| Bottled, Tank, or LP Gas | 14 (4.3%) | 24 (12.6%) |
| Electricity | 21 (6.4%) | 20 (10.5%) |
| Fuel Oil or Kerosene | 0 (0.0%) | 0 (0.0%) |
| Coal or Coke | 0 (0.0%) | 0 (0.0%) |
| All other Fuels | 0 (0.0%) | 0 (0.0%) |
| No Fuel Used | 0 (0.0%) | 0 (0.0%) |
| Total | 326 (100.0%) | 191 (100.0%) |
Household Vehicle Usage in Velda City
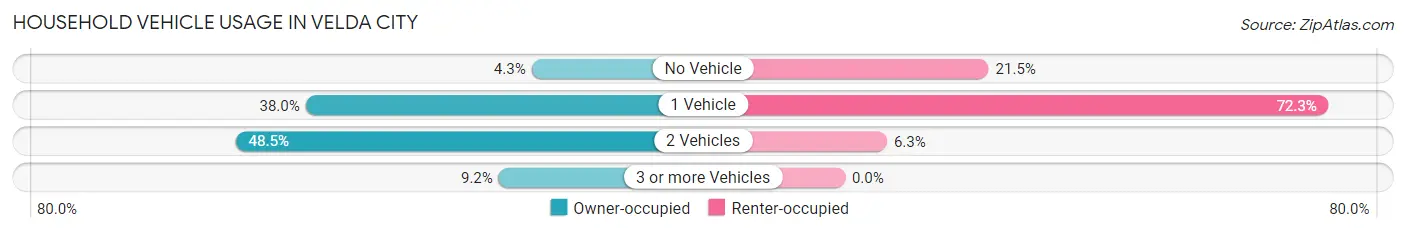
| Vehicles per Household | Owner-occupied | Renter-occupied |
| No Vehicle | 14 (4.3%) | 41 (21.5%) |
| 1 Vehicle | 124 (38.0%) | 138 (72.3%) |
| 2 Vehicles | 158 (48.5%) | 12 (6.3%) |
| 3 or more Vehicles | 30 (9.2%) | 0 (0.0%) |
| Total | 326 (100.0%) | 191 (100.0%) |
Real Estate & Mortgages in Velda City
Real Estate and Mortgage Overview in Velda City
| Characteristic | Without Mortgage | With Mortgage |
| Housing Units | 179 | 147 |
| Median Property Value | $47,900 | $58,100 |
| Median Household Income | $48,281 | $0 |
| Monthly Housing Costs | $391 | $0 |
| Real Estate Taxes | $1,206 | $4 |
Property Value by Mortgage Status in Velda City
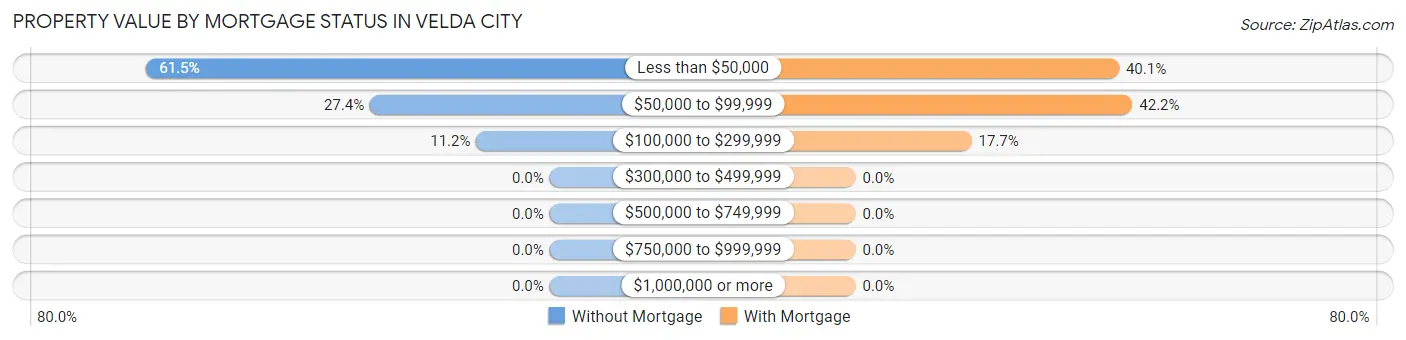
| Property Value | Without Mortgage | With Mortgage |
| Less than $50,000 | 110 (61.5%) | 59 (40.1%) |
| $50,000 to $99,999 | 49 (27.4%) | 62 (42.2%) |
| $100,000 to $299,999 | 20 (11.2%) | 26 (17.7%) |
| $300,000 to $499,999 | 0 (0.0%) | 0 (0.0%) |
| $500,000 to $749,999 | 0 (0.0%) | 0 (0.0%) |
| $750,000 to $999,999 | 0 (0.0%) | 0 (0.0%) |
| $1,000,000 or more | 0 (0.0%) | 0 (0.0%) |
| Total | 179 (100.0%) | 147 (100.0%) |
Household Income by Mortgage Status in Velda City
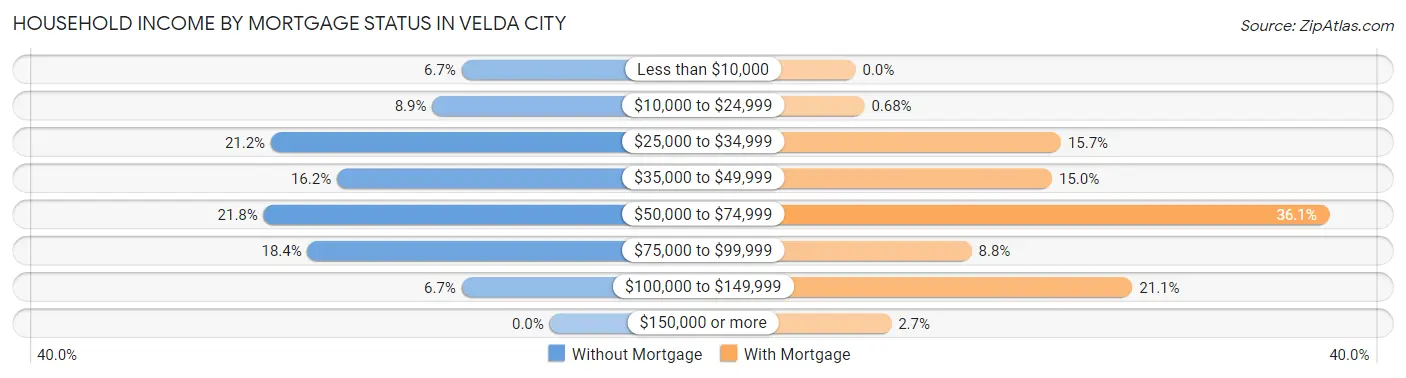
| Household Income | Without Mortgage | With Mortgage |
| Less than $10,000 | 12 (6.7%) | 0 (0.0%) |
| $10,000 to $24,999 | 16 (8.9%) | 1 (0.7%) |
| $25,000 to $34,999 | 38 (21.2%) | 23 (15.7%) |
| $35,000 to $49,999 | 29 (16.2%) | 22 (15.0%) |
| $50,000 to $74,999 | 39 (21.8%) | 53 (36.0%) |
| $75,000 to $99,999 | 33 (18.4%) | 13 (8.8%) |
| $100,000 to $149,999 | 12 (6.7%) | 31 (21.1%) |
| $150,000 or more | 0 (0.0%) | 4 (2.7%) |
| Total | 179 (100.0%) | 147 (100.0%) |
Property Value to Household Income Ratio in Velda City
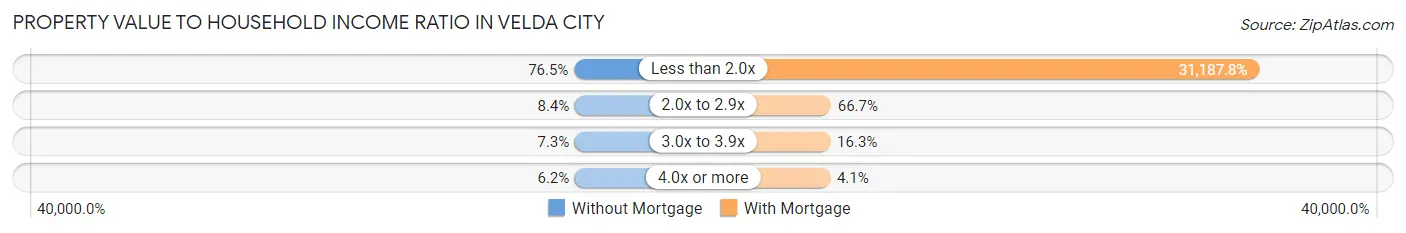
| Value-to-Income Ratio | Without Mortgage | With Mortgage |
| Less than 2.0x | 137 (76.5%) | 45,846 (31,187.8%) |
| 2.0x to 2.9x | 15 (8.4%) | 98 (66.7%) |
| 3.0x to 3.9x | 13 (7.3%) | 24 (16.3%) |
| 4.0x or more | 11 (6.1%) | 6 (4.1%) |
| Total | 179 (100.0%) | 147 (100.0%) |
Real Estate Taxes by Mortgage Status in Velda City
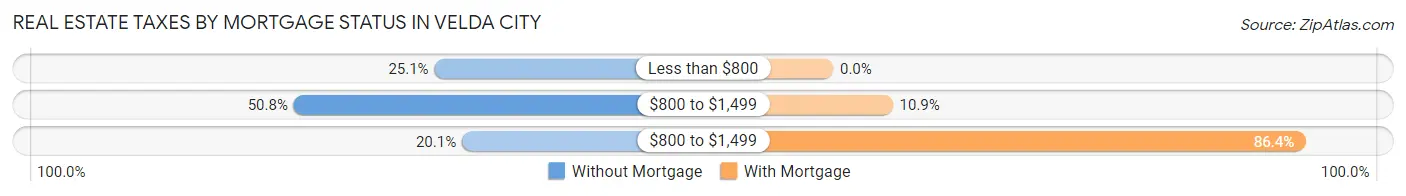
| Property Taxes | Without Mortgage | With Mortgage |
| Less than $800 | 45 (25.1%) | 0 (0.0%) |
| $800 to $1,499 | 91 (50.8%) | 16 (10.9%) |
| $800 to $1,499 | 36 (20.1%) | 127 (86.4%) |
| Total | 179 (100.0%) | 147 (100.0%) |
Health & Disability in Velda City
Health Insurance Coverage by Age in Velda City
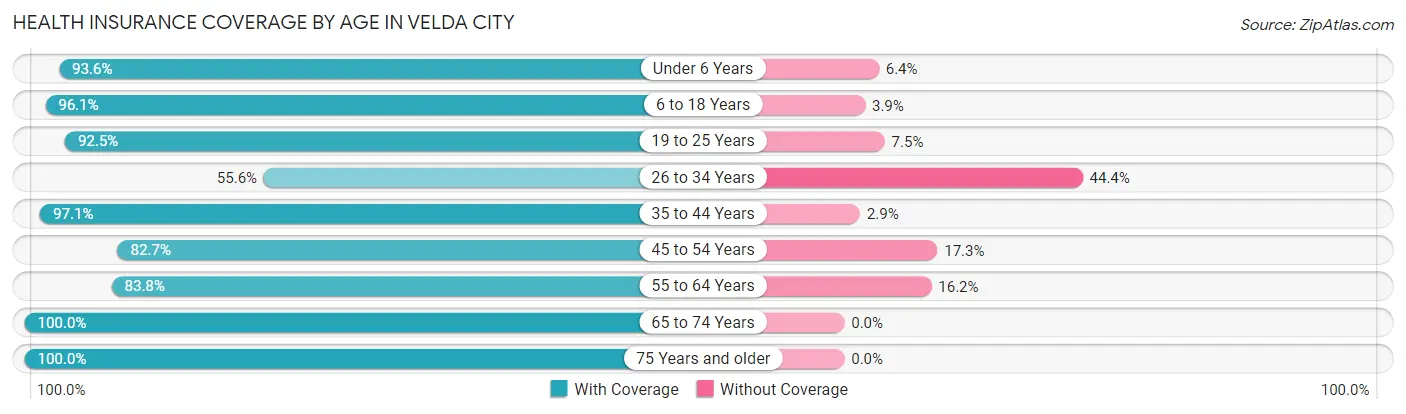
| Age Bracket | With Coverage | Without Coverage |
| Under 6 Years | 131 (93.6%) | 9 (6.4%) |
| 6 to 18 Years | 174 (96.1%) | 7 (3.9%) |
| 19 to 25 Years | 135 (92.5%) | 11 (7.5%) |
| 26 to 34 Years | 65 (55.6%) | 52 (44.4%) |
| 35 to 44 Years | 100 (97.1%) | 3 (2.9%) |
| 45 to 54 Years | 143 (82.7%) | 30 (17.3%) |
| 55 to 64 Years | 129 (83.8%) | 25 (16.2%) |
| 65 to 74 Years | 121 (100.0%) | 0 (0.0%) |
| 75 Years and older | 119 (100.0%) | 0 (0.0%) |
| Total | 1,117 (89.1%) | 137 (10.9%) |
Health Insurance Coverage by Citizenship Status in Velda City
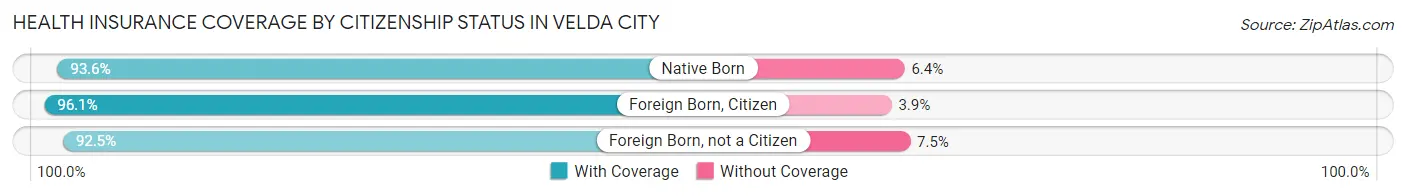
| Citizenship Status | With Coverage | Without Coverage |
| Native Born | 131 (93.6%) | 9 (6.4%) |
| Foreign Born, Citizen | 174 (96.1%) | 7 (3.9%) |
| Foreign Born, not a Citizen | 135 (92.5%) | 11 (7.5%) |
Health Insurance Coverage by Household Income in Velda City
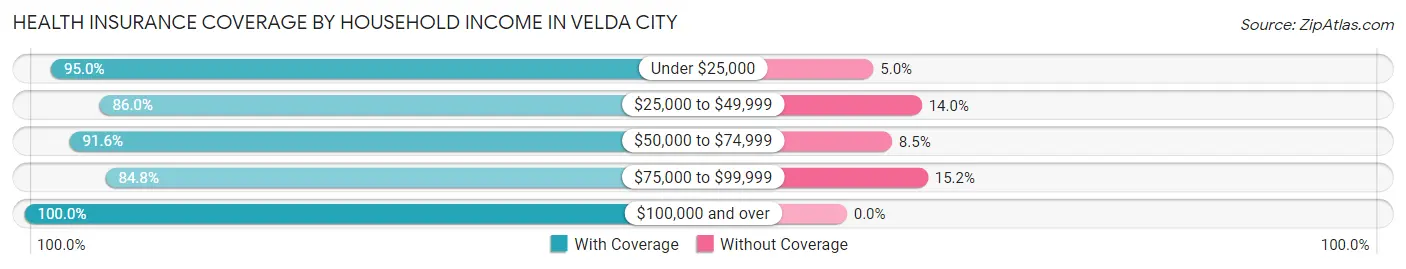
| Household Income | With Coverage | Without Coverage |
| Under $25,000 | 229 (95.0%) | 12 (5.0%) |
| $25,000 to $49,999 | 349 (86.0%) | 57 (14.0%) |
| $50,000 to $74,999 | 260 (91.5%) | 24 (8.5%) |
| $75,000 to $99,999 | 246 (84.8%) | 44 (15.2%) |
| $100,000 and over | 33 (100.0%) | 0 (0.0%) |
Public vs Private Health Insurance Coverage by Age in Velda City
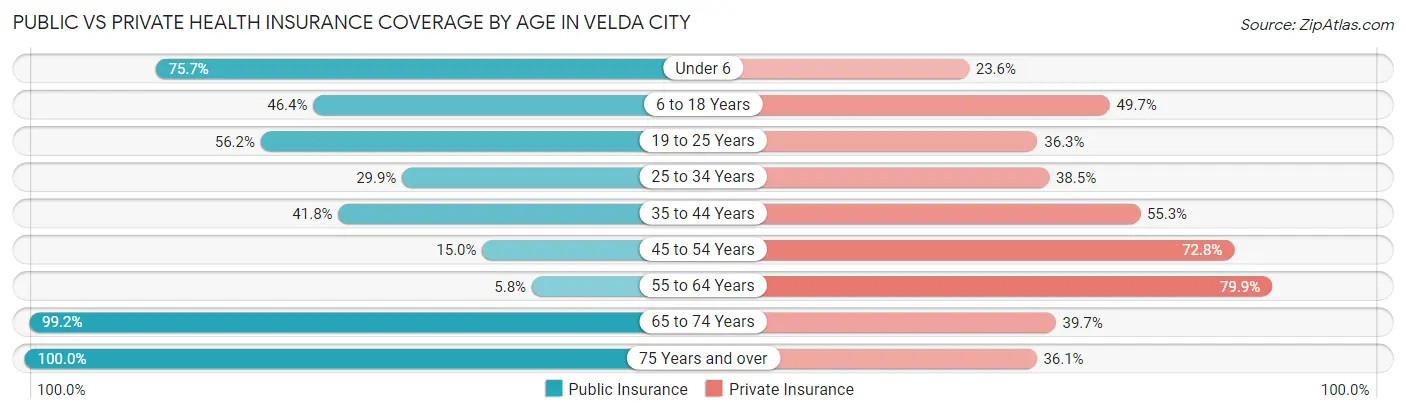
| Age Bracket | Public Insurance | Private Insurance |
| Under 6 | 106 (75.7%) | 33 (23.6%) |
| 6 to 18 Years | 84 (46.4%) | 90 (49.7%) |
| 19 to 25 Years | 82 (56.2%) | 53 (36.3%) |
| 25 to 34 Years | 35 (29.9%) | 45 (38.5%) |
| 35 to 44 Years | 43 (41.7%) | 57 (55.3%) |
| 45 to 54 Years | 26 (15.0%) | 126 (72.8%) |
| 55 to 64 Years | 9 (5.8%) | 123 (79.9%) |
| 65 to 74 Years | 120 (99.2%) | 48 (39.7%) |
| 75 Years and over | 119 (100.0%) | 43 (36.1%) |
| Total | 624 (49.8%) | 618 (49.3%) |
Disability Status by Sex by Age in Velda City
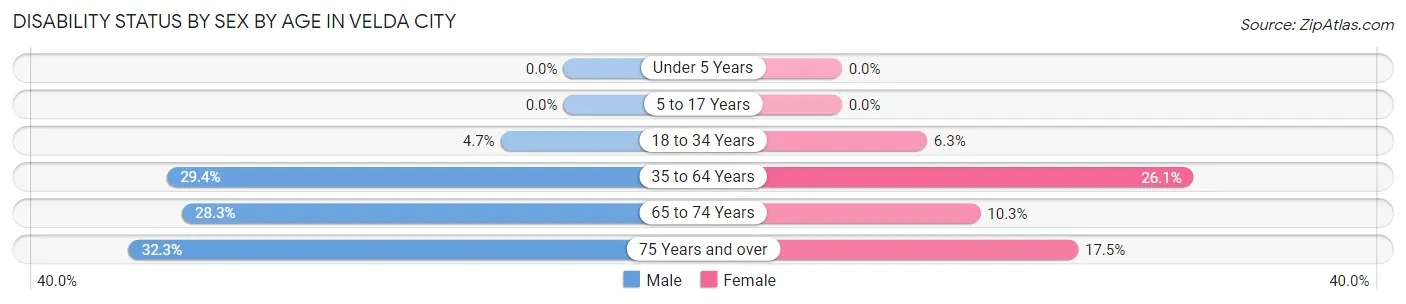
| Age Bracket | Male | Female |
| Under 5 Years | 0 (0.0%) | 0 (0.0%) |
| 5 to 17 Years | 0 (0.0%) | 0 (0.0%) |
| 18 to 34 Years | 5 (4.7%) | 11 (6.3%) |
| 35 to 64 Years | 60 (29.4%) | 59 (26.1%) |
| 65 to 74 Years | 15 (28.3%) | 7 (10.3%) |
| 75 Years and over | 20 (32.3%) | 10 (17.5%) |
Disability Class by Sex by Age in Velda City
Disability Class: Hearing Difficulty
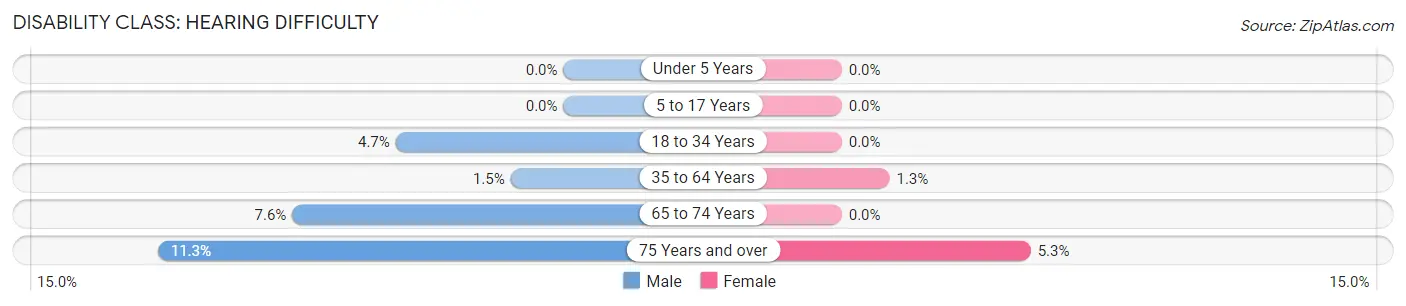
| Age Bracket | Male | Female |
| Under 5 Years | 0 (0.0%) | 0 (0.0%) |
| 5 to 17 Years | 0 (0.0%) | 0 (0.0%) |
| 18 to 34 Years | 5 (4.7%) | 0 (0.0%) |
| 35 to 64 Years | 3 (1.5%) | 3 (1.3%) |
| 65 to 74 Years | 4 (7.5%) | 0 (0.0%) |
| 75 Years and over | 7 (11.3%) | 3 (5.3%) |
Disability Class: Vision Difficulty
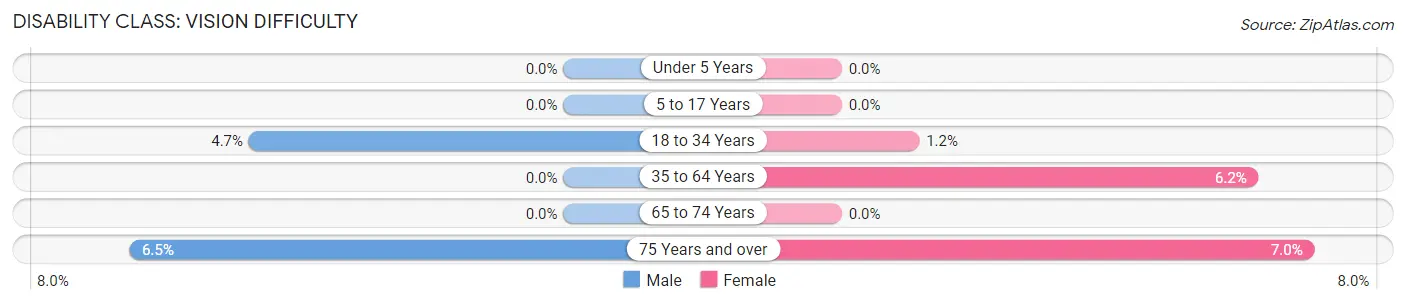
| Age Bracket | Male | Female |
| Under 5 Years | 0 (0.0%) | 0 (0.0%) |
| 5 to 17 Years | 0 (0.0%) | 0 (0.0%) |
| 18 to 34 Years | 5 (4.7%) | 2 (1.1%) |
| 35 to 64 Years | 0 (0.0%) | 14 (6.2%) |
| 65 to 74 Years | 0 (0.0%) | 0 (0.0%) |
| 75 Years and over | 4 (6.5%) | 4 (7.0%) |
Disability Class: Cognitive Difficulty
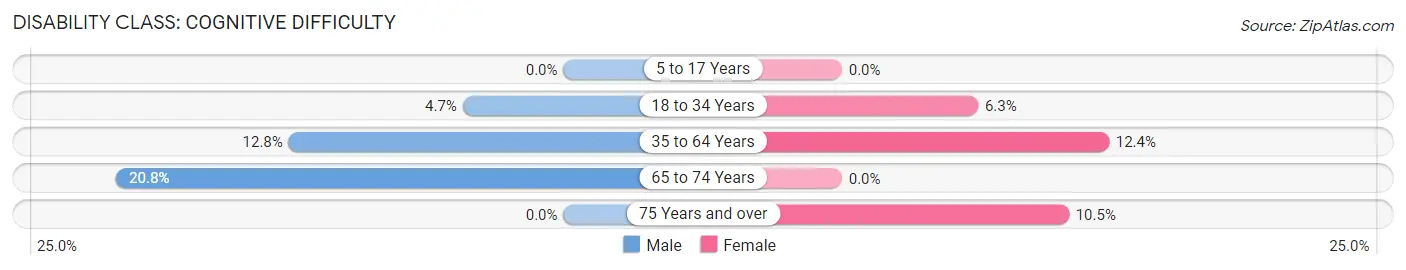
| Age Bracket | Male | Female |
| 5 to 17 Years | 0 (0.0%) | 0 (0.0%) |
| 18 to 34 Years | 5 (4.7%) | 11 (6.3%) |
| 35 to 64 Years | 26 (12.8%) | 28 (12.4%) |
| 65 to 74 Years | 11 (20.7%) | 0 (0.0%) |
| 75 Years and over | 0 (0.0%) | 6 (10.5%) |
Disability Class: Ambulatory Difficulty
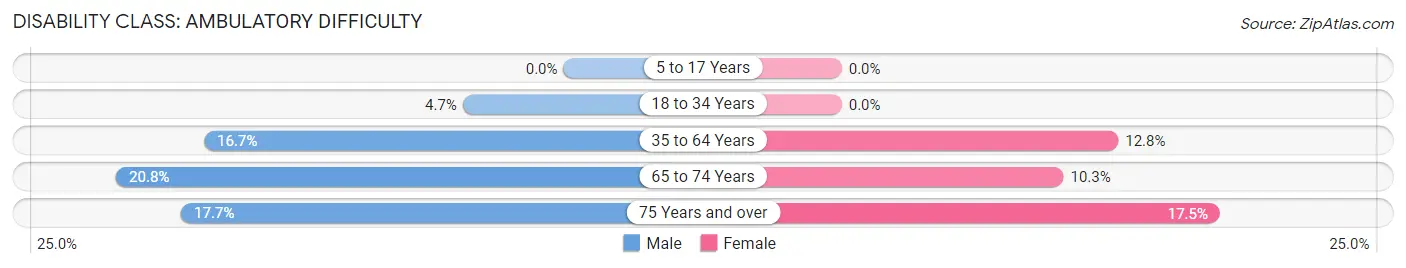
| Age Bracket | Male | Female |
| 5 to 17 Years | 0 (0.0%) | 0 (0.0%) |
| 18 to 34 Years | 5 (4.7%) | 0 (0.0%) |
| 35 to 64 Years | 34 (16.7%) | 29 (12.8%) |
| 65 to 74 Years | 11 (20.7%) | 7 (10.3%) |
| 75 Years and over | 11 (17.7%) | 10 (17.5%) |
Disability Class: Self-Care Difficulty
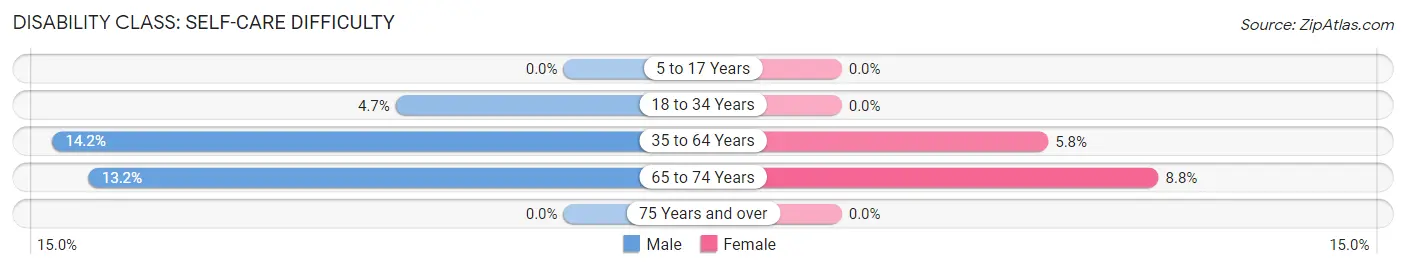
| Age Bracket | Male | Female |
| 5 to 17 Years | 0 (0.0%) | 0 (0.0%) |
| 18 to 34 Years | 5 (4.7%) | 0 (0.0%) |
| 35 to 64 Years | 29 (14.2%) | 13 (5.8%) |
| 65 to 74 Years | 7 (13.2%) | 6 (8.8%) |
| 75 Years and over | 0 (0.0%) | 0 (0.0%) |
Technology Access in Velda City
Computing Device Access in Velda City
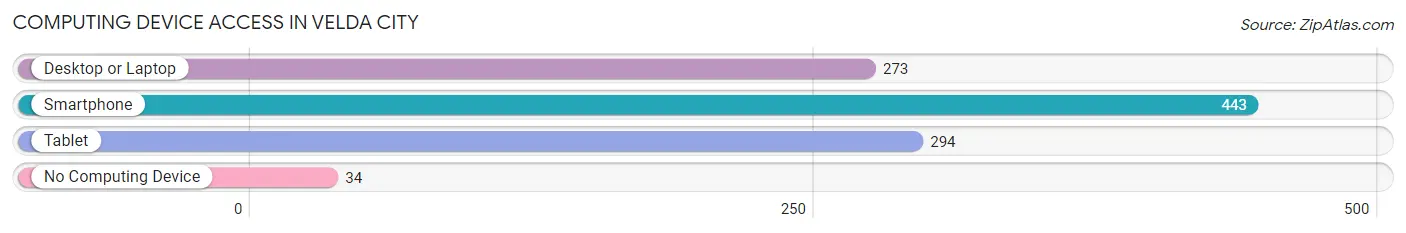
| Device Type | # Households | % Households |
| Desktop or Laptop | 273 | 52.8% |
| Smartphone | 443 | 85.7% |
| Tablet | 294 | 56.9% |
| No Computing Device | 34 | 6.6% |
| Total | 517 | 100.0% |
Internet Access in Velda City
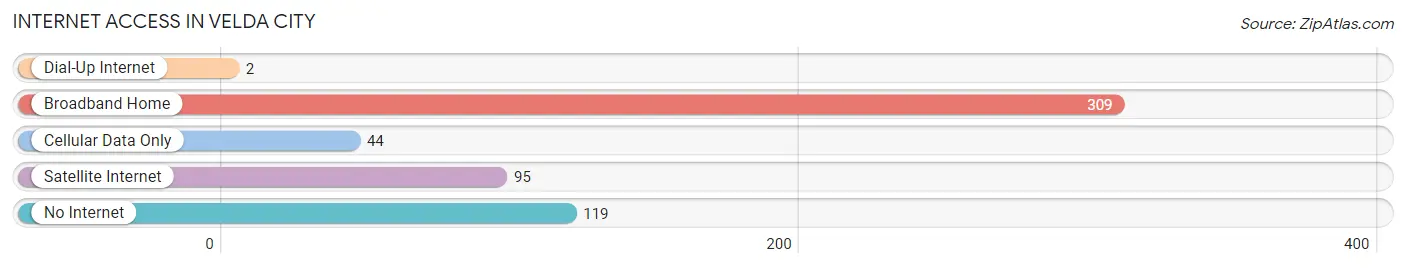
| Internet Type | # Households | % Households |
| Dial-Up Internet | 2 | 0.4% |
| Broadband Home | 309 | 59.8% |
| Cellular Data Only | 44 | 8.5% |
| Satellite Internet | 95 | 18.4% |
| No Internet | 119 | 23.0% |
| Total | 517 | 100.0% |
Velda City Summary
Velda City is a small city located in St. Louis County, Missouri. It is situated on the banks of the Missouri River, just north of the city of St. Louis. The city was founded in 1892 and has a population of approximately 4,000 people.
History
Velda City was founded in 1892 by a group of German immigrants who had recently arrived in the United States. The city was named after the daughter of one of the founders, Velda Schubert. The city was originally a farming community, but it soon developed into a small industrial center. The city was home to several factories, including a shoe factory, a brickyard, and a brewery.
In the early 1900s, the city experienced a period of growth and prosperity. The population increased from 1,000 in 1900 to 4,000 in 1920. During this time, the city was home to several businesses, including a bank, a hotel, and a movie theater.
In the 1950s, the city began to decline. The factories closed and the population decreased. In the 1970s, the city was declared a blighted area and the city government began to focus on revitalization efforts. In the 1980s, the city began to experience a resurgence. The population increased and new businesses opened.
Geography
Velda City is located in St. Louis County, Missouri. It is situated on the banks of the Missouri River, just north of the city of St. Louis. The city covers an area of 1.2 square miles and has a population density of 3,400 people per square mile.
The city is located in a humid continental climate zone, with hot summers and cold winters. The average annual temperature is 54 degrees Fahrenheit. The average annual precipitation is 40 inches.
Economy
The economy of Velda City is largely based on manufacturing and services. The city is home to several factories, including a shoe factory, a brickyard, and a brewery. The city is also home to several retail stores, restaurants, and other businesses.
The city is also home to several educational institutions, including a community college and a technical school. The city is also home to a hospital and several medical clinics.
Demographics
As of the 2010 census, the population of Velda City was 4,000. The racial makeup of the city was 79.3% White, 15.2% African American, 0.7% Native American, 0.7% Asian, and 4.1% from other races. The median household income was $37,000 and the median family income was $45,000.
The city is home to a diverse population. The city is home to a large Hispanic population, as well as a large African American population. The city is also home to a large number of immigrants from various countries, including Mexico, India, and China.
Common Questions
What is Per Capita Income in Velda City?
Per Capita income in Velda City is $20,490.
What is the Median Family Income in Velda City?
Median Family Income in Velda City is $47,917.
What is the Median Household income in Velda City?
Median Household Income in Velda City is $44,432.
What is Inequality or Gini Index in Velda City?
Inequality or Gini Index in Velda City is 0.33.
What is the Total Population of Velda City?
Total Population of Velda City is 1,254.
What is the Total Male Population of Velda City?
Total Male Population of Velda City is 570.
What is the Total Female Population of Velda City?
Total Female Population of Velda City is 684.
What is the Ratio of Males per 100 Females in Velda City?
There are 83.33 Males per 100 Females in Velda City.
What is the Ratio of Females per 100 Males in Velda City?
There are 120.00 Females per 100 Males in Velda City.
What is the Median Population Age in Velda City?
Median Population Age in Velda City is 41.6 Years.
What is the Average Family Size in Velda City
Average Family Size in Velda City is 3.0 People.
What is the Average Household Size in Velda City
Average Household Size in Velda City is 2.4 People.
How Large is the Labor Force in Velda City?
There are 561 People in the Labor Forcein in Velda City.
What is the Percentage of People in the Labor Force in Velda City?
57.2% of People are in the Labor Force in Velda City.
What is the Unemployment Rate in Velda City?
Unemployment Rate in Velda City is 4.5%.