Northwoods, MO Map & Demographics
Northwoods Map
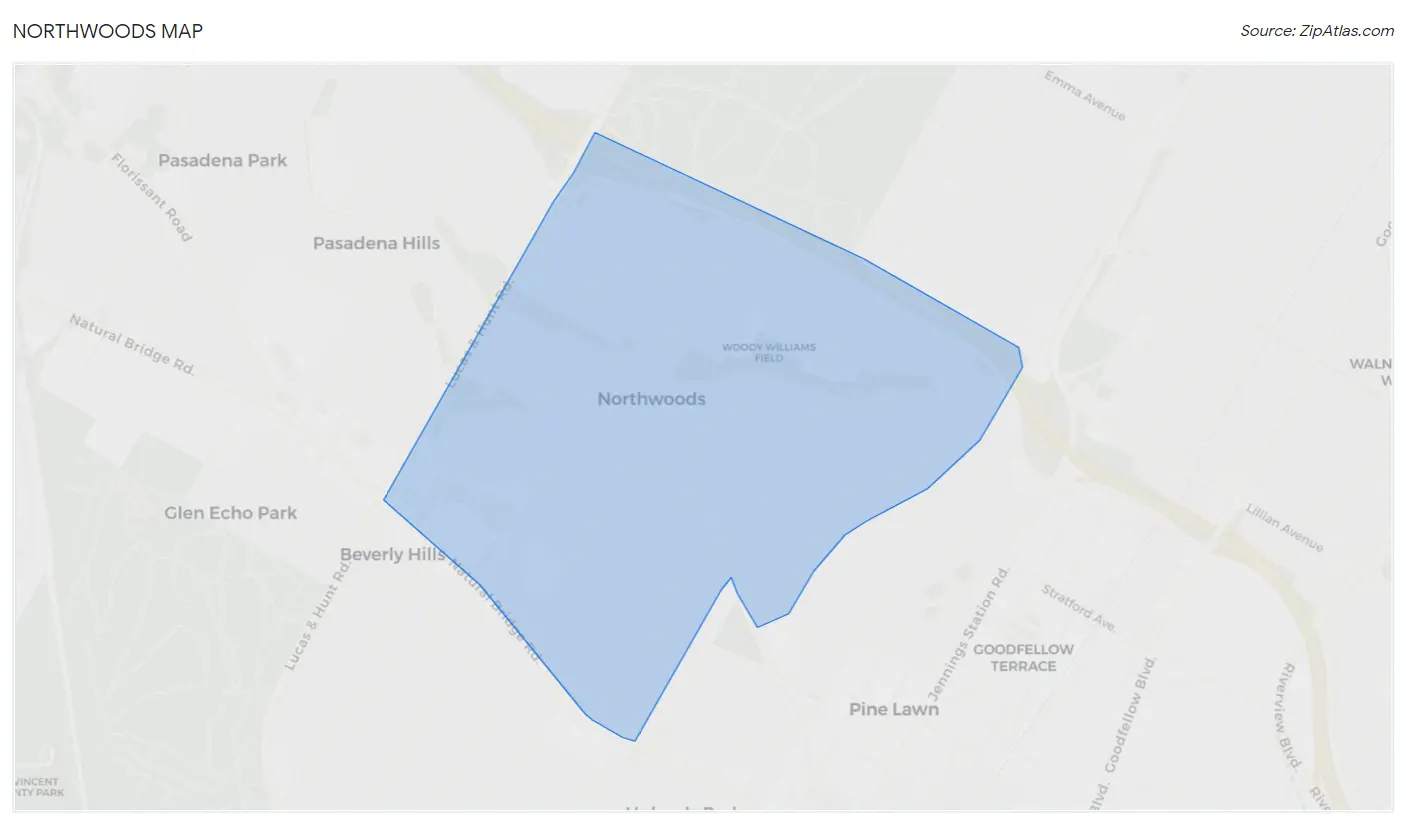
Northwoods Overview
$22,427
PER CAPITA INCOME
$55,019
AVG FAMILY INCOME
$38,864
AVG HOUSEHOLD INCOME
9.3%
WAGE / INCOME GAP [ % ]
90.7¢/ $1
WAGE / INCOME GAP [ $ ]
0.36
INEQUALITY / GINI INDEX
3,700
TOTAL POPULATION
1,858
MALE POPULATION
1,842
FEMALE POPULATION
100.87
MALES / 100 FEMALES
99.14
FEMALES / 100 MALES
57.6
MEDIAN AGE
2.9
AVG FAMILY SIZE
1.9
AVG HOUSEHOLD SIZE
1,220
LABOR FORCE [ PEOPLE ]
38.0%
PERCENT IN LABOR FORCE
8.2%
UNEMPLOYMENT RATE
Income in Northwoods
Income Overview in Northwoods
Per Capita Income in Northwoods is $22,427, while median incomes of families and households are $55,019 and $38,864 respectively.
| Characteristic | Number | Measure |
| Per Capita Income | 3,700 | $22,427 |
| Median Family Income | 773 | $55,019 |
| Mean Family Income | 773 | $55,320 |
| Median Household Income | 1,896 | $38,864 |
| Mean Household Income | 1,896 | $40,747 |
| Income Deficit | 773 | $0 |
| Wage / Income Gap (%) | 3,700 | 9.33% |
| Wage / Income Gap ($) | 3,700 | 90.67¢ per $1 |
| Gini / Inequality Index | 3,700 | 0.36 |
Earnings by Sex in Northwoods
Average Earnings in Northwoods are $35,640, $35,000 for men and $38,603 for women, a difference of 9.3%.
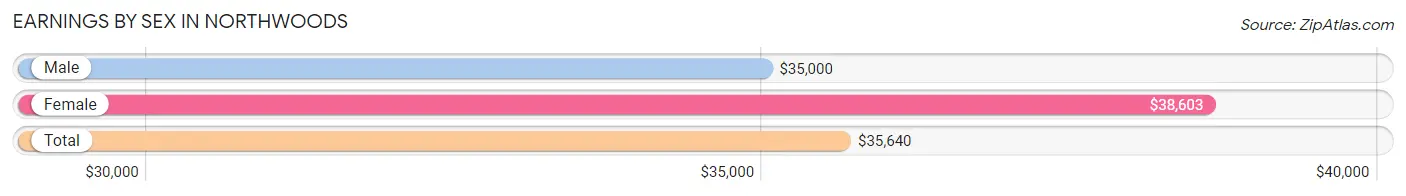
| Sex | Number | Average Earnings |
| Male | 560 (46.6%) | $35,000 |
| Female | 641 (53.4%) | $38,603 |
| Total | 1,201 (100.0%) | $35,640 |
Earnings by Sex by Income Bracket in Northwoods
The most common earnings brackets in Northwoods are $35,000 to $39,999 for men (173 | 30.9%) and $45,000 to $49,999 for women (149 | 23.2%).
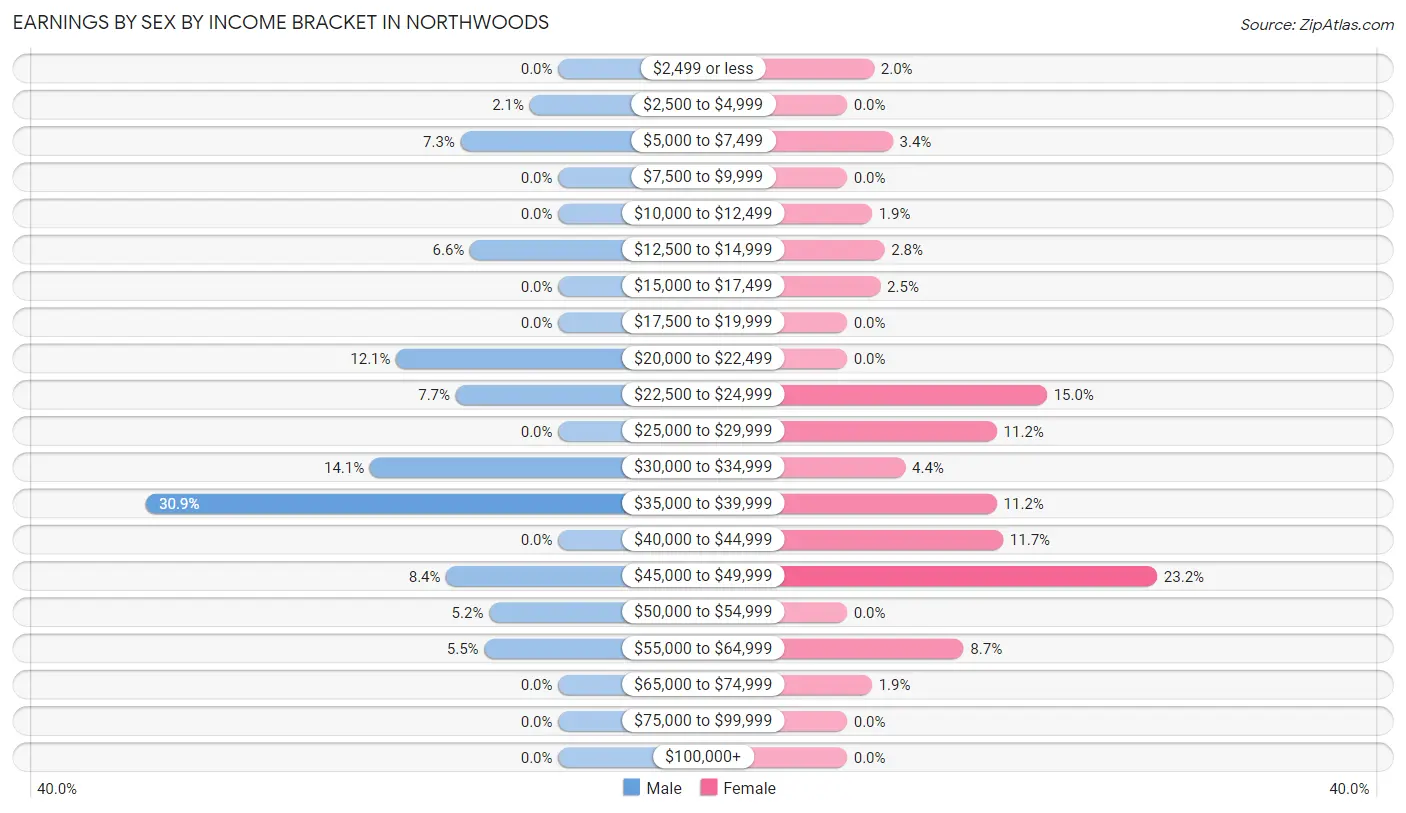
| Income | Male | Female |
| $2,499 or less | 0 (0.0%) | 13 (2.0%) |
| $2,500 to $4,999 | 12 (2.1%) | 0 (0.0%) |
| $5,000 to $7,499 | 41 (7.3%) | 22 (3.4%) |
| $7,500 to $9,999 | 0 (0.0%) | 0 (0.0%) |
| $10,000 to $12,499 | 0 (0.0%) | 12 (1.9%) |
| $12,500 to $14,999 | 37 (6.6%) | 18 (2.8%) |
| $15,000 to $17,499 | 0 (0.0%) | 16 (2.5%) |
| $17,500 to $19,999 | 0 (0.0%) | 0 (0.0%) |
| $20,000 to $22,499 | 68 (12.1%) | 0 (0.0%) |
| $22,500 to $24,999 | 43 (7.7%) | 96 (15.0%) |
| $25,000 to $29,999 | 0 (0.0%) | 72 (11.2%) |
| $30,000 to $34,999 | 79 (14.1%) | 28 (4.4%) |
| $35,000 to $39,999 | 173 (30.9%) | 72 (11.2%) |
| $40,000 to $44,999 | 0 (0.0%) | 75 (11.7%) |
| $45,000 to $49,999 | 47 (8.4%) | 149 (23.2%) |
| $50,000 to $54,999 | 29 (5.2%) | 0 (0.0%) |
| $55,000 to $64,999 | 31 (5.5%) | 56 (8.7%) |
| $65,000 to $74,999 | 0 (0.0%) | 12 (1.9%) |
| $75,000 to $99,999 | 0 (0.0%) | 0 (0.0%) |
| $100,000+ | 0 (0.0%) | 0 (0.0%) |
| Total | 560 (100.0%) | 641 (100.0%) |
Earnings by Sex by Educational Attainment in Northwoods
Average earnings in Northwoods are $35,554 for men and $39,363 for women, a difference of 9.7%. Men with an educational attainment of college or associate's degree enjoy the highest average annual earnings of $36,270, while those with high school diploma education earn the least with $21,710. Women with an educational attainment of college or associate's degree earn the most with the average annual earnings of $45,542, while those with high school diploma education have the smallest earnings of $28,983.
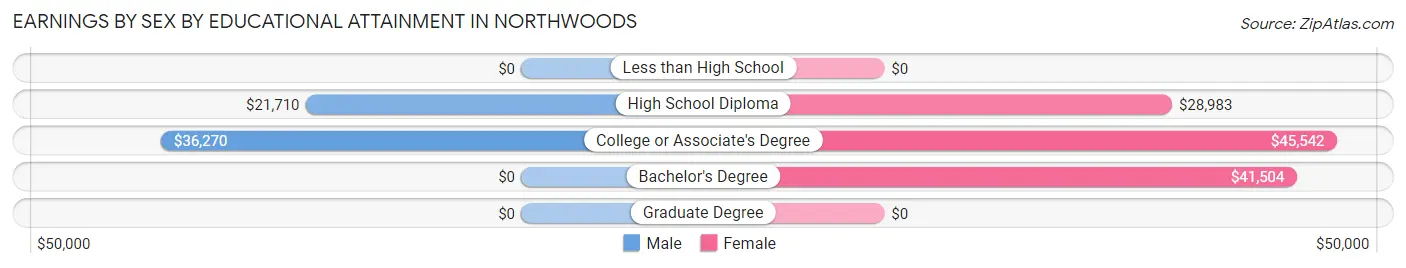
| Educational Attainment | Male Income | Female Income |
| Less than High School | - | - |
| High School Diploma | $21,710 | $28,983 |
| College or Associate's Degree | $36,270 | $45,542 |
| Bachelor's Degree | - | - |
| Graduate Degree | - | - |
| Total | $35,554 | $39,363 |
Family Income in Northwoods
Family Income Brackets in Northwoods
According to the Northwoods family income data, there are 303 families falling into the $35,000 to $49,999 income range, which is the most common income bracket and makes up 39.2% of all families.
| Income Bracket | # Families | % Families |
| Less than $10,000 | 0 | 0.0% |
| $10,000 to $14,999 | 0 | 0.0% |
| $15,000 to $24,999 | 46 | 6.0% |
| $25,000 to $34,999 | 27 | 3.5% |
| $35,000 to $49,999 | 303 | 39.2% |
| $50,000 to $74,999 | 270 | 34.9% |
| $75,000 to $99,999 | 105 | 13.6% |
| $100,000 to $149,999 | 15 | 1.9% |
| $150,000 to $199,999 | 7 | 0.9% |
| $200,000+ | 0 | 0.0% |
Family Income by Famaliy Size in Northwoods
2-person families (455 | 58.9%) account for the highest median family income in Northwoods with $56,307 per family, while 2-person families (455 | 58.9%) have the highest median income of $28,154 per family member.
| Income Bracket | # Families | Median Income |
| 2-Person Families | 455 (58.9%) | $56,307 |
| 3-Person Families | 234 (30.3%) | $46,125 |
| 4-Person Families | 36 (4.7%) | $0 |
| 5-Person Families | 48 (6.2%) | $0 |
| 6-Person Families | 0 (0.0%) | $0 |
| 7+ Person Families | 0 (0.0%) | $0 |
| Total | 773 (100.0%) | $55,019 |
Family Income by Number of Earners in Northwoods
| Number of Earners | # Families | Median Income |
| No Earners | 280 (36.2%) | $55,152 |
| 1 Earner | 359 (46.4%) | $46,490 |
| 2 Earners | 116 (15.0%) | $62,195 |
| 3+ Earners | 18 (2.3%) | $0 |
| Total | 773 (100.0%) | $55,019 |
Household Income in Northwoods
Household Income Brackets in Northwoods
With 573 households falling in the category, the $35,000 to $49,999 income range is the most frequent in Northwoods, accounting for 30.2% of all households.
| Income Bracket | # Households | % Households |
| Less than $10,000 | 229 | 12.1% |
| $10,000 to $14,999 | 13 | 0.7% |
| $15,000 to $24,999 | 391 | 20.6% |
| $25,000 to $34,999 | 131 | 6.9% |
| $35,000 to $49,999 | 573 | 30.2% |
| $50,000 to $74,999 | 362 | 19.1% |
| $75,000 to $99,999 | 129 | 6.8% |
| $100,000 to $149,999 | 63 | 3.3% |
| $150,000 to $199,999 | 8 | 0.4% |
| $200,000+ | 0 | 0.0% |
Household Income by Householder Age in Northwoods
The median household income in Northwoods is $38,864, with the highest median household income of $43,780 found in the 25 to 44 years age bracket for the primary householder. A total of 403 households (21.3%) fall into this category.
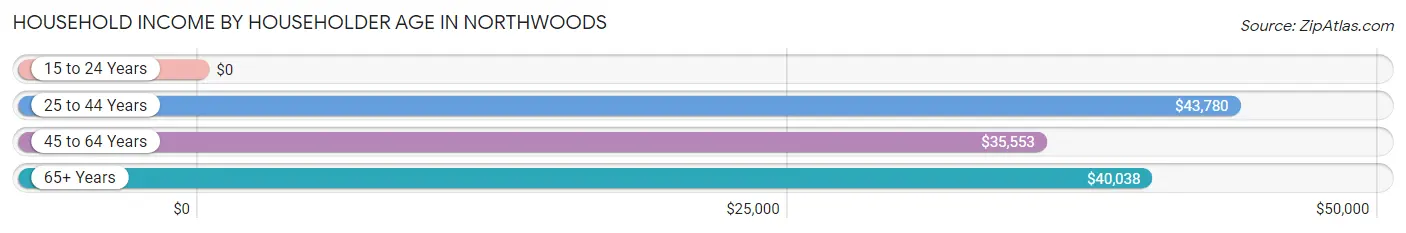
| Income Bracket | # Households | Median Income |
| 15 to 24 Years | 0 (0.0%) | $0 |
| 25 to 44 Years | 403 (21.3%) | $43,780 |
| 45 to 64 Years | 824 (43.5%) | $35,553 |
| 65+ Years | 669 (35.3%) | $40,038 |
| Total | 1,896 (100.0%) | $38,864 |
Poverty in Northwoods
Income Below Poverty by Sex and Age in Northwoods
With 13.5% poverty level for males and 6.0% for females among the residents of Northwoods, 35 to 44 year old males and 18 to 24 year old females are the most vulnerable to poverty, with 110 males (48.7%) and 12 females (27.9%) in their respective age groups living below the poverty level.
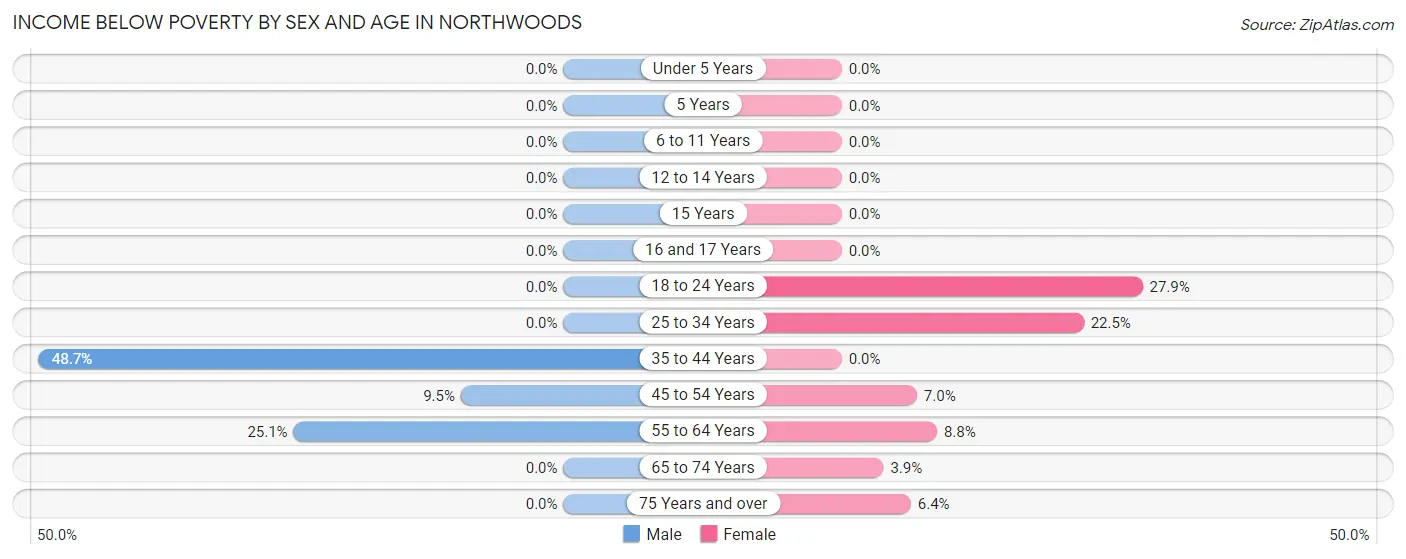
| Age Bracket | Male | Female |
| Under 5 Years | 0 (0.0%) | 0 (0.0%) |
| 5 Years | 0 (0.0%) | 0 (0.0%) |
| 6 to 11 Years | 0 (0.0%) | 0 (0.0%) |
| 12 to 14 Years | 0 (0.0%) | 0 (0.0%) |
| 15 Years | 0 (0.0%) | 0 (0.0%) |
| 16 and 17 Years | 0 (0.0%) | 0 (0.0%) |
| 18 to 24 Years | 0 (0.0%) | 12 (27.9%) |
| 25 to 34 Years | 0 (0.0%) | 22 (22.5%) |
| 35 to 44 Years | 110 (48.7%) | 0 (0.0%) |
| 45 to 54 Years | 16 (9.5%) | 14 (7.0%) |
| 55 to 64 Years | 115 (25.1%) | 25 (8.8%) |
| 65 to 74 Years | 0 (0.0%) | 13 (3.9%) |
| 75 Years and over | 0 (0.0%) | 20 (6.4%) |
| Total | 241 (13.5%) | 106 (6.0%) |
Income Above Poverty by Sex and Age in Northwoods
According to the poverty statistics in Northwoods, males aged 6 to 11 years and females aged under 5 years are the age groups that are most secure financially, with 100.0% of males and 100.0% of females in these age groups living above the poverty line.
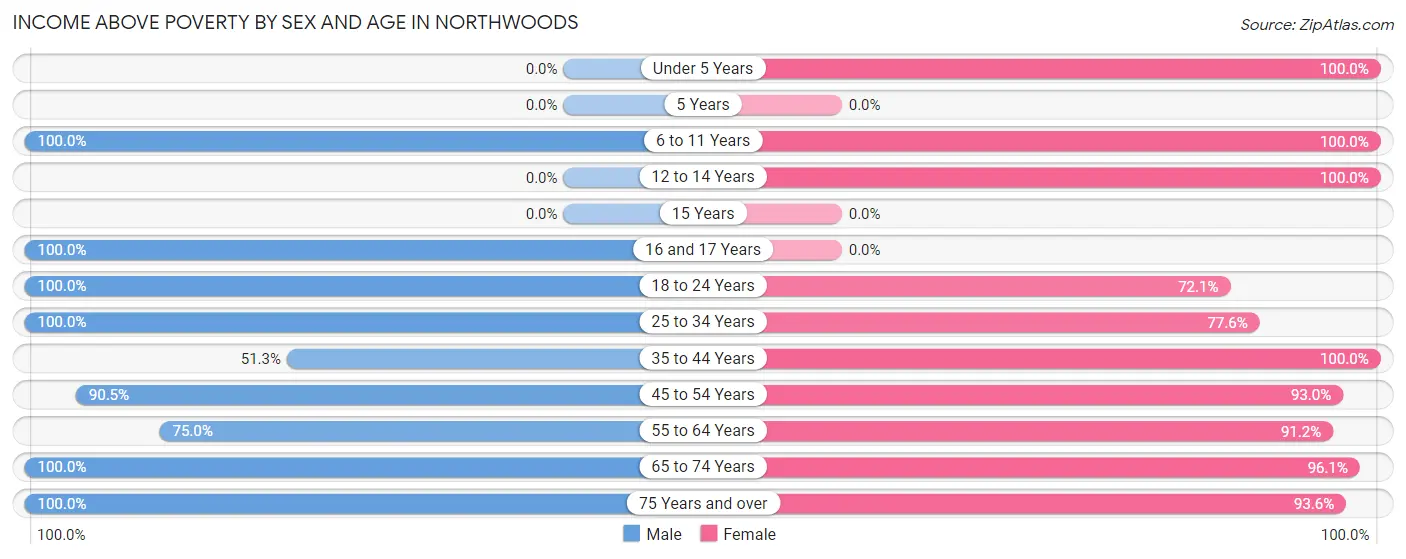
| Age Bracket | Male | Female |
| Under 5 Years | 0 (0.0%) | 51 (100.0%) |
| 5 Years | 0 (0.0%) | 0 (0.0%) |
| 6 to 11 Years | 223 (100.0%) | 43 (100.0%) |
| 12 to 14 Years | 0 (0.0%) | 132 (100.0%) |
| 15 Years | 0 (0.0%) | 0 (0.0%) |
| 16 and 17 Years | 59 (100.0%) | 0 (0.0%) |
| 18 to 24 Years | 125 (100.0%) | 31 (72.1%) |
| 25 to 34 Years | 103 (100.0%) | 76 (77.5%) |
| 35 to 44 Years | 116 (51.3%) | 254 (100.0%) |
| 45 to 54 Years | 152 (90.5%) | 187 (93.0%) |
| 55 to 64 Years | 344 (75.0%) | 258 (91.2%) |
| 65 to 74 Years | 246 (100.0%) | 323 (96.1%) |
| 75 Years and over | 179 (100.0%) | 292 (93.6%) |
| Total | 1,547 (86.5%) | 1,647 (94.0%) |
Income Below Poverty Among Married-Couple Families in Northwoods
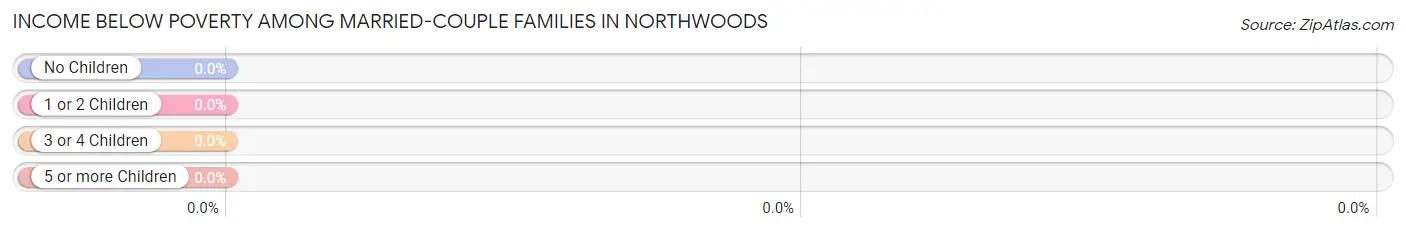
| Children | Above Poverty | Below Poverty |
| No Children | 262 (100.0%) | 0 (0.0%) |
| 1 or 2 Children | 51 (100.0%) | 0 (0.0%) |
| 3 or 4 Children | 41 (100.0%) | 0 (0.0%) |
| 5 or more Children | 0 (0.0%) | 0 (0.0%) |
| Total | 354 (100.0%) | 0 (0.0%) |
Income Below Poverty Among Single-Parent Households in Northwoods
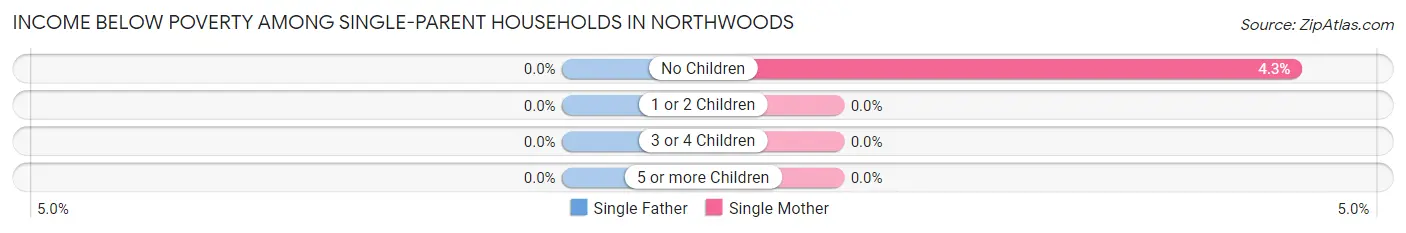
| Children | Single Father | Single Mother |
| No Children | 0 (0.0%) | 12 (4.3%) |
| 1 or 2 Children | 0 (0.0%) | 0 (0.0%) |
| 3 or 4 Children | 0 (0.0%) | 0 (0.0%) |
| 5 or more Children | 0 (0.0%) | 0 (0.0%) |
| Total | 0 (0.0%) | 12 (2.9%) |
Income Below Poverty Among Married-Couple vs Single-Parent Households in Northwoods
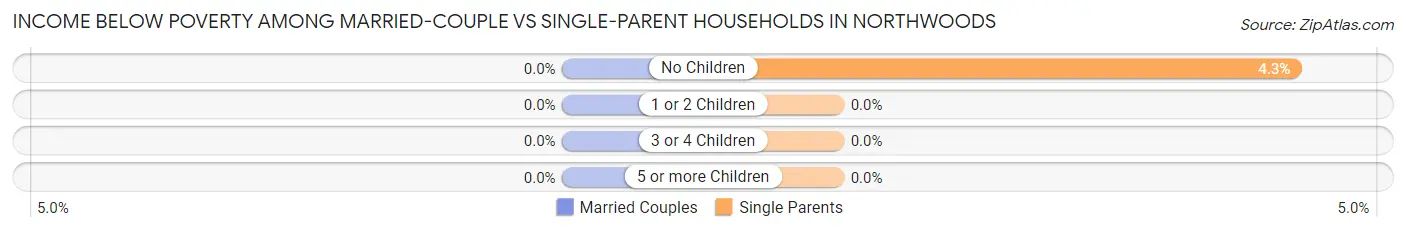
| Children | Married-Couple Families | Single-Parent Households |
| No Children | 0 (0.0%) | 12 (4.3%) |
| 1 or 2 Children | 0 (0.0%) | 0 (0.0%) |
| 3 or 4 Children | 0 (0.0%) | 0 (0.0%) |
| 5 or more Children | 0 (0.0%) | 0 (0.0%) |
| Total | 0 (0.0%) | 12 (2.9%) |
Race in Northwoods
The most populous races in Northwoods are Black / African American (3,365 | 90.9%), White / Caucasian (251 | 6.8%), and Two or more Races (84 | 2.3%).
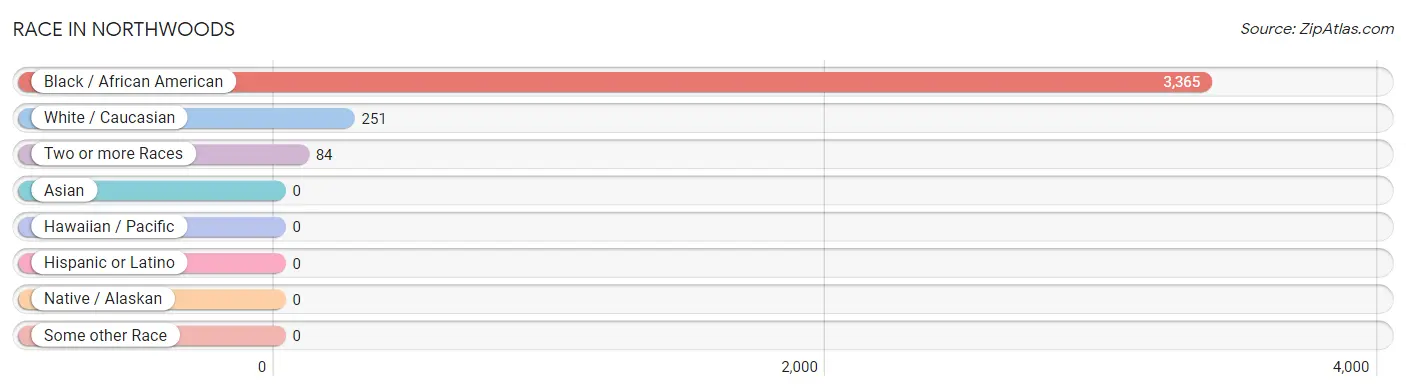
| Race | # Population | % Population |
| Asian | 0 | 0.0% |
| Black / African American | 3,365 | 90.9% |
| Hawaiian / Pacific | 0 | 0.0% |
| Hispanic or Latino | 0 | 0.0% |
| Native / Alaskan | 0 | 0.0% |
| White / Caucasian | 251 | 6.8% |
| Two or more Races | 84 | 2.3% |
| Some other Race | 0 | 0.0% |
| Total | 3,700 | 100.0% |
Ancestry in Northwoods
The most populous ancestries reported in Northwoods are Jamaican (226 | 6.1%), American (109 | 2.9%), Irish (107 | 2.9%), German (77 | 2.1%), and African (41 | 1.1%), together accounting for 15.1% of all Northwoods residents.
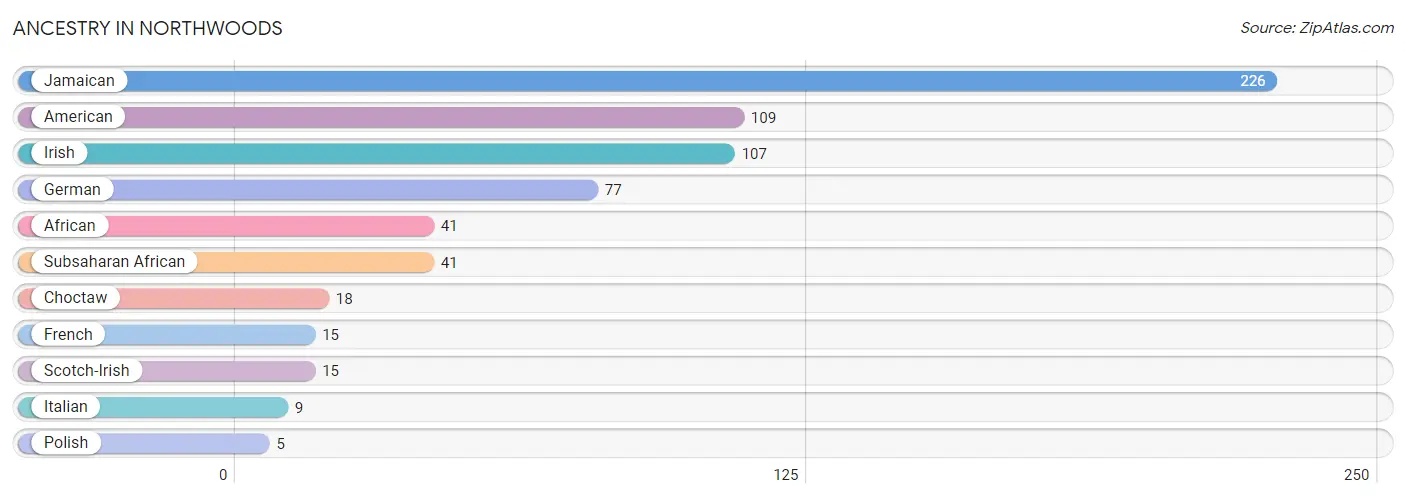
| Ancestry | # Population | % Population |
| African | 41 | 1.1% |
| American | 109 | 2.9% |
| Choctaw | 18 | 0.5% |
| French | 15 | 0.4% |
| German | 77 | 2.1% |
| Irish | 107 | 2.9% |
| Italian | 9 | 0.2% |
| Jamaican | 226 | 6.1% |
| Polish | 5 | 0.1% |
| Scotch-Irish | 15 | 0.4% |
| Subsaharan African | 41 | 1.1% | View All 11 Rows |
Immigrants in Northwoods
The most numerous immigrant groups reported in Northwoods came from Caribbean (132 | 3.6%), Jamaica (132 | 3.6%), and Latin America (132 | 3.6%), together accounting for 10.7% of all Northwoods residents.
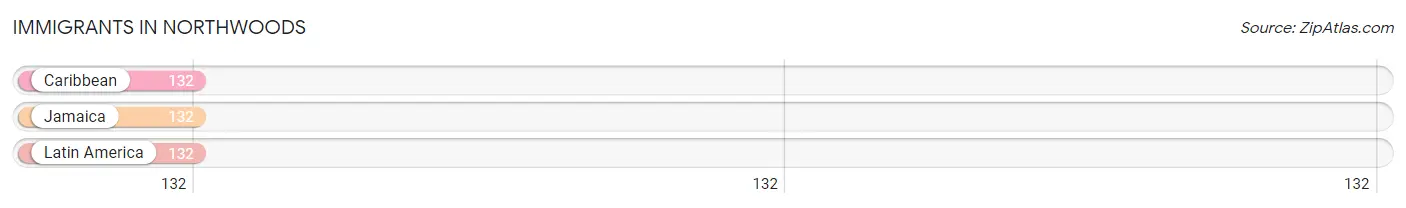
| Immigration Origin | # Population | % Population |
| Caribbean | 132 | 3.6% |
| Jamaica | 132 | 3.6% |
| Latin America | 132 | 3.6% | View All 3 Rows |
Sex and Age in Northwoods
Sex and Age in Northwoods
The most populous age groups in Northwoods are 60 to 64 Years (323 | 17.4%) for men and 60 to 64 Years (230 | 12.5%) for women.
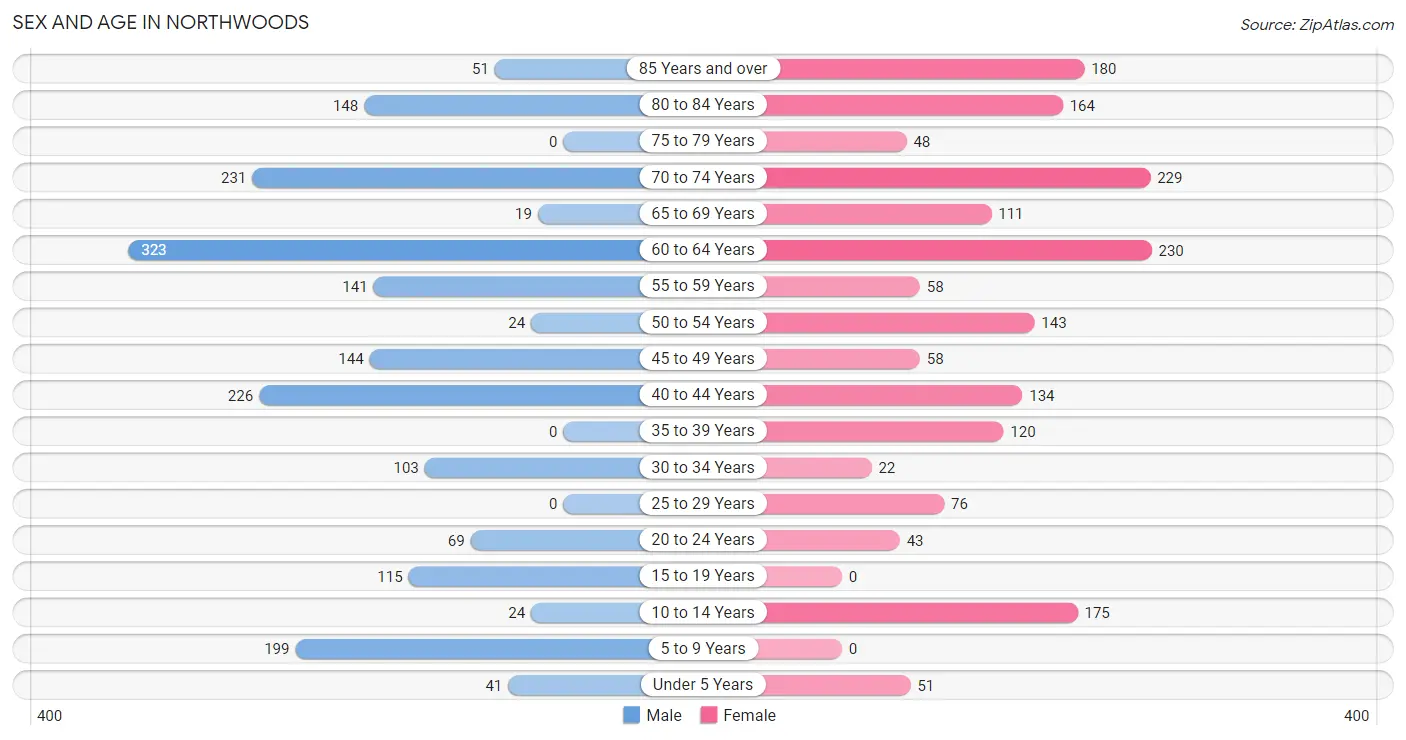
| Age Bracket | Male | Female |
| Under 5 Years | 41 (2.2%) | 51 (2.8%) |
| 5 to 9 Years | 199 (10.7%) | 0 (0.0%) |
| 10 to 14 Years | 24 (1.3%) | 175 (9.5%) |
| 15 to 19 Years | 115 (6.2%) | 0 (0.0%) |
| 20 to 24 Years | 69 (3.7%) | 43 (2.3%) |
| 25 to 29 Years | 0 (0.0%) | 76 (4.1%) |
| 30 to 34 Years | 103 (5.5%) | 22 (1.2%) |
| 35 to 39 Years | 0 (0.0%) | 120 (6.5%) |
| 40 to 44 Years | 226 (12.2%) | 134 (7.3%) |
| 45 to 49 Years | 144 (7.7%) | 58 (3.2%) |
| 50 to 54 Years | 24 (1.3%) | 143 (7.8%) |
| 55 to 59 Years | 141 (7.6%) | 58 (3.2%) |
| 60 to 64 Years | 323 (17.4%) | 230 (12.5%) |
| 65 to 69 Years | 19 (1.0%) | 111 (6.0%) |
| 70 to 74 Years | 231 (12.4%) | 229 (12.4%) |
| 75 to 79 Years | 0 (0.0%) | 48 (2.6%) |
| 80 to 84 Years | 148 (8.0%) | 164 (8.9%) |
| 85 Years and over | 51 (2.7%) | 180 (9.8%) |
| Total | 1,858 (100.0%) | 1,842 (100.0%) |
Families and Households in Northwoods
Median Family Size in Northwoods
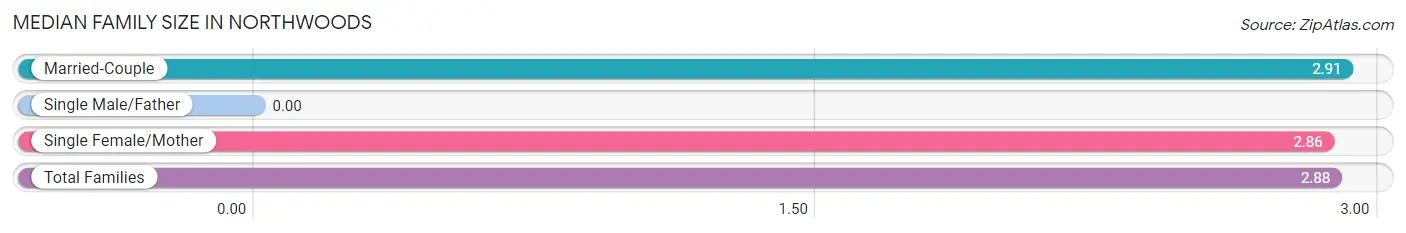
| Family Type | # Families | Family Size |
| Married-Couple | 354 (45.8%) | 2.91 |
| Single Male/Father | 0 (0.0%) | - |
| Single Female/Mother | 419 (54.2%) | 2.86 |
| Total Families | 773 (100.0%) | 2.88 |
Median Household Size in Northwoods
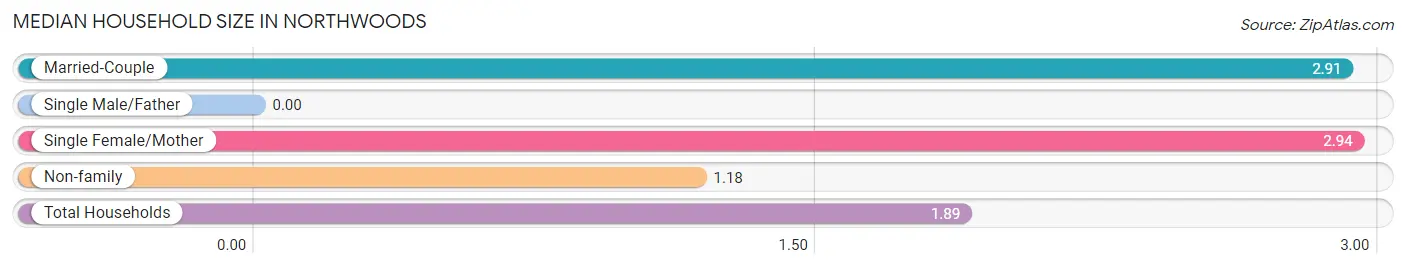
| Household Type | # Households | Household Size |
| Married-Couple | 354 (18.7%) | 2.91 |
| Single Male/Father | 0 (0.0%) | - |
| Single Female/Mother | 419 (22.1%) | 2.94 |
| Non-family | 1,123 (59.2%) | 1.18 |
| Total Households | 1,896 (100.0%) | 1.89 |
Household Size by Marriage Status in Northwoods
Out of a total of 1,896 households in Northwoods, 773 (40.8%) are family households, while 1,123 (59.2%) are nonfamily households. The most numerous type of family households are 2-person households, comprising 432, and the most common type of nonfamily households are 1-person households, comprising 963.
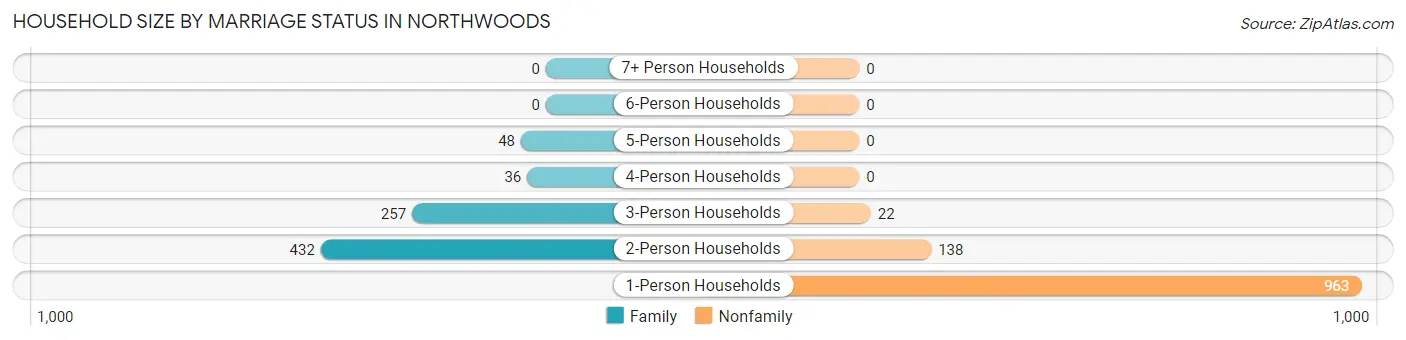
| Household Size | Family Households | Nonfamily Households |
| 1-Person Households | - | 963 (50.8%) |
| 2-Person Households | 432 (22.8%) | 138 (7.3%) |
| 3-Person Households | 257 (13.6%) | 22 (1.2%) |
| 4-Person Households | 36 (1.9%) | 0 (0.0%) |
| 5-Person Households | 48 (2.5%) | 0 (0.0%) |
| 6-Person Households | 0 (0.0%) | 0 (0.0%) |
| 7+ Person Households | 0 (0.0%) | 0 (0.0%) |
| Total | 773 (40.8%) | 1,123 (59.2%) |
Female Fertility in Northwoods
Fertility by Age in Northwoods
Average fertility rate in Northwoods is 99.0 births per 1,000 women. Women in the age bracket of 20 to 34 years have the highest fertility rate with 340.0 births per 1,000 women. Women in the age bracket of 20 to 34 years acount for 100.0% of all women with births.
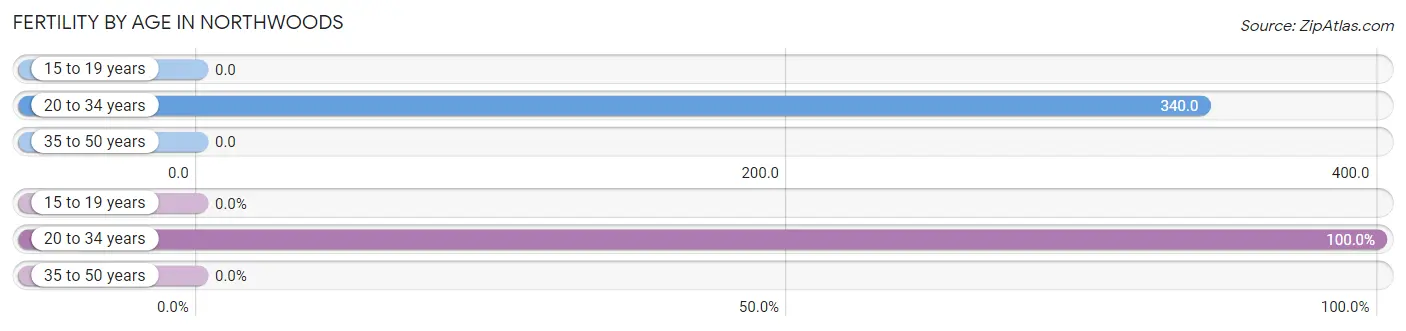
| Age Bracket | Women with Births | Births / 1,000 Women |
| 15 to 19 years | 0 (0.0%) | 0.0 |
| 20 to 34 years | 48 (100.0%) | 340.0 |
| 35 to 50 years | 0 (0.0%) | 0.0 |
| Total | 48 (100.0%) | 99.0 |
Fertility by Age by Marriage Status in Northwoods
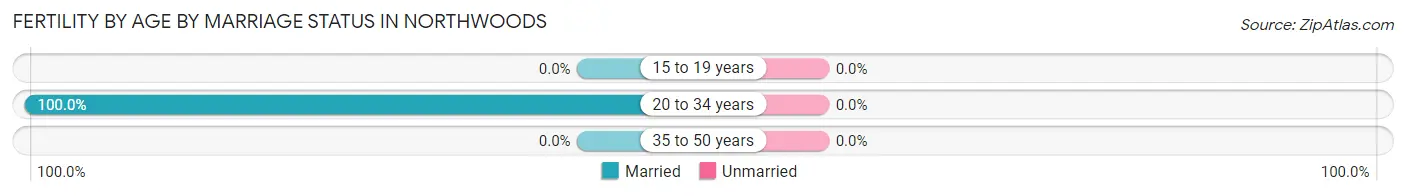
| Age Bracket | Married | Unmarried |
| 15 to 19 years | 0 (0.0%) | 0 (0.0%) |
| 20 to 34 years | 48 (100.0%) | 0 (0.0%) |
| 35 to 50 years | 0 (0.0%) | 0 (0.0%) |
| Total | 48 (100.0%) | 0 (0.0%) |
Fertility by Education in Northwoods
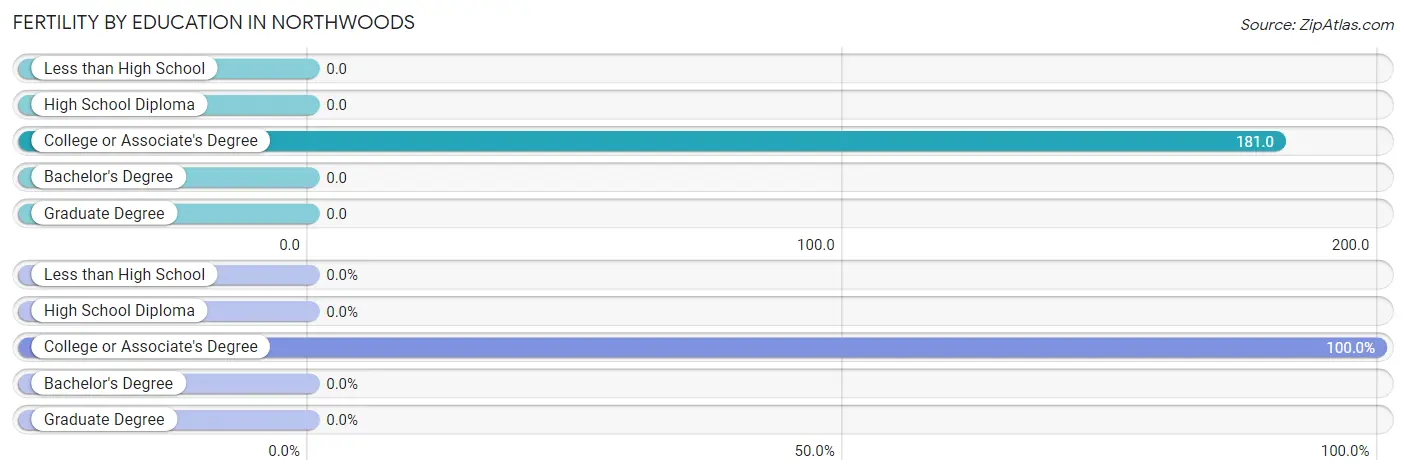
| Educational Attainment | Women with Births | Births / 1,000 Women |
| Less than High School | 0 (0.0%) | 0.0 |
| High School Diploma | 0 (0.0%) | 0.0 |
| College or Associate's Degree | 48 (100.0%) | 181.0 |
| Bachelor's Degree | 0 (0.0%) | 0.0 |
| Graduate Degree | 0 (0.0%) | 0.0 |
| Total | 48 (100.0%) | 99.0 |
Fertility by Education by Marriage Status in Northwoods
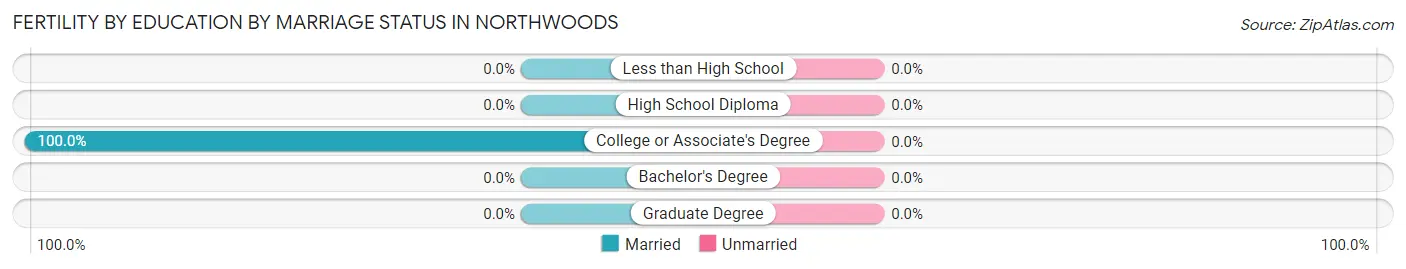
| Educational Attainment | Married | Unmarried |
| Less than High School | 0 (0.0%) | 0 (0.0%) |
| High School Diploma | 0 (0.0%) | 0 (0.0%) |
| College or Associate's Degree | 48 (100.0%) | 0 (0.0%) |
| Bachelor's Degree | 0 (0.0%) | 0 (0.0%) |
| Graduate Degree | 0 (0.0%) | 0 (0.0%) |
| Total | 48 (100.0%) | 0 (0.0%) |
Employment Characteristics in Northwoods
Employment by Class of Employer in Northwoods
Among the 1,119 employed individuals in Northwoods, private company employees (857 | 76.6%), not-for-profit organizations (101 | 9.0%), and self-employed (not incorporated) (91 | 8.1%) make up the most common classes of employment.
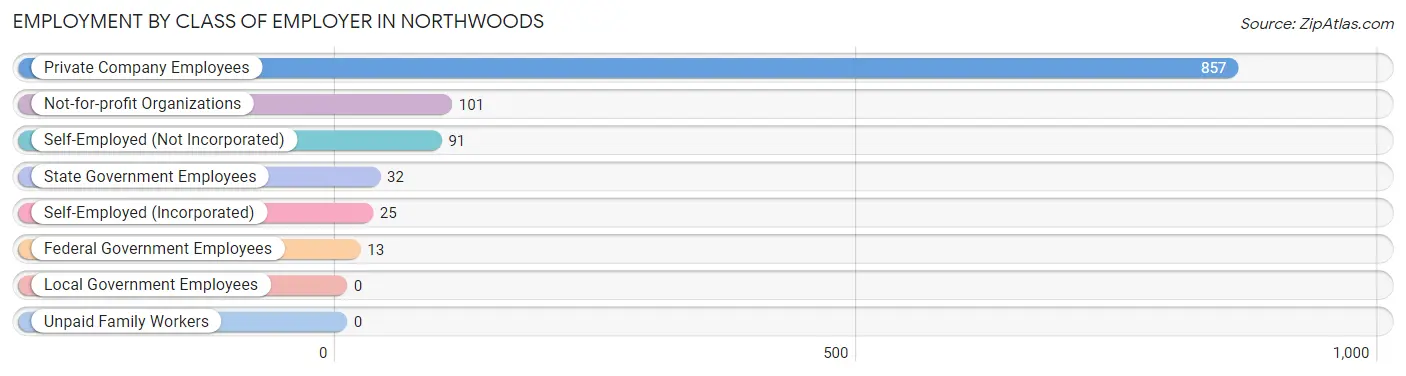
| Employer Class | # Employees | % Employees |
| Private Company Employees | 857 | 76.6% |
| Self-Employed (Incorporated) | 25 | 2.2% |
| Self-Employed (Not Incorporated) | 91 | 8.1% |
| Not-for-profit Organizations | 101 | 9.0% |
| Local Government Employees | 0 | 0.0% |
| State Government Employees | 32 | 2.9% |
| Federal Government Employees | 13 | 1.2% |
| Unpaid Family Workers | 0 | 0.0% |
| Total | 1,119 | 100.0% |
Employment Status by Age in Northwoods
According to the labor force statistics for Northwoods, out of the total population over 16 years of age (3,210), 38.0% or 1,220 individuals are in the labor force, with 8.2% or 100 of them unemployed. The age group with the highest labor force participation rate is 25 to 29 years, with 100.0% or 76 individuals in the labor force. Within the labor force, the 75 years and over age range has the highest percentage of unemployed individuals, with 100.0% or 20 of them being unemployed.
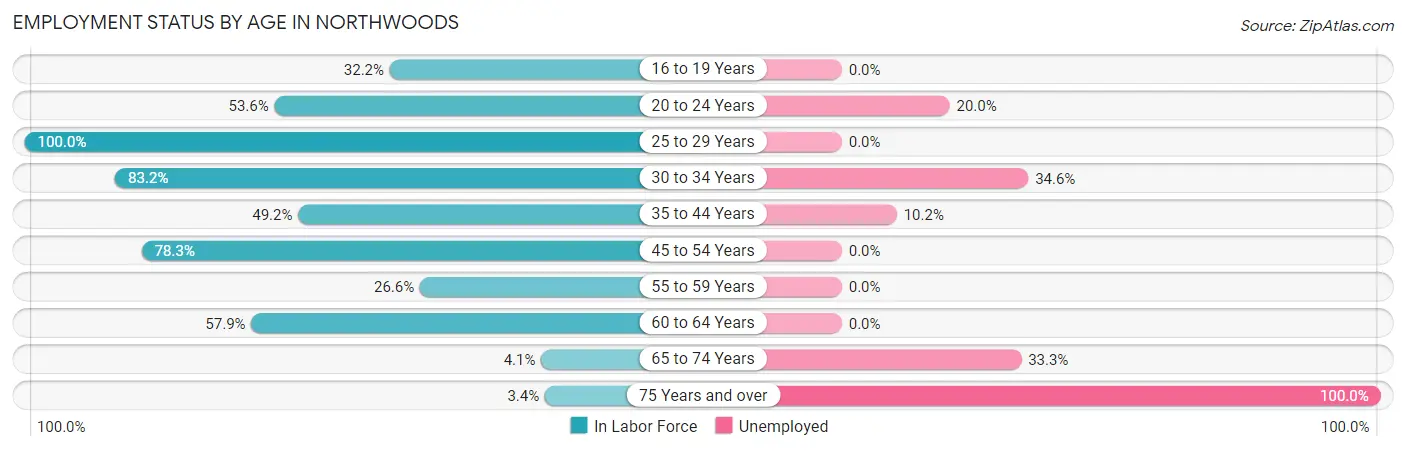
| Age Bracket | In Labor Force | Unemployed |
| 16 to 19 Years | 37 (32.2%) | 0 (0.0%) |
| 20 to 24 Years | 60 (53.6%) | 12 (20.0%) |
| 25 to 29 Years | 76 (100.0%) | 0 (0.0%) |
| 30 to 34 Years | 104 (83.2%) | 36 (34.6%) |
| 35 to 44 Years | 236 (49.2%) | 24 (10.2%) |
| 45 to 54 Years | 289 (78.3%) | 0 (0.0%) |
| 55 to 59 Years | 53 (26.6%) | 0 (0.0%) |
| 60 to 64 Years | 320 (57.9%) | 0 (0.0%) |
| 65 to 74 Years | 24 (4.1%) | 8 (33.3%) |
| 75 Years and over | 20 (3.4%) | 20 (100.0%) |
| Total | 1,220 (38.0%) | 100 (8.2%) |
Employment Status by Educational Attainment in Northwoods
According to labor force statistics for Northwoods, 59.8% of individuals (1,078) out of the total population between 25 and 64 years of age (1,802) are in the labor force, with 5.6% or 60 of them being unemployed. The group with the highest labor force participation rate are those with the educational attainment of college / associate degree, with 74.2% or 640 individuals in the labor force. Within the labor force, individuals with less than high school education have the highest percentage of unemployment, with 57.1% or 24 of them being unemployed.
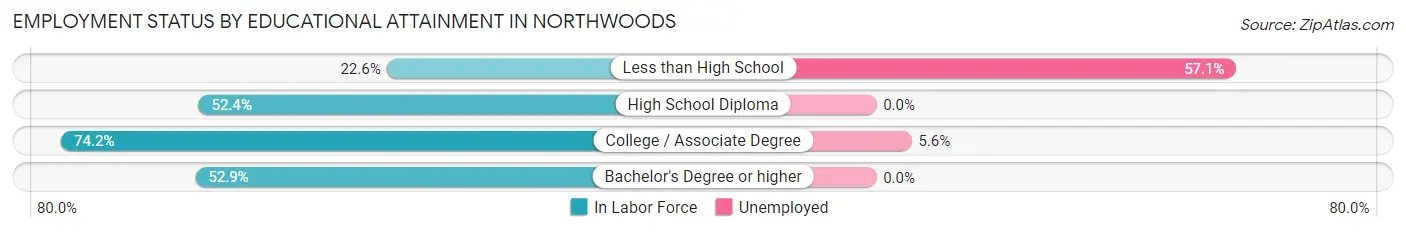
| Educational Attainment | In Labor Force | Unemployed |
| Less than High School | 42 (22.6%) | 106 (57.1%) |
| High School Diploma | 297 (52.4%) | 0 (0.0%) |
| College / Associate Degree | 640 (74.2%) | 48 (5.6%) |
| Bachelor's Degree or higher | 99 (52.9%) | 0 (0.0%) |
| Total | 1,078 (59.8%) | 101 (5.6%) |
Employment Occupations by Sex in Northwoods
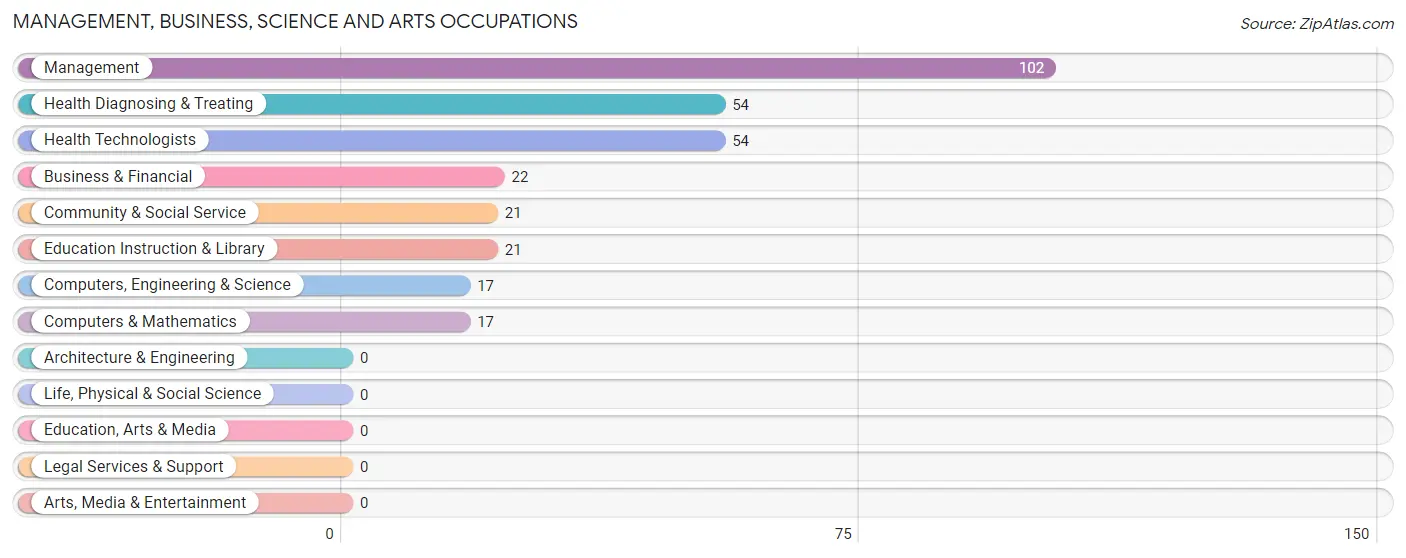
Management, Business, Science and Arts Occupations
The most common Management, Business, Science and Arts occupations in Northwoods are Management (102 | 9.1%), Health Diagnosing & Treating (54 | 4.8%), Health Technologists (54 | 4.8%), Business & Financial (22 | 2.0%), and Community & Social Service (21 | 1.9%).
Management, Business, Science and Arts Occupations by Sex
Within the Management, Business, Science and Arts occupations in Northwoods, the most male-oriented occupations are Business & Financial (100.0%), Computers, Engineering & Science (100.0%), and Computers & Mathematics (100.0%), while the most female-oriented occupations are Community & Social Service (100.0%), Education Instruction & Library (100.0%), and Health Diagnosing & Treating (59.3%).
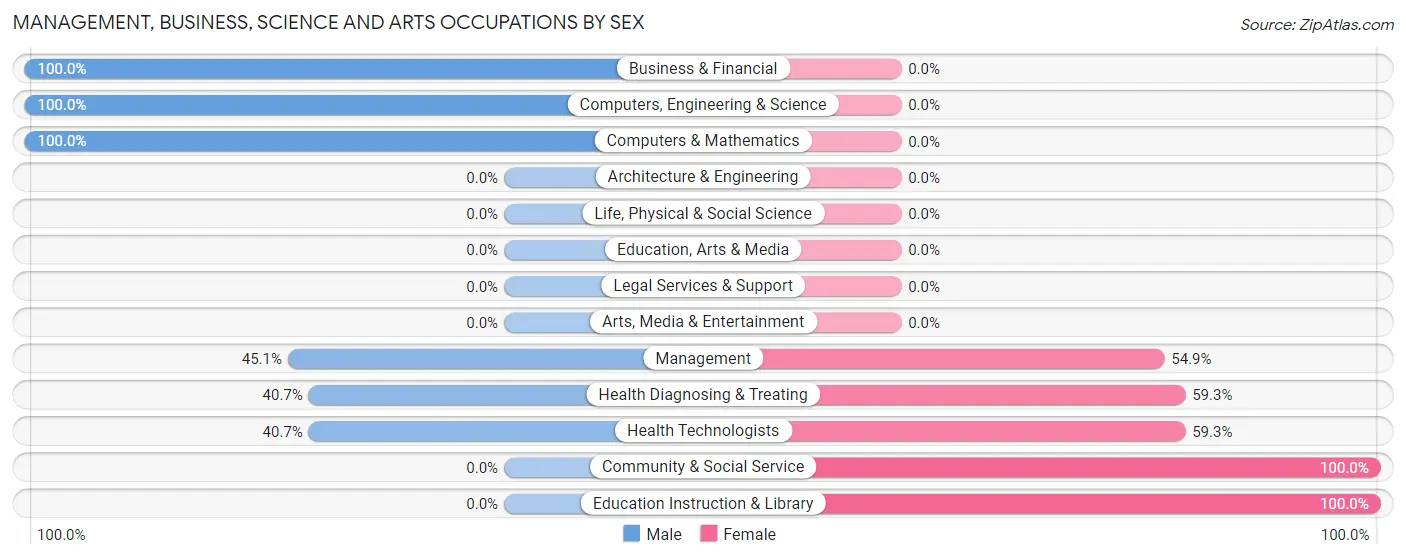
| Occupation | Male | Female |
| Management | 46 (45.1%) | 56 (54.9%) |
| Business & Financial | 22 (100.0%) | 0 (0.0%) |
| Computers, Engineering & Science | 17 (100.0%) | 0 (0.0%) |
| Computers & Mathematics | 17 (100.0%) | 0 (0.0%) |
| Architecture & Engineering | 0 (0.0%) | 0 (0.0%) |
| Life, Physical & Social Science | 0 (0.0%) | 0 (0.0%) |
| Community & Social Service | 0 (0.0%) | 21 (100.0%) |
| Education, Arts & Media | 0 (0.0%) | 0 (0.0%) |
| Legal Services & Support | 0 (0.0%) | 0 (0.0%) |
| Education Instruction & Library | 0 (0.0%) | 21 (100.0%) |
| Arts, Media & Entertainment | 0 (0.0%) | 0 (0.0%) |
| Health Diagnosing & Treating | 22 (40.7%) | 32 (59.3%) |
| Health Technologists | 22 (40.7%) | 32 (59.3%) |
| Total (Category) | 107 (49.5%) | 109 (50.5%) |
| Total (Overall) | 491 (43.9%) | 628 (56.1%) |
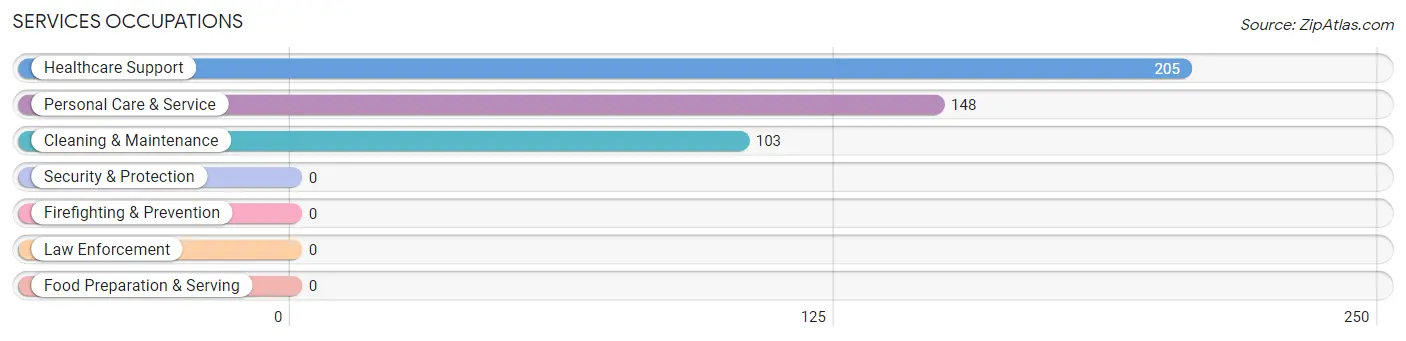
Services Occupations
The most common Services occupations in Northwoods are Healthcare Support (205 | 18.3%), Personal Care & Service (148 | 13.2%), and Cleaning & Maintenance (103 | 9.2%).
Services Occupations by Sex
Within the Services occupations in Northwoods, the most male-oriented occupations are Personal Care & Service (89.2%), Cleaning & Maintenance (66.0%), and Healthcare Support (7.8%), while the most female-oriented occupations are Healthcare Support (92.2%), Cleaning & Maintenance (34.0%), and Personal Care & Service (10.8%).
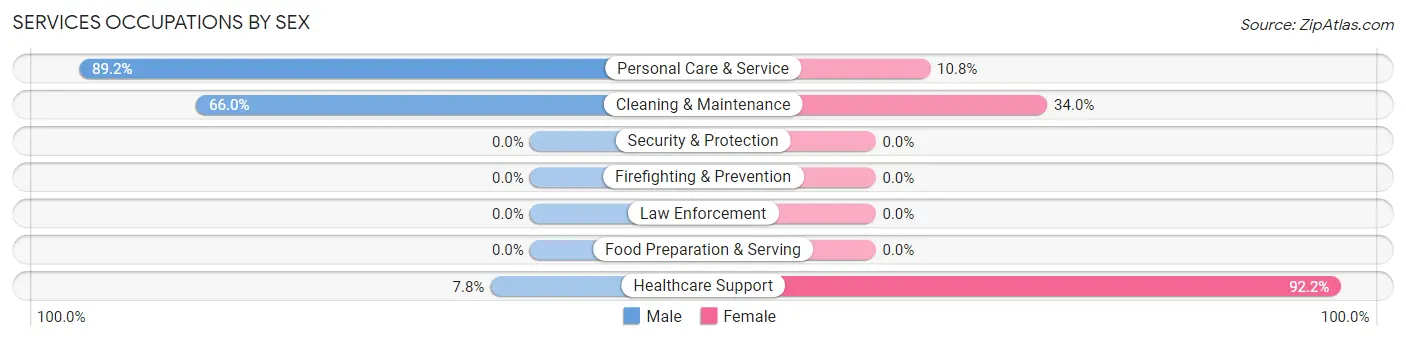
| Occupation | Male | Female |
| Healthcare Support | 16 (7.8%) | 189 (92.2%) |
| Security & Protection | 0 (0.0%) | 0 (0.0%) |
| Firefighting & Prevention | 0 (0.0%) | 0 (0.0%) |
| Law Enforcement | 0 (0.0%) | 0 (0.0%) |
| Food Preparation & Serving | 0 (0.0%) | 0 (0.0%) |
| Cleaning & Maintenance | 68 (66.0%) | 35 (34.0%) |
| Personal Care & Service | 132 (89.2%) | 16 (10.8%) |
| Total (Category) | 216 (47.4%) | 240 (52.6%) |
| Total (Overall) | 491 (43.9%) | 628 (56.1%) |
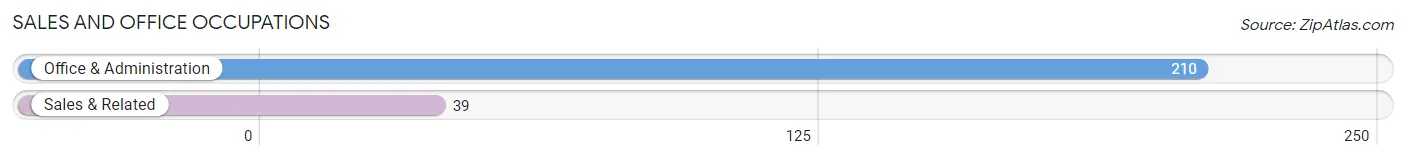
Sales and Office Occupations
The most common Sales and Office occupations in Northwoods are Office & Administration (210 | 18.8%), and Sales & Related (39 | 3.5%).
Sales and Office Occupations by Sex
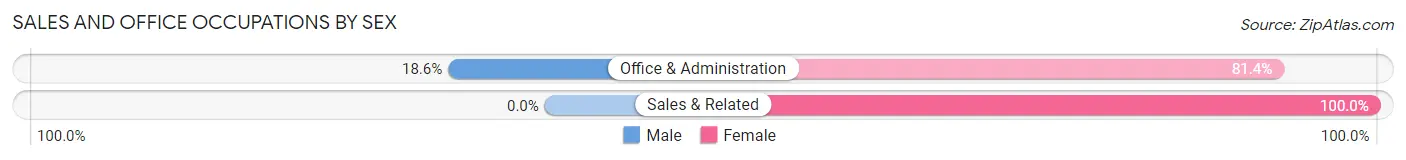
| Occupation | Male | Female |
| Sales & Related | 0 (0.0%) | 39 (100.0%) |
| Office & Administration | 39 (18.6%) | 171 (81.4%) |
| Total (Category) | 39 (15.7%) | 210 (84.3%) |
| Total (Overall) | 491 (43.9%) | 628 (56.1%) |
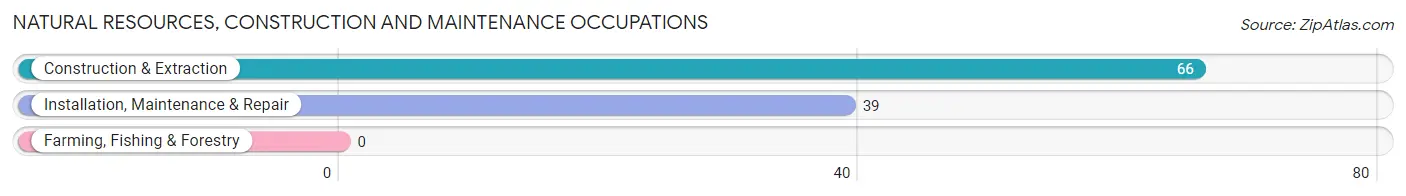
Natural Resources, Construction and Maintenance Occupations
The most common Natural Resources, Construction and Maintenance occupations in Northwoods are Construction & Extraction (66 | 5.9%), and Installation, Maintenance & Repair (39 | 3.5%).
Natural Resources, Construction and Maintenance Occupations by Sex
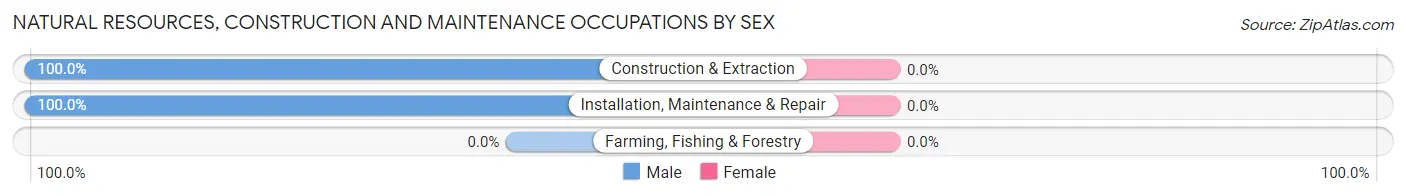
| Occupation | Male | Female |
| Farming, Fishing & Forestry | 0 (0.0%) | 0 (0.0%) |
| Construction & Extraction | 66 (100.0%) | 0 (0.0%) |
| Installation, Maintenance & Repair | 39 (100.0%) | 0 (0.0%) |
| Total (Category) | 105 (100.0%) | 0 (0.0%) |
| Total (Overall) | 491 (43.9%) | 628 (56.1%) |
Production, Transportation and Moving Occupations
The most common Production, Transportation and Moving occupations in Northwoods are Production (56 | 5.0%), Transportation (24 | 2.1%), and Material Moving (13 | 1.2%).
Production, Transportation and Moving Occupations by Sex
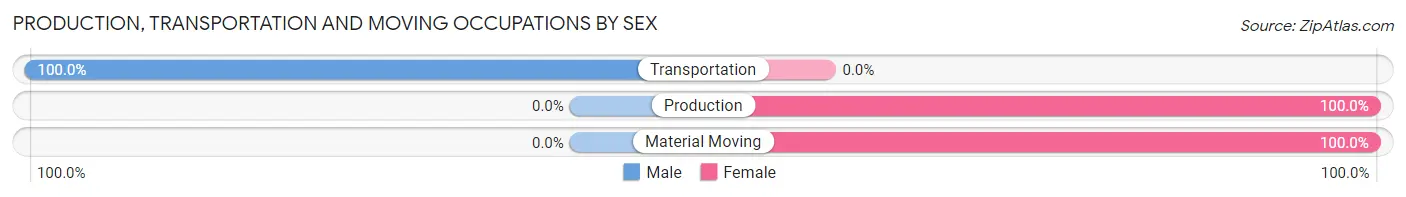
| Occupation | Male | Female |
| Production | 0 (0.0%) | 56 (100.0%) |
| Transportation | 24 (100.0%) | 0 (0.0%) |
| Material Moving | 0 (0.0%) | 13 (100.0%) |
| Total (Category) | 24 (25.8%) | 69 (74.2%) |
| Total (Overall) | 491 (43.9%) | 628 (56.1%) |
Employment Industries by Sex in Northwoods
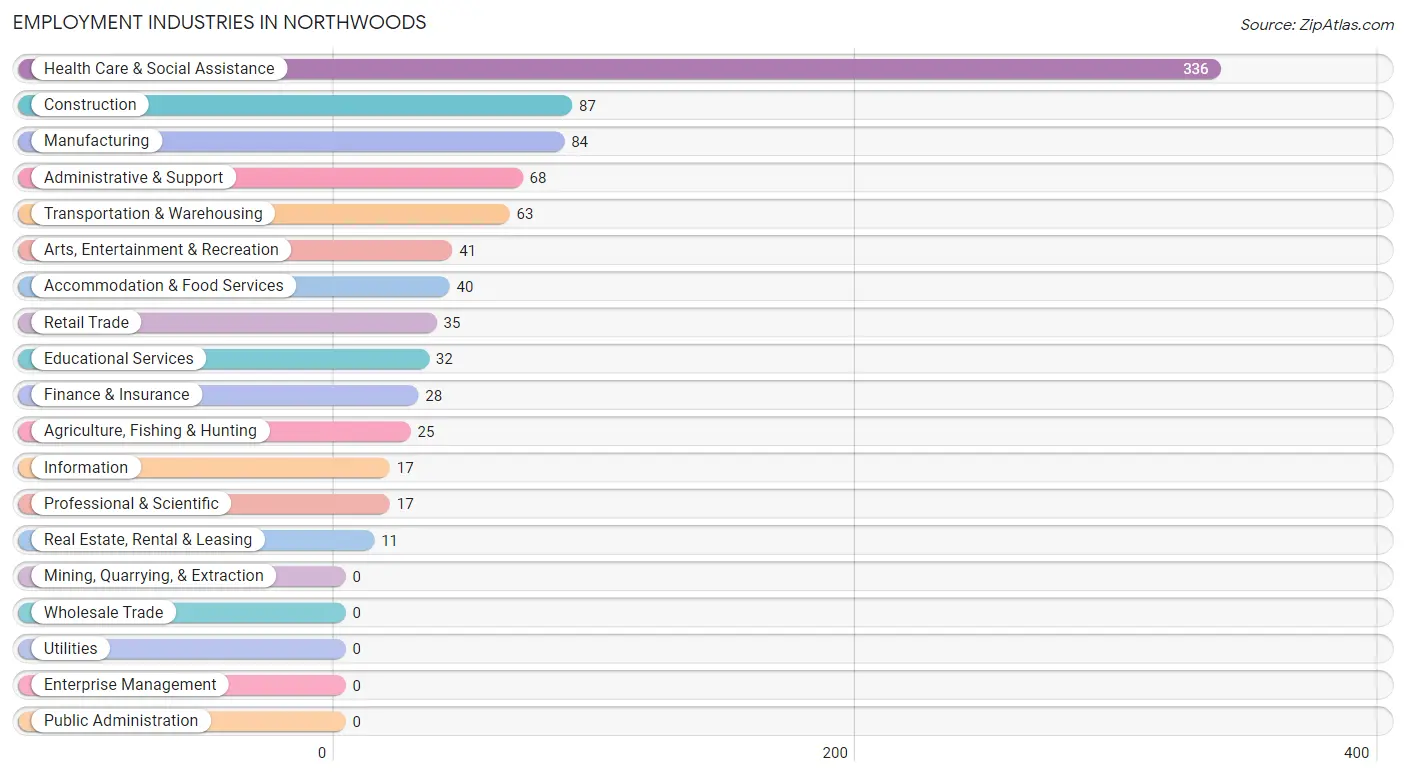
Employment Industries in Northwoods
The major employment industries in Northwoods include Health Care & Social Assistance (336 | 30.0%), Construction (87 | 7.8%), Manufacturing (84 | 7.5%), Administrative & Support (68 | 6.1%), and Transportation & Warehousing (63 | 5.6%).
Employment Industries by Sex in Northwoods
The Northwoods industries that see more men than women are Agriculture, Fishing & Hunting (100.0%), Construction (100.0%), and Transportation & Warehousing (100.0%), whereas the industries that tend to have a higher number of women are Information (100.0%), Finance & Insurance (100.0%), and Real Estate, Rental & Leasing (100.0%).
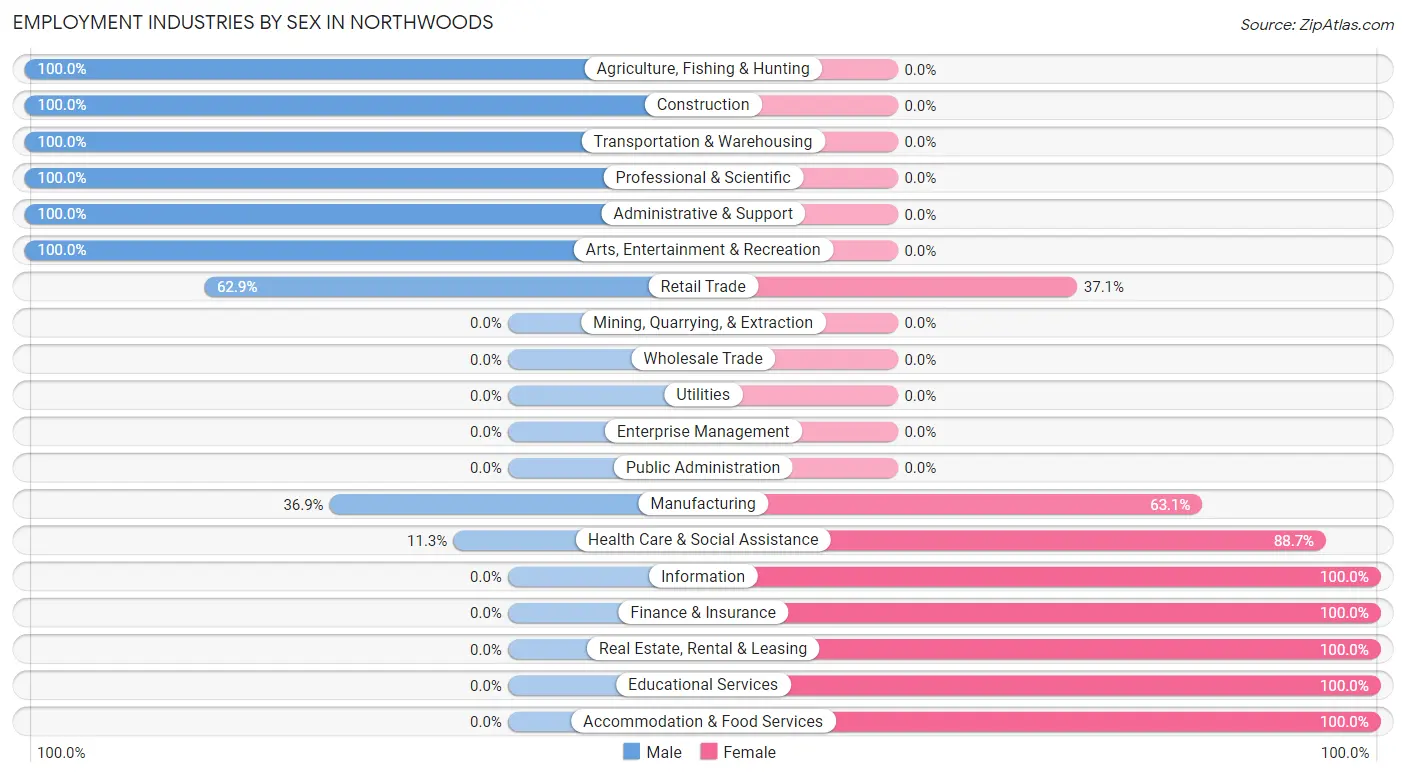
| Industry | Male | Female |
| Agriculture, Fishing & Hunting | 25 (100.0%) | 0 (0.0%) |
| Mining, Quarrying, & Extraction | 0 (0.0%) | 0 (0.0%) |
| Construction | 87 (100.0%) | 0 (0.0%) |
| Manufacturing | 31 (36.9%) | 53 (63.1%) |
| Wholesale Trade | 0 (0.0%) | 0 (0.0%) |
| Retail Trade | 22 (62.9%) | 13 (37.1%) |
| Transportation & Warehousing | 63 (100.0%) | 0 (0.0%) |
| Utilities | 0 (0.0%) | 0 (0.0%) |
| Information | 0 (0.0%) | 17 (100.0%) |
| Finance & Insurance | 0 (0.0%) | 28 (100.0%) |
| Real Estate, Rental & Leasing | 0 (0.0%) | 11 (100.0%) |
| Professional & Scientific | 17 (100.0%) | 0 (0.0%) |
| Enterprise Management | 0 (0.0%) | 0 (0.0%) |
| Administrative & Support | 68 (100.0%) | 0 (0.0%) |
| Educational Services | 0 (0.0%) | 32 (100.0%) |
| Health Care & Social Assistance | 38 (11.3%) | 298 (88.7%) |
| Arts, Entertainment & Recreation | 41 (100.0%) | 0 (0.0%) |
| Accommodation & Food Services | 0 (0.0%) | 40 (100.0%) |
| Public Administration | 0 (0.0%) | 0 (0.0%) |
| Total | 491 (43.9%) | 628 (56.1%) |
Education in Northwoods
School Enrollment in Northwoods
The most common levels of schooling among the 629 students in Northwoods are elementary school (199 | 31.6%), middle school (199 | 31.6%), and college / undergraduate (129 | 20.5%).
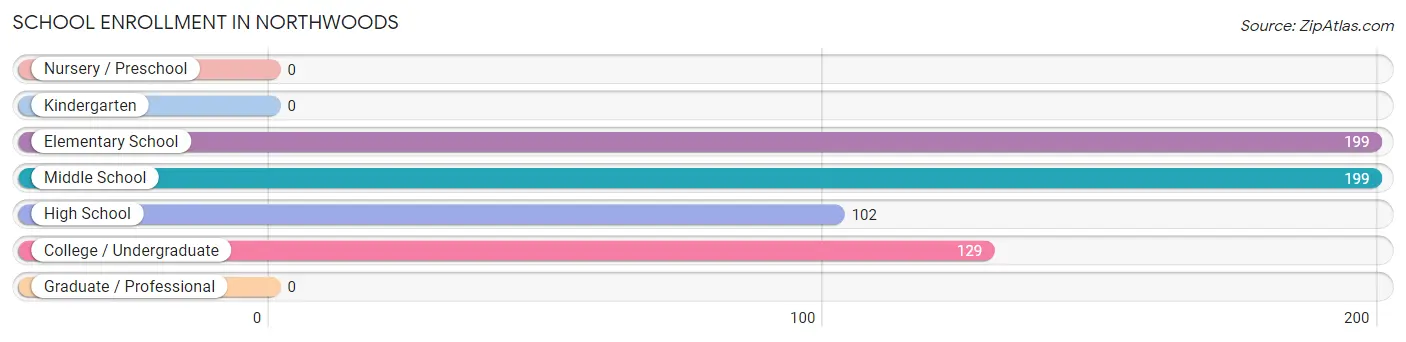
| School Level | # Students | % Students |
| Nursery / Preschool | 0 | 0.0% |
| Kindergarten | 0 | 0.0% |
| Elementary School | 199 | 31.6% |
| Middle School | 199 | 31.6% |
| High School | 102 | 16.2% |
| College / Undergraduate | 129 | 20.5% |
| Graduate / Professional | 0 | 0.0% |
| Total | 629 | 100.0% |
School Enrollment by Age by Funding Source in Northwoods
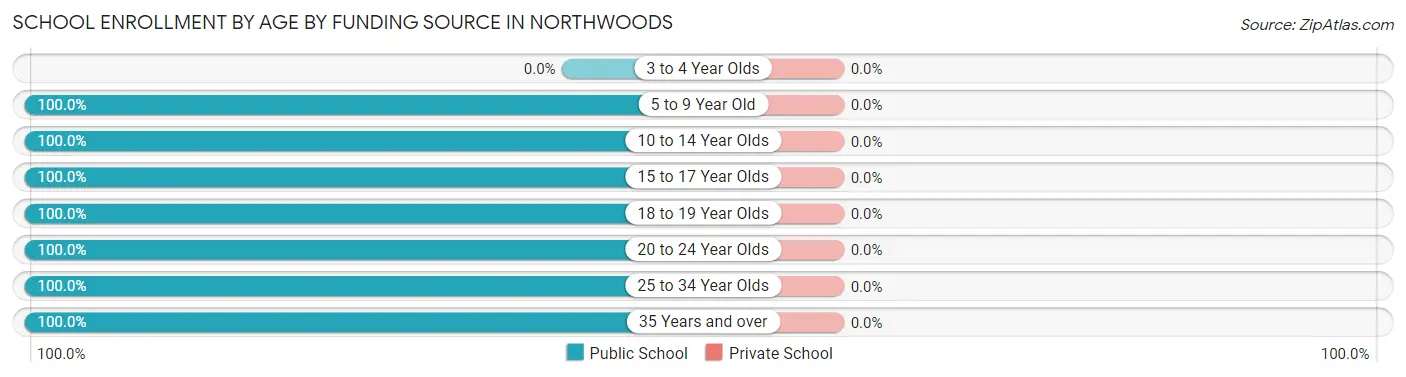
| Age Bracket | Public School | Private School |
| 3 to 4 Year Olds | 0 (0.0%) | 0 (0.0%) |
| 5 to 9 Year Old | 199 (100.0%) | 0 (0.0%) |
| 10 to 14 Year Olds | 199 (100.0%) | 0 (0.0%) |
| 15 to 17 Year Olds | 59 (100.0%) | 0 (0.0%) |
| 18 to 19 Year Olds | 19 (100.0%) | 0 (0.0%) |
| 20 to 24 Year Olds | 41 (100.0%) | 0 (0.0%) |
| 25 to 34 Year Olds | 48 (100.0%) | 0 (0.0%) |
| 35 Years and over | 64 (100.0%) | 0 (0.0%) |
| Total | 629 (100.0%) | 0 (0.0%) |
Educational Attainment by Field of Study in Northwoods
Arts & humanities (106 | 27.2%), education (97 | 24.9%), science & technology (80 | 20.5%), psychology (49 | 12.6%), and business (22 | 5.6%) are the most common fields of study among 390 individuals in Northwoods who have obtained a bachelor's degree or higher.
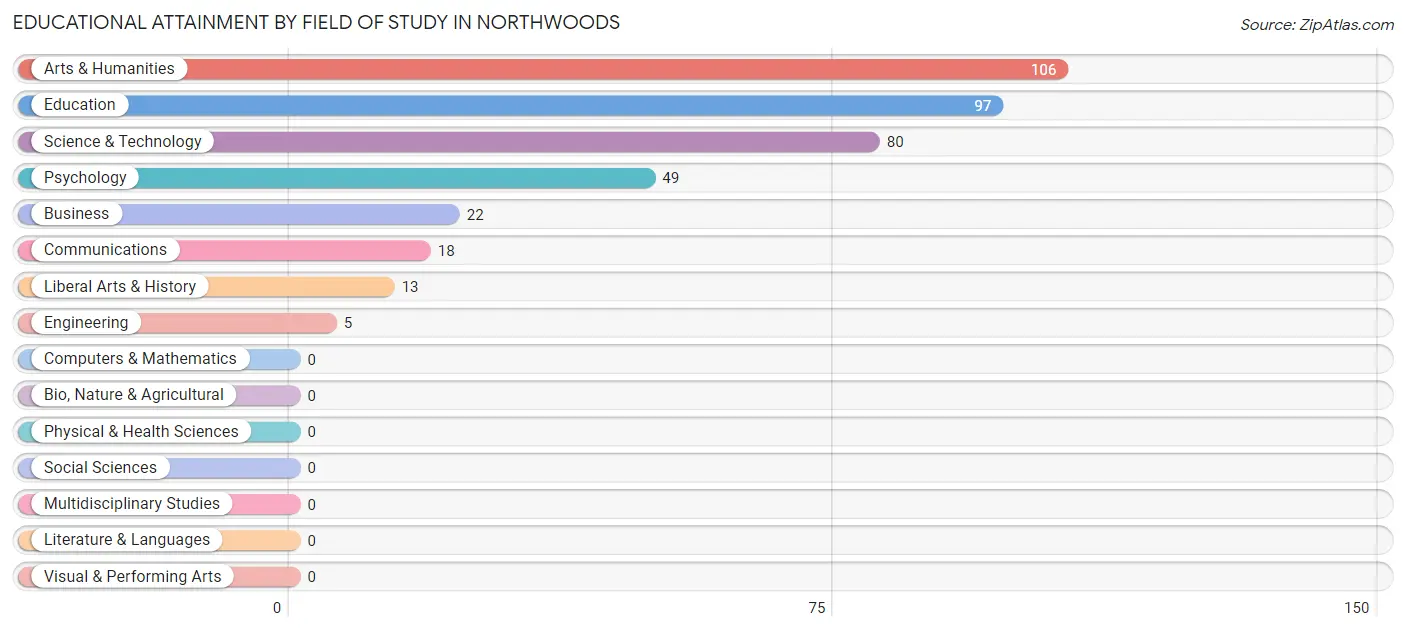
| Field of Study | # Graduates | % Graduates |
| Computers & Mathematics | 0 | 0.0% |
| Bio, Nature & Agricultural | 0 | 0.0% |
| Physical & Health Sciences | 0 | 0.0% |
| Psychology | 49 | 12.6% |
| Social Sciences | 0 | 0.0% |
| Engineering | 5 | 1.3% |
| Multidisciplinary Studies | 0 | 0.0% |
| Science & Technology | 80 | 20.5% |
| Business | 22 | 5.6% |
| Education | 97 | 24.9% |
| Literature & Languages | 0 | 0.0% |
| Liberal Arts & History | 13 | 3.3% |
| Visual & Performing Arts | 0 | 0.0% |
| Communications | 18 | 4.6% |
| Arts & Humanities | 106 | 27.2% |
| Total | 390 | 100.0% |
Transportation & Commute in Northwoods
Vehicle Availability by Sex in Northwoods
The most prevalent vehicle ownership categories in Northwoods are males with 2 vehicles (198, accounting for 40.3%) and females with 2 vehicles (282, making up 31.5%).
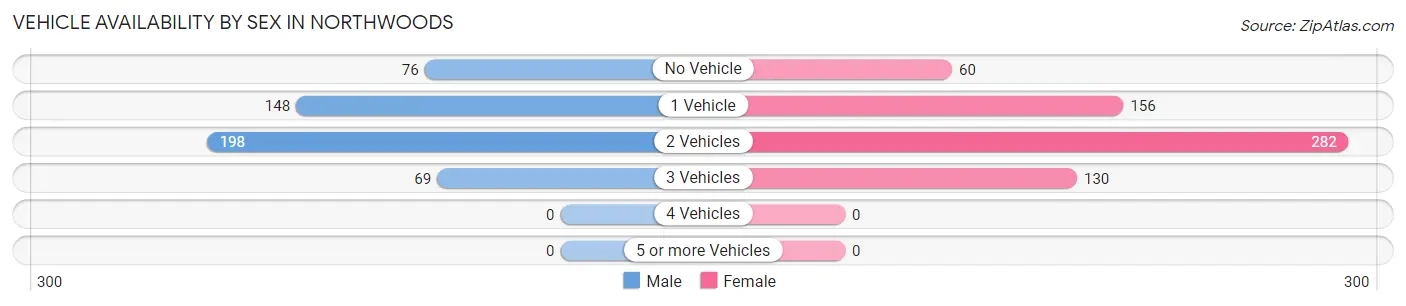
| Vehicles Available | Male | Female |
| No Vehicle | 76 (15.5%) | 60 (9.6%) |
| 1 Vehicle | 148 (30.1%) | 156 (24.8%) |
| 2 Vehicles | 198 (40.3%) | 282 (44.9%) |
| 3 Vehicles | 69 (14.1%) | 130 (20.7%) |
| 4 Vehicles | 0 (0.0%) | 0 (0.0%) |
| 5 or more Vehicles | 0 (0.0%) | 0 (0.0%) |
| Total | 491 (100.0%) | 628 (100.0%) |
Commute Time in Northwoods
The most frequently occuring commute durations in Northwoods are 20 to 24 minutes (332 commuters, 31.6%), 30 to 34 minutes (317 commuters, 30.2%), and 15 to 19 minutes (163 commuters, 15.5%).
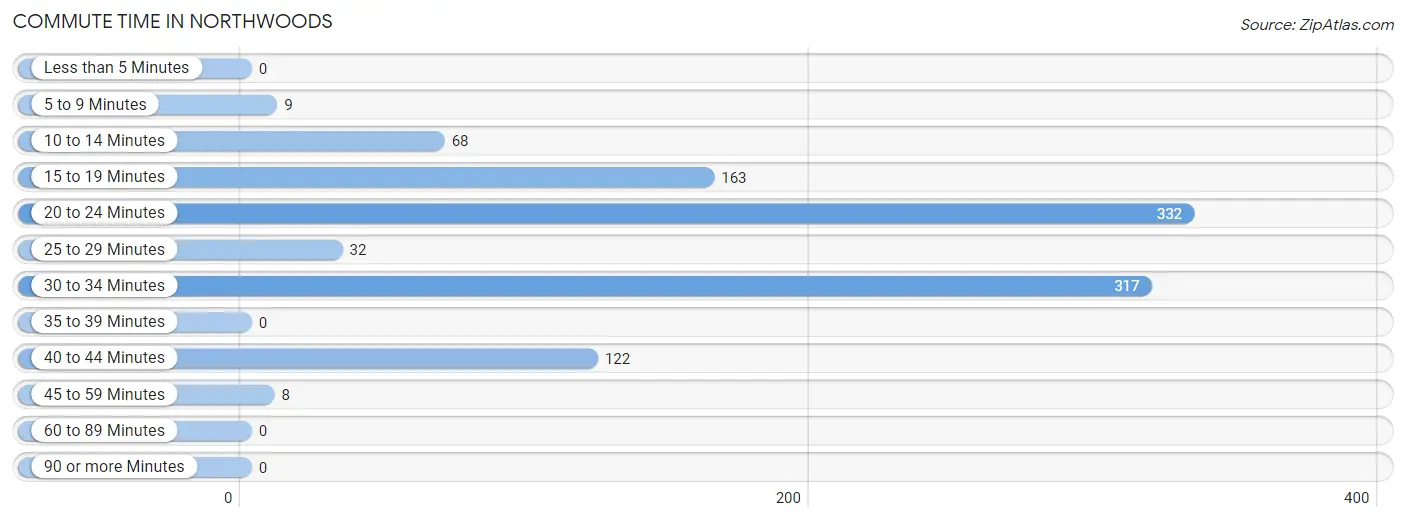
| Commute Time | # Commuters | % Commuters |
| Less than 5 Minutes | 0 | 0.0% |
| 5 to 9 Minutes | 9 | 0.9% |
| 10 to 14 Minutes | 68 | 6.5% |
| 15 to 19 Minutes | 163 | 15.5% |
| 20 to 24 Minutes | 332 | 31.6% |
| 25 to 29 Minutes | 32 | 3.0% |
| 30 to 34 Minutes | 317 | 30.2% |
| 35 to 39 Minutes | 0 | 0.0% |
| 40 to 44 Minutes | 122 | 11.6% |
| 45 to 59 Minutes | 8 | 0.8% |
| 60 to 89 Minutes | 0 | 0.0% |
| 90 or more Minutes | 0 | 0.0% |
Commute Time by Sex in Northwoods
The most common commute times in Northwoods are 30 to 34 minutes (178 commuters, 42.1%) for males and 20 to 24 minutes (285 commuters, 45.4%) for females.
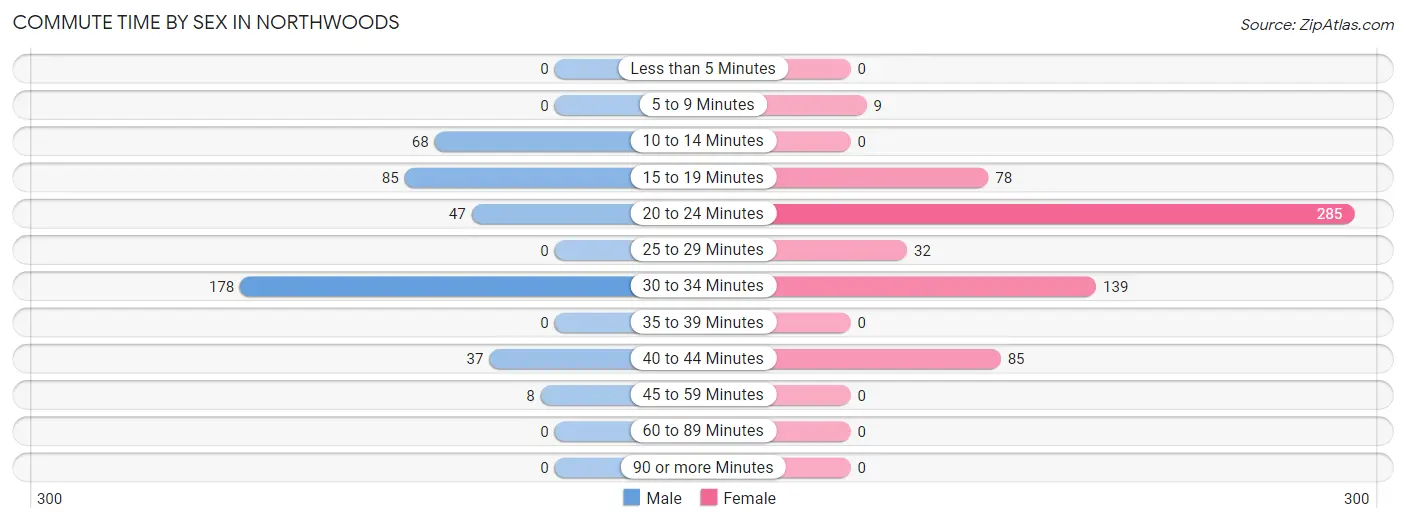
| Commute Time | Male | Female |
| Less than 5 Minutes | 0 (0.0%) | 0 (0.0%) |
| 5 to 9 Minutes | 0 (0.0%) | 9 (1.4%) |
| 10 to 14 Minutes | 68 (16.1%) | 0 (0.0%) |
| 15 to 19 Minutes | 85 (20.1%) | 78 (12.4%) |
| 20 to 24 Minutes | 47 (11.1%) | 285 (45.4%) |
| 25 to 29 Minutes | 0 (0.0%) | 32 (5.1%) |
| 30 to 34 Minutes | 178 (42.1%) | 139 (22.1%) |
| 35 to 39 Minutes | 0 (0.0%) | 0 (0.0%) |
| 40 to 44 Minutes | 37 (8.7%) | 85 (13.5%) |
| 45 to 59 Minutes | 8 (1.9%) | 0 (0.0%) |
| 60 to 89 Minutes | 0 (0.0%) | 0 (0.0%) |
| 90 or more Minutes | 0 (0.0%) | 0 (0.0%) |
Time of Departure to Work by Sex in Northwoods
The most frequent times of departure to work in Northwoods are 10:00 AM to 10:59 AM (113, 26.7%) for males and 7:30 AM to 7:59 AM (372, 59.2%) for females.
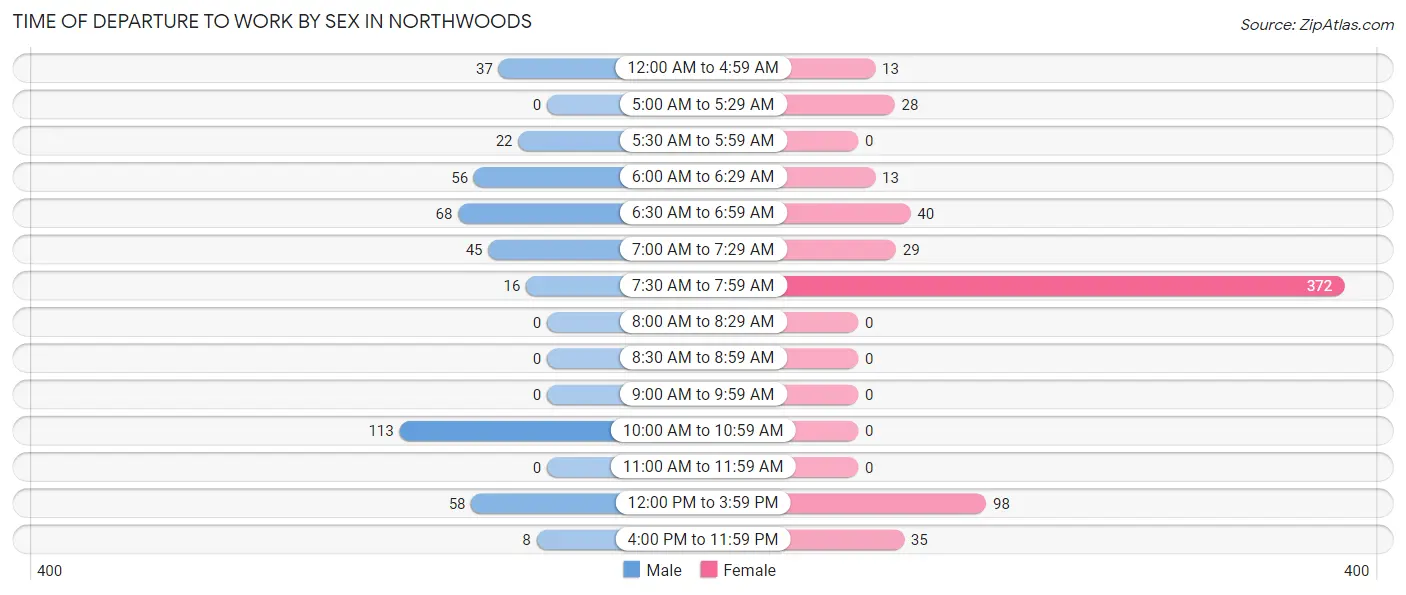
| Time of Departure | Male | Female |
| 12:00 AM to 4:59 AM | 37 (8.7%) | 13 (2.1%) |
| 5:00 AM to 5:29 AM | 0 (0.0%) | 28 (4.5%) |
| 5:30 AM to 5:59 AM | 22 (5.2%) | 0 (0.0%) |
| 6:00 AM to 6:29 AM | 56 (13.2%) | 13 (2.1%) |
| 6:30 AM to 6:59 AM | 68 (16.1%) | 40 (6.4%) |
| 7:00 AM to 7:29 AM | 45 (10.6%) | 29 (4.6%) |
| 7:30 AM to 7:59 AM | 16 (3.8%) | 372 (59.2%) |
| 8:00 AM to 8:29 AM | 0 (0.0%) | 0 (0.0%) |
| 8:30 AM to 8:59 AM | 0 (0.0%) | 0 (0.0%) |
| 9:00 AM to 9:59 AM | 0 (0.0%) | 0 (0.0%) |
| 10:00 AM to 10:59 AM | 113 (26.7%) | 0 (0.0%) |
| 11:00 AM to 11:59 AM | 0 (0.0%) | 0 (0.0%) |
| 12:00 PM to 3:59 PM | 58 (13.7%) | 98 (15.6%) |
| 4:00 PM to 11:59 PM | 8 (1.9%) | 35 (5.6%) |
| Total | 423 (100.0%) | 628 (100.0%) |
Housing Occupancy in Northwoods
Occupancy by Ownership in Northwoods
Of the total 1,896 dwellings in Northwoods, owner-occupied units account for 1,427 (75.3%), while renter-occupied units make up 469 (24.7%).
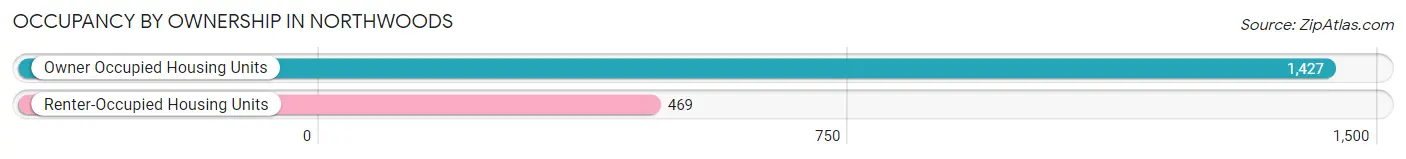
| Occupancy | # Housing Units | % Housing Units |
| Owner Occupied Housing Units | 1,427 | 75.3% |
| Renter-Occupied Housing Units | 469 | 24.7% |
| Total Occupied Housing Units | 1,896 | 100.0% |
Occupancy by Household Size in Northwoods
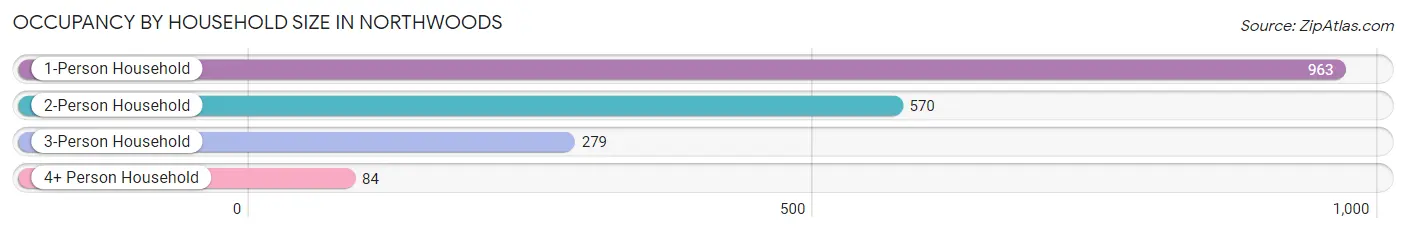
| Household Size | # Housing Units | % Housing Units |
| 1-Person Household | 963 | 50.8% |
| 2-Person Household | 570 | 30.1% |
| 3-Person Household | 279 | 14.7% |
| 4+ Person Household | 84 | 4.4% |
| Total Housing Units | 1,896 | 100.0% |
Occupancy by Ownership by Household Size in Northwoods
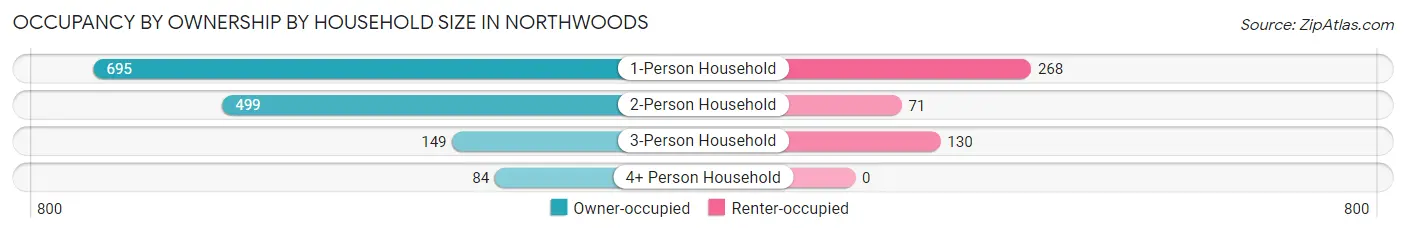
| Household Size | Owner-occupied | Renter-occupied |
| 1-Person Household | 695 (72.2%) | 268 (27.8%) |
| 2-Person Household | 499 (87.5%) | 71 (12.5%) |
| 3-Person Household | 149 (53.4%) | 130 (46.6%) |
| 4+ Person Household | 84 (100.0%) | 0 (0.0%) |
| Total Housing Units | 1,427 (75.3%) | 469 (24.7%) |
Occupancy by Educational Attainment in Northwoods
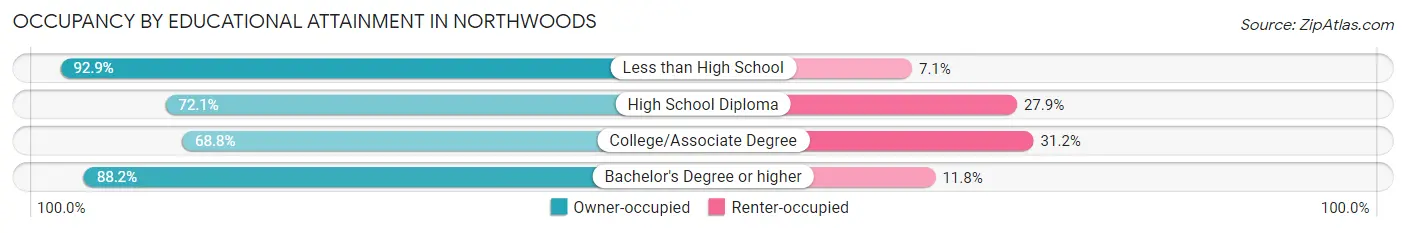
| Household Size | Owner-occupied | Renter-occupied |
| Less than High School | 183 (92.9%) | 14 (7.1%) |
| High School Diploma | 493 (72.1%) | 191 (27.9%) |
| College/Associate Degree | 511 (68.8%) | 232 (31.2%) |
| Bachelor's Degree or higher | 240 (88.2%) | 32 (11.8%) |
Occupancy by Age of Householder in Northwoods
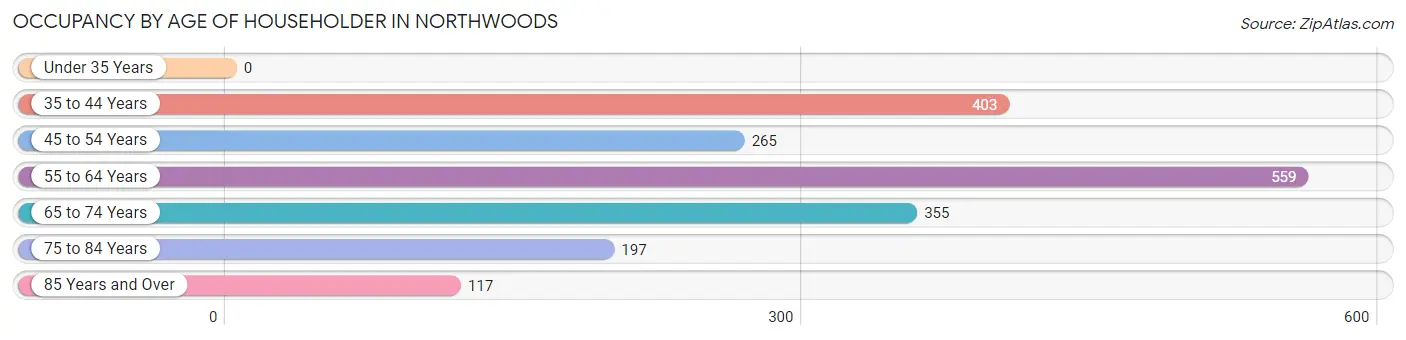
| Age Bracket | # Households | % Households |
| Under 35 Years | 0 | 0.0% |
| 35 to 44 Years | 403 | 21.3% |
| 45 to 54 Years | 265 | 14.0% |
| 55 to 64 Years | 559 | 29.5% |
| 65 to 74 Years | 355 | 18.7% |
| 75 to 84 Years | 197 | 10.4% |
| 85 Years and Over | 117 | 6.2% |
| Total | 1,896 | 100.0% |
Housing Finances in Northwoods
Median Income by Occupancy in Northwoods
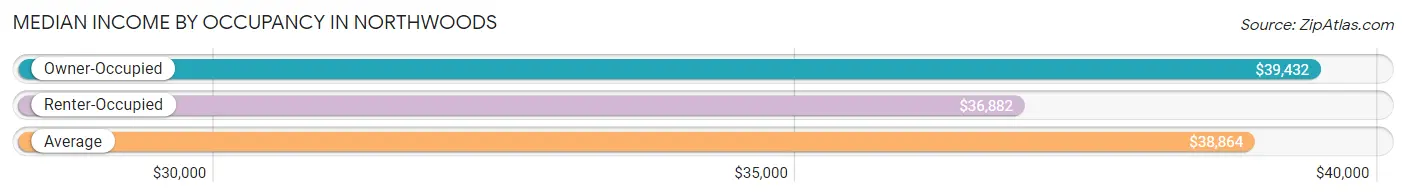
| Occupancy Type | # Households | Median Income |
| Owner-Occupied | 1,427 (75.3%) | $39,432 |
| Renter-Occupied | 469 (24.7%) | $36,882 |
| Average | 1,896 (100.0%) | $38,864 |
Occupancy by Householder Income Bracket in Northwoods
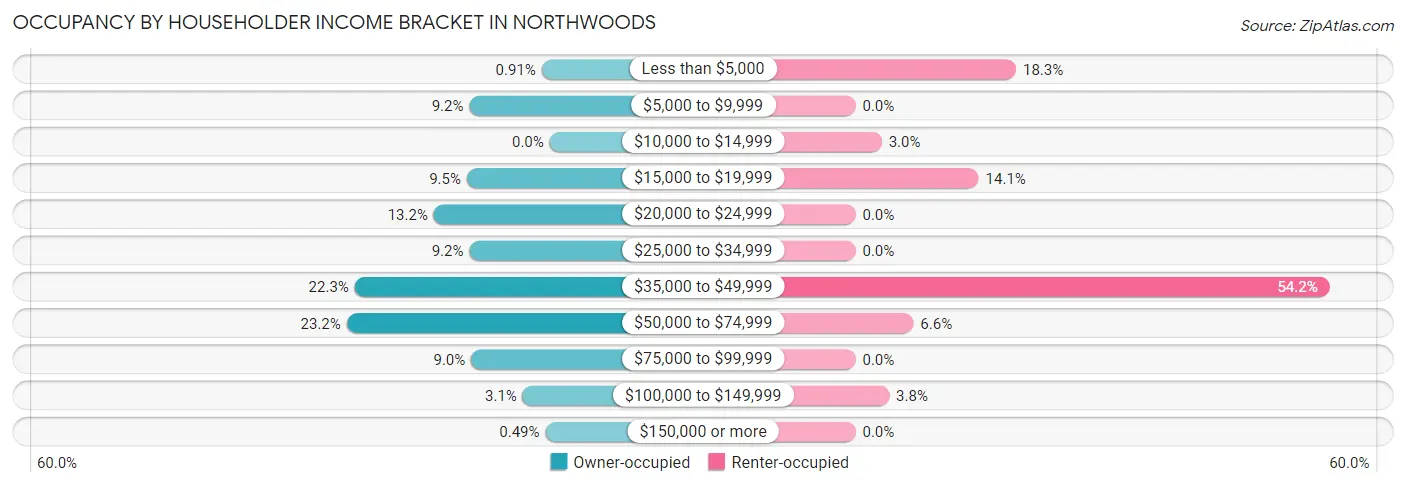
| Income Bracket | Owner-occupied | Renter-occupied |
| Less than $5,000 | 13 (0.9%) | 86 (18.3%) |
| $5,000 to $9,999 | 131 (9.2%) | 0 (0.0%) |
| $10,000 to $14,999 | 0 (0.0%) | 14 (3.0%) |
| $15,000 to $19,999 | 135 (9.5%) | 66 (14.1%) |
| $20,000 to $24,999 | 189 (13.2%) | 0 (0.0%) |
| $25,000 to $34,999 | 131 (9.2%) | 0 (0.0%) |
| $35,000 to $49,999 | 318 (22.3%) | 254 (54.2%) |
| $50,000 to $74,999 | 331 (23.2%) | 31 (6.6%) |
| $75,000 to $99,999 | 128 (9.0%) | 0 (0.0%) |
| $100,000 to $149,999 | 44 (3.1%) | 18 (3.8%) |
| $150,000 or more | 7 (0.5%) | 0 (0.0%) |
| Total | 1,427 (100.0%) | 469 (100.0%) |
Monthly Housing Cost Tiers in Northwoods
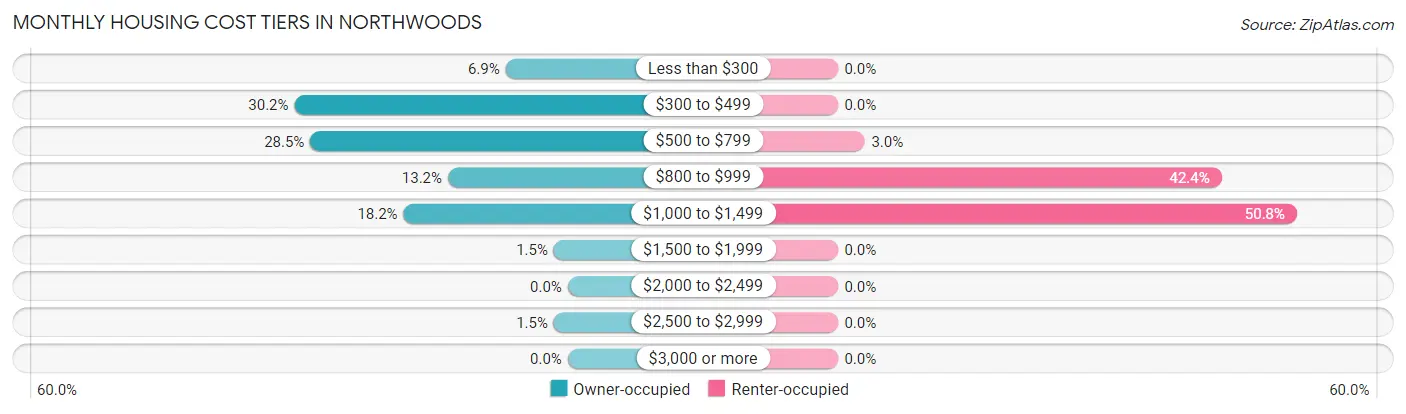
| Monthly Cost | Owner-occupied | Renter-occupied |
| Less than $300 | 98 (6.9%) | 0 (0.0%) |
| $300 to $499 | 431 (30.2%) | 0 (0.0%) |
| $500 to $799 | 406 (28.4%) | 14 (3.0%) |
| $800 to $999 | 189 (13.2%) | 199 (42.4%) |
| $1,000 to $1,499 | 259 (18.1%) | 238 (50.7%) |
| $1,500 to $1,999 | 22 (1.5%) | 0 (0.0%) |
| $2,000 to $2,499 | 0 (0.0%) | 0 (0.0%) |
| $2,500 to $2,999 | 22 (1.5%) | 0 (0.0%) |
| $3,000 or more | 0 (0.0%) | 0 (0.0%) |
| Total | 1,427 (100.0%) | 469 (100.0%) |
Physical Housing Characteristics in Northwoods
Housing Structures in Northwoods
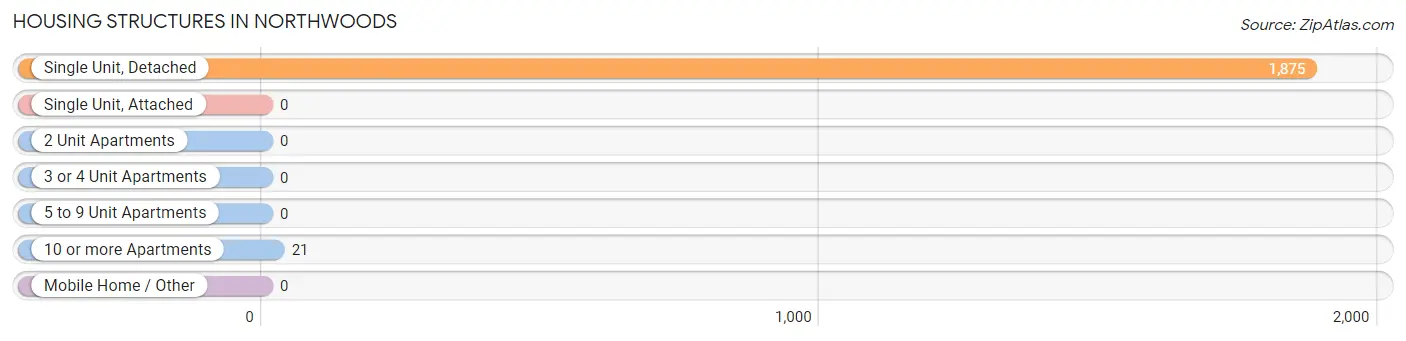
| Structure Type | # Housing Units | % Housing Units |
| Single Unit, Detached | 1,875 | 98.9% |
| Single Unit, Attached | 0 | 0.0% |
| 2 Unit Apartments | 0 | 0.0% |
| 3 or 4 Unit Apartments | 0 | 0.0% |
| 5 to 9 Unit Apartments | 0 | 0.0% |
| 10 or more Apartments | 21 | 1.1% |
| Mobile Home / Other | 0 | 0.0% |
| Total | 1,896 | 100.0% |
Housing Structures by Occupancy in Northwoods
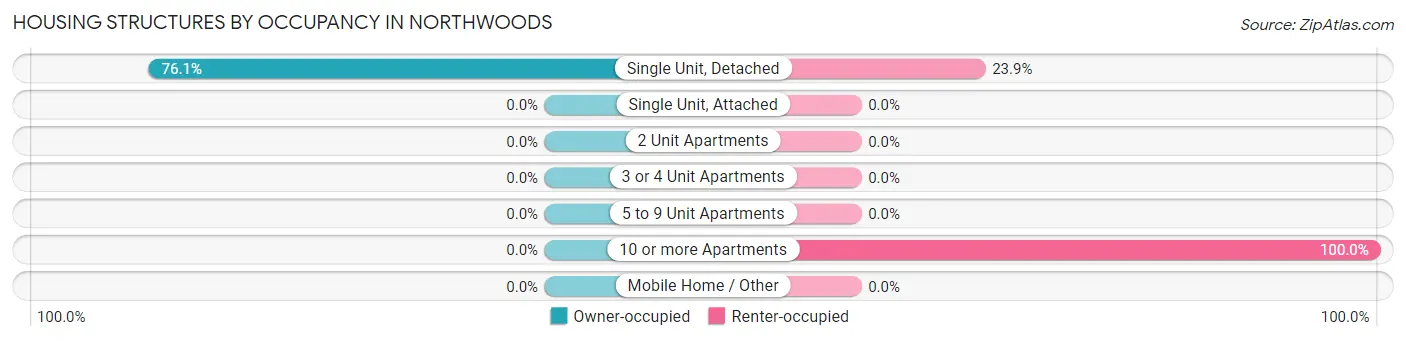
| Structure Type | Owner-occupied | Renter-occupied |
| Single Unit, Detached | 1,427 (76.1%) | 448 (23.9%) |
| Single Unit, Attached | 0 (0.0%) | 0 (0.0%) |
| 2 Unit Apartments | 0 (0.0%) | 0 (0.0%) |
| 3 or 4 Unit Apartments | 0 (0.0%) | 0 (0.0%) |
| 5 to 9 Unit Apartments | 0 (0.0%) | 0 (0.0%) |
| 10 or more Apartments | 0 (0.0%) | 21 (100.0%) |
| Mobile Home / Other | 0 (0.0%) | 0 (0.0%) |
| Total | 1,427 (75.3%) | 469 (24.7%) |
Housing Structures by Number of Rooms in Northwoods
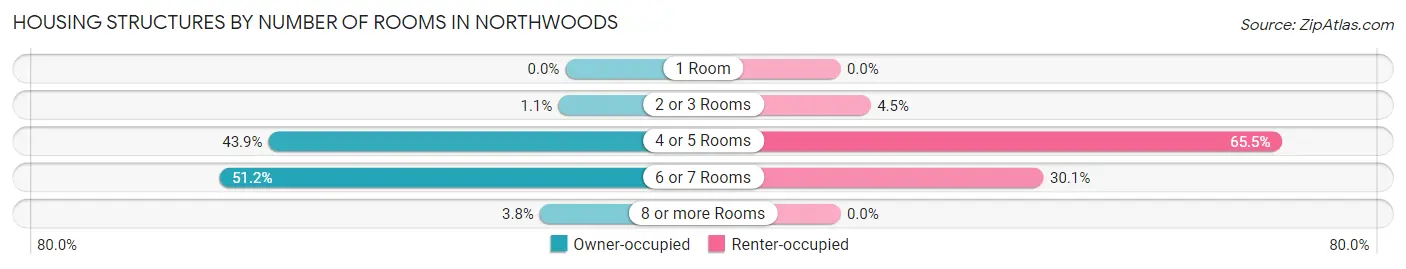
| Number of Rooms | Owner-occupied | Renter-occupied |
| 1 Room | 0 (0.0%) | 0 (0.0%) |
| 2 or 3 Rooms | 15 (1.1%) | 21 (4.5%) |
| 4 or 5 Rooms | 627 (43.9%) | 307 (65.5%) |
| 6 or 7 Rooms | 731 (51.2%) | 141 (30.1%) |
| 8 or more Rooms | 54 (3.8%) | 0 (0.0%) |
| Total | 1,427 (100.0%) | 469 (100.0%) |
Housing Structure by Heating Type in Northwoods
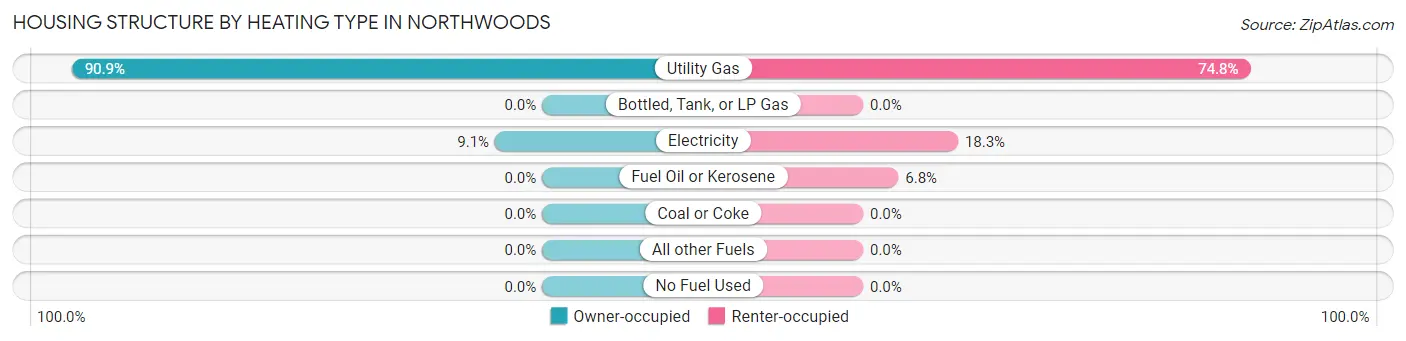
| Heating Type | Owner-occupied | Renter-occupied |
| Utility Gas | 1,297 (90.9%) | 351 (74.8%) |
| Bottled, Tank, or LP Gas | 0 (0.0%) | 0 (0.0%) |
| Electricity | 130 (9.1%) | 86 (18.3%) |
| Fuel Oil or Kerosene | 0 (0.0%) | 32 (6.8%) |
| Coal or Coke | 0 (0.0%) | 0 (0.0%) |
| All other Fuels | 0 (0.0%) | 0 (0.0%) |
| No Fuel Used | 0 (0.0%) | 0 (0.0%) |
| Total | 1,427 (100.0%) | 469 (100.0%) |
Household Vehicle Usage in Northwoods
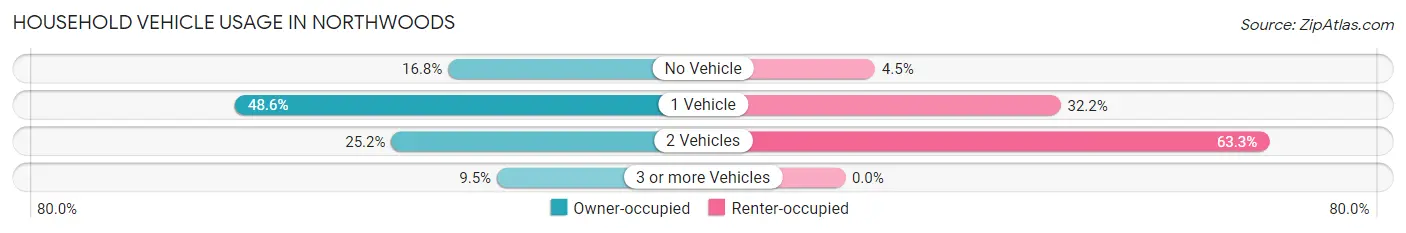
| Vehicles per Household | Owner-occupied | Renter-occupied |
| No Vehicle | 239 (16.8%) | 21 (4.5%) |
| 1 Vehicle | 693 (48.6%) | 151 (32.2%) |
| 2 Vehicles | 360 (25.2%) | 297 (63.3%) |
| 3 or more Vehicles | 135 (9.5%) | 0 (0.0%) |
| Total | 1,427 (100.0%) | 469 (100.0%) |
Real Estate & Mortgages in Northwoods
Real Estate and Mortgage Overview in Northwoods
| Characteristic | Without Mortgage | With Mortgage |
| Housing Units | 782 | 645 |
| Median Property Value | $56,000 | $82,500 |
| Median Household Income | $29,198 | $7 |
| Monthly Housing Costs | $426 | $0 |
| Real Estate Taxes | $1,324 | $0 |
Property Value by Mortgage Status in Northwoods
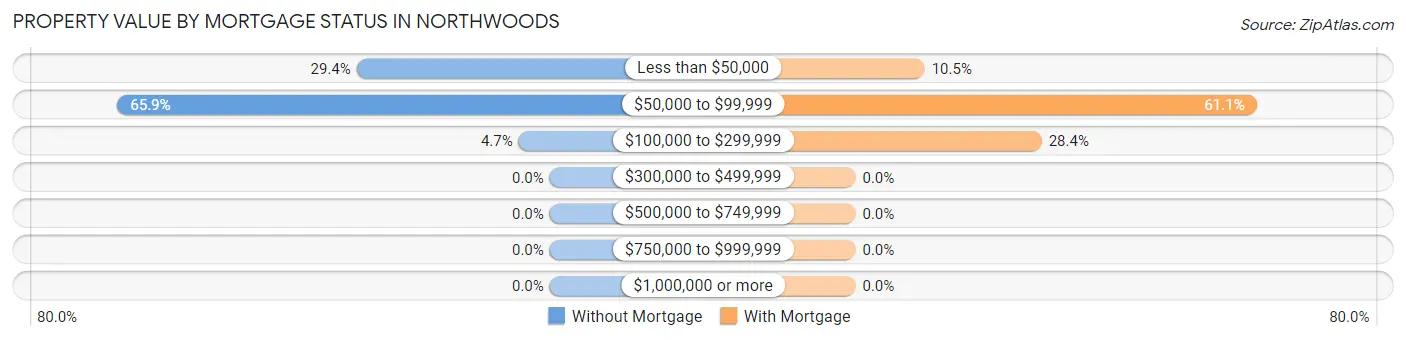
| Property Value | Without Mortgage | With Mortgage |
| Less than $50,000 | 230 (29.4%) | 68 (10.5%) |
| $50,000 to $99,999 | 515 (65.9%) | 394 (61.1%) |
| $100,000 to $299,999 | 37 (4.7%) | 183 (28.4%) |
| $300,000 to $499,999 | 0 (0.0%) | 0 (0.0%) |
| $500,000 to $749,999 | 0 (0.0%) | 0 (0.0%) |
| $750,000 to $999,999 | 0 (0.0%) | 0 (0.0%) |
| $1,000,000 or more | 0 (0.0%) | 0 (0.0%) |
| Total | 782 (100.0%) | 645 (100.0%) |
Household Income by Mortgage Status in Northwoods
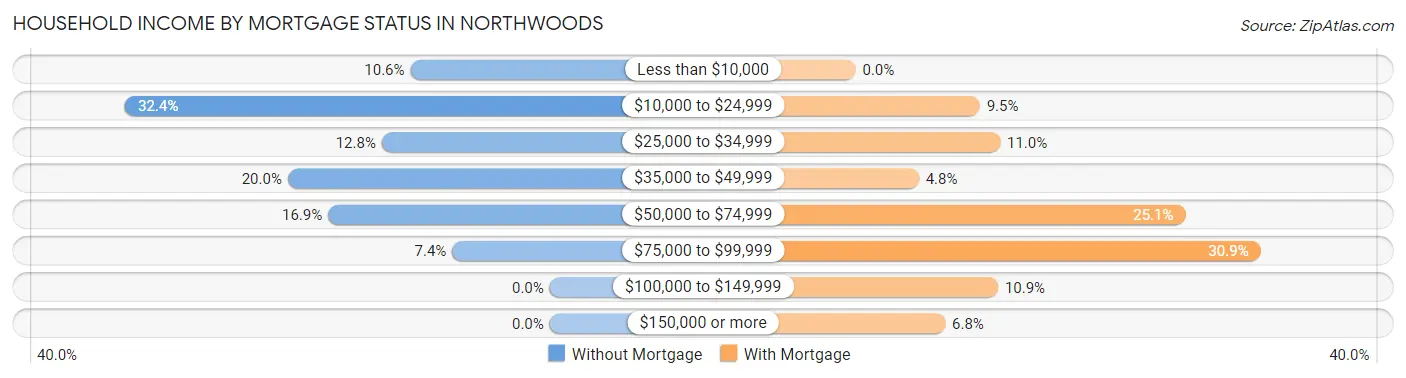
| Household Income | Without Mortgage | With Mortgage |
| Less than $10,000 | 83 (10.6%) | 0 (0.0%) |
| $10,000 to $24,999 | 253 (32.4%) | 61 (9.5%) |
| $25,000 to $34,999 | 100 (12.8%) | 71 (11.0%) |
| $35,000 to $49,999 | 156 (20.0%) | 31 (4.8%) |
| $50,000 to $74,999 | 132 (16.9%) | 162 (25.1%) |
| $75,000 to $99,999 | 58 (7.4%) | 199 (30.8%) |
| $100,000 to $149,999 | 0 (0.0%) | 70 (10.8%) |
| $150,000 or more | 0 (0.0%) | 44 (6.8%) |
| Total | 782 (100.0%) | 645 (100.0%) |
Property Value to Household Income Ratio in Northwoods
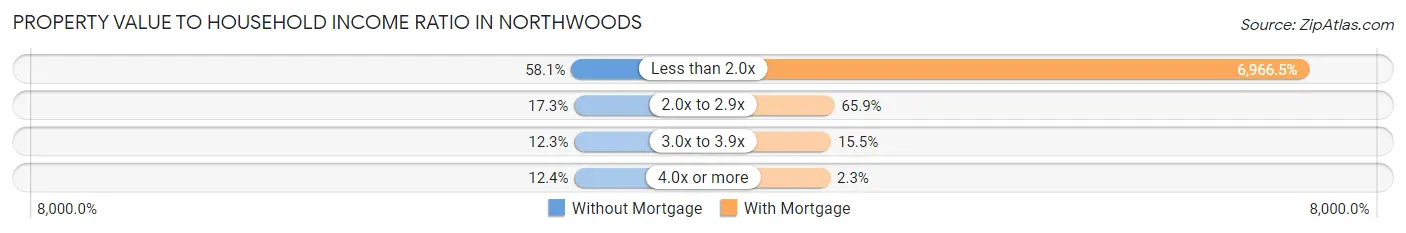
| Value-to-Income Ratio | Without Mortgage | With Mortgage |
| Less than 2.0x | 454 (58.1%) | 44,934 (6,966.5%) |
| 2.0x to 2.9x | 135 (17.3%) | 425 (65.9%) |
| 3.0x to 3.9x | 96 (12.3%) | 100 (15.5%) |
| 4.0x or more | 97 (12.4%) | 15 (2.3%) |
| Total | 782 (100.0%) | 645 (100.0%) |
Real Estate Taxes by Mortgage Status in Northwoods
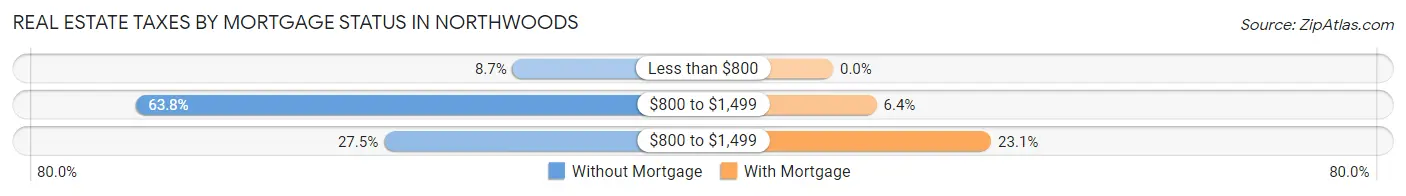
| Property Taxes | Without Mortgage | With Mortgage |
| Less than $800 | 68 (8.7%) | 0 (0.0%) |
| $800 to $1,499 | 499 (63.8%) | 41 (6.4%) |
| $800 to $1,499 | 215 (27.5%) | 149 (23.1%) |
| Total | 782 (100.0%) | 645 (100.0%) |
Health & Disability in Northwoods
Health Insurance Coverage by Age in Northwoods
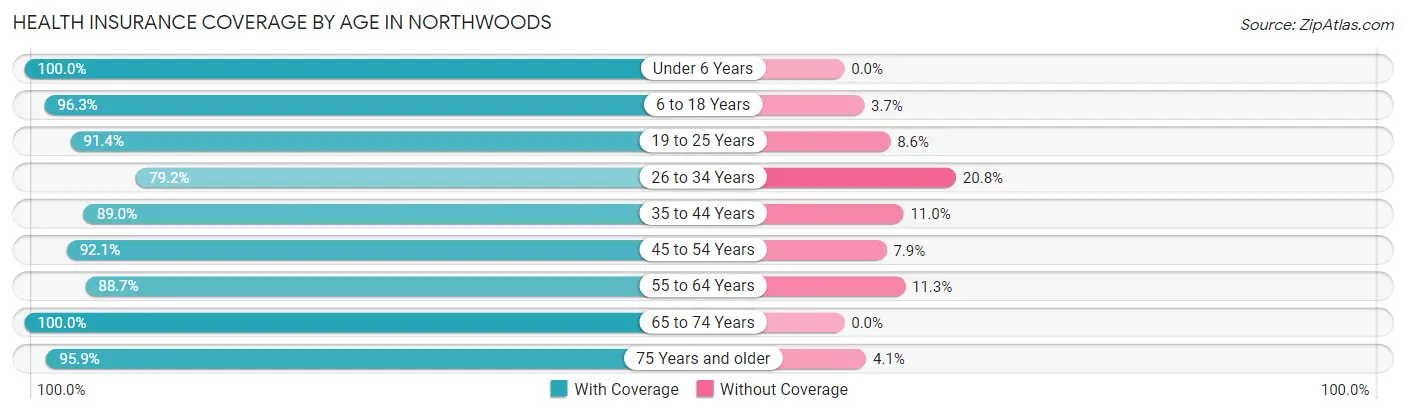
| Age Bracket | With Coverage | Without Coverage |
| Under 6 Years | 92 (100.0%) | 0 (0.0%) |
| 6 to 18 Years | 494 (96.3%) | 19 (3.7%) |
| 19 to 25 Years | 128 (91.4%) | 12 (8.6%) |
| 26 to 34 Years | 137 (79.2%) | 36 (20.8%) |
| 35 to 44 Years | 427 (89.0%) | 53 (11.0%) |
| 45 to 54 Years | 340 (92.1%) | 29 (7.9%) |
| 55 to 64 Years | 658 (88.7%) | 84 (11.3%) |
| 65 to 74 Years | 582 (100.0%) | 0 (0.0%) |
| 75 Years and older | 471 (95.9%) | 20 (4.1%) |
| Total | 3,329 (92.9%) | 253 (7.1%) |
Health Insurance Coverage by Citizenship Status in Northwoods
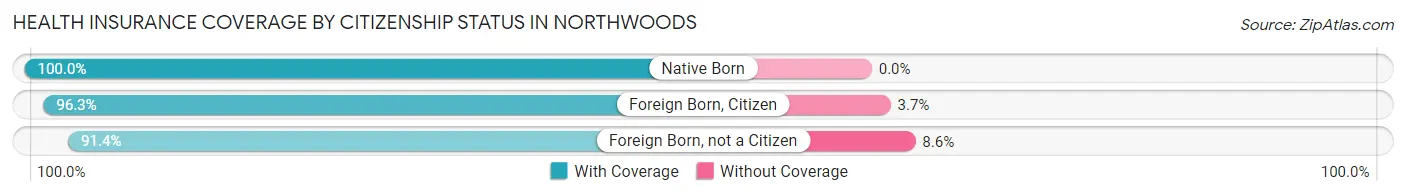
| Citizenship Status | With Coverage | Without Coverage |
| Native Born | 92 (100.0%) | 0 (0.0%) |
| Foreign Born, Citizen | 494 (96.3%) | 19 (3.7%) |
| Foreign Born, not a Citizen | 128 (91.4%) | 12 (8.6%) |
Health Insurance Coverage by Household Income in Northwoods
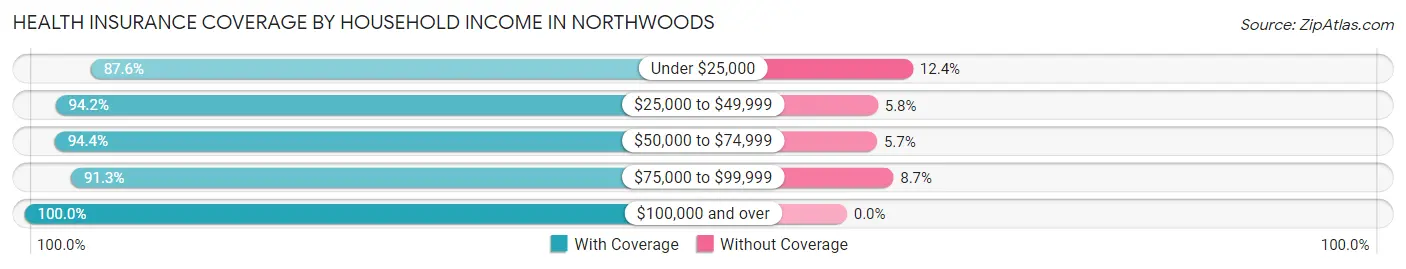
| Household Income | With Coverage | Without Coverage |
| Under $25,000 | 622 (87.6%) | 88 (12.4%) |
| $25,000 to $49,999 | 1,314 (94.2%) | 81 (5.8%) |
| $50,000 to $74,999 | 918 (94.4%) | 55 (5.7%) |
| $75,000 to $99,999 | 304 (91.3%) | 29 (8.7%) |
| $100,000 and over | 171 (100.0%) | 0 (0.0%) |
Public vs Private Health Insurance Coverage by Age in Northwoods
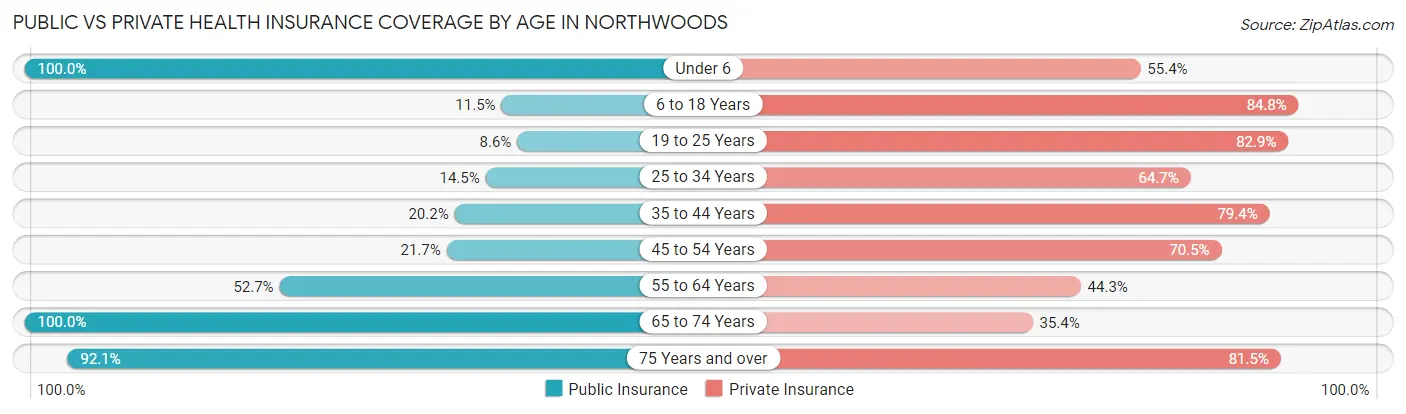
| Age Bracket | Public Insurance | Private Insurance |
| Under 6 | 92 (100.0%) | 51 (55.4%) |
| 6 to 18 Years | 59 (11.5%) | 435 (84.8%) |
| 19 to 25 Years | 12 (8.6%) | 116 (82.9%) |
| 25 to 34 Years | 25 (14.4%) | 112 (64.7%) |
| 35 to 44 Years | 97 (20.2%) | 381 (79.4%) |
| 45 to 54 Years | 80 (21.7%) | 260 (70.5%) |
| 55 to 64 Years | 391 (52.7%) | 329 (44.3%) |
| 65 to 74 Years | 582 (100.0%) | 206 (35.4%) |
| 75 Years and over | 452 (92.1%) | 400 (81.5%) |
| Total | 1,790 (50.0%) | 2,290 (63.9%) |
Disability Status by Sex by Age in Northwoods
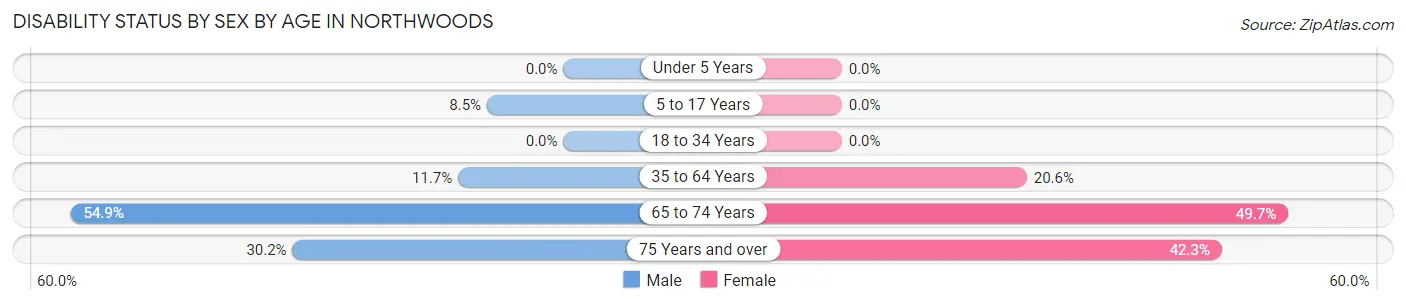
| Age Bracket | Male | Female |
| Under 5 Years | 0 (0.0%) | 0 (0.0%) |
| 5 to 17 Years | 24 (8.5%) | 0 (0.0%) |
| 18 to 34 Years | 0 (0.0%) | 0 (0.0%) |
| 35 to 64 Years | 100 (11.7%) | 152 (20.6%) |
| 65 to 74 Years | 135 (54.9%) | 167 (49.7%) |
| 75 Years and over | 54 (30.2%) | 132 (42.3%) |
Disability Class by Sex by Age in Northwoods
Disability Class: Hearing Difficulty
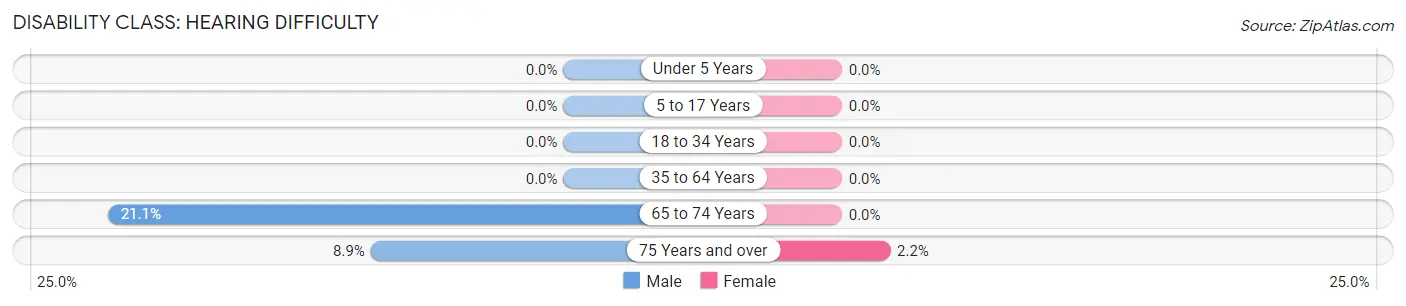
| Age Bracket | Male | Female |
| Under 5 Years | 0 (0.0%) | 0 (0.0%) |
| 5 to 17 Years | 0 (0.0%) | 0 (0.0%) |
| 18 to 34 Years | 0 (0.0%) | 0 (0.0%) |
| 35 to 64 Years | 0 (0.0%) | 0 (0.0%) |
| 65 to 74 Years | 52 (21.1%) | 0 (0.0%) |
| 75 Years and over | 16 (8.9%) | 7 (2.2%) |
Disability Class: Vision Difficulty
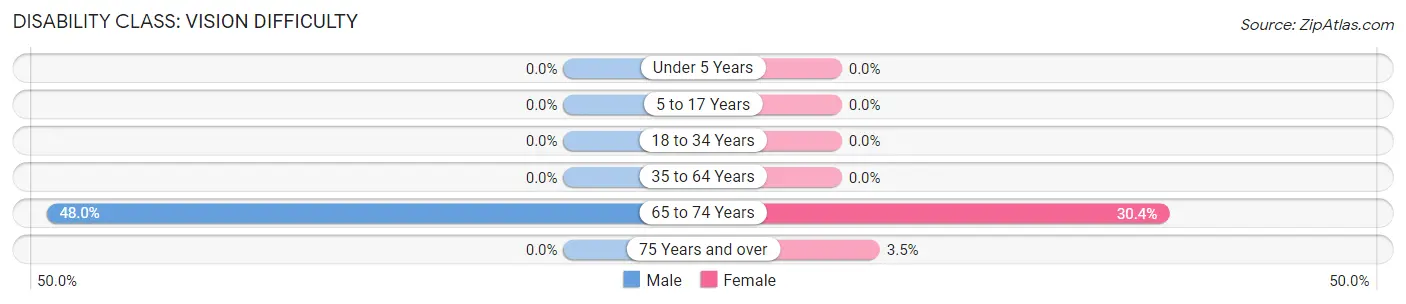
| Age Bracket | Male | Female |
| Under 5 Years | 0 (0.0%) | 0 (0.0%) |
| 5 to 17 Years | 0 (0.0%) | 0 (0.0%) |
| 18 to 34 Years | 0 (0.0%) | 0 (0.0%) |
| 35 to 64 Years | 0 (0.0%) | 0 (0.0%) |
| 65 to 74 Years | 118 (48.0%) | 102 (30.4%) |
| 75 Years and over | 0 (0.0%) | 11 (3.5%) |
Disability Class: Cognitive Difficulty
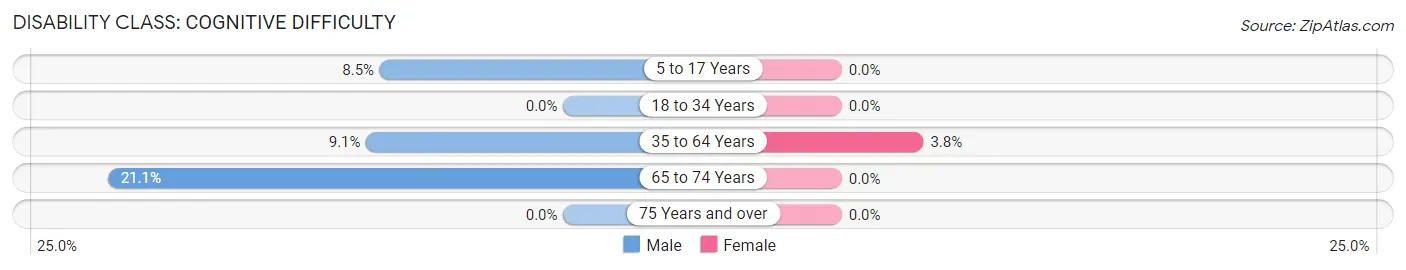
| Age Bracket | Male | Female |
| 5 to 17 Years | 24 (8.5%) | 0 (0.0%) |
| 18 to 34 Years | 0 (0.0%) | 0 (0.0%) |
| 35 to 64 Years | 78 (9.1%) | 28 (3.8%) |
| 65 to 74 Years | 52 (21.1%) | 0 (0.0%) |
| 75 Years and over | 0 (0.0%) | 0 (0.0%) |
Disability Class: Ambulatory Difficulty
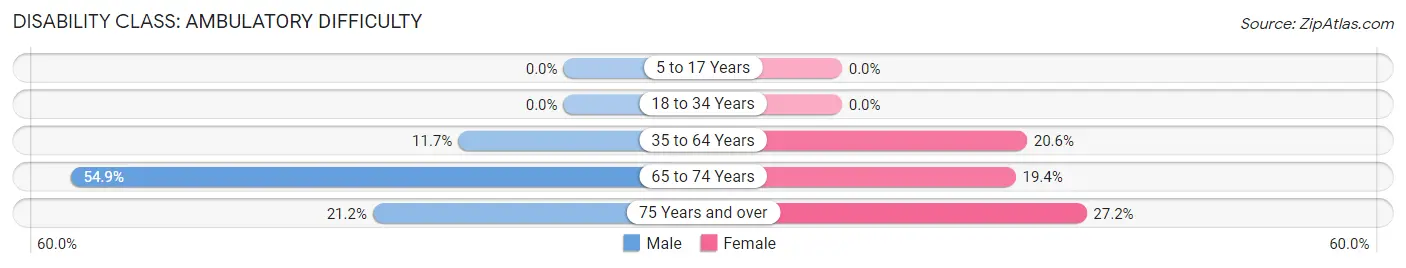
| Age Bracket | Male | Female |
| 5 to 17 Years | 0 (0.0%) | 0 (0.0%) |
| 18 to 34 Years | 0 (0.0%) | 0 (0.0%) |
| 35 to 64 Years | 100 (11.7%) | 152 (20.6%) |
| 65 to 74 Years | 135 (54.9%) | 65 (19.4%) |
| 75 Years and over | 38 (21.2%) | 85 (27.2%) |
Disability Class: Self-Care Difficulty
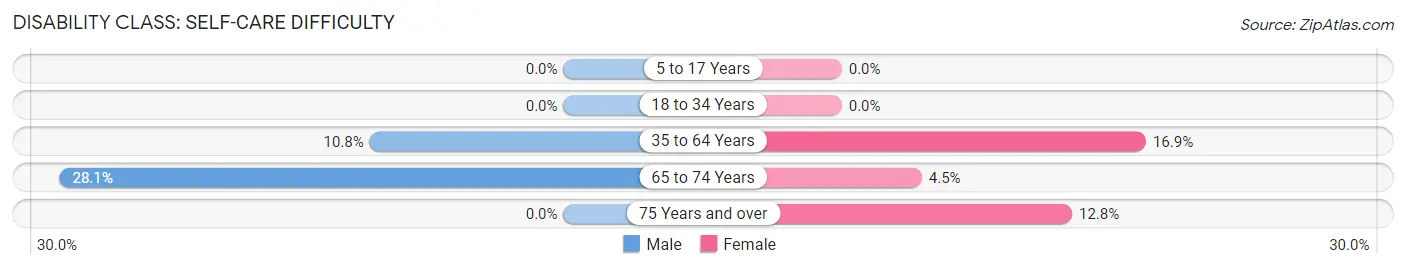
| Age Bracket | Male | Female |
| 5 to 17 Years | 0 (0.0%) | 0 (0.0%) |
| 18 to 34 Years | 0 (0.0%) | 0 (0.0%) |
| 35 to 64 Years | 92 (10.8%) | 125 (16.9%) |
| 65 to 74 Years | 69 (28.1%) | 15 (4.5%) |
| 75 Years and over | 0 (0.0%) | 40 (12.8%) |
Technology Access in Northwoods
Computing Device Access in Northwoods
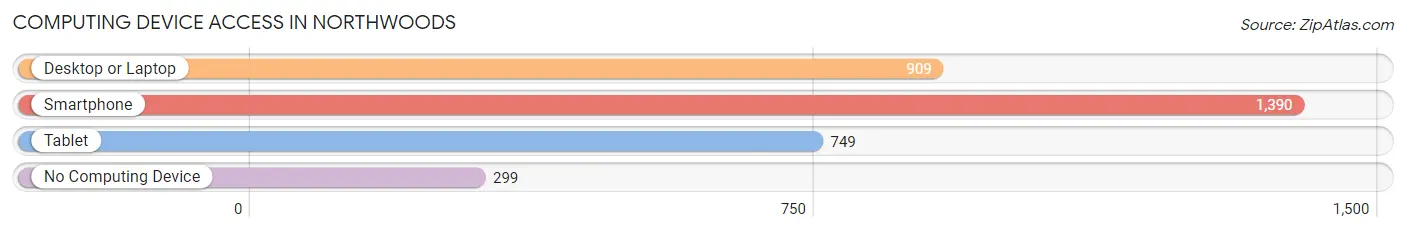
| Device Type | # Households | % Households |
| Desktop or Laptop | 909 | 47.9% |
| Smartphone | 1,390 | 73.3% |
| Tablet | 749 | 39.5% |
| No Computing Device | 299 | 15.8% |
| Total | 1,896 | 100.0% |
Internet Access in Northwoods
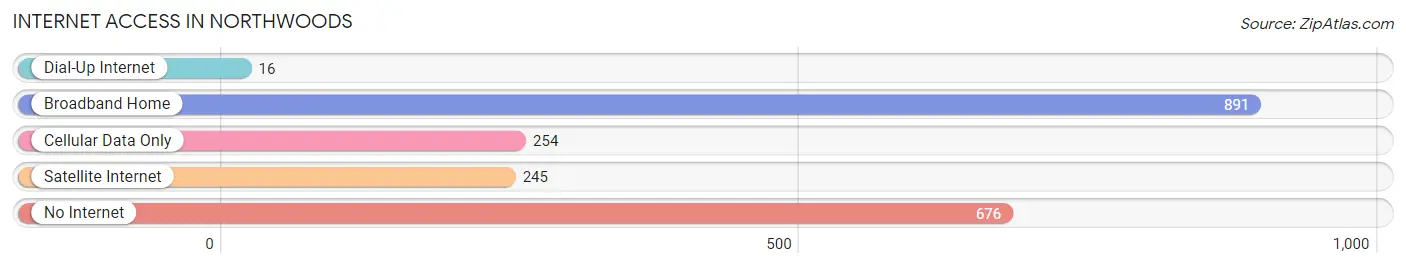
| Internet Type | # Households | % Households |
| Dial-Up Internet | 16 | 0.8% |
| Broadband Home | 891 | 47.0% |
| Cellular Data Only | 254 | 13.4% |
| Satellite Internet | 245 | 12.9% |
| No Internet | 676 | 35.6% |
| Total | 1,896 | 100.0% |
Northwoods Summary
Northwoods, Missouri is a small city located in St. Louis County, Missouri. It is situated on the banks of the Missouri River, just north of St. Louis. The city has a population of approximately 8,000 people and is part of the Greater St. Louis metropolitan area.
History
Northwoods was founded in 1876 by a group of German immigrants who were looking for a place to settle and start a new life. The city was originally called “New Berlin” and was the first German settlement in St. Louis County. The city was renamed Northwoods in 1883, after the nearby Northwoods Forest.
The city grew rapidly in the late 19th and early 20th centuries, becoming a popular destination for German immigrants. The city was home to a large number of German-owned businesses, including a brewery, a sausage factory, and a brickyard.
In the early 20th century, Northwoods became a popular destination for African Americans who were looking for a place to escape the racism and segregation of the South. The city was home to a vibrant African American community, and was the birthplace of the famous jazz musician Miles Davis.
Geography
Northwoods is located in St. Louis County, Missouri, on the banks of the Missouri River. The city is situated on the western edge of the Ozark Plateau, and is surrounded by rolling hills and forests. The city is located approximately 20 miles north of St. Louis, and is part of the Greater St. Louis metropolitan area.
The city has a total area of 4.2 square miles, of which 0.2 square miles is water. The city is located at an elevation of 590 feet above sea level.
Economy
Northwoods has a diverse economy, with a variety of industries represented. The city is home to a number of manufacturing companies, including a steel mill, a paper mill, and a printing company. The city is also home to a number of retail stores, restaurants, and other businesses.
The city is also home to a number of educational institutions, including a community college and a technical school. The city is also home to a number of medical facilities, including a hospital and a number of clinics.
Demographics
As of the 2010 census, Northwoods had a population of 8,000 people. The racial makeup of the city was 79.3% White, 15.2% African American, 0.7% Native American, 0.7% Asian, 0.1% Pacific Islander, and 3.9% from other races. Hispanic or Latino of any race were 4.3% of the population.
The median income for a household in the city was $41,944, and the median income for a family was $50,944. The per capita income for the city was $20,944. About 11.2% of families and 14.2% of the population were below the poverty line, including 19.2% of those under age 18 and 8.2% of those age 65 or over.
Common Questions
What is Per Capita Income in Northwoods?
Per Capita income in Northwoods is $22,427.
What is the Median Family Income in Northwoods?
Median Family Income in Northwoods is $55,019.
What is the Median Household income in Northwoods?
Median Household Income in Northwoods is $38,864.
What is Income or Wage Gap in Northwoods?
Income or Wage Gap in Northwoods is 9.3%.
Women in Northwoods earn 90.7 cents for every dollar earned by a man.
What is Inequality or Gini Index in Northwoods?
Inequality or Gini Index in Northwoods is 0.36.
What is the Total Population of Northwoods?
Total Population of Northwoods is 3,700.
What is the Total Male Population of Northwoods?
Total Male Population of Northwoods is 1,858.
What is the Total Female Population of Northwoods?
Total Female Population of Northwoods is 1,842.
What is the Ratio of Males per 100 Females in Northwoods?
There are 100.87 Males per 100 Females in Northwoods.
What is the Ratio of Females per 100 Males in Northwoods?
There are 99.14 Females per 100 Males in Northwoods.
What is the Median Population Age in Northwoods?
Median Population Age in Northwoods is 57.6 Years.
What is the Average Family Size in Northwoods
Average Family Size in Northwoods is 2.9 People.
What is the Average Household Size in Northwoods
Average Household Size in Northwoods is 1.9 People.
How Large is the Labor Force in Northwoods?
There are 1,220 People in the Labor Forcein in Northwoods.
What is the Percentage of People in the Labor Force in Northwoods?
38.0% of People are in the Labor Force in Northwoods.
What is the Unemployment Rate in Northwoods?
Unemployment Rate in Northwoods is 8.2%.