Dearborn, MO Map & Demographics
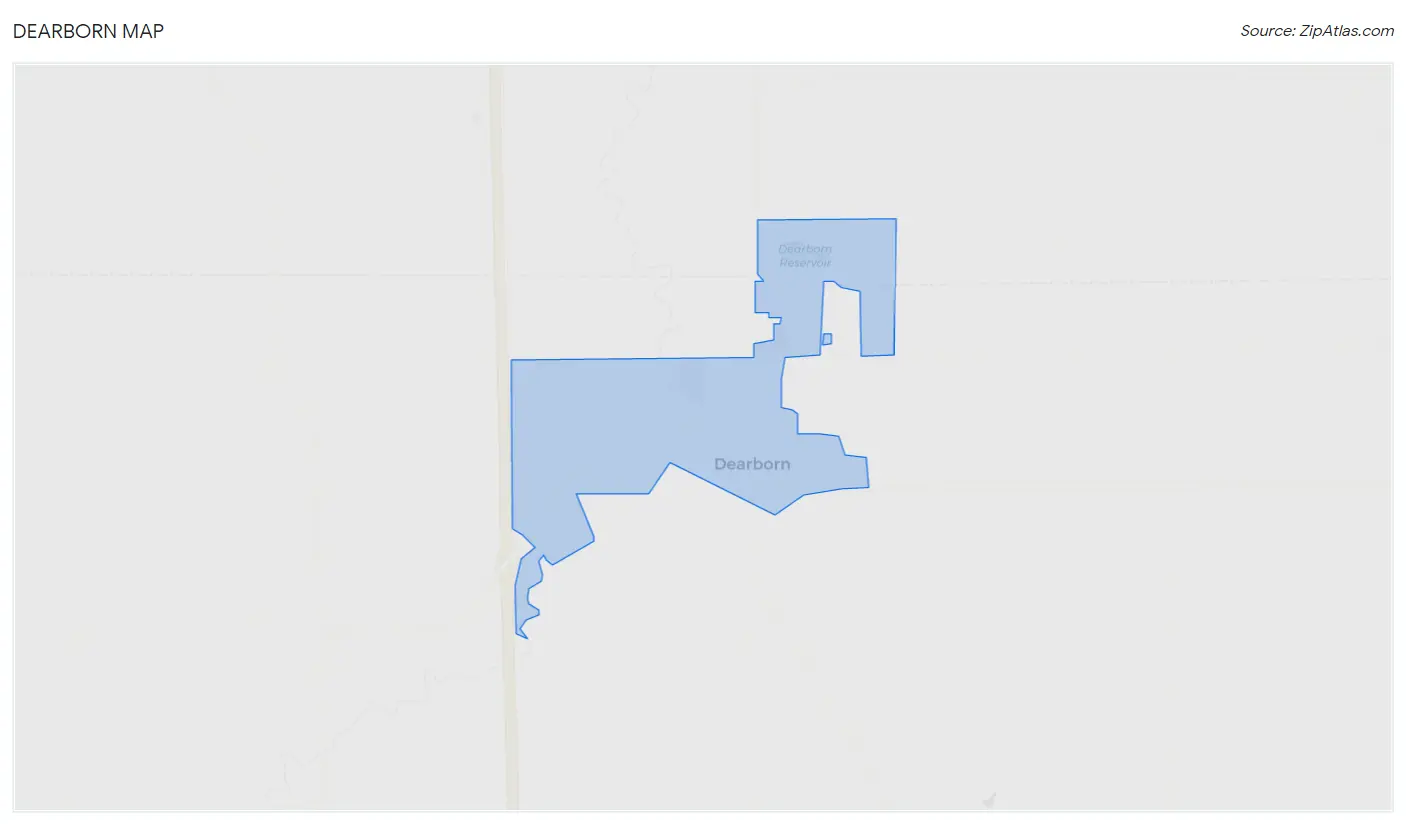
Dearborn Map
Dearborn Overview
$24,955
PER CAPITA INCOME
$48,750
AVG FAMILY INCOME
$41,250
AVG HOUSEHOLD INCOME
37.9%
WAGE / INCOME GAP [ % ]
62.1¢/ $1
WAGE / INCOME GAP [ $ ]
0.37
INEQUALITY / GINI INDEX
498
TOTAL POPULATION
240
MALE POPULATION
258
FEMALE POPULATION
93.02
MALES / 100 FEMALES
107.50
FEMALES / 100 MALES
38.6
MEDIAN AGE
2.9
AVG FAMILY SIZE
2.4
AVG HOUSEHOLD SIZE
189
LABOR FORCE [ PEOPLE ]
51.6%
PERCENT IN LABOR FORCE
2.1%
UNEMPLOYMENT RATE
Dearborn Zip Codes
Dearborn Area Codes
Income in Dearborn
Income Overview in Dearborn
Per Capita Income in Dearborn is $24,955, while median incomes of families and households are $48,750 and $41,250 respectively.
| Characteristic | Number | Measure |
| Per Capita Income | 498 | $24,955 |
| Median Family Income | 137 | $48,750 |
| Mean Family Income | 137 | $64,688 |
| Median Household Income | 212 | $41,250 |
| Mean Household Income | 212 | $56,622 |
| Income Deficit | 137 | $0 |
| Wage / Income Gap (%) | 498 | 37.91% |
| Wage / Income Gap ($) | 498 | 62.09¢ per $1 |
| Gini / Inequality Index | 498 | 0.37 |
Earnings by Sex in Dearborn
Average Earnings in Dearborn are $37,083, $50,556 for men and $31,389 for women, a difference of 37.9%.
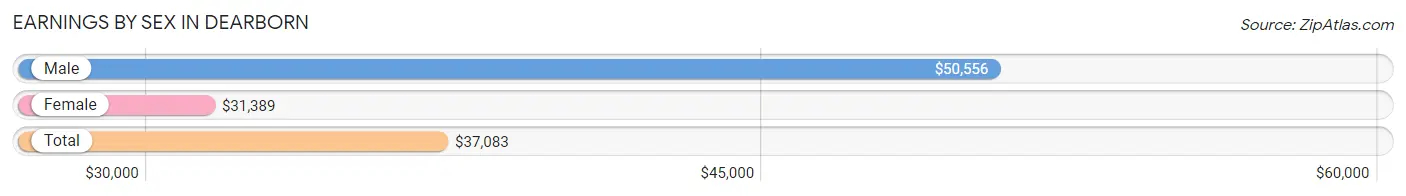
| Sex | Number | Average Earnings |
| Male | 116 (56.3%) | $50,556 |
| Female | 90 (43.7%) | $31,389 |
| Total | 206 (100.0%) | $37,083 |
Earnings by Sex by Income Bracket in Dearborn
The most common earnings brackets in Dearborn are $55,000 to $64,999 for men (25 | 21.5%) and $30,000 to $34,999 for women (16 | 17.8%).
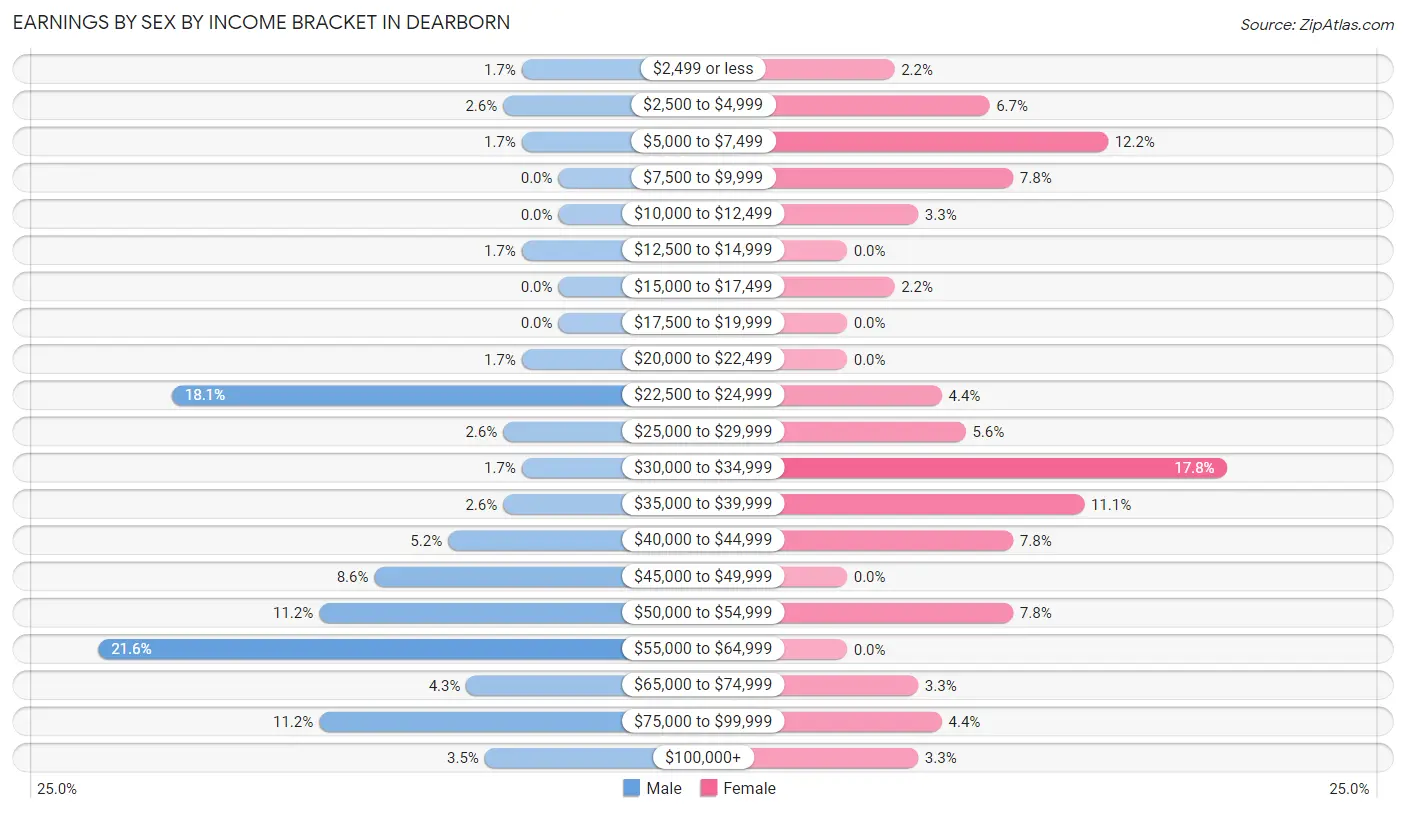
| Income | Male | Female |
| $2,499 or less | 2 (1.7%) | 2 (2.2%) |
| $2,500 to $4,999 | 3 (2.6%) | 6 (6.7%) |
| $5,000 to $7,499 | 2 (1.7%) | 11 (12.2%) |
| $7,500 to $9,999 | 0 (0.0%) | 7 (7.8%) |
| $10,000 to $12,499 | 0 (0.0%) | 3 (3.3%) |
| $12,500 to $14,999 | 2 (1.7%) | 0 (0.0%) |
| $15,000 to $17,499 | 0 (0.0%) | 2 (2.2%) |
| $17,500 to $19,999 | 0 (0.0%) | 0 (0.0%) |
| $20,000 to $22,499 | 2 (1.7%) | 0 (0.0%) |
| $22,500 to $24,999 | 21 (18.1%) | 4 (4.4%) |
| $25,000 to $29,999 | 3 (2.6%) | 5 (5.6%) |
| $30,000 to $34,999 | 2 (1.7%) | 16 (17.8%) |
| $35,000 to $39,999 | 3 (2.6%) | 10 (11.1%) |
| $40,000 to $44,999 | 6 (5.2%) | 7 (7.8%) |
| $45,000 to $49,999 | 10 (8.6%) | 0 (0.0%) |
| $50,000 to $54,999 | 13 (11.2%) | 7 (7.8%) |
| $55,000 to $64,999 | 25 (21.5%) | 0 (0.0%) |
| $65,000 to $74,999 | 5 (4.3%) | 3 (3.3%) |
| $75,000 to $99,999 | 13 (11.2%) | 4 (4.4%) |
| $100,000+ | 4 (3.5%) | 3 (3.3%) |
| Total | 116 (100.0%) | 90 (100.0%) |
Earnings by Sex by Educational Attainment in Dearborn
Average earnings in Dearborn are $51,111 for men and $32,857 for women, a difference of 35.7%. Men with an educational attainment of college or associate's degree enjoy the highest average annual earnings of $53,125, while those with high school diploma education earn the least with $51,250. Women with an educational attainment of graduate degree earn the most with the average annual earnings of $53,750, while those with college or associate's degree education have the smallest earnings of $33,571.
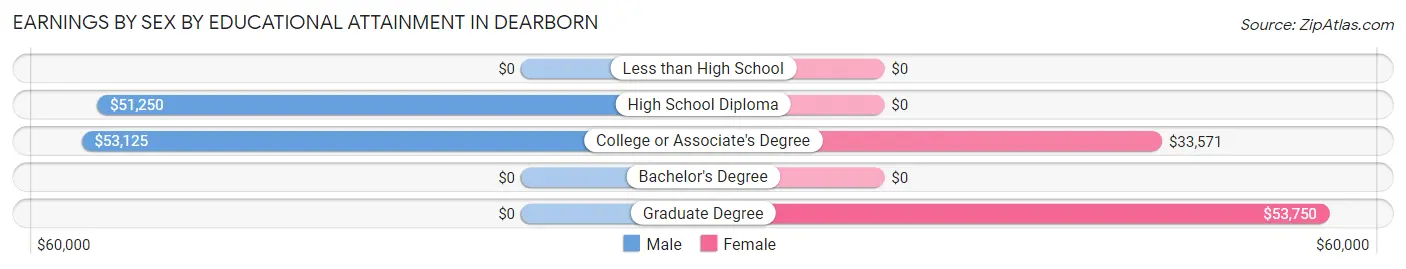
| Educational Attainment | Male Income | Female Income |
| Less than High School | - | - |
| High School Diploma | $51,250 | $0 |
| College or Associate's Degree | $53,125 | $33,571 |
| Bachelor's Degree | - | - |
| Graduate Degree | - | - |
| Total | $51,111 | $32,857 |
Family Income in Dearborn
Family Income Brackets in Dearborn
According to the Dearborn family income data, there are 31 families falling into the $75,000 to $99,999 income range, which is the most common income bracket and makes up 22.6% of all families.
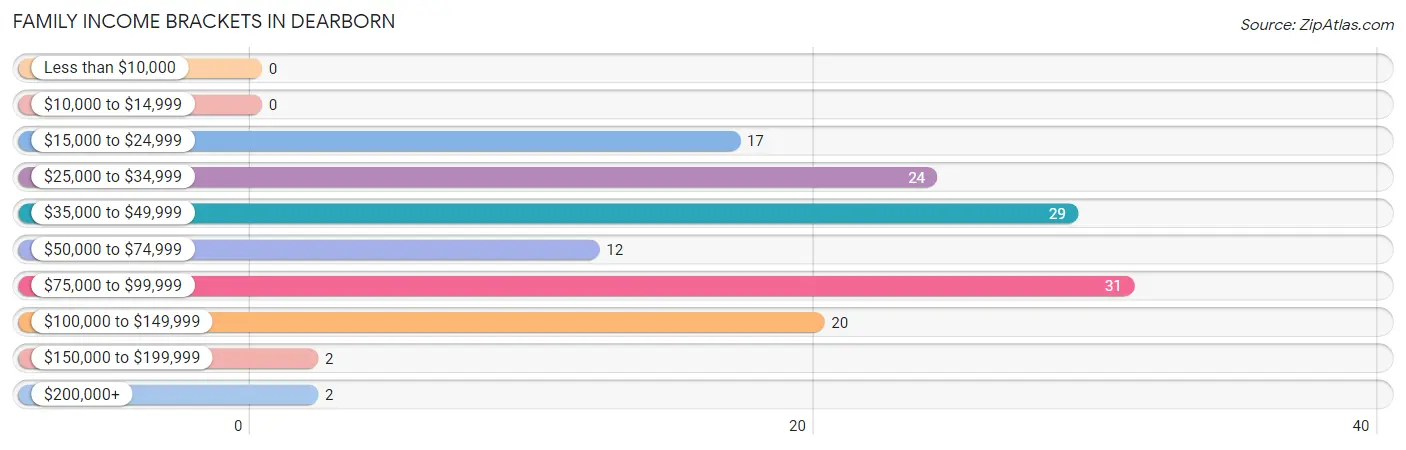
| Income Bracket | # Families | % Families |
| Less than $10,000 | 0 | 0.0% |
| $10,000 to $14,999 | 0 | 0.0% |
| $15,000 to $24,999 | 17 | 12.4% |
| $25,000 to $34,999 | 24 | 17.5% |
| $35,000 to $49,999 | 29 | 21.2% |
| $50,000 to $74,999 | 12 | 8.8% |
| $75,000 to $99,999 | 31 | 22.6% |
| $100,000 to $149,999 | 20 | 14.6% |
| $150,000 to $199,999 | 2 | 1.5% |
| $200,000+ | 2 | 1.5% |
Family Income by Famaliy Size in Dearborn
4-person families (22 | 16.1%) account for the highest median family income in Dearborn with $91,250 per family, while 4-person families (22 | 16.1%) have the highest median income of $22,812 per family member.
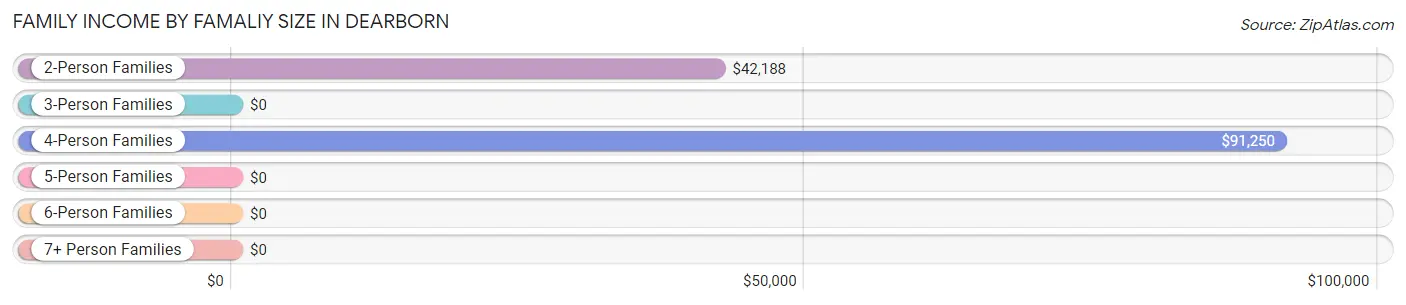
| Income Bracket | # Families | Median Income |
| 2-Person Families | 59 (43.1%) | $42,188 |
| 3-Person Families | 43 (31.4%) | $0 |
| 4-Person Families | 22 (16.1%) | $91,250 |
| 5-Person Families | 9 (6.6%) | $0 |
| 6-Person Families | 4 (2.9%) | $0 |
| 7+ Person Families | 0 (0.0%) | $0 |
| Total | 137 (100.0%) | $48,750 |
Family Income by Number of Earners in Dearborn
The median family income in Dearborn is $48,750, with families comprising 2 earners (37) having the highest median family income of $94,861, while families with no earners (35) have the lowest median family income of $35,972, accounting for 27.0% and 25.6% of families, respectively.
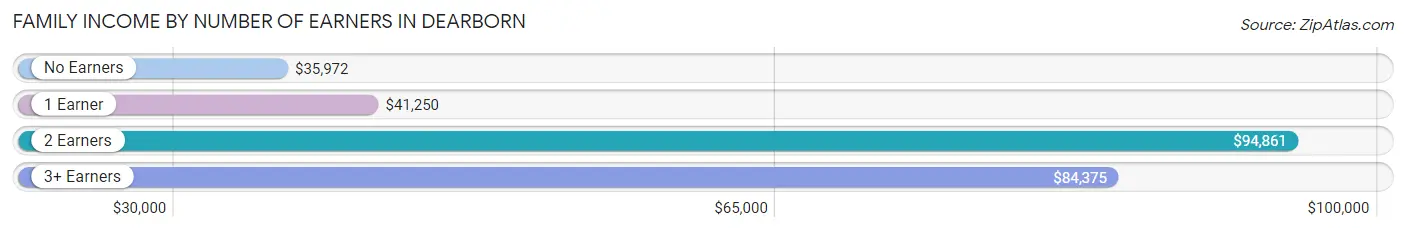
| Number of Earners | # Families | Median Income |
| No Earners | 35 (25.6%) | $35,972 |
| 1 Earner | 54 (39.4%) | $41,250 |
| 2 Earners | 37 (27.0%) | $94,861 |
| 3+ Earners | 11 (8.0%) | $84,375 |
| Total | 137 (100.0%) | $48,750 |
Household Income in Dearborn
Household Income Brackets in Dearborn
With 46 households falling in the category, the $75,000 to $99,999 income range is the most frequent in Dearborn, accounting for 21.7% of all households. In contrast, only 2 households (0.9%) fall into the $200,000+ income bracket, making it the least populous group.
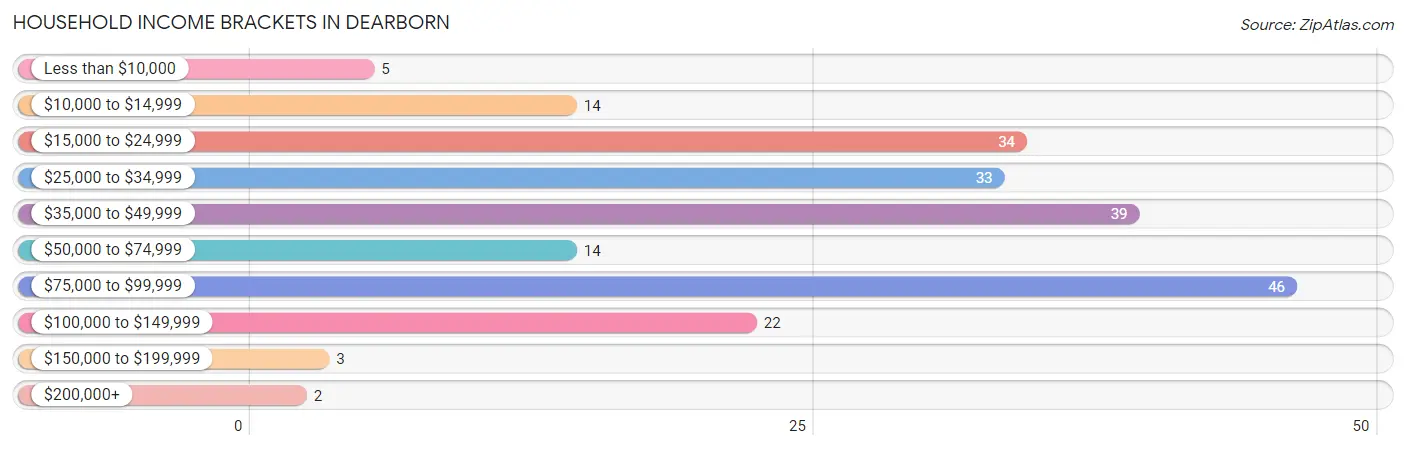
| Income Bracket | # Households | % Households |
| Less than $10,000 | 5 | 2.4% |
| $10,000 to $14,999 | 14 | 6.6% |
| $15,000 to $24,999 | 34 | 16.0% |
| $25,000 to $34,999 | 33 | 15.6% |
| $35,000 to $49,999 | 39 | 18.4% |
| $50,000 to $74,999 | 14 | 6.6% |
| $75,000 to $99,999 | 46 | 21.7% |
| $100,000 to $149,999 | 22 | 10.4% |
| $150,000 to $199,999 | 3 | 1.4% |
| $200,000+ | 2 | 0.9% |
Household Income by Householder Age in Dearborn
The median household income in Dearborn is $41,250, with the highest median household income of $83,750 found in the 25 to 44 years age bracket for the primary householder. A total of 76 households (35.8%) fall into this category.
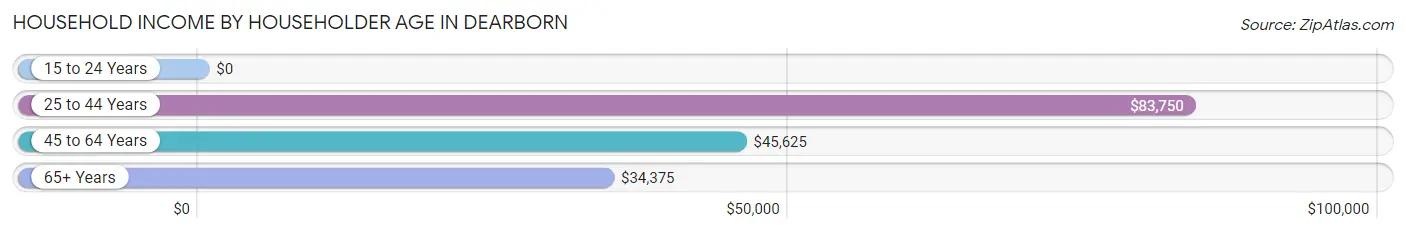
| Income Bracket | # Households | Median Income |
| 15 to 24 Years | 0 (0.0%) | $0 |
| 25 to 44 Years | 76 (35.8%) | $83,750 |
| 45 to 64 Years | 65 (30.7%) | $45,625 |
| 65+ Years | 71 (33.5%) | $34,375 |
| Total | 212 (100.0%) | $41,250 |
Poverty in Dearborn
Income Below Poverty by Sex and Age in Dearborn
With 15.8% poverty level for males and 5.9% for females among the residents of Dearborn, under 5 year old males and 45 to 54 year old females are the most vulnerable to poverty, with 11 males (57.9%) and 5 females (29.4%) in their respective age groups living below the poverty level.
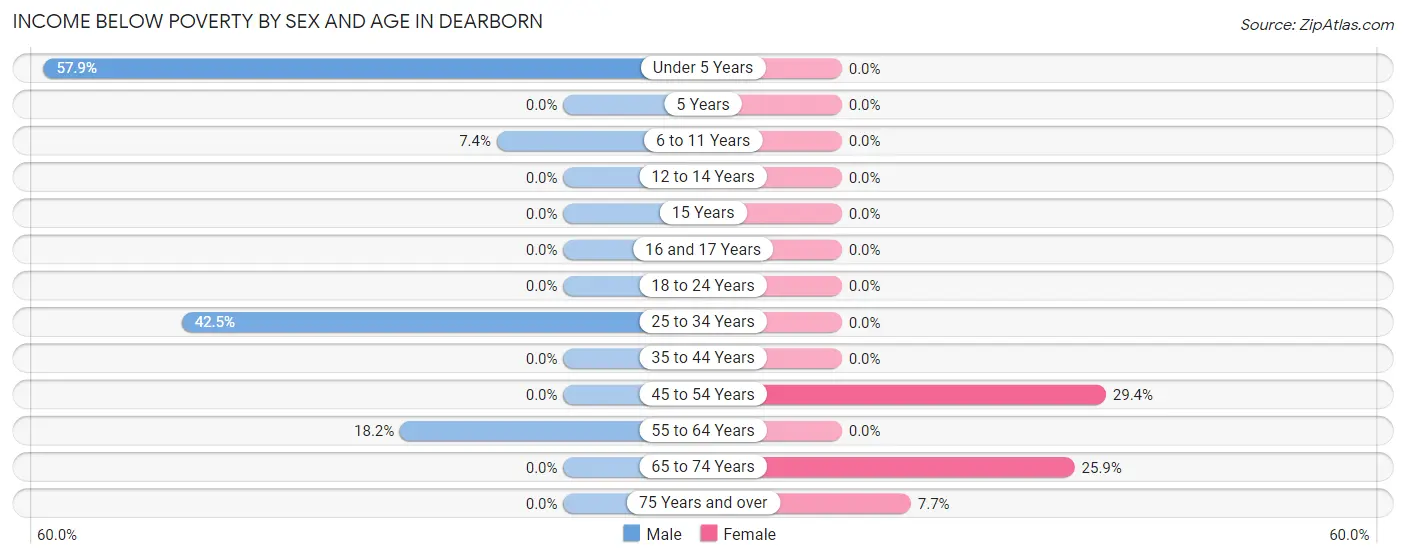
| Age Bracket | Male | Female |
| Under 5 Years | 11 (57.9%) | 0 (0.0%) |
| 5 Years | 0 (0.0%) | 0 (0.0%) |
| 6 to 11 Years | 2 (7.4%) | 0 (0.0%) |
| 12 to 14 Years | 0 (0.0%) | 0 (0.0%) |
| 15 Years | 0 (0.0%) | 0 (0.0%) |
| 16 and 17 Years | 0 (0.0%) | 0 (0.0%) |
| 18 to 24 Years | 0 (0.0%) | 0 (0.0%) |
| 25 to 34 Years | 17 (42.5%) | 0 (0.0%) |
| 35 to 44 Years | 0 (0.0%) | 0 (0.0%) |
| 45 to 54 Years | 0 (0.0%) | 5 (29.4%) |
| 55 to 64 Years | 8 (18.2%) | 0 (0.0%) |
| 65 to 74 Years | 0 (0.0%) | 7 (25.9%) |
| 75 Years and over | 0 (0.0%) | 3 (7.7%) |
| Total | 38 (15.8%) | 15 (5.9%) |
Income Above Poverty by Sex and Age in Dearborn
According to the poverty statistics in Dearborn, males aged 5 years and females aged under 5 years are the age groups that are most secure financially, with 100.0% of males and 100.0% of females in these age groups living above the poverty line.
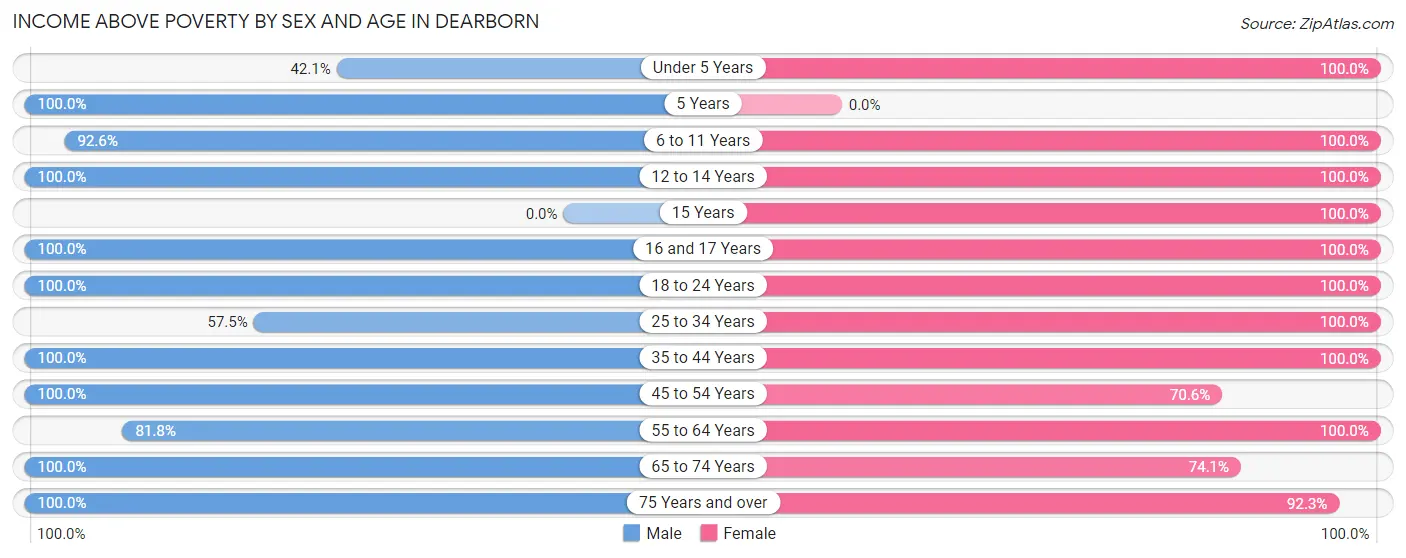
| Age Bracket | Male | Female |
| Under 5 Years | 8 (42.1%) | 15 (100.0%) |
| 5 Years | 3 (100.0%) | 0 (0.0%) |
| 6 to 11 Years | 25 (92.6%) | 22 (100.0%) |
| 12 to 14 Years | 16 (100.0%) | 4 (100.0%) |
| 15 Years | 0 (0.0%) | 21 (100.0%) |
| 16 and 17 Years | 3 (100.0%) | 6 (100.0%) |
| 18 to 24 Years | 5 (100.0%) | 16 (100.0%) |
| 25 to 34 Years | 23 (57.5%) | 24 (100.0%) |
| 35 to 44 Years | 31 (100.0%) | 45 (100.0%) |
| 45 to 54 Years | 18 (100.0%) | 12 (70.6%) |
| 55 to 64 Years | 36 (81.8%) | 17 (100.0%) |
| 65 to 74 Years | 16 (100.0%) | 20 (74.1%) |
| 75 Years and over | 18 (100.0%) | 36 (92.3%) |
| Total | 202 (84.2%) | 238 (94.1%) |
Income Below Poverty Among Married-Couple Families in Dearborn
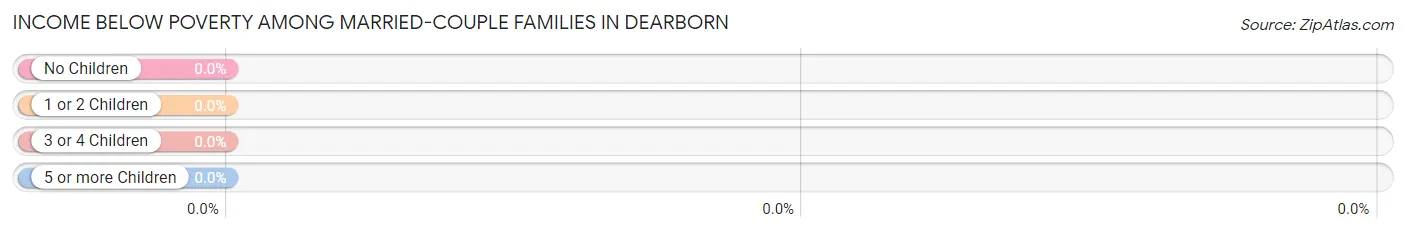
| Children | Above Poverty | Below Poverty |
| No Children | 51 (100.0%) | 0 (0.0%) |
| 1 or 2 Children | 34 (100.0%) | 0 (0.0%) |
| 3 or 4 Children | 4 (100.0%) | 0 (0.0%) |
| 5 or more Children | 0 (0.0%) | 0 (0.0%) |
| Total | 89 (100.0%) | 0 (0.0%) |
Income Below Poverty Among Single-Parent Households in Dearborn
According to the poverty data in Dearborn, 57.7% or 15 single-father households and 9.1% or 2 single-mother households are living below the poverty line. Among single-father households, those with 1 or 2 children have the highest poverty rate, with 15 households (62.5%) experiencing poverty. Likewise, among single-mother households, those with 1 or 2 children have the highest poverty rate, with 2 households (16.7%) falling below the poverty line.
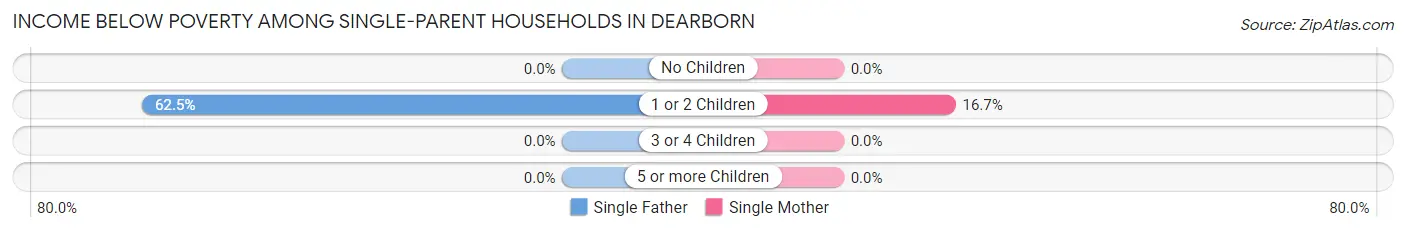
| Children | Single Father | Single Mother |
| No Children | 0 (0.0%) | 0 (0.0%) |
| 1 or 2 Children | 15 (62.5%) | 2 (16.7%) |
| 3 or 4 Children | 0 (0.0%) | 0 (0.0%) |
| 5 or more Children | 0 (0.0%) | 0 (0.0%) |
| Total | 15 (57.7%) | 2 (9.1%) |
Income Below Poverty Among Married-Couple vs Single-Parent Households in Dearborn
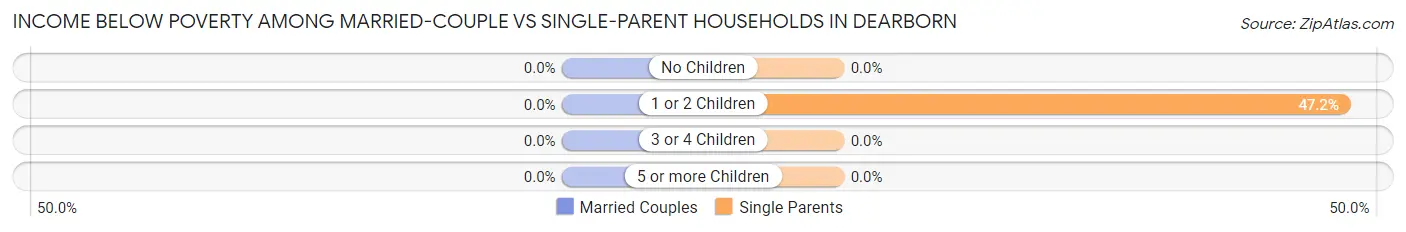
| Children | Married-Couple Families | Single-Parent Households |
| No Children | 0 (0.0%) | 0 (0.0%) |
| 1 or 2 Children | 0 (0.0%) | 17 (47.2%) |
| 3 or 4 Children | 0 (0.0%) | 0 (0.0%) |
| 5 or more Children | 0 (0.0%) | 0 (0.0%) |
| Total | 0 (0.0%) | 17 (35.4%) |
Race in Dearborn
The most populous races in Dearborn are White / Caucasian (475 | 95.4%), Two or more Races (13 | 2.6%), and Hawaiian / Pacific (5 | 1.0%).
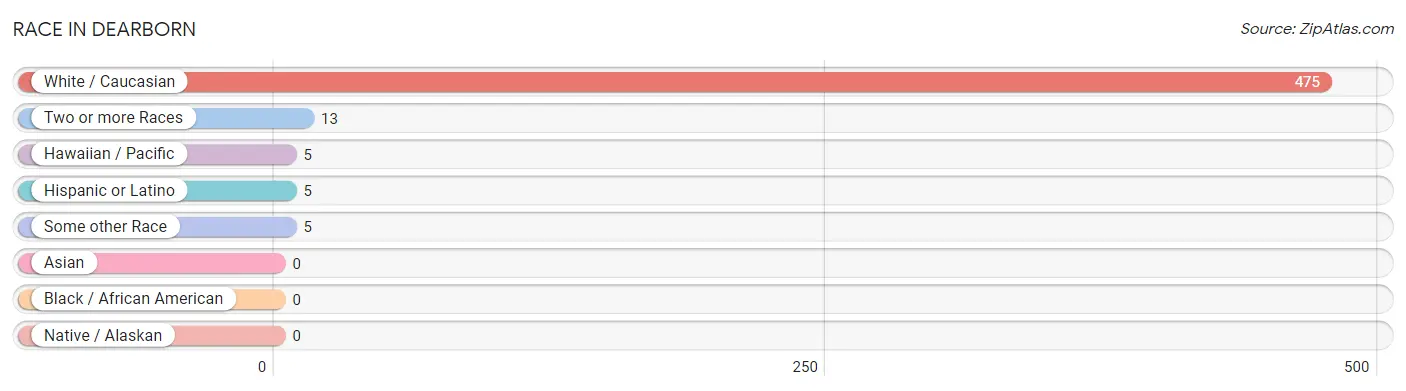
| Race | # Population | % Population |
| Asian | 0 | 0.0% |
| Black / African American | 0 | 0.0% |
| Hawaiian / Pacific | 5 | 1.0% |
| Hispanic or Latino | 5 | 1.0% |
| Native / Alaskan | 0 | 0.0% |
| White / Caucasian | 475 | 95.4% |
| Two or more Races | 13 | 2.6% |
| Some other Race | 5 | 1.0% |
| Total | 498 | 100.0% |
Ancestry in Dearborn
The most populous ancestries reported in Dearborn are German (94 | 18.9%), Irish (94 | 18.9%), English (71 | 14.3%), French (29 | 5.8%), and American (23 | 4.6%), together accounting for 62.5% of all Dearborn residents.
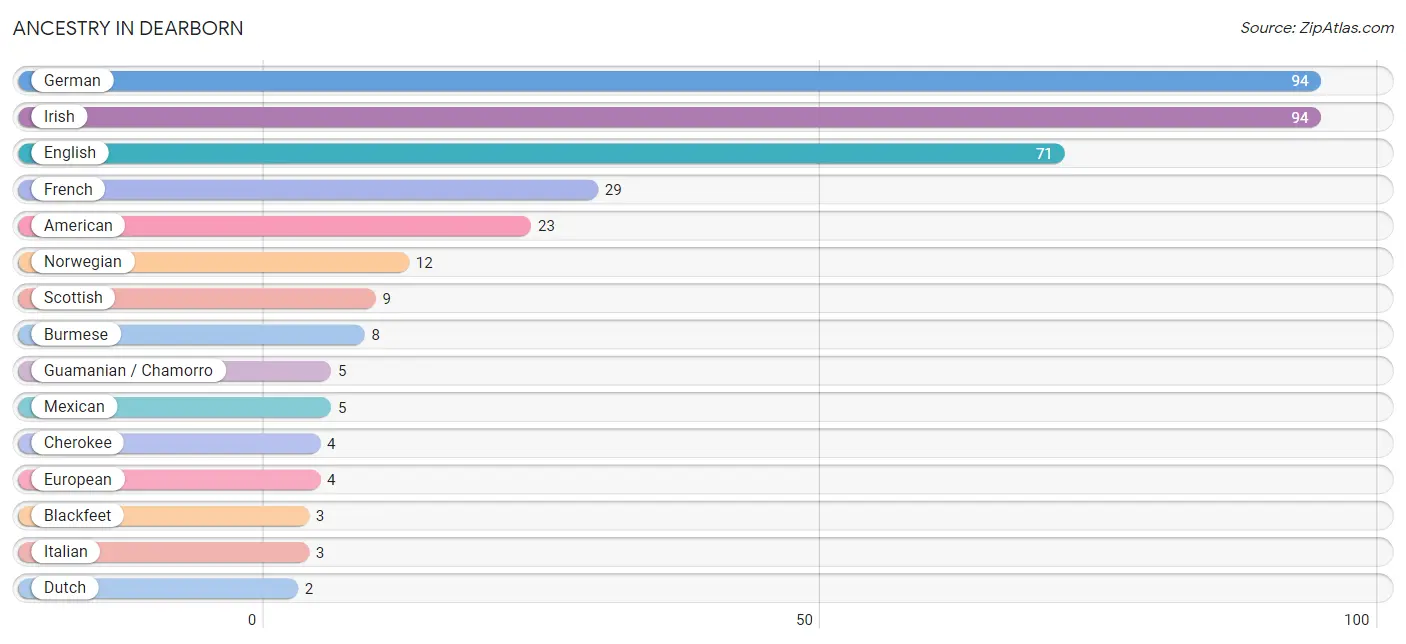
| Ancestry | # Population | % Population |
| American | 23 | 4.6% |
| Blackfeet | 3 | 0.6% |
| Burmese | 8 | 1.6% |
| Cherokee | 4 | 0.8% |
| Choctaw | 1 | 0.2% |
| Dutch | 2 | 0.4% |
| English | 71 | 14.3% |
| European | 4 | 0.8% |
| French | 29 | 5.8% |
| German | 94 | 18.9% |
| Guamanian / Chamorro | 5 | 1.0% |
| Irish | 94 | 18.9% |
| Italian | 3 | 0.6% |
| Mexican | 5 | 1.0% |
| Norwegian | 12 | 2.4% |
| Pennsylvania German | 2 | 0.4% |
| Scandinavian | 2 | 0.4% |
| Scotch-Irish | 2 | 0.4% |
| Scottish | 9 | 1.8% |
| Swedish | 2 | 0.4% |
| Swiss | 2 | 0.4% | View All 21 Rows |
Immigrants in Dearborn

| Immigration Origin | # Population | % Population | View All 0 Rows |
Sex and Age in Dearborn
Sex and Age in Dearborn
The most populous age groups in Dearborn are 30 to 34 Years (27 | 11.3%) for men and 15 to 19 Years (40 | 15.5%) for women.
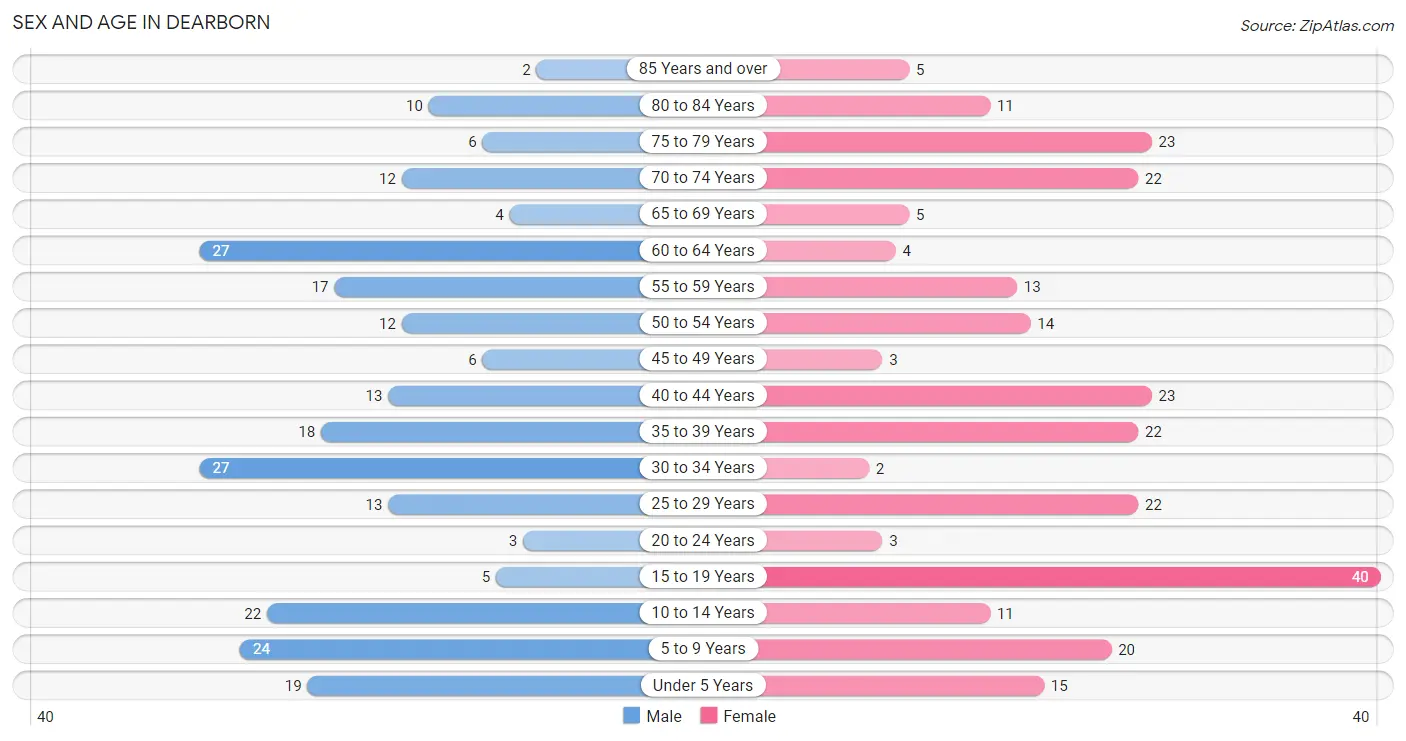
| Age Bracket | Male | Female |
| Under 5 Years | 19 (7.9%) | 15 (5.8%) |
| 5 to 9 Years | 24 (10.0%) | 20 (7.7%) |
| 10 to 14 Years | 22 (9.2%) | 11 (4.3%) |
| 15 to 19 Years | 5 (2.1%) | 40 (15.5%) |
| 20 to 24 Years | 3 (1.3%) | 3 (1.2%) |
| 25 to 29 Years | 13 (5.4%) | 22 (8.5%) |
| 30 to 34 Years | 27 (11.3%) | 2 (0.8%) |
| 35 to 39 Years | 18 (7.5%) | 22 (8.5%) |
| 40 to 44 Years | 13 (5.4%) | 23 (8.9%) |
| 45 to 49 Years | 6 (2.5%) | 3 (1.2%) |
| 50 to 54 Years | 12 (5.0%) | 14 (5.4%) |
| 55 to 59 Years | 17 (7.1%) | 13 (5.0%) |
| 60 to 64 Years | 27 (11.3%) | 4 (1.5%) |
| 65 to 69 Years | 4 (1.7%) | 5 (1.9%) |
| 70 to 74 Years | 12 (5.0%) | 22 (8.5%) |
| 75 to 79 Years | 6 (2.5%) | 23 (8.9%) |
| 80 to 84 Years | 10 (4.2%) | 11 (4.3%) |
| 85 Years and over | 2 (0.8%) | 5 (1.9%) |
| Total | 240 (100.0%) | 258 (100.0%) |
Families and Households in Dearborn
Median Family Size in Dearborn
The median family size in Dearborn is 2.92 persons per family, with single female/mother families (22 | 16.1%) accounting for the largest median family size of 3.55 persons per family. On the other hand, single male/father families (26 | 19.0%) represent the smallest median family size with 2.04 persons per family.
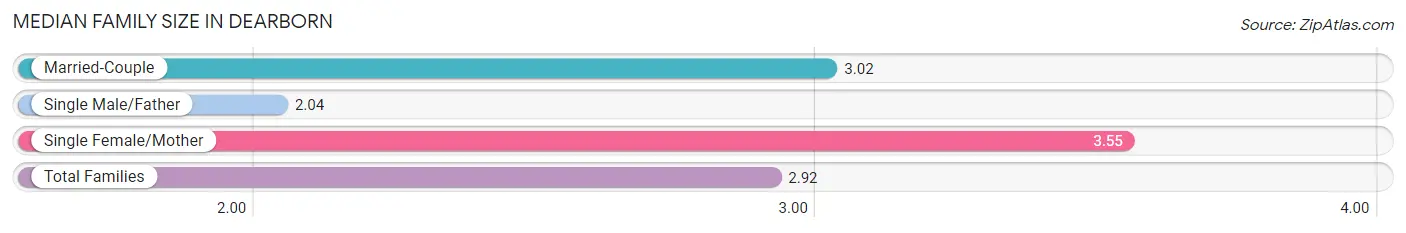
| Family Type | # Families | Family Size |
| Married-Couple | 89 (65.0%) | 3.02 |
| Single Male/Father | 26 (19.0%) | 2.04 |
| Single Female/Mother | 22 (16.1%) | 3.55 |
| Total Families | 137 (100.0%) | 2.92 |
Median Household Size in Dearborn
The median household size in Dearborn is 2.35 persons per household, with single female/mother households (22 | 10.4%) accounting for the largest median household size of 3.64 persons per household. non-family households (75 | 35.4%) represent the smallest median household size with 1.12 persons per household.
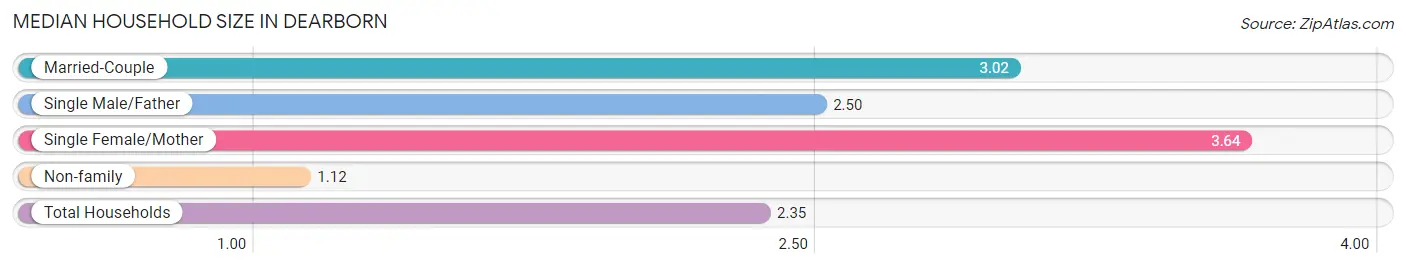
| Household Type | # Households | Household Size |
| Married-Couple | 89 (42.0%) | 3.02 |
| Single Male/Father | 26 (12.3%) | 2.50 |
| Single Female/Mother | 22 (10.4%) | 3.64 |
| Non-family | 75 (35.4%) | 1.12 |
| Total Households | 212 (100.0%) | 2.35 |
Household Size by Marriage Status in Dearborn
Out of a total of 212 households in Dearborn, 137 (64.6%) are family households, while 75 (35.4%) are nonfamily households. The most numerous type of family households are 2-person households, comprising 53, and the most common type of nonfamily households are 1-person households, comprising 67.
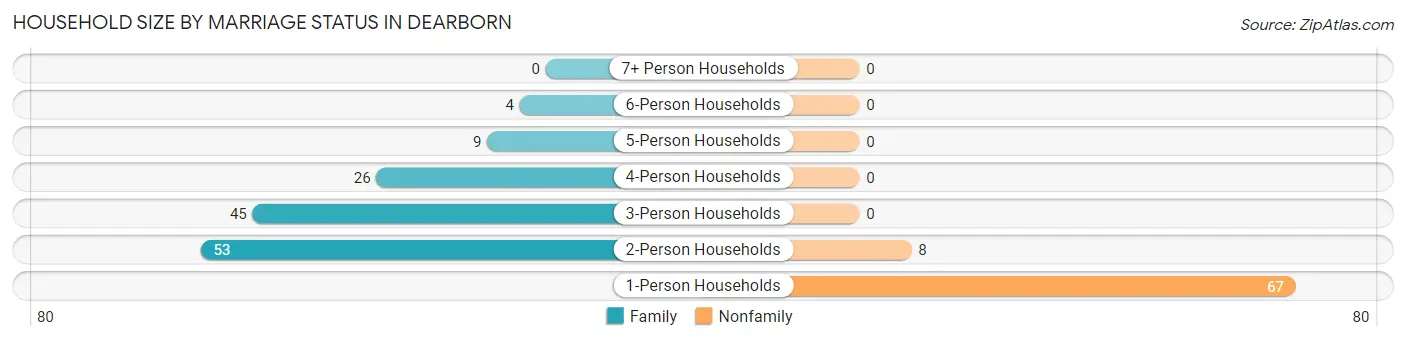
| Household Size | Family Households | Nonfamily Households |
| 1-Person Households | - | 67 (31.6%) |
| 2-Person Households | 53 (25.0%) | 8 (3.8%) |
| 3-Person Households | 45 (21.2%) | 0 (0.0%) |
| 4-Person Households | 26 (12.3%) | 0 (0.0%) |
| 5-Person Households | 9 (4.3%) | 0 (0.0%) |
| 6-Person Households | 4 (1.9%) | 0 (0.0%) |
| 7+ Person Households | 0 (0.0%) | 0 (0.0%) |
| Total | 137 (64.6%) | 75 (35.4%) |
Female Fertility in Dearborn
Fertility by Age in Dearborn
Average fertility rate in Dearborn is 9.0 births per 1,000 women. Women in the age bracket of 20 to 34 years have the highest fertility rate with 37.0 births per 1,000 women. Women in the age bracket of 20 to 34 years acount for 100.0% of all women with births.
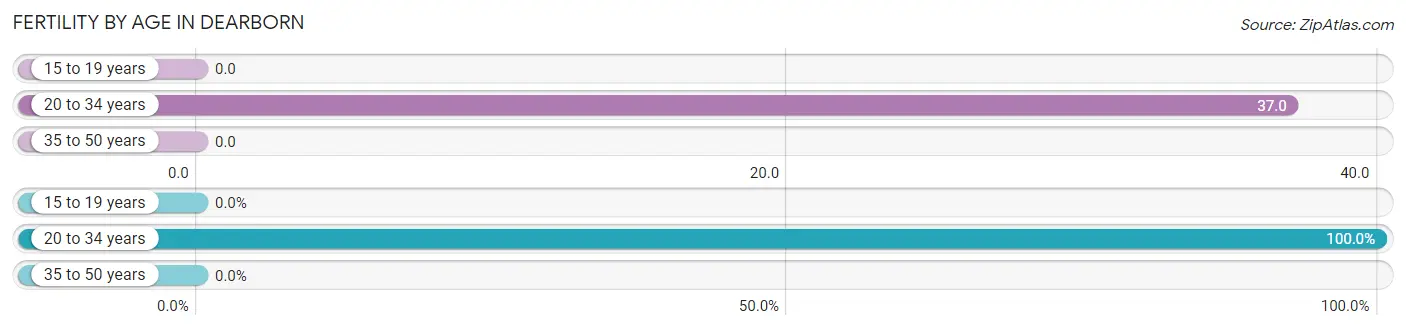
| Age Bracket | Women with Births | Births / 1,000 Women |
| 15 to 19 years | 0 (0.0%) | 0.0 |
| 20 to 34 years | 1 (100.0%) | 37.0 |
| 35 to 50 years | 0 (0.0%) | 0.0 |
| Total | 1 (100.0%) | 9.0 |
Fertility by Age by Marriage Status in Dearborn
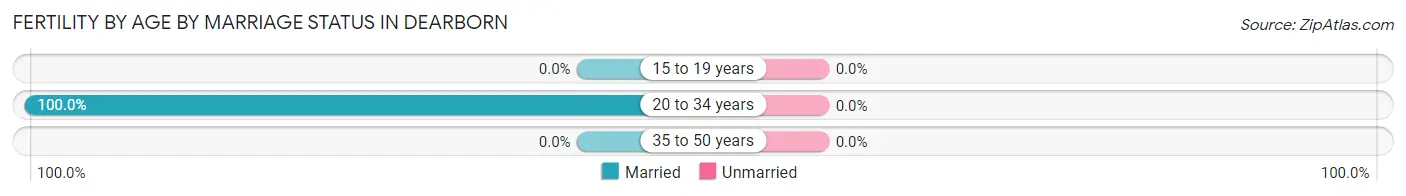
| Age Bracket | Married | Unmarried |
| 15 to 19 years | 0 (0.0%) | 0 (0.0%) |
| 20 to 34 years | 1 (100.0%) | 0 (0.0%) |
| 35 to 50 years | 0 (0.0%) | 0 (0.0%) |
| Total | 1 (100.0%) | 0 (0.0%) |
Fertility by Education in Dearborn
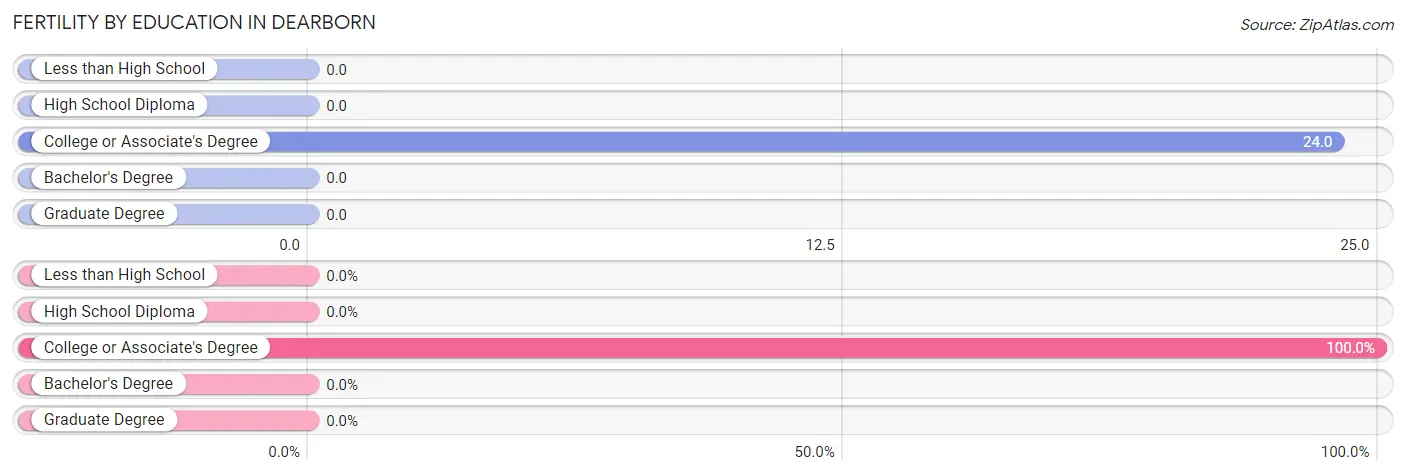
| Educational Attainment | Women with Births | Births / 1,000 Women |
| Less than High School | 0 (0.0%) | 0.0 |
| High School Diploma | 0 (0.0%) | 0.0 |
| College or Associate's Degree | 1 (100.0%) | 24.0 |
| Bachelor's Degree | 0 (0.0%) | 0.0 |
| Graduate Degree | 0 (0.0%) | 0.0 |
| Total | 1 (100.0%) | 9.0 |
Fertility by Education by Marriage Status in Dearborn
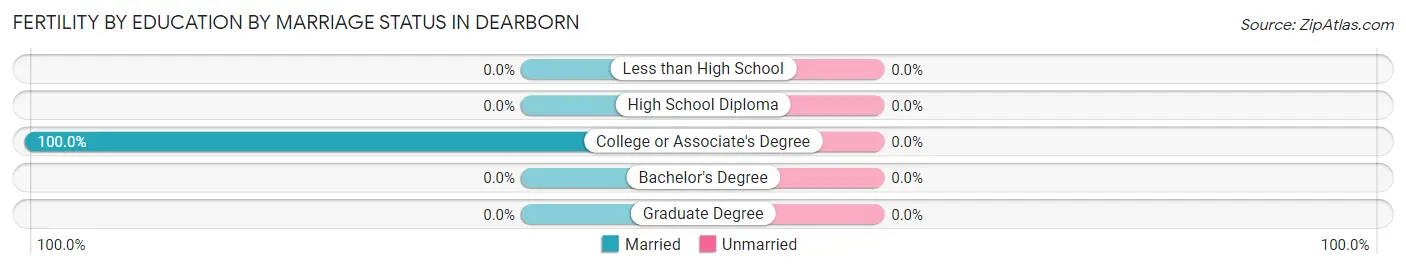
| Educational Attainment | Married | Unmarried |
| Less than High School | 0 (0.0%) | 0 (0.0%) |
| High School Diploma | 0 (0.0%) | 0 (0.0%) |
| College or Associate's Degree | 1 (100.0%) | 0 (0.0%) |
| Bachelor's Degree | 0 (0.0%) | 0 (0.0%) |
| Graduate Degree | 0 (0.0%) | 0 (0.0%) |
| Total | 1 (100.0%) | 0 (0.0%) |
Employment Characteristics in Dearborn
Employment by Class of Employer in Dearborn
Among the 180 employed individuals in Dearborn, private company employees (147 | 81.7%), local government employees (24 | 13.3%), and state government employees (4 | 2.2%) make up the most common classes of employment.
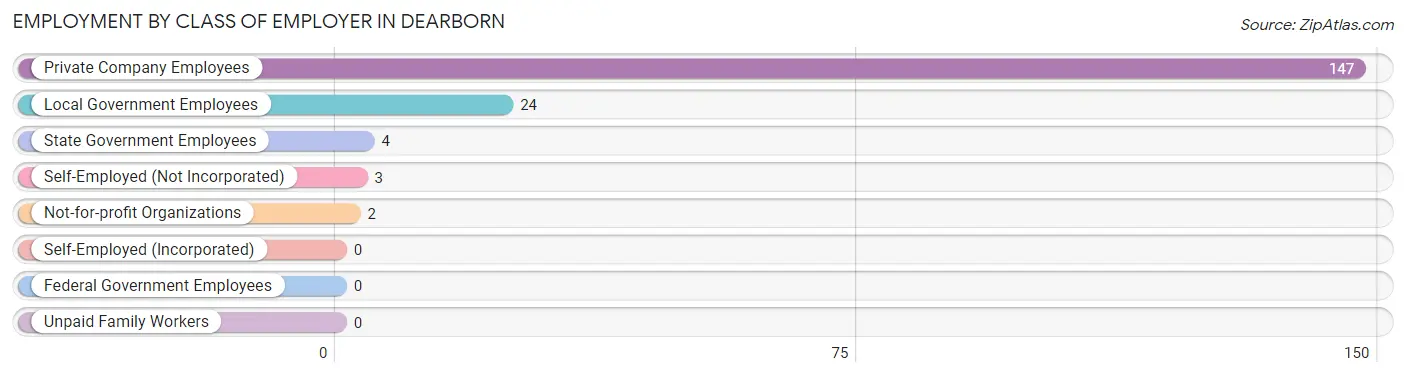
| Employer Class | # Employees | % Employees |
| Private Company Employees | 147 | 81.7% |
| Self-Employed (Incorporated) | 0 | 0.0% |
| Self-Employed (Not Incorporated) | 3 | 1.7% |
| Not-for-profit Organizations | 2 | 1.1% |
| Local Government Employees | 24 | 13.3% |
| State Government Employees | 4 | 2.2% |
| Federal Government Employees | 0 | 0.0% |
| Unpaid Family Workers | 0 | 0.0% |
| Total | 180 | 100.0% |
Employment Status by Age in Dearborn
According to the labor force statistics for Dearborn, out of the total population over 16 years of age (366), 51.6% or 189 individuals are in the labor force, with 2.1% or 4 of them unemployed. The age group with the highest labor force participation rate is 25 to 29 years, with 100.0% or 35 individuals in the labor force. Within the labor force, the 65 to 74 years age range has the highest percentage of unemployed individuals, with 40.0% or 2 of them being unemployed.
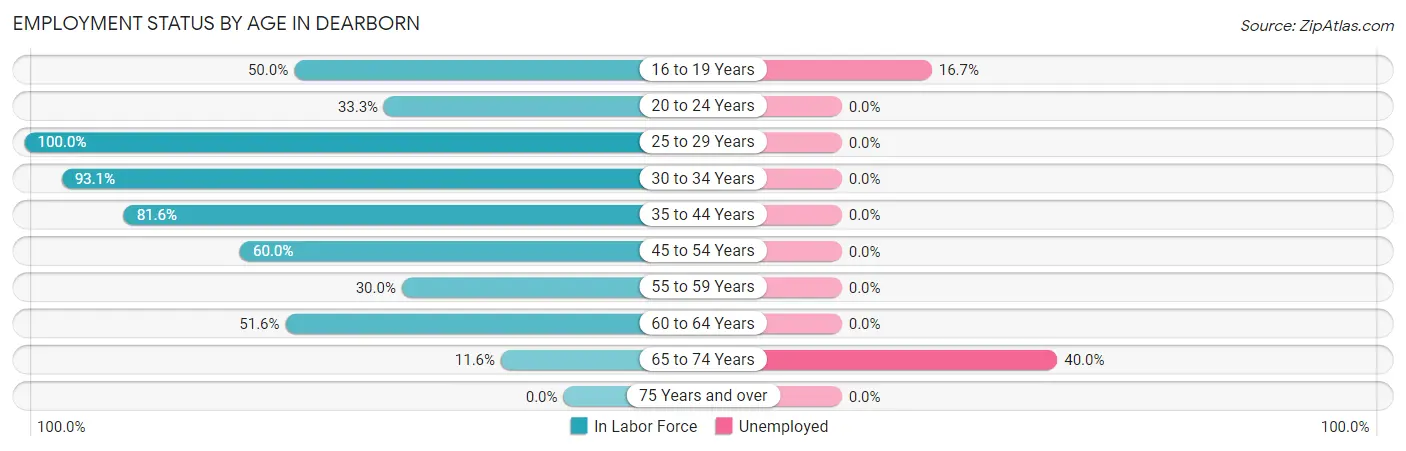
| Age Bracket | In Labor Force | Unemployed |
| 16 to 19 Years | 12 (50.0%) | 2 (16.7%) |
| 20 to 24 Years | 2 (33.3%) | 0 (0.0%) |
| 25 to 29 Years | 35 (100.0%) | 0 (0.0%) |
| 30 to 34 Years | 27 (93.1%) | 0 (0.0%) |
| 35 to 44 Years | 62 (81.6%) | 0 (0.0%) |
| 45 to 54 Years | 21 (60.0%) | 0 (0.0%) |
| 55 to 59 Years | 9 (30.0%) | 0 (0.0%) |
| 60 to 64 Years | 16 (51.6%) | 0 (0.0%) |
| 65 to 74 Years | 5 (11.6%) | 2 (40.0%) |
| 75 Years and over | 0 (0.0%) | 0 (0.0%) |
| Total | 189 (51.6%) | 4 (2.1%) |
Employment Status by Educational Attainment in Dearborn
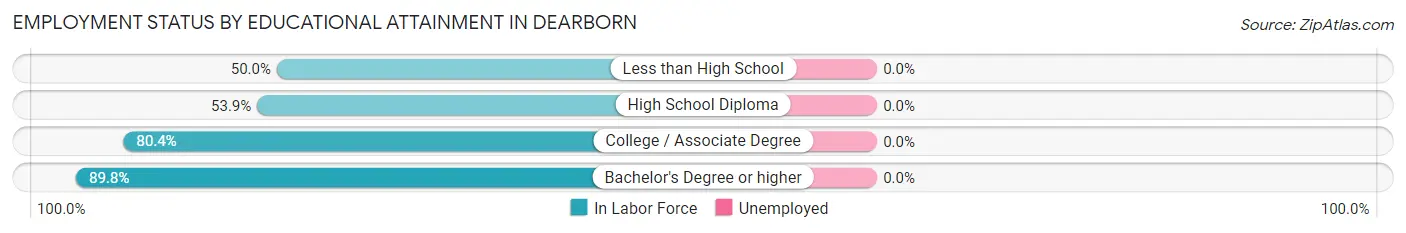
| Educational Attainment | In Labor Force | Unemployed |
| Less than High School | 7 (50.0%) | 0 (0.0%) |
| High School Diploma | 41 (53.9%) | 0 (0.0%) |
| College / Associate Degree | 78 (80.4%) | 0 (0.0%) |
| Bachelor's Degree or higher | 44 (89.8%) | 0 (0.0%) |
| Total | 170 (72.0%) | 0 (0.0%) |
Employment Occupations by Sex in Dearborn
Management, Business, Science and Arts Occupations
The most common Management, Business, Science and Arts occupations in Dearborn are Health Diagnosing & Treating (27 | 14.6%), Health Technologists (15 | 8.1%), Community & Social Service (11 | 5.9%), Education Instruction & Library (11 | 5.9%), and Management (5 | 2.7%).
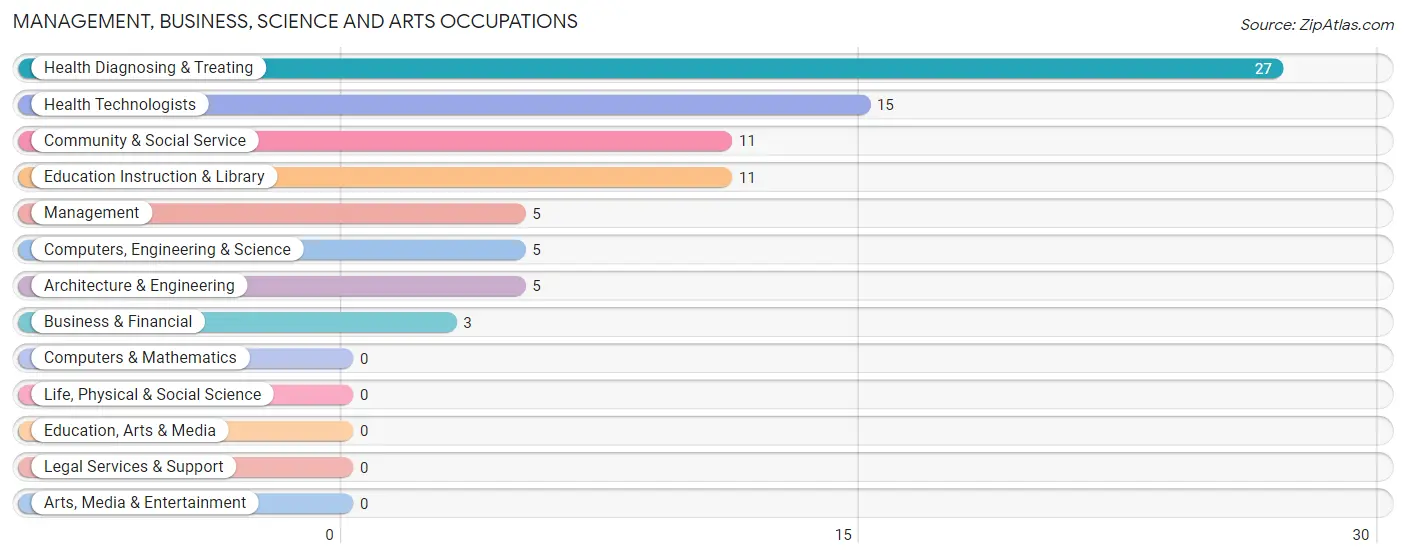
Management, Business, Science and Arts Occupations by Sex
Within the Management, Business, Science and Arts occupations in Dearborn, the most male-oriented occupations are Management (100.0%), Health Technologists (100.0%), and Health Diagnosing & Treating (55.6%), while the most female-oriented occupations are Business & Financial (100.0%), Community & Social Service (63.6%), and Education Instruction & Library (63.6%).
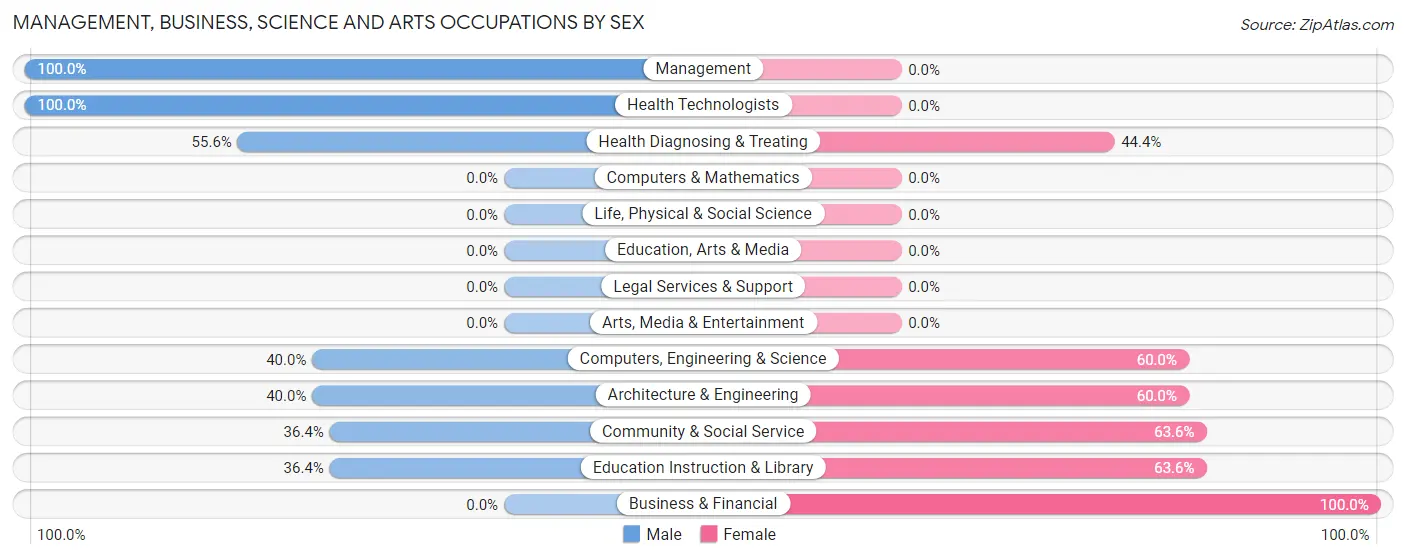
| Occupation | Male | Female |
| Management | 5 (100.0%) | 0 (0.0%) |
| Business & Financial | 0 (0.0%) | 3 (100.0%) |
| Computers, Engineering & Science | 2 (40.0%) | 3 (60.0%) |
| Computers & Mathematics | 0 (0.0%) | 0 (0.0%) |
| Architecture & Engineering | 2 (40.0%) | 3 (60.0%) |
| Life, Physical & Social Science | 0 (0.0%) | 0 (0.0%) |
| Community & Social Service | 4 (36.4%) | 7 (63.6%) |
| Education, Arts & Media | 0 (0.0%) | 0 (0.0%) |
| Legal Services & Support | 0 (0.0%) | 0 (0.0%) |
| Education Instruction & Library | 4 (36.4%) | 7 (63.6%) |
| Arts, Media & Entertainment | 0 (0.0%) | 0 (0.0%) |
| Health Diagnosing & Treating | 15 (55.6%) | 12 (44.4%) |
| Health Technologists | 15 (100.0%) | 0 (0.0%) |
| Total (Category) | 26 (51.0%) | 25 (49.0%) |
| Total (Overall) | 108 (58.4%) | 77 (41.6%) |
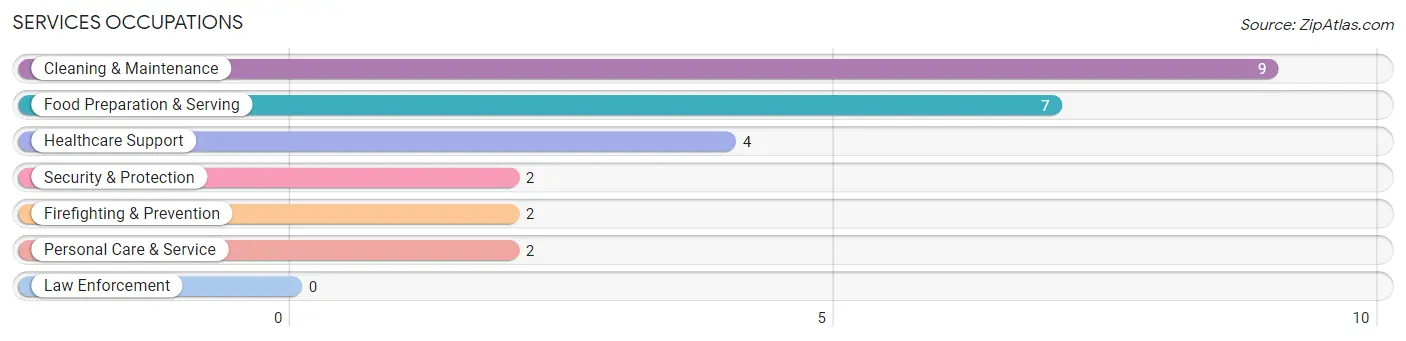
Services Occupations
The most common Services occupations in Dearborn are Cleaning & Maintenance (9 | 4.9%), Food Preparation & Serving (7 | 3.8%), Healthcare Support (4 | 2.2%), Security & Protection (2 | 1.1%), and Firefighting & Prevention (2 | 1.1%).
Services Occupations by Sex
Within the Services occupations in Dearborn, the most male-oriented occupations are Security & Protection (100.0%), Firefighting & Prevention (100.0%), and Cleaning & Maintenance (55.6%), while the most female-oriented occupations are Healthcare Support (100.0%), Food Preparation & Serving (100.0%), and Personal Care & Service (100.0%).
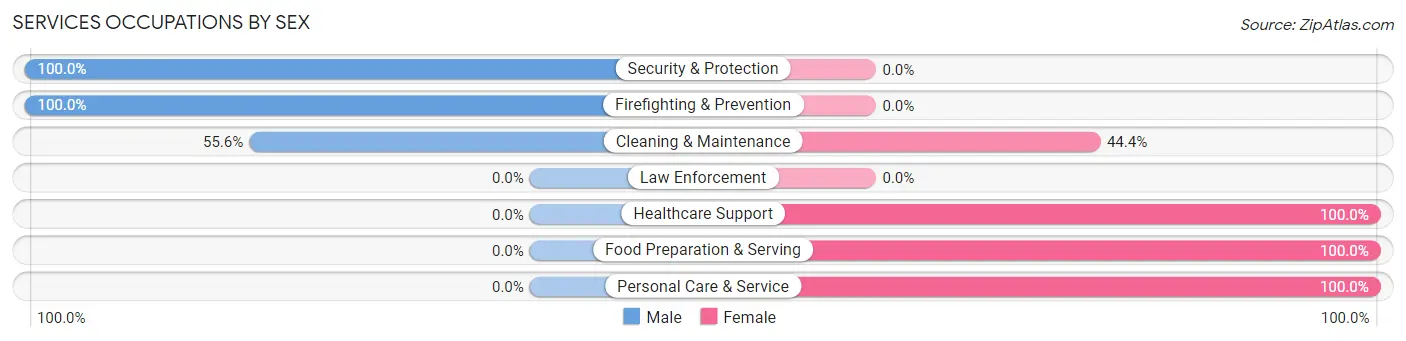
| Occupation | Male | Female |
| Healthcare Support | 0 (0.0%) | 4 (100.0%) |
| Security & Protection | 2 (100.0%) | 0 (0.0%) |
| Firefighting & Prevention | 2 (100.0%) | 0 (0.0%) |
| Law Enforcement | 0 (0.0%) | 0 (0.0%) |
| Food Preparation & Serving | 0 (0.0%) | 7 (100.0%) |
| Cleaning & Maintenance | 5 (55.6%) | 4 (44.4%) |
| Personal Care & Service | 0 (0.0%) | 2 (100.0%) |
| Total (Category) | 7 (29.2%) | 17 (70.8%) |
| Total (Overall) | 108 (58.4%) | 77 (41.6%) |
Sales and Office Occupations
The most common Sales and Office occupations in Dearborn are , and Office & Administration (35 | 18.9%).
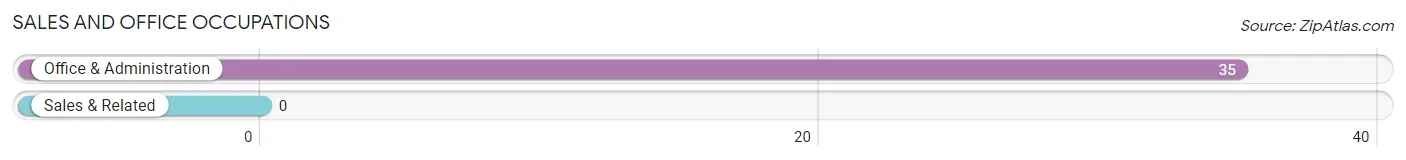
Sales and Office Occupations by Sex
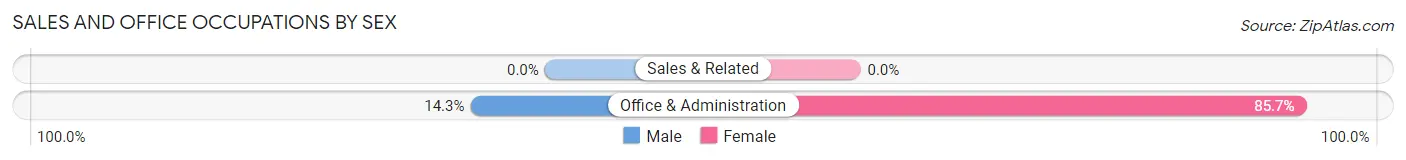
| Occupation | Male | Female |
| Sales & Related | 0 (0.0%) | 0 (0.0%) |
| Office & Administration | 5 (14.3%) | 30 (85.7%) |
| Total (Category) | 5 (14.3%) | 30 (85.7%) |
| Total (Overall) | 108 (58.4%) | 77 (41.6%) |
Natural Resources, Construction and Maintenance Occupations
The most common Natural Resources, Construction and Maintenance occupations in Dearborn are Construction & Extraction (21 | 11.4%), and Installation, Maintenance & Repair (20 | 10.8%).
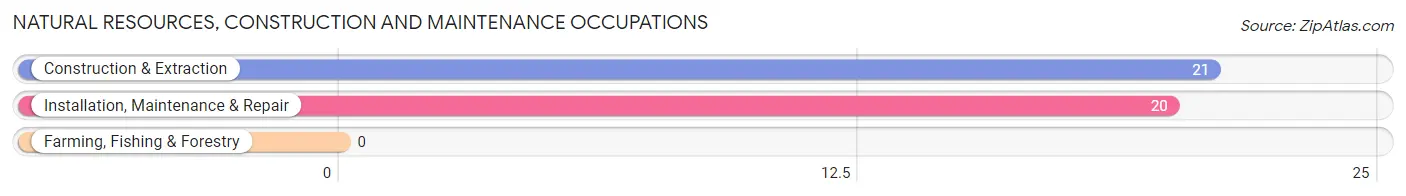
Natural Resources, Construction and Maintenance Occupations by Sex
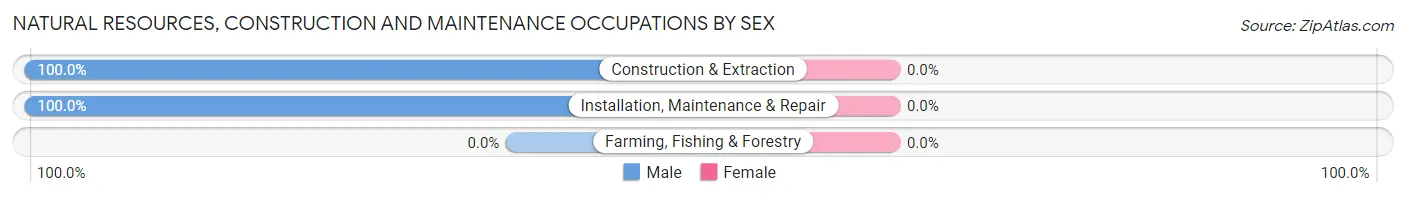
| Occupation | Male | Female |
| Farming, Fishing & Forestry | 0 (0.0%) | 0 (0.0%) |
| Construction & Extraction | 21 (100.0%) | 0 (0.0%) |
| Installation, Maintenance & Repair | 20 (100.0%) | 0 (0.0%) |
| Total (Category) | 41 (100.0%) | 0 (0.0%) |
| Total (Overall) | 108 (58.4%) | 77 (41.6%) |
Production, Transportation and Moving Occupations
The most common Production, Transportation and Moving occupations in Dearborn are Production (18 | 9.7%), Transportation (10 | 5.4%), and Material Moving (6 | 3.2%).
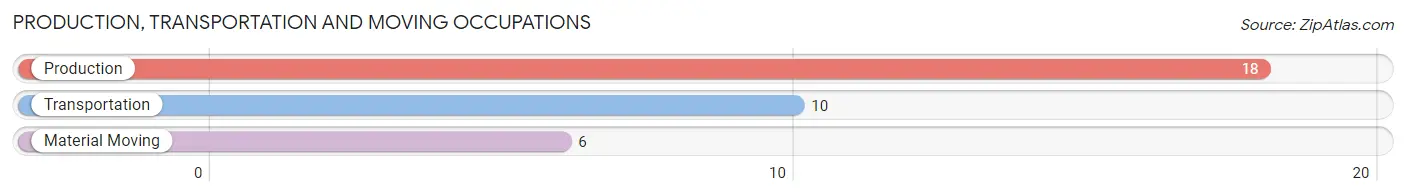
Production, Transportation and Moving Occupations by Sex
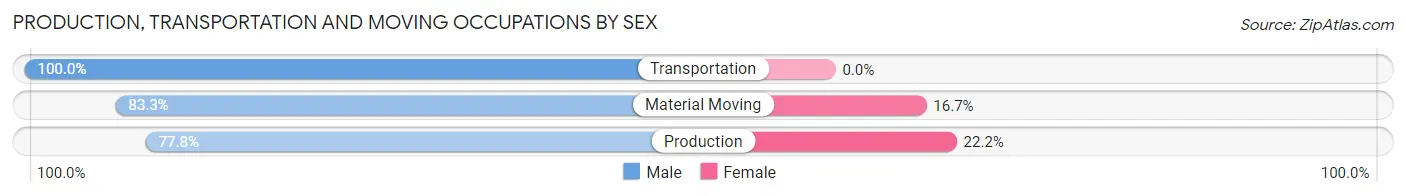
| Occupation | Male | Female |
| Production | 14 (77.8%) | 4 (22.2%) |
| Transportation | 10 (100.0%) | 0 (0.0%) |
| Material Moving | 5 (83.3%) | 1 (16.7%) |
| Total (Category) | 29 (85.3%) | 5 (14.7%) |
| Total (Overall) | 108 (58.4%) | 77 (41.6%) |
Employment Industries by Sex in Dearborn
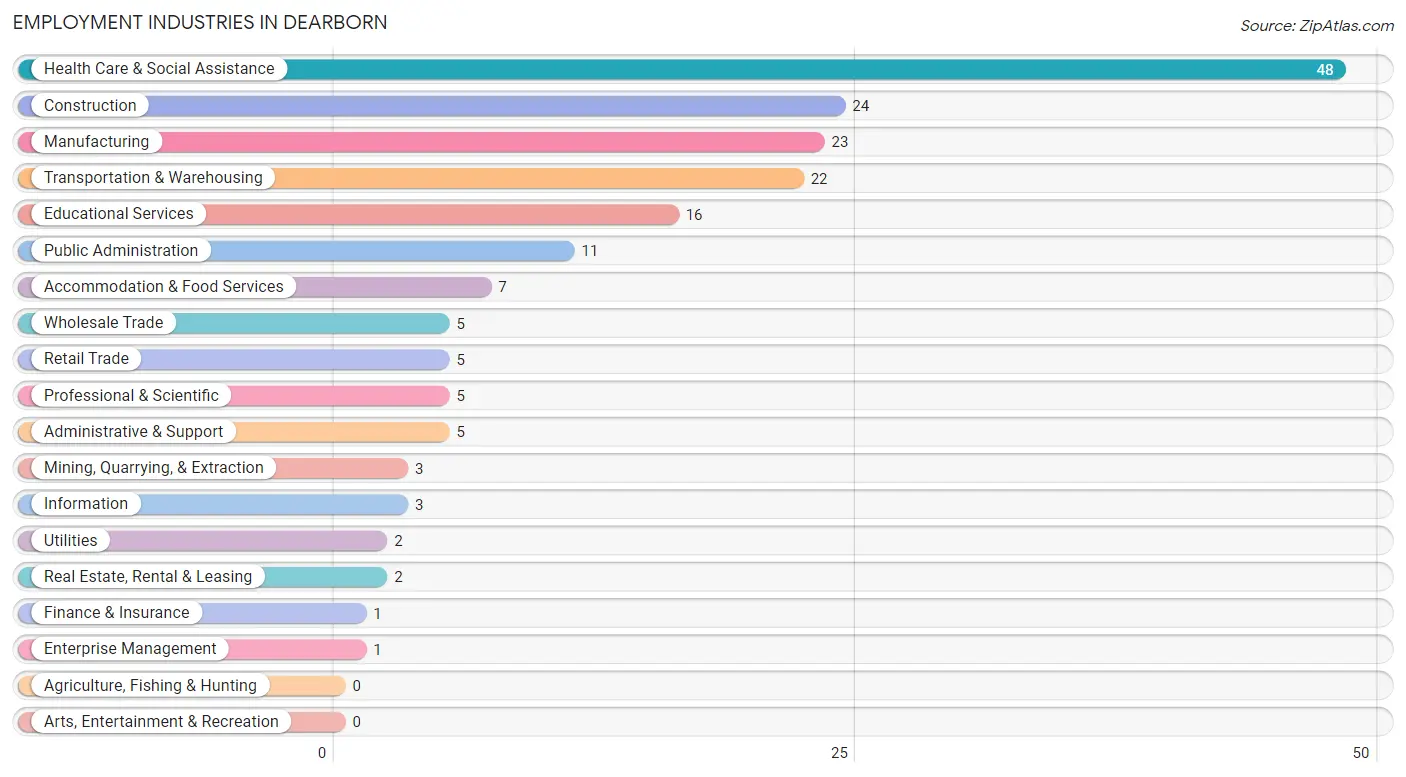
Employment Industries in Dearborn
The major employment industries in Dearborn include Health Care & Social Assistance (48 | 26.0%), Construction (24 | 13.0%), Manufacturing (23 | 12.4%), Transportation & Warehousing (22 | 11.9%), and Educational Services (16 | 8.6%).
Employment Industries by Sex in Dearborn
The Dearborn industries that see more men than women are Mining, Quarrying, & Extraction (100.0%), Construction (100.0%), and Wholesale Trade (100.0%), whereas the industries that tend to have a higher number of women are Retail Trade (100.0%), Information (100.0%), and Finance & Insurance (100.0%).
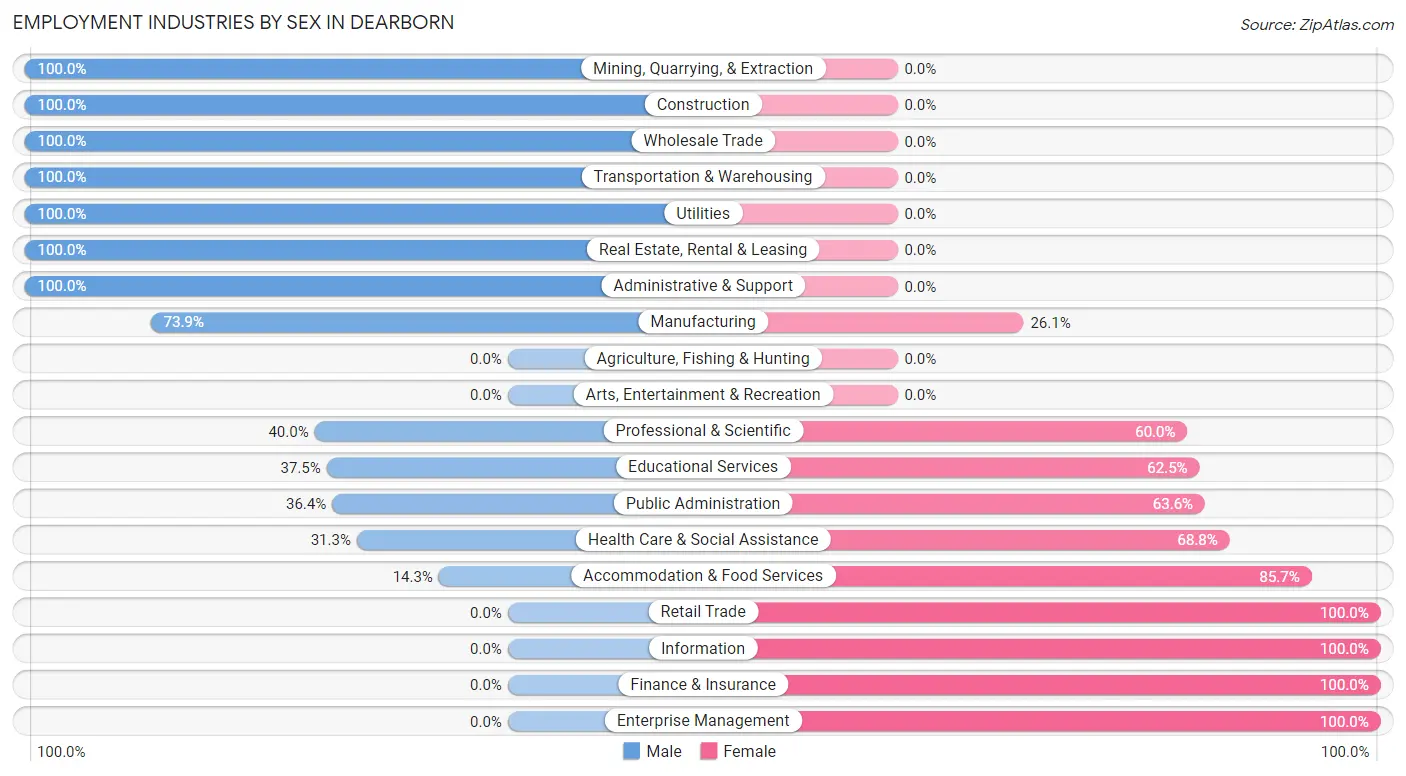
| Industry | Male | Female |
| Agriculture, Fishing & Hunting | 0 (0.0%) | 0 (0.0%) |
| Mining, Quarrying, & Extraction | 3 (100.0%) | 0 (0.0%) |
| Construction | 24 (100.0%) | 0 (0.0%) |
| Manufacturing | 17 (73.9%) | 6 (26.1%) |
| Wholesale Trade | 5 (100.0%) | 0 (0.0%) |
| Retail Trade | 0 (0.0%) | 5 (100.0%) |
| Transportation & Warehousing | 22 (100.0%) | 0 (0.0%) |
| Utilities | 2 (100.0%) | 0 (0.0%) |
| Information | 0 (0.0%) | 3 (100.0%) |
| Finance & Insurance | 0 (0.0%) | 1 (100.0%) |
| Real Estate, Rental & Leasing | 2 (100.0%) | 0 (0.0%) |
| Professional & Scientific | 2 (40.0%) | 3 (60.0%) |
| Enterprise Management | 0 (0.0%) | 1 (100.0%) |
| Administrative & Support | 5 (100.0%) | 0 (0.0%) |
| Educational Services | 6 (37.5%) | 10 (62.5%) |
| Health Care & Social Assistance | 15 (31.2%) | 33 (68.8%) |
| Arts, Entertainment & Recreation | 0 (0.0%) | 0 (0.0%) |
| Accommodation & Food Services | 1 (14.3%) | 6 (85.7%) |
| Public Administration | 4 (36.4%) | 7 (63.6%) |
| Total | 108 (58.4%) | 77 (41.6%) |
Education in Dearborn
School Enrollment in Dearborn
The most common levels of schooling among the 117 students in Dearborn are high school (43 | 36.7%), elementary school (39 | 33.3%), and middle school (24 | 20.5%).
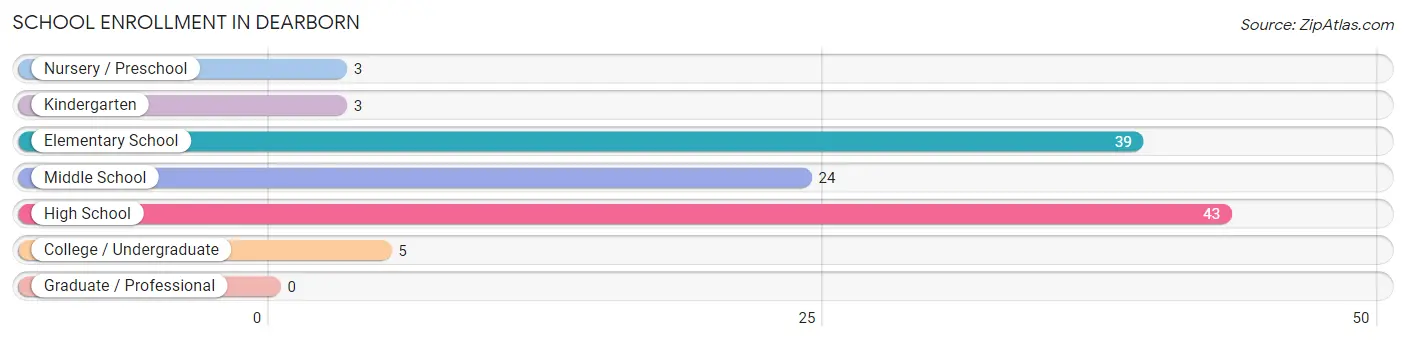
| School Level | # Students | % Students |
| Nursery / Preschool | 3 | 2.6% |
| Kindergarten | 3 | 2.6% |
| Elementary School | 39 | 33.3% |
| Middle School | 24 | 20.5% |
| High School | 43 | 36.7% |
| College / Undergraduate | 5 | 4.3% |
| Graduate / Professional | 0 | 0.0% |
| Total | 117 | 100.0% |
School Enrollment by Age by Funding Source in Dearborn
Out of a total of 117 students who are enrolled in schools in Dearborn, 3 (2.6%) attend a private institution, while the remaining 114 (97.4%) are enrolled in public schools. The age group of 35 years and over has the highest likelihood of being enrolled in private schools, with 1 (33.3% in the age bracket) enrolled. Conversely, the age group of 10 to 14 year olds has the lowest likelihood of being enrolled in a private school, with 33 (100.0% in the age bracket) attending a public institution.
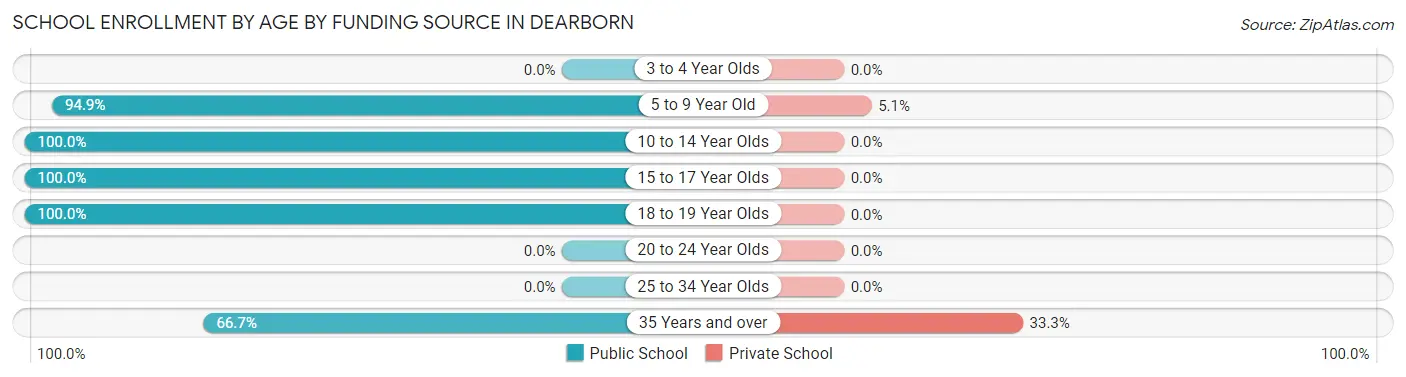
| Age Bracket | Public School | Private School |
| 3 to 4 Year Olds | 0 (0.0%) | 0 (0.0%) |
| 5 to 9 Year Old | 37 (94.9%) | 2 (5.1%) |
| 10 to 14 Year Olds | 33 (100.0%) | 0 (0.0%) |
| 15 to 17 Year Olds | 30 (100.0%) | 0 (0.0%) |
| 18 to 19 Year Olds | 12 (100.0%) | 0 (0.0%) |
| 20 to 24 Year Olds | 0 (0.0%) | 0 (0.0%) |
| 25 to 34 Year Olds | 0 (0.0%) | 0 (0.0%) |
| 35 Years and over | 2 (66.7%) | 1 (33.3%) |
| Total | 114 (97.4%) | 3 (2.6%) |
Educational Attainment by Field of Study in Dearborn
Science & technology (21 | 38.9%), education (19 | 35.2%), business (7 | 13.0%), computers & mathematics (3 | 5.6%), and psychology (2 | 3.7%) are the most common fields of study among 54 individuals in Dearborn who have obtained a bachelor's degree or higher.
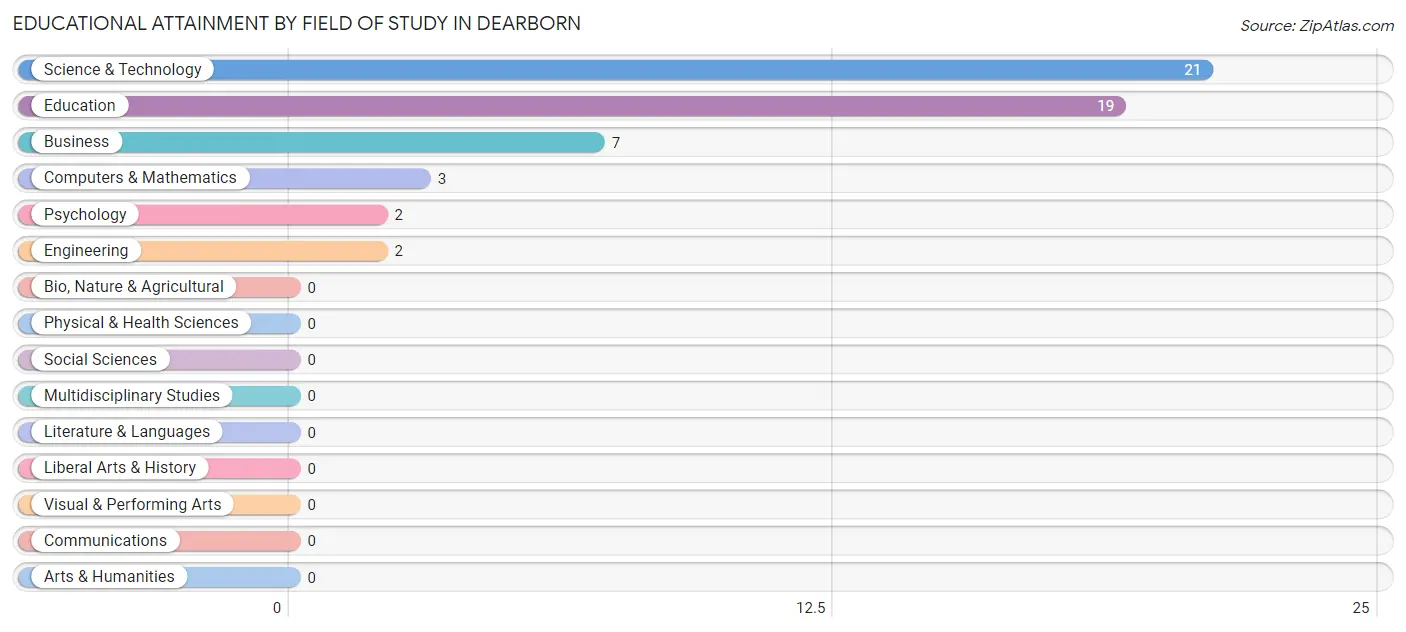
| Field of Study | # Graduates | % Graduates |
| Computers & Mathematics | 3 | 5.6% |
| Bio, Nature & Agricultural | 0 | 0.0% |
| Physical & Health Sciences | 0 | 0.0% |
| Psychology | 2 | 3.7% |
| Social Sciences | 0 | 0.0% |
| Engineering | 2 | 3.7% |
| Multidisciplinary Studies | 0 | 0.0% |
| Science & Technology | 21 | 38.9% |
| Business | 7 | 13.0% |
| Education | 19 | 35.2% |
| Literature & Languages | 0 | 0.0% |
| Liberal Arts & History | 0 | 0.0% |
| Visual & Performing Arts | 0 | 0.0% |
| Communications | 0 | 0.0% |
| Arts & Humanities | 0 | 0.0% |
| Total | 54 | 100.0% |
Transportation & Commute in Dearborn
Vehicle Availability by Sex in Dearborn
The most prevalent vehicle ownership categories in Dearborn are males with 2 vehicles (32, accounting for 31.1%) and females with 2 vehicles (20, making up 41.6%).
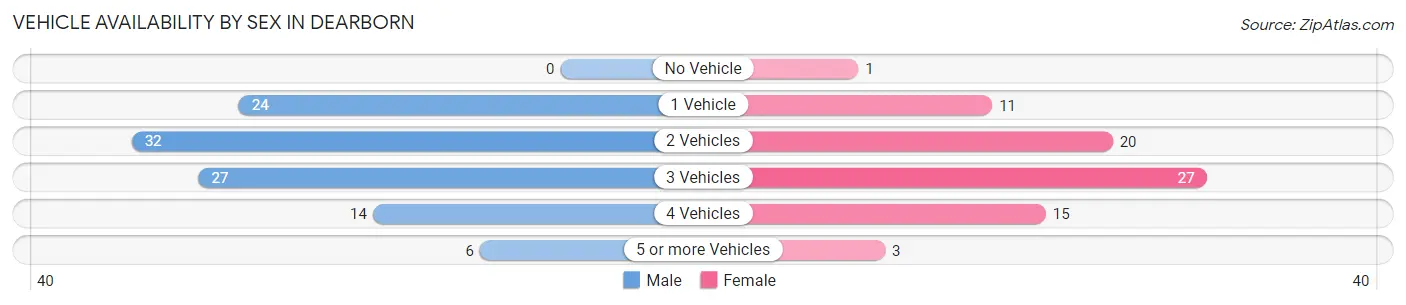
| Vehicles Available | Male | Female |
| No Vehicle | 0 (0.0%) | 1 (1.3%) |
| 1 Vehicle | 24 (23.3%) | 11 (14.3%) |
| 2 Vehicles | 32 (31.1%) | 20 (26.0%) |
| 3 Vehicles | 27 (26.2%) | 27 (35.1%) |
| 4 Vehicles | 14 (13.6%) | 15 (19.5%) |
| 5 or more Vehicles | 6 (5.8%) | 3 (3.9%) |
| Total | 103 (100.0%) | 77 (100.0%) |
Commute Time in Dearborn
The most frequently occuring commute durations in Dearborn are 40 to 44 minutes (34 commuters, 19.7%), 20 to 24 minutes (24 commuters, 13.9%), and 45 to 59 minutes (22 commuters, 12.7%).
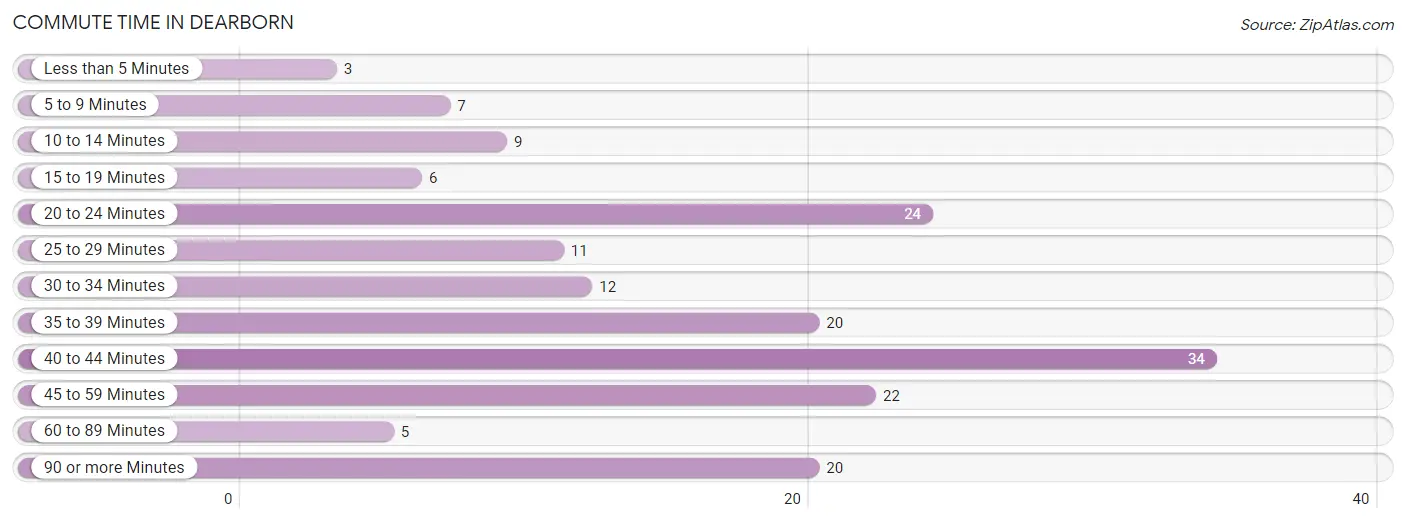
| Commute Time | # Commuters | % Commuters |
| Less than 5 Minutes | 3 | 1.7% |
| 5 to 9 Minutes | 7 | 4.1% |
| 10 to 14 Minutes | 9 | 5.2% |
| 15 to 19 Minutes | 6 | 3.5% |
| 20 to 24 Minutes | 24 | 13.9% |
| 25 to 29 Minutes | 11 | 6.4% |
| 30 to 34 Minutes | 12 | 6.9% |
| 35 to 39 Minutes | 20 | 11.6% |
| 40 to 44 Minutes | 34 | 19.7% |
| 45 to 59 Minutes | 22 | 12.7% |
| 60 to 89 Minutes | 5 | 2.9% |
| 90 or more Minutes | 20 | 11.6% |
Commute Time by Sex in Dearborn
The most common commute times in Dearborn are 40 to 44 minutes (21 commuters, 20.8%) for males and 40 to 44 minutes (13 commuters, 18.1%) for females.
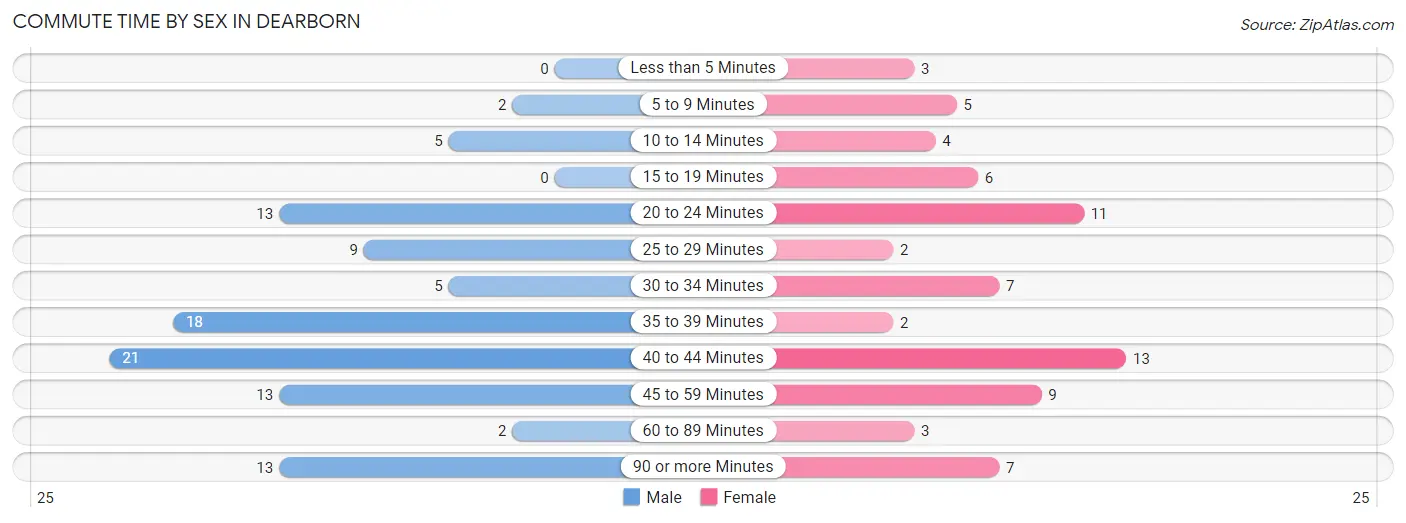
| Commute Time | Male | Female |
| Less than 5 Minutes | 0 (0.0%) | 3 (4.2%) |
| 5 to 9 Minutes | 2 (2.0%) | 5 (6.9%) |
| 10 to 14 Minutes | 5 (5.0%) | 4 (5.6%) |
| 15 to 19 Minutes | 0 (0.0%) | 6 (8.3%) |
| 20 to 24 Minutes | 13 (12.9%) | 11 (15.3%) |
| 25 to 29 Minutes | 9 (8.9%) | 2 (2.8%) |
| 30 to 34 Minutes | 5 (5.0%) | 7 (9.7%) |
| 35 to 39 Minutes | 18 (17.8%) | 2 (2.8%) |
| 40 to 44 Minutes | 21 (20.8%) | 13 (18.1%) |
| 45 to 59 Minutes | 13 (12.9%) | 9 (12.5%) |
| 60 to 89 Minutes | 2 (2.0%) | 3 (4.2%) |
| 90 or more Minutes | 13 (12.9%) | 7 (9.7%) |
Time of Departure to Work by Sex in Dearborn
The most frequent times of departure to work in Dearborn are 6:30 AM to 6:59 AM (31, 30.7%) for males and 7:00 AM to 7:29 AM (19, 26.4%) for females.
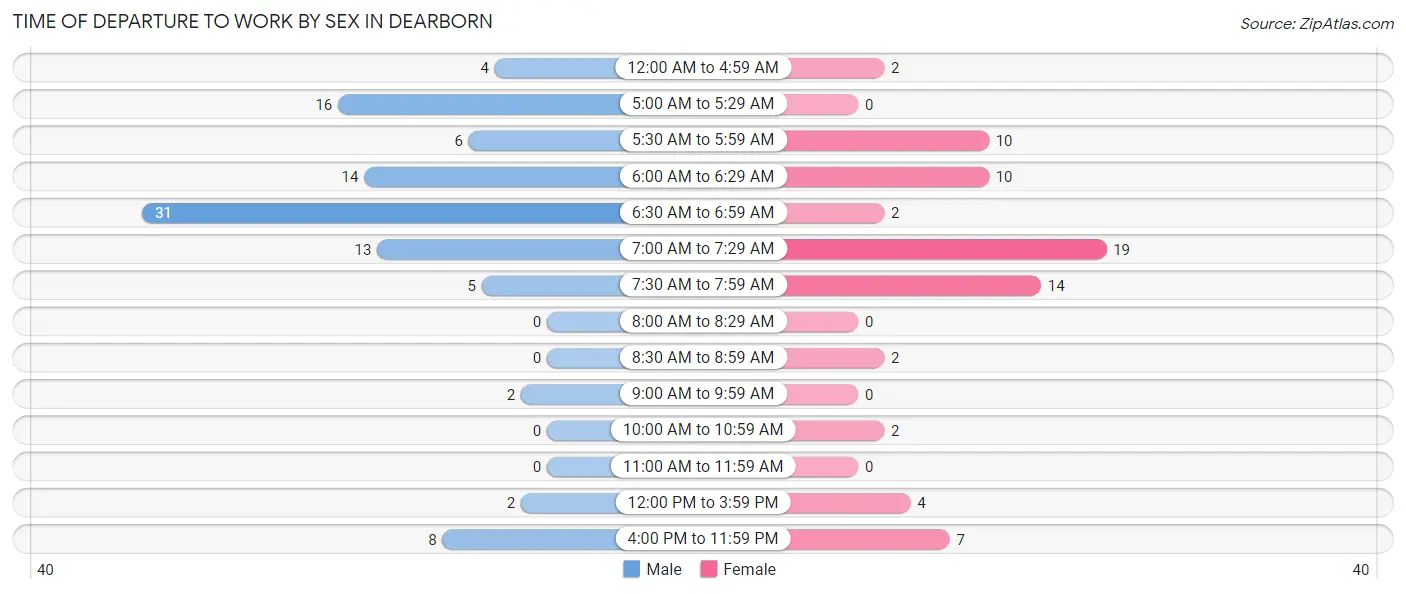
| Time of Departure | Male | Female |
| 12:00 AM to 4:59 AM | 4 (4.0%) | 2 (2.8%) |
| 5:00 AM to 5:29 AM | 16 (15.8%) | 0 (0.0%) |
| 5:30 AM to 5:59 AM | 6 (5.9%) | 10 (13.9%) |
| 6:00 AM to 6:29 AM | 14 (13.9%) | 10 (13.9%) |
| 6:30 AM to 6:59 AM | 31 (30.7%) | 2 (2.8%) |
| 7:00 AM to 7:29 AM | 13 (12.9%) | 19 (26.4%) |
| 7:30 AM to 7:59 AM | 5 (5.0%) | 14 (19.4%) |
| 8:00 AM to 8:29 AM | 0 (0.0%) | 0 (0.0%) |
| 8:30 AM to 8:59 AM | 0 (0.0%) | 2 (2.8%) |
| 9:00 AM to 9:59 AM | 2 (2.0%) | 0 (0.0%) |
| 10:00 AM to 10:59 AM | 0 (0.0%) | 2 (2.8%) |
| 11:00 AM to 11:59 AM | 0 (0.0%) | 0 (0.0%) |
| 12:00 PM to 3:59 PM | 2 (2.0%) | 4 (5.6%) |
| 4:00 PM to 11:59 PM | 8 (7.9%) | 7 (9.7%) |
| Total | 101 (100.0%) | 72 (100.0%) |
Housing Occupancy in Dearborn
Occupancy by Ownership in Dearborn
Of the total 212 dwellings in Dearborn, owner-occupied units account for 161 (75.9%), while renter-occupied units make up 51 (24.1%).
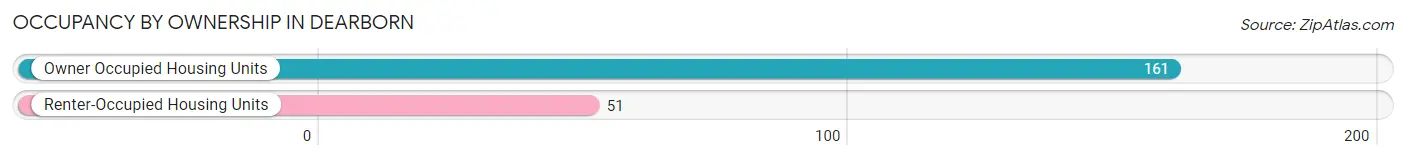
| Occupancy | # Housing Units | % Housing Units |
| Owner Occupied Housing Units | 161 | 75.9% |
| Renter-Occupied Housing Units | 51 | 24.1% |
| Total Occupied Housing Units | 212 | 100.0% |
Occupancy by Household Size in Dearborn
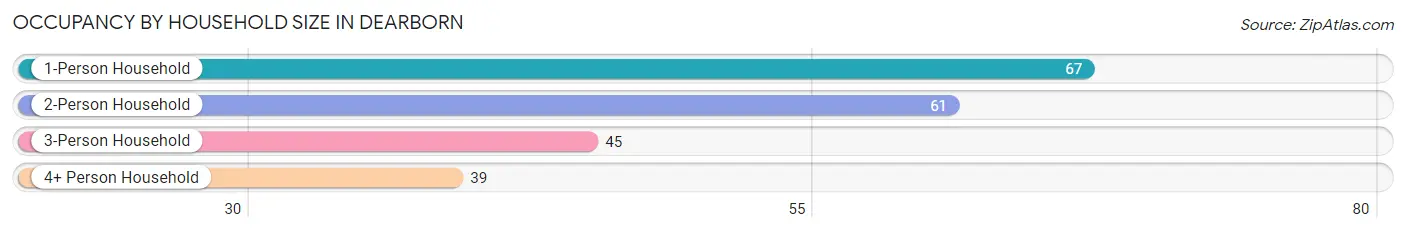
| Household Size | # Housing Units | % Housing Units |
| 1-Person Household | 67 | 31.6% |
| 2-Person Household | 61 | 28.8% |
| 3-Person Household | 45 | 21.2% |
| 4+ Person Household | 39 | 18.4% |
| Total Housing Units | 212 | 100.0% |
Occupancy by Ownership by Household Size in Dearborn
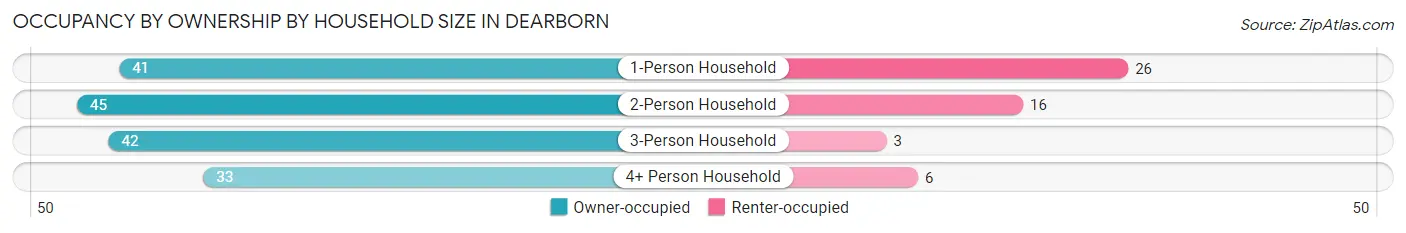
| Household Size | Owner-occupied | Renter-occupied |
| 1-Person Household | 41 (61.2%) | 26 (38.8%) |
| 2-Person Household | 45 (73.8%) | 16 (26.2%) |
| 3-Person Household | 42 (93.3%) | 3 (6.7%) |
| 4+ Person Household | 33 (84.6%) | 6 (15.4%) |
| Total Housing Units | 161 (75.9%) | 51 (24.1%) |
Occupancy by Educational Attainment in Dearborn
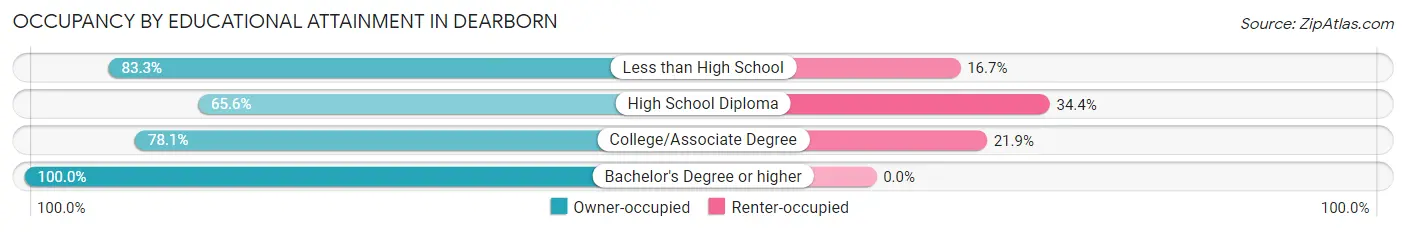
| Household Size | Owner-occupied | Renter-occupied |
| Less than High School | 10 (83.3%) | 2 (16.7%) |
| High School Diploma | 63 (65.6%) | 33 (34.4%) |
| College/Associate Degree | 57 (78.1%) | 16 (21.9%) |
| Bachelor's Degree or higher | 31 (100.0%) | 0 (0.0%) |
Occupancy by Age of Householder in Dearborn
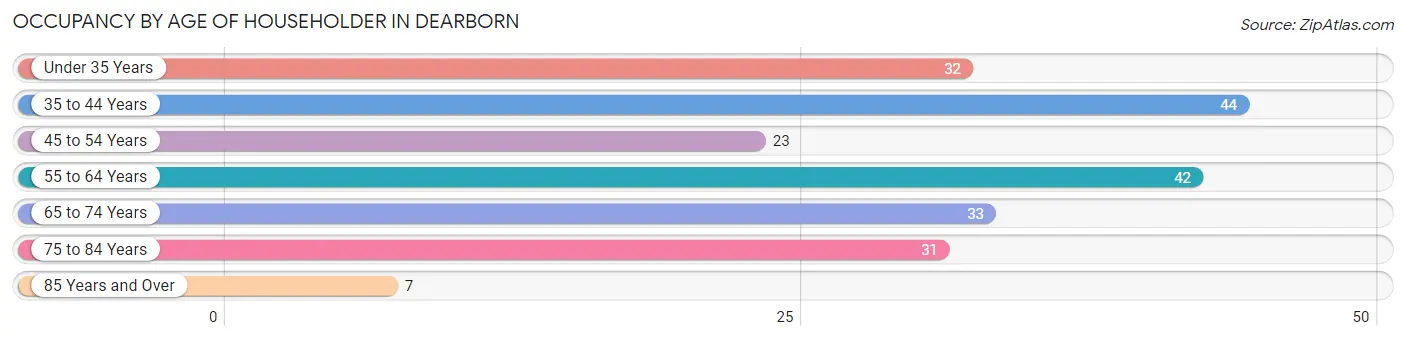
| Age Bracket | # Households | % Households |
| Under 35 Years | 32 | 15.1% |
| 35 to 44 Years | 44 | 20.7% |
| 45 to 54 Years | 23 | 10.8% |
| 55 to 64 Years | 42 | 19.8% |
| 65 to 74 Years | 33 | 15.6% |
| 75 to 84 Years | 31 | 14.6% |
| 85 Years and Over | 7 | 3.3% |
| Total | 212 | 100.0% |
Housing Finances in Dearborn
Median Income by Occupancy in Dearborn
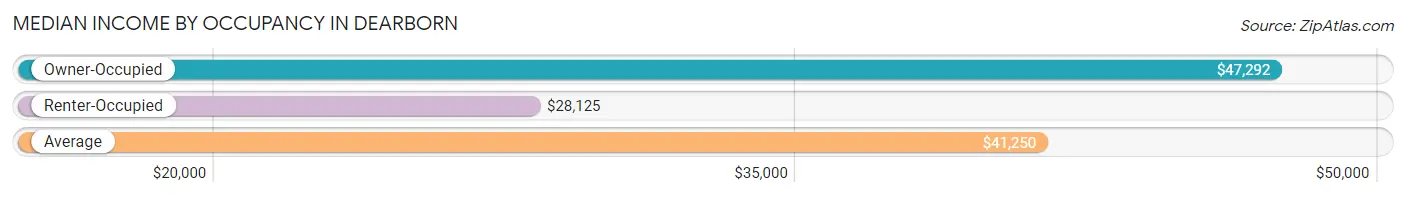
| Occupancy Type | # Households | Median Income |
| Owner-Occupied | 161 (75.9%) | $47,292 |
| Renter-Occupied | 51 (24.1%) | $28,125 |
| Average | 212 (100.0%) | $41,250 |
Occupancy by Householder Income Bracket in Dearborn
| Income Bracket | Owner-occupied | Renter-occupied |
| Less than $5,000 | 0 (0.0%) | 0 (0.0%) |
| $5,000 to $9,999 | 0 (0.0%) | 5 (9.8%) |
| $10,000 to $14,999 | 0 (0.0%) | 14 (27.5%) |
| $15,000 to $19,999 | 0 (0.0%) | 3 (5.9%) |
| $20,000 to $24,999 | 31 (19.3%) | 0 (0.0%) |
| $25,000 to $34,999 | 24 (14.9%) | 9 (17.6%) |
| $35,000 to $49,999 | 32 (19.9%) | 7 (13.7%) |
| $50,000 to $74,999 | 8 (5.0%) | 6 (11.8%) |
| $75,000 to $99,999 | 41 (25.5%) | 5 (9.8%) |
| $100,000 to $149,999 | 20 (12.4%) | 2 (3.9%) |
| $150,000 or more | 5 (3.1%) | 0 (0.0%) |
| Total | 161 (100.0%) | 51 (100.0%) |
Monthly Housing Cost Tiers in Dearborn
| Monthly Cost | Owner-occupied | Renter-occupied |
| Less than $300 | 2 (1.2%) | 8 (15.7%) |
| $300 to $499 | 27 (16.8%) | 18 (35.3%) |
| $500 to $799 | 34 (21.1%) | 6 (11.8%) |
| $800 to $999 | 23 (14.3%) | 10 (19.6%) |
| $1,000 to $1,499 | 45 (28.0%) | 9 (17.6%) |
| $1,500 to $1,999 | 15 (9.3%) | 0 (0.0%) |
| $2,000 to $2,499 | 6 (3.7%) | 0 (0.0%) |
| $2,500 to $2,999 | 9 (5.6%) | 0 (0.0%) |
| $3,000 or more | 0 (0.0%) | 0 (0.0%) |
| Total | 161 (100.0%) | 51 (100.0%) |
Physical Housing Characteristics in Dearborn
Housing Structures in Dearborn
| Structure Type | # Housing Units | % Housing Units |
| Single Unit, Detached | 174 | 82.1% |
| Single Unit, Attached | 2 | 0.9% |
| 2 Unit Apartments | 2 | 0.9% |
| 3 or 4 Unit Apartments | 18 | 8.5% |
| 5 to 9 Unit Apartments | 16 | 7.5% |
| 10 or more Apartments | 0 | 0.0% |
| Mobile Home / Other | 0 | 0.0% |
| Total | 212 | 100.0% |
Housing Structures by Occupancy in Dearborn
| Structure Type | Owner-occupied | Renter-occupied |
| Single Unit, Detached | 157 (90.2%) | 17 (9.8%) |
| Single Unit, Attached | 2 (100.0%) | 0 (0.0%) |
| 2 Unit Apartments | 2 (100.0%) | 0 (0.0%) |
| 3 or 4 Unit Apartments | 0 (0.0%) | 18 (100.0%) |
| 5 to 9 Unit Apartments | 0 (0.0%) | 16 (100.0%) |
| 10 or more Apartments | 0 (0.0%) | 0 (0.0%) |
| Mobile Home / Other | 0 (0.0%) | 0 (0.0%) |
| Total | 161 (75.9%) | 51 (24.1%) |
Housing Structures by Number of Rooms in Dearborn
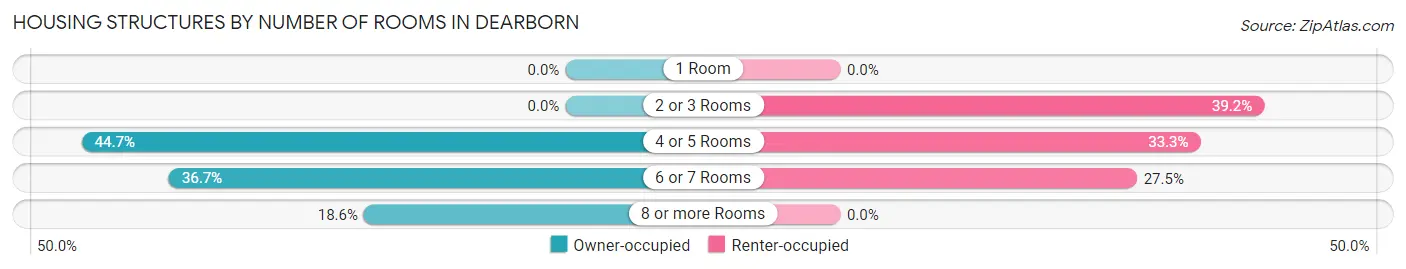
| Number of Rooms | Owner-occupied | Renter-occupied |
| 1 Room | 0 (0.0%) | 0 (0.0%) |
| 2 or 3 Rooms | 0 (0.0%) | 20 (39.2%) |
| 4 or 5 Rooms | 72 (44.7%) | 17 (33.3%) |
| 6 or 7 Rooms | 59 (36.6%) | 14 (27.5%) |
| 8 or more Rooms | 30 (18.6%) | 0 (0.0%) |
| Total | 161 (100.0%) | 51 (100.0%) |
Housing Structure by Heating Type in Dearborn
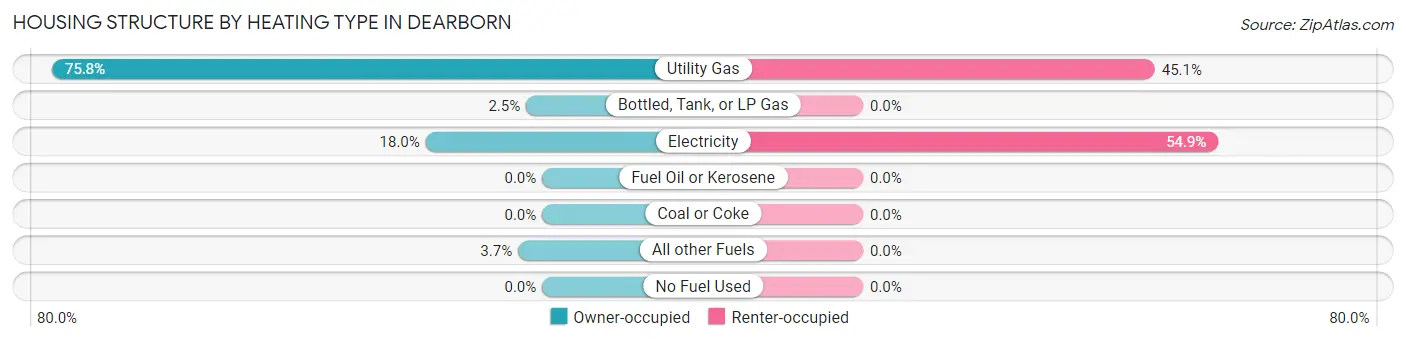
| Heating Type | Owner-occupied | Renter-occupied |
| Utility Gas | 122 (75.8%) | 23 (45.1%) |
| Bottled, Tank, or LP Gas | 4 (2.5%) | 0 (0.0%) |
| Electricity | 29 (18.0%) | 28 (54.9%) |
| Fuel Oil or Kerosene | 0 (0.0%) | 0 (0.0%) |
| Coal or Coke | 0 (0.0%) | 0 (0.0%) |
| All other Fuels | 6 (3.7%) | 0 (0.0%) |
| No Fuel Used | 0 (0.0%) | 0 (0.0%) |
| Total | 161 (100.0%) | 51 (100.0%) |
Household Vehicle Usage in Dearborn
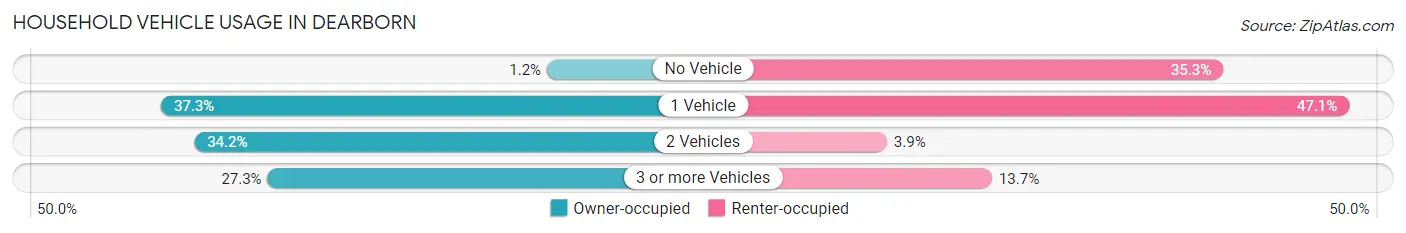
| Vehicles per Household | Owner-occupied | Renter-occupied |
| No Vehicle | 2 (1.2%) | 18 (35.3%) |
| 1 Vehicle | 60 (37.3%) | 24 (47.1%) |
| 2 Vehicles | 55 (34.2%) | 2 (3.9%) |
| 3 or more Vehicles | 44 (27.3%) | 7 (13.7%) |
| Total | 161 (100.0%) | 51 (100.0%) |
Real Estate & Mortgages in Dearborn
Real Estate and Mortgage Overview in Dearborn
| Characteristic | Without Mortgage | With Mortgage |
| Housing Units | 57 | 104 |
| Median Property Value | $147,500 | $157,600 |
| Median Household Income | - | - |
| Monthly Housing Costs | $498 | $0 |
| Real Estate Taxes | $1,807 | $2 |
Property Value by Mortgage Status in Dearborn
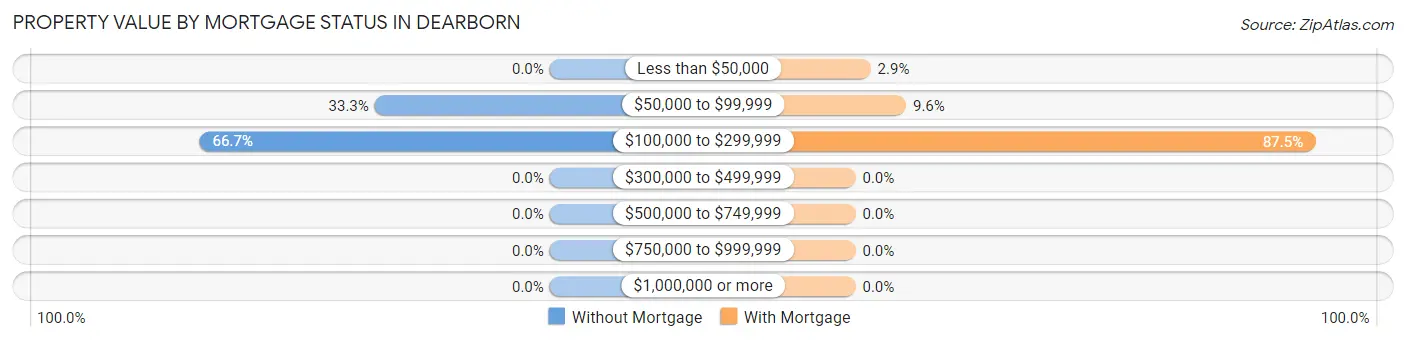
| Property Value | Without Mortgage | With Mortgage |
| Less than $50,000 | 0 (0.0%) | 3 (2.9%) |
| $50,000 to $99,999 | 19 (33.3%) | 10 (9.6%) |
| $100,000 to $299,999 | 38 (66.7%) | 91 (87.5%) |
| $300,000 to $499,999 | 0 (0.0%) | 0 (0.0%) |
| $500,000 to $749,999 | 0 (0.0%) | 0 (0.0%) |
| $750,000 to $999,999 | 0 (0.0%) | 0 (0.0%) |
| $1,000,000 or more | 0 (0.0%) | 0 (0.0%) |
| Total | 57 (100.0%) | 104 (100.0%) |
Household Income by Mortgage Status in Dearborn
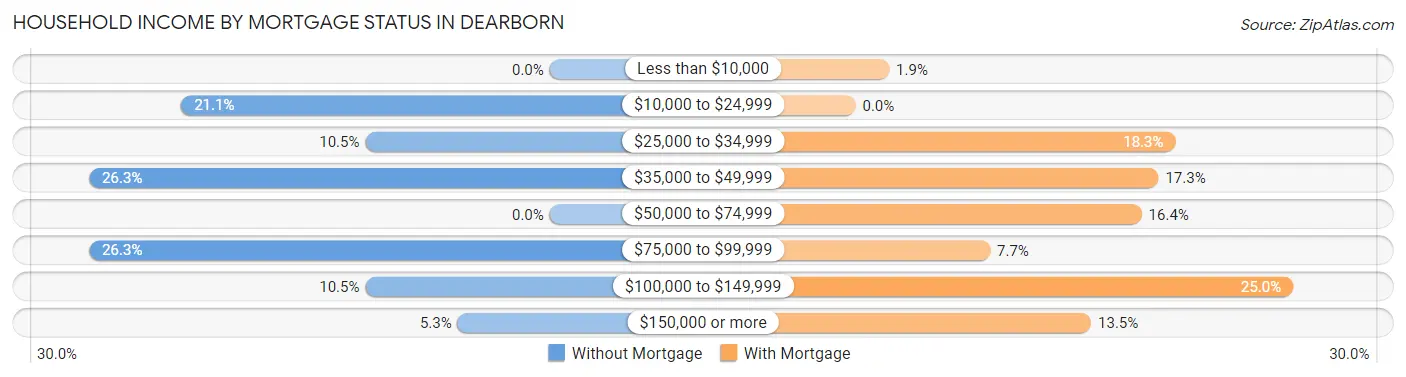
| Household Income | Without Mortgage | With Mortgage |
| Less than $10,000 | 0 (0.0%) | 2 (1.9%) |
| $10,000 to $24,999 | 12 (21.0%) | 0 (0.0%) |
| $25,000 to $34,999 | 6 (10.5%) | 19 (18.3%) |
| $35,000 to $49,999 | 15 (26.3%) | 18 (17.3%) |
| $50,000 to $74,999 | 0 (0.0%) | 17 (16.4%) |
| $75,000 to $99,999 | 15 (26.3%) | 8 (7.7%) |
| $100,000 to $149,999 | 6 (10.5%) | 26 (25.0%) |
| $150,000 or more | 3 (5.3%) | 14 (13.5%) |
| Total | 57 (100.0%) | 104 (100.0%) |
Property Value to Household Income Ratio in Dearborn
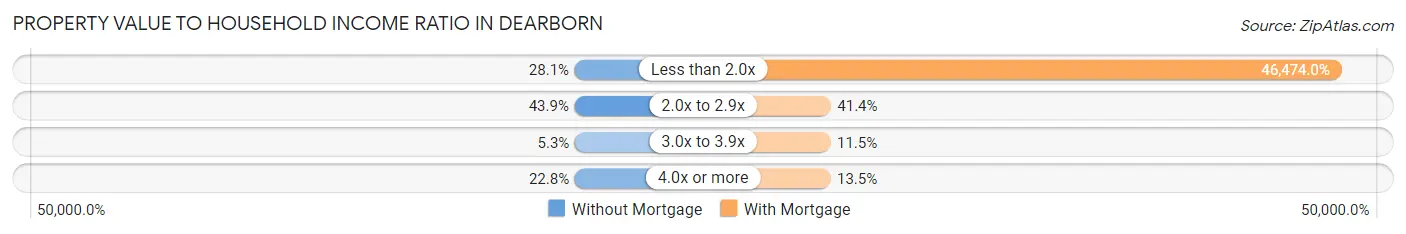
| Value-to-Income Ratio | Without Mortgage | With Mortgage |
| Less than 2.0x | 16 (28.1%) | 48,333 (46,474.0%) |
| 2.0x to 2.9x | 25 (43.9%) | 43 (41.3%) |
| 3.0x to 3.9x | 3 (5.3%) | 12 (11.5%) |
| 4.0x or more | 13 (22.8%) | 14 (13.5%) |
| Total | 57 (100.0%) | 104 (100.0%) |
Real Estate Taxes by Mortgage Status in Dearborn
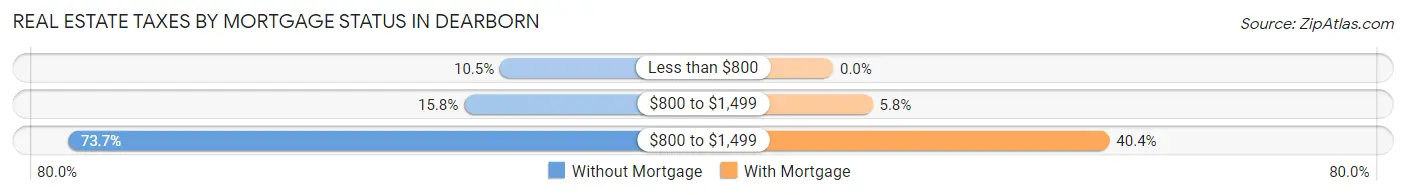
| Property Taxes | Without Mortgage | With Mortgage |
| Less than $800 | 6 (10.5%) | 0 (0.0%) |
| $800 to $1,499 | 9 (15.8%) | 6 (5.8%) |
| $800 to $1,499 | 42 (73.7%) | 42 (40.4%) |
| Total | 57 (100.0%) | 104 (100.0%) |
Health & Disability in Dearborn
Health Insurance Coverage by Age in Dearborn
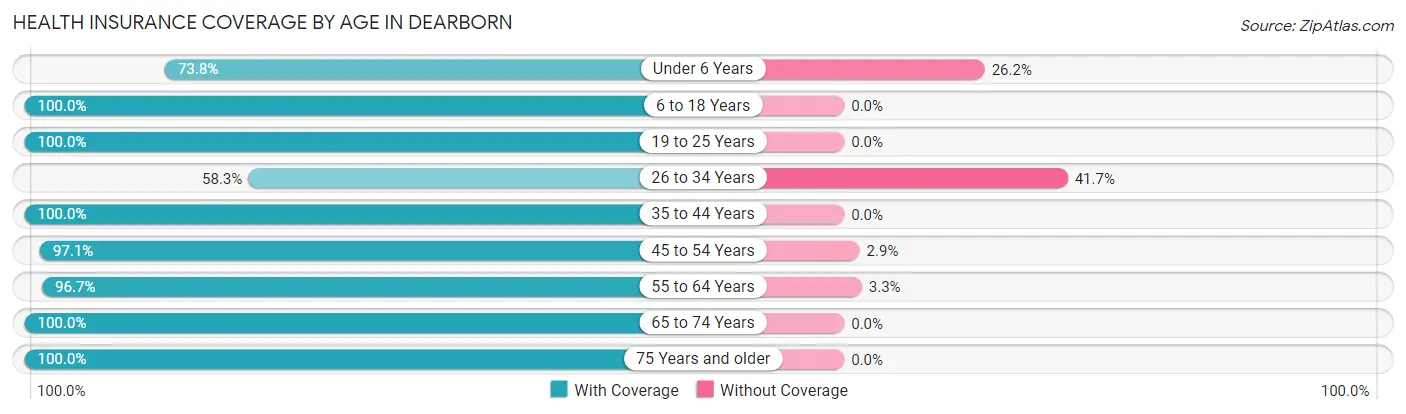
| Age Bracket | With Coverage | Without Coverage |
| Under 6 Years | 31 (73.8%) | 11 (26.2%) |
| 6 to 18 Years | 109 (100.0%) | 0 (0.0%) |
| 19 to 25 Years | 15 (100.0%) | 0 (0.0%) |
| 26 to 34 Years | 35 (58.3%) | 25 (41.7%) |
| 35 to 44 Years | 76 (100.0%) | 0 (0.0%) |
| 45 to 54 Years | 34 (97.1%) | 1 (2.9%) |
| 55 to 64 Years | 59 (96.7%) | 2 (3.3%) |
| 65 to 74 Years | 43 (100.0%) | 0 (0.0%) |
| 75 Years and older | 57 (100.0%) | 0 (0.0%) |
| Total | 459 (92.2%) | 39 (7.8%) |
Health Insurance Coverage by Citizenship Status in Dearborn
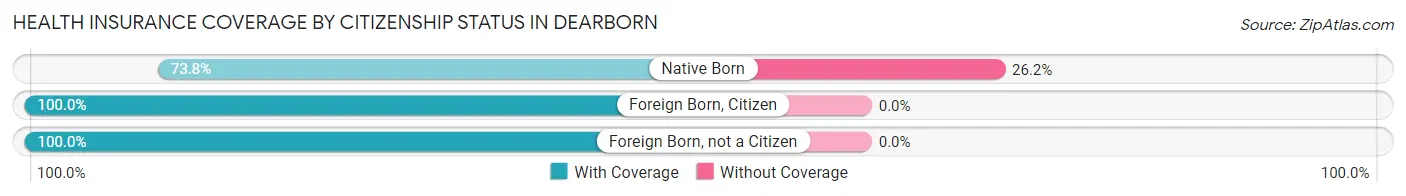
| Citizenship Status | With Coverage | Without Coverage |
| Native Born | 31 (73.8%) | 11 (26.2%) |
| Foreign Born, Citizen | 109 (100.0%) | 0 (0.0%) |
| Foreign Born, not a Citizen | 15 (100.0%) | 0 (0.0%) |
Health Insurance Coverage by Household Income in Dearborn
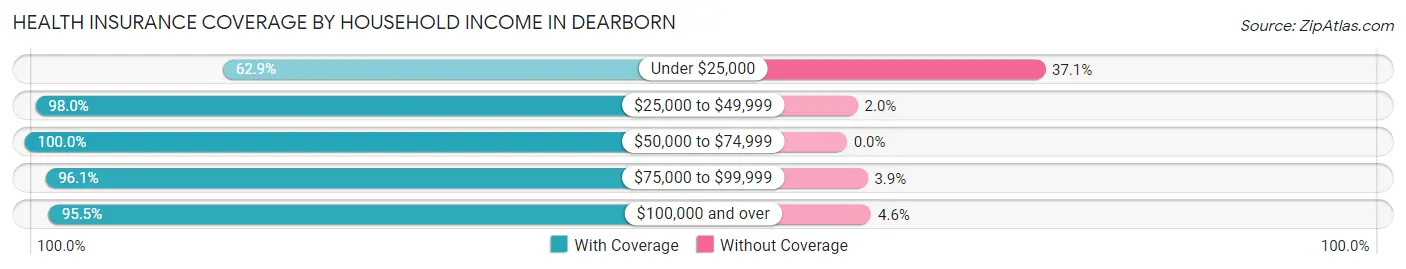
| Household Income | With Coverage | Without Coverage |
| Under $25,000 | 44 (62.9%) | 26 (37.1%) |
| $25,000 to $49,999 | 145 (98.0%) | 3 (2.0%) |
| $50,000 to $74,999 | 37 (100.0%) | 0 (0.0%) |
| $75,000 to $99,999 | 149 (96.1%) | 6 (3.9%) |
| $100,000 and over | 84 (95.5%) | 4 (4.5%) |
Public vs Private Health Insurance Coverage by Age in Dearborn
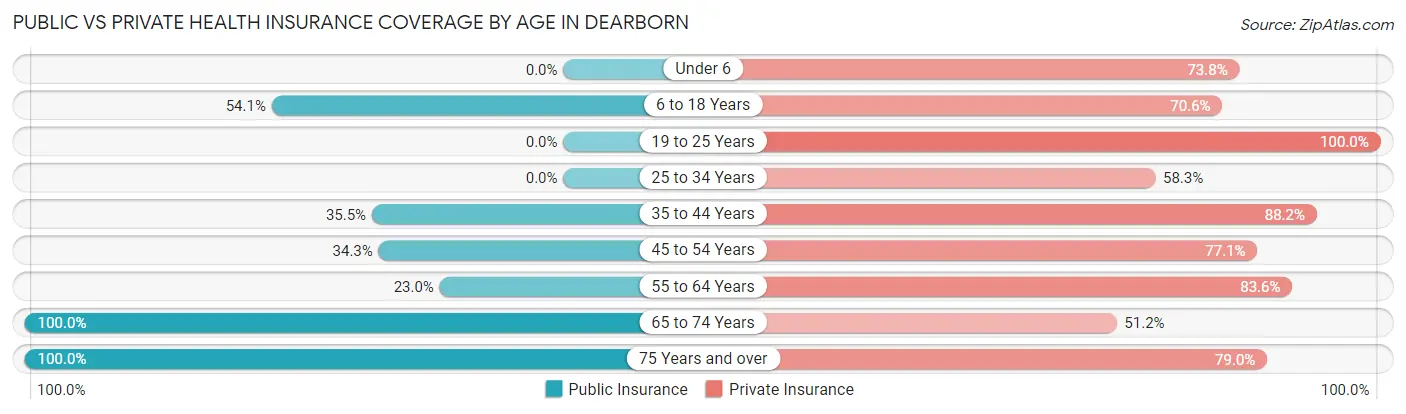
| Age Bracket | Public Insurance | Private Insurance |
| Under 6 | 0 (0.0%) | 31 (73.8%) |
| 6 to 18 Years | 59 (54.1%) | 77 (70.6%) |
| 19 to 25 Years | 0 (0.0%) | 15 (100.0%) |
| 25 to 34 Years | 0 (0.0%) | 35 (58.3%) |
| 35 to 44 Years | 27 (35.5%) | 67 (88.2%) |
| 45 to 54 Years | 12 (34.3%) | 27 (77.1%) |
| 55 to 64 Years | 14 (23.0%) | 51 (83.6%) |
| 65 to 74 Years | 43 (100.0%) | 22 (51.2%) |
| 75 Years and over | 57 (100.0%) | 45 (78.9%) |
| Total | 212 (42.6%) | 370 (74.3%) |
Disability Status by Sex by Age in Dearborn
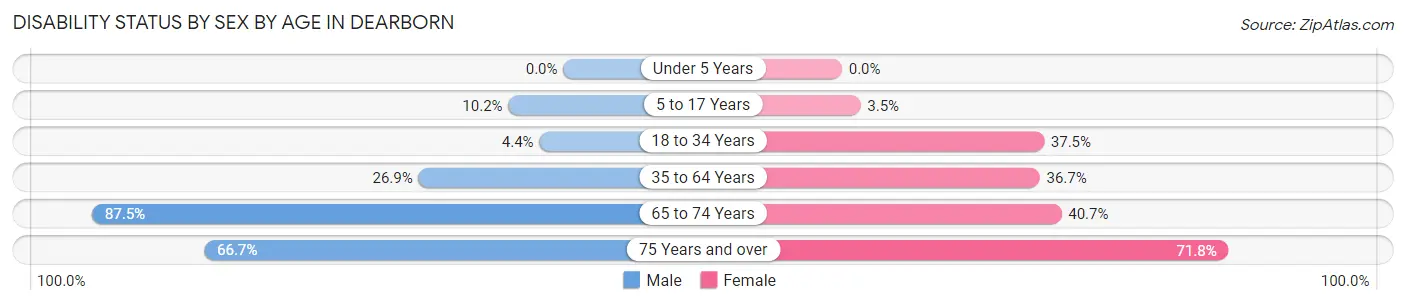
| Age Bracket | Male | Female |
| Under 5 Years | 0 (0.0%) | 0 (0.0%) |
| 5 to 17 Years | 5 (10.2%) | 2 (3.5%) |
| 18 to 34 Years | 2 (4.4%) | 15 (37.5%) |
| 35 to 64 Years | 25 (26.9%) | 29 (36.7%) |
| 65 to 74 Years | 14 (87.5%) | 11 (40.7%) |
| 75 Years and over | 12 (66.7%) | 28 (71.8%) |
Disability Class by Sex by Age in Dearborn
Disability Class: Hearing Difficulty
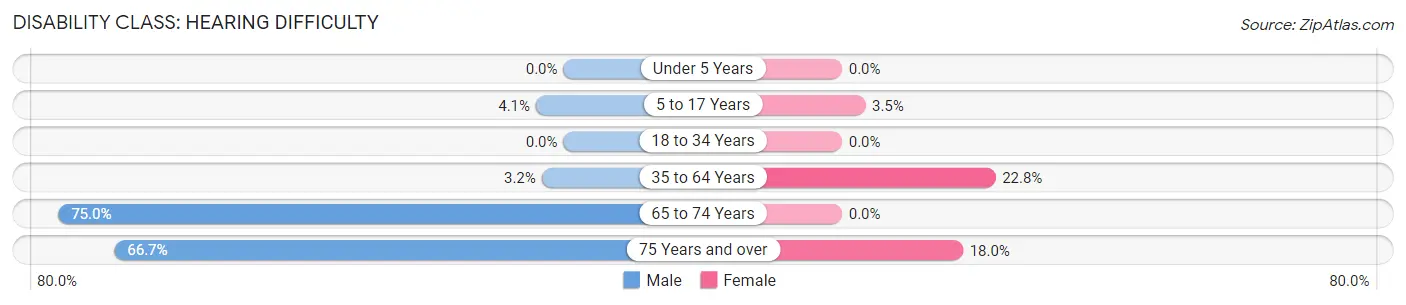
| Age Bracket | Male | Female |
| Under 5 Years | 0 (0.0%) | 0 (0.0%) |
| 5 to 17 Years | 2 (4.1%) | 2 (3.5%) |
| 18 to 34 Years | 0 (0.0%) | 0 (0.0%) |
| 35 to 64 Years | 3 (3.2%) | 18 (22.8%) |
| 65 to 74 Years | 12 (75.0%) | 0 (0.0%) |
| 75 Years and over | 12 (66.7%) | 7 (17.9%) |
Disability Class: Vision Difficulty
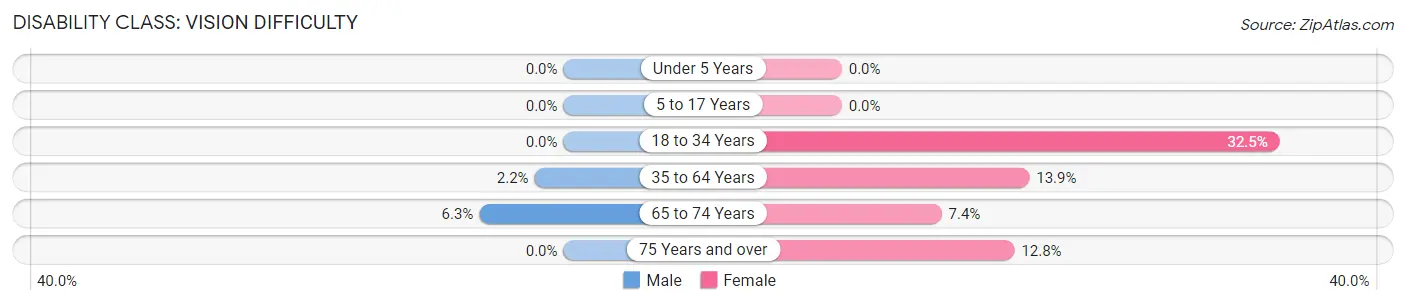
| Age Bracket | Male | Female |
| Under 5 Years | 0 (0.0%) | 0 (0.0%) |
| 5 to 17 Years | 0 (0.0%) | 0 (0.0%) |
| 18 to 34 Years | 0 (0.0%) | 13 (32.5%) |
| 35 to 64 Years | 2 (2.1%) | 11 (13.9%) |
| 65 to 74 Years | 1 (6.2%) | 2 (7.4%) |
| 75 Years and over | 0 (0.0%) | 5 (12.8%) |
Disability Class: Cognitive Difficulty
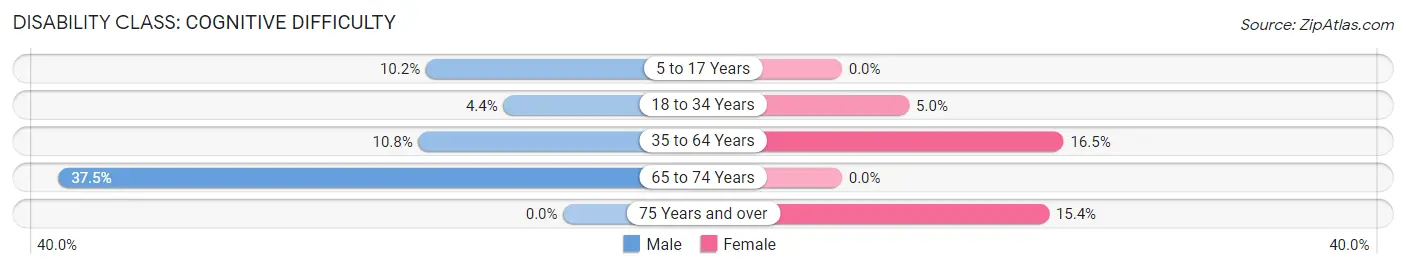
| Age Bracket | Male | Female |
| 5 to 17 Years | 5 (10.2%) | 0 (0.0%) |
| 18 to 34 Years | 2 (4.4%) | 2 (5.0%) |
| 35 to 64 Years | 10 (10.7%) | 13 (16.5%) |
| 65 to 74 Years | 6 (37.5%) | 0 (0.0%) |
| 75 Years and over | 0 (0.0%) | 6 (15.4%) |
Disability Class: Ambulatory Difficulty
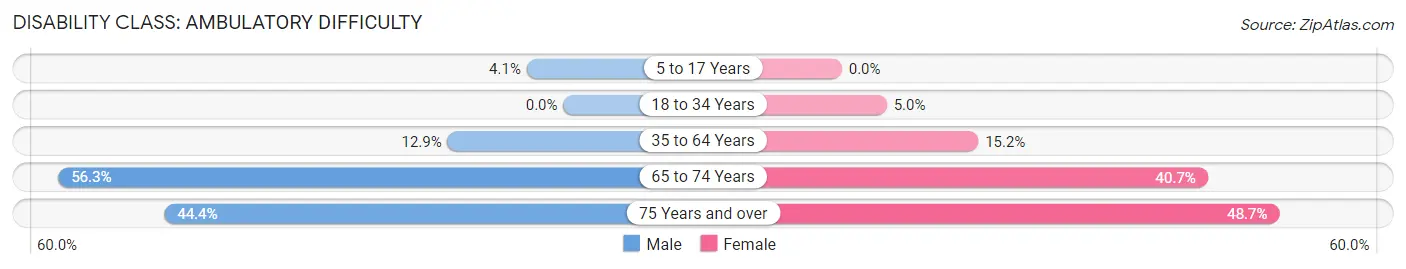
| Age Bracket | Male | Female |
| 5 to 17 Years | 2 (4.1%) | 0 (0.0%) |
| 18 to 34 Years | 0 (0.0%) | 2 (5.0%) |
| 35 to 64 Years | 12 (12.9%) | 12 (15.2%) |
| 65 to 74 Years | 9 (56.2%) | 11 (40.7%) |
| 75 Years and over | 8 (44.4%) | 19 (48.7%) |
Disability Class: Self-Care Difficulty
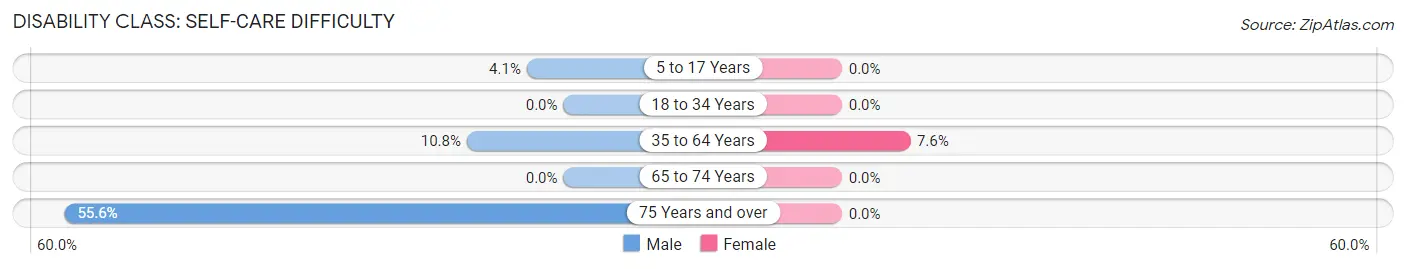
| Age Bracket | Male | Female |
| 5 to 17 Years | 2 (4.1%) | 0 (0.0%) |
| 18 to 34 Years | 0 (0.0%) | 0 (0.0%) |
| 35 to 64 Years | 10 (10.7%) | 6 (7.6%) |
| 65 to 74 Years | 0 (0.0%) | 0 (0.0%) |
| 75 Years and over | 10 (55.6%) | 0 (0.0%) |
Technology Access in Dearborn
Computing Device Access in Dearborn
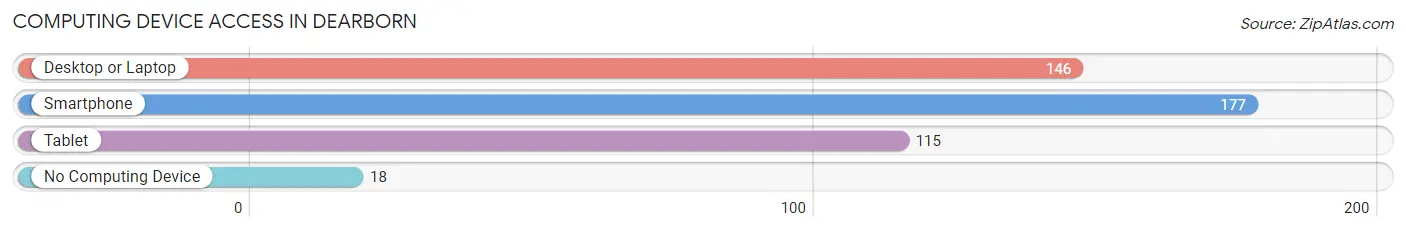
| Device Type | # Households | % Households |
| Desktop or Laptop | 146 | 68.9% |
| Smartphone | 177 | 83.5% |
| Tablet | 115 | 54.2% |
| No Computing Device | 18 | 8.5% |
| Total | 212 | 100.0% |
Internet Access in Dearborn
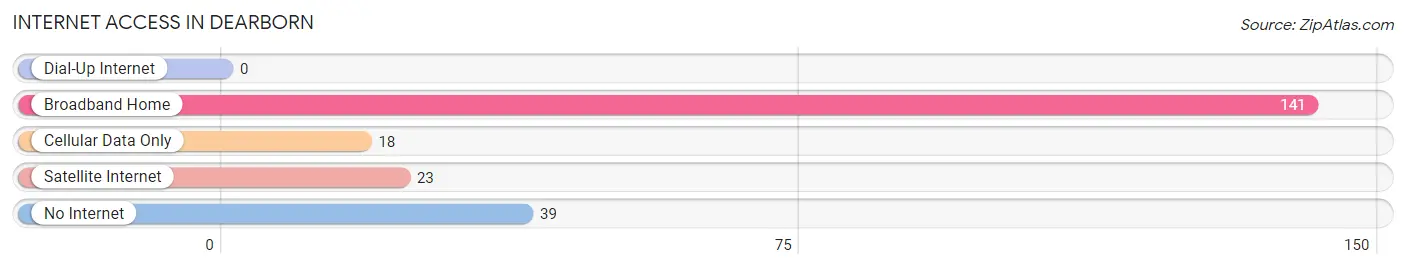
| Internet Type | # Households | % Households |
| Dial-Up Internet | 0 | 0.0% |
| Broadband Home | 141 | 66.5% |
| Cellular Data Only | 18 | 8.5% |
| Satellite Internet | 23 | 10.8% |
| No Internet | 39 | 18.4% |
| Total | 212 | 100.0% |
Dearborn Summary
Dearborn, Missouri is a small town located in Platte County, Missouri. It is situated on the banks of the Missouri River, approximately 30 miles north of Kansas City. The town was founded in 1837 and was named after Henry Dearborn, a Revolutionary War hero. The population of Dearborn in 2000 was 1,093.
History
The area that is now Dearborn was first settled in 1837 by a group of settlers from Kentucky. The town was named after Henry Dearborn, a Revolutionary War hero. The town was incorporated in 1871 and was the first town in Platte County to be incorporated.
The town was a major stop on the Hannibal and St. Joseph Railroad, which ran from Hannibal, Missouri to St. Joseph, Missouri. The railroad was completed in 1859 and was the first transcontinental railroad in the United States. The railroad brought many new settlers to the area and helped to spur the growth of the town.
The town was also a major stop on the Pony Express, which ran from St. Joseph, Missouri to Sacramento, California. The Pony Express was in operation from 1860 to 1861 and was the first fast mail service in the United States.
Geography
Dearborn is located in Platte County, Missouri. It is situated on the banks of the Missouri River, approximately 30 miles north of Kansas City. The town is located in the Missouri River Valley, which is a major agricultural region. The town is surrounded by rolling hills and is located in a temperate climate zone.
The town is located at an elevation of 845 feet above sea level. The average annual temperature is 54 degrees Fahrenheit and the average annual precipitation is 39 inches.
Economy
The economy of Dearborn is largely based on agriculture. The town is located in the Missouri River Valley, which is a major agricultural region. The town is home to several large farms and ranches, which produce a variety of crops and livestock.
The town is also home to several small businesses, including a grocery store, a hardware store, a restaurant, and a gas station. The town is also home to a small manufacturing plant, which produces a variety of products.
Demographics
The population of Dearborn in 2000 was 1,093. The population is predominantly white, with a small minority population. The median household income is $37,500 and the median home value is $90,000. The town has a low unemployment rate and a high rate of homeownership.
The town is served by the Platte County School District, which includes two elementary schools, one middle school, and one high school. The town is also home to a small library and a community center.
Conclusion
Dearborn, Missouri is a small town located in Platte County, Missouri. It is situated on the banks of the Missouri River, approximately 30 miles north of Kansas City. The town was founded in 1837 and was named after Henry Dearborn, a Revolutionary War hero. The population of Dearborn in 2000 was 1,093. The economy of Dearborn is largely based on agriculture and the town is home to several small businesses. The population is predominantly white, with a small minority population. The town is served by the Platte County School District and is home to a small library and a community center.
Common Questions
What is Per Capita Income in Dearborn?
Per Capita income in Dearborn is $24,955.
What is the Median Family Income in Dearborn?
Median Family Income in Dearborn is $48,750.
What is the Median Household income in Dearborn?
Median Household Income in Dearborn is $41,250.
What is Income or Wage Gap in Dearborn?
Income or Wage Gap in Dearborn is 37.9%.
Women in Dearborn earn 62.1 cents for every dollar earned by a man.
What is Inequality or Gini Index in Dearborn?
Inequality or Gini Index in Dearborn is 0.37.
What is the Total Population of Dearborn?
Total Population of Dearborn is 498.
What is the Total Male Population of Dearborn?
Total Male Population of Dearborn is 240.
What is the Total Female Population of Dearborn?
Total Female Population of Dearborn is 258.
What is the Ratio of Males per 100 Females in Dearborn?
There are 93.02 Males per 100 Females in Dearborn.
What is the Ratio of Females per 100 Males in Dearborn?
There are 107.50 Females per 100 Males in Dearborn.
What is the Median Population Age in Dearborn?
Median Population Age in Dearborn is 38.6 Years.
What is the Average Family Size in Dearborn
Average Family Size in Dearborn is 2.9 People.
What is the Average Household Size in Dearborn
Average Household Size in Dearborn is 2.4 People.
How Large is the Labor Force in Dearborn?
There are 189 People in the Labor Forcein in Dearborn.
What is the Percentage of People in the Labor Force in Dearborn?
51.6% of People are in the Labor Force in Dearborn.
What is the Unemployment Rate in Dearborn?
Unemployment Rate in Dearborn is 2.1%.