Wanamingo, MN Map & Demographics
Wanamingo Map
Wanamingo Overview
$35,823
PER CAPITA INCOME
$96,563
AVG FAMILY INCOME
$78,375
AVG HOUSEHOLD INCOME
20.2%
WAGE / INCOME GAP [ % ]
79.8¢/ $1
WAGE / INCOME GAP [ $ ]
0.39
INEQUALITY / GINI INDEX
1,189
TOTAL POPULATION
523
MALE POPULATION
666
FEMALE POPULATION
78.53
MALES / 100 FEMALES
127.34
FEMALES / 100 MALES
36.9
MEDIAN AGE
3.0
AVG FAMILY SIZE
2.4
AVG HOUSEHOLD SIZE
633
LABOR FORCE [ PEOPLE ]
69.6%
PERCENT IN LABOR FORCE
2.2%
UNEMPLOYMENT RATE
Wanamingo Zip Codes
Wanamingo Area Codes
Income in Wanamingo
Income Overview in Wanamingo
Per Capita Income in Wanamingo is $35,823, while median incomes of families and households are $96,563 and $78,375 respectively.
| Characteristic | Number | Measure |
| Per Capita Income | 1,189 | $35,823 |
| Median Family Income | 312 | $96,563 |
| Mean Family Income | 312 | $104,772 |
| Median Household Income | 493 | $78,375 |
| Mean Household Income | 493 | $83,335 |
| Income Deficit | 312 | $0 |
| Wage / Income Gap (%) | 1,189 | 20.21% |
| Wage / Income Gap ($) | 1,189 | 79.79¢ per $1 |
| Gini / Inequality Index | 1,189 | 0.39 |
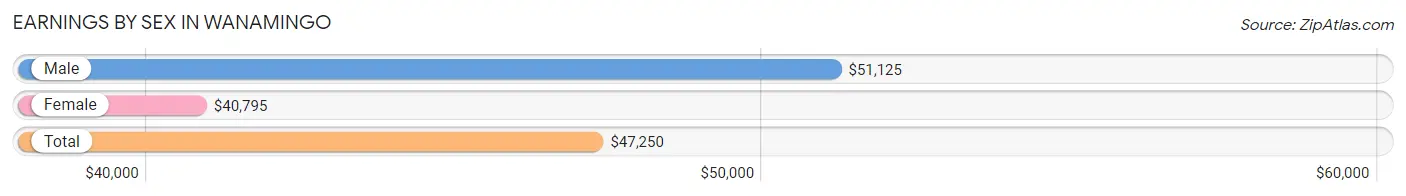
Earnings by Sex in Wanamingo
Average Earnings in Wanamingo are $47,250, $51,125 for men and $40,795 for women, a difference of 20.2%.
| Sex | Number | Average Earnings |
| Male | 349 (51.2%) | $51,125 |
| Female | 333 (48.8%) | $40,795 |
| Total | 682 (100.0%) | $47,250 |
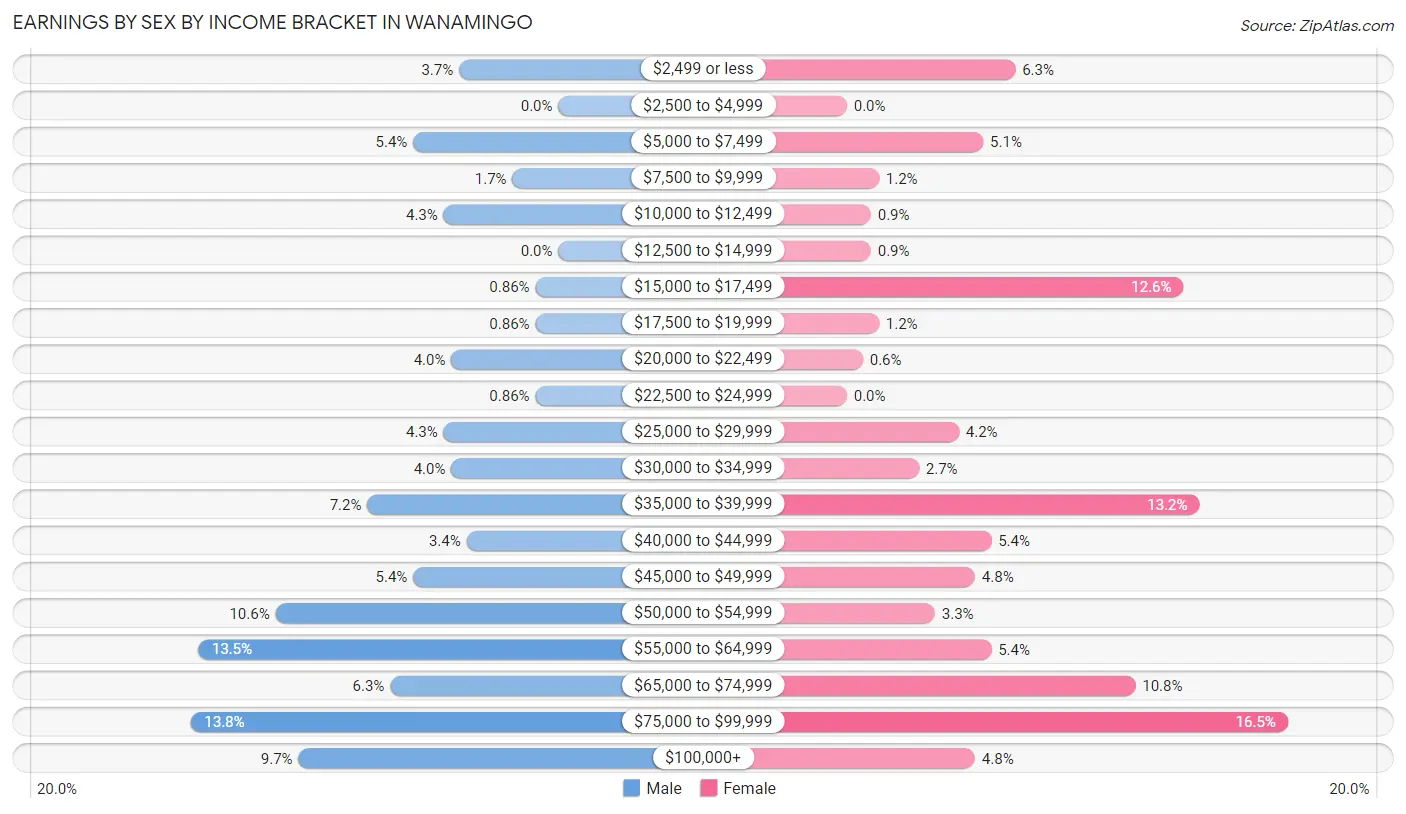
Earnings by Sex by Income Bracket in Wanamingo
The most common earnings brackets in Wanamingo are $75,000 to $99,999 for men (48 | 13.8%) and $75,000 to $99,999 for women (55 | 16.5%).
| Income | Male | Female |
| $2,499 or less | 13 (3.7%) | 21 (6.3%) |
| $2,500 to $4,999 | 0 (0.0%) | 0 (0.0%) |
| $5,000 to $7,499 | 19 (5.4%) | 17 (5.1%) |
| $7,500 to $9,999 | 6 (1.7%) | 4 (1.2%) |
| $10,000 to $12,499 | 15 (4.3%) | 3 (0.9%) |
| $12,500 to $14,999 | 0 (0.0%) | 3 (0.9%) |
| $15,000 to $17,499 | 3 (0.9%) | 42 (12.6%) |
| $17,500 to $19,999 | 3 (0.9%) | 4 (1.2%) |
| $20,000 to $22,499 | 14 (4.0%) | 2 (0.6%) |
| $22,500 to $24,999 | 3 (0.9%) | 0 (0.0%) |
| $25,000 to $29,999 | 15 (4.3%) | 14 (4.2%) |
| $30,000 to $34,999 | 14 (4.0%) | 9 (2.7%) |
| $35,000 to $39,999 | 25 (7.2%) | 44 (13.2%) |
| $40,000 to $44,999 | 12 (3.4%) | 18 (5.4%) |
| $45,000 to $49,999 | 19 (5.4%) | 16 (4.8%) |
| $50,000 to $54,999 | 37 (10.6%) | 11 (3.3%) |
| $55,000 to $64,999 | 47 (13.5%) | 18 (5.4%) |
| $65,000 to $74,999 | 22 (6.3%) | 36 (10.8%) |
| $75,000 to $99,999 | 48 (13.8%) | 55 (16.5%) |
| $100,000+ | 34 (9.7%) | 16 (4.8%) |
| Total | 349 (100.0%) | 333 (100.0%) |
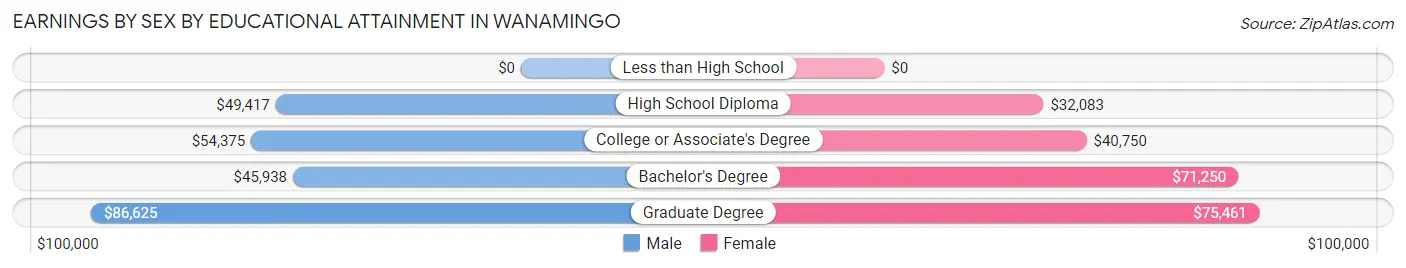
Earnings by Sex by Educational Attainment in Wanamingo
Average earnings in Wanamingo are $52,000 for men and $46,953 for women, a difference of 9.7%. Men with an educational attainment of graduate degree enjoy the highest average annual earnings of $86,625, while those with bachelor's degree education earn the least with $45,938. Women with an educational attainment of graduate degree earn the most with the average annual earnings of $75,461, while those with high school diploma education have the smallest earnings of $32,083.
| Educational Attainment | Male Income | Female Income |
| Less than High School | - | - |
| High School Diploma | $49,417 | $32,083 |
| College or Associate's Degree | $54,375 | $40,750 |
| Bachelor's Degree | $45,938 | $71,250 |
| Graduate Degree | $86,625 | $75,461 |
| Total | $52,000 | $46,953 |
Family Income in Wanamingo
Family Income Brackets in Wanamingo
According to the Wanamingo family income data, there are 71 families falling into the $75,000 to $99,999 income range, which is the most common income bracket and makes up 22.8% of all families.
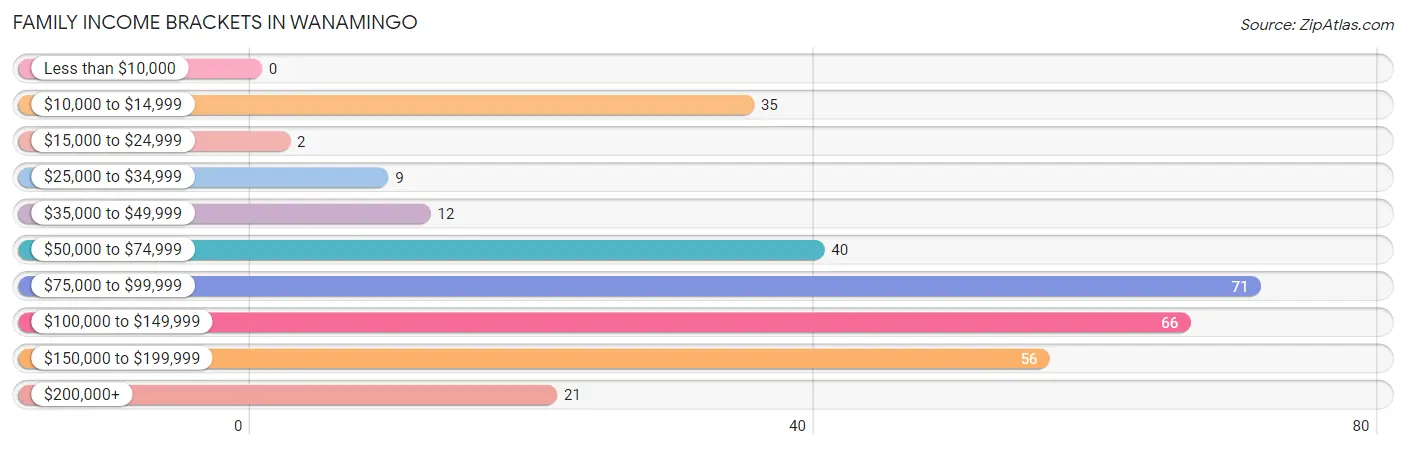
| Income Bracket | # Families | % Families |
| Less than $10,000 | 0 | 0.0% |
| $10,000 to $14,999 | 35 | 11.2% |
| $15,000 to $24,999 | 2 | 0.6% |
| $25,000 to $34,999 | 9 | 2.9% |
| $35,000 to $49,999 | 12 | 3.8% |
| $50,000 to $74,999 | 40 | 12.8% |
| $75,000 to $99,999 | 71 | 22.8% |
| $100,000 to $149,999 | 66 | 21.2% |
| $150,000 to $199,999 | 56 | 17.9% |
| $200,000+ | 21 | 6.7% |
Family Income by Famaliy Size in Wanamingo
5-person families (29 | 9.3%) account for the highest median family income in Wanamingo with $140,313 per family, while 2-person families (150 | 48.1%) have the highest median income of $48,438 per family member.
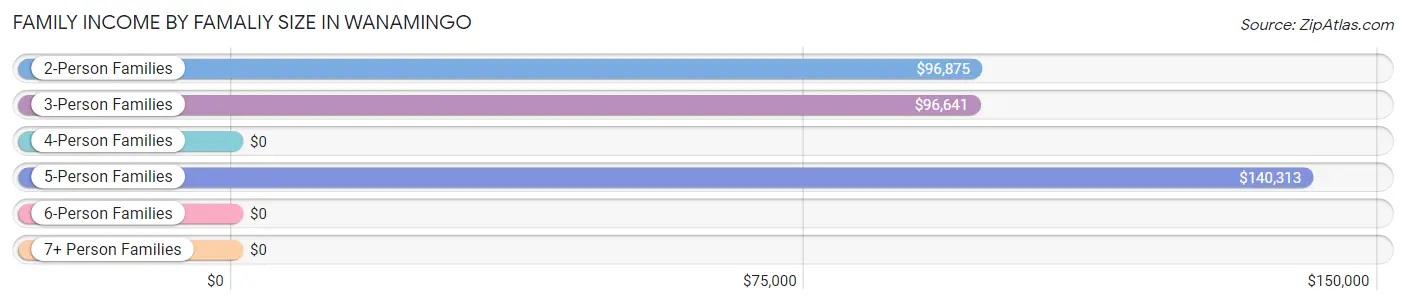
| Income Bracket | # Families | Median Income |
| 2-Person Families | 150 (48.1%) | $96,875 |
| 3-Person Families | 57 (18.3%) | $96,641 |
| 4-Person Families | 67 (21.5%) | $0 |
| 5-Person Families | 29 (9.3%) | $140,313 |
| 6-Person Families | 5 (1.6%) | $0 |
| 7+ Person Families | 4 (1.3%) | $0 |
| Total | 312 (100.0%) | $96,563 |
Family Income by Number of Earners in Wanamingo
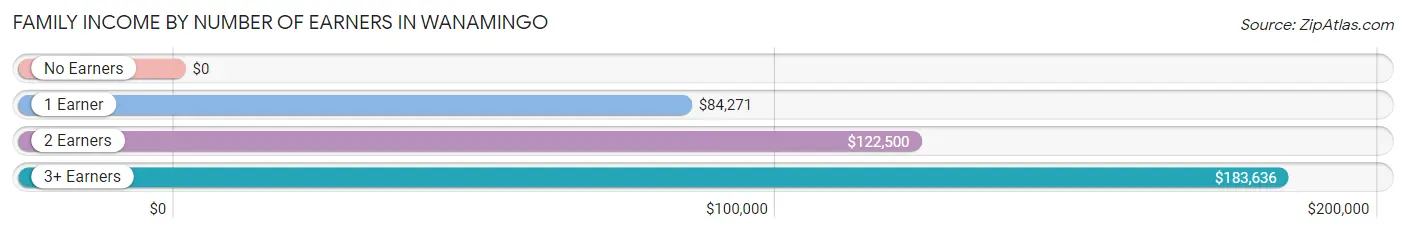
| Number of Earners | # Families | Median Income |
| No Earners | 51 (16.4%) | $0 |
| 1 Earner | 95 (30.4%) | $84,271 |
| 2 Earners | 132 (42.3%) | $122,500 |
| 3+ Earners | 34 (10.9%) | $183,636 |
| Total | 312 (100.0%) | $96,563 |
Household Income in Wanamingo
Household Income Brackets in Wanamingo
With 91 households falling in the category, the $75,000 to $99,999 income range is the most frequent in Wanamingo, accounting for 18.5% of all households. In contrast, only 8 households (1.6%) fall into the less than $10,000 income bracket, making it the least populous group.
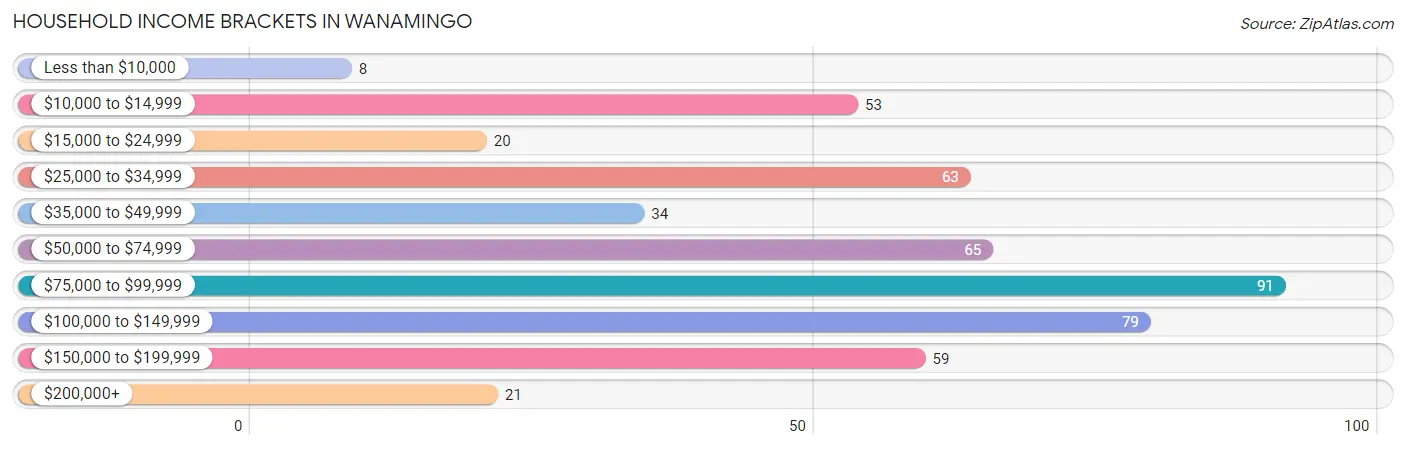
| Income Bracket | # Households | % Households |
| Less than $10,000 | 8 | 1.6% |
| $10,000 to $14,999 | 53 | 10.8% |
| $15,000 to $24,999 | 20 | 4.1% |
| $25,000 to $34,999 | 63 | 12.8% |
| $35,000 to $49,999 | 34 | 6.9% |
| $50,000 to $74,999 | 65 | 13.2% |
| $75,000 to $99,999 | 91 | 18.5% |
| $100,000 to $149,999 | 79 | 16.0% |
| $150,000 to $199,999 | 59 | 12.0% |
| $200,000+ | 21 | 4.3% |
Household Income by Householder Age in Wanamingo
The median household income in Wanamingo is $78,375, with the highest median household income of $95,781 found in the 45 to 64 years age bracket for the primary householder. A total of 150 households (30.4%) fall into this category. Meanwhile, the 15 to 24 years age bracket for the primary householder has the lowest median household income of $0, with 4 households (0.8%) in this group.
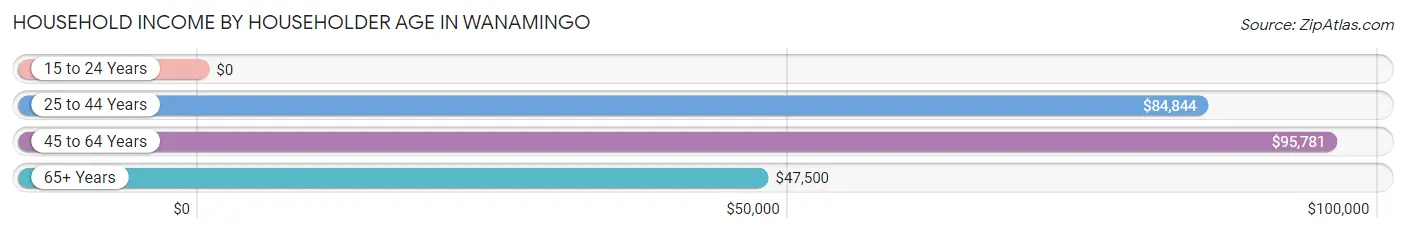
| Income Bracket | # Households | Median Income |
| 15 to 24 Years | 4 (0.8%) | $0 |
| 25 to 44 Years | 199 (40.4%) | $84,844 |
| 45 to 64 Years | 150 (30.4%) | $95,781 |
| 65+ Years | 140 (28.4%) | $47,500 |
| Total | 493 (100.0%) | $78,375 |
Poverty in Wanamingo
Income Below Poverty by Sex and Age in Wanamingo
With 9.9% poverty level for males and 20.1% for females among the residents of Wanamingo, under 5 year old males and 6 to 11 year old females are the most vulnerable to poverty, with 17 males (48.6%) and 66 females (60.0%) in their respective age groups living below the poverty level.
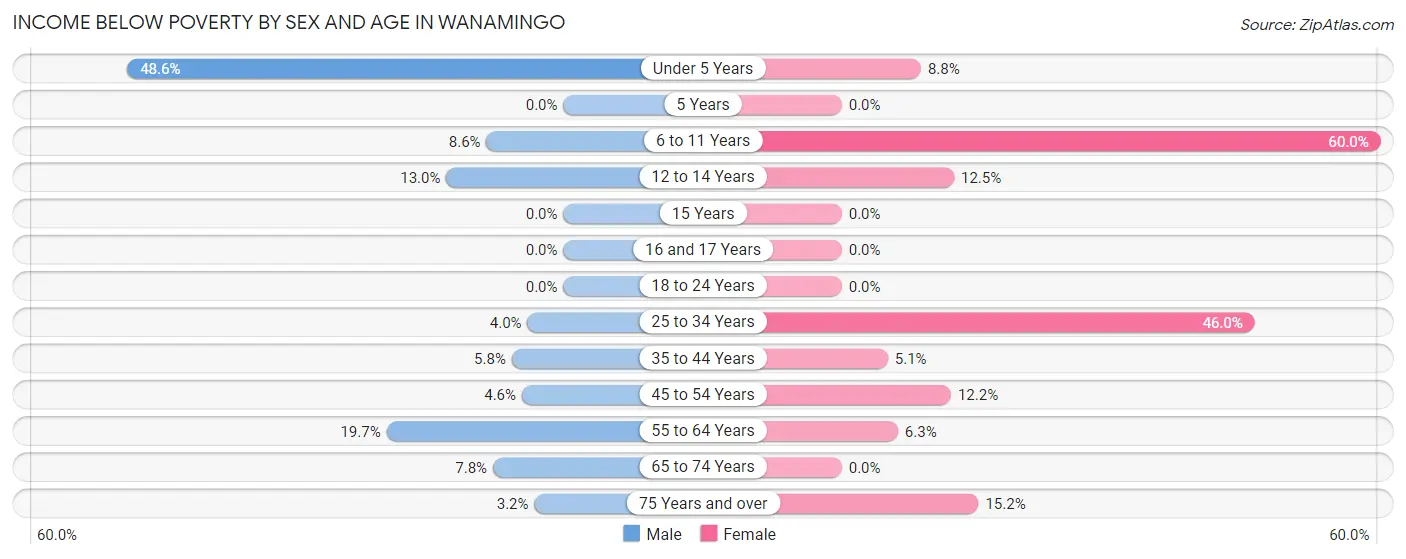
| Age Bracket | Male | Female |
| Under 5 Years | 17 (48.6%) | 3 (8.8%) |
| 5 Years | 0 (0.0%) | 0 (0.0%) |
| 6 to 11 Years | 3 (8.6%) | 66 (60.0%) |
| 12 to 14 Years | 3 (13.0%) | 1 (12.5%) |
| 15 Years | 0 (0.0%) | 0 (0.0%) |
| 16 and 17 Years | 0 (0.0%) | 0 (0.0%) |
| 18 to 24 Years | 0 (0.0%) | 0 (0.0%) |
| 25 to 34 Years | 3 (4.0%) | 40 (46.0%) |
| 35 to 44 Years | 5 (5.8%) | 4 (5.1%) |
| 45 to 54 Years | 3 (4.6%) | 9 (12.2%) |
| 55 to 64 Years | 13 (19.7%) | 4 (6.2%) |
| 65 to 74 Years | 4 (7.8%) | 0 (0.0%) |
| 75 Years and over | 1 (3.2%) | 7 (15.2%) |
| Total | 52 (9.9%) | 134 (20.1%) |
Income Above Poverty by Sex and Age in Wanamingo
According to the poverty statistics in Wanamingo, males aged 15 years and females aged 5 years are the age groups that are most secure financially, with 100.0% of males and 100.0% of females in these age groups living above the poverty line.
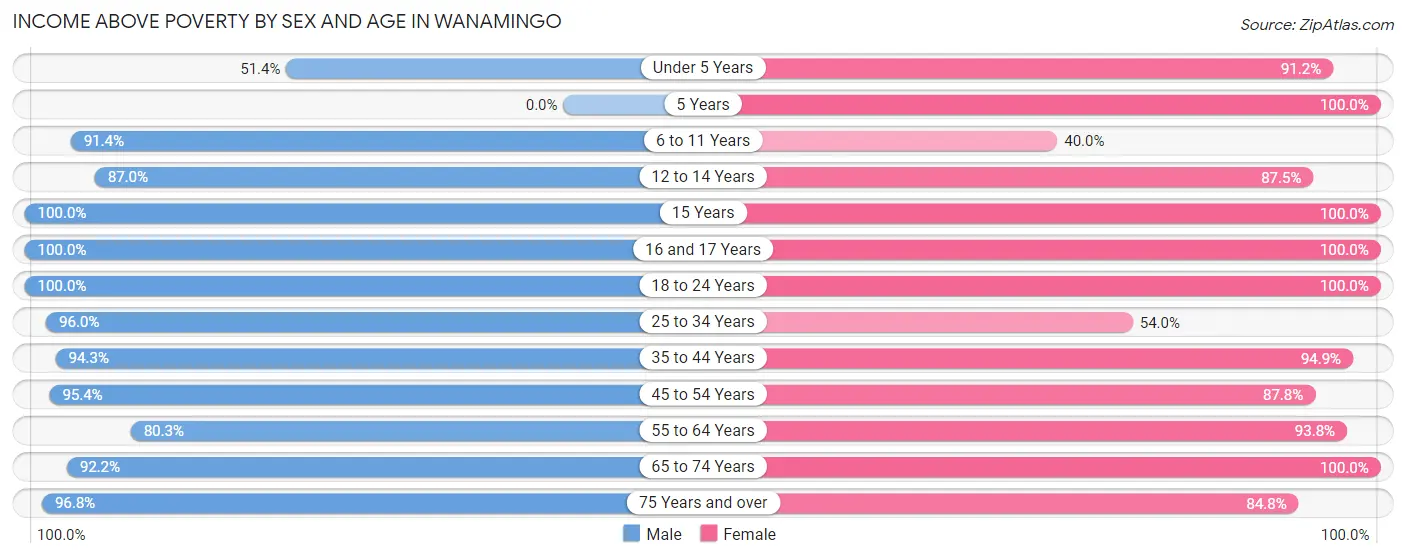
| Age Bracket | Male | Female |
| Under 5 Years | 18 (51.4%) | 31 (91.2%) |
| 5 Years | 0 (0.0%) | 12 (100.0%) |
| 6 to 11 Years | 32 (91.4%) | 44 (40.0%) |
| 12 to 14 Years | 20 (87.0%) | 7 (87.5%) |
| 15 Years | 14 (100.0%) | 8 (100.0%) |
| 16 and 17 Years | 15 (100.0%) | 13 (100.0%) |
| 18 to 24 Years | 26 (100.0%) | 47 (100.0%) |
| 25 to 34 Years | 72 (96.0%) | 47 (54.0%) |
| 35 to 44 Years | 82 (94.3%) | 74 (94.9%) |
| 45 to 54 Years | 62 (95.4%) | 65 (87.8%) |
| 55 to 64 Years | 53 (80.3%) | 60 (93.8%) |
| 65 to 74 Years | 47 (92.2%) | 85 (100.0%) |
| 75 Years and over | 30 (96.8%) | 39 (84.8%) |
| Total | 471 (90.1%) | 532 (79.9%) |
Income Below Poverty Among Married-Couple Families in Wanamingo
The poverty statistics for married-couple families in Wanamingo show that 2.9% or 7 of the total 239 families live below the poverty line. Families with 3 or 4 children have the highest poverty rate of 9.7%, comprising of 3 families. On the other hand, families with no children have the lowest poverty rate of 0.0%, which includes 0 families.
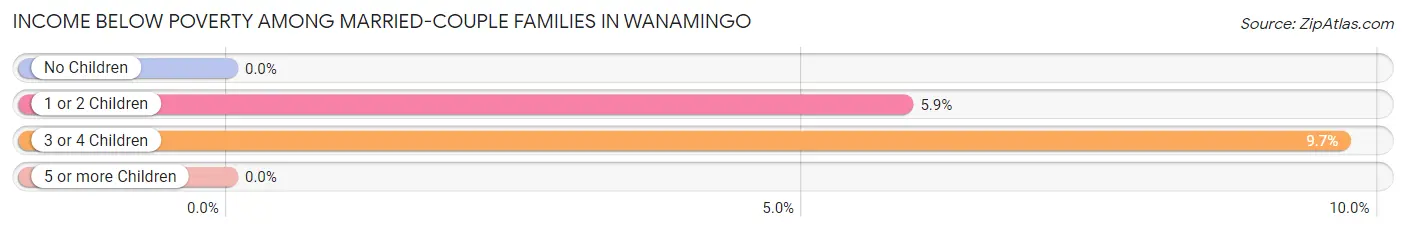
| Children | Above Poverty | Below Poverty |
| No Children | 140 (100.0%) | 0 (0.0%) |
| 1 or 2 Children | 64 (94.1%) | 4 (5.9%) |
| 3 or 4 Children | 28 (90.3%) | 3 (9.7%) |
| 5 or more Children | 0 (0.0%) | 0 (0.0%) |
| Total | 232 (97.1%) | 7 (2.9%) |
Income Below Poverty Among Single-Parent Households in Wanamingo
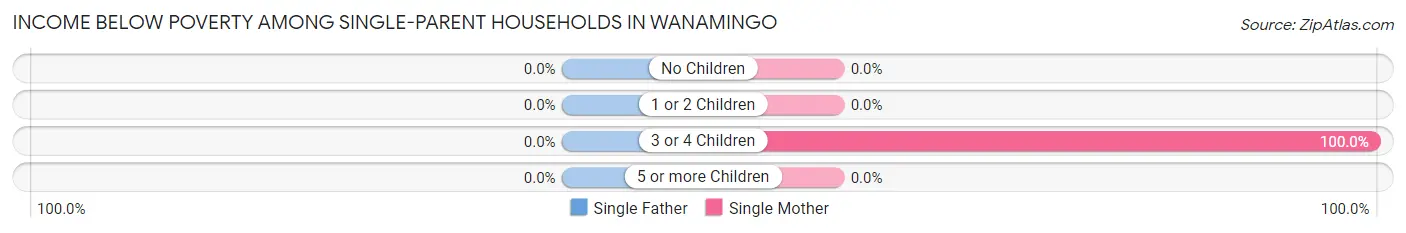
| Children | Single Father | Single Mother |
| No Children | 0 (0.0%) | 0 (0.0%) |
| 1 or 2 Children | 0 (0.0%) | 0 (0.0%) |
| 3 or 4 Children | 0 (0.0%) | 33 (100.0%) |
| 5 or more Children | 0 (0.0%) | 0 (0.0%) |
| Total | 0 (0.0%) | 33 (49.2%) |
Income Below Poverty Among Married-Couple vs Single-Parent Households in Wanamingo
The poverty data for Wanamingo shows that 7 of the married-couple family households (2.9%) and 33 of the single-parent households (45.2%) are living below the poverty level. Within the married-couple family households, those with 3 or 4 children have the highest poverty rate, with 3 households (9.7%) falling below the poverty line. Among the single-parent households, those with 3 or 4 children have the highest poverty rate, with 33 household (100.0%) living below poverty.
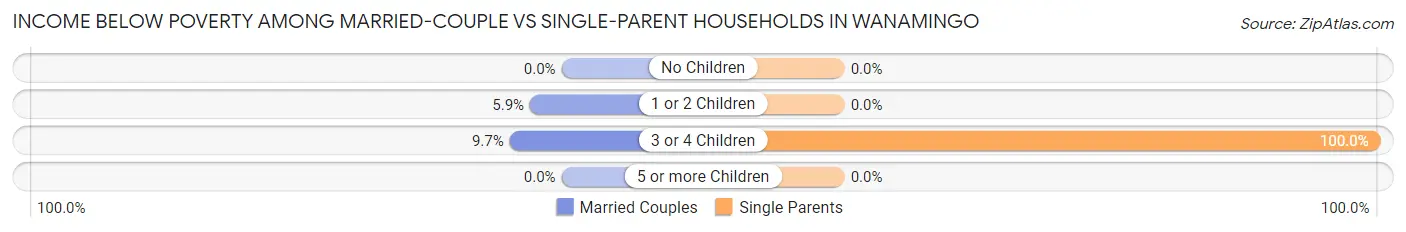
| Children | Married-Couple Families | Single-Parent Households |
| No Children | 0 (0.0%) | 0 (0.0%) |
| 1 or 2 Children | 4 (5.9%) | 0 (0.0%) |
| 3 or 4 Children | 3 (9.7%) | 33 (100.0%) |
| 5 or more Children | 0 (0.0%) | 0 (0.0%) |
| Total | 7 (2.9%) | 33 (45.2%) |
Race in Wanamingo
The most populous races in Wanamingo are White / Caucasian (1,046 | 88.0%), Black / African American (97 | 8.2%), and Two or more Races (28 | 2.4%).
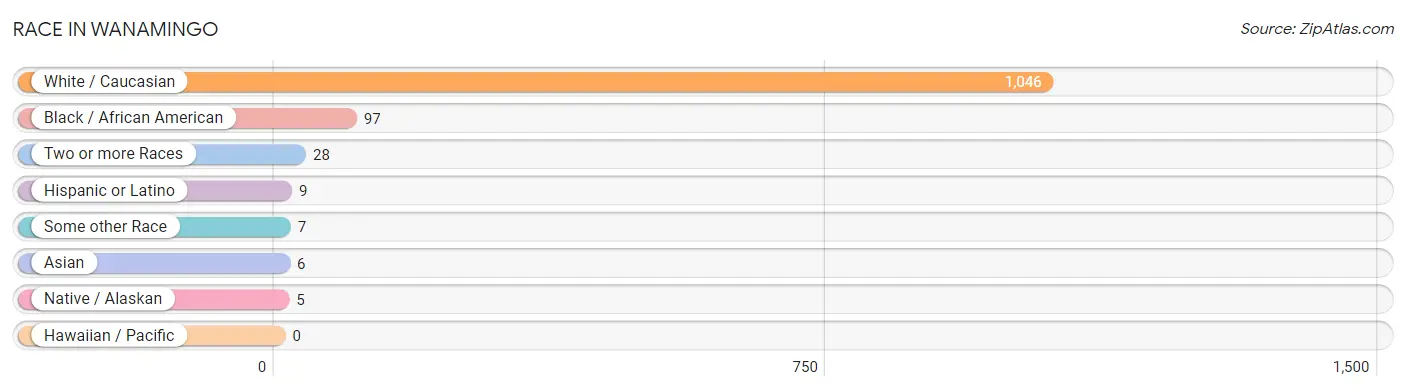
| Race | # Population | % Population |
| Asian | 6 | 0.5% |
| Black / African American | 97 | 8.2% |
| Hawaiian / Pacific | 0 | 0.0% |
| Hispanic or Latino | 9 | 0.8% |
| Native / Alaskan | 5 | 0.4% |
| White / Caucasian | 1,046 | 88.0% |
| Two or more Races | 28 | 2.4% |
| Some other Race | 7 | 0.6% |
| Total | 1,189 | 100.0% |
Ancestry in Wanamingo
The most populous ancestries reported in Wanamingo are Norwegian (393 | 33.1%), German (355 | 29.9%), Irish (124 | 10.4%), Swedish (95 | 8.0%), and English (65 | 5.5%), together accounting for 86.8% of all Wanamingo residents.
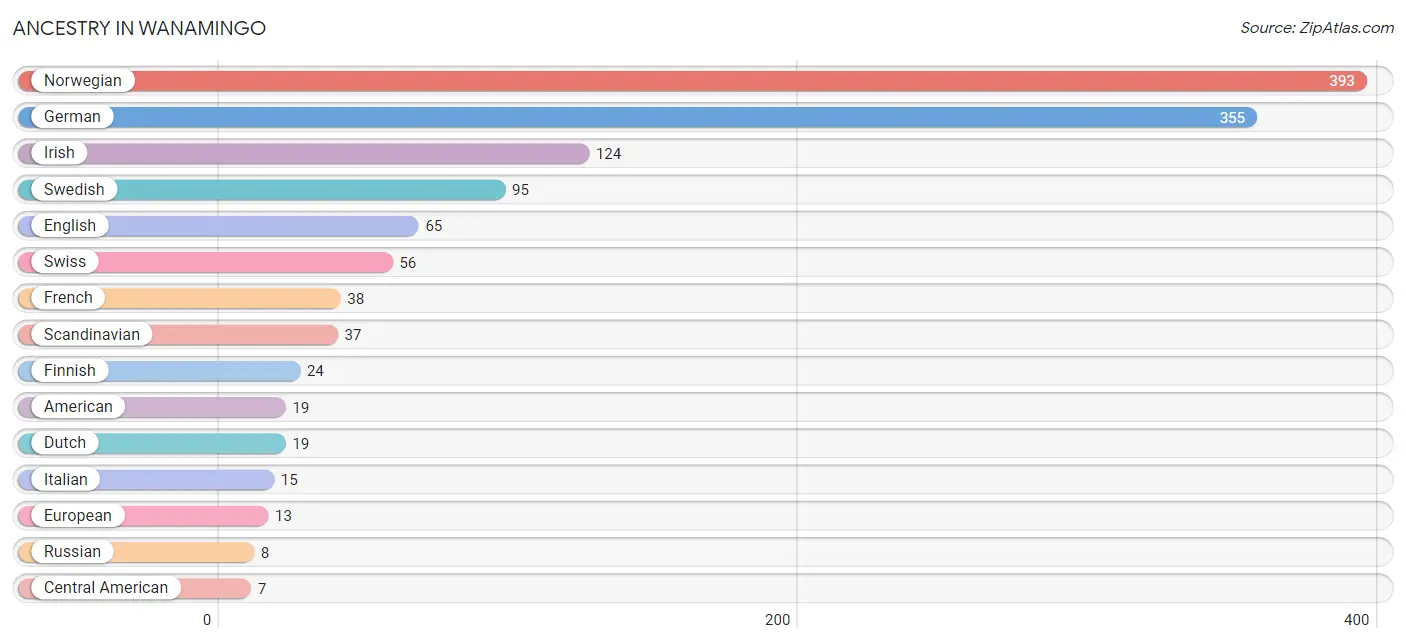
| Ancestry | # Population | % Population |
| American | 19 | 1.6% |
| Belgian | 3 | 0.3% |
| Central American | 7 | 0.6% |
| Cuban | 2 | 0.2% |
| Czech | 7 | 0.6% |
| Danish | 5 | 0.4% |
| Dutch | 19 | 1.6% |
| English | 65 | 5.5% |
| European | 13 | 1.1% |
| Finnish | 24 | 2.0% |
| French | 38 | 3.2% |
| French Canadian | 4 | 0.3% |
| German | 355 | 29.9% |
| Guatemalan | 7 | 0.6% |
| Irish | 124 | 10.4% |
| Italian | 15 | 1.3% |
| Jamaican | 3 | 0.3% |
| Korean | 6 | 0.5% |
| Luxembourger | 3 | 0.3% |
| Norwegian | 393 | 33.1% |
| Polish | 1 | 0.1% |
| Russian | 8 | 0.7% |
| Scandinavian | 37 | 3.1% |
| Scotch-Irish | 2 | 0.2% |
| Scottish | 1 | 0.1% |
| Swedish | 95 | 8.0% |
| Swiss | 56 | 4.7% |
| Welsh | 6 | 0.5% | View All 28 Rows |
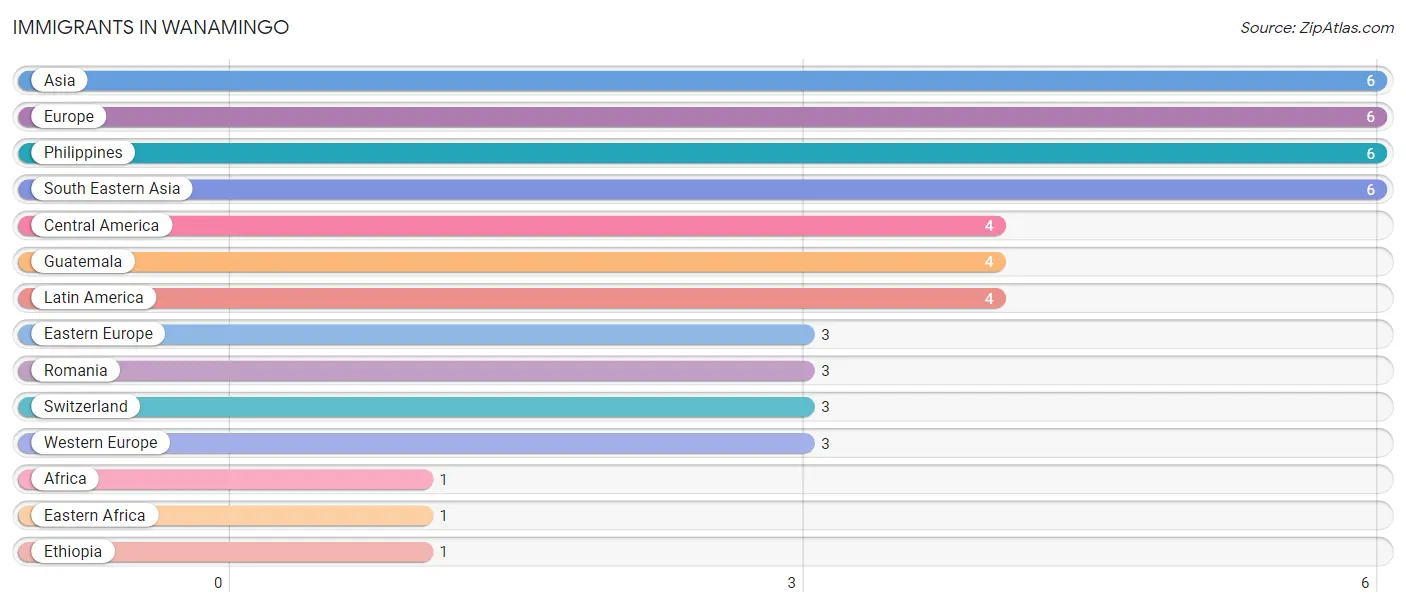
Immigrants in Wanamingo
The most numerous immigrant groups reported in Wanamingo came from Asia (6 | 0.5%), Europe (6 | 0.5%), Philippines (6 | 0.5%), South Eastern Asia (6 | 0.5%), and Central America (4 | 0.3%), together accounting for 2.3% of all Wanamingo residents.
| Immigration Origin | # Population | % Population |
| Africa | 1 | 0.1% |
| Asia | 6 | 0.5% |
| Central America | 4 | 0.3% |
| Eastern Africa | 1 | 0.1% |
| Eastern Europe | 3 | 0.3% |
| Ethiopia | 1 | 0.1% |
| Europe | 6 | 0.5% |
| Guatemala | 4 | 0.3% |
| Latin America | 4 | 0.3% |
| Philippines | 6 | 0.5% |
| Romania | 3 | 0.3% |
| South Eastern Asia | 6 | 0.5% |
| Switzerland | 3 | 0.3% |
| Western Europe | 3 | 0.3% | View All 14 Rows |
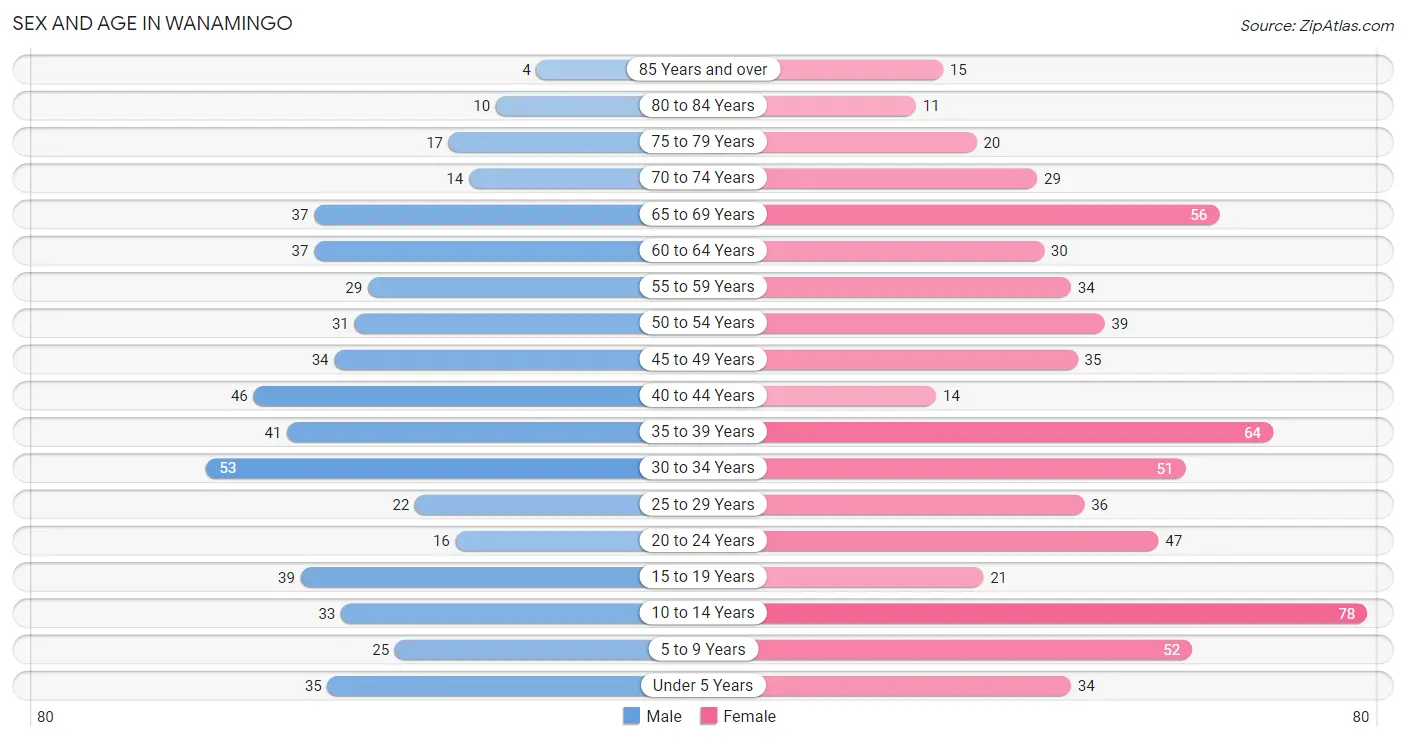
Sex and Age in Wanamingo
Sex and Age in Wanamingo
The most populous age groups in Wanamingo are 30 to 34 Years (53 | 10.1%) for men and 10 to 14 Years (78 | 11.7%) for women.
| Age Bracket | Male | Female |
| Under 5 Years | 35 (6.7%) | 34 (5.1%) |
| 5 to 9 Years | 25 (4.8%) | 52 (7.8%) |
| 10 to 14 Years | 33 (6.3%) | 78 (11.7%) |
| 15 to 19 Years | 39 (7.5%) | 21 (3.2%) |
| 20 to 24 Years | 16 (3.1%) | 47 (7.1%) |
| 25 to 29 Years | 22 (4.2%) | 36 (5.4%) |
| 30 to 34 Years | 53 (10.1%) | 51 (7.7%) |
| 35 to 39 Years | 41 (7.8%) | 64 (9.6%) |
| 40 to 44 Years | 46 (8.8%) | 14 (2.1%) |
| 45 to 49 Years | 34 (6.5%) | 35 (5.3%) |
| 50 to 54 Years | 31 (5.9%) | 39 (5.9%) |
| 55 to 59 Years | 29 (5.5%) | 34 (5.1%) |
| 60 to 64 Years | 37 (7.1%) | 30 (4.5%) |
| 65 to 69 Years | 37 (7.1%) | 56 (8.4%) |
| 70 to 74 Years | 14 (2.7%) | 29 (4.3%) |
| 75 to 79 Years | 17 (3.3%) | 20 (3.0%) |
| 80 to 84 Years | 10 (1.9%) | 11 (1.7%) |
| 85 Years and over | 4 (0.8%) | 15 (2.2%) |
| Total | 523 (100.0%) | 666 (100.0%) |
Families and Households in Wanamingo
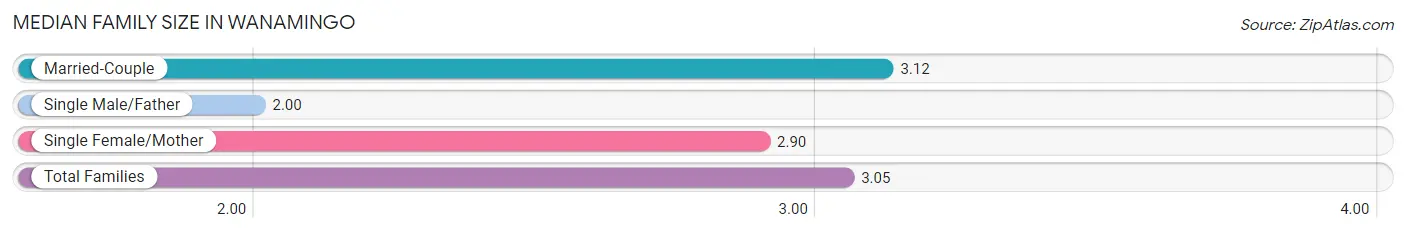
Median Family Size in Wanamingo
The median family size in Wanamingo is 3.05 persons per family, with married-couple families (239 | 76.6%) accounting for the largest median family size of 3.12 persons per family. On the other hand, single male/father families (6 | 1.9%) represent the smallest median family size with 2.00 persons per family.
| Family Type | # Families | Family Size |
| Married-Couple | 239 (76.6%) | 3.12 |
| Single Male/Father | 6 (1.9%) | 2.00 |
| Single Female/Mother | 67 (21.5%) | 2.90 |
| Total Families | 312 (100.0%) | 3.05 |
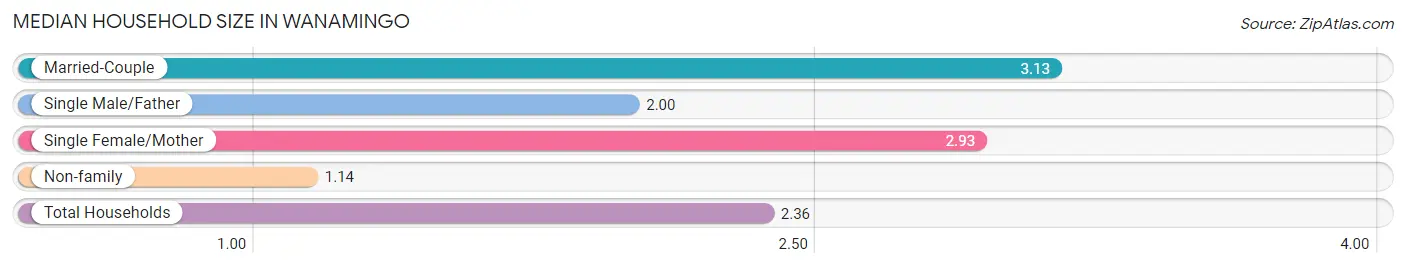
Median Household Size in Wanamingo
The median household size in Wanamingo is 2.36 persons per household, with married-couple households (239 | 48.5%) accounting for the largest median household size of 3.13 persons per household. non-family households (181 | 36.7%) represent the smallest median household size with 1.14 persons per household.
| Household Type | # Households | Household Size |
| Married-Couple | 239 (48.5%) | 3.13 |
| Single Male/Father | 6 (1.2%) | 2.00 |
| Single Female/Mother | 67 (13.6%) | 2.93 |
| Non-family | 181 (36.7%) | 1.14 |
| Total Households | 493 (100.0%) | 2.36 |
Household Size by Marriage Status in Wanamingo
Out of a total of 493 households in Wanamingo, 312 (63.3%) are family households, while 181 (36.7%) are nonfamily households. The most numerous type of family households are 2-person households, comprising 147, and the most common type of nonfamily households are 1-person households, comprising 156.
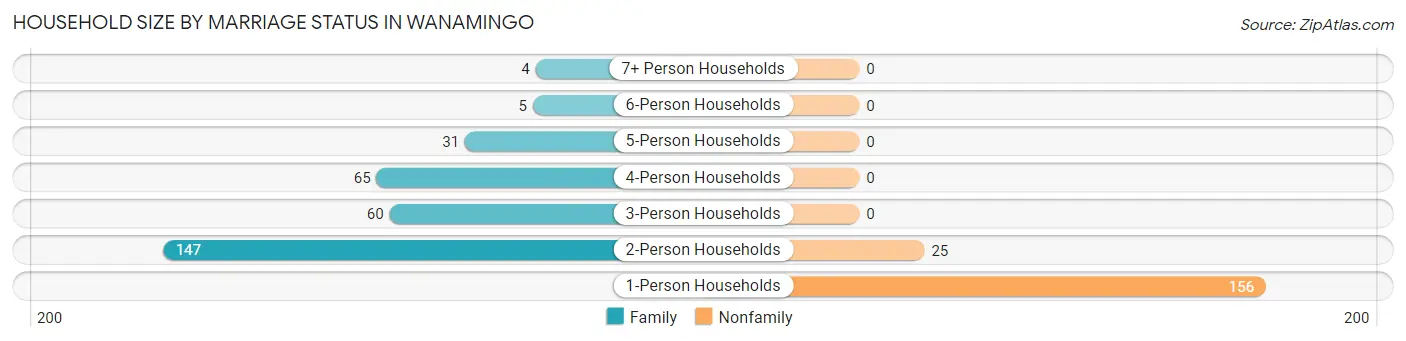
| Household Size | Family Households | Nonfamily Households |
| 1-Person Households | - | 156 (31.6%) |
| 2-Person Households | 147 (29.8%) | 25 (5.1%) |
| 3-Person Households | 60 (12.2%) | 0 (0.0%) |
| 4-Person Households | 65 (13.2%) | 0 (0.0%) |
| 5-Person Households | 31 (6.3%) | 0 (0.0%) |
| 6-Person Households | 5 (1.0%) | 0 (0.0%) |
| 7+ Person Households | 4 (0.8%) | 0 (0.0%) |
| Total | 312 (63.3%) | 181 (36.7%) |
Female Fertility in Wanamingo
Fertility by Age in Wanamingo
Average fertility rate in Wanamingo is 52.0 births per 1,000 women. Women in the age bracket of 20 to 34 years have the highest fertility rate with 90.0 births per 1,000 women. Women in the age bracket of 20 to 34 years acount for 85.7% of all women with births.
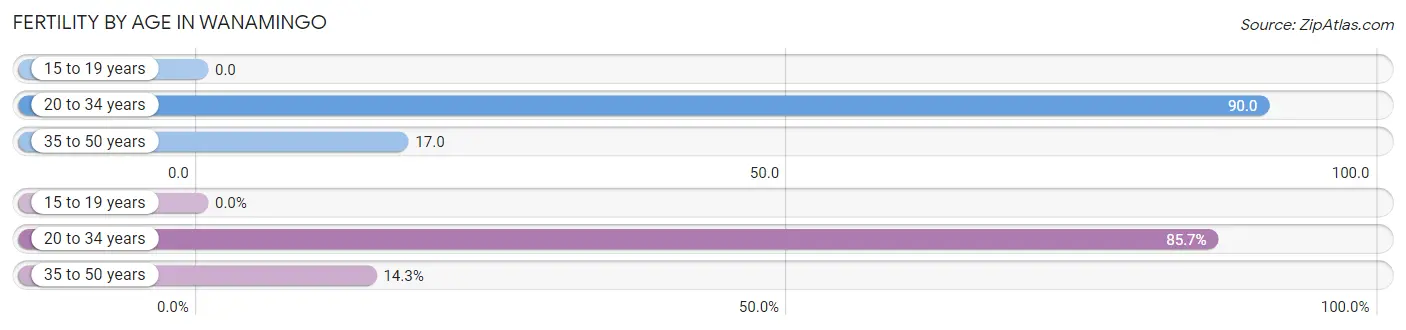
| Age Bracket | Women with Births | Births / 1,000 Women |
| 15 to 19 years | 0 (0.0%) | 0.0 |
| 20 to 34 years | 12 (85.7%) | 90.0 |
| 35 to 50 years | 2 (14.3%) | 17.0 |
| Total | 14 (100.0%) | 52.0 |
Fertility by Age by Marriage Status in Wanamingo
57.1% of women with births (14) in Wanamingo are married. The highest percentage of unmarried women with births falls into 20 to 34 years age bracket with 50.0% of them unmarried at the time of birth, while the lowest percentage of unmarried women with births belong to 35 to 50 years age bracket with 0.0% of them unmarried.
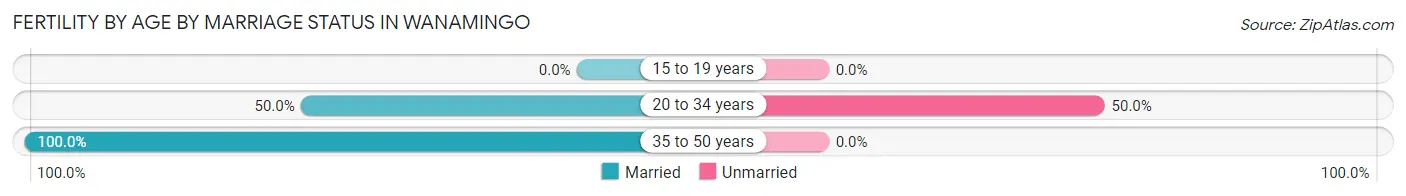
| Age Bracket | Married | Unmarried |
| 15 to 19 years | 0 (0.0%) | 0 (0.0%) |
| 20 to 34 years | 6 (50.0%) | 6 (50.0%) |
| 35 to 50 years | 2 (100.0%) | 0 (0.0%) |
| Total | 8 (57.1%) | 6 (42.9%) |
Fertility by Education in Wanamingo
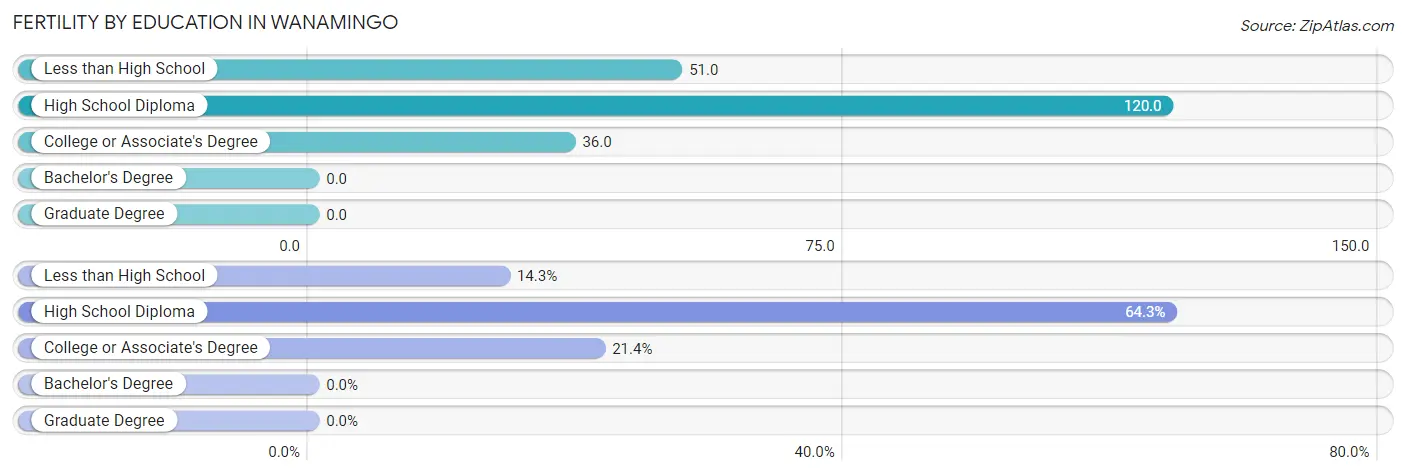
| Educational Attainment | Women with Births | Births / 1,000 Women |
| Less than High School | 2 (14.3%) | 51.0 |
| High School Diploma | 9 (64.3%) | 120.0 |
| College or Associate's Degree | 3 (21.4%) | 36.0 |
| Bachelor's Degree | 0 (0.0%) | 0.0 |
| Graduate Degree | 0 (0.0%) | 0.0 |
| Total | 14 (100.0%) | 52.0 |
Fertility by Education by Marriage Status in Wanamingo
42.9% of women with births in Wanamingo are unmarried. Women with the educational attainment of less than high school are most likely to be married with 100.0% of them married at childbirth, while women with the educational attainment of high school diploma are least likely to be married with 66.7% of them unmarried at childbirth.
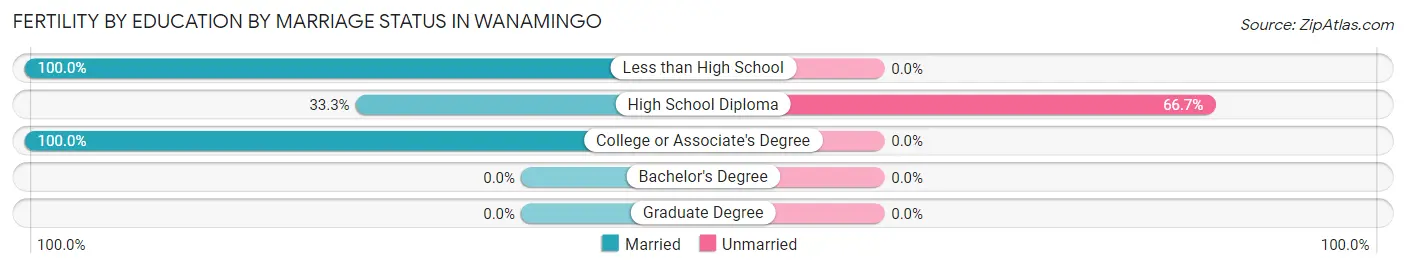
| Educational Attainment | Married | Unmarried |
| Less than High School | 2 (100.0%) | 0 (0.0%) |
| High School Diploma | 3 (33.3%) | 6 (66.7%) |
| College or Associate's Degree | 3 (100.0%) | 0 (0.0%) |
| Bachelor's Degree | 0 (0.0%) | 0 (0.0%) |
| Graduate Degree | 0 (0.0%) | 0 (0.0%) |
| Total | 8 (57.1%) | 6 (42.9%) |
Employment Characteristics in Wanamingo
Employment by Class of Employer in Wanamingo
Among the 615 employed individuals in Wanamingo, private company employees (417 | 67.8%), not-for-profit organizations (70 | 11.4%), and local government employees (58 | 9.4%) make up the most common classes of employment.
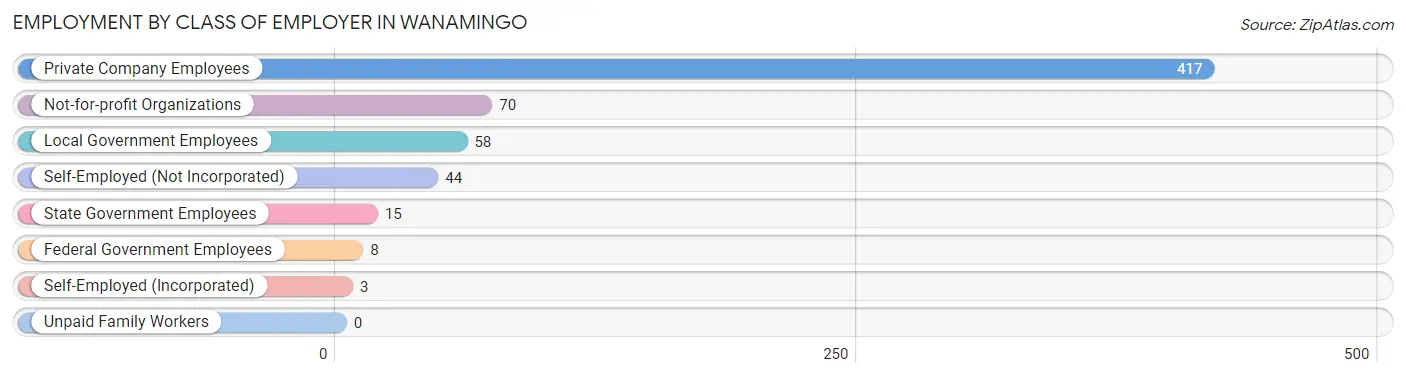
| Employer Class | # Employees | % Employees |
| Private Company Employees | 417 | 67.8% |
| Self-Employed (Incorporated) | 3 | 0.5% |
| Self-Employed (Not Incorporated) | 44 | 7.1% |
| Not-for-profit Organizations | 70 | 11.4% |
| Local Government Employees | 58 | 9.4% |
| State Government Employees | 15 | 2.4% |
| Federal Government Employees | 8 | 1.3% |
| Unpaid Family Workers | 0 | 0.0% |
| Total | 615 | 100.0% |
Employment Status by Age in Wanamingo
According to the labor force statistics for Wanamingo, out of the total population over 16 years of age (910), 69.6% or 633 individuals are in the labor force, with 2.2% or 14 of them unemployed. The age group with the highest labor force participation rate is 45 to 54 years, with 96.4% or 134 individuals in the labor force. Within the labor force, the 60 to 64 years age range has the highest percentage of unemployed individuals, with 4.8% or 3 of them being unemployed.
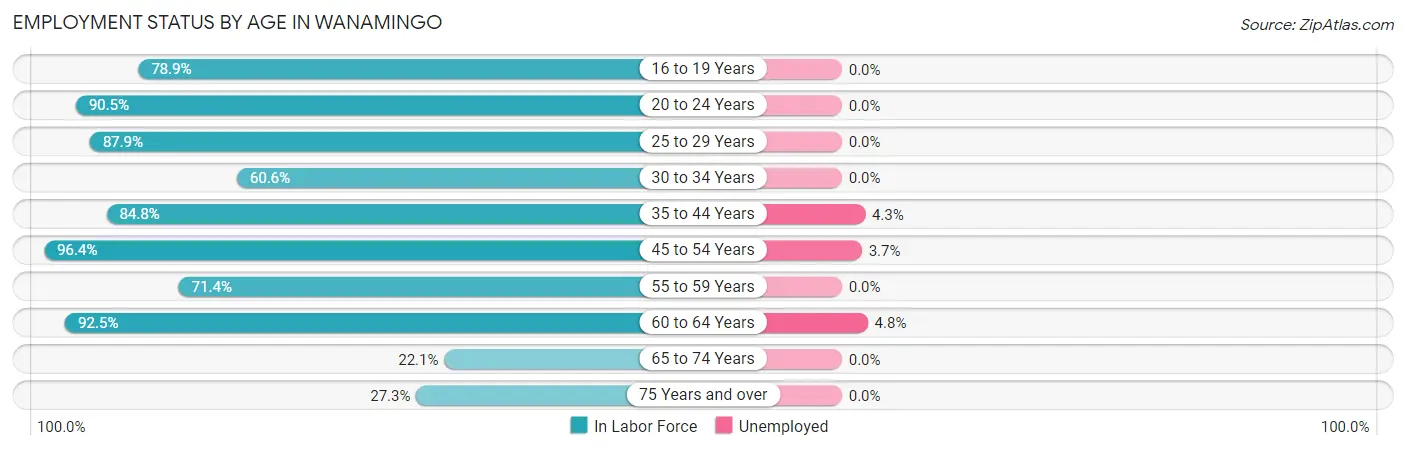
| Age Bracket | In Labor Force | Unemployed |
| 16 to 19 Years | 30 (78.9%) | 0 (0.0%) |
| 20 to 24 Years | 57 (90.5%) | 0 (0.0%) |
| 25 to 29 Years | 51 (87.9%) | 0 (0.0%) |
| 30 to 34 Years | 63 (60.6%) | 0 (0.0%) |
| 35 to 44 Years | 140 (84.8%) | 6 (4.3%) |
| 45 to 54 Years | 134 (96.4%) | 5 (3.7%) |
| 55 to 59 Years | 45 (71.4%) | 0 (0.0%) |
| 60 to 64 Years | 62 (92.5%) | 3 (4.8%) |
| 65 to 74 Years | 30 (22.1%) | 0 (0.0%) |
| 75 Years and over | 21 (27.3%) | 0 (0.0%) |
| Total | 633 (69.6%) | 14 (2.2%) |
Employment Status by Educational Attainment in Wanamingo
According to labor force statistics for Wanamingo, 83.1% of individuals (495) out of the total population between 25 and 64 years of age (596) are in the labor force, with 2.8% or 14 of them being unemployed. The group with the highest labor force participation rate are those with the educational attainment of bachelor's degree or higher, with 92.9% or 130 individuals in the labor force. Within the labor force, individuals with high school diploma education have the highest percentage of unemployment, with 11.2% or 14 of them being unemployed.
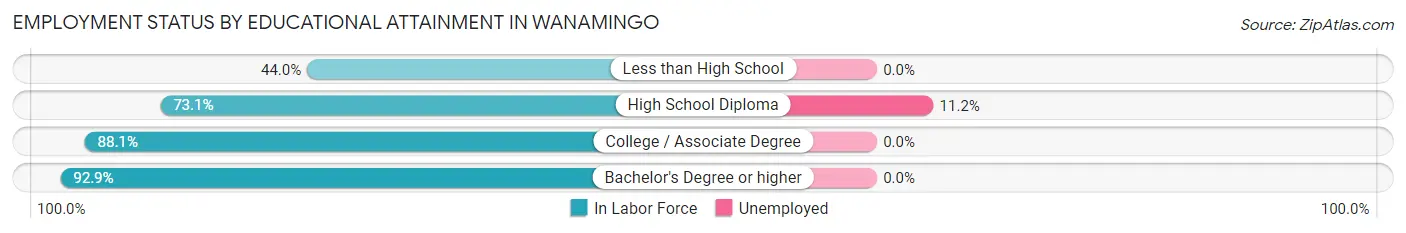
| Educational Attainment | In Labor Force | Unemployed |
| Less than High School | 11 (44.0%) | 0 (0.0%) |
| High School Diploma | 125 (73.1%) | 19 (11.2%) |
| College / Associate Degree | 229 (88.1%) | 0 (0.0%) |
| Bachelor's Degree or higher | 130 (92.9%) | 0 (0.0%) |
| Total | 495 (83.1%) | 17 (2.8%) |
Employment Occupations by Sex in Wanamingo
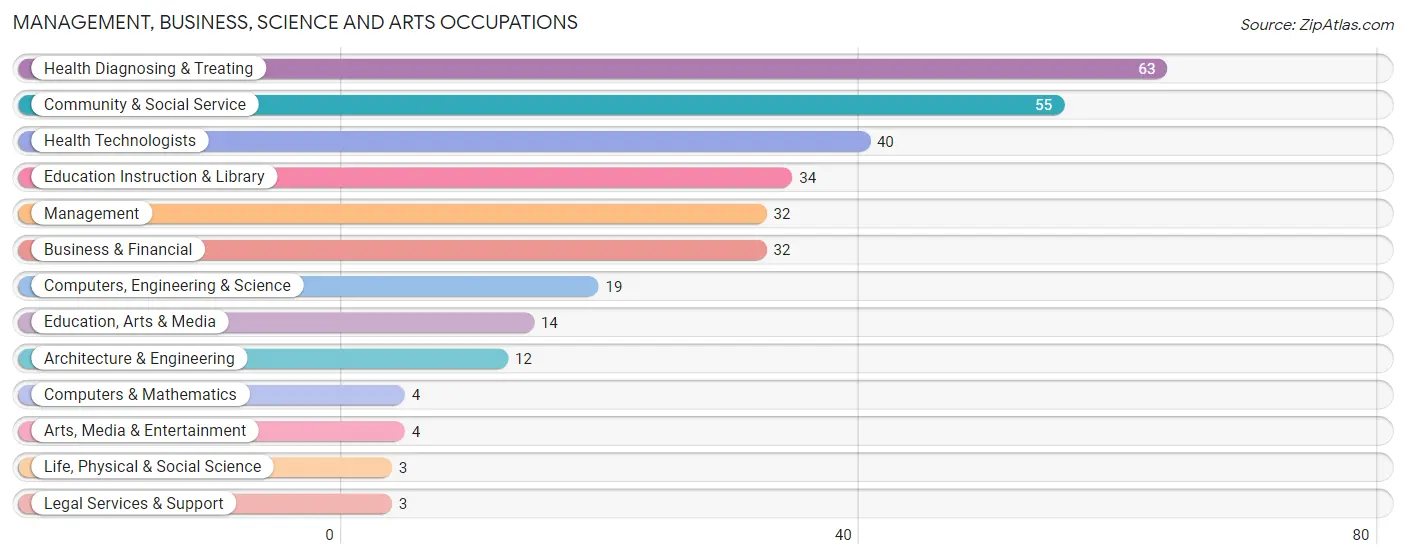
Management, Business, Science and Arts Occupations
The most common Management, Business, Science and Arts occupations in Wanamingo are Health Diagnosing & Treating (63 | 10.2%), Community & Social Service (55 | 8.9%), Health Technologists (40 | 6.5%), Education Instruction & Library (34 | 5.5%), and Management (32 | 5.2%).
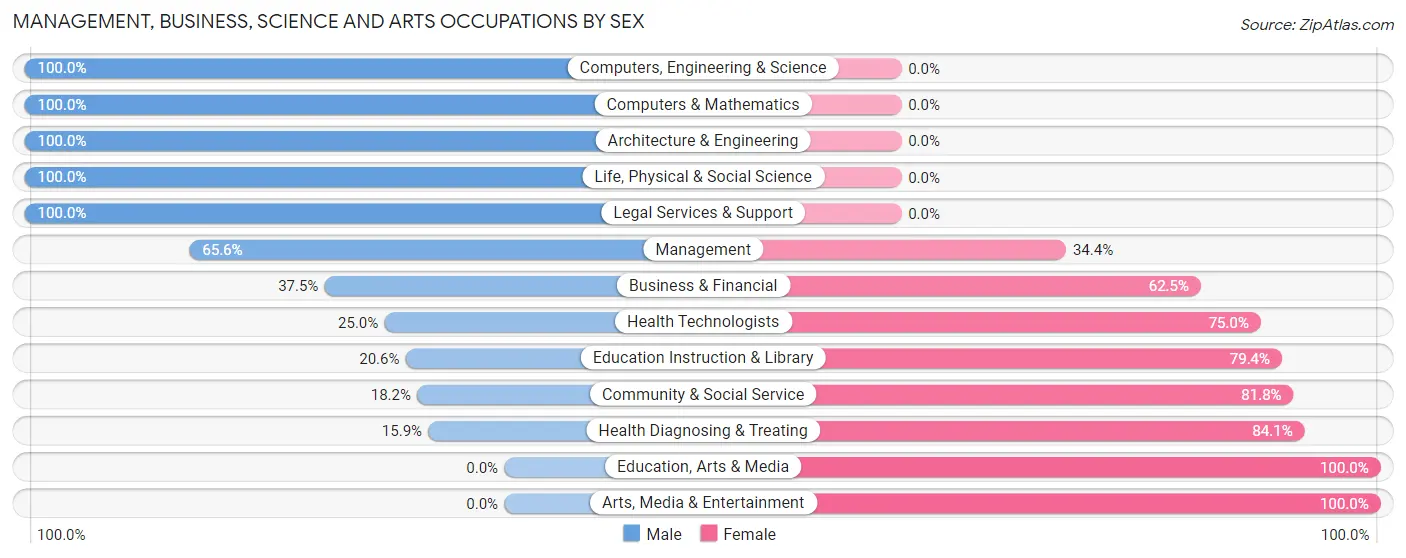
Management, Business, Science and Arts Occupations by Sex
Within the Management, Business, Science and Arts occupations in Wanamingo, the most male-oriented occupations are Computers, Engineering & Science (100.0%), Computers & Mathematics (100.0%), and Architecture & Engineering (100.0%), while the most female-oriented occupations are Education, Arts & Media (100.0%), Arts, Media & Entertainment (100.0%), and Health Diagnosing & Treating (84.1%).
| Occupation | Male | Female |
| Management | 21 (65.6%) | 11 (34.4%) |
| Business & Financial | 12 (37.5%) | 20 (62.5%) |
| Computers, Engineering & Science | 19 (100.0%) | 0 (0.0%) |
| Computers & Mathematics | 4 (100.0%) | 0 (0.0%) |
| Architecture & Engineering | 12 (100.0%) | 0 (0.0%) |
| Life, Physical & Social Science | 3 (100.0%) | 0 (0.0%) |
| Community & Social Service | 10 (18.2%) | 45 (81.8%) |
| Education, Arts & Media | 0 (0.0%) | 14 (100.0%) |
| Legal Services & Support | 3 (100.0%) | 0 (0.0%) |
| Education Instruction & Library | 7 (20.6%) | 27 (79.4%) |
| Arts, Media & Entertainment | 0 (0.0%) | 4 (100.0%) |
| Health Diagnosing & Treating | 10 (15.9%) | 53 (84.1%) |
| Health Technologists | 10 (25.0%) | 30 (75.0%) |
| Total (Category) | 72 (35.8%) | 129 (64.2%) |
| Total (Overall) | 313 (50.6%) | 306 (49.4%) |
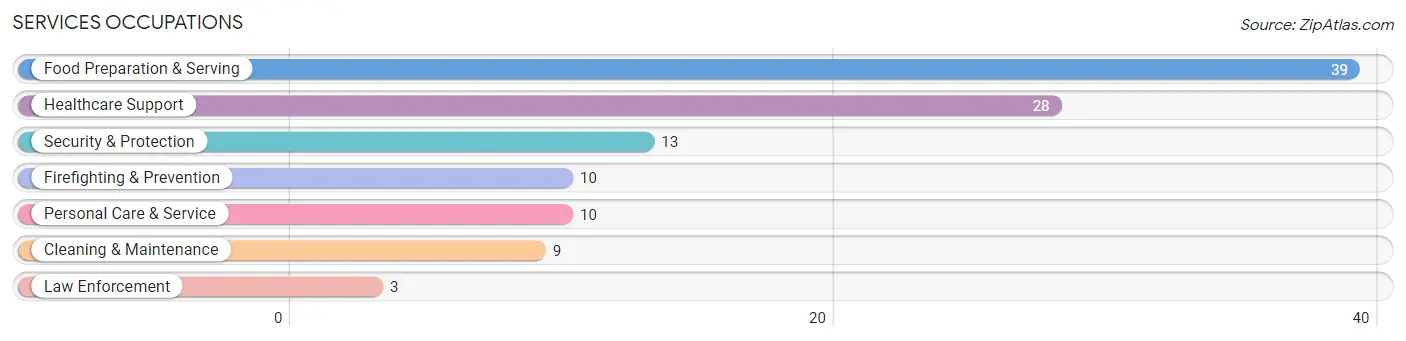
Services Occupations
The most common Services occupations in Wanamingo are Food Preparation & Serving (39 | 6.3%), Healthcare Support (28 | 4.5%), Security & Protection (13 | 2.1%), Firefighting & Prevention (10 | 1.6%), and Personal Care & Service (10 | 1.6%).
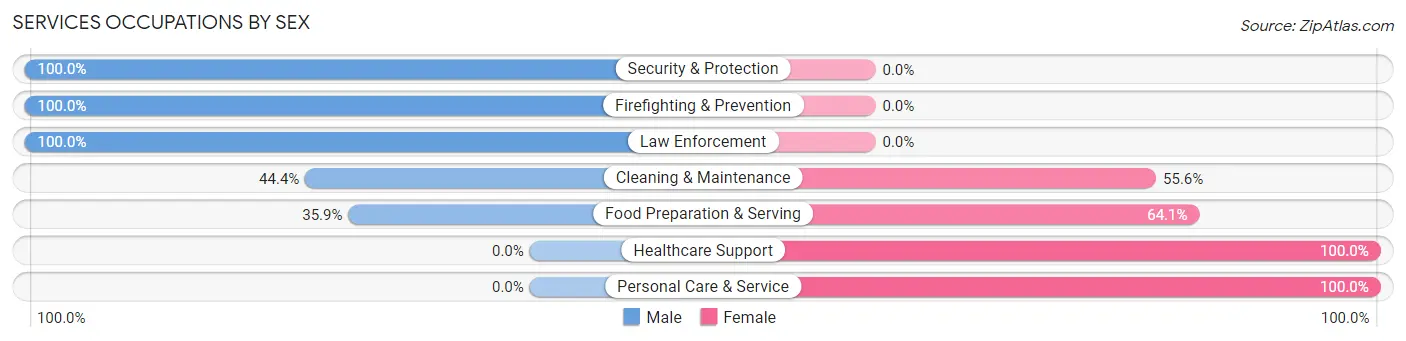
Services Occupations by Sex
Within the Services occupations in Wanamingo, the most male-oriented occupations are Security & Protection (100.0%), Firefighting & Prevention (100.0%), and Law Enforcement (100.0%), while the most female-oriented occupations are Healthcare Support (100.0%), Personal Care & Service (100.0%), and Food Preparation & Serving (64.1%).
| Occupation | Male | Female |
| Healthcare Support | 0 (0.0%) | 28 (100.0%) |
| Security & Protection | 13 (100.0%) | 0 (0.0%) |
| Firefighting & Prevention | 10 (100.0%) | 0 (0.0%) |
| Law Enforcement | 3 (100.0%) | 0 (0.0%) |
| Food Preparation & Serving | 14 (35.9%) | 25 (64.1%) |
| Cleaning & Maintenance | 4 (44.4%) | 5 (55.6%) |
| Personal Care & Service | 0 (0.0%) | 10 (100.0%) |
| Total (Category) | 31 (31.3%) | 68 (68.7%) |
| Total (Overall) | 313 (50.6%) | 306 (49.4%) |
Sales and Office Occupations
The most common Sales and Office occupations in Wanamingo are Sales & Related (57 | 9.2%), and Office & Administration (49 | 7.9%).
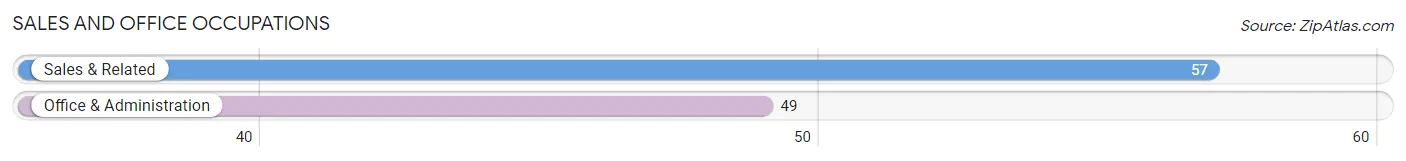
Sales and Office Occupations by Sex
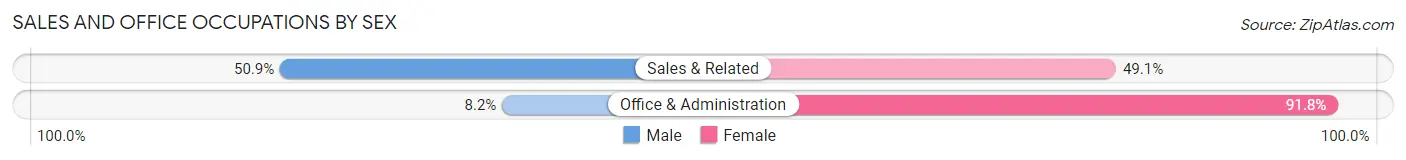
| Occupation | Male | Female |
| Sales & Related | 29 (50.9%) | 28 (49.1%) |
| Office & Administration | 4 (8.2%) | 45 (91.8%) |
| Total (Category) | 33 (31.1%) | 73 (68.9%) |
| Total (Overall) | 313 (50.6%) | 306 (49.4%) |
Natural Resources, Construction and Maintenance Occupations
The most common Natural Resources, Construction and Maintenance occupations in Wanamingo are Installation, Maintenance & Repair (38 | 6.1%), Construction & Extraction (29 | 4.7%), and Farming, Fishing & Forestry (15 | 2.4%).
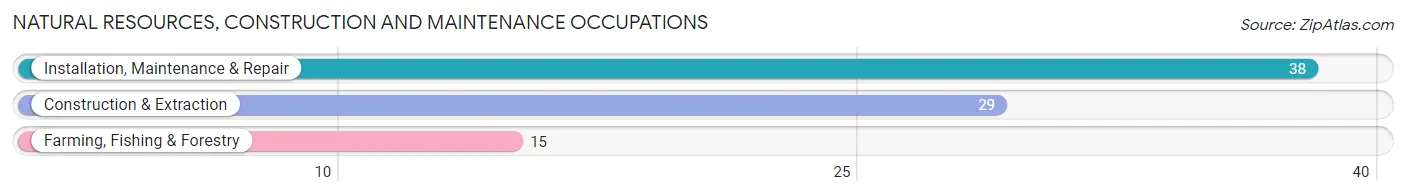
Natural Resources, Construction and Maintenance Occupations by Sex
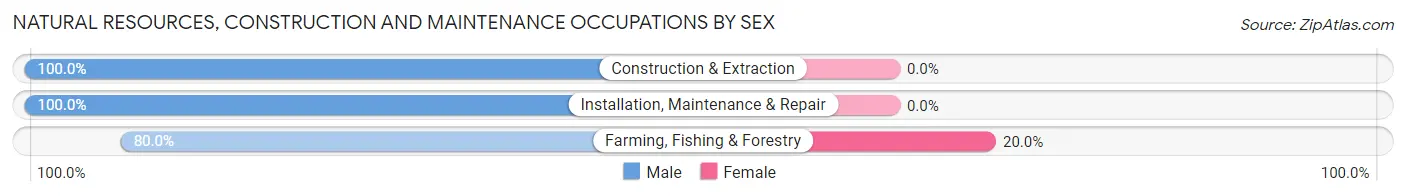
| Occupation | Male | Female |
| Farming, Fishing & Forestry | 12 (80.0%) | 3 (20.0%) |
| Construction & Extraction | 29 (100.0%) | 0 (0.0%) |
| Installation, Maintenance & Repair | 38 (100.0%) | 0 (0.0%) |
| Total (Category) | 79 (96.3%) | 3 (3.7%) |
| Total (Overall) | 313 (50.6%) | 306 (49.4%) |
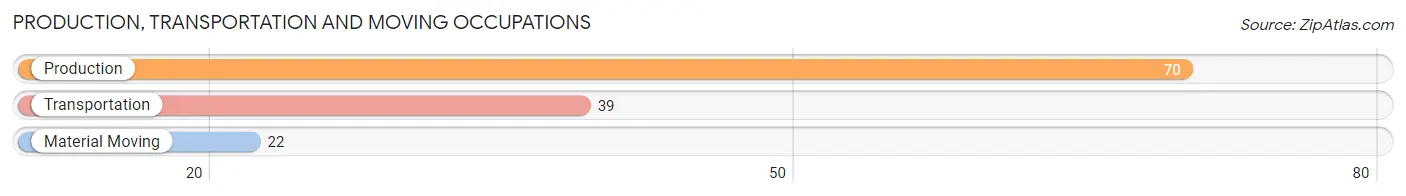
Production, Transportation and Moving Occupations
The most common Production, Transportation and Moving occupations in Wanamingo are Production (70 | 11.3%), Transportation (39 | 6.3%), and Material Moving (22 | 3.5%).
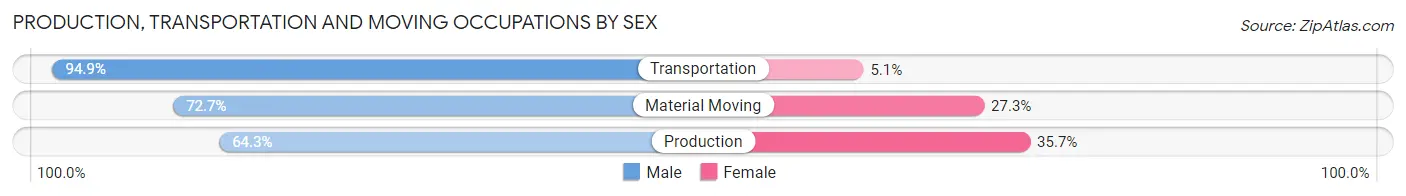
Production, Transportation and Moving Occupations by Sex
| Occupation | Male | Female |
| Production | 45 (64.3%) | 25 (35.7%) |
| Transportation | 37 (94.9%) | 2 (5.1%) |
| Material Moving | 16 (72.7%) | 6 (27.3%) |
| Total (Category) | 98 (74.8%) | 33 (25.2%) |
| Total (Overall) | 313 (50.6%) | 306 (49.4%) |
Employment Industries by Sex in Wanamingo
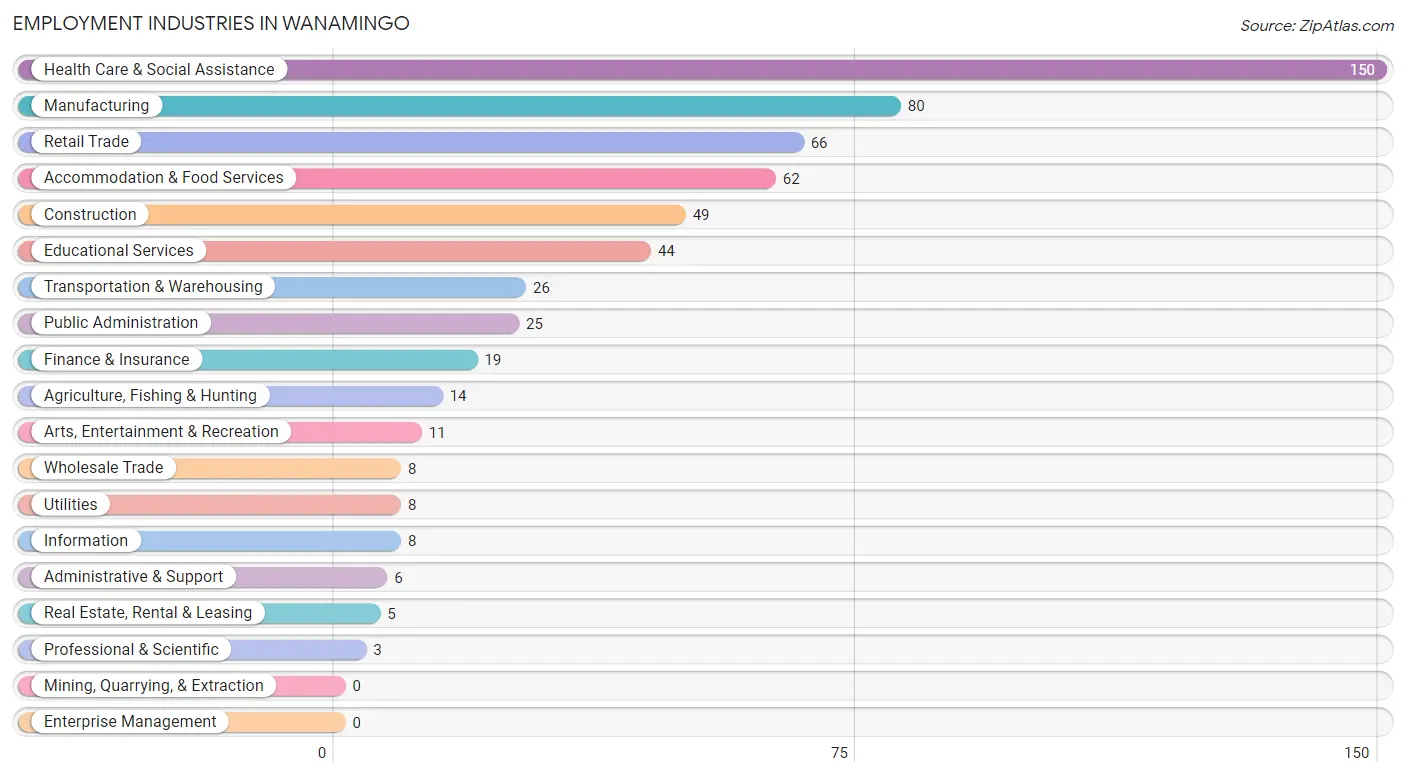
Employment Industries in Wanamingo
The major employment industries in Wanamingo include Health Care & Social Assistance (150 | 24.2%), Manufacturing (80 | 12.9%), Retail Trade (66 | 10.7%), Accommodation & Food Services (62 | 10.0%), and Construction (49 | 7.9%).
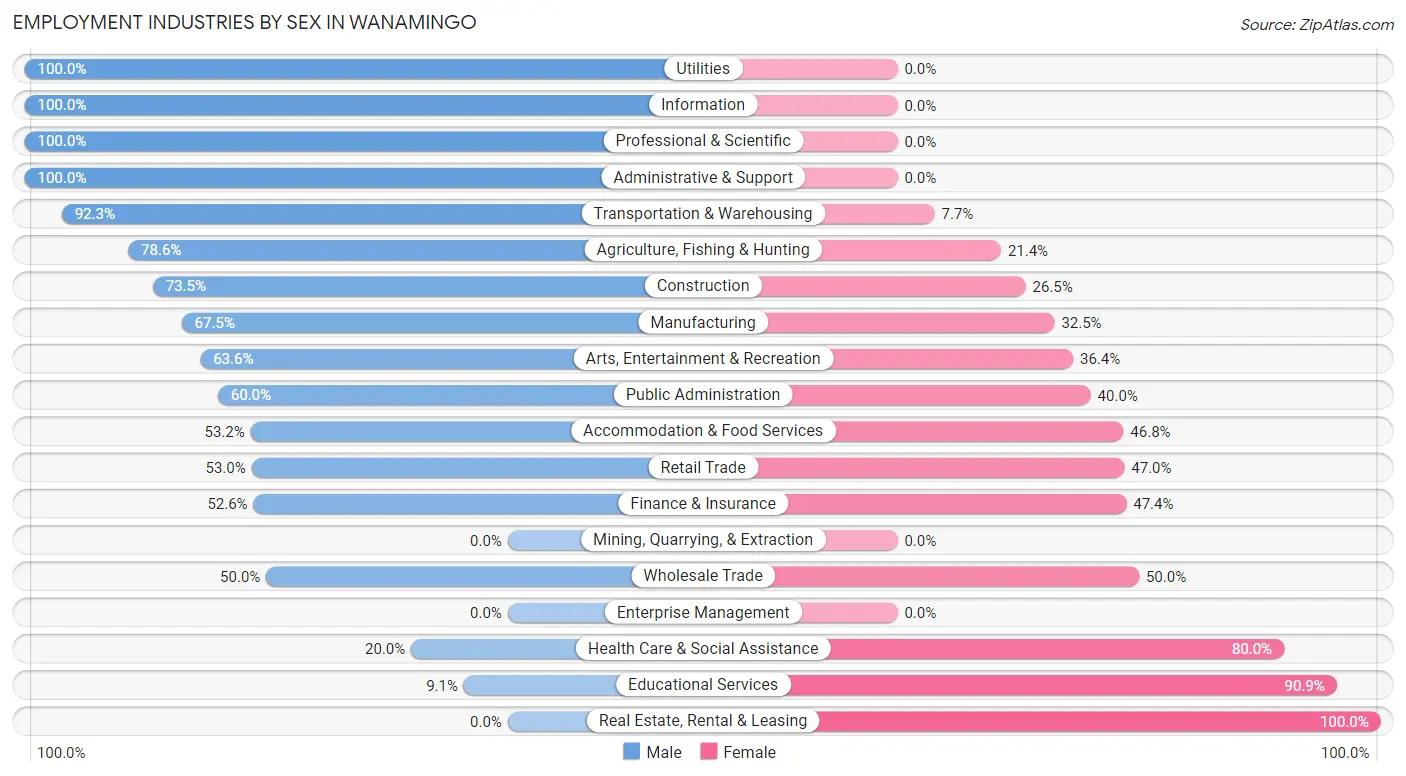
Employment Industries by Sex in Wanamingo
The Wanamingo industries that see more men than women are Utilities (100.0%), Information (100.0%), and Professional & Scientific (100.0%), whereas the industries that tend to have a higher number of women are Real Estate, Rental & Leasing (100.0%), Educational Services (90.9%), and Health Care & Social Assistance (80.0%).
| Industry | Male | Female |
| Agriculture, Fishing & Hunting | 11 (78.6%) | 3 (21.4%) |
| Mining, Quarrying, & Extraction | 0 (0.0%) | 0 (0.0%) |
| Construction | 36 (73.5%) | 13 (26.5%) |
| Manufacturing | 54 (67.5%) | 26 (32.5%) |
| Wholesale Trade | 4 (50.0%) | 4 (50.0%) |
| Retail Trade | 35 (53.0%) | 31 (47.0%) |
| Transportation & Warehousing | 24 (92.3%) | 2 (7.7%) |
| Utilities | 8 (100.0%) | 0 (0.0%) |
| Information | 8 (100.0%) | 0 (0.0%) |
| Finance & Insurance | 10 (52.6%) | 9 (47.4%) |
| Real Estate, Rental & Leasing | 0 (0.0%) | 5 (100.0%) |
| Professional & Scientific | 3 (100.0%) | 0 (0.0%) |
| Enterprise Management | 0 (0.0%) | 0 (0.0%) |
| Administrative & Support | 6 (100.0%) | 0 (0.0%) |
| Educational Services | 4 (9.1%) | 40 (90.9%) |
| Health Care & Social Assistance | 30 (20.0%) | 120 (80.0%) |
| Arts, Entertainment & Recreation | 7 (63.6%) | 4 (36.4%) |
| Accommodation & Food Services | 33 (53.2%) | 29 (46.8%) |
| Public Administration | 15 (60.0%) | 10 (40.0%) |
| Total | 313 (50.6%) | 306 (49.4%) |
Education in Wanamingo
School Enrollment in Wanamingo
The most common levels of schooling among the 277 students in Wanamingo are middle school (103 | 37.2%), elementary school (63 | 22.7%), and high school (58 | 20.9%).
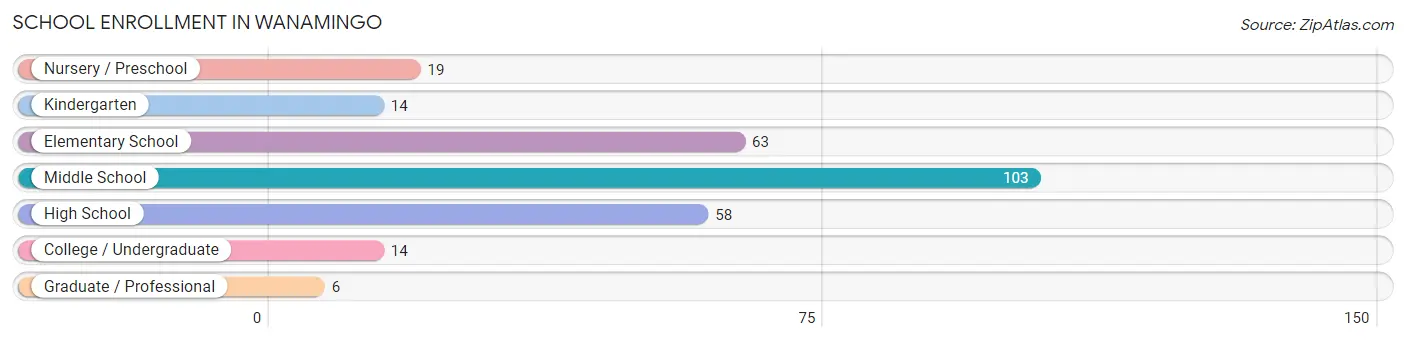
| School Level | # Students | % Students |
| Nursery / Preschool | 19 | 6.9% |
| Kindergarten | 14 | 5.1% |
| Elementary School | 63 | 22.7% |
| Middle School | 103 | 37.2% |
| High School | 58 | 20.9% |
| College / Undergraduate | 14 | 5.1% |
| Graduate / Professional | 6 | 2.2% |
| Total | 277 | 100.0% |
School Enrollment by Age by Funding Source in Wanamingo
Out of a total of 277 students who are enrolled in schools in Wanamingo, 6 (2.2%) attend a private institution, while the remaining 271 (97.8%) are enrolled in public schools. The age group of 25 to 34 year olds has the highest likelihood of being enrolled in private schools, with 6 (40.0% in the age bracket) enrolled. Conversely, the age group of 3 to 4 year olds has the lowest likelihood of being enrolled in a private school, with 15 (100.0% in the age bracket) attending a public institution.
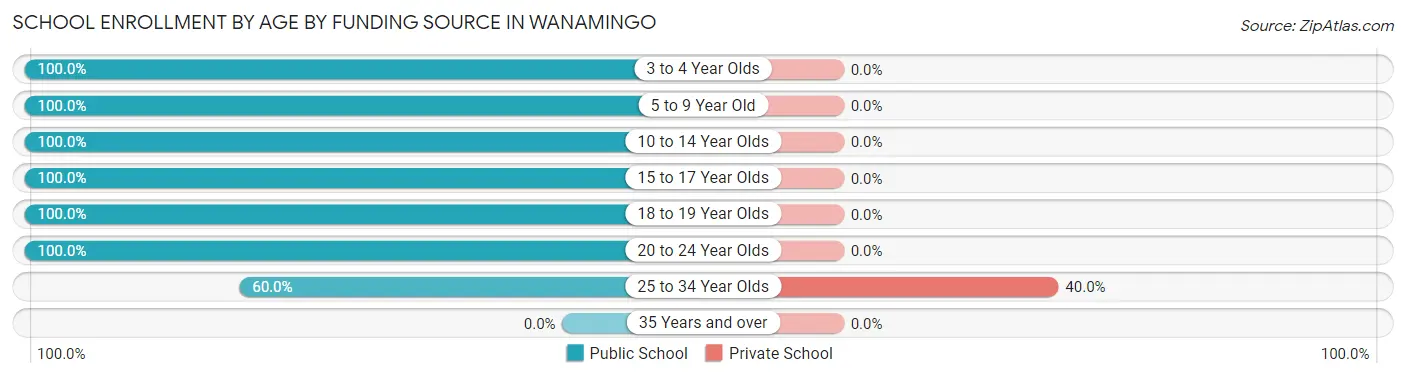
| Age Bracket | Public School | Private School |
| 3 to 4 Year Olds | 15 (100.0%) | 0 (0.0%) |
| 5 to 9 Year Old | 77 (100.0%) | 0 (0.0%) |
| 10 to 14 Year Olds | 111 (100.0%) | 0 (0.0%) |
| 15 to 17 Year Olds | 50 (100.0%) | 0 (0.0%) |
| 18 to 19 Year Olds | 4 (100.0%) | 0 (0.0%) |
| 20 to 24 Year Olds | 5 (100.0%) | 0 (0.0%) |
| 25 to 34 Year Olds | 9 (60.0%) | 6 (40.0%) |
| 35 Years and over | 0 (0.0%) | 0 (0.0%) |
| Total | 271 (97.8%) | 6 (2.2%) |
Educational Attainment by Field of Study in Wanamingo
Science & technology (39 | 19.9%), business (31 | 15.8%), education (25 | 12.8%), bio, nature & agricultural (23 | 11.7%), and literature & languages (22 | 11.2%) are the most common fields of study among 196 individuals in Wanamingo who have obtained a bachelor's degree or higher.
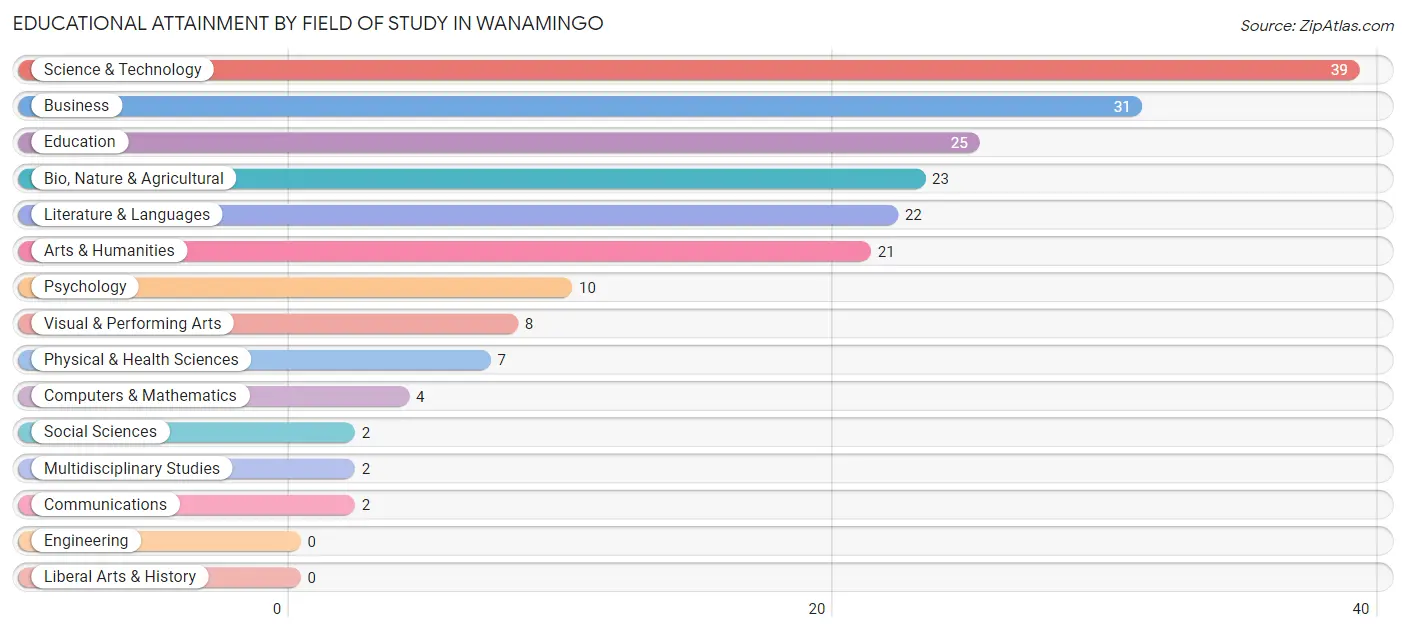
| Field of Study | # Graduates | % Graduates |
| Computers & Mathematics | 4 | 2.0% |
| Bio, Nature & Agricultural | 23 | 11.7% |
| Physical & Health Sciences | 7 | 3.6% |
| Psychology | 10 | 5.1% |
| Social Sciences | 2 | 1.0% |
| Engineering | 0 | 0.0% |
| Multidisciplinary Studies | 2 | 1.0% |
| Science & Technology | 39 | 19.9% |
| Business | 31 | 15.8% |
| Education | 25 | 12.8% |
| Literature & Languages | 22 | 11.2% |
| Liberal Arts & History | 0 | 0.0% |
| Visual & Performing Arts | 8 | 4.1% |
| Communications | 2 | 1.0% |
| Arts & Humanities | 21 | 10.7% |
| Total | 196 | 100.0% |
Transportation & Commute in Wanamingo
Vehicle Availability by Sex in Wanamingo
The most prevalent vehicle ownership categories in Wanamingo are males with 2 vehicles (140, accounting for 46.4%) and females with 2 vehicles (95, making up 47.9%).
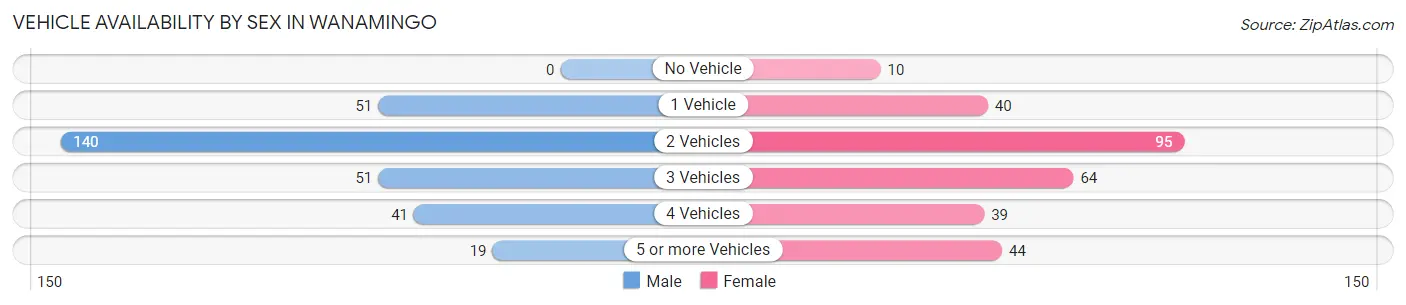
| Vehicles Available | Male | Female |
| No Vehicle | 0 (0.0%) | 10 (3.4%) |
| 1 Vehicle | 51 (16.9%) | 40 (13.7%) |
| 2 Vehicles | 140 (46.4%) | 95 (32.5%) |
| 3 Vehicles | 51 (16.9%) | 64 (21.9%) |
| 4 Vehicles | 41 (13.6%) | 39 (13.4%) |
| 5 or more Vehicles | 19 (6.3%) | 44 (15.1%) |
| Total | 302 (100.0%) | 292 (100.0%) |
Commute Time in Wanamingo
The most frequently occuring commute durations in Wanamingo are 30 to 34 minutes (102 commuters, 18.0%), 5 to 9 minutes (89 commuters, 15.7%), and 35 to 39 minutes (76 commuters, 13.4%).
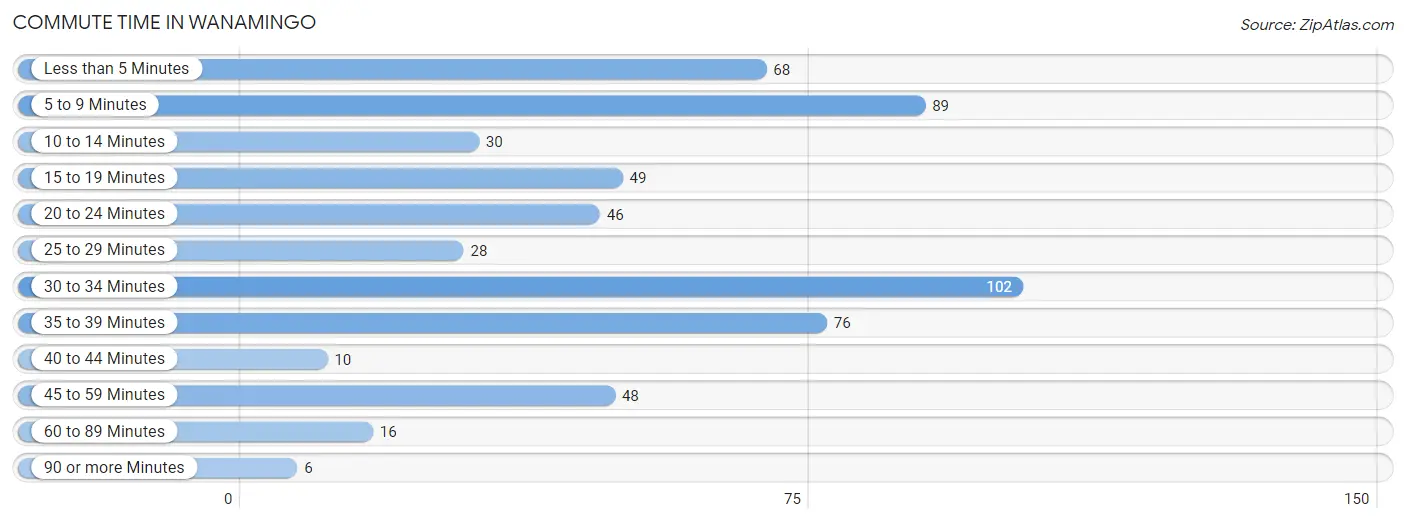
| Commute Time | # Commuters | % Commuters |
| Less than 5 Minutes | 68 | 12.0% |
| 5 to 9 Minutes | 89 | 15.7% |
| 10 to 14 Minutes | 30 | 5.3% |
| 15 to 19 Minutes | 49 | 8.6% |
| 20 to 24 Minutes | 46 | 8.1% |
| 25 to 29 Minutes | 28 | 4.9% |
| 30 to 34 Minutes | 102 | 18.0% |
| 35 to 39 Minutes | 76 | 13.4% |
| 40 to 44 Minutes | 10 | 1.8% |
| 45 to 59 Minutes | 48 | 8.5% |
| 60 to 89 Minutes | 16 | 2.8% |
| 90 or more Minutes | 6 | 1.1% |
Commute Time by Sex in Wanamingo
The most common commute times in Wanamingo are 5 to 9 minutes (44 commuters, 15.4%) for males and 30 to 34 minutes (73 commuters, 25.9%) for females.
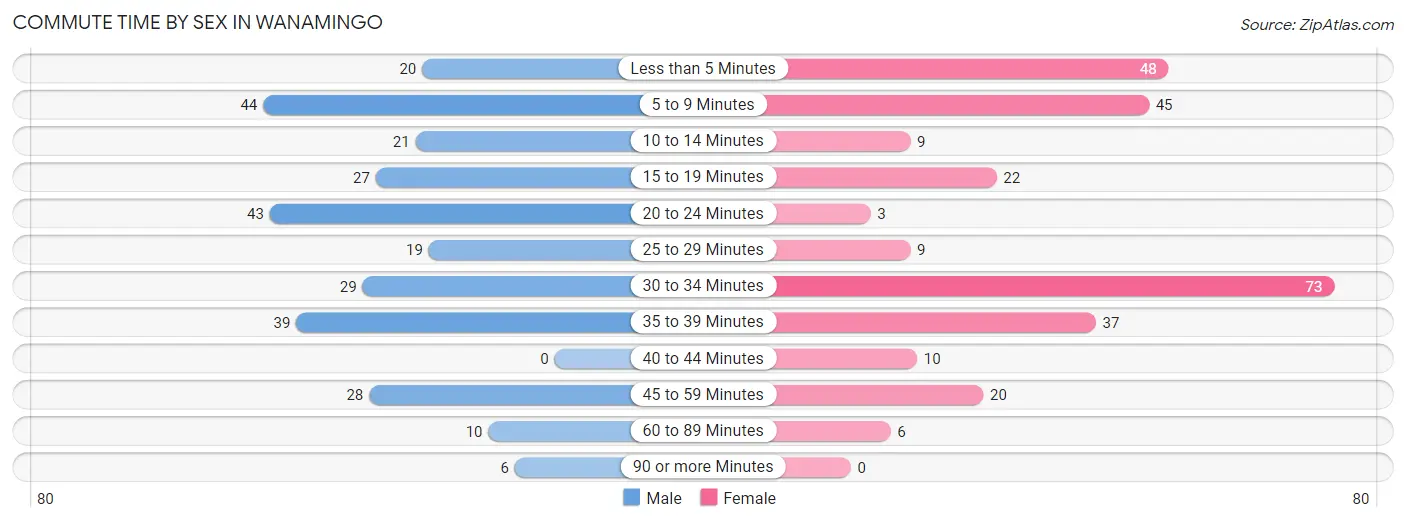
| Commute Time | Male | Female |
| Less than 5 Minutes | 20 (7.0%) | 48 (17.0%) |
| 5 to 9 Minutes | 44 (15.4%) | 45 (16.0%) |
| 10 to 14 Minutes | 21 (7.3%) | 9 (3.2%) |
| 15 to 19 Minutes | 27 (9.4%) | 22 (7.8%) |
| 20 to 24 Minutes | 43 (15.0%) | 3 (1.1%) |
| 25 to 29 Minutes | 19 (6.6%) | 9 (3.2%) |
| 30 to 34 Minutes | 29 (10.1%) | 73 (25.9%) |
| 35 to 39 Minutes | 39 (13.6%) | 37 (13.1%) |
| 40 to 44 Minutes | 0 (0.0%) | 10 (3.5%) |
| 45 to 59 Minutes | 28 (9.8%) | 20 (7.1%) |
| 60 to 89 Minutes | 10 (3.5%) | 6 (2.1%) |
| 90 or more Minutes | 6 (2.1%) | 0 (0.0%) |
Time of Departure to Work by Sex in Wanamingo
The most frequent times of departure to work in Wanamingo are 6:00 AM to 6:29 AM (66, 23.1%) for males and 6:00 AM to 6:29 AM (61, 21.6%) for females.
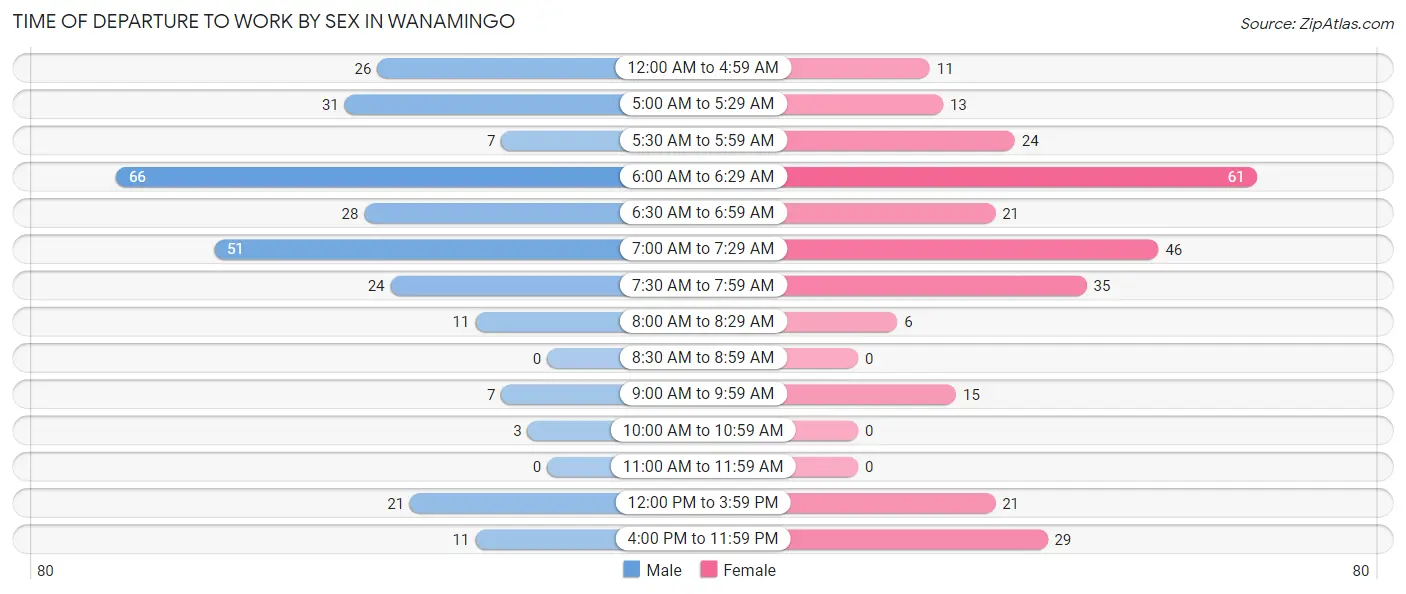
| Time of Departure | Male | Female |
| 12:00 AM to 4:59 AM | 26 (9.1%) | 11 (3.9%) |
| 5:00 AM to 5:29 AM | 31 (10.8%) | 13 (4.6%) |
| 5:30 AM to 5:59 AM | 7 (2.5%) | 24 (8.5%) |
| 6:00 AM to 6:29 AM | 66 (23.1%) | 61 (21.6%) |
| 6:30 AM to 6:59 AM | 28 (9.8%) | 21 (7.4%) |
| 7:00 AM to 7:29 AM | 51 (17.8%) | 46 (16.3%) |
| 7:30 AM to 7:59 AM | 24 (8.4%) | 35 (12.4%) |
| 8:00 AM to 8:29 AM | 11 (3.8%) | 6 (2.1%) |
| 8:30 AM to 8:59 AM | 0 (0.0%) | 0 (0.0%) |
| 9:00 AM to 9:59 AM | 7 (2.5%) | 15 (5.3%) |
| 10:00 AM to 10:59 AM | 3 (1.1%) | 0 (0.0%) |
| 11:00 AM to 11:59 AM | 0 (0.0%) | 0 (0.0%) |
| 12:00 PM to 3:59 PM | 21 (7.3%) | 21 (7.4%) |
| 4:00 PM to 11:59 PM | 11 (3.8%) | 29 (10.3%) |
| Total | 286 (100.0%) | 282 (100.0%) |
Housing Occupancy in Wanamingo
Occupancy by Ownership in Wanamingo
Of the total 493 dwellings in Wanamingo, owner-occupied units account for 356 (72.2%), while renter-occupied units make up 137 (27.8%).
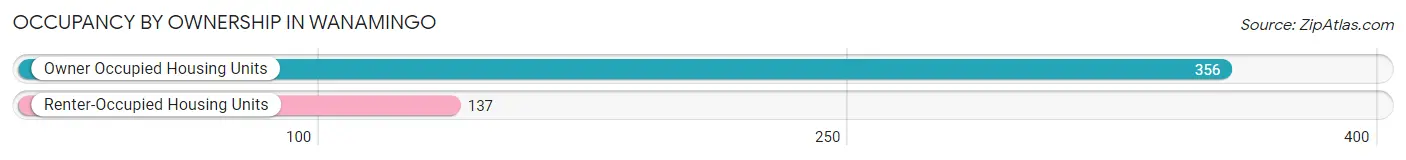
| Occupancy | # Housing Units | % Housing Units |
| Owner Occupied Housing Units | 356 | 72.2% |
| Renter-Occupied Housing Units | 137 | 27.8% |
| Total Occupied Housing Units | 493 | 100.0% |
Occupancy by Household Size in Wanamingo
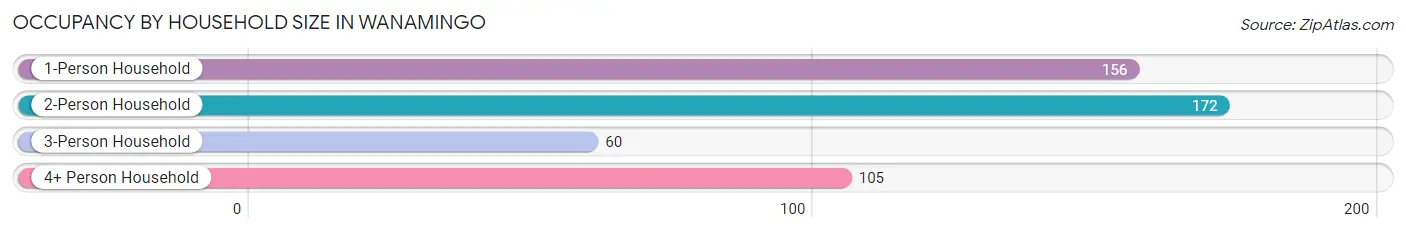
| Household Size | # Housing Units | % Housing Units |
| 1-Person Household | 156 | 31.6% |
| 2-Person Household | 172 | 34.9% |
| 3-Person Household | 60 | 12.2% |
| 4+ Person Household | 105 | 21.3% |
| Total Housing Units | 493 | 100.0% |
Occupancy by Ownership by Household Size in Wanamingo
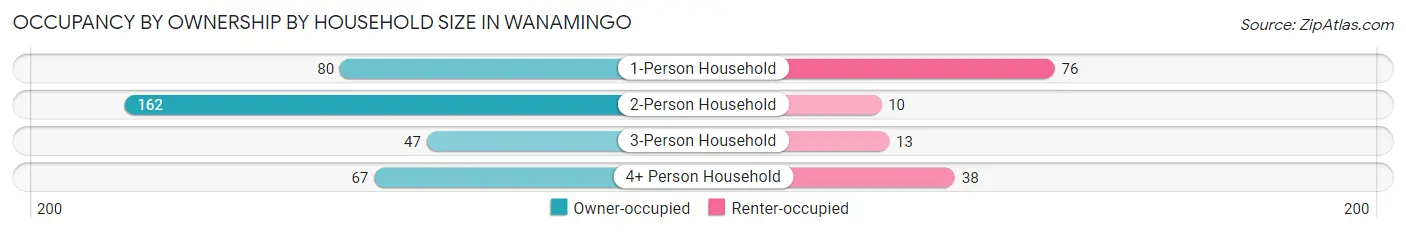
| Household Size | Owner-occupied | Renter-occupied |
| 1-Person Household | 80 (51.3%) | 76 (48.7%) |
| 2-Person Household | 162 (94.2%) | 10 (5.8%) |
| 3-Person Household | 47 (78.3%) | 13 (21.7%) |
| 4+ Person Household | 67 (63.8%) | 38 (36.2%) |
| Total Housing Units | 356 (72.2%) | 137 (27.8%) |
Occupancy by Educational Attainment in Wanamingo
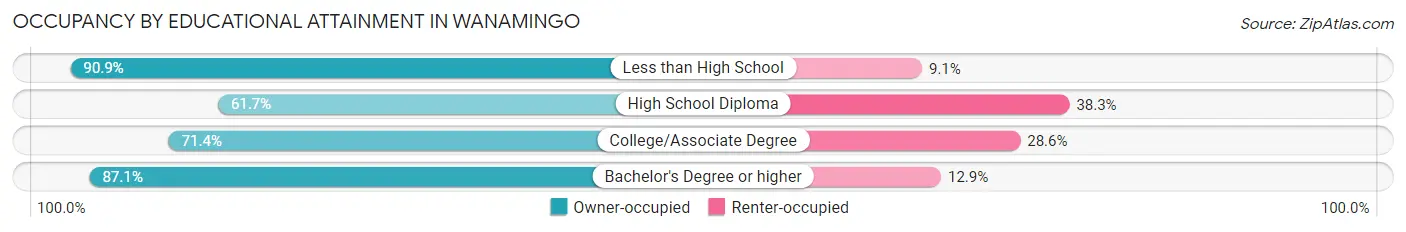
| Household Size | Owner-occupied | Renter-occupied |
| Less than High School | 20 (90.9%) | 2 (9.1%) |
| High School Diploma | 103 (61.7%) | 64 (38.3%) |
| College/Associate Degree | 145 (71.4%) | 58 (28.6%) |
| Bachelor's Degree or higher | 88 (87.1%) | 13 (12.9%) |
Occupancy by Age of Householder in Wanamingo
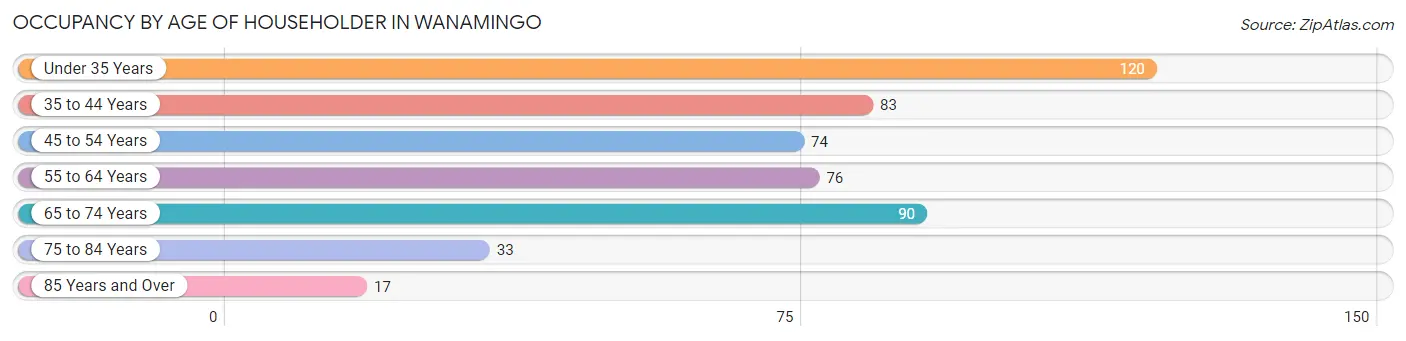
| Age Bracket | # Households | % Households |
| Under 35 Years | 120 | 24.3% |
| 35 to 44 Years | 83 | 16.8% |
| 45 to 54 Years | 74 | 15.0% |
| 55 to 64 Years | 76 | 15.4% |
| 65 to 74 Years | 90 | 18.3% |
| 75 to 84 Years | 33 | 6.7% |
| 85 Years and Over | 17 | 3.5% |
| Total | 493 | 100.0% |
Housing Finances in Wanamingo
Median Income by Occupancy in Wanamingo
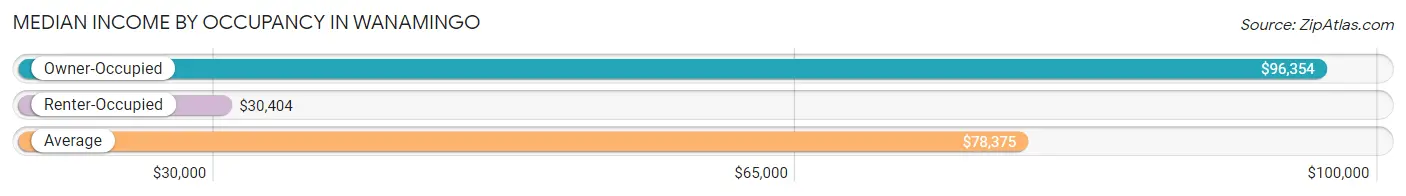
| Occupancy Type | # Households | Median Income |
| Owner-Occupied | 356 (72.2%) | $96,354 |
| Renter-Occupied | 137 (27.8%) | $30,404 |
| Average | 493 (100.0%) | $78,375 |
Occupancy by Householder Income Bracket in Wanamingo
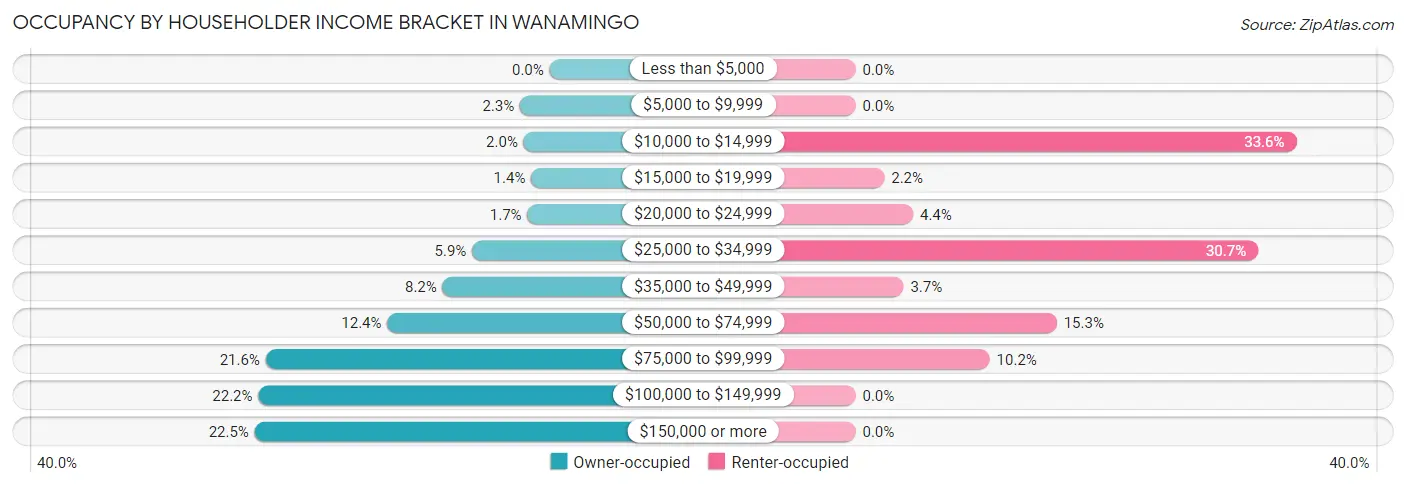
| Income Bracket | Owner-occupied | Renter-occupied |
| Less than $5,000 | 0 (0.0%) | 0 (0.0%) |
| $5,000 to $9,999 | 8 (2.2%) | 0 (0.0%) |
| $10,000 to $14,999 | 7 (2.0%) | 46 (33.6%) |
| $15,000 to $19,999 | 5 (1.4%) | 3 (2.2%) |
| $20,000 to $24,999 | 6 (1.7%) | 6 (4.4%) |
| $25,000 to $34,999 | 21 (5.9%) | 42 (30.7%) |
| $35,000 to $49,999 | 29 (8.2%) | 5 (3.6%) |
| $50,000 to $74,999 | 44 (12.4%) | 21 (15.3%) |
| $75,000 to $99,999 | 77 (21.6%) | 14 (10.2%) |
| $100,000 to $149,999 | 79 (22.2%) | 0 (0.0%) |
| $150,000 or more | 80 (22.5%) | 0 (0.0%) |
| Total | 356 (100.0%) | 137 (100.0%) |
Monthly Housing Cost Tiers in Wanamingo
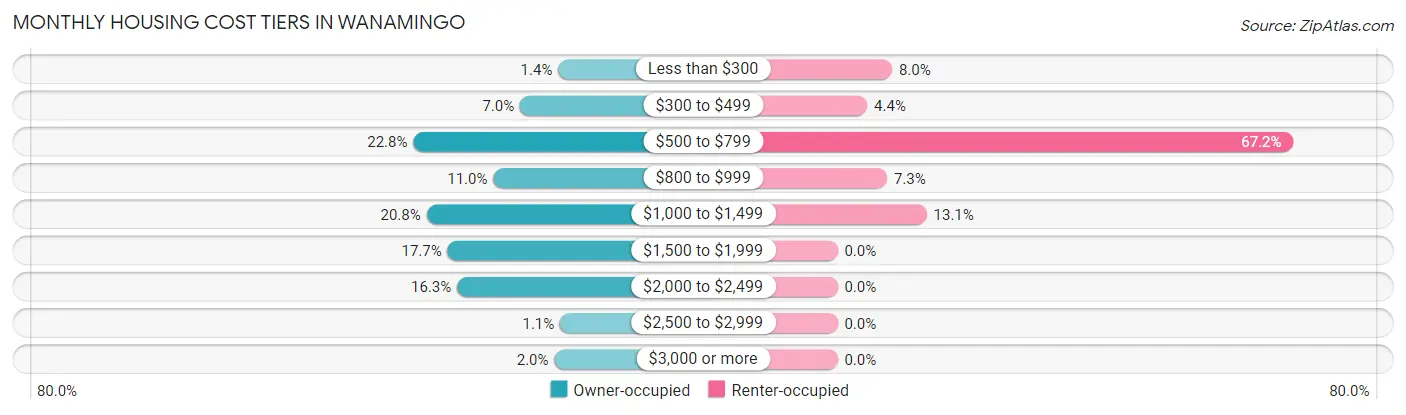
| Monthly Cost | Owner-occupied | Renter-occupied |
| Less than $300 | 5 (1.4%) | 11 (8.0%) |
| $300 to $499 | 25 (7.0%) | 6 (4.4%) |
| $500 to $799 | 81 (22.8%) | 92 (67.1%) |
| $800 to $999 | 39 (11.0%) | 10 (7.3%) |
| $1,000 to $1,499 | 74 (20.8%) | 18 (13.1%) |
| $1,500 to $1,999 | 63 (17.7%) | 0 (0.0%) |
| $2,000 to $2,499 | 58 (16.3%) | 0 (0.0%) |
| $2,500 to $2,999 | 4 (1.1%) | 0 (0.0%) |
| $3,000 or more | 7 (2.0%) | 0 (0.0%) |
| Total | 356 (100.0%) | 137 (100.0%) |
Physical Housing Characteristics in Wanamingo
Housing Structures in Wanamingo
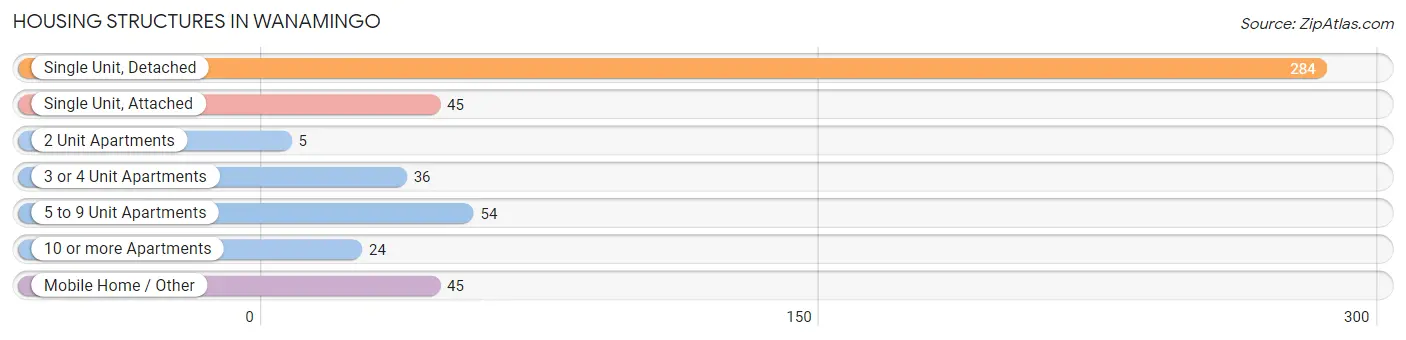
| Structure Type | # Housing Units | % Housing Units |
| Single Unit, Detached | 284 | 57.6% |
| Single Unit, Attached | 45 | 9.1% |
| 2 Unit Apartments | 5 | 1.0% |
| 3 or 4 Unit Apartments | 36 | 7.3% |
| 5 to 9 Unit Apartments | 54 | 11.0% |
| 10 or more Apartments | 24 | 4.9% |
| Mobile Home / Other | 45 | 9.1% |
| Total | 493 | 100.0% |
Housing Structures by Occupancy in Wanamingo
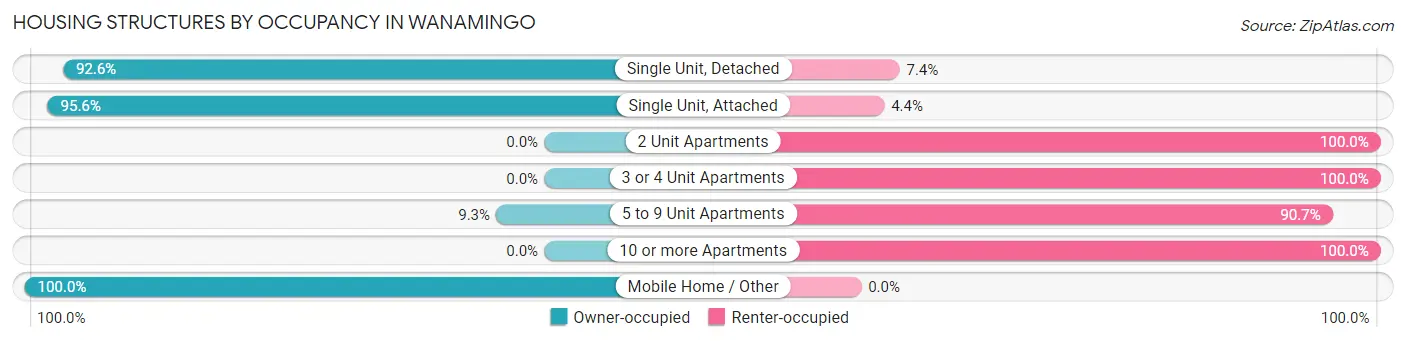
| Structure Type | Owner-occupied | Renter-occupied |
| Single Unit, Detached | 263 (92.6%) | 21 (7.4%) |
| Single Unit, Attached | 43 (95.6%) | 2 (4.4%) |
| 2 Unit Apartments | 0 (0.0%) | 5 (100.0%) |
| 3 or 4 Unit Apartments | 0 (0.0%) | 36 (100.0%) |
| 5 to 9 Unit Apartments | 5 (9.3%) | 49 (90.7%) |
| 10 or more Apartments | 0 (0.0%) | 24 (100.0%) |
| Mobile Home / Other | 45 (100.0%) | 0 (0.0%) |
| Total | 356 (72.2%) | 137 (27.8%) |
Housing Structures by Number of Rooms in Wanamingo
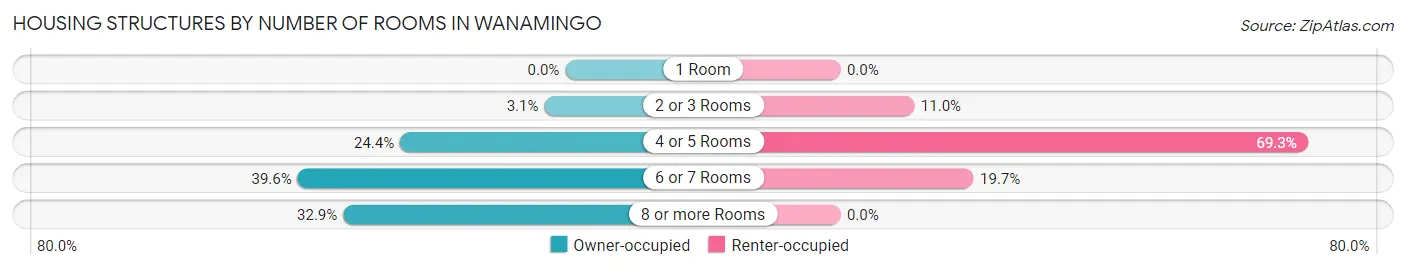
| Number of Rooms | Owner-occupied | Renter-occupied |
| 1 Room | 0 (0.0%) | 0 (0.0%) |
| 2 or 3 Rooms | 11 (3.1%) | 15 (11.0%) |
| 4 or 5 Rooms | 87 (24.4%) | 95 (69.3%) |
| 6 or 7 Rooms | 141 (39.6%) | 27 (19.7%) |
| 8 or more Rooms | 117 (32.9%) | 0 (0.0%) |
| Total | 356 (100.0%) | 137 (100.0%) |
Housing Structure by Heating Type in Wanamingo
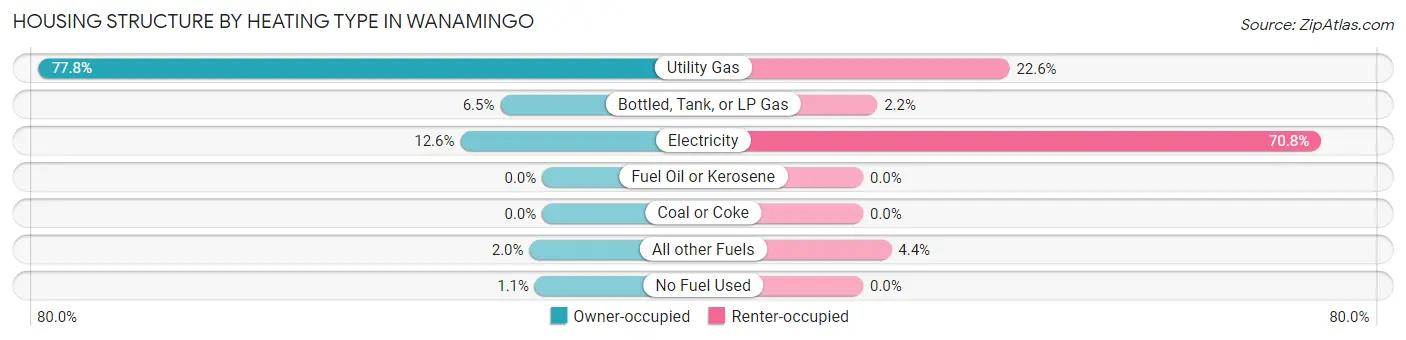
| Heating Type | Owner-occupied | Renter-occupied |
| Utility Gas | 277 (77.8%) | 31 (22.6%) |
| Bottled, Tank, or LP Gas | 23 (6.5%) | 3 (2.2%) |
| Electricity | 45 (12.6%) | 97 (70.8%) |
| Fuel Oil or Kerosene | 0 (0.0%) | 0 (0.0%) |
| Coal or Coke | 0 (0.0%) | 0 (0.0%) |
| All other Fuels | 7 (2.0%) | 6 (4.4%) |
| No Fuel Used | 4 (1.1%) | 0 (0.0%) |
| Total | 356 (100.0%) | 137 (100.0%) |
Household Vehicle Usage in Wanamingo
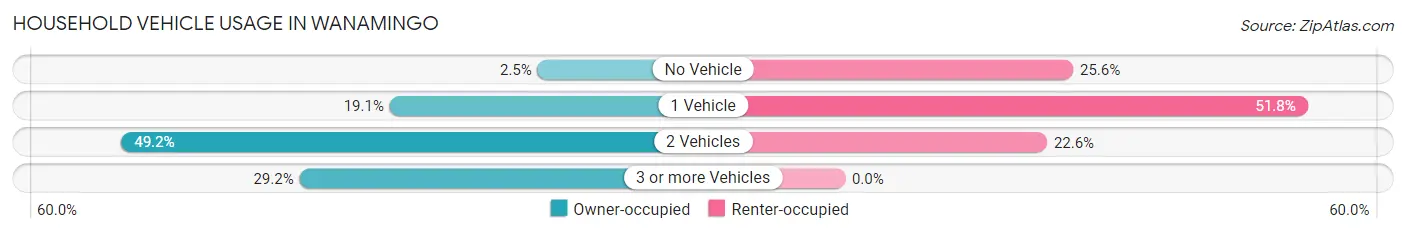
| Vehicles per Household | Owner-occupied | Renter-occupied |
| No Vehicle | 9 (2.5%) | 35 (25.6%) |
| 1 Vehicle | 68 (19.1%) | 71 (51.8%) |
| 2 Vehicles | 175 (49.2%) | 31 (22.6%) |
| 3 or more Vehicles | 104 (29.2%) | 0 (0.0%) |
| Total | 356 (100.0%) | 137 (100.0%) |
Real Estate & Mortgages in Wanamingo
Real Estate and Mortgage Overview in Wanamingo
| Characteristic | Without Mortgage | With Mortgage |
| Housing Units | 104 | 252 |
| Median Property Value | $189,700 | $245,500 |
| Median Household Income | $72,500 | $65 |
| Monthly Housing Costs | $576 | $7 |
| Real Estate Taxes | $2,512 | $0 |
Property Value by Mortgage Status in Wanamingo
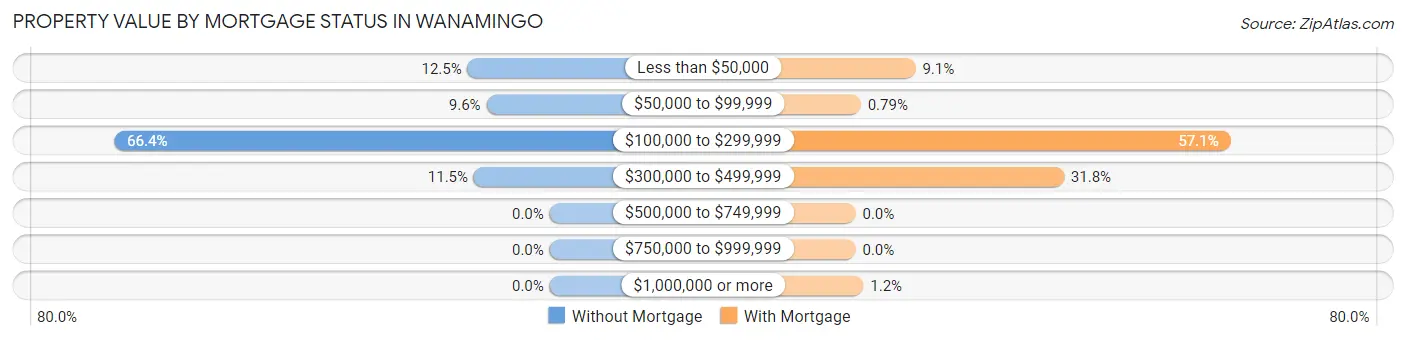
| Property Value | Without Mortgage | With Mortgage |
| Less than $50,000 | 13 (12.5%) | 23 (9.1%) |
| $50,000 to $99,999 | 10 (9.6%) | 2 (0.8%) |
| $100,000 to $299,999 | 69 (66.3%) | 144 (57.1%) |
| $300,000 to $499,999 | 12 (11.5%) | 80 (31.8%) |
| $500,000 to $749,999 | 0 (0.0%) | 0 (0.0%) |
| $750,000 to $999,999 | 0 (0.0%) | 0 (0.0%) |
| $1,000,000 or more | 0 (0.0%) | 3 (1.2%) |
| Total | 104 (100.0%) | 252 (100.0%) |
Household Income by Mortgage Status in Wanamingo
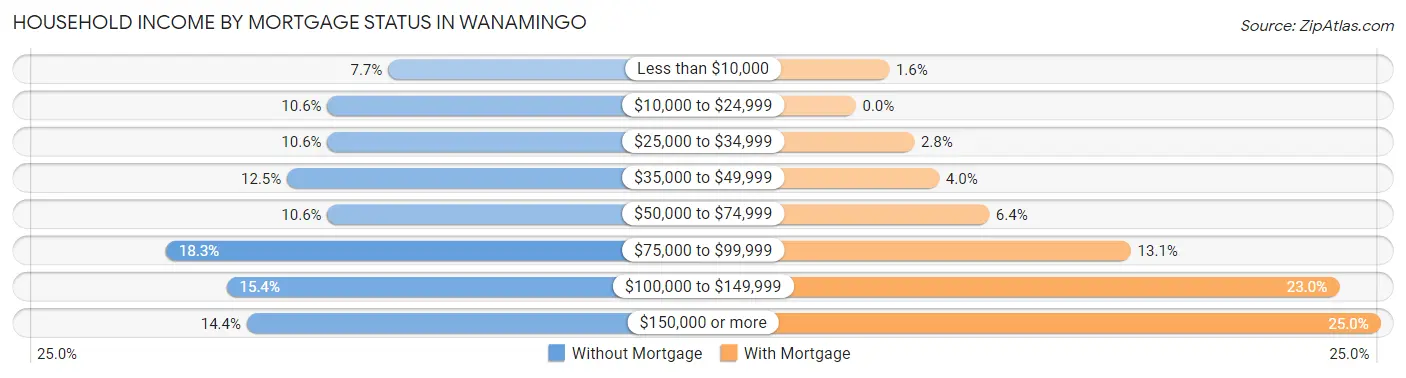
| Household Income | Without Mortgage | With Mortgage |
| Less than $10,000 | 8 (7.7%) | 4 (1.6%) |
| $10,000 to $24,999 | 11 (10.6%) | 0 (0.0%) |
| $25,000 to $34,999 | 11 (10.6%) | 7 (2.8%) |
| $35,000 to $49,999 | 13 (12.5%) | 10 (4.0%) |
| $50,000 to $74,999 | 11 (10.6%) | 16 (6.4%) |
| $75,000 to $99,999 | 19 (18.3%) | 33 (13.1%) |
| $100,000 to $149,999 | 16 (15.4%) | 58 (23.0%) |
| $150,000 or more | 15 (14.4%) | 63 (25.0%) |
| Total | 104 (100.0%) | 252 (100.0%) |
Property Value to Household Income Ratio in Wanamingo
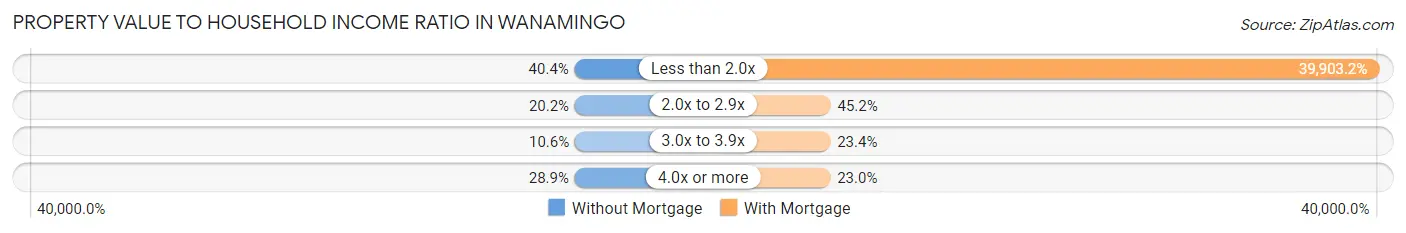
| Value-to-Income Ratio | Without Mortgage | With Mortgage |
| Less than 2.0x | 42 (40.4%) | 100,556 (39,903.2%) |
| 2.0x to 2.9x | 21 (20.2%) | 114 (45.2%) |
| 3.0x to 3.9x | 11 (10.6%) | 59 (23.4%) |
| 4.0x or more | 30 (28.8%) | 58 (23.0%) |
| Total | 104 (100.0%) | 252 (100.0%) |
Real Estate Taxes by Mortgage Status in Wanamingo
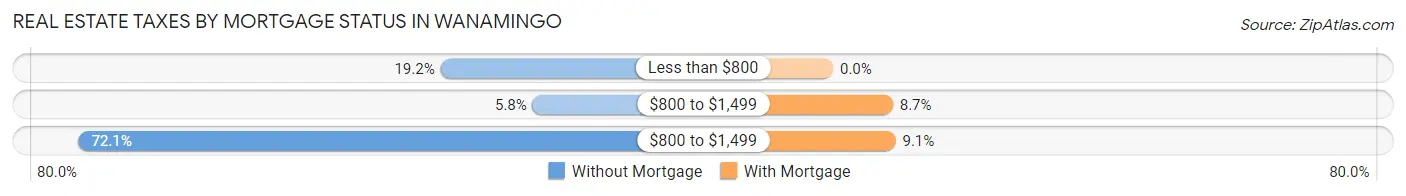
| Property Taxes | Without Mortgage | With Mortgage |
| Less than $800 | 20 (19.2%) | 0 (0.0%) |
| $800 to $1,499 | 6 (5.8%) | 22 (8.7%) |
| $800 to $1,499 | 75 (72.1%) | 23 (9.1%) |
| Total | 104 (100.0%) | 252 (100.0%) |
Health & Disability in Wanamingo
Health Insurance Coverage by Age in Wanamingo
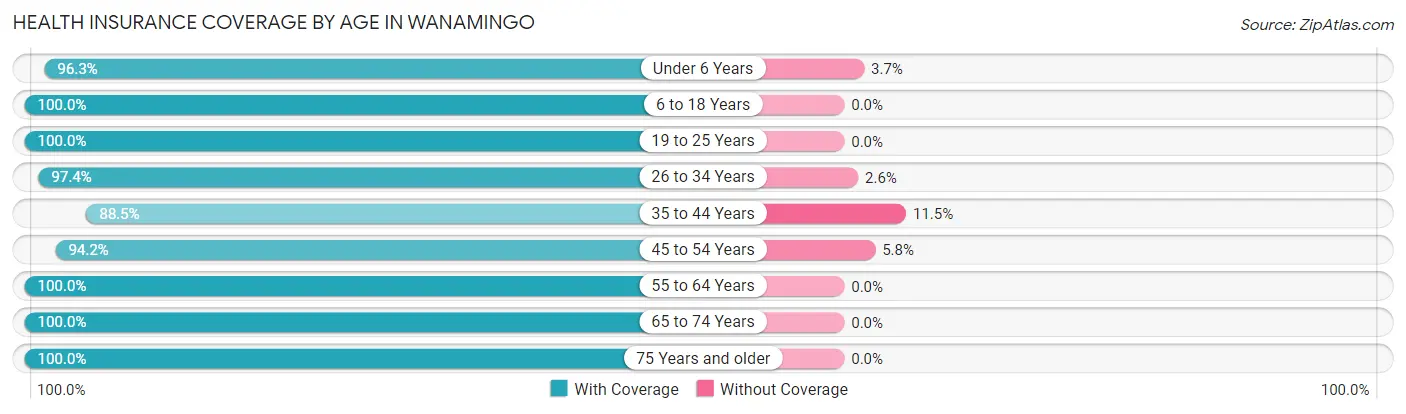
| Age Bracket | With Coverage | Without Coverage |
| Under 6 Years | 78 (96.3%) | 3 (3.7%) |
| 6 to 18 Years | 230 (100.0%) | 0 (0.0%) |
| 19 to 25 Years | 76 (100.0%) | 0 (0.0%) |
| 26 to 34 Years | 151 (97.4%) | 4 (2.6%) |
| 35 to 44 Years | 146 (88.5%) | 19 (11.5%) |
| 45 to 54 Years | 131 (94.2%) | 8 (5.8%) |
| 55 to 64 Years | 130 (100.0%) | 0 (0.0%) |
| 65 to 74 Years | 136 (100.0%) | 0 (0.0%) |
| 75 Years and older | 77 (100.0%) | 0 (0.0%) |
| Total | 1,155 (97.1%) | 34 (2.9%) |
Health Insurance Coverage by Citizenship Status in Wanamingo
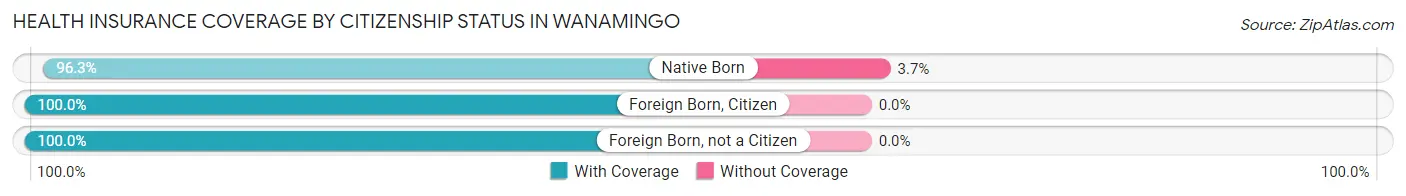
| Citizenship Status | With Coverage | Without Coverage |
| Native Born | 78 (96.3%) | 3 (3.7%) |
| Foreign Born, Citizen | 230 (100.0%) | 0 (0.0%) |
| Foreign Born, not a Citizen | 76 (100.0%) | 0 (0.0%) |
Health Insurance Coverage by Household Income in Wanamingo
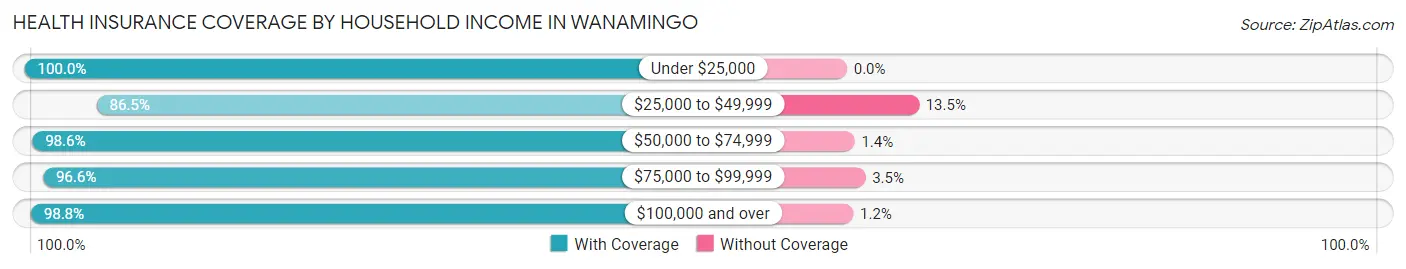
| Household Income | With Coverage | Without Coverage |
| Under $25,000 | 170 (100.0%) | 0 (0.0%) |
| $25,000 to $49,999 | 122 (86.5%) | 19 (13.5%) |
| $50,000 to $74,999 | 137 (98.6%) | 2 (1.4%) |
| $75,000 to $99,999 | 196 (96.6%) | 7 (3.5%) |
| $100,000 and over | 503 (98.8%) | 6 (1.2%) |
Public vs Private Health Insurance Coverage by Age in Wanamingo
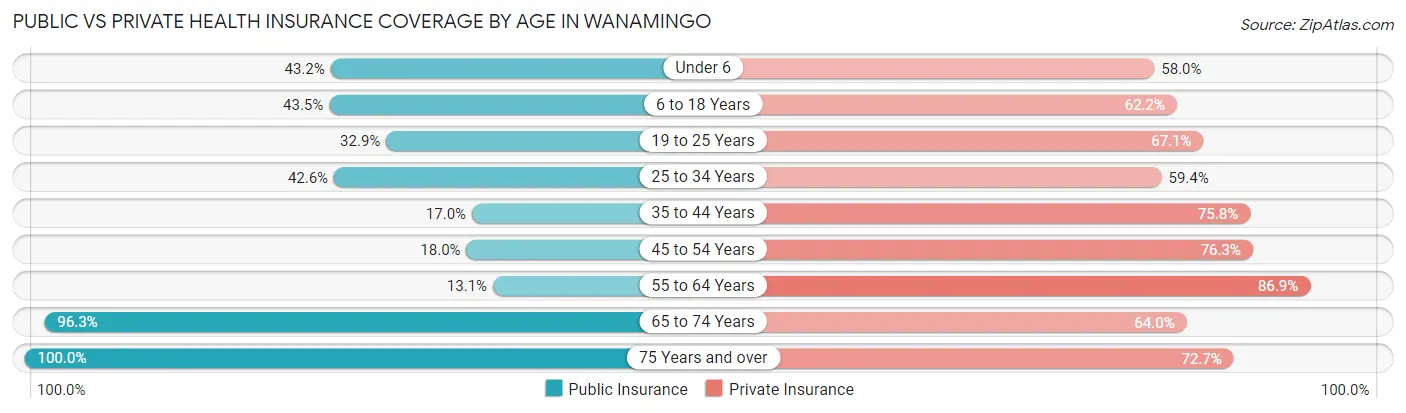
| Age Bracket | Public Insurance | Private Insurance |
| Under 6 | 35 (43.2%) | 47 (58.0%) |
| 6 to 18 Years | 100 (43.5%) | 143 (62.2%) |
| 19 to 25 Years | 25 (32.9%) | 51 (67.1%) |
| 25 to 34 Years | 66 (42.6%) | 92 (59.4%) |
| 35 to 44 Years | 28 (17.0%) | 125 (75.8%) |
| 45 to 54 Years | 25 (18.0%) | 106 (76.3%) |
| 55 to 64 Years | 17 (13.1%) | 113 (86.9%) |
| 65 to 74 Years | 131 (96.3%) | 87 (64.0%) |
| 75 Years and over | 77 (100.0%) | 56 (72.7%) |
| Total | 504 (42.4%) | 820 (69.0%) |
Disability Status by Sex by Age in Wanamingo
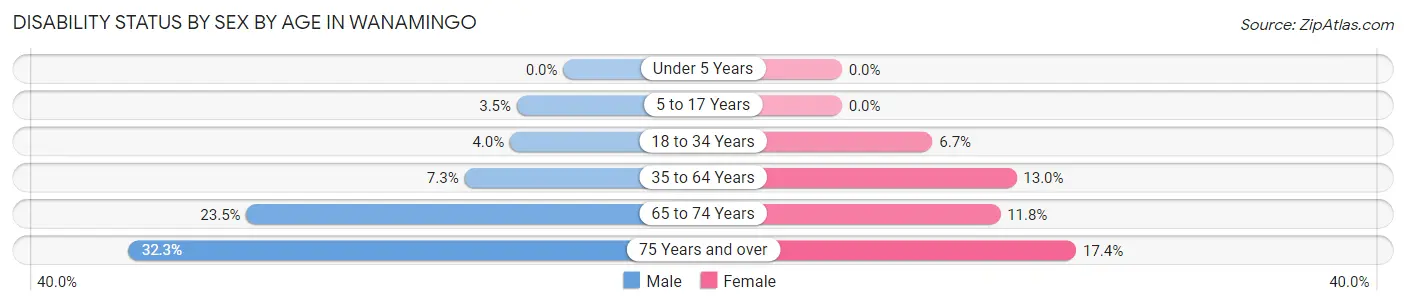
| Age Bracket | Male | Female |
| Under 5 Years | 0 (0.0%) | 0 (0.0%) |
| 5 to 17 Years | 3 (3.5%) | 0 (0.0%) |
| 18 to 34 Years | 4 (4.0%) | 9 (6.7%) |
| 35 to 64 Years | 16 (7.3%) | 28 (13.0%) |
| 65 to 74 Years | 12 (23.5%) | 10 (11.8%) |
| 75 Years and over | 10 (32.3%) | 8 (17.4%) |
Disability Class by Sex by Age in Wanamingo
Disability Class: Hearing Difficulty
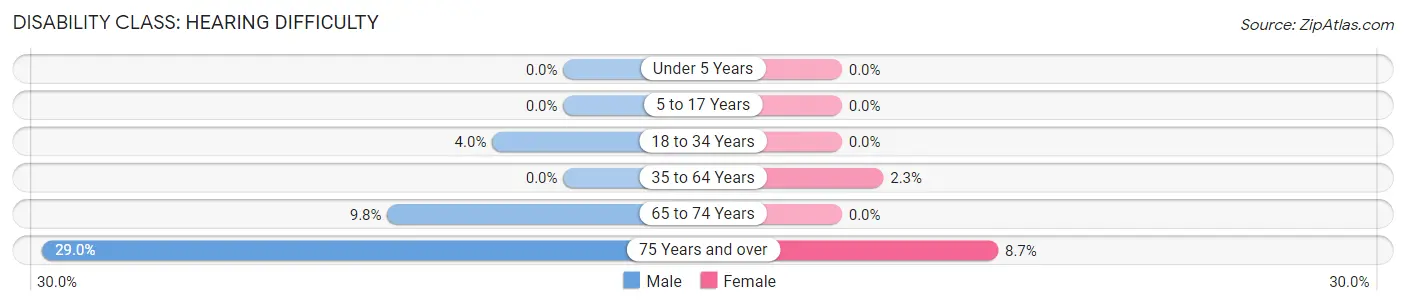
| Age Bracket | Male | Female |
| Under 5 Years | 0 (0.0%) | 0 (0.0%) |
| 5 to 17 Years | 0 (0.0%) | 0 (0.0%) |
| 18 to 34 Years | 4 (4.0%) | 0 (0.0%) |
| 35 to 64 Years | 0 (0.0%) | 5 (2.3%) |
| 65 to 74 Years | 5 (9.8%) | 0 (0.0%) |
| 75 Years and over | 9 (29.0%) | 4 (8.7%) |
Disability Class: Vision Difficulty
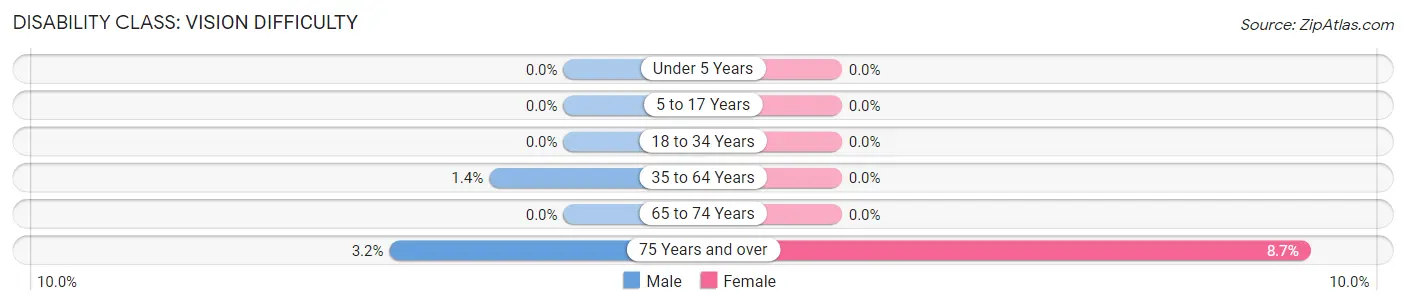
| Age Bracket | Male | Female |
| Under 5 Years | 0 (0.0%) | 0 (0.0%) |
| 5 to 17 Years | 0 (0.0%) | 0 (0.0%) |
| 18 to 34 Years | 0 (0.0%) | 0 (0.0%) |
| 35 to 64 Years | 3 (1.4%) | 0 (0.0%) |
| 65 to 74 Years | 0 (0.0%) | 0 (0.0%) |
| 75 Years and over | 1 (3.2%) | 4 (8.7%) |
Disability Class: Cognitive Difficulty
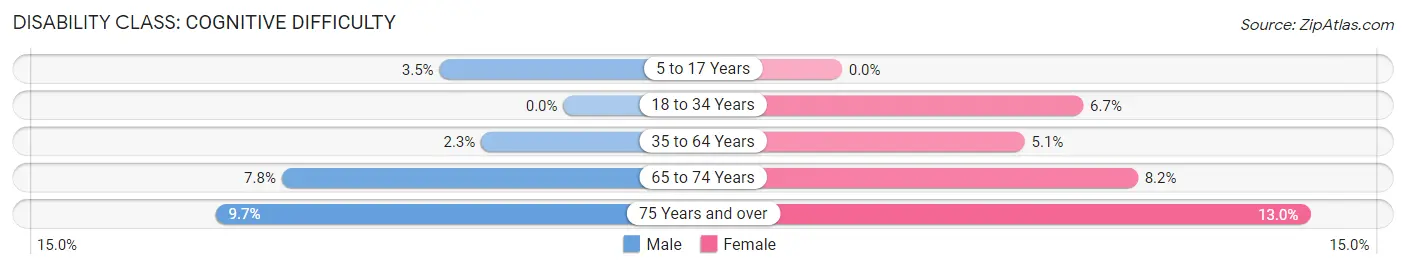
| Age Bracket | Male | Female |
| 5 to 17 Years | 3 (3.5%) | 0 (0.0%) |
| 18 to 34 Years | 0 (0.0%) | 9 (6.7%) |
| 35 to 64 Years | 5 (2.3%) | 11 (5.1%) |
| 65 to 74 Years | 4 (7.8%) | 7 (8.2%) |
| 75 Years and over | 3 (9.7%) | 6 (13.0%) |
Disability Class: Ambulatory Difficulty
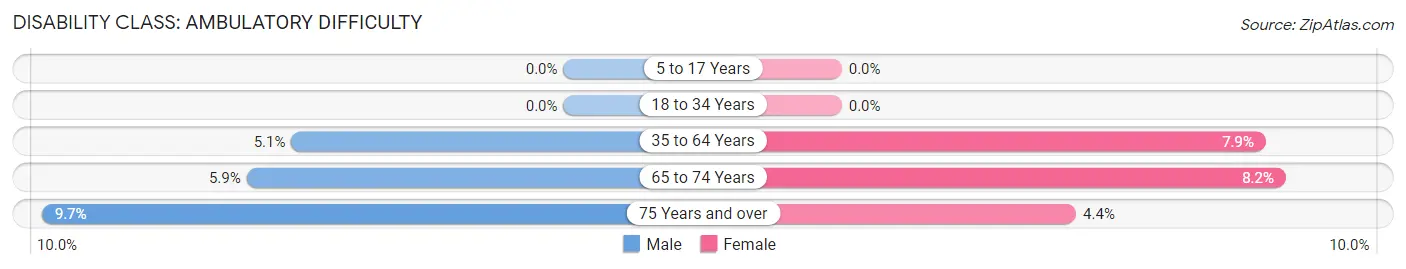
| Age Bracket | Male | Female |
| 5 to 17 Years | 0 (0.0%) | 0 (0.0%) |
| 18 to 34 Years | 0 (0.0%) | 0 (0.0%) |
| 35 to 64 Years | 11 (5.1%) | 17 (7.9%) |
| 65 to 74 Years | 3 (5.9%) | 7 (8.2%) |
| 75 Years and over | 3 (9.7%) | 2 (4.3%) |
Disability Class: Self-Care Difficulty
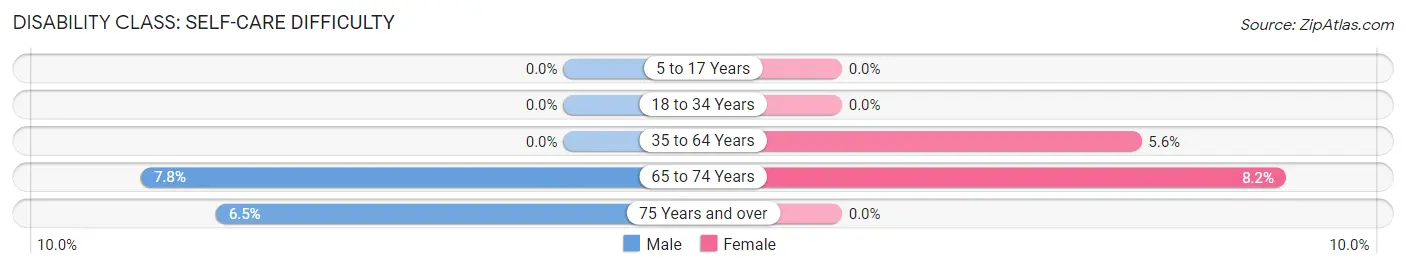
| Age Bracket | Male | Female |
| 5 to 17 Years | 0 (0.0%) | 0 (0.0%) |
| 18 to 34 Years | 0 (0.0%) | 0 (0.0%) |
| 35 to 64 Years | 0 (0.0%) | 12 (5.6%) |
| 65 to 74 Years | 4 (7.8%) | 7 (8.2%) |
| 75 Years and over | 2 (6.5%) | 0 (0.0%) |
Technology Access in Wanamingo
Computing Device Access in Wanamingo
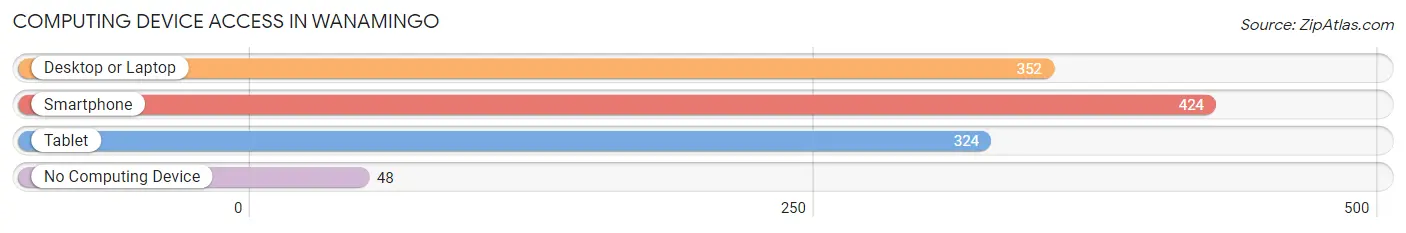
| Device Type | # Households | % Households |
| Desktop or Laptop | 352 | 71.4% |
| Smartphone | 424 | 86.0% |
| Tablet | 324 | 65.7% |
| No Computing Device | 48 | 9.7% |
| Total | 493 | 100.0% |
Internet Access in Wanamingo
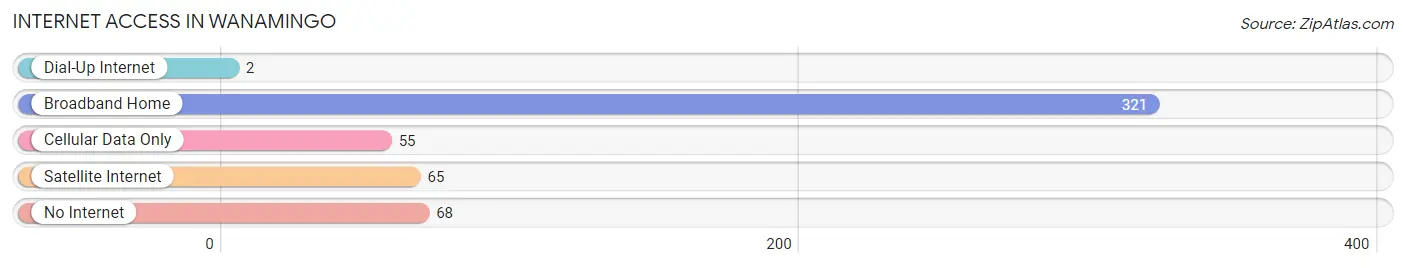
| Internet Type | # Households | % Households |
| Dial-Up Internet | 2 | 0.4% |
| Broadband Home | 321 | 65.1% |
| Cellular Data Only | 55 | 11.2% |
| Satellite Internet | 65 | 13.2% |
| No Internet | 68 | 13.8% |
| Total | 493 | 100.0% |
Wanamingo Summary
Nestled in the rolling hills of southeastern Minnesota, the small town of Wanamingo is a rural community with a population of just over 500 people. The town is located in Goodhue County, about 30 miles south of the Twin Cities of Minneapolis and St. Paul.
History
The area that is now Wanamingo was first settled in 1854 by a group of Swedish immigrants. The town was originally known as “Swedish Settlement” and was later renamed “Wanamingo” after the Dakota word for “place of peace”. The town was officially incorporated in 1887.
In the early days, Wanamingo was a farming community, with many of the residents working in the fields and tending to their livestock. The town also had a few small businesses, including a general store, a blacksmith shop, and a sawmill.
In the late 19th century, the railroad came to Wanamingo, bringing with it a new era of growth and prosperity. The railroad allowed the town to become a shipping hub for the surrounding area, and it also brought new businesses and industries to the area.
Geography
Wanamingo is located in southeastern Minnesota, about 30 miles south of the Twin Cities of Minneapolis and St. Paul. The town is situated in the rolling hills of Goodhue County, and is surrounded by farmland and small towns.
The Zumbro River runs through the town, and there are several small lakes and ponds in the area. The town is also home to a number of parks and recreational areas, including Wanamingo Park, which features a playground, picnic area, and walking trails.
Economy
The economy of Wanamingo is largely based on agriculture and small businesses. The town is home to several farms, which produce a variety of crops, including corn, soybeans, and hay. There are also several small businesses in the area, including a grocery store, a hardware store, and a few restaurants.
The town is also home to a number of manufacturing companies, including a plastics factory and a metal fabrication plant. The town is also home to a number of small service businesses, such as auto repair shops and hair salons.
Demographics
As of the 2010 census, the population of Wanamingo was 517 people. The town is predominantly white, with 92.3% of the population identifying as Caucasian. The town also has a small Hispanic population, with 4.3% of the population identifying as Hispanic or Latino.
The median household income in Wanamingo is $50,000, and the median home value is $150,000. The town has a low unemployment rate, with only 3.2% of the population unemployed.
Conclusion
Wanamingo is a small rural town in southeastern Minnesota with a population of just over 500 people. The town is largely agricultural, with many of the residents working in the fields and tending to their livestock. The town is also home to a number of small businesses and manufacturing companies. The town has a predominantly white population, with a small Hispanic population. The median household income in Wanamingo is $50,000, and the median home value is $150,000. The town has a low unemployment rate, with only 3.2% of the population unemployed.
Common Questions
What is Per Capita Income in Wanamingo?
Per Capita income in Wanamingo is $35,823.
What is the Median Family Income in Wanamingo?
Median Family Income in Wanamingo is $96,563.
What is the Median Household income in Wanamingo?
Median Household Income in Wanamingo is $78,375.
What is Income or Wage Gap in Wanamingo?
Income or Wage Gap in Wanamingo is 20.2%.
Women in Wanamingo earn 79.8 cents for every dollar earned by a man.
What is Inequality or Gini Index in Wanamingo?
Inequality or Gini Index in Wanamingo is 0.39.
What is the Total Population of Wanamingo?
Total Population of Wanamingo is 1,189.
What is the Total Male Population of Wanamingo?
Total Male Population of Wanamingo is 523.
What is the Total Female Population of Wanamingo?
Total Female Population of Wanamingo is 666.
What is the Ratio of Males per 100 Females in Wanamingo?
There are 78.53 Males per 100 Females in Wanamingo.
What is the Ratio of Females per 100 Males in Wanamingo?
There are 127.34 Females per 100 Males in Wanamingo.
What is the Median Population Age in Wanamingo?
Median Population Age in Wanamingo is 36.9 Years.
What is the Average Family Size in Wanamingo
Average Family Size in Wanamingo is 3.0 People.
What is the Average Household Size in Wanamingo
Average Household Size in Wanamingo is 2.4 People.
How Large is the Labor Force in Wanamingo?
There are 633 People in the Labor Forcein in Wanamingo.
What is the Percentage of People in the Labor Force in Wanamingo?
69.6% of People are in the Labor Force in Wanamingo.
What is the Unemployment Rate in Wanamingo?
Unemployment Rate in Wanamingo is 2.2%.