Medford, MN Map & Demographics
Medford Map
Medford Overview
$38,652
PER CAPITA INCOME
$111,364
AVG FAMILY INCOME
$98,036
AVG HOUSEHOLD INCOME
27.5%
WAGE / INCOME GAP [ % ]
72.5¢/ $1
WAGE / INCOME GAP [ $ ]
0.34
INEQUALITY / GINI INDEX
1,258
TOTAL POPULATION
655
MALE POPULATION
603
FEMALE POPULATION
108.62
MALES / 100 FEMALES
92.06
FEMALES / 100 MALES
31.4
MEDIAN AGE
3.3
AVG FAMILY SIZE
2.8
AVG HOUSEHOLD SIZE
709
LABOR FORCE [ PEOPLE ]
77.5%
PERCENT IN LABOR FORCE
4.8%
UNEMPLOYMENT RATE
Medford Zip Codes
Medford Area Codes
Income in Medford
Income Overview in Medford
Per Capita Income in Medford is $38,652, while median incomes of families and households are $111,364 and $98,036 respectively.
| Characteristic | Number | Measure |
| Per Capita Income | 1,258 | $38,652 |
| Median Family Income | 332 | $111,364 |
| Mean Family Income | 332 | $113,665 |
| Median Household Income | 440 | $98,036 |
| Mean Household Income | 440 | $105,345 |
| Income Deficit | 332 | $0 |
| Wage / Income Gap (%) | 1,258 | 27.46% |
| Wage / Income Gap ($) | 1,258 | 72.54¢ per $1 |
| Gini / Inequality Index | 1,258 | 0.34 |
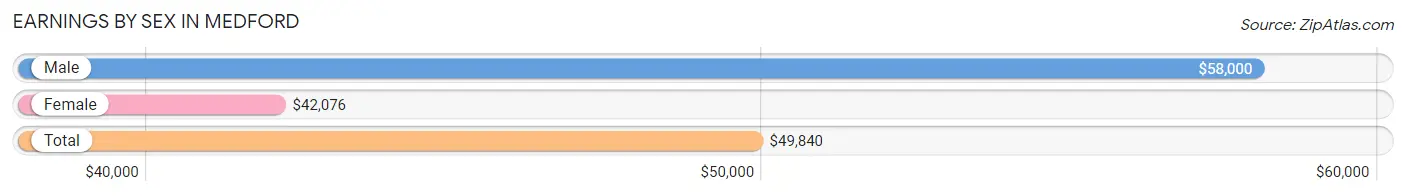
Earnings by Sex in Medford
Average Earnings in Medford are $49,840, $58,000 for men and $42,076 for women, a difference of 27.5%.
| Sex | Number | Average Earnings |
| Male | 374 (51.2%) | $58,000 |
| Female | 357 (48.8%) | $42,076 |
| Total | 731 (100.0%) | $49,840 |
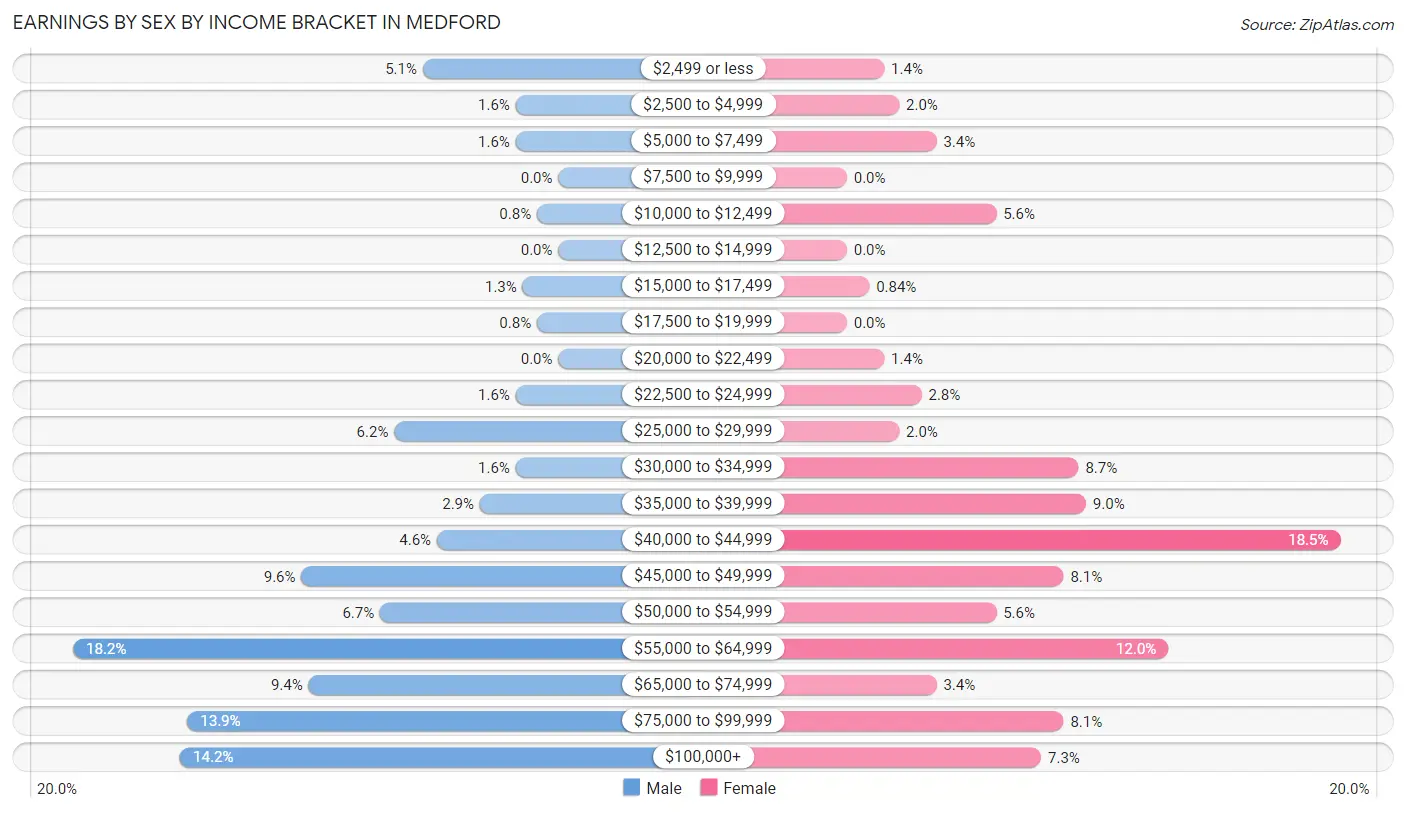
Earnings by Sex by Income Bracket in Medford
The most common earnings brackets in Medford are $55,000 to $64,999 for men (68 | 18.2%) and $40,000 to $44,999 for women (66 | 18.5%).
| Income | Male | Female |
| $2,499 or less | 19 (5.1%) | 5 (1.4%) |
| $2,500 to $4,999 | 6 (1.6%) | 7 (2.0%) |
| $5,000 to $7,499 | 6 (1.6%) | 12 (3.4%) |
| $7,500 to $9,999 | 0 (0.0%) | 0 (0.0%) |
| $10,000 to $12,499 | 3 (0.8%) | 20 (5.6%) |
| $12,500 to $14,999 | 0 (0.0%) | 0 (0.0%) |
| $15,000 to $17,499 | 5 (1.3%) | 3 (0.8%) |
| $17,500 to $19,999 | 3 (0.8%) | 0 (0.0%) |
| $20,000 to $22,499 | 0 (0.0%) | 5 (1.4%) |
| $22,500 to $24,999 | 6 (1.6%) | 10 (2.8%) |
| $25,000 to $29,999 | 23 (6.1%) | 7 (2.0%) |
| $30,000 to $34,999 | 6 (1.6%) | 31 (8.7%) |
| $35,000 to $39,999 | 11 (2.9%) | 32 (9.0%) |
| $40,000 to $44,999 | 17 (4.5%) | 66 (18.5%) |
| $45,000 to $49,999 | 36 (9.6%) | 29 (8.1%) |
| $50,000 to $54,999 | 25 (6.7%) | 20 (5.6%) |
| $55,000 to $64,999 | 68 (18.2%) | 43 (12.0%) |
| $65,000 to $74,999 | 35 (9.4%) | 12 (3.4%) |
| $75,000 to $99,999 | 52 (13.9%) | 29 (8.1%) |
| $100,000+ | 53 (14.2%) | 26 (7.3%) |
| Total | 374 (100.0%) | 357 (100.0%) |
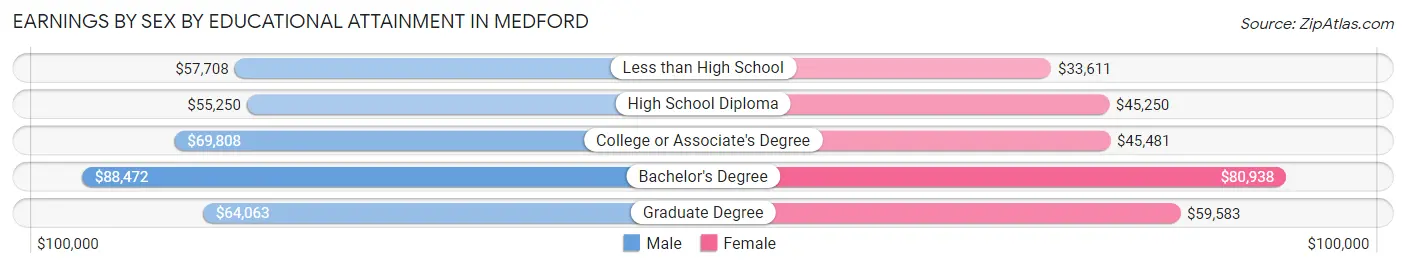
Earnings by Sex by Educational Attainment in Medford
Average earnings in Medford are $59,667 for men and $46,875 for women, a difference of 21.4%. Men with an educational attainment of bachelor's degree enjoy the highest average annual earnings of $88,472, while those with high school diploma education earn the least with $55,250. Women with an educational attainment of bachelor's degree earn the most with the average annual earnings of $80,938, while those with less than high school education have the smallest earnings of $33,611.
| Educational Attainment | Male Income | Female Income |
| Less than High School | $57,708 | $33,611 |
| High School Diploma | $55,250 | $45,250 |
| College or Associate's Degree | $69,808 | $45,481 |
| Bachelor's Degree | $88,472 | $80,938 |
| Graduate Degree | $64,063 | $59,583 |
| Total | $59,667 | $46,875 |
Family Income in Medford
Family Income Brackets in Medford
According to the Medford family income data, there are 119 families falling into the $100,000 to $149,999 income range, which is the most common income bracket and makes up 35.8% of all families.
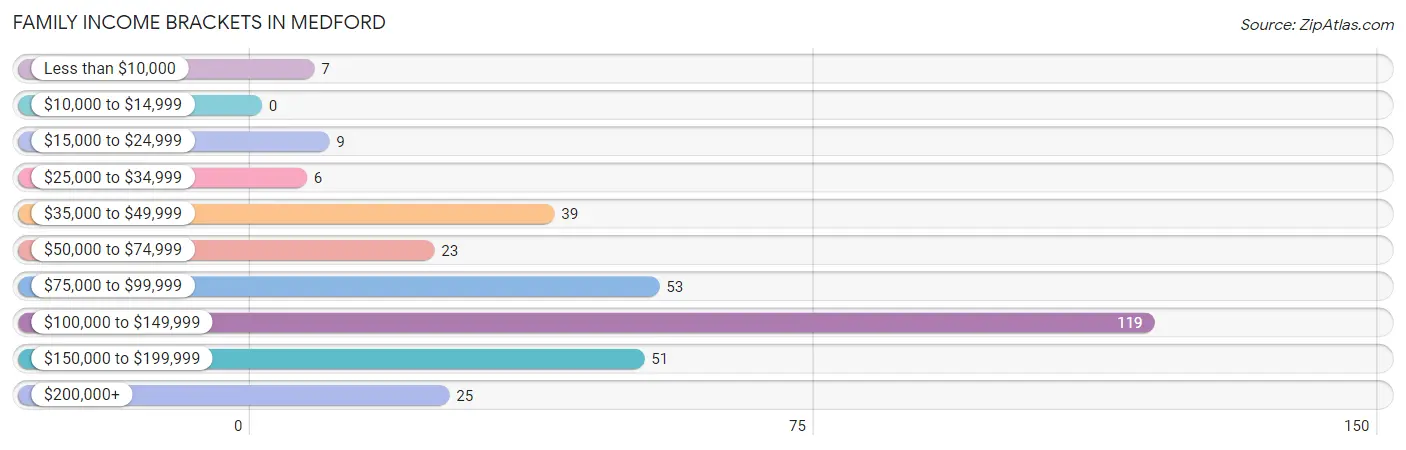
| Income Bracket | # Families | % Families |
| Less than $10,000 | 7 | 2.1% |
| $10,000 to $14,999 | 0 | 0.0% |
| $15,000 to $24,999 | 9 | 2.7% |
| $25,000 to $34,999 | 6 | 1.8% |
| $35,000 to $49,999 | 39 | 11.7% |
| $50,000 to $74,999 | 23 | 6.9% |
| $75,000 to $99,999 | 53 | 16.0% |
| $100,000 to $149,999 | 119 | 35.8% |
| $150,000 to $199,999 | 51 | 15.4% |
| $200,000+ | 25 | 7.5% |
Family Income by Famaliy Size in Medford
6-person families (20 | 6.0%) account for the highest median family income in Medford with $157,917 per family, while 2-person families (141 | 42.5%) have the highest median income of $44,514 per family member.
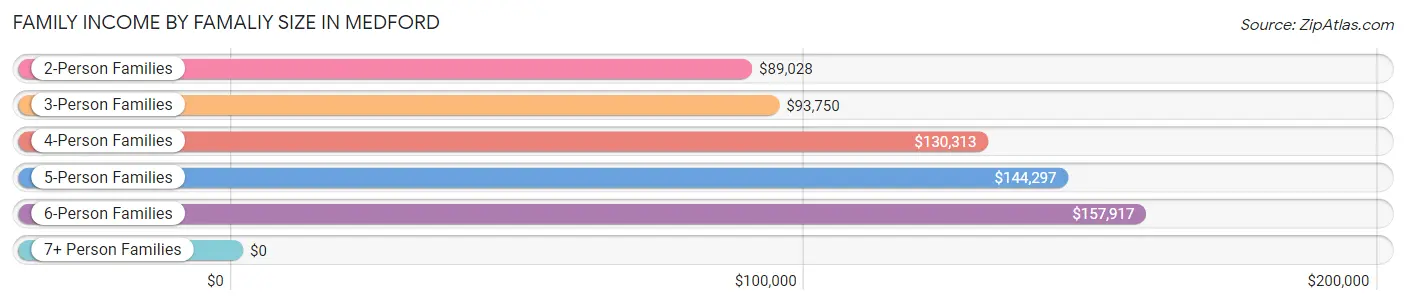
| Income Bracket | # Families | Median Income |
| 2-Person Families | 141 (42.5%) | $89,028 |
| 3-Person Families | 67 (20.2%) | $93,750 |
| 4-Person Families | 67 (20.2%) | $130,313 |
| 5-Person Families | 37 (11.1%) | $144,297 |
| 6-Person Families | 20 (6.0%) | $157,917 |
| 7+ Person Families | 0 (0.0%) | $0 |
| Total | 332 (100.0%) | $111,364 |
Family Income by Number of Earners in Medford
The median family income in Medford is $111,364, with families comprising 3+ earners (49) having the highest median family income of $143,828, while families with 1 earner (71) have the lowest median family income of $48,906, accounting for 14.8% and 21.4% of families, respectively.
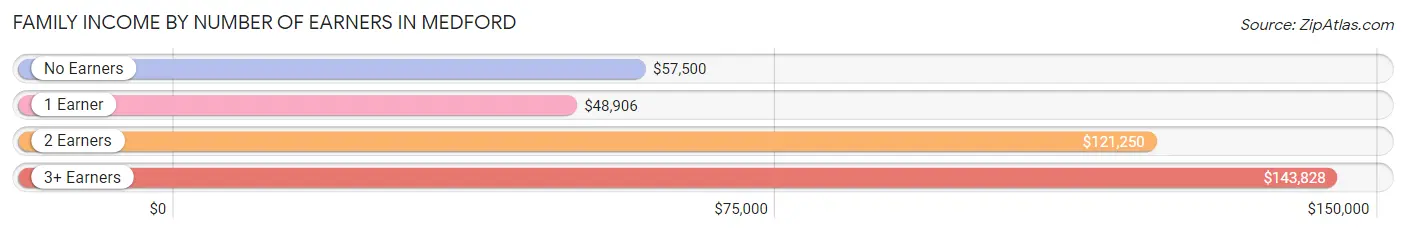
| Number of Earners | # Families | Median Income |
| No Earners | 24 (7.2%) | $57,500 |
| 1 Earner | 71 (21.4%) | $48,906 |
| 2 Earners | 188 (56.6%) | $121,250 |
| 3+ Earners | 49 (14.8%) | $143,828 |
| Total | 332 (100.0%) | $111,364 |
Household Income in Medford
Household Income Brackets in Medford
With 125 households falling in the category, the $100,000 to $149,999 income range is the most frequent in Medford, accounting for 28.4% of all households. In contrast, only 5 households (1.1%) fall into the $15,000 to $24,999 income bracket, making it the least populous group.
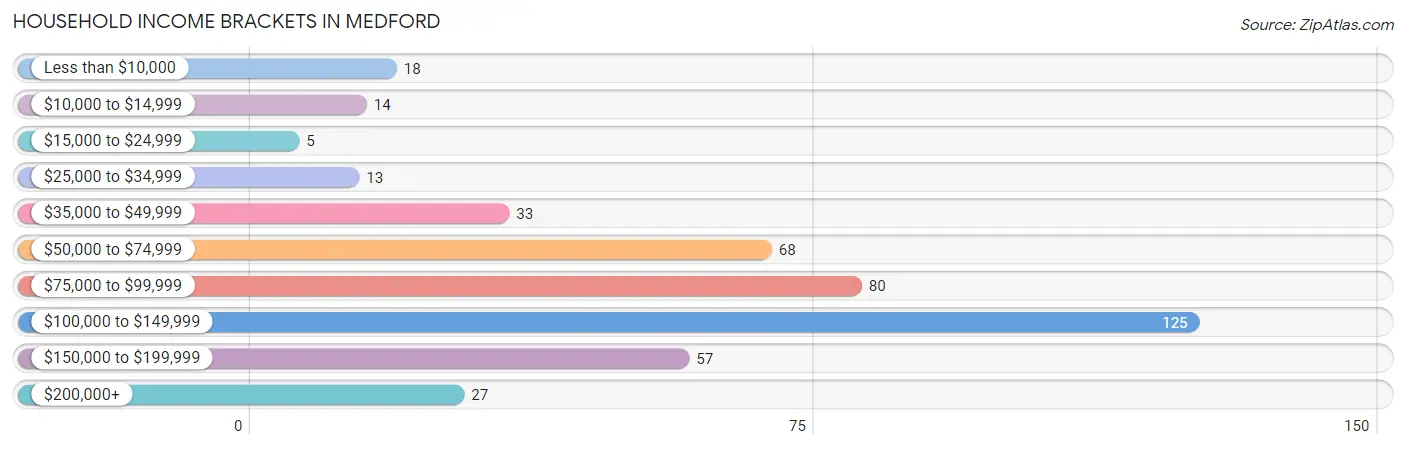
| Income Bracket | # Households | % Households |
| Less than $10,000 | 18 | 4.1% |
| $10,000 to $14,999 | 14 | 3.2% |
| $15,000 to $24,999 | 5 | 1.1% |
| $25,000 to $34,999 | 13 | 3.0% |
| $35,000 to $49,999 | 33 | 7.5% |
| $50,000 to $74,999 | 68 | 15.5% |
| $75,000 to $99,999 | 80 | 18.2% |
| $100,000 to $149,999 | 125 | 28.4% |
| $150,000 to $199,999 | 57 | 13.0% |
| $200,000+ | 27 | 6.1% |
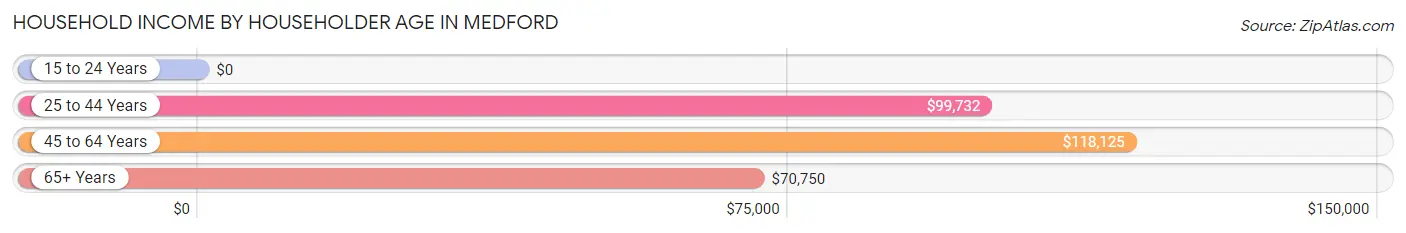
Household Income by Householder Age in Medford
The median household income in Medford is $98,036, with the highest median household income of $118,125 found in the 45 to 64 years age bracket for the primary householder. A total of 174 households (39.6%) fall into this category.
| Income Bracket | # Households | Median Income |
| 15 to 24 Years | 0 (0.0%) | $0 |
| 25 to 44 Years | 191 (43.4%) | $99,732 |
| 45 to 64 Years | 174 (39.6%) | $118,125 |
| 65+ Years | 75 (17.1%) | $70,750 |
| Total | 440 (100.0%) | $98,036 |
Poverty in Medford
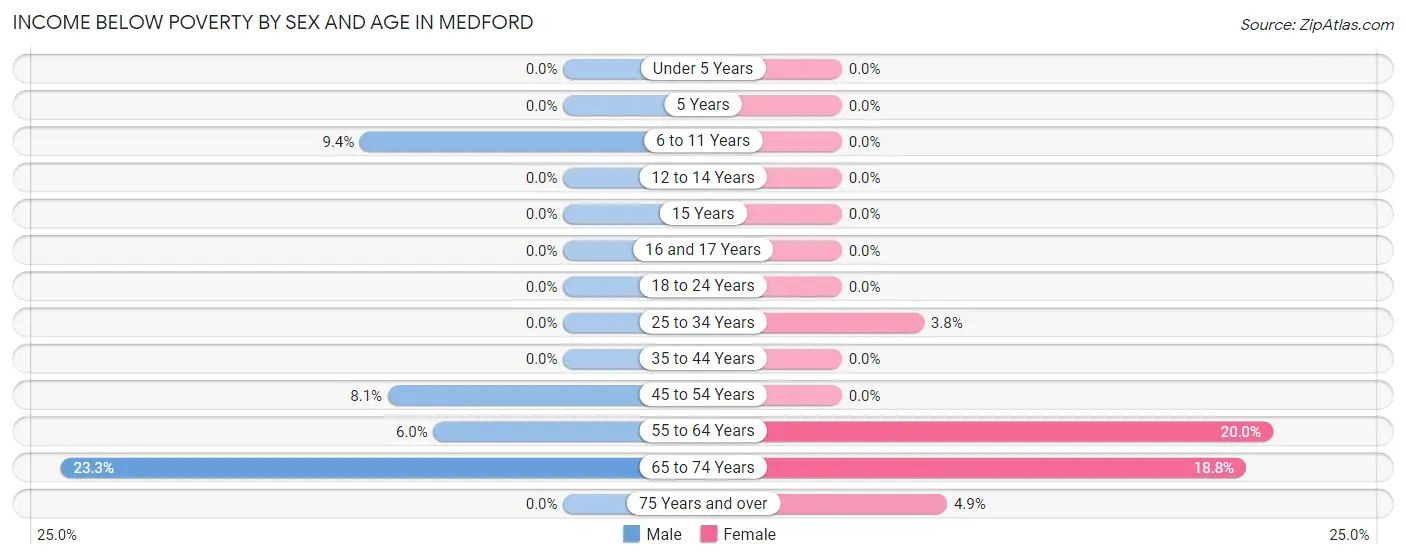
Income Below Poverty by Sex and Age in Medford
With 3.7% poverty level for males and 3.5% for females among the residents of Medford, 65 to 74 year old males and 55 to 64 year old females are the most vulnerable to poverty, with 7 males (23.3%) and 12 females (20.0%) in their respective age groups living below the poverty level.
| Age Bracket | Male | Female |
| Under 5 Years | 0 (0.0%) | 0 (0.0%) |
| 5 Years | 0 (0.0%) | 0 (0.0%) |
| 6 to 11 Years | 5 (9.4%) | 0 (0.0%) |
| 12 to 14 Years | 0 (0.0%) | 0 (0.0%) |
| 15 Years | 0 (0.0%) | 0 (0.0%) |
| 16 and 17 Years | 0 (0.0%) | 0 (0.0%) |
| 18 to 24 Years | 0 (0.0%) | 0 (0.0%) |
| 25 to 34 Years | 0 (0.0%) | 4 (3.8%) |
| 35 to 44 Years | 0 (0.0%) | 0 (0.0%) |
| 45 to 54 Years | 7 (8.1%) | 0 (0.0%) |
| 55 to 64 Years | 5 (6.0%) | 12 (20.0%) |
| 65 to 74 Years | 7 (23.3%) | 3 (18.8%) |
| 75 Years and over | 0 (0.0%) | 2 (4.9%) |
| Total | 24 (3.7%) | 21 (3.5%) |
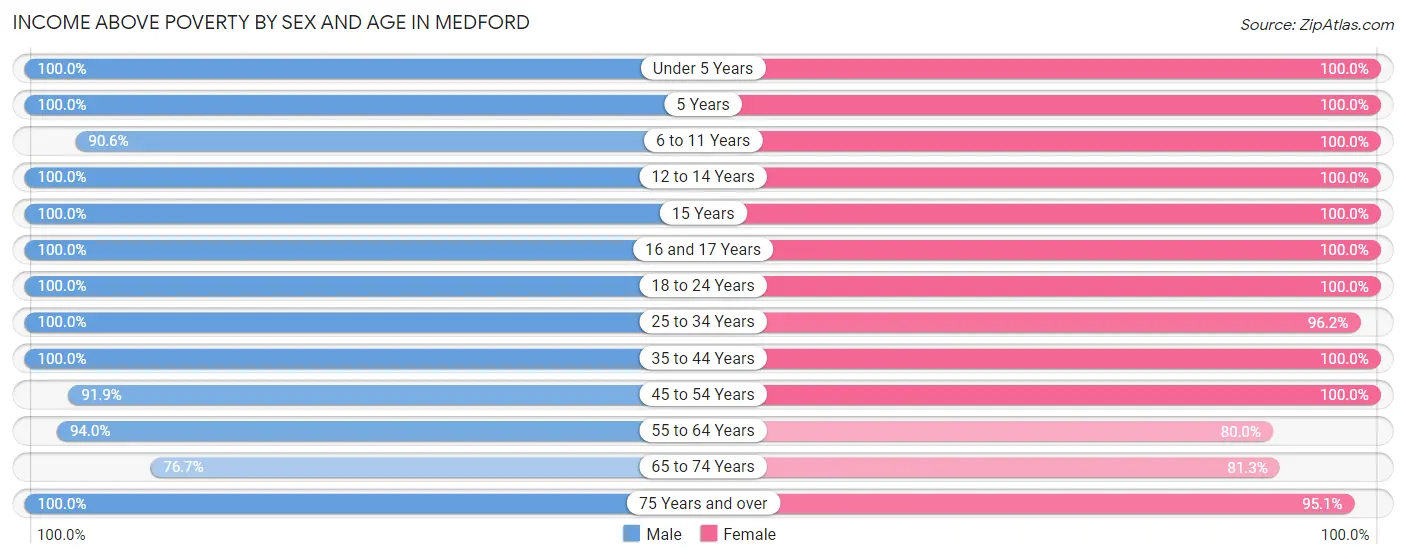
Income Above Poverty by Sex and Age in Medford
According to the poverty statistics in Medford, males aged under 5 years and females aged under 5 years are the age groups that are most secure financially, with 100.0% of males and 100.0% of females in these age groups living above the poverty line.
| Age Bracket | Male | Female |
| Under 5 Years | 72 (100.0%) | 52 (100.0%) |
| 5 Years | 17 (100.0%) | 8 (100.0%) |
| 6 to 11 Years | 48 (90.6%) | 49 (100.0%) |
| 12 to 14 Years | 29 (100.0%) | 38 (100.0%) |
| 15 Years | 18 (100.0%) | 7 (100.0%) |
| 16 and 17 Years | 23 (100.0%) | 10 (100.0%) |
| 18 to 24 Years | 41 (100.0%) | 74 (100.0%) |
| 25 to 34 Years | 83 (100.0%) | 101 (96.2%) |
| 35 to 44 Years | 89 (100.0%) | 81 (100.0%) |
| 45 to 54 Years | 79 (91.9%) | 59 (100.0%) |
| 55 to 64 Years | 78 (94.0%) | 48 (80.0%) |
| 65 to 74 Years | 23 (76.7%) | 13 (81.2%) |
| 75 Years and over | 30 (100.0%) | 39 (95.1%) |
| Total | 630 (96.3%) | 579 (96.5%) |
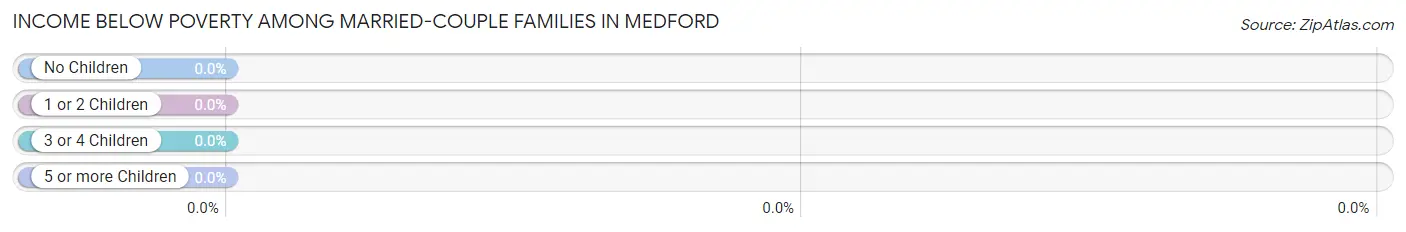
Income Below Poverty Among Married-Couple Families in Medford
| Children | Above Poverty | Below Poverty |
| No Children | 104 (100.0%) | 0 (0.0%) |
| 1 or 2 Children | 99 (100.0%) | 0 (0.0%) |
| 3 or 4 Children | 46 (100.0%) | 0 (0.0%) |
| 5 or more Children | 0 (0.0%) | 0 (0.0%) |
| Total | 249 (100.0%) | 0 (0.0%) |
Income Below Poverty Among Single-Parent Households in Medford
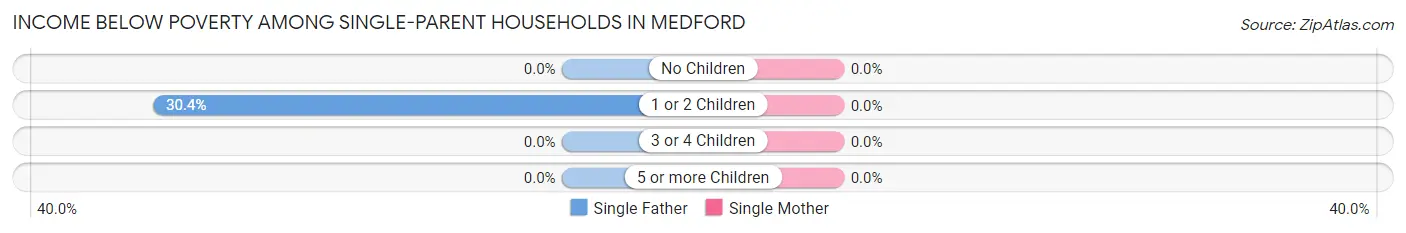
| Children | Single Father | Single Mother |
| No Children | 0 (0.0%) | 0 (0.0%) |
| 1 or 2 Children | 7 (30.4%) | 0 (0.0%) |
| 3 or 4 Children | 0 (0.0%) | 0 (0.0%) |
| 5 or more Children | 0 (0.0%) | 0 (0.0%) |
| Total | 7 (16.3%) | 0 (0.0%) |
Income Below Poverty Among Married-Couple vs Single-Parent Households in Medford
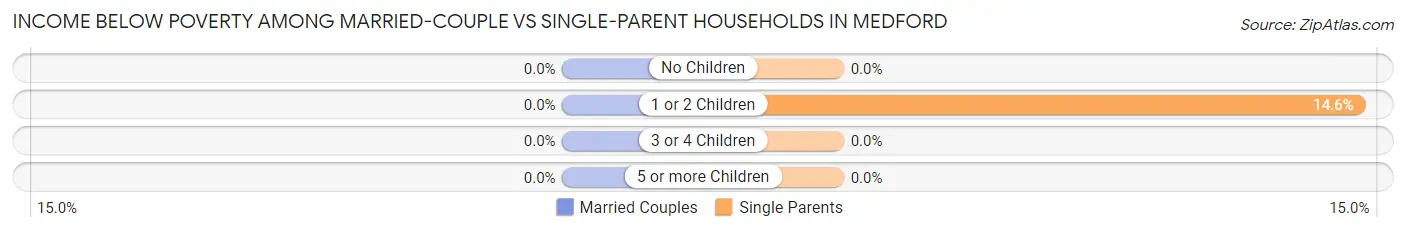
| Children | Married-Couple Families | Single-Parent Households |
| No Children | 0 (0.0%) | 0 (0.0%) |
| 1 or 2 Children | 0 (0.0%) | 7 (14.6%) |
| 3 or 4 Children | 0 (0.0%) | 0 (0.0%) |
| 5 or more Children | 0 (0.0%) | 0 (0.0%) |
| Total | 0 (0.0%) | 7 (8.4%) |
Race in Medford
The most populous races in Medford are White / Caucasian (1,138 | 90.5%), Hispanic or Latino (183 | 14.5%), and Some other Race (56 | 4.4%).
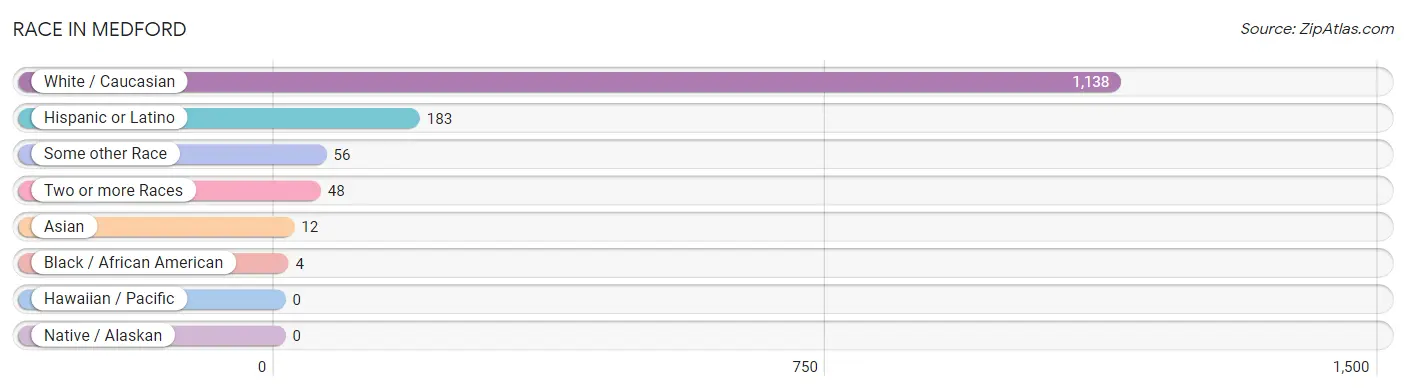
| Race | # Population | % Population |
| Asian | 12 | 0.9% |
| Black / African American | 4 | 0.3% |
| Hawaiian / Pacific | 0 | 0.0% |
| Hispanic or Latino | 183 | 14.5% |
| Native / Alaskan | 0 | 0.0% |
| White / Caucasian | 1,138 | 90.5% |
| Two or more Races | 48 | 3.8% |
| Some other Race | 56 | 4.4% |
| Total | 1,258 | 100.0% |
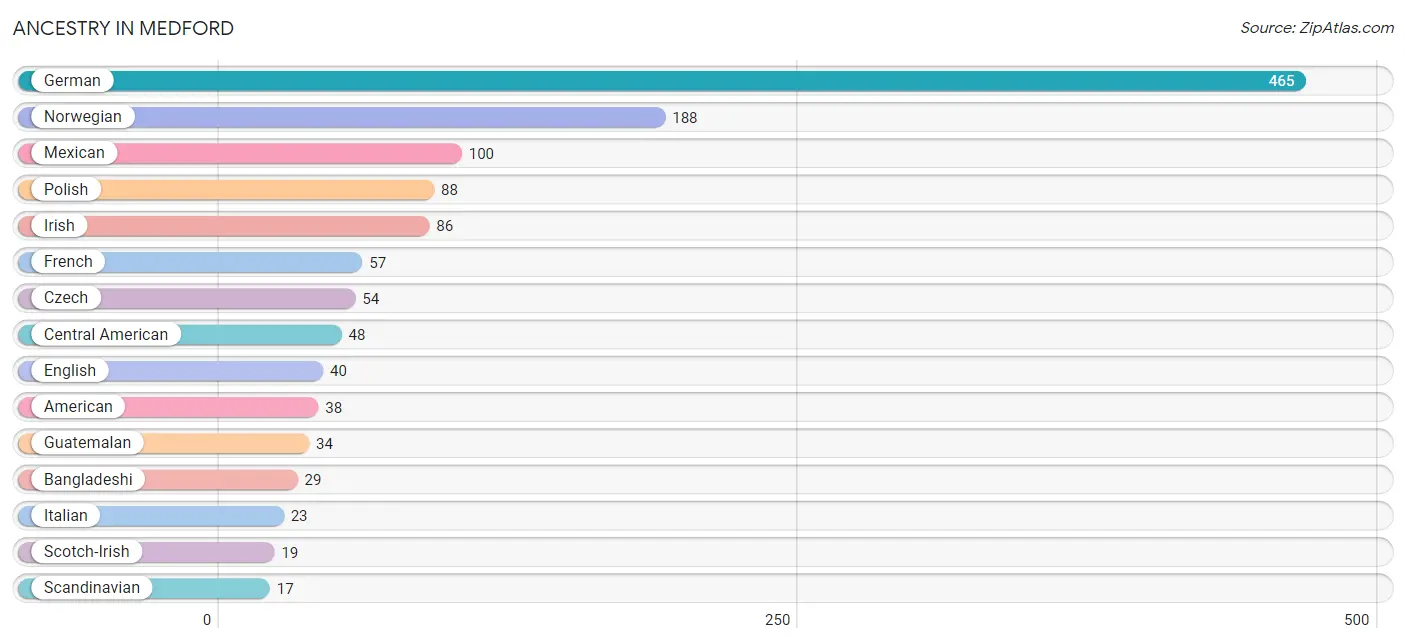
Ancestry in Medford
The most populous ancestries reported in Medford are German (465 | 37.0%), Norwegian (188 | 14.9%), Mexican (100 | 8.0%), Polish (88 | 7.0%), and Irish (86 | 6.8%), together accounting for 73.7% of all Medford residents.
| Ancestry | # Population | % Population |
| American | 38 | 3.0% |
| Bangladeshi | 29 | 2.3% |
| Burmese | 8 | 0.6% |
| Central American | 48 | 3.8% |
| Costa Rican | 14 | 1.1% |
| Czech | 54 | 4.3% |
| Czechoslovakian | 3 | 0.2% |
| Danish | 6 | 0.5% |
| Dutch | 11 | 0.9% |
| Eastern European | 3 | 0.2% |
| English | 40 | 3.2% |
| European | 14 | 1.1% |
| Finnish | 4 | 0.3% |
| French | 57 | 4.5% |
| French Canadian | 6 | 0.5% |
| German | 465 | 37.0% |
| Guatemalan | 34 | 2.7% |
| Irish | 86 | 6.8% |
| Italian | 23 | 1.8% |
| Korean | 14 | 1.1% |
| Luxembourger | 3 | 0.2% |
| Mexican | 100 | 8.0% |
| Norwegian | 188 | 14.9% |
| Polish | 88 | 7.0% |
| Puerto Rican | 13 | 1.0% |
| Russian | 2 | 0.2% |
| Scandinavian | 17 | 1.3% |
| Scotch-Irish | 19 | 1.5% |
| Scottish | 13 | 1.0% |
| Subsaharan African | 1 | 0.1% |
| Sudanese | 1 | 0.1% |
| Swedish | 9 | 0.7% |
| Swiss | 5 | 0.4% |
| Thai | 4 | 0.3% |
| Welsh | 13 | 1.0% | View All 35 Rows |
Immigrants in Medford
The most numerous immigrant groups reported in Medford came from Asia (35 | 2.8%), Central America (32 | 2.5%), Latin America (32 | 2.5%), South Eastern Asia (25 | 2.0%), and Mexico (18 | 1.4%), together accounting for 11.3% of all Medford residents.
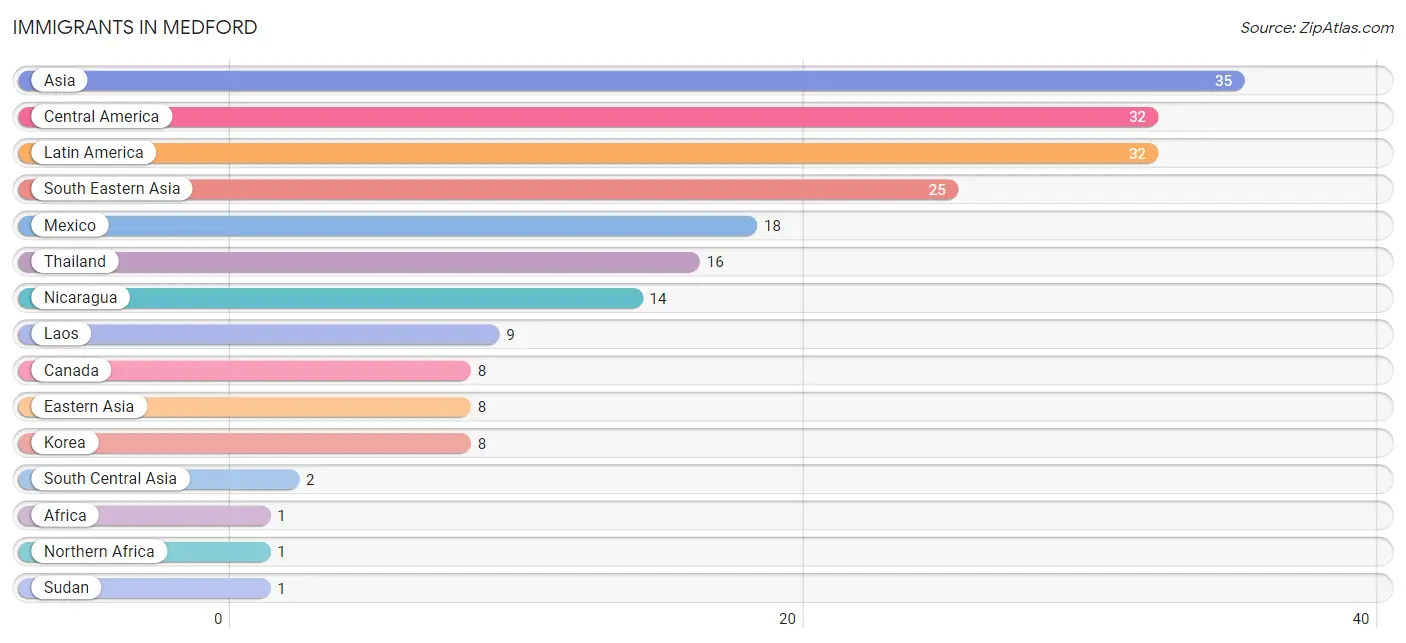
| Immigration Origin | # Population | % Population |
| Africa | 1 | 0.1% |
| Asia | 35 | 2.8% |
| Canada | 8 | 0.6% |
| Central America | 32 | 2.5% |
| Eastern Asia | 8 | 0.6% |
| Korea | 8 | 0.6% |
| Laos | 9 | 0.7% |
| Latin America | 32 | 2.5% |
| Mexico | 18 | 1.4% |
| Nicaragua | 14 | 1.1% |
| Northern Africa | 1 | 0.1% |
| South Central Asia | 2 | 0.2% |
| South Eastern Asia | 25 | 2.0% |
| Sudan | 1 | 0.1% |
| Thailand | 16 | 1.3% | View All 15 Rows |
Sex and Age in Medford
Sex and Age in Medford
The most populous age groups in Medford are Under 5 Years (72 | 11.0%) for men and 25 to 29 Years (74 | 12.3%) for women.
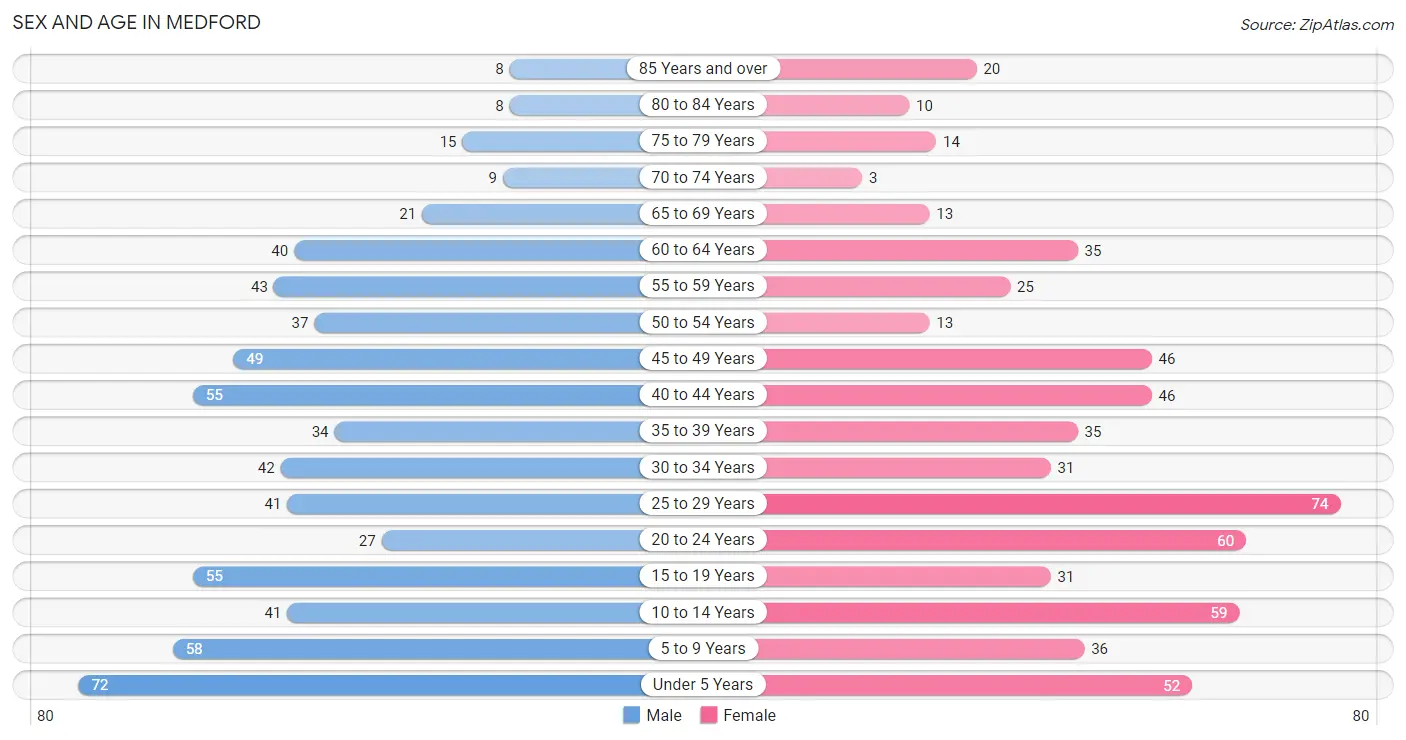
| Age Bracket | Male | Female |
| Under 5 Years | 72 (11.0%) | 52 (8.6%) |
| 5 to 9 Years | 58 (8.8%) | 36 (6.0%) |
| 10 to 14 Years | 41 (6.3%) | 59 (9.8%) |
| 15 to 19 Years | 55 (8.4%) | 31 (5.1%) |
| 20 to 24 Years | 27 (4.1%) | 60 (10.0%) |
| 25 to 29 Years | 41 (6.3%) | 74 (12.3%) |
| 30 to 34 Years | 42 (6.4%) | 31 (5.1%) |
| 35 to 39 Years | 34 (5.2%) | 35 (5.8%) |
| 40 to 44 Years | 55 (8.4%) | 46 (7.6%) |
| 45 to 49 Years | 49 (7.5%) | 46 (7.6%) |
| 50 to 54 Years | 37 (5.7%) | 13 (2.2%) |
| 55 to 59 Years | 43 (6.6%) | 25 (4.2%) |
| 60 to 64 Years | 40 (6.1%) | 35 (5.8%) |
| 65 to 69 Years | 21 (3.2%) | 13 (2.2%) |
| 70 to 74 Years | 9 (1.4%) | 3 (0.5%) |
| 75 to 79 Years | 15 (2.3%) | 14 (2.3%) |
| 80 to 84 Years | 8 (1.2%) | 10 (1.7%) |
| 85 Years and over | 8 (1.2%) | 20 (3.3%) |
| Total | 655 (100.0%) | 603 (100.0%) |
Families and Households in Medford
Median Family Size in Medford
The median family size in Medford is 3.32 persons per family, with single male/father families (43 | 13.0%) accounting for the largest median family size of 3.63 persons per family. On the other hand, single female/mother families (40 | 12.0%) represent the smallest median family size with 2.73 persons per family.
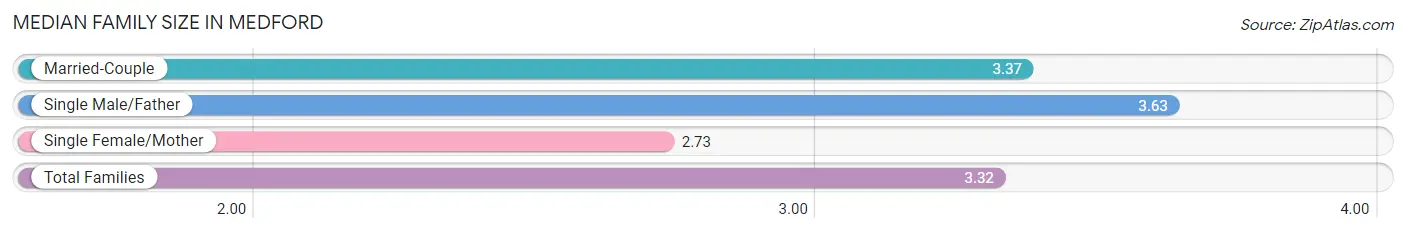
| Family Type | # Families | Family Size |
| Married-Couple | 249 (75.0%) | 3.37 |
| Single Male/Father | 43 (13.0%) | 3.63 |
| Single Female/Mother | 40 (12.0%) | 2.73 |
| Total Families | 332 (100.0%) | 3.32 |
Median Household Size in Medford
The median household size in Medford is 2.83 persons per household, with single male/father households (43 | 9.8%) accounting for the largest median household size of 3.77 persons per household. non-family households (108 | 24.5%) represent the smallest median household size with 1.03 persons per household.
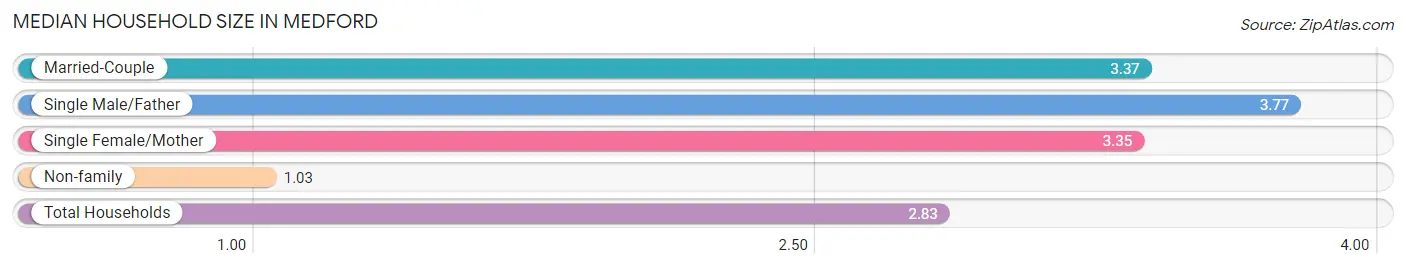
| Household Type | # Households | Household Size |
| Married-Couple | 249 (56.6%) | 3.37 |
| Single Male/Father | 43 (9.8%) | 3.77 |
| Single Female/Mother | 40 (9.1%) | 3.35 |
| Non-family | 108 (24.5%) | 1.03 |
| Total Households | 440 (100.0%) | 2.83 |
Household Size by Marriage Status in Medford
Out of a total of 440 households in Medford, 332 (75.4%) are family households, while 108 (24.5%) are nonfamily households. The most numerous type of family households are 2-person households, comprising 129, and the most common type of nonfamily households are 1-person households, comprising 106.
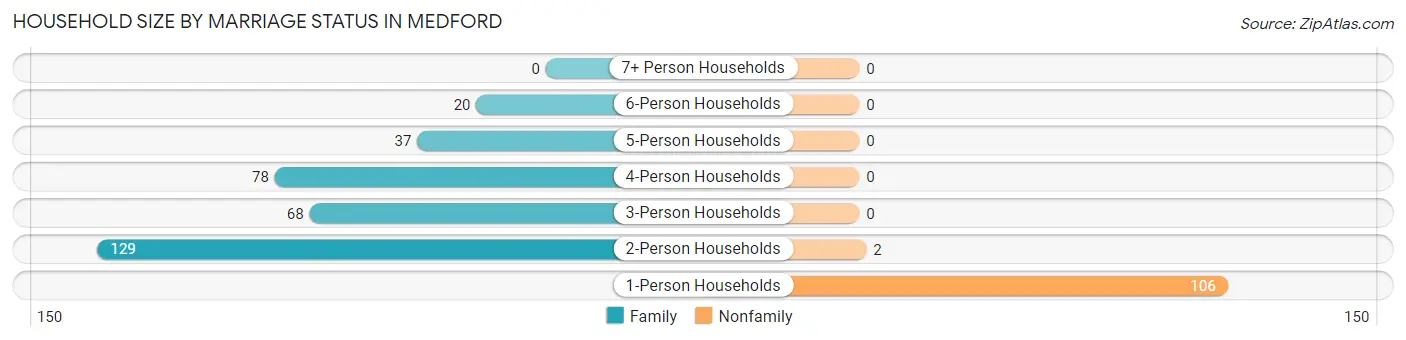
| Household Size | Family Households | Nonfamily Households |
| 1-Person Households | - | 106 (24.1%) |
| 2-Person Households | 129 (29.3%) | 2 (0.4%) |
| 3-Person Households | 68 (15.4%) | 0 (0.0%) |
| 4-Person Households | 78 (17.7%) | 0 (0.0%) |
| 5-Person Households | 37 (8.4%) | 0 (0.0%) |
| 6-Person Households | 20 (4.5%) | 0 (0.0%) |
| 7+ Person Households | 0 (0.0%) | 0 (0.0%) |
| Total | 332 (75.4%) | 108 (24.5%) |
Female Fertility in Medford
Fertility by Age in Medford
Average fertility rate in Medford is 58.0 births per 1,000 women. Women in the age bracket of 20 to 34 years have the highest fertility rate with 97.0 births per 1,000 women. Women in the age bracket of 20 to 34 years acount for 84.2% of all women with births.
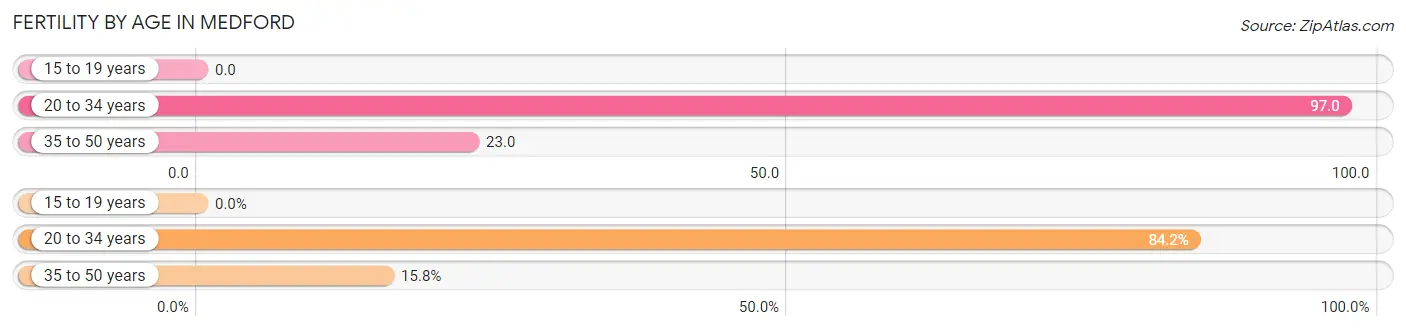
| Age Bracket | Women with Births | Births / 1,000 Women |
| 15 to 19 years | 0 (0.0%) | 0.0 |
| 20 to 34 years | 16 (84.2%) | 97.0 |
| 35 to 50 years | 3 (15.8%) | 23.0 |
| Total | 19 (100.0%) | 58.0 |
Fertility by Age by Marriage Status in Medford
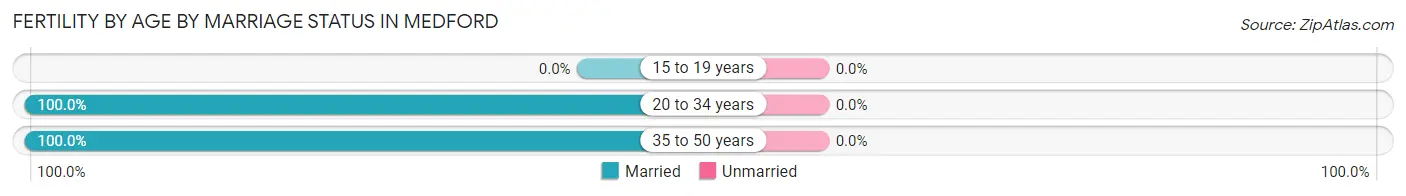
| Age Bracket | Married | Unmarried |
| 15 to 19 years | 0 (0.0%) | 0 (0.0%) |
| 20 to 34 years | 16 (100.0%) | 0 (0.0%) |
| 35 to 50 years | 3 (100.0%) | 0 (0.0%) |
| Total | 19 (100.0%) | 0 (0.0%) |
Fertility by Education in Medford
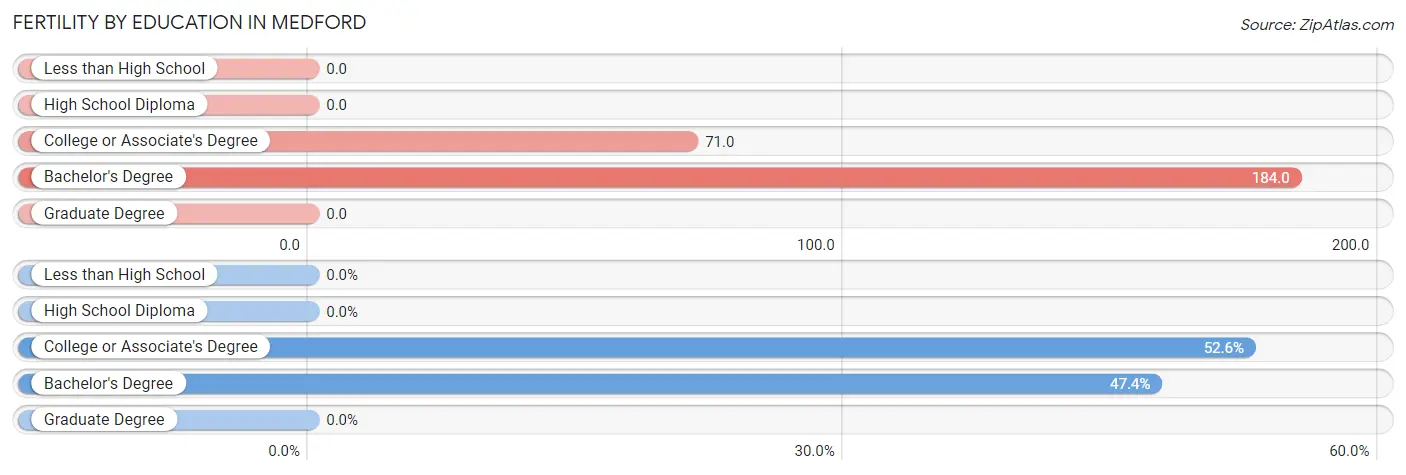
| Educational Attainment | Women with Births | Births / 1,000 Women |
| Less than High School | 0 (0.0%) | 0.0 |
| High School Diploma | 0 (0.0%) | 0.0 |
| College or Associate's Degree | 10 (52.6%) | 71.0 |
| Bachelor's Degree | 9 (47.4%) | 184.0 |
| Graduate Degree | 0 (0.0%) | 0.0 |
| Total | 19 (100.0%) | 58.0 |
Fertility by Education by Marriage Status in Medford
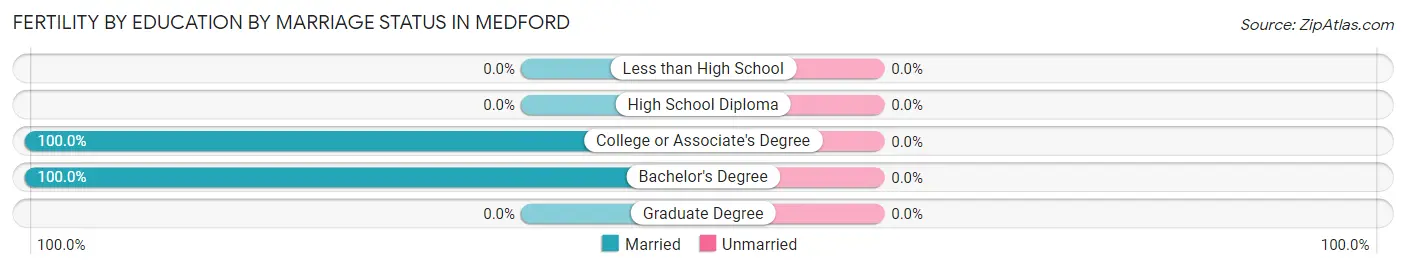
| Educational Attainment | Married | Unmarried |
| Less than High School | 0 (0.0%) | 0 (0.0%) |
| High School Diploma | 0 (0.0%) | 0 (0.0%) |
| College or Associate's Degree | 10 (100.0%) | 0 (0.0%) |
| Bachelor's Degree | 9 (100.0%) | 0 (0.0%) |
| Graduate Degree | 0 (0.0%) | 0 (0.0%) |
| Total | 19 (100.0%) | 0 (0.0%) |
Employment Characteristics in Medford
Employment by Class of Employer in Medford
Among the 662 employed individuals in Medford, private company employees (510 | 77.0%), local government employees (65 | 9.8%), and not-for-profit organizations (41 | 6.2%) make up the most common classes of employment.
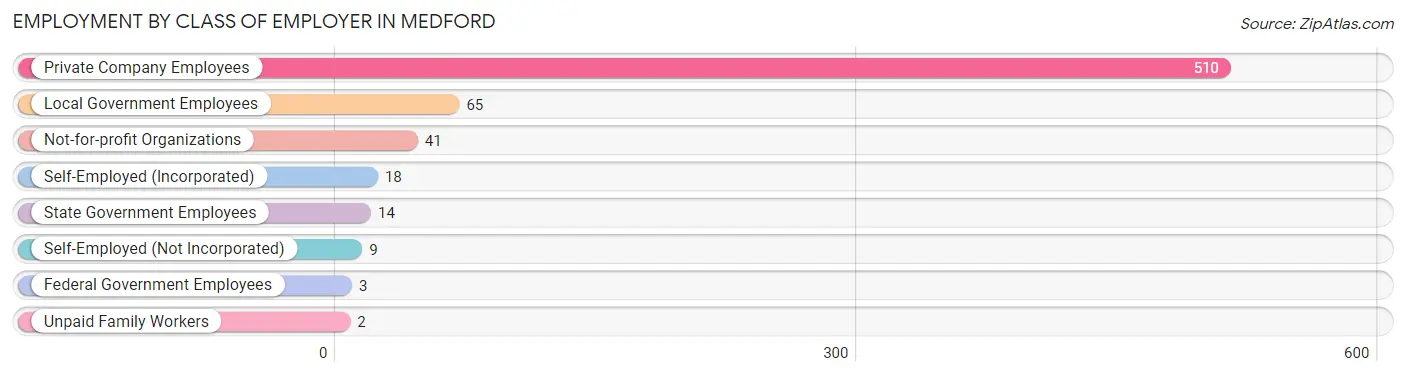
| Employer Class | # Employees | % Employees |
| Private Company Employees | 510 | 77.0% |
| Self-Employed (Incorporated) | 18 | 2.7% |
| Self-Employed (Not Incorporated) | 9 | 1.4% |
| Not-for-profit Organizations | 41 | 6.2% |
| Local Government Employees | 65 | 9.8% |
| State Government Employees | 14 | 2.1% |
| Federal Government Employees | 3 | 0.4% |
| Unpaid Family Workers | 2 | 0.3% |
| Total | 662 | 100.0% |
Employment Status by Age in Medford
According to the labor force statistics for Medford, out of the total population over 16 years of age (915), 77.5% or 709 individuals are in the labor force, with 4.8% or 34 of them unemployed. The age group with the highest labor force participation rate is 45 to 54 years, with 97.9% or 142 individuals in the labor force. Within the labor force, the 16 to 19 years age range has the highest percentage of unemployed individuals, with 19.4% or 7 of them being unemployed.
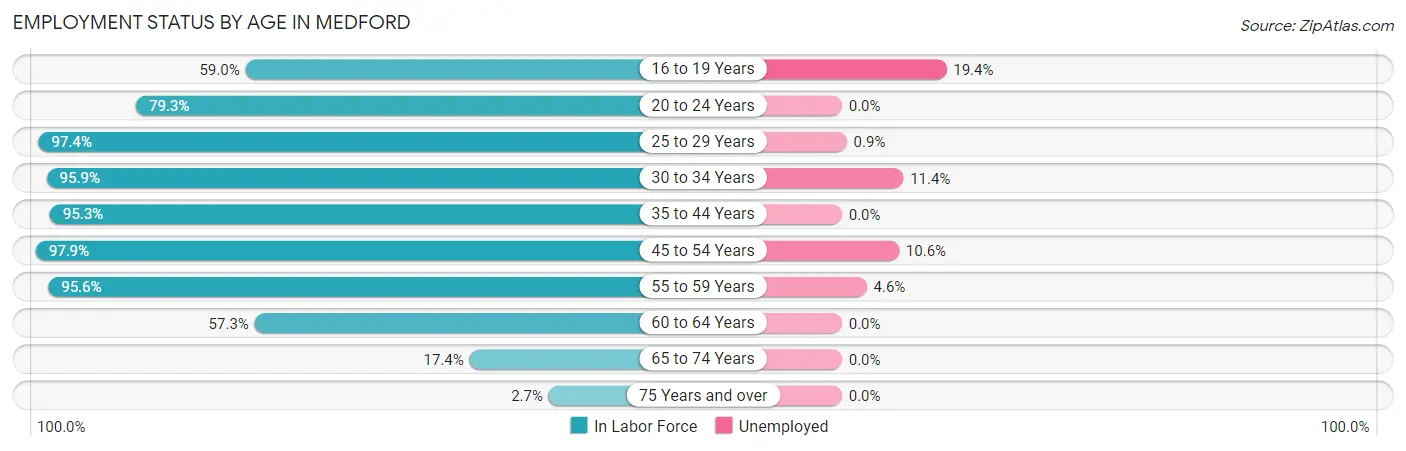
| Age Bracket | In Labor Force | Unemployed |
| 16 to 19 Years | 36 (59.0%) | 7 (19.4%) |
| 20 to 24 Years | 69 (79.3%) | 0 (0.0%) |
| 25 to 29 Years | 112 (97.4%) | 1 (0.9%) |
| 30 to 34 Years | 70 (95.9%) | 8 (11.4%) |
| 35 to 44 Years | 162 (95.3%) | 0 (0.0%) |
| 45 to 54 Years | 142 (97.9%) | 15 (10.6%) |
| 55 to 59 Years | 65 (95.6%) | 3 (4.6%) |
| 60 to 64 Years | 43 (57.3%) | 0 (0.0%) |
| 65 to 74 Years | 8 (17.4%) | 0 (0.0%) |
| 75 Years and over | 2 (2.7%) | 0 (0.0%) |
| Total | 709 (77.5%) | 34 (4.8%) |
Employment Status by Educational Attainment in Medford
According to labor force statistics for Medford, 92.0% of individuals (594) out of the total population between 25 and 64 years of age (646) are in the labor force, with 4.5% or 27 of them being unemployed. The group with the highest labor force participation rate are those with the educational attainment of bachelor's degree or higher, with 96.9% or 158 individuals in the labor force. Within the labor force, individuals with less than high school education have the highest percentage of unemployment, with 15.4% or 8 of them being unemployed.
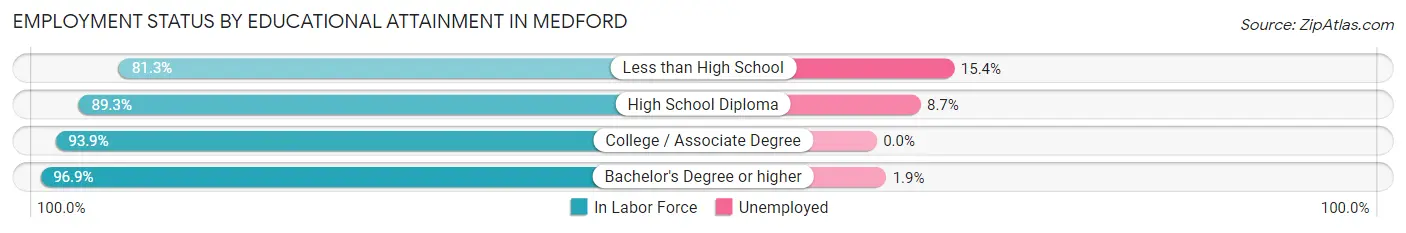
| Educational Attainment | In Labor Force | Unemployed |
| Less than High School | 52 (81.3%) | 10 (15.4%) |
| High School Diploma | 184 (89.3%) | 18 (8.7%) |
| College / Associate Degree | 200 (93.9%) | 0 (0.0%) |
| Bachelor's Degree or higher | 158 (96.9%) | 3 (1.9%) |
| Total | 594 (92.0%) | 29 (4.5%) |
Employment Occupations by Sex in Medford
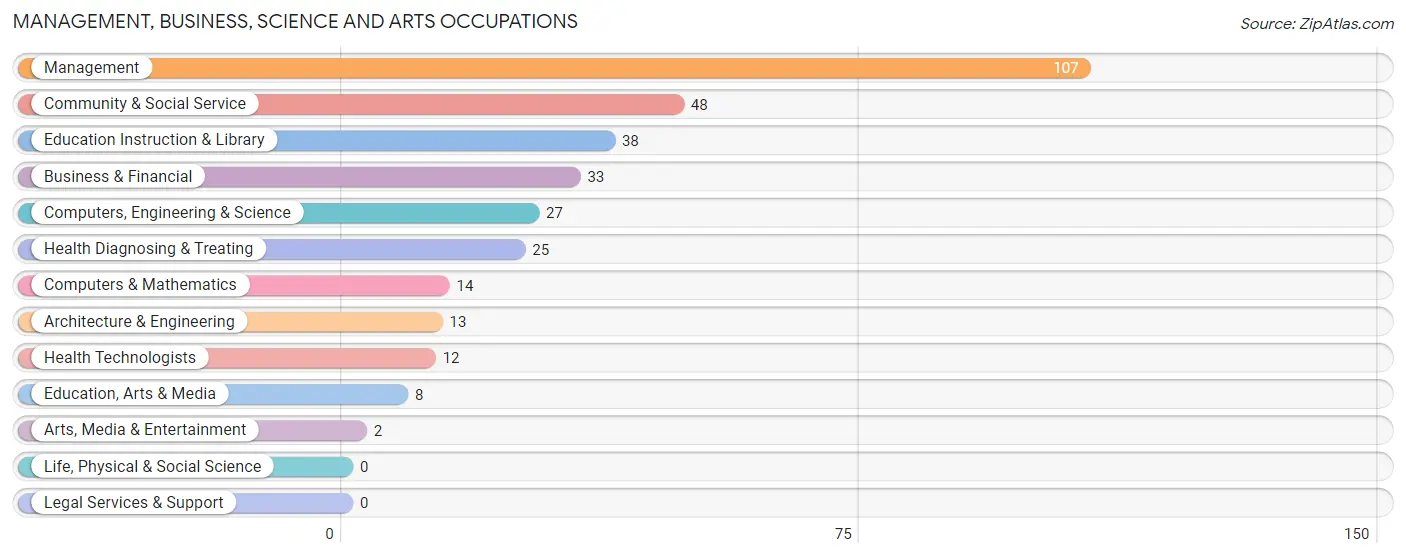
Management, Business, Science and Arts Occupations
The most common Management, Business, Science and Arts occupations in Medford are Management (107 | 15.9%), Community & Social Service (48 | 7.1%), Education Instruction & Library (38 | 5.6%), Business & Financial (33 | 4.9%), and Computers, Engineering & Science (27 | 4.0%).
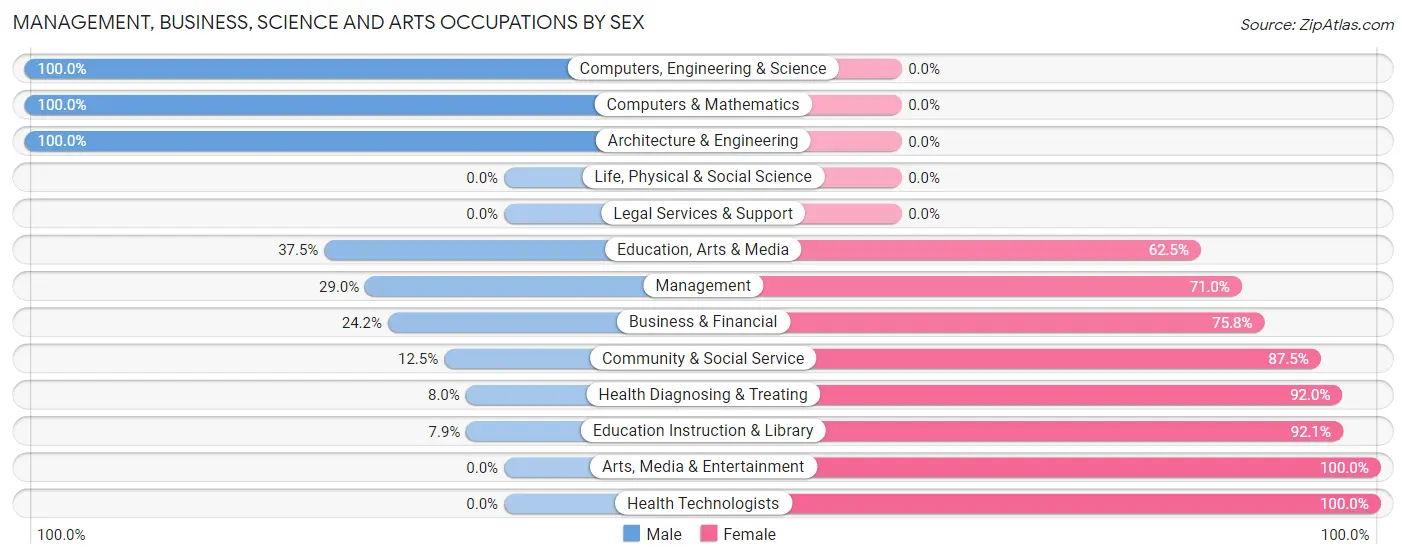
Management, Business, Science and Arts Occupations by Sex
Within the Management, Business, Science and Arts occupations in Medford, the most male-oriented occupations are Computers, Engineering & Science (100.0%), Computers & Mathematics (100.0%), and Architecture & Engineering (100.0%), while the most female-oriented occupations are Arts, Media & Entertainment (100.0%), Health Technologists (100.0%), and Education Instruction & Library (92.1%).
| Occupation | Male | Female |
| Management | 31 (29.0%) | 76 (71.0%) |
| Business & Financial | 8 (24.2%) | 25 (75.8%) |
| Computers, Engineering & Science | 27 (100.0%) | 0 (0.0%) |
| Computers & Mathematics | 14 (100.0%) | 0 (0.0%) |
| Architecture & Engineering | 13 (100.0%) | 0 (0.0%) |
| Life, Physical & Social Science | 0 (0.0%) | 0 (0.0%) |
| Community & Social Service | 6 (12.5%) | 42 (87.5%) |
| Education, Arts & Media | 3 (37.5%) | 5 (62.5%) |
| Legal Services & Support | 0 (0.0%) | 0 (0.0%) |
| Education Instruction & Library | 3 (7.9%) | 35 (92.1%) |
| Arts, Media & Entertainment | 0 (0.0%) | 2 (100.0%) |
| Health Diagnosing & Treating | 2 (8.0%) | 23 (92.0%) |
| Health Technologists | 0 (0.0%) | 12 (100.0%) |
| Total (Category) | 74 (30.8%) | 166 (69.2%) |
| Total (Overall) | 336 (49.8%) | 339 (50.2%) |
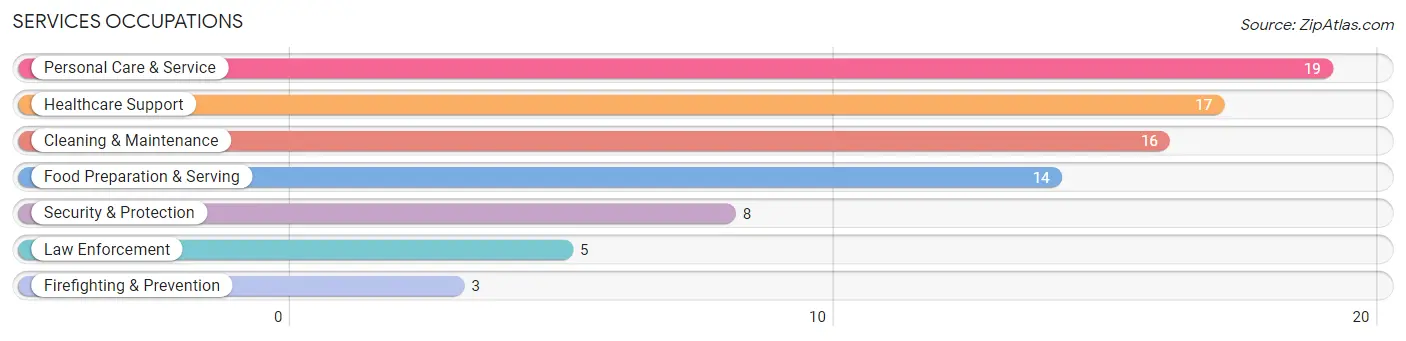
Services Occupations
The most common Services occupations in Medford are Personal Care & Service (19 | 2.8%), Healthcare Support (17 | 2.5%), Cleaning & Maintenance (16 | 2.4%), Food Preparation & Serving (14 | 2.1%), and Security & Protection (8 | 1.2%).
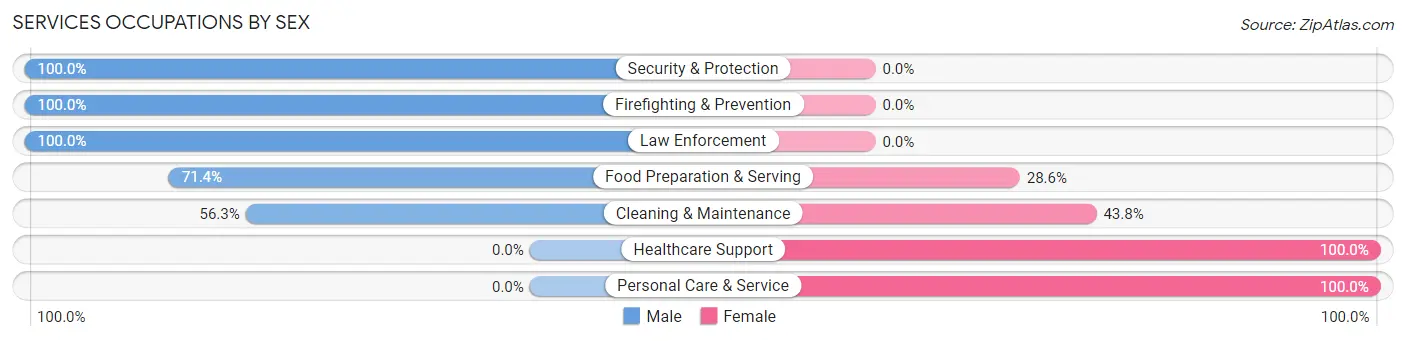
Services Occupations by Sex
Within the Services occupations in Medford, the most male-oriented occupations are Security & Protection (100.0%), Firefighting & Prevention (100.0%), and Law Enforcement (100.0%), while the most female-oriented occupations are Healthcare Support (100.0%), Personal Care & Service (100.0%), and Cleaning & Maintenance (43.8%).
| Occupation | Male | Female |
| Healthcare Support | 0 (0.0%) | 17 (100.0%) |
| Security & Protection | 8 (100.0%) | 0 (0.0%) |
| Firefighting & Prevention | 3 (100.0%) | 0 (0.0%) |
| Law Enforcement | 5 (100.0%) | 0 (0.0%) |
| Food Preparation & Serving | 10 (71.4%) | 4 (28.6%) |
| Cleaning & Maintenance | 9 (56.2%) | 7 (43.8%) |
| Personal Care & Service | 0 (0.0%) | 19 (100.0%) |
| Total (Category) | 27 (36.5%) | 47 (63.5%) |
| Total (Overall) | 336 (49.8%) | 339 (50.2%) |
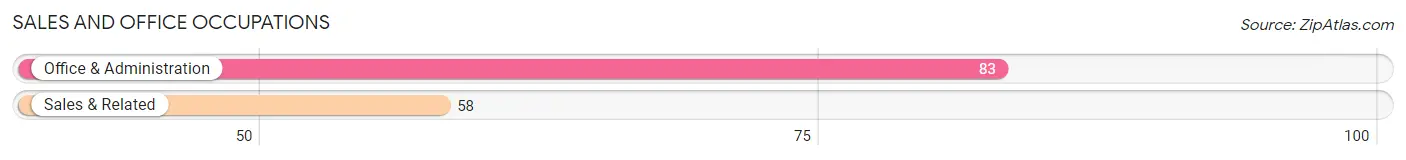
Sales and Office Occupations
The most common Sales and Office occupations in Medford are Office & Administration (83 | 12.3%), and Sales & Related (58 | 8.6%).
Sales and Office Occupations by Sex
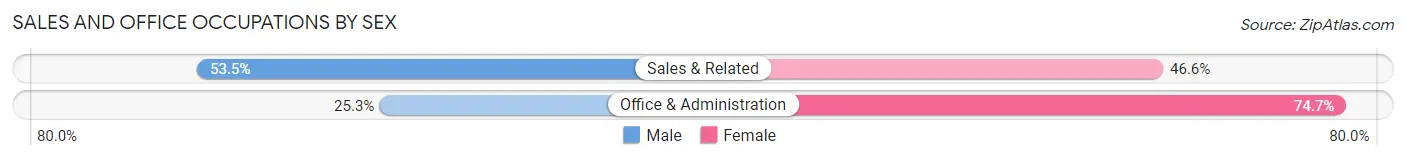
| Occupation | Male | Female |
| Sales & Related | 31 (53.4%) | 27 (46.6%) |
| Office & Administration | 21 (25.3%) | 62 (74.7%) |
| Total (Category) | 52 (36.9%) | 89 (63.1%) |
| Total (Overall) | 336 (49.8%) | 339 (50.2%) |
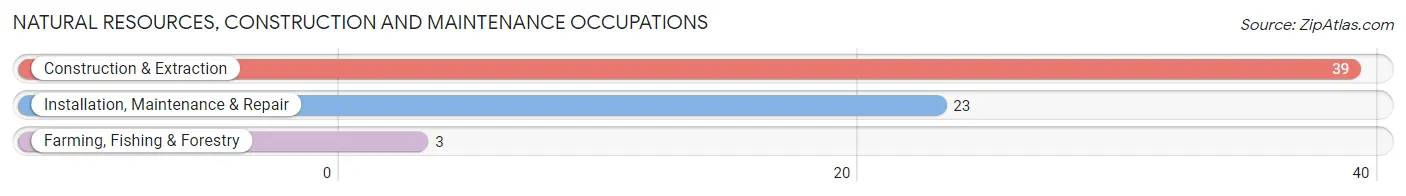
Natural Resources, Construction and Maintenance Occupations
The most common Natural Resources, Construction and Maintenance occupations in Medford are Construction & Extraction (39 | 5.8%), Installation, Maintenance & Repair (23 | 3.4%), and Farming, Fishing & Forestry (3 | 0.4%).
Natural Resources, Construction and Maintenance Occupations by Sex
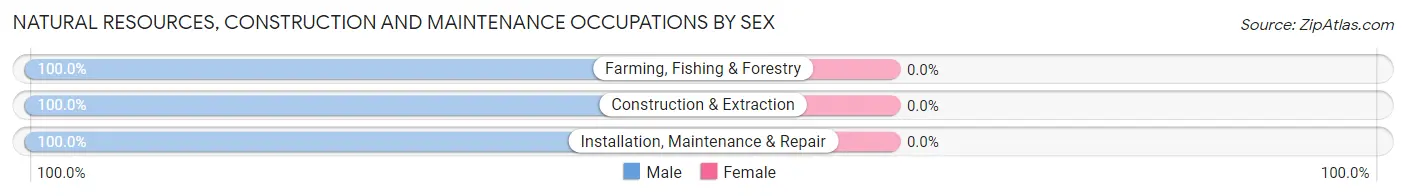
| Occupation | Male | Female |
| Farming, Fishing & Forestry | 3 (100.0%) | 0 (0.0%) |
| Construction & Extraction | 39 (100.0%) | 0 (0.0%) |
| Installation, Maintenance & Repair | 23 (100.0%) | 0 (0.0%) |
| Total (Category) | 65 (100.0%) | 0 (0.0%) |
| Total (Overall) | 336 (49.8%) | 339 (50.2%) |
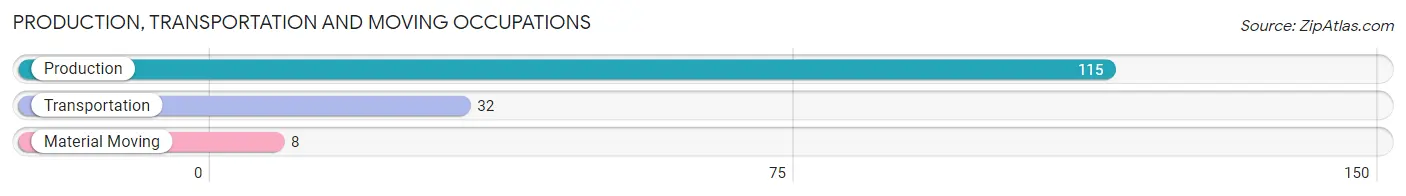
Production, Transportation and Moving Occupations
The most common Production, Transportation and Moving occupations in Medford are Production (115 | 17.0%), Transportation (32 | 4.7%), and Material Moving (8 | 1.2%).
Production, Transportation and Moving Occupations by Sex
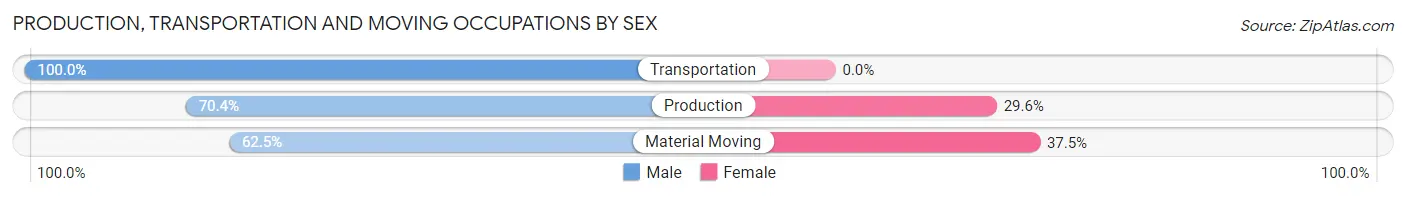
| Occupation | Male | Female |
| Production | 81 (70.4%) | 34 (29.6%) |
| Transportation | 32 (100.0%) | 0 (0.0%) |
| Material Moving | 5 (62.5%) | 3 (37.5%) |
| Total (Category) | 118 (76.1%) | 37 (23.9%) |
| Total (Overall) | 336 (49.8%) | 339 (50.2%) |
Employment Industries by Sex in Medford
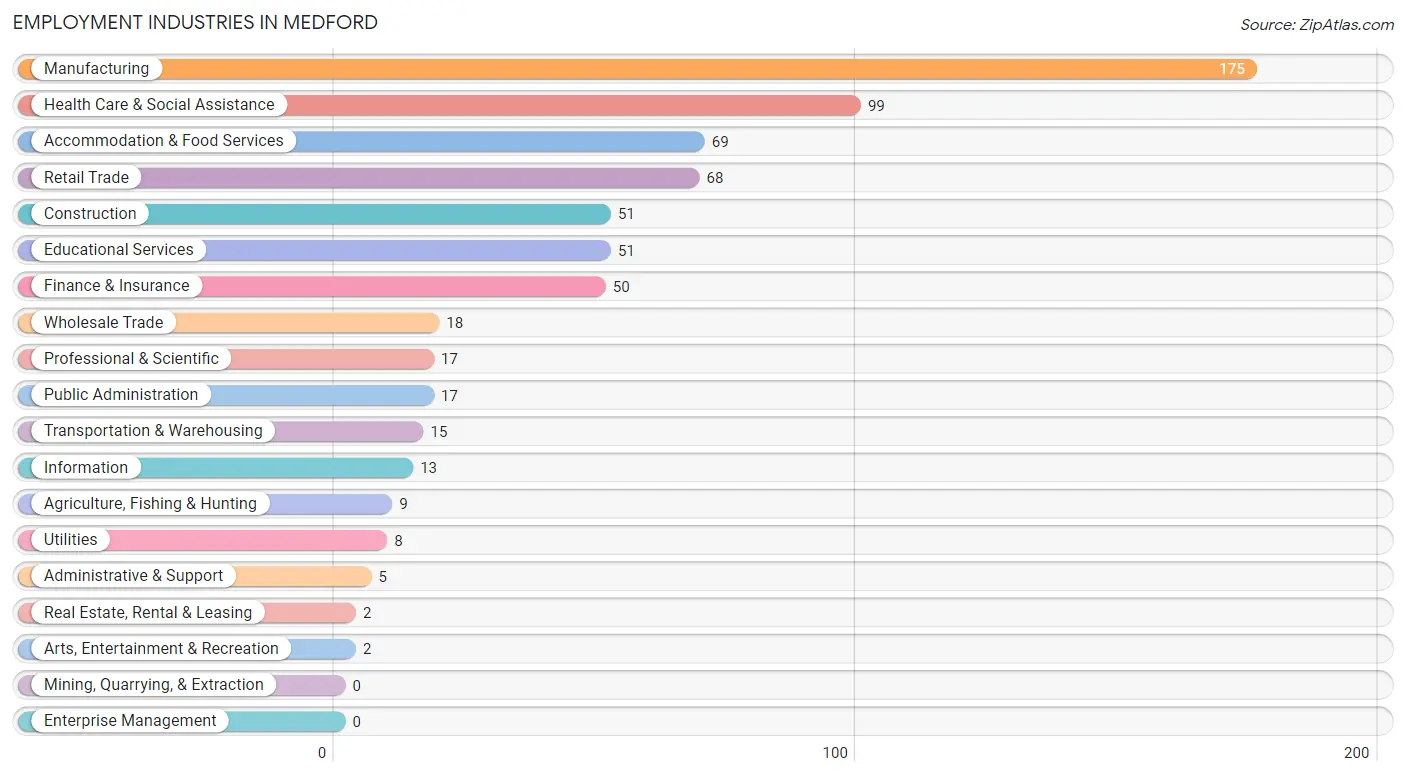
Employment Industries in Medford
The major employment industries in Medford include Manufacturing (175 | 25.9%), Health Care & Social Assistance (99 | 14.7%), Accommodation & Food Services (69 | 10.2%), Retail Trade (68 | 10.1%), and Construction (51 | 7.6%).
Employment Industries by Sex in Medford
The Medford industries that see more men than women are Agriculture, Fishing & Hunting (100.0%), Transportation & Warehousing (100.0%), and Utilities (100.0%), whereas the industries that tend to have a higher number of women are Real Estate, Rental & Leasing (100.0%), Arts, Entertainment & Recreation (100.0%), and Educational Services (86.3%).
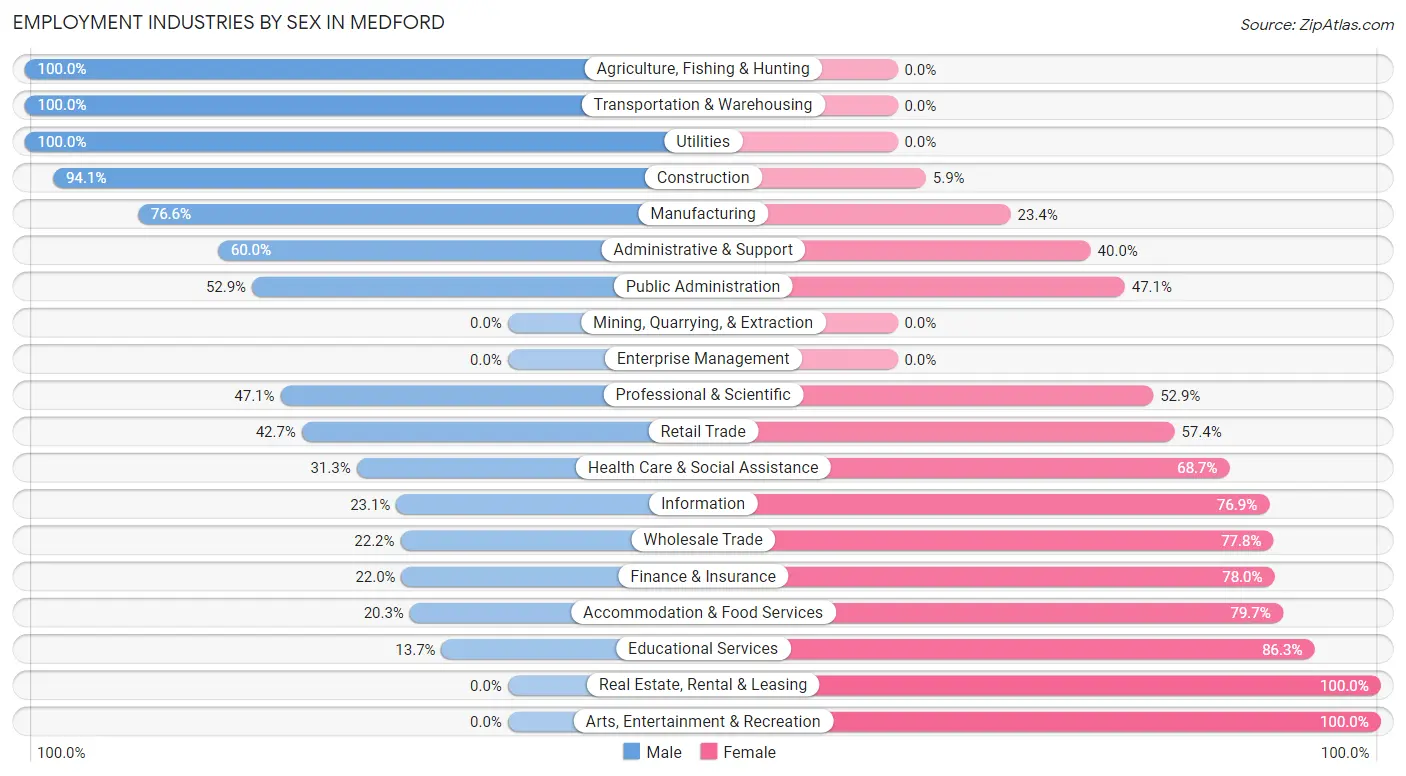
| Industry | Male | Female |
| Agriculture, Fishing & Hunting | 9 (100.0%) | 0 (0.0%) |
| Mining, Quarrying, & Extraction | 0 (0.0%) | 0 (0.0%) |
| Construction | 48 (94.1%) | 3 (5.9%) |
| Manufacturing | 134 (76.6%) | 41 (23.4%) |
| Wholesale Trade | 4 (22.2%) | 14 (77.8%) |
| Retail Trade | 29 (42.6%) | 39 (57.4%) |
| Transportation & Warehousing | 15 (100.0%) | 0 (0.0%) |
| Utilities | 8 (100.0%) | 0 (0.0%) |
| Information | 3 (23.1%) | 10 (76.9%) |
| Finance & Insurance | 11 (22.0%) | 39 (78.0%) |
| Real Estate, Rental & Leasing | 0 (0.0%) | 2 (100.0%) |
| Professional & Scientific | 8 (47.1%) | 9 (52.9%) |
| Enterprise Management | 0 (0.0%) | 0 (0.0%) |
| Administrative & Support | 3 (60.0%) | 2 (40.0%) |
| Educational Services | 7 (13.7%) | 44 (86.3%) |
| Health Care & Social Assistance | 31 (31.3%) | 68 (68.7%) |
| Arts, Entertainment & Recreation | 0 (0.0%) | 2 (100.0%) |
| Accommodation & Food Services | 14 (20.3%) | 55 (79.7%) |
| Public Administration | 9 (52.9%) | 8 (47.1%) |
| Total | 336 (49.8%) | 339 (50.2%) |
Education in Medford
School Enrollment in Medford
The most common levels of schooling among the 356 students in Medford are high school (88 | 24.7%), elementary school (81 | 22.8%), and middle school (76 | 21.3%).
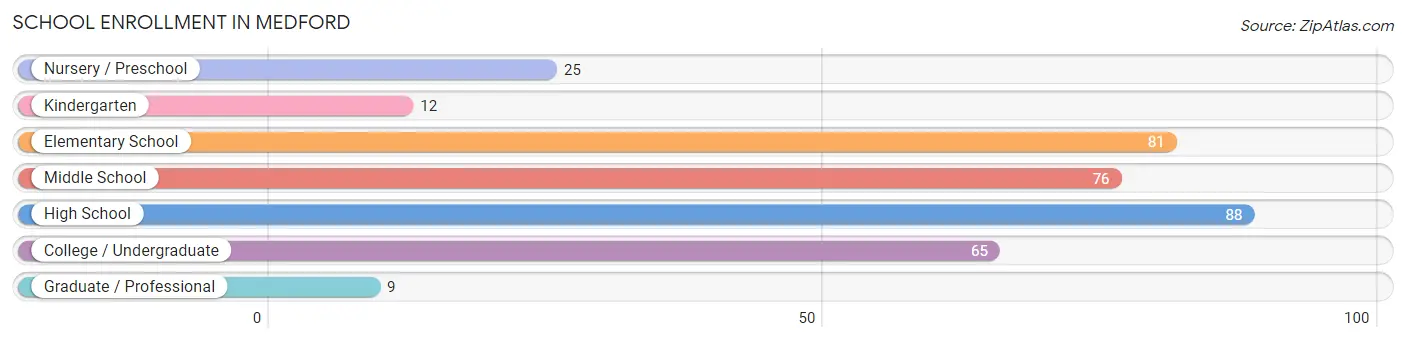
| School Level | # Students | % Students |
| Nursery / Preschool | 25 | 7.0% |
| Kindergarten | 12 | 3.4% |
| Elementary School | 81 | 22.8% |
| Middle School | 76 | 21.3% |
| High School | 88 | 24.7% |
| College / Undergraduate | 65 | 18.3% |
| Graduate / Professional | 9 | 2.5% |
| Total | 356 | 100.0% |
School Enrollment by Age by Funding Source in Medford
Out of a total of 356 students who are enrolled in schools in Medford, 20 (5.6%) attend a private institution, while the remaining 336 (94.4%) are enrolled in public schools. The age group of 3 to 4 year olds has the highest likelihood of being enrolled in private schools, with 10 (58.8% in the age bracket) enrolled. Conversely, the age group of 15 to 17 year olds has the lowest likelihood of being enrolled in a private school, with 58 (100.0% in the age bracket) attending a public institution.
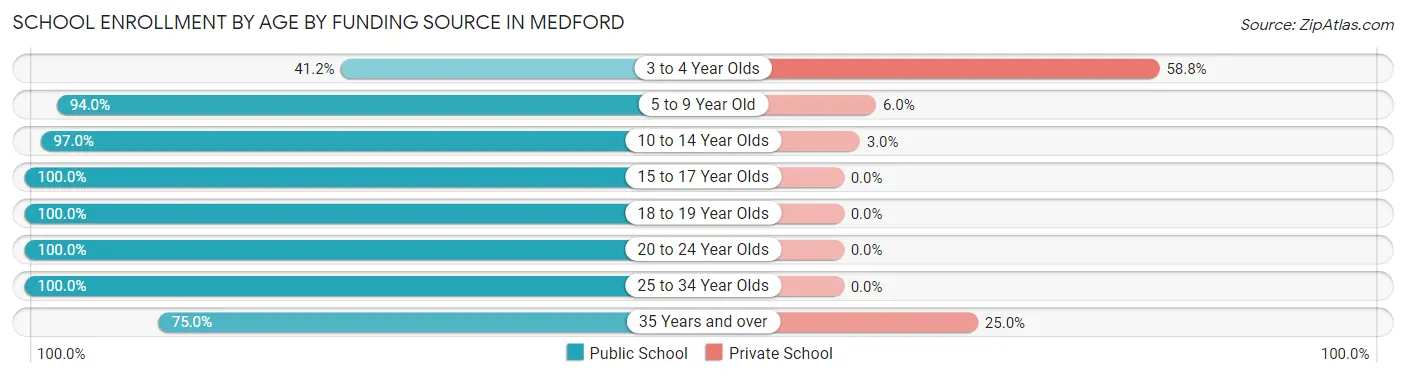
| Age Bracket | Public School | Private School |
| 3 to 4 Year Olds | 7 (41.2%) | 10 (58.8%) |
| 5 to 9 Year Old | 78 (94.0%) | 5 (6.0%) |
| 10 to 14 Year Olds | 97 (97.0%) | 3 (3.0%) |
| 15 to 17 Year Olds | 58 (100.0%) | 0 (0.0%) |
| 18 to 19 Year Olds | 28 (100.0%) | 0 (0.0%) |
| 20 to 24 Year Olds | 50 (100.0%) | 0 (0.0%) |
| 25 to 34 Year Olds | 12 (100.0%) | 0 (0.0%) |
| 35 Years and over | 6 (75.0%) | 2 (25.0%) |
| Total | 336 (94.4%) | 20 (5.6%) |
Educational Attainment by Field of Study in Medford
Business (72 | 36.7%), education (32 | 16.3%), science & technology (21 | 10.7%), bio, nature & agricultural (12 | 6.1%), and communications (12 | 6.1%) are the most common fields of study among 196 individuals in Medford who have obtained a bachelor's degree or higher.
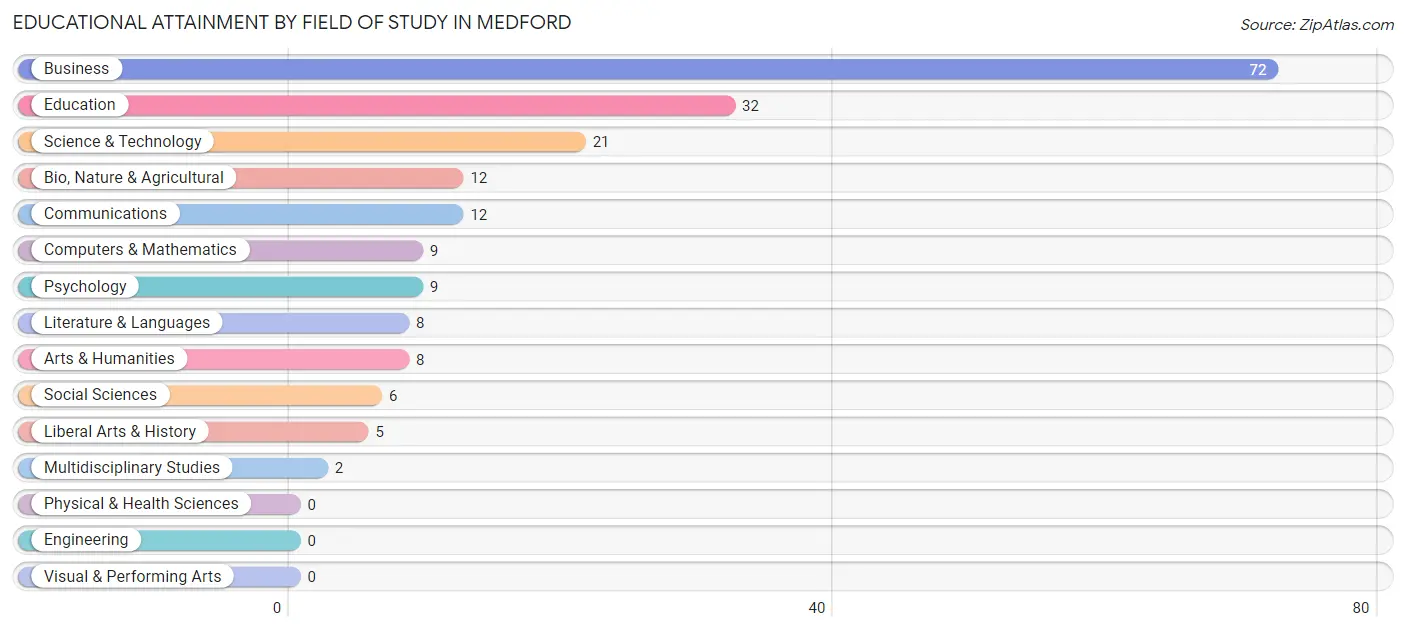
| Field of Study | # Graduates | % Graduates |
| Computers & Mathematics | 9 | 4.6% |
| Bio, Nature & Agricultural | 12 | 6.1% |
| Physical & Health Sciences | 0 | 0.0% |
| Psychology | 9 | 4.6% |
| Social Sciences | 6 | 3.1% |
| Engineering | 0 | 0.0% |
| Multidisciplinary Studies | 2 | 1.0% |
| Science & Technology | 21 | 10.7% |
| Business | 72 | 36.7% |
| Education | 32 | 16.3% |
| Literature & Languages | 8 | 4.1% |
| Liberal Arts & History | 5 | 2.5% |
| Visual & Performing Arts | 0 | 0.0% |
| Communications | 12 | 6.1% |
| Arts & Humanities | 8 | 4.1% |
| Total | 196 | 100.0% |
Transportation & Commute in Medford
Vehicle Availability by Sex in Medford
The most prevalent vehicle ownership categories in Medford are males with 2 vehicles (141, accounting for 43.6%) and females with 2 vehicles (170, making up 41.6%).
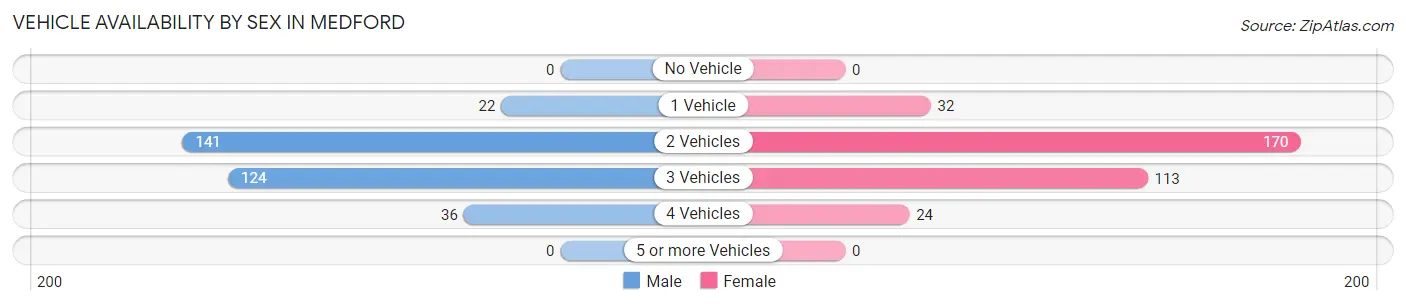
| Vehicles Available | Male | Female |
| No Vehicle | 0 (0.0%) | 0 (0.0%) |
| 1 Vehicle | 22 (6.8%) | 32 (9.4%) |
| 2 Vehicles | 141 (43.6%) | 170 (50.1%) |
| 3 Vehicles | 124 (38.4%) | 113 (33.3%) |
| 4 Vehicles | 36 (11.2%) | 24 (7.1%) |
| 5 or more Vehicles | 0 (0.0%) | 0 (0.0%) |
| Total | 323 (100.0%) | 339 (100.0%) |
Commute Time in Medford
The most frequently occuring commute durations in Medford are 15 to 19 minutes (175 commuters, 28.3%), 10 to 14 minutes (121 commuters, 19.6%), and less than 5 minutes (65 commuters, 10.5%).
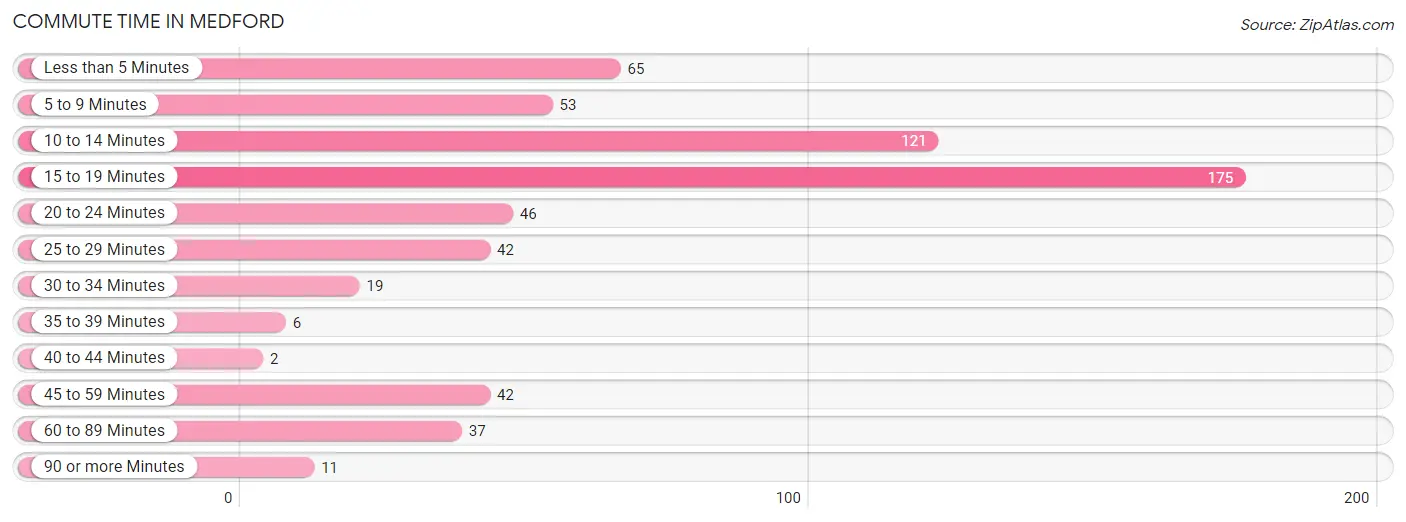
| Commute Time | # Commuters | % Commuters |
| Less than 5 Minutes | 65 | 10.5% |
| 5 to 9 Minutes | 53 | 8.6% |
| 10 to 14 Minutes | 121 | 19.6% |
| 15 to 19 Minutes | 175 | 28.3% |
| 20 to 24 Minutes | 46 | 7.4% |
| 25 to 29 Minutes | 42 | 6.8% |
| 30 to 34 Minutes | 19 | 3.1% |
| 35 to 39 Minutes | 6 | 1.0% |
| 40 to 44 Minutes | 2 | 0.3% |
| 45 to 59 Minutes | 42 | 6.8% |
| 60 to 89 Minutes | 37 | 6.0% |
| 90 or more Minutes | 11 | 1.8% |
Commute Time by Sex in Medford
The most common commute times in Medford are 15 to 19 minutes (90 commuters, 28.7%) for males and 15 to 19 minutes (85 commuters, 27.9%) for females.
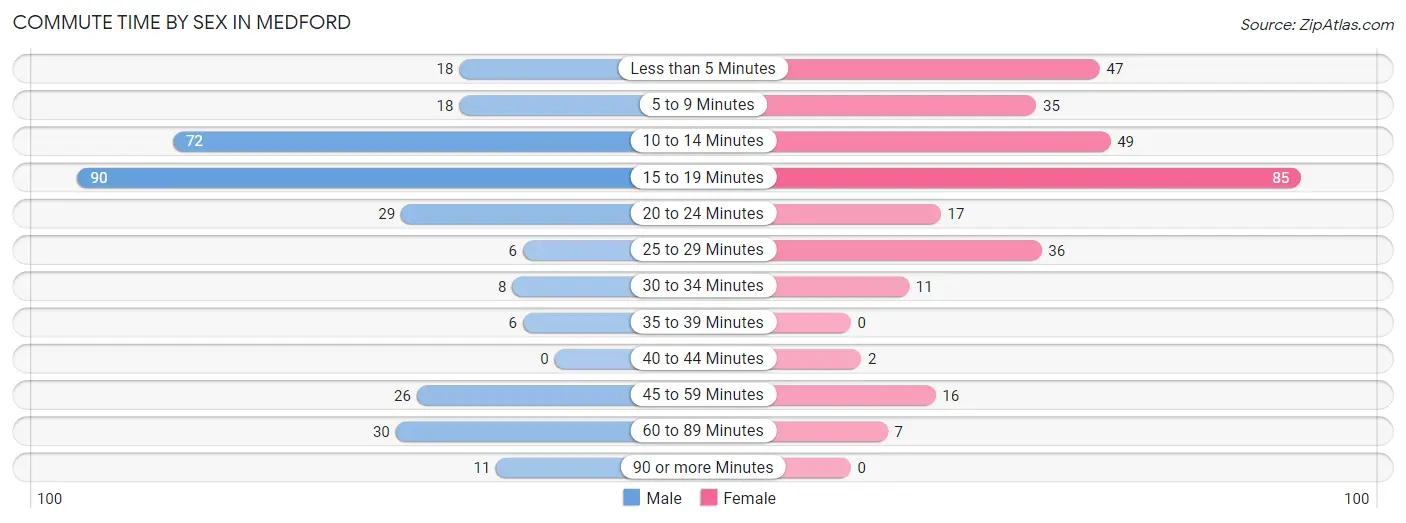
| Commute Time | Male | Female |
| Less than 5 Minutes | 18 (5.7%) | 47 (15.4%) |
| 5 to 9 Minutes | 18 (5.7%) | 35 (11.5%) |
| 10 to 14 Minutes | 72 (22.9%) | 49 (16.1%) |
| 15 to 19 Minutes | 90 (28.7%) | 85 (27.9%) |
| 20 to 24 Minutes | 29 (9.2%) | 17 (5.6%) |
| 25 to 29 Minutes | 6 (1.9%) | 36 (11.8%) |
| 30 to 34 Minutes | 8 (2.5%) | 11 (3.6%) |
| 35 to 39 Minutes | 6 (1.9%) | 0 (0.0%) |
| 40 to 44 Minutes | 0 (0.0%) | 2 (0.7%) |
| 45 to 59 Minutes | 26 (8.3%) | 16 (5.2%) |
| 60 to 89 Minutes | 30 (9.6%) | 7 (2.3%) |
| 90 or more Minutes | 11 (3.5%) | 0 (0.0%) |
Time of Departure to Work by Sex in Medford
The most frequent times of departure to work in Medford are 7:30 AM to 7:59 AM (57, 18.1%) for males and 7:00 AM to 7:29 AM (55, 18.0%) for females.
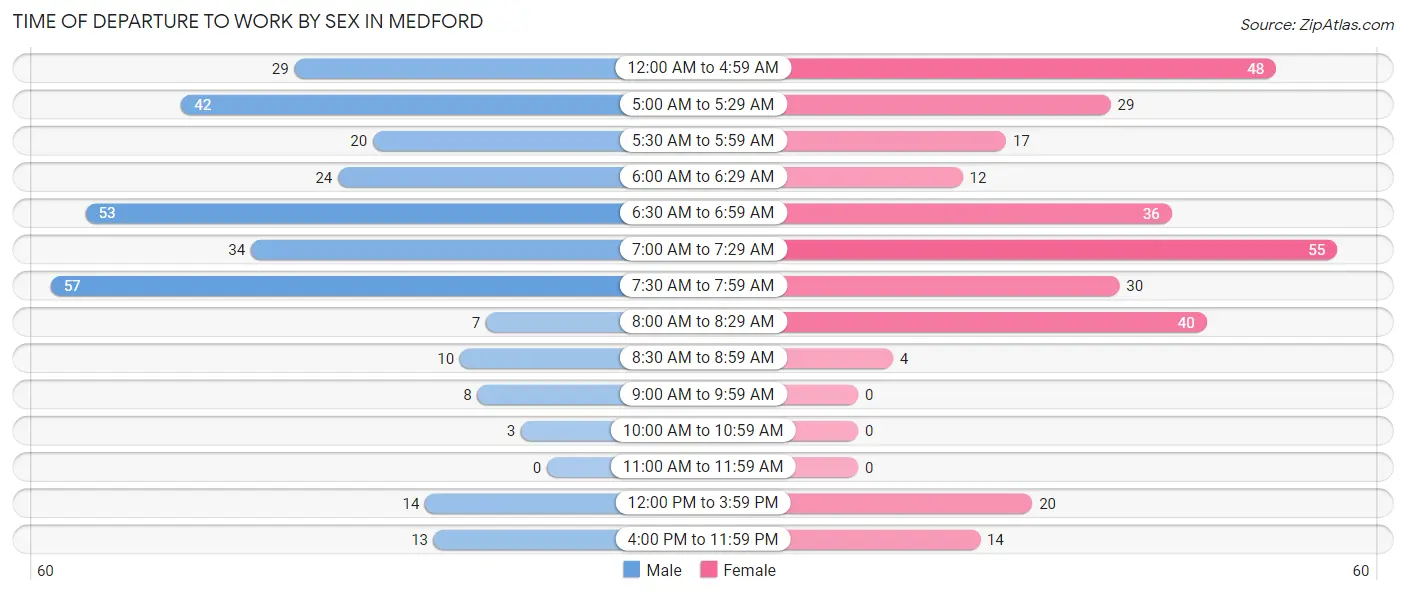
| Time of Departure | Male | Female |
| 12:00 AM to 4:59 AM | 29 (9.2%) | 48 (15.7%) |
| 5:00 AM to 5:29 AM | 42 (13.4%) | 29 (9.5%) |
| 5:30 AM to 5:59 AM | 20 (6.4%) | 17 (5.6%) |
| 6:00 AM to 6:29 AM | 24 (7.6%) | 12 (3.9%) |
| 6:30 AM to 6:59 AM | 53 (16.9%) | 36 (11.8%) |
| 7:00 AM to 7:29 AM | 34 (10.8%) | 55 (18.0%) |
| 7:30 AM to 7:59 AM | 57 (18.1%) | 30 (9.8%) |
| 8:00 AM to 8:29 AM | 7 (2.2%) | 40 (13.1%) |
| 8:30 AM to 8:59 AM | 10 (3.2%) | 4 (1.3%) |
| 9:00 AM to 9:59 AM | 8 (2.5%) | 0 (0.0%) |
| 10:00 AM to 10:59 AM | 3 (1.0%) | 0 (0.0%) |
| 11:00 AM to 11:59 AM | 0 (0.0%) | 0 (0.0%) |
| 12:00 PM to 3:59 PM | 14 (4.5%) | 20 (6.6%) |
| 4:00 PM to 11:59 PM | 13 (4.1%) | 14 (4.6%) |
| Total | 314 (100.0%) | 305 (100.0%) |
Housing Occupancy in Medford
Occupancy by Ownership in Medford
Of the total 440 dwellings in Medford, owner-occupied units account for 340 (77.3%), while renter-occupied units make up 100 (22.7%).
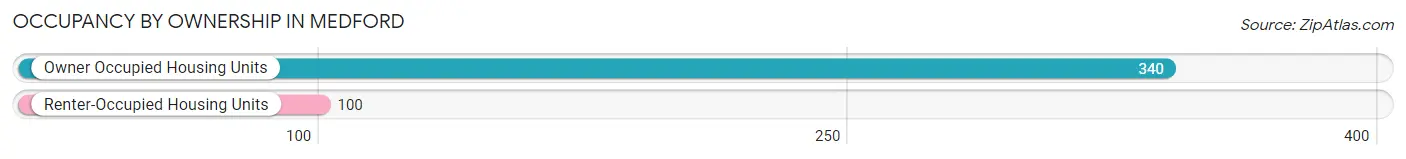
| Occupancy | # Housing Units | % Housing Units |
| Owner Occupied Housing Units | 340 | 77.3% |
| Renter-Occupied Housing Units | 100 | 22.7% |
| Total Occupied Housing Units | 440 | 100.0% |
Occupancy by Household Size in Medford
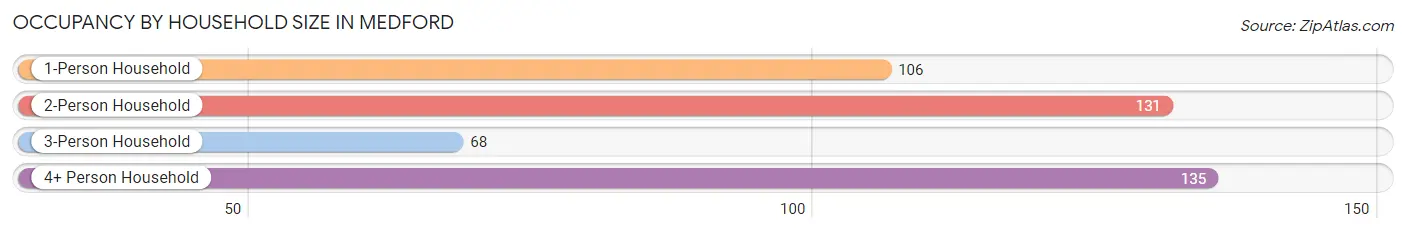
| Household Size | # Housing Units | % Housing Units |
| 1-Person Household | 106 | 24.1% |
| 2-Person Household | 131 | 29.8% |
| 3-Person Household | 68 | 15.4% |
| 4+ Person Household | 135 | 30.7% |
| Total Housing Units | 440 | 100.0% |
Occupancy by Ownership by Household Size in Medford
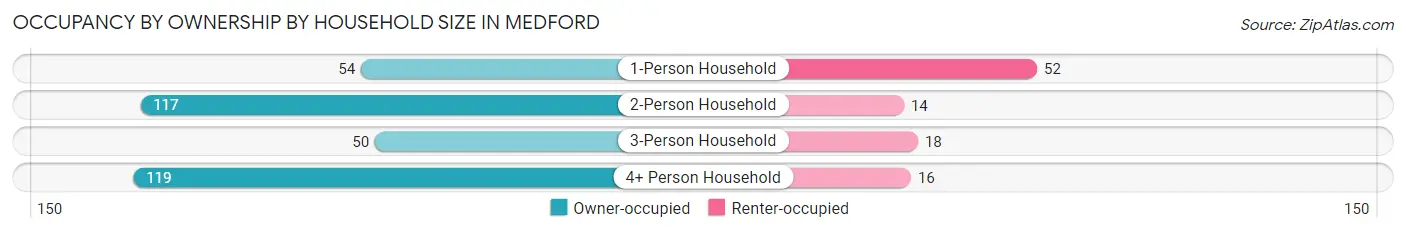
| Household Size | Owner-occupied | Renter-occupied |
| 1-Person Household | 54 (50.9%) | 52 (49.1%) |
| 2-Person Household | 117 (89.3%) | 14 (10.7%) |
| 3-Person Household | 50 (73.5%) | 18 (26.5%) |
| 4+ Person Household | 119 (88.1%) | 16 (11.8%) |
| Total Housing Units | 340 (77.3%) | 100 (22.7%) |
Occupancy by Educational Attainment in Medford
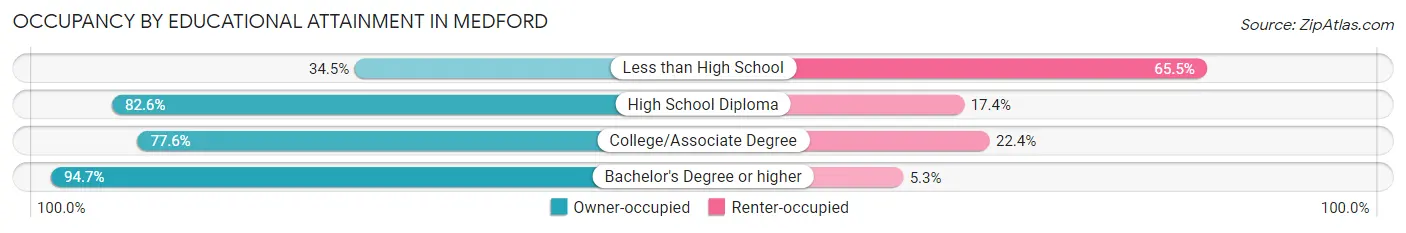
| Household Size | Owner-occupied | Renter-occupied |
| Less than High School | 20 (34.5%) | 38 (65.5%) |
| High School Diploma | 119 (82.6%) | 25 (17.4%) |
| College/Associate Degree | 111 (77.6%) | 32 (22.4%) |
| Bachelor's Degree or higher | 90 (94.7%) | 5 (5.3%) |
Occupancy by Age of Householder in Medford
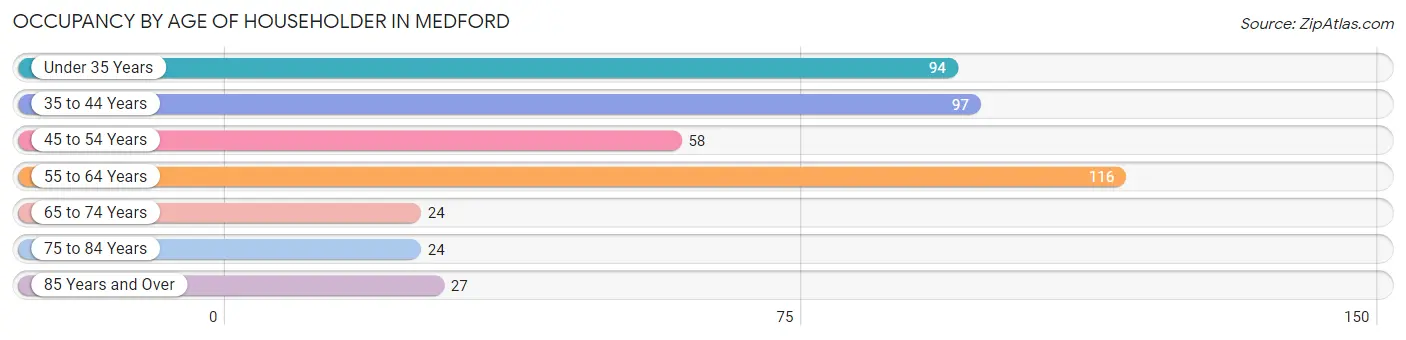
| Age Bracket | # Households | % Households |
| Under 35 Years | 94 | 21.4% |
| 35 to 44 Years | 97 | 22.1% |
| 45 to 54 Years | 58 | 13.2% |
| 55 to 64 Years | 116 | 26.4% |
| 65 to 74 Years | 24 | 5.4% |
| 75 to 84 Years | 24 | 5.4% |
| 85 Years and Over | 27 | 6.1% |
| Total | 440 | 100.0% |
Housing Finances in Medford
Median Income by Occupancy in Medford
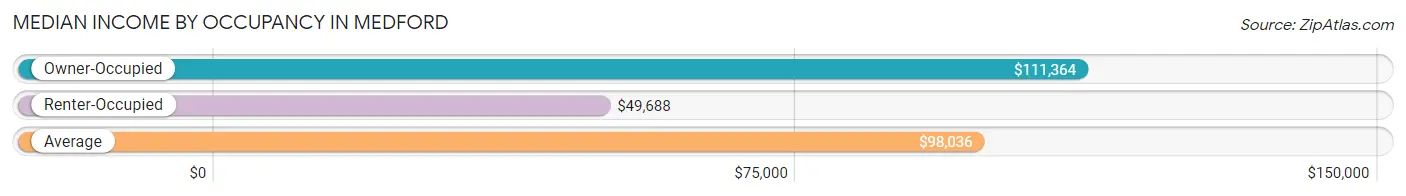
| Occupancy Type | # Households | Median Income |
| Owner-Occupied | 340 (77.3%) | $111,364 |
| Renter-Occupied | 100 (22.7%) | $49,688 |
| Average | 440 (100.0%) | $98,036 |
Occupancy by Householder Income Bracket in Medford
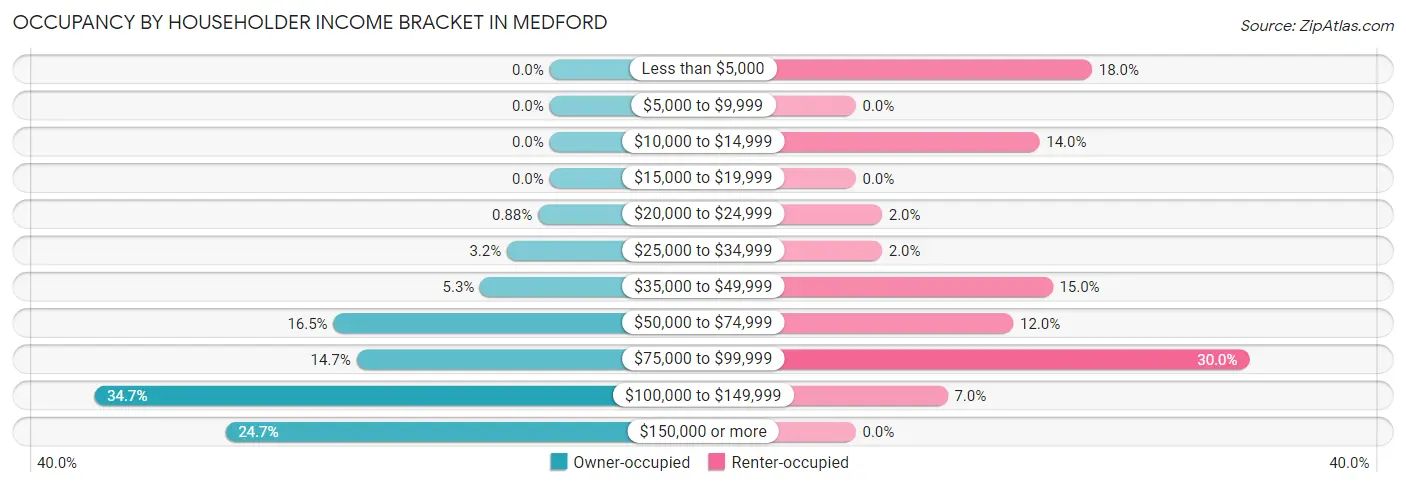
| Income Bracket | Owner-occupied | Renter-occupied |
| Less than $5,000 | 0 (0.0%) | 18 (18.0%) |
| $5,000 to $9,999 | 0 (0.0%) | 0 (0.0%) |
| $10,000 to $14,999 | 0 (0.0%) | 14 (14.0%) |
| $15,000 to $19,999 | 0 (0.0%) | 0 (0.0%) |
| $20,000 to $24,999 | 3 (0.9%) | 2 (2.0%) |
| $25,000 to $34,999 | 11 (3.2%) | 2 (2.0%) |
| $35,000 to $49,999 | 18 (5.3%) | 15 (15.0%) |
| $50,000 to $74,999 | 56 (16.5%) | 12 (12.0%) |
| $75,000 to $99,999 | 50 (14.7%) | 30 (30.0%) |
| $100,000 to $149,999 | 118 (34.7%) | 7 (7.0%) |
| $150,000 or more | 84 (24.7%) | 0 (0.0%) |
| Total | 340 (100.0%) | 100 (100.0%) |
Monthly Housing Cost Tiers in Medford
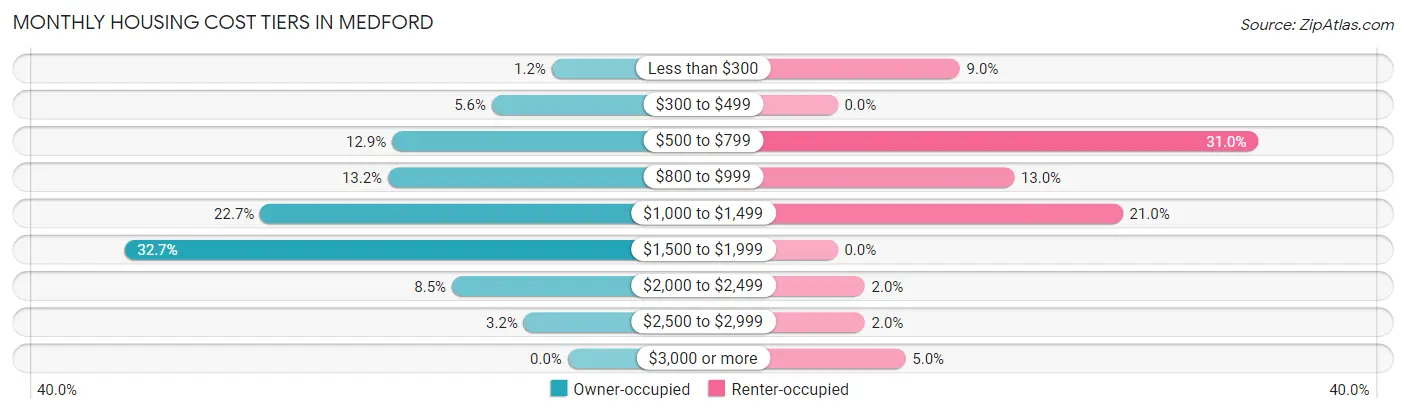
| Monthly Cost | Owner-occupied | Renter-occupied |
| Less than $300 | 4 (1.2%) | 9 (9.0%) |
| $300 to $499 | 19 (5.6%) | 0 (0.0%) |
| $500 to $799 | 44 (12.9%) | 31 (31.0%) |
| $800 to $999 | 45 (13.2%) | 13 (13.0%) |
| $1,000 to $1,499 | 77 (22.7%) | 21 (21.0%) |
| $1,500 to $1,999 | 111 (32.7%) | 0 (0.0%) |
| $2,000 to $2,499 | 29 (8.5%) | 2 (2.0%) |
| $2,500 to $2,999 | 11 (3.2%) | 2 (2.0%) |
| $3,000 or more | 0 (0.0%) | 5 (5.0%) |
| Total | 340 (100.0%) | 100 (100.0%) |
Physical Housing Characteristics in Medford
Housing Structures in Medford
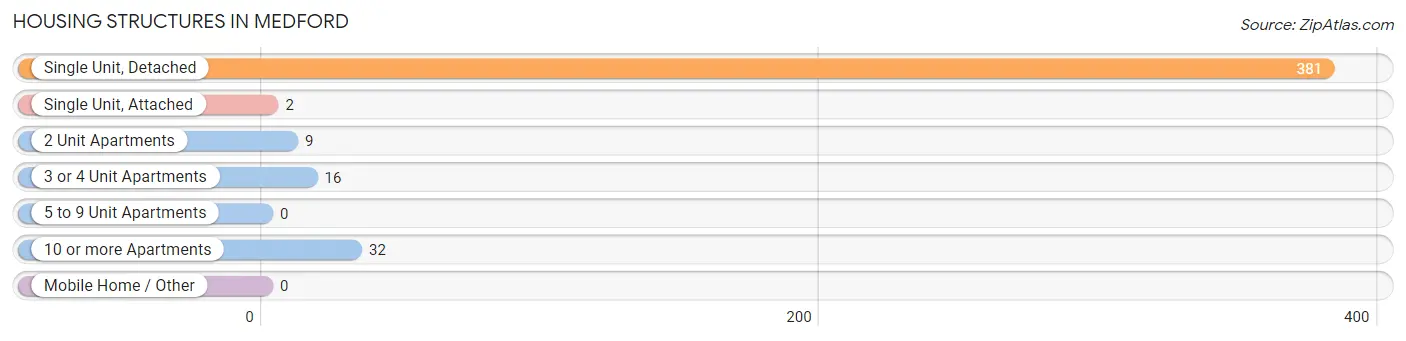
| Structure Type | # Housing Units | % Housing Units |
| Single Unit, Detached | 381 | 86.6% |
| Single Unit, Attached | 2 | 0.4% |
| 2 Unit Apartments | 9 | 2.1% |
| 3 or 4 Unit Apartments | 16 | 3.6% |
| 5 to 9 Unit Apartments | 0 | 0.0% |
| 10 or more Apartments | 32 | 7.3% |
| Mobile Home / Other | 0 | 0.0% |
| Total | 440 | 100.0% |
Housing Structures by Occupancy in Medford
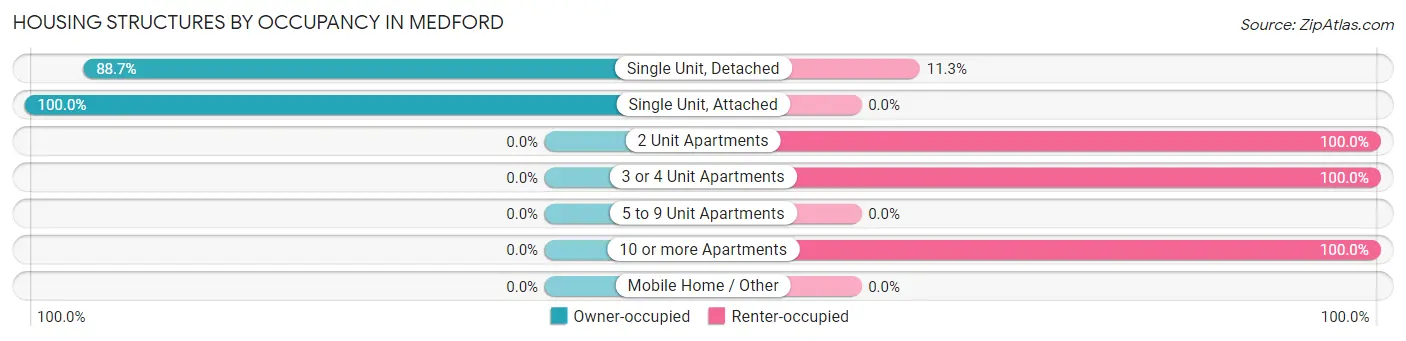
| Structure Type | Owner-occupied | Renter-occupied |
| Single Unit, Detached | 338 (88.7%) | 43 (11.3%) |
| Single Unit, Attached | 2 (100.0%) | 0 (0.0%) |
| 2 Unit Apartments | 0 (0.0%) | 9 (100.0%) |
| 3 or 4 Unit Apartments | 0 (0.0%) | 16 (100.0%) |
| 5 to 9 Unit Apartments | 0 (0.0%) | 0 (0.0%) |
| 10 or more Apartments | 0 (0.0%) | 32 (100.0%) |
| Mobile Home / Other | 0 (0.0%) | 0 (0.0%) |
| Total | 340 (77.3%) | 100 (22.7%) |
Housing Structures by Number of Rooms in Medford
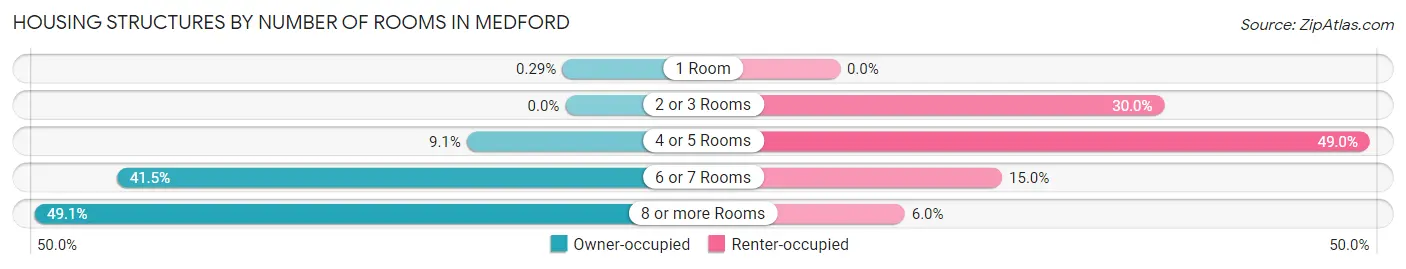
| Number of Rooms | Owner-occupied | Renter-occupied |
| 1 Room | 1 (0.3%) | 0 (0.0%) |
| 2 or 3 Rooms | 0 (0.0%) | 30 (30.0%) |
| 4 or 5 Rooms | 31 (9.1%) | 49 (49.0%) |
| 6 or 7 Rooms | 141 (41.5%) | 15 (15.0%) |
| 8 or more Rooms | 167 (49.1%) | 6 (6.0%) |
| Total | 340 (100.0%) | 100 (100.0%) |
Housing Structure by Heating Type in Medford
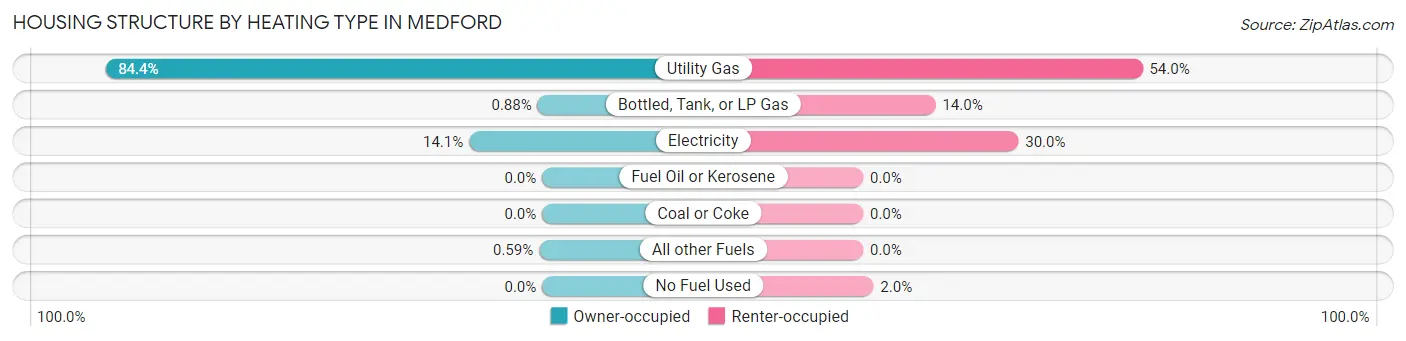
| Heating Type | Owner-occupied | Renter-occupied |
| Utility Gas | 287 (84.4%) | 54 (54.0%) |
| Bottled, Tank, or LP Gas | 3 (0.9%) | 14 (14.0%) |
| Electricity | 48 (14.1%) | 30 (30.0%) |
| Fuel Oil or Kerosene | 0 (0.0%) | 0 (0.0%) |
| Coal or Coke | 0 (0.0%) | 0 (0.0%) |
| All other Fuels | 2 (0.6%) | 0 (0.0%) |
| No Fuel Used | 0 (0.0%) | 2 (2.0%) |
| Total | 340 (100.0%) | 100 (100.0%) |
Household Vehicle Usage in Medford
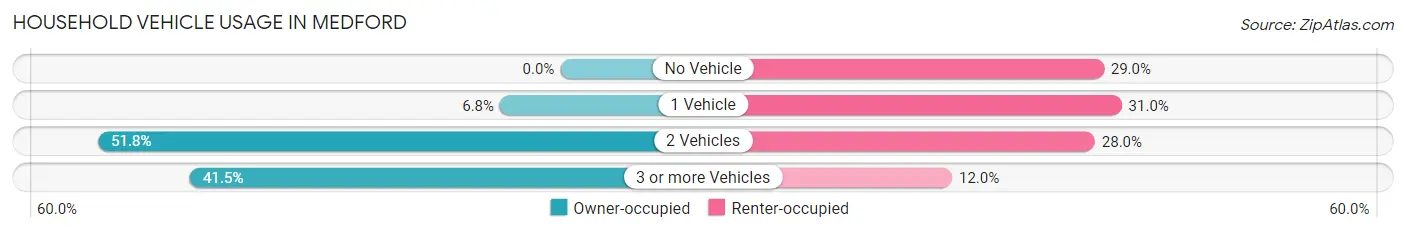
| Vehicles per Household | Owner-occupied | Renter-occupied |
| No Vehicle | 0 (0.0%) | 29 (29.0%) |
| 1 Vehicle | 23 (6.8%) | 31 (31.0%) |
| 2 Vehicles | 176 (51.8%) | 28 (28.0%) |
| 3 or more Vehicles | 141 (41.5%) | 12 (12.0%) |
| Total | 340 (100.0%) | 100 (100.0%) |
Real Estate & Mortgages in Medford
Real Estate and Mortgage Overview in Medford
| Characteristic | Without Mortgage | With Mortgage |
| Housing Units | 89 | 251 |
| Median Property Value | $210,600 | $214,100 |
| Median Household Income | $115,972 | $66 |
| Monthly Housing Costs | $614 | $0 |
| Real Estate Taxes | $3,132 | $3 |
Property Value by Mortgage Status in Medford
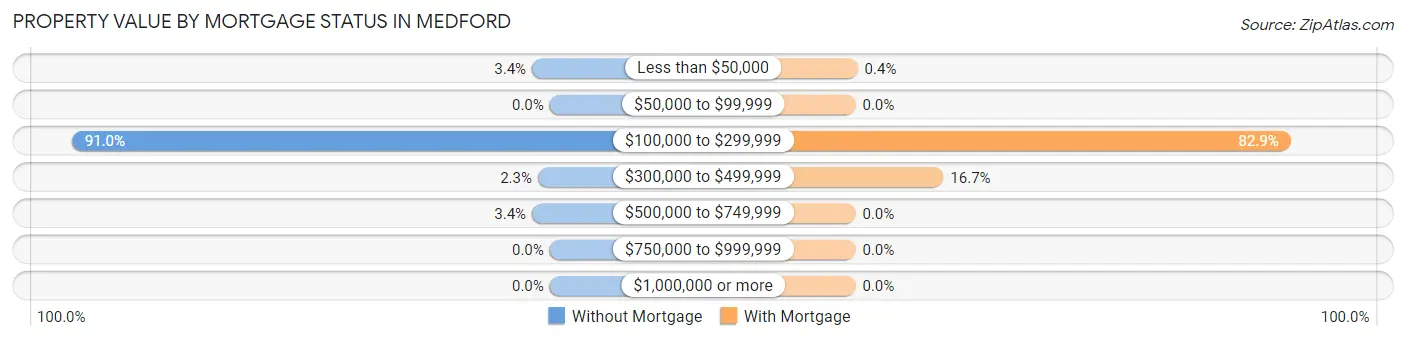
| Property Value | Without Mortgage | With Mortgage |
| Less than $50,000 | 3 (3.4%) | 1 (0.4%) |
| $50,000 to $99,999 | 0 (0.0%) | 0 (0.0%) |
| $100,000 to $299,999 | 81 (91.0%) | 208 (82.9%) |
| $300,000 to $499,999 | 2 (2.2%) | 42 (16.7%) |
| $500,000 to $749,999 | 3 (3.4%) | 0 (0.0%) |
| $750,000 to $999,999 | 0 (0.0%) | 0 (0.0%) |
| $1,000,000 or more | 0 (0.0%) | 0 (0.0%) |
| Total | 89 (100.0%) | 251 (100.0%) |
Household Income by Mortgage Status in Medford
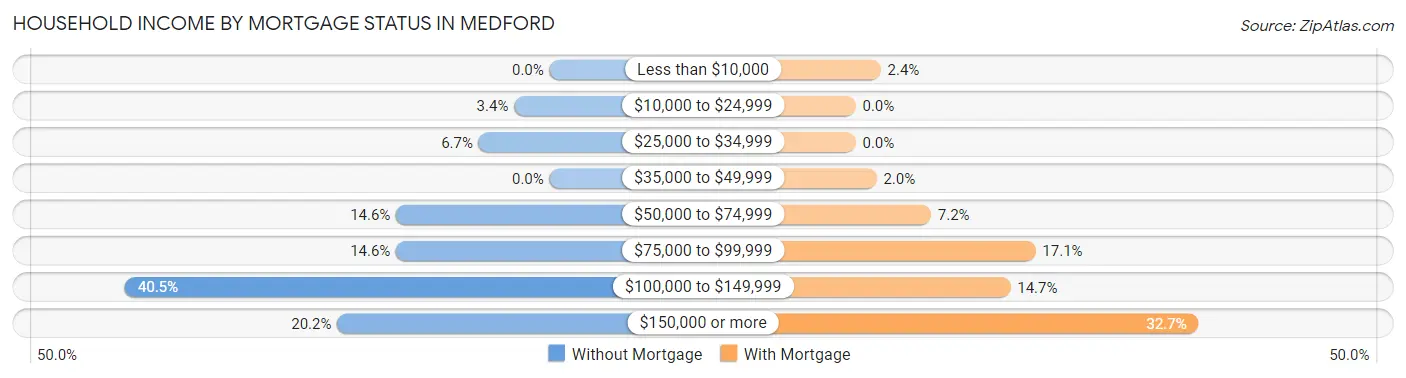
| Household Income | Without Mortgage | With Mortgage |
| Less than $10,000 | 0 (0.0%) | 6 (2.4%) |
| $10,000 to $24,999 | 3 (3.4%) | 0 (0.0%) |
| $25,000 to $34,999 | 6 (6.7%) | 0 (0.0%) |
| $35,000 to $49,999 | 0 (0.0%) | 5 (2.0%) |
| $50,000 to $74,999 | 13 (14.6%) | 18 (7.2%) |
| $75,000 to $99,999 | 13 (14.6%) | 43 (17.1%) |
| $100,000 to $149,999 | 36 (40.5%) | 37 (14.7%) |
| $150,000 or more | 18 (20.2%) | 82 (32.7%) |
| Total | 89 (100.0%) | 251 (100.0%) |
Property Value to Household Income Ratio in Medford
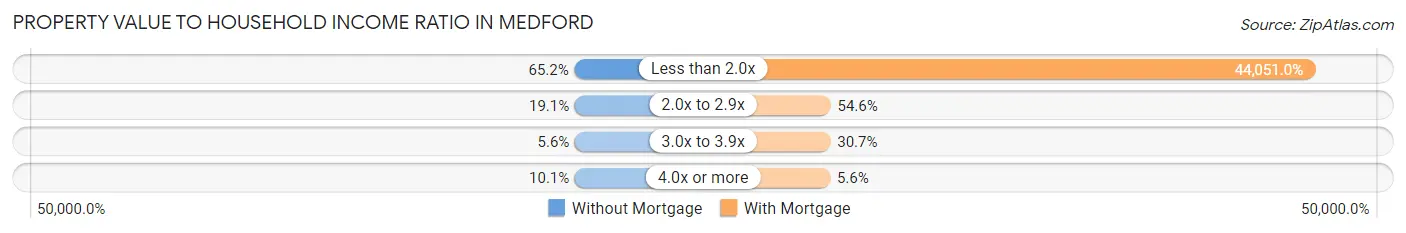
| Value-to-Income Ratio | Without Mortgage | With Mortgage |
| Less than 2.0x | 58 (65.2%) | 110,568 (44,051.0%) |
| 2.0x to 2.9x | 17 (19.1%) | 137 (54.6%) |
| 3.0x to 3.9x | 5 (5.6%) | 77 (30.7%) |
| 4.0x or more | 9 (10.1%) | 14 (5.6%) |
| Total | 89 (100.0%) | 251 (100.0%) |
Real Estate Taxes by Mortgage Status in Medford
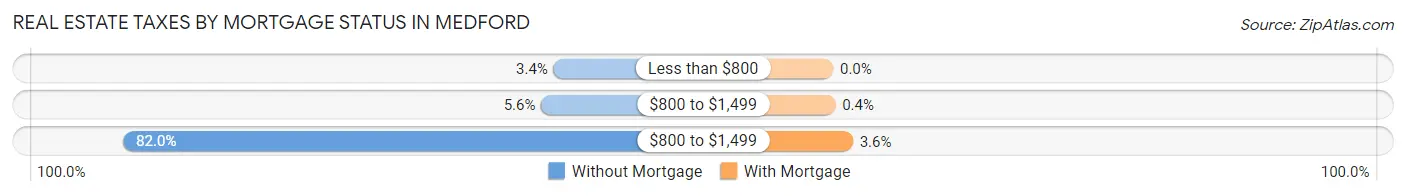
| Property Taxes | Without Mortgage | With Mortgage |
| Less than $800 | 3 (3.4%) | 0 (0.0%) |
| $800 to $1,499 | 5 (5.6%) | 1 (0.4%) |
| $800 to $1,499 | 73 (82.0%) | 9 (3.6%) |
| Total | 89 (100.0%) | 251 (100.0%) |
Health & Disability in Medford
Health Insurance Coverage by Age in Medford
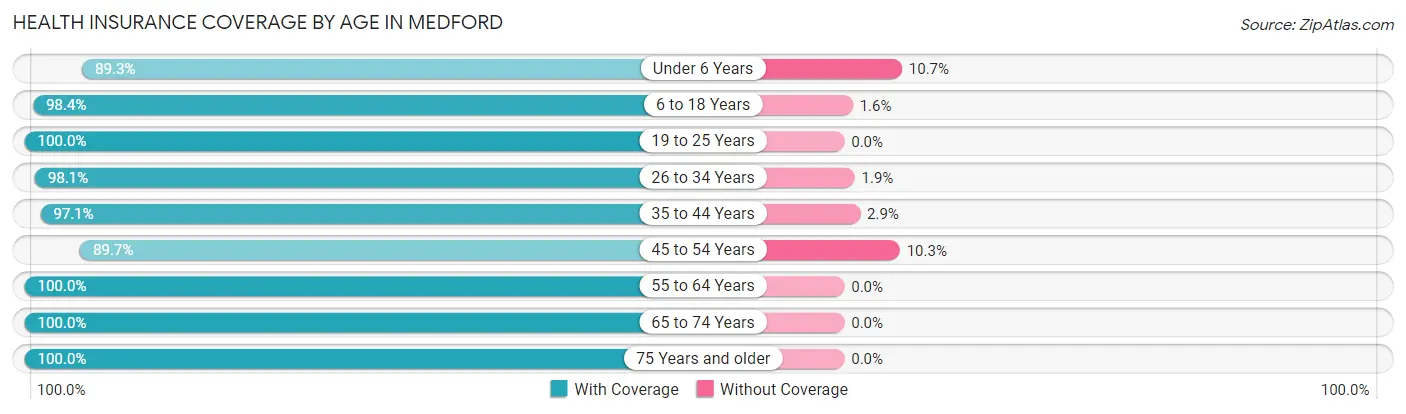
| Age Bracket | With Coverage | Without Coverage |
| Under 6 Years | 133 (89.3%) | 16 (10.7%) |
| 6 to 18 Years | 251 (98.4%) | 4 (1.6%) |
| 19 to 25 Years | 119 (100.0%) | 0 (0.0%) |
| 26 to 34 Years | 153 (98.1%) | 3 (1.9%) |
| 35 to 44 Years | 165 (97.1%) | 5 (2.9%) |
| 45 to 54 Years | 130 (89.7%) | 15 (10.3%) |
| 55 to 64 Years | 143 (100.0%) | 0 (0.0%) |
| 65 to 74 Years | 46 (100.0%) | 0 (0.0%) |
| 75 Years and older | 71 (100.0%) | 0 (0.0%) |
| Total | 1,211 (96.6%) | 43 (3.4%) |
Health Insurance Coverage by Citizenship Status in Medford
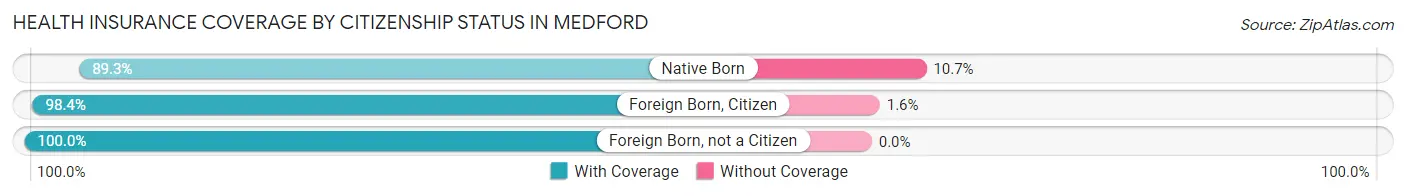
| Citizenship Status | With Coverage | Without Coverage |
| Native Born | 133 (89.3%) | 16 (10.7%) |
| Foreign Born, Citizen | 251 (98.4%) | 4 (1.6%) |
| Foreign Born, not a Citizen | 119 (100.0%) | 0 (0.0%) |
Health Insurance Coverage by Household Income in Medford
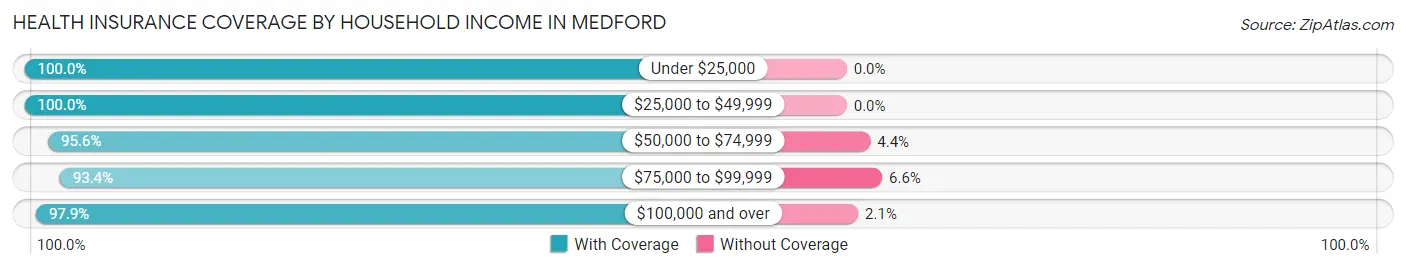
| Household Income | With Coverage | Without Coverage |
| Under $25,000 | 45 (100.0%) | 0 (0.0%) |
| $25,000 to $49,999 | 86 (100.0%) | 0 (0.0%) |
| $50,000 to $74,999 | 130 (95.6%) | 6 (4.4%) |
| $75,000 to $99,999 | 212 (93.4%) | 15 (6.6%) |
| $100,000 and over | 735 (97.9%) | 16 (2.1%) |
Public vs Private Health Insurance Coverage by Age in Medford
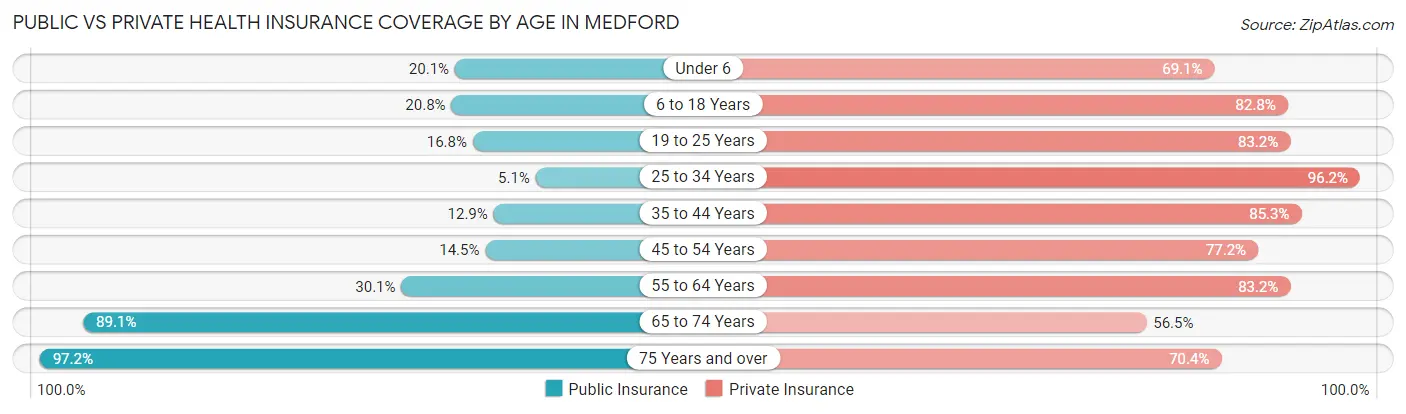
| Age Bracket | Public Insurance | Private Insurance |
| Under 6 | 30 (20.1%) | 103 (69.1%) |
| 6 to 18 Years | 53 (20.8%) | 211 (82.8%) |
| 19 to 25 Years | 20 (16.8%) | 99 (83.2%) |
| 25 to 34 Years | 8 (5.1%) | 150 (96.2%) |
| 35 to 44 Years | 22 (12.9%) | 145 (85.3%) |
| 45 to 54 Years | 21 (14.5%) | 112 (77.2%) |
| 55 to 64 Years | 43 (30.1%) | 119 (83.2%) |
| 65 to 74 Years | 41 (89.1%) | 26 (56.5%) |
| 75 Years and over | 69 (97.2%) | 50 (70.4%) |
| Total | 307 (24.5%) | 1,015 (80.9%) |
Disability Status by Sex by Age in Medford
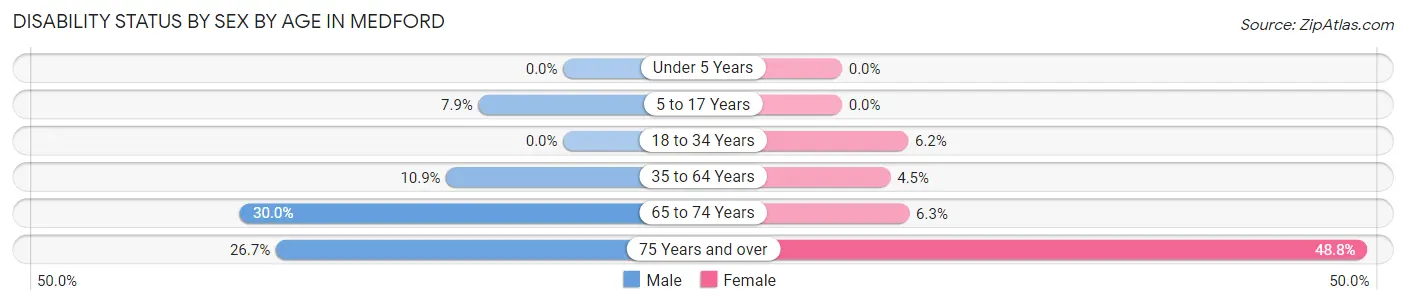
| Age Bracket | Male | Female |
| Under 5 Years | 0 (0.0%) | 0 (0.0%) |
| 5 to 17 Years | 11 (7.9%) | 0 (0.0%) |
| 18 to 34 Years | 0 (0.0%) | 11 (6.1%) |
| 35 to 64 Years | 28 (10.8%) | 9 (4.5%) |
| 65 to 74 Years | 9 (30.0%) | 1 (6.2%) |
| 75 Years and over | 8 (26.7%) | 20 (48.8%) |
Disability Class by Sex by Age in Medford
Disability Class: Hearing Difficulty
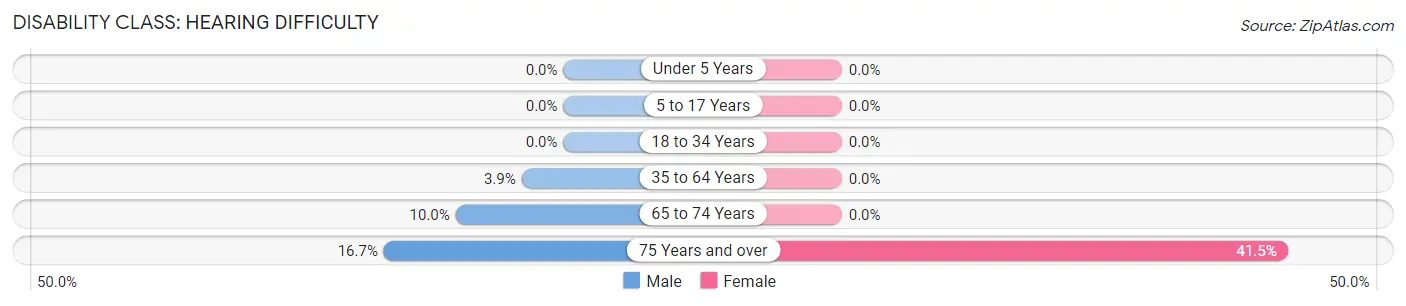
| Age Bracket | Male | Female |
| Under 5 Years | 0 (0.0%) | 0 (0.0%) |
| 5 to 17 Years | 0 (0.0%) | 0 (0.0%) |
| 18 to 34 Years | 0 (0.0%) | 0 (0.0%) |
| 35 to 64 Years | 10 (3.9%) | 0 (0.0%) |
| 65 to 74 Years | 3 (10.0%) | 0 (0.0%) |
| 75 Years and over | 5 (16.7%) | 17 (41.5%) |
Disability Class: Vision Difficulty
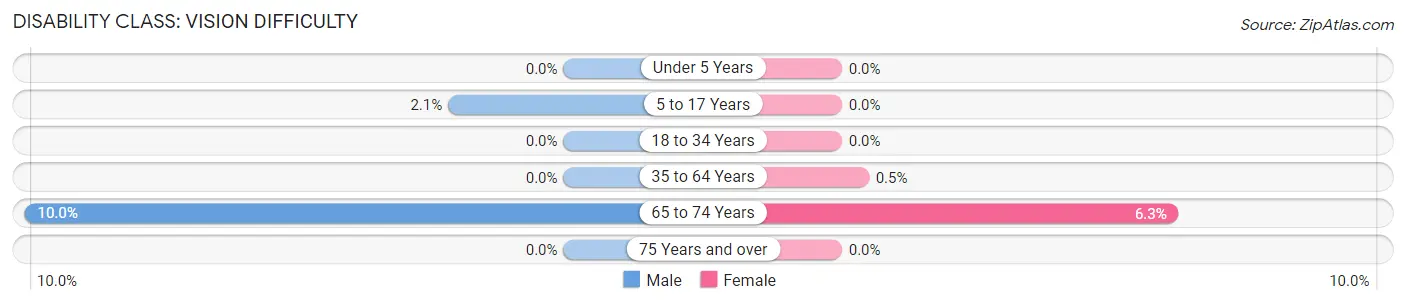
| Age Bracket | Male | Female |
| Under 5 Years | 0 (0.0%) | 0 (0.0%) |
| 5 to 17 Years | 3 (2.1%) | 0 (0.0%) |
| 18 to 34 Years | 0 (0.0%) | 0 (0.0%) |
| 35 to 64 Years | 0 (0.0%) | 1 (0.5%) |
| 65 to 74 Years | 3 (10.0%) | 1 (6.2%) |
| 75 Years and over | 0 (0.0%) | 0 (0.0%) |
Disability Class: Cognitive Difficulty
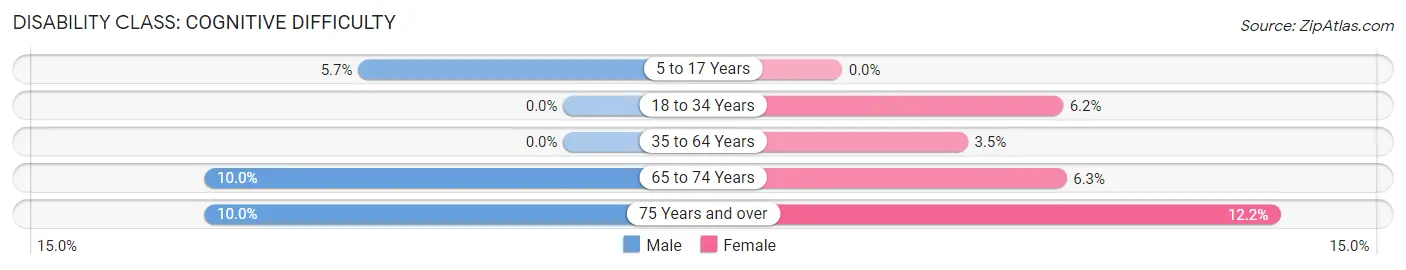
| Age Bracket | Male | Female |
| 5 to 17 Years | 8 (5.7%) | 0 (0.0%) |
| 18 to 34 Years | 0 (0.0%) | 11 (6.1%) |
| 35 to 64 Years | 0 (0.0%) | 7 (3.5%) |
| 65 to 74 Years | 3 (10.0%) | 1 (6.2%) |
| 75 Years and over | 3 (10.0%) | 5 (12.2%) |
Disability Class: Ambulatory Difficulty
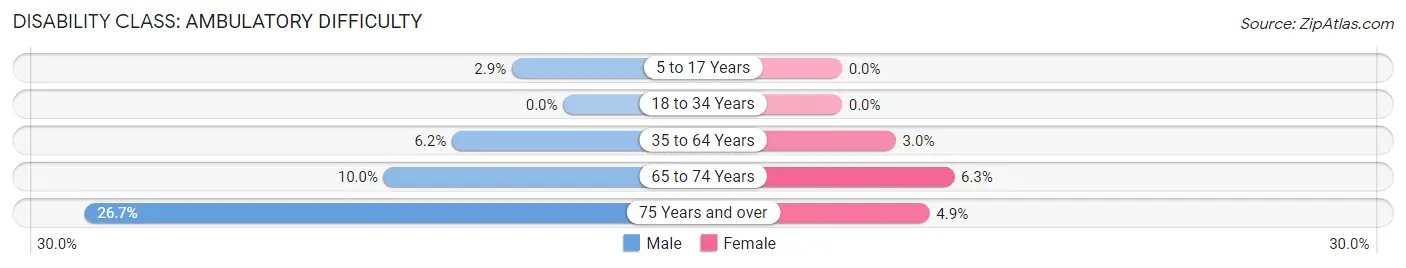
| Age Bracket | Male | Female |
| 5 to 17 Years | 4 (2.9%) | 0 (0.0%) |
| 18 to 34 Years | 0 (0.0%) | 0 (0.0%) |
| 35 to 64 Years | 16 (6.2%) | 6 (3.0%) |
| 65 to 74 Years | 3 (10.0%) | 1 (6.2%) |
| 75 Years and over | 8 (26.7%) | 2 (4.9%) |
Disability Class: Self-Care Difficulty
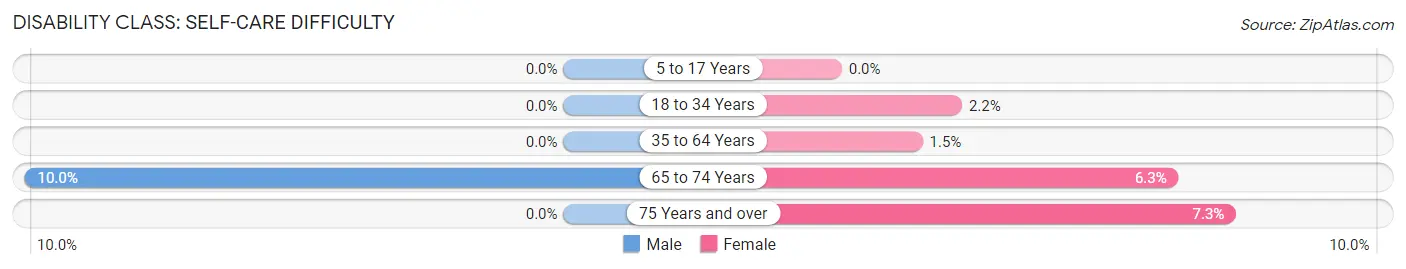
| Age Bracket | Male | Female |
| 5 to 17 Years | 0 (0.0%) | 0 (0.0%) |
| 18 to 34 Years | 0 (0.0%) | 4 (2.2%) |
| 35 to 64 Years | 0 (0.0%) | 3 (1.5%) |
| 65 to 74 Years | 3 (10.0%) | 1 (6.2%) |
| 75 Years and over | 0 (0.0%) | 3 (7.3%) |
Technology Access in Medford
Computing Device Access in Medford
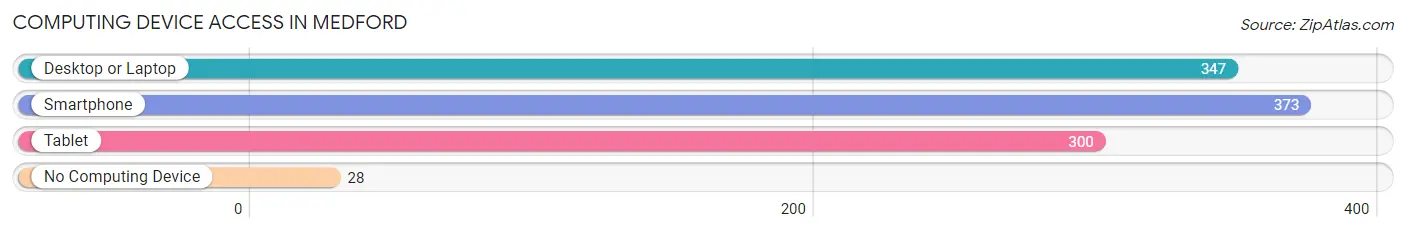
| Device Type | # Households | % Households |
| Desktop or Laptop | 347 | 78.9% |
| Smartphone | 373 | 84.8% |
| Tablet | 300 | 68.2% |
| No Computing Device | 28 | 6.4% |
| Total | 440 | 100.0% |
Internet Access in Medford
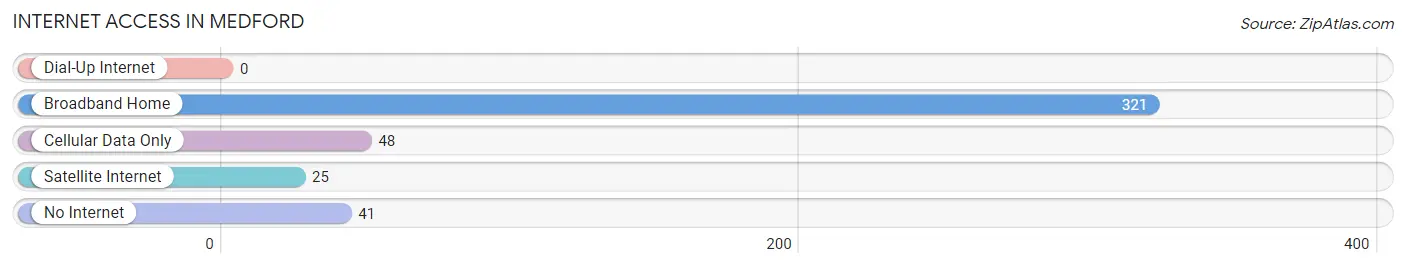
| Internet Type | # Households | % Households |
| Dial-Up Internet | 0 | 0.0% |
| Broadband Home | 321 | 73.0% |
| Cellular Data Only | 48 | 10.9% |
| Satellite Internet | 25 | 5.7% |
| No Internet | 41 | 9.3% |
| Total | 440 | 100.0% |
Medford Summary
Medford, Minnesota is a small city located in Steele County, in the southeastern part of the state. It is situated on the banks of the Straight River, and is part of the larger Mankato-North Mankato metropolitan area. The city has a population of approximately 2,500 people, and is known for its small-town charm and friendly atmosphere.
History
Medford was founded in 1856 by a group of settlers from New York. The city was named after Medford, Massachusetts, and was originally intended to be a farming community. The first settlers built a sawmill and a gristmill, and the town quickly grew. By the late 1800s, Medford had become a thriving community, with a variety of businesses, including a hotel, a bank, a newspaper, and a post office.
In the early 1900s, Medford experienced a period of growth and prosperity. The city was home to several factories, including a flour mill, a creamery, and a canning factory. The city also had a thriving agricultural industry, with many farmers growing wheat, corn, and other crops.
Geography
Medford is located in Steele County, in the southeastern part of Minnesota. The city is situated on the banks of the Straight River, and is part of the larger Mankato-North Mankato metropolitan area. The city has a total area of 1.3 square miles, all of which is land.
The city is located in a region of rolling hills and prairies, and is surrounded by farmland. The Straight River runs through the city, and is a popular spot for fishing and canoeing. The city is also home to several parks, including Medford Park, which features a playground, picnic areas, and a walking trail.
Economy
Medford’s economy is largely based on agriculture and manufacturing. The city is home to several factories, including a flour mill, a creamery, and a canning factory. The city also has a thriving agricultural industry, with many farmers growing wheat, corn, and other crops.
The city is also home to several small businesses, including restaurants, shops, and service providers. The city is also home to a number of medical facilities, including a hospital and several clinics.
Demographics
As of the 2010 census, Medford had a population of 2,500 people. The racial makeup of the city was 97.2% White, 0.8% African American, 0.4% Native American, 0.4% Asian, and 0.2% from other races. Hispanic or Latino of any race were 1.2% of the population.
The median household income in Medford was $45,000, and the median family income was $50,000. The per capita income in the city was $20,000. About 8.5% of families and 10.2% of the population were below the poverty line.
Medford is a small city with a friendly atmosphere and a strong sense of community. The city is home to a variety of businesses, and is surrounded by farmland and rolling hills. The city is also home to several parks and recreational areas, making it a great place to live and work.
Common Questions
What is Per Capita Income in Medford?
Per Capita income in Medford is $38,652.
What is the Median Family Income in Medford?
Median Family Income in Medford is $111,364.
What is the Median Household income in Medford?
Median Household Income in Medford is $98,036.
What is Income or Wage Gap in Medford?
Income or Wage Gap in Medford is 27.5%.
Women in Medford earn 72.5 cents for every dollar earned by a man.
What is Inequality or Gini Index in Medford?
Inequality or Gini Index in Medford is 0.34.
What is the Total Population of Medford?
Total Population of Medford is 1,258.
What is the Total Male Population of Medford?
Total Male Population of Medford is 655.
What is the Total Female Population of Medford?
Total Female Population of Medford is 603.
What is the Ratio of Males per 100 Females in Medford?
There are 108.62 Males per 100 Females in Medford.
What is the Ratio of Females per 100 Males in Medford?
There are 92.06 Females per 100 Males in Medford.
What is the Median Population Age in Medford?
Median Population Age in Medford is 31.4 Years.
What is the Average Family Size in Medford
Average Family Size in Medford is 3.3 People.
What is the Average Household Size in Medford
Average Household Size in Medford is 2.8 People.
How Large is the Labor Force in Medford?
There are 709 People in the Labor Forcein in Medford.
What is the Percentage of People in the Labor Force in Medford?
77.5% of People are in the Labor Force in Medford.
What is the Unemployment Rate in Medford?
Unemployment Rate in Medford is 4.8%.