Zip Codes with the Highest Percentage of Population Employed in Health Care & Social Assistance in Bowling Green, KY
RELATED REPORTS & OPTIONS
Health Care & Social Assistance
Bowling Green
Compare Zip Codes
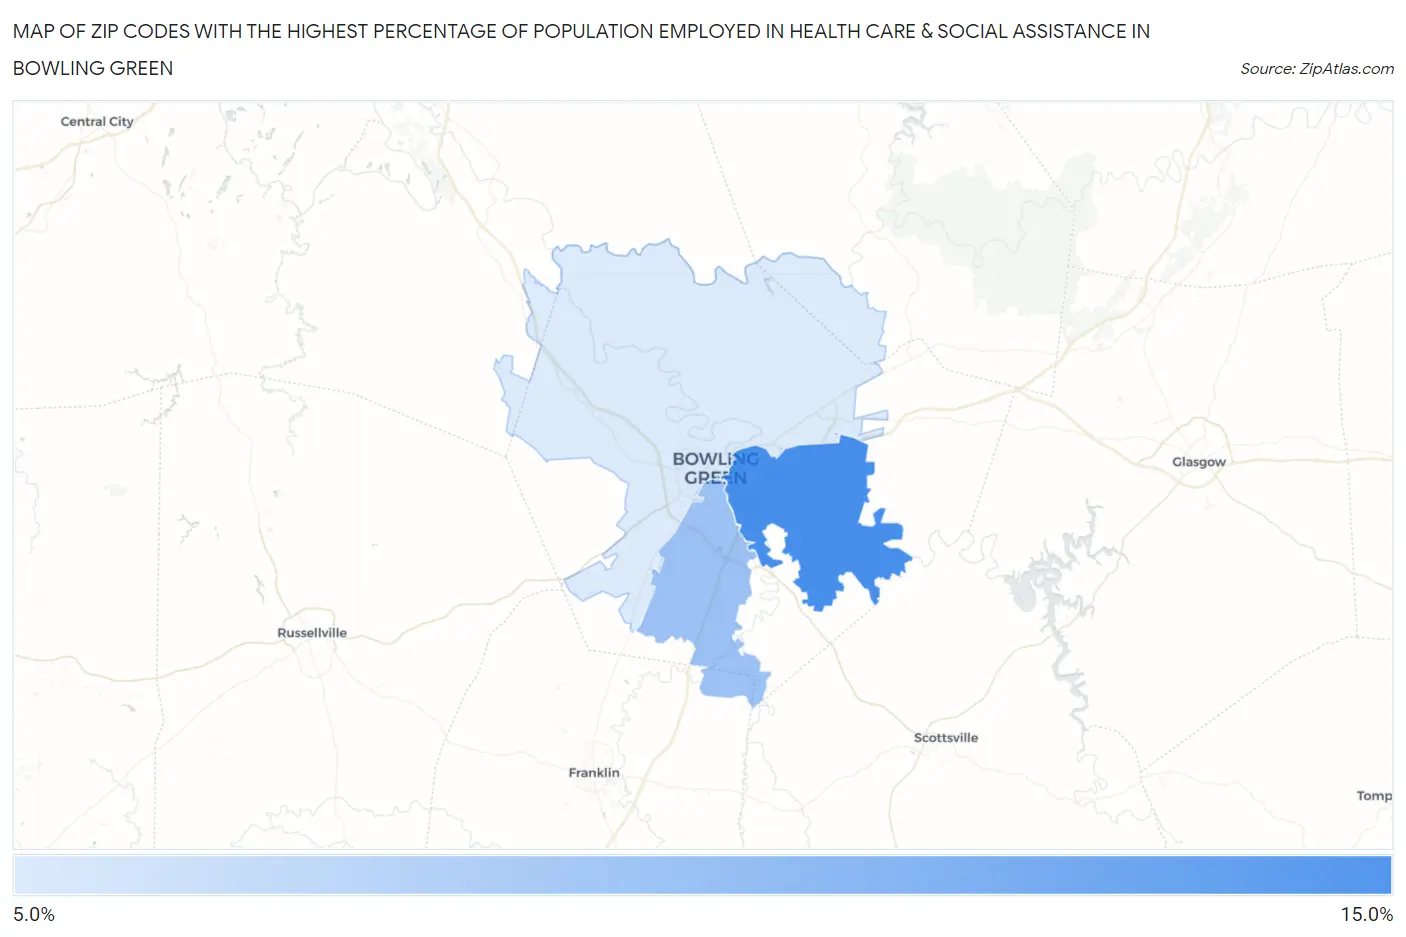
Map of Zip Codes with the Highest Percentage of Population Employed in Health Care & Social Assistance in Bowling Green
12.1%
13.5%
Zip Codes with the Highest Percentage of Population Employed in Health Care & Social Assistance in Bowling Green, KY
| Zip Code | % Employed | vs State | vs National | |
| 1. | 42103 | 13.5% | 14.4%(-0.991)#385 | 13.9%(-0.483)#15,397 |
| 2. | 42104 | 12.7% | 14.4%(-1.74)#420 | 13.9%(-1.24)#17,349 |
| 3. | 42101 | 12.1% | 14.4%(-2.36)#443 | 13.9%(-1.85)#18,828 |
1
Common Questions
What are the Top Zip Codes with the Highest Percentage of Population Employed in Health Care & Social Assistance in Bowling Green, KY?
Top Zip Codes with the Highest Percentage of Population Employed in Health Care & Social Assistance in Bowling Green, KY are:
What zip code has the Highest Percentage of Population Employed in Health Care & Social Assistance in Bowling Green, KY?
42103 has the Highest Percentage of Population Employed in Health Care & Social Assistance in Bowling Green, KY with 13.5%.
What is the Percentage of Population Employed in Health Care & Social Assistance in Bowling Green, KY?
Percentage of Population Employed in Health Care & Social Assistance in Bowling Green is 12.0%.
What is the Percentage of Population Employed in Health Care & Social Assistance in Kentucky?
Percentage of Population Employed in Health Care & Social Assistance in Kentucky is 14.4%.
What is the Percentage of Population Employed in Health Care & Social Assistance in the United States?
Percentage of Population Employed in Health Care & Social Assistance in the United States is 13.9%.