Zip Codes with the Highest Percentage of Population Employed in Office & Administration in Columbus, IN
RELATED REPORTS & OPTIONS
Office & Administration
Columbus
Compare Zip Codes
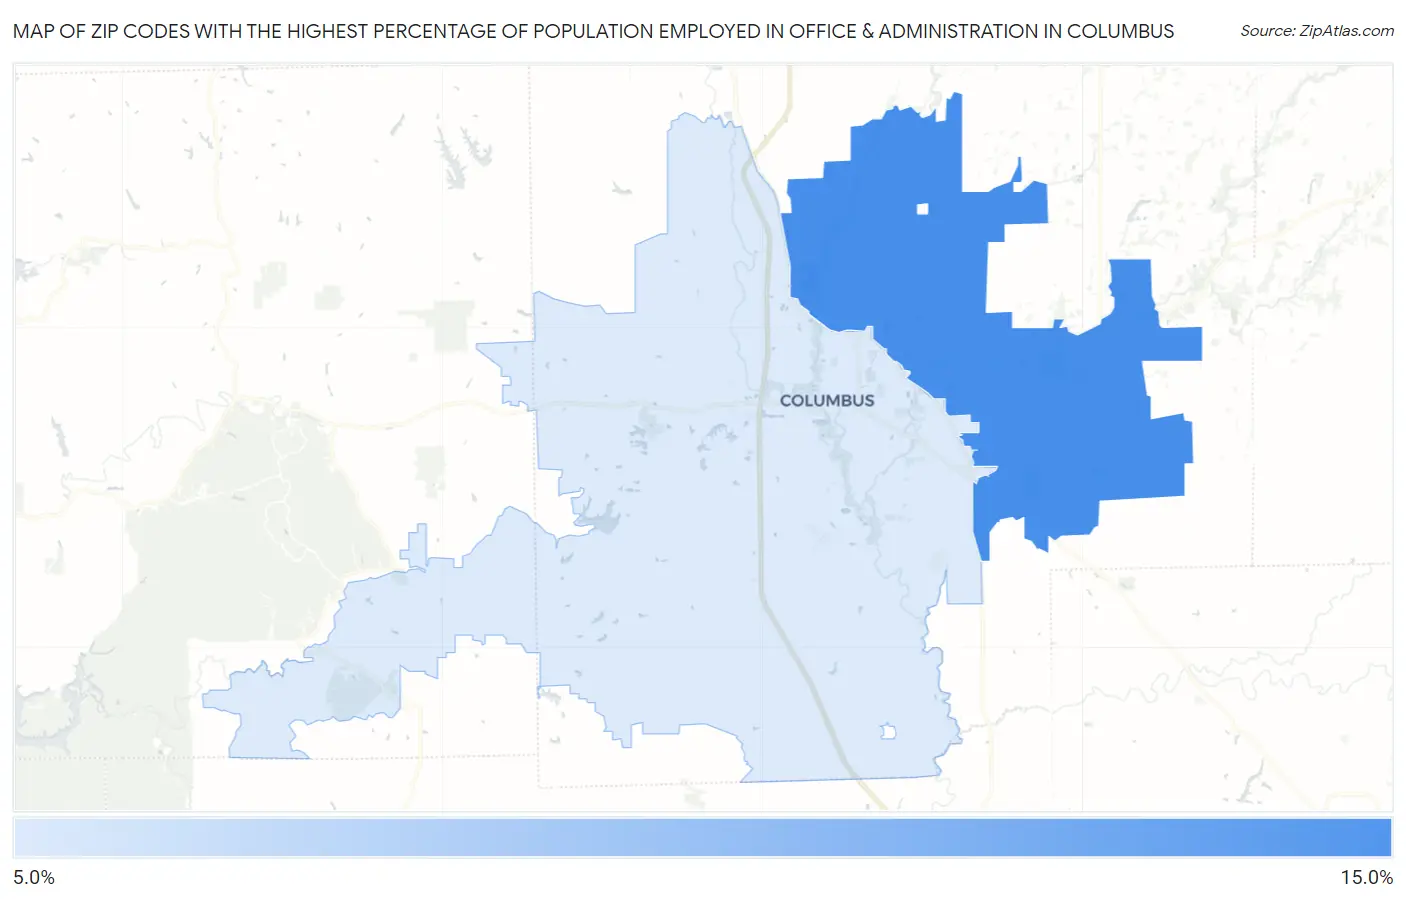
Map of Zip Codes with the Highest Percentage of Population Employed in Office & Administration in Columbus
8.9%
12.7%
Zip Codes with the Highest Percentage of Population Employed in Office & Administration in Columbus, IN
| Zip Code | % Employed | vs State | vs National | |
| 1. | 47203 | 12.7% | 11.0%(+1.74)#179 | 10.9%(+1.87)#8,711 |
| 2. | 47201 | 8.9% | 11.0%(-2.12)#489 | 10.9%(-1.99)#20,639 |
1
Common Questions
What are the Top Zip Codes with the Highest Percentage of Population Employed in Office & Administration in Columbus, IN?
Top Zip Codes with the Highest Percentage of Population Employed in Office & Administration in Columbus, IN are:
What zip code has the Highest Percentage of Population Employed in Office & Administration in Columbus, IN?
47203 has the Highest Percentage of Population Employed in Office & Administration in Columbus, IN with 12.7%.
What is the Percentage of Population Employed in Office & Administration in Columbus, IN?
Percentage of Population Employed in Office & Administration in Columbus is 10.4%.
What is the Percentage of Population Employed in Office & Administration in Indiana?
Percentage of Population Employed in Office & Administration in Indiana is 11.0%.
What is the Percentage of Population Employed in Office & Administration in the United States?
Percentage of Population Employed in Office & Administration in the United States is 10.9%.