Zip Codes with the Highest Percentage of Population Employed in Office & Administration in Fishers, IN
RELATED REPORTS & OPTIONS
Office & Administration
Fishers
Compare Zip Codes
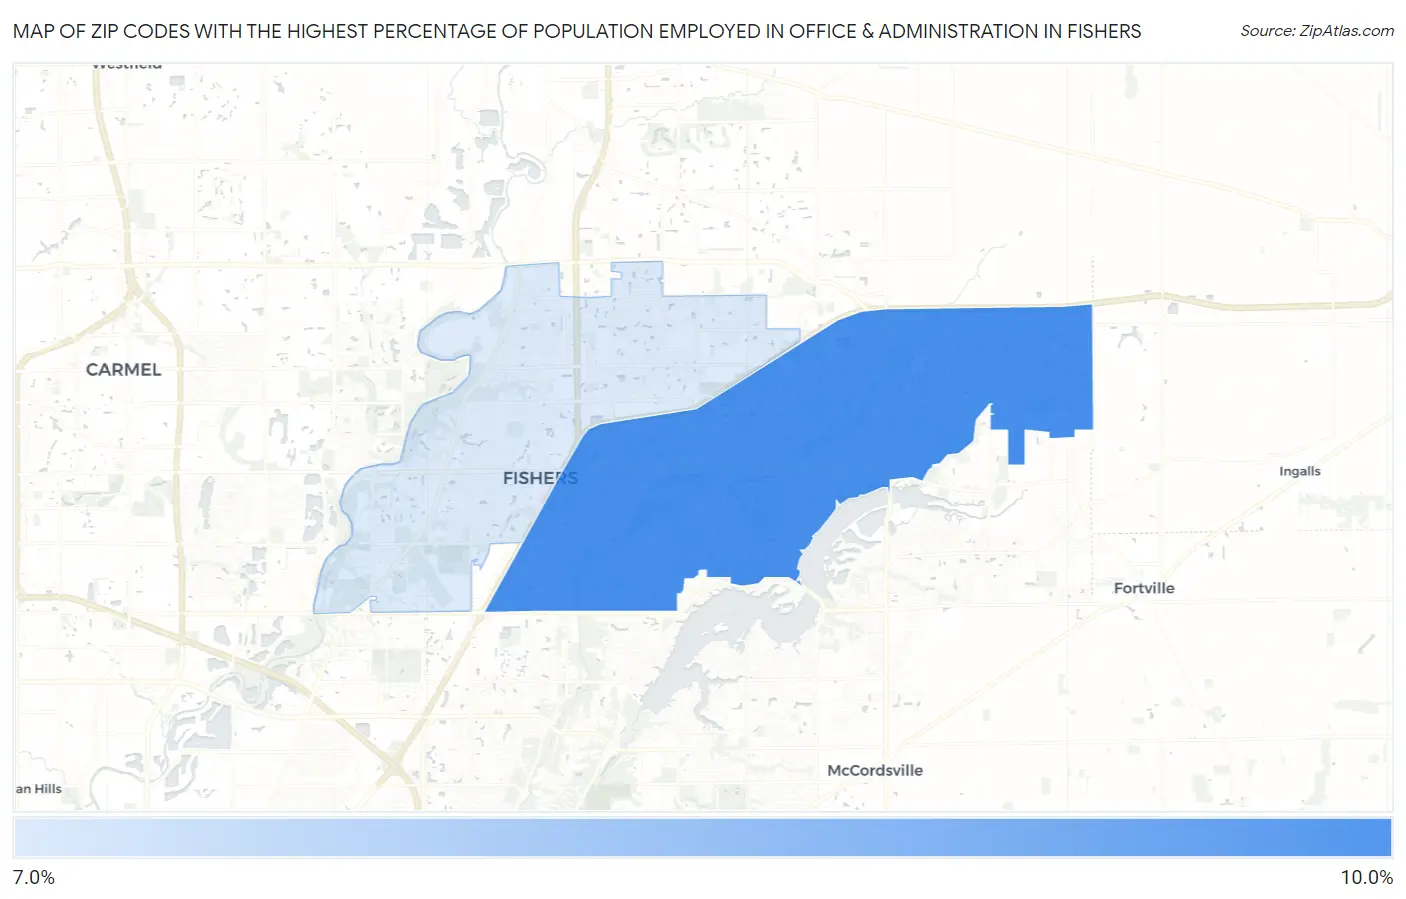
Map of Zip Codes with the Highest Percentage of Population Employed in Office & Administration in Fishers
7.5%
8.1%
Zip Codes with the Highest Percentage of Population Employed in Office & Administration in Fishers, IN
| Zip Code | % Employed | vs State | vs National | |
| 1. | 46037 | 8.1% | 11.0%(-2.91)#542 | 10.9%(-2.78)#22,840 |
| 2. | 46038 | 7.5% | 11.0%(-3.47)#575 | 10.9%(-3.34)#24,116 |
1
Common Questions
What are the Top Zip Codes with the Highest Percentage of Population Employed in Office & Administration in Fishers, IN?
Top Zip Codes with the Highest Percentage of Population Employed in Office & Administration in Fishers, IN are:
What zip code has the Highest Percentage of Population Employed in Office & Administration in Fishers, IN?
46037 has the Highest Percentage of Population Employed in Office & Administration in Fishers, IN with 8.1%.
What is the Percentage of Population Employed in Office & Administration in Fishers, IN?
Percentage of Population Employed in Office & Administration in Fishers is 7.7%.
What is the Percentage of Population Employed in Office & Administration in Indiana?
Percentage of Population Employed in Office & Administration in Indiana is 11.0%.
What is the Percentage of Population Employed in Office & Administration in the United States?
Percentage of Population Employed in Office & Administration in the United States is 10.9%.