Zip Codes with the Highest Percentage of Population Employed in Farming, Fishing & Forestry in Indiana
RELATED REPORTS & OPTIONS
Farming, Fishing & Forestry
Indiana
Compare Zip Codes
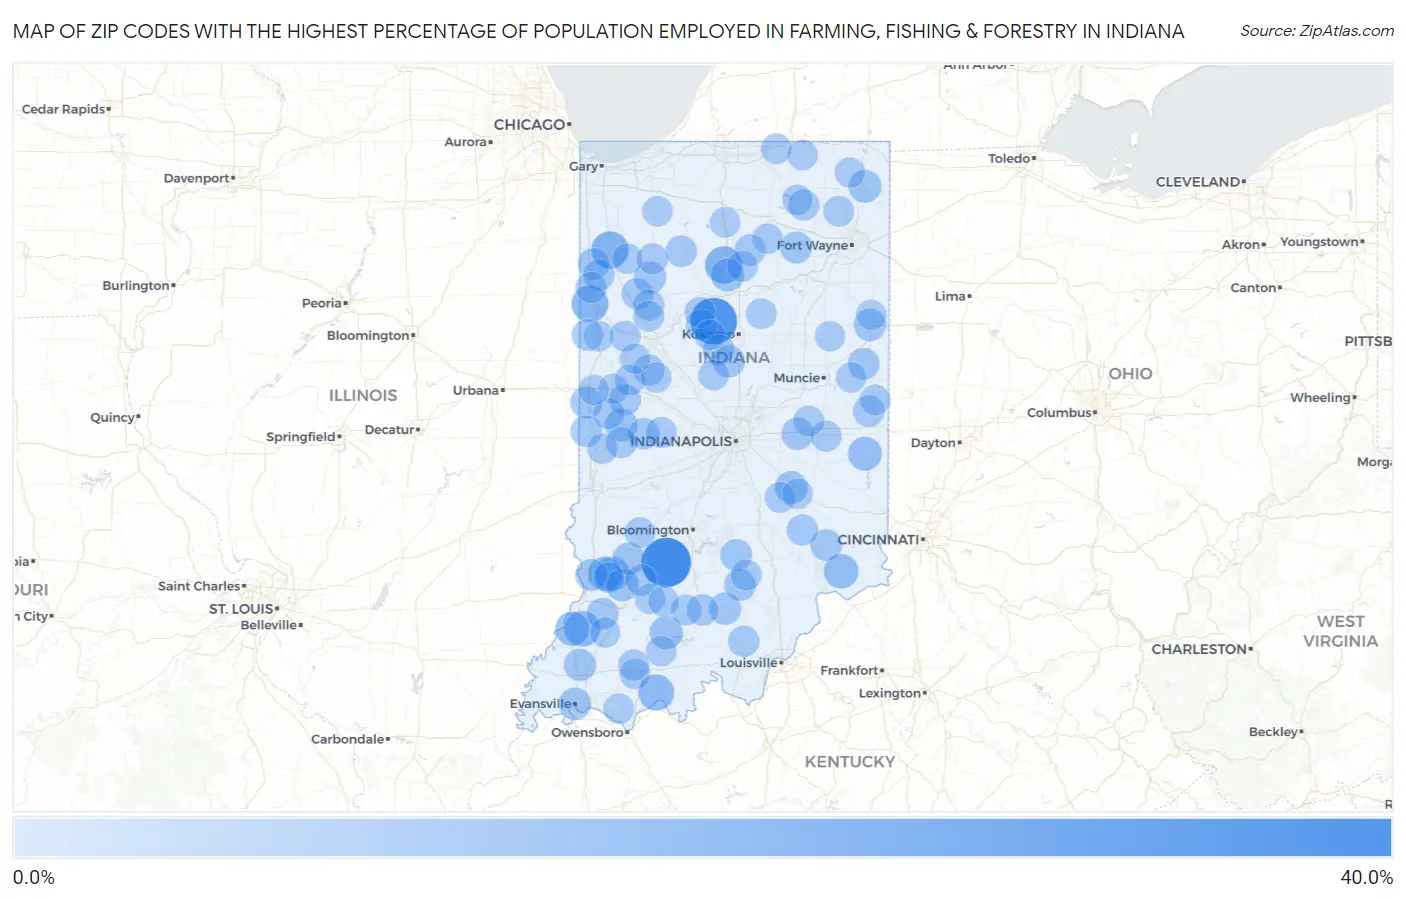
Map of Zip Codes with the Highest Percentage of Population Employed in Farming, Fishing & Forestry in Indiana
0.0%
40.0%
Zip Codes with the Highest Percentage of Population Employed in Farming, Fishing & Forestry in Indiana
| Zip Code | % Employed | vs State | vs National | |
| 1. | 47453 | 36.5% | 0.39%(+36.1)#1 | 0.61%(+35.9)#126 |
| 2. | 46998 | 31.3% | 0.39%(+31.0)#2 | 0.61%(+30.7)#178 |
| 3. | 46931 | 14.5% | 0.39%(+14.1)#3 | 0.61%(+13.9)#682 |
| 4. | 47943 | 14.1% | 0.39%(+13.7)#4 | 0.61%(+13.5)#712 |
| 5. | 47942 | 13.5% | 0.39%(+13.1)#5 | 0.61%(+12.9)#773 |
| 6. | 47531 | 11.8% | 0.39%(+11.4)#6 | 0.61%(+11.2)#949 |
| 7. | 47640 | 11.4% | 0.39%(+11.0)#7 | 0.61%(+10.8)#1,003 |
| 8. | 47224 | 9.3% | 0.39%(+8.89)#8 | 0.61%(+8.67)#1,342 |
| 9. | 47596 | 9.0% | 0.39%(+8.59)#9 | 0.61%(+8.37)#1,412 |
| 10. | 47524 | 8.9% | 0.39%(+8.48)#10 | 0.61%(+8.26)#1,436 |
| 11. | 47535 | 8.7% | 0.39%(+8.29)#11 | 0.61%(+8.07)#1,484 |
| 12. | 47325 | 8.2% | 0.39%(+7.82)#12 | 0.61%(+7.60)#1,605 |
| 13. | 47527 | 7.3% | 0.39%(+6.87)#13 | 0.61%(+6.65)#1,890 |
| 14. | 46988 | 6.9% | 0.39%(+6.51)#14 | 0.61%(+6.29)#2,021 |
| 15. | 46793 | 6.6% | 0.39%(+6.18)#15 | 0.61%(+5.96)#2,140 |
| 16. | 46182 | 6.3% | 0.39%(+5.95)#16 | 0.61%(+5.73)#2,223 |
| 17. | 47859 | 6.2% | 0.39%(+5.84)#17 | 0.61%(+5.62)#2,282 |
| 18. | 47568 | 6.2% | 0.39%(+5.78)#18 | 0.61%(+5.56)#2,312 |
| 19. | 46117 | 5.7% | 0.39%(+5.34)#19 | 0.61%(+5.12)#2,537 |
| 20. | 46049 | 5.6% | 0.39%(+5.23)#20 | 0.61%(+5.01)#2,587 |
| 21. | 47959 | 5.5% | 0.39%(+5.07)#21 | 0.61%(+4.85)#2,673 |
| 22. | 47326 | 5.4% | 0.39%(+5.06)#22 | 0.61%(+4.84)#2,680 |
| 23. | 47108 | 5.4% | 0.39%(+5.05)#23 | 0.61%(+4.83)#2,690 |
| 24. | 47443 | 5.4% | 0.39%(+5.04)#24 | 0.61%(+4.82)#2,691 |
| 25. | 47648 | 5.1% | 0.39%(+4.76)#25 | 0.61%(+4.54)#2,835 |
| 26. | 47708 | 5.1% | 0.39%(+4.72)#26 | 0.61%(+4.50)#2,860 |
| 27. | 46787 | 5.0% | 0.39%(+4.65)#27 | 0.61%(+4.43)#2,907 |
| 28. | 47974 | 4.8% | 0.39%(+4.42)#28 | 0.61%(+4.20)#3,072 |
| 29. | 47281 | 4.7% | 0.39%(+4.28)#29 | 0.61%(+4.06)#3,176 |
| 30. | 47561 | 4.5% | 0.39%(+4.11)#30 | 0.61%(+3.89)#3,305 |
| 31. | 47235 | 4.5% | 0.39%(+4.08)#31 | 0.61%(+3.86)#3,324 |
| 32. | 47380 | 4.4% | 0.39%(+4.06)#32 | 0.61%(+3.84)#3,357 |
| 33. | 47557 | 4.3% | 0.39%(+3.90)#33 | 0.61%(+3.68)#3,471 |
| 34. | 47847 | 4.2% | 0.39%(+3.86)#34 | 0.61%(+3.64)#3,503 |
| 35. | 47023 | 4.2% | 0.39%(+3.85)#35 | 0.61%(+3.63)#3,515 |
| 36. | 47995 | 4.2% | 0.39%(+3.78)#36 | 0.61%(+3.56)#3,575 |
| 37. | 46039 | 4.1% | 0.39%(+3.76)#37 | 0.61%(+3.54)#3,585 |
| 38. | 47963 | 4.1% | 0.39%(+3.73)#38 | 0.61%(+3.51)#3,612 |
| 39. | 47949 | 4.1% | 0.39%(+3.73)#39 | 0.61%(+3.51)#3,613 |
| 40. | 47917 | 4.1% | 0.39%(+3.72)#40 | 0.61%(+3.50)#3,629 |
| 41. | 47922 | 4.0% | 0.39%(+3.66)#41 | 0.61%(+3.44)#3,679 |
| 42. | 47393 | 4.0% | 0.39%(+3.66)#42 | 0.61%(+3.44)#3,684 |
| 43. | 46996 | 4.0% | 0.39%(+3.61)#43 | 0.61%(+3.39)#3,721 |
| 44. | 46910 | 3.9% | 0.39%(+3.47)#44 | 0.61%(+3.25)#3,850 |
| 45. | 47452 | 3.8% | 0.39%(+3.45)#45 | 0.61%(+3.23)#3,871 |
| 46. | 47562 | 3.8% | 0.39%(+3.45)#46 | 0.61%(+3.23)#3,872 |
| 47. | 47283 | 3.8% | 0.39%(+3.41)#47 | 0.61%(+3.19)#3,907 |
| 48. | 46175 | 3.7% | 0.39%(+3.35)#48 | 0.61%(+3.13)#3,963 |
| 49. | 47164 | 3.7% | 0.39%(+3.28)#49 | 0.61%(+3.06)#4,034 |
| 50. | 47951 | 3.6% | 0.39%(+3.21)#50 | 0.61%(+2.99)#4,104 |
| 51. | 47981 | 3.6% | 0.39%(+3.19)#51 | 0.61%(+2.97)#4,118 |
| 52. | 46760 | 3.5% | 0.39%(+3.11)#52 | 0.61%(+2.89)#4,206 |
| 53. | 47929 | 3.4% | 0.39%(+3.01)#53 | 0.61%(+2.79)#4,332 |
| 54. | 47952 | 3.3% | 0.39%(+2.95)#54 | 0.61%(+2.73)#4,406 |
| 55. | 47872 | 3.3% | 0.39%(+2.95)#55 | 0.61%(+2.73)#4,410 |
| 56. | 47541 | 3.2% | 0.39%(+2.81)#56 | 0.61%(+2.59)#4,556 |
| 57. | 46929 | 3.2% | 0.39%(+2.78)#57 | 0.61%(+2.56)#4,605 |
| 58. | 47352 | 3.1% | 0.39%(+2.68)#58 | 0.61%(+2.46)#4,729 |
| 59. | 47946 | 3.0% | 0.39%(+2.62)#59 | 0.61%(+2.40)#4,799 |
| 60. | 46172 | 3.0% | 0.39%(+2.60)#60 | 0.61%(+2.38)#4,838 |
| 61. | 47923 | 3.0% | 0.39%(+2.59)#61 | 0.61%(+2.37)#4,847 |
| 62. | 47469 | 2.9% | 0.39%(+2.56)#62 | 0.61%(+2.34)#4,890 |
| 63. | 46763 | 2.9% | 0.39%(+2.53)#63 | 0.61%(+2.31)#4,934 |
| 64. | 47220 | 2.9% | 0.39%(+2.49)#64 | 0.61%(+2.26)#4,993 |
| 65. | 46917 | 2.8% | 0.39%(+2.46)#65 | 0.61%(+2.24)#5,036 |
| 66. | 46951 | 2.8% | 0.39%(+2.36)#66 | 0.61%(+2.14)#5,177 |
| 67. | 47351 | 2.7% | 0.39%(+2.29)#67 | 0.61%(+2.07)#5,281 |
| 68. | 47994 | 2.6% | 0.39%(+2.25)#68 | 0.61%(+2.03)#5,345 |
| 69. | 47355 | 2.6% | 0.39%(+2.20)#69 | 0.61%(+1.98)#5,405 |
| 70. | 47553 | 2.6% | 0.39%(+2.17)#70 | 0.61%(+1.95)#5,465 |
| 71. | 47523 | 2.5% | 0.39%(+2.16)#71 | 0.61%(+1.94)#5,479 |
| 72. | 46050 | 2.5% | 0.39%(+2.14)#72 | 0.61%(+1.92)#5,506 |
| 73. | 47234 | 2.5% | 0.39%(+2.12)#73 | 0.61%(+1.90)#5,535 |
| 74. | 47970 | 2.5% | 0.39%(+2.09)#74 | 0.61%(+1.87)#5,580 |
| 75. | 46911 | 2.5% | 0.39%(+2.09)#75 | 0.61%(+1.87)#5,594 |
| 76. | 46510 | 2.5% | 0.39%(+2.09)#76 | 0.61%(+1.86)#5,598 |
| 77. | 46507 | 2.5% | 0.39%(+2.08)#77 | 0.61%(+1.86)#5,602 |
| 78. | 46565 | 2.4% | 0.39%(+2.06)#78 | 0.61%(+1.84)#5,629 |
| 79. | 46732 | 2.4% | 0.39%(+2.04)#79 | 0.61%(+1.82)#5,672 |
| 80. | 47978 | 2.4% | 0.39%(+2.01)#80 | 0.61%(+1.79)#5,734 |
| 81. | 47955 | 2.4% | 0.39%(+2.00)#81 | 0.61%(+1.78)#5,743 |
| 82. | 47471 | 2.4% | 0.39%(+2.00)#82 | 0.61%(+1.78)#5,745 |
| 83. | 46348 | 2.4% | 0.39%(+1.98)#83 | 0.61%(+1.76)#5,795 |
| 84. | 47581 | 2.4% | 0.39%(+1.97)#84 | 0.61%(+1.75)#5,811 |
| 85. | 47634 | 2.4% | 0.39%(+1.97)#85 | 0.61%(+1.75)#5,813 |
| 86. | 46501 | 2.3% | 0.39%(+1.90)#86 | 0.61%(+1.68)#5,936 |
| 87. | 47992 | 2.3% | 0.39%(+1.89)#87 | 0.61%(+1.67)#5,962 |
| 88. | 47272 | 2.3% | 0.39%(+1.87)#88 | 0.61%(+1.65)#6,019 |
| 89. | 47575 | 2.2% | 0.39%(+1.85)#89 | 0.61%(+1.63)#6,065 |
| 90. | 47528 | 2.2% | 0.39%(+1.80)#90 | 0.61%(+1.58)#6,161 |
| 91. | 47921 | 2.2% | 0.39%(+1.79)#91 | 0.61%(+1.57)#6,182 |
| 92. | 46740 | 2.2% | 0.39%(+1.78)#92 | 0.61%(+1.56)#6,192 |
| 93. | 47340 | 2.2% | 0.39%(+1.77)#93 | 0.61%(+1.55)#6,215 |
| 94. | 46747 | 2.1% | 0.39%(+1.68)#94 | 0.61%(+1.46)#6,392 |
| 95. | 47860 | 2.0% | 0.39%(+1.66)#95 | 0.61%(+1.44)#6,459 |
| 96. | 47987 | 2.0% | 0.39%(+1.64)#96 | 0.61%(+1.42)#6,495 |
| 97. | 47567 | 2.0% | 0.39%(+1.64)#97 | 0.61%(+1.42)#6,504 |
| 98. | 47932 | 2.0% | 0.39%(+1.63)#98 | 0.61%(+1.41)#6,521 |
| 99. | 46915 | 2.0% | 0.39%(+1.62)#99 | 0.61%(+1.40)#6,552 |
| 100. | 47348 | 2.0% | 0.39%(+1.60)#100 | 0.61%(+1.38)#6,587 |
Common Questions
What are the Top 10 Zip Codes with the Highest Percentage of Population Employed in Farming, Fishing & Forestry in Indiana?
Top 10 Zip Codes with the Highest Percentage of Population Employed in Farming, Fishing & Forestry in Indiana are:
What zip code has the Highest Percentage of Population Employed in Farming, Fishing & Forestry in Indiana?
47453 has the Highest Percentage of Population Employed in Farming, Fishing & Forestry in Indiana with 36.5%.
What is the Percentage of Population Employed in Farming, Fishing & Forestry in the State of Indiana?
Percentage of Population Employed in Farming, Fishing & Forestry in Indiana is 0.39%.
What is the Percentage of Population Employed in Farming, Fishing & Forestry in the United States?
Percentage of Population Employed in Farming, Fishing & Forestry in the United States is 0.61%.