Zip Codes with the Highest Percentage of Population Employed in Real Estate, Rental & Leasing in Iowa
RELATED REPORTS & OPTIONS
Real Estate, Rental & Leasing
Iowa
Compare Zip Codes
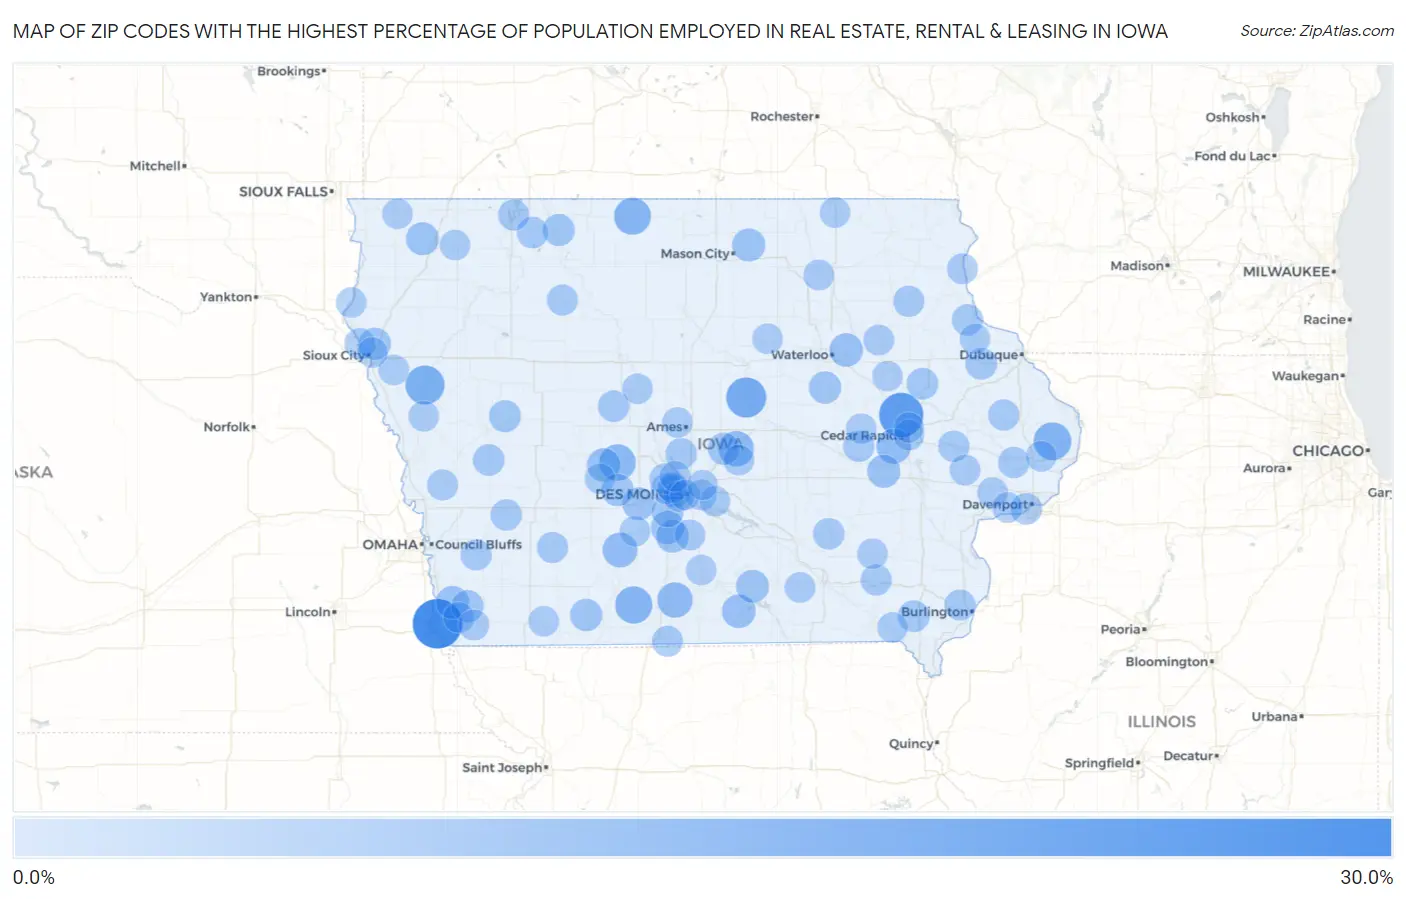
Map of Zip Codes with the Highest Percentage of Population Employed in Real Estate, Rental & Leasing in Iowa
0.0%
30.0%
Zip Codes with the Highest Percentage of Population Employed in Real Estate, Rental & Leasing in Iowa
| Zip Code | % Employed | vs State | vs National | |
| 1. | 51648 | 28.4% | 1.1%(+27.3)#1 | 1.9%(+26.6)#51 |
| 2. | 52341 | 21.0% | 1.1%(+19.8)#2 | 1.9%(+19.1)#101 |
| 3. | 50258 | 15.1% | 1.1%(+13.9)#3 | 1.9%(+13.2)#170 |
| 4. | 51044 | 13.9% | 1.1%(+12.8)#4 | 1.9%(+12.0)#204 |
| 5. | 52750 | 11.9% | 1.1%(+10.7)#5 | 1.9%(+9.96)#271 |
| 6. | 50074 | 11.2% | 1.1%(+10.1)#6 | 1.9%(+9.34)#296 |
| 7. | 50451 | 10.8% | 1.1%(+9.69)#7 | 1.9%(+8.93)#321 |
| 8. | 50066 | 10.0% | 1.1%(+8.87)#8 | 1.9%(+8.11)#384 |
| 9. | 50234 | 8.7% | 1.1%(+7.58)#9 | 1.9%(+6.82)#479 |
| 10. | 50264 | 8.6% | 1.1%(+7.50)#10 | 1.9%(+6.74)#486 |
| 11. | 52228 | 8.0% | 1.1%(+6.91)#11 | 1.9%(+6.15)#549 |
| 12. | 50155 | 8.0% | 1.1%(+6.87)#12 | 1.9%(+6.11)#554 |
| 13. | 52583 | 6.2% | 1.1%(+5.12)#13 | 1.9%(+4.36)#900 |
| 14. | 50623 | 6.2% | 1.1%(+5.12)#14 | 1.9%(+4.36)#901 |
| 15. | 50277 | 6.1% | 1.1%(+4.95)#15 | 1.9%(+4.20)#945 |
| 16. | 50229 | 5.8% | 1.1%(+4.63)#16 | 1.9%(+3.87)#1,053 |
| 17. | 51653 | 5.6% | 1.1%(+4.46)#17 | 1.9%(+3.71)#1,114 |
| 18. | 52236 | 5.6% | 1.1%(+4.42)#18 | 1.9%(+3.66)#1,131 |
| 19. | 51244 | 5.5% | 1.1%(+4.36)#19 | 1.9%(+3.60)#1,147 |
| 20. | 50467 | 5.5% | 1.1%(+4.32)#20 | 1.9%(+3.56)#1,172 |
| 21. | 50241 | 5.4% | 1.1%(+4.27)#21 | 1.9%(+3.51)#1,201 |
| 22. | 52569 | 5.3% | 1.1%(+4.21)#22 | 1.9%(+3.46)#1,219 |
| 23. | 50069 | 5.1% | 1.1%(+3.98)#23 | 1.9%(+3.22)#1,328 |
| 24. | 50612 | 4.6% | 1.1%(+3.50)#24 | 1.9%(+2.74)#1,613 |
| 25. | 50840 | 4.6% | 1.1%(+3.45)#25 | 1.9%(+2.69)#1,655 |
| 26. | 51649 | 4.6% | 1.1%(+3.44)#26 | 1.9%(+2.68)#1,657 |
| 27. | 50233 | 4.6% | 1.1%(+3.42)#27 | 1.9%(+2.67)#1,672 |
| 28. | 50324 | 4.3% | 1.1%(+3.21)#28 | 1.9%(+2.45)#1,837 |
| 29. | 51108 | 4.3% | 1.1%(+3.13)#29 | 1.9%(+2.37)#1,902 |
| 30. | 50061 | 4.2% | 1.1%(+3.05)#30 | 1.9%(+2.29)#1,972 |
| 31. | 50055 | 4.2% | 1.1%(+3.04)#31 | 1.9%(+2.29)#1,984 |
| 32. | 51365 | 4.2% | 1.1%(+3.03)#32 | 1.9%(+2.27)#1,993 |
| 33. | 51465 | 4.1% | 1.1%(+2.93)#33 | 1.9%(+2.17)#2,105 |
| 34. | 52631 | 3.8% | 1.1%(+2.71)#34 | 1.9%(+1.95)#2,336 |
| 35. | 52046 | 3.8% | 1.1%(+2.66)#35 | 1.9%(+1.90)#2,399 |
| 36. | 52218 | 3.7% | 1.1%(+2.55)#36 | 1.9%(+1.80)#2,540 |
| 37. | 51527 | 3.6% | 1.1%(+2.45)#37 | 1.9%(+1.70)#2,691 |
| 38. | 50217 | 3.6% | 1.1%(+2.44)#38 | 1.9%(+1.68)#2,712 |
| 39. | 51364 | 3.4% | 1.1%(+2.31)#39 | 1.9%(+1.55)#2,951 |
| 40. | 52802 | 3.4% | 1.1%(+2.29)#40 | 1.9%(+1.53)#2,973 |
| 41. | 50244 | 3.4% | 1.1%(+2.23)#41 | 1.9%(+1.47)#3,110 |
| 42. | 52550 | 3.3% | 1.1%(+2.18)#42 | 1.9%(+1.42)#3,184 |
| 43. | 51577 | 3.3% | 1.1%(+2.12)#43 | 1.9%(+1.36)#3,306 |
| 44. | 52052 | 3.2% | 1.1%(+2.08)#44 | 1.9%(+1.32)#3,394 |
| 45. | 52729 | 3.2% | 1.1%(+2.02)#45 | 1.9%(+1.26)#3,516 |
| 46. | 51109 | 3.1% | 1.1%(+1.99)#46 | 1.9%(+1.23)#3,564 |
| 47. | 52169 | 3.1% | 1.1%(+1.99)#47 | 1.9%(+1.23)#3,575 |
| 48. | 52207 | 3.1% | 1.1%(+1.99)#48 | 1.9%(+1.23)#3,576 |
| 49. | 52306 | 3.1% | 1.1%(+1.94)#49 | 1.9%(+1.18)#3,686 |
| 50. | 50853 | 3.0% | 1.1%(+1.86)#50 | 1.9%(+1.10)#3,930 |
| 51. | 52209 | 3.0% | 1.1%(+1.84)#51 | 1.9%(+1.09)#3,960 |
| 52. | 52556 | 3.0% | 1.1%(+1.82)#52 | 1.9%(+1.06)#4,036 |
| 53. | 50546 | 2.9% | 1.1%(+1.76)#53 | 1.9%(+0.998)#4,200 |
| 54. | 51355 | 2.9% | 1.1%(+1.74)#54 | 1.9%(+0.979)#4,246 |
| 55. | 51549 | 2.8% | 1.1%(+1.71)#55 | 1.9%(+0.952)#4,315 |
| 56. | 52655 | 2.8% | 1.1%(+1.71)#56 | 1.9%(+0.947)#4,328 |
| 57. | 50065 | 2.8% | 1.1%(+1.68)#57 | 1.9%(+0.920)#4,399 |
| 58. | 51546 | 2.7% | 1.1%(+1.59)#58 | 1.9%(+0.831)#4,679 |
| 59. | 51652 | 2.6% | 1.1%(+1.44)#59 | 1.9%(+0.686)#5,170 |
| 60. | 50028 | 2.6% | 1.1%(+1.44)#60 | 1.9%(+0.683)#5,186 |
| 61. | 51639 | 2.5% | 1.1%(+1.40)#61 | 1.9%(+0.640)#5,368 |
| 62. | 50325 | 2.5% | 1.1%(+1.40)#62 | 1.9%(+0.638)#5,376 |
| 63. | 50111 | 2.5% | 1.1%(+1.37)#63 | 1.9%(+0.608)#5,492 |
| 64. | 50322 | 2.5% | 1.1%(+1.36)#64 | 1.9%(+0.604)#5,504 |
| 65. | 52158 | 2.5% | 1.1%(+1.35)#65 | 1.9%(+0.593)#5,549 |
| 66. | 52536 | 2.4% | 1.1%(+1.31)#66 | 1.9%(+0.556)#5,691 |
| 67. | 50125 | 2.4% | 1.1%(+1.29)#67 | 1.9%(+0.529)#5,802 |
| 68. | 52401 | 2.4% | 1.1%(+1.28)#68 | 1.9%(+0.518)#5,858 |
| 69. | 50327 | 2.4% | 1.1%(+1.27)#69 | 1.9%(+0.513)#5,875 |
| 70. | 50312 | 2.4% | 1.1%(+1.24)#70 | 1.9%(+0.479)#6,018 |
| 71. | 52772 | 2.4% | 1.1%(+1.23)#71 | 1.9%(+0.471)#6,046 |
| 72. | 52747 | 2.4% | 1.1%(+1.23)#72 | 1.9%(+0.468)#6,060 |
| 73. | 50645 | 2.4% | 1.1%(+1.22)#73 | 1.9%(+0.461)#6,092 |
| 74. | 50641 | 2.4% | 1.1%(+1.22)#74 | 1.9%(+0.460)#6,098 |
| 75. | 52726 | 2.3% | 1.1%(+1.19)#75 | 1.9%(+0.431)#6,212 |
| 76. | 50131 | 2.3% | 1.1%(+1.16)#76 | 1.9%(+0.404)#6,320 |
| 77. | 51007 | 2.3% | 1.1%(+1.15)#77 | 1.9%(+0.394)#6,368 |
| 78. | 52742 | 2.3% | 1.1%(+1.14)#78 | 1.9%(+0.377)#6,474 |
| 79. | 52155 | 2.3% | 1.1%(+1.12)#79 | 1.9%(+0.365)#6,531 |
| 80. | 51010 | 2.2% | 1.1%(+1.11)#80 | 1.9%(+0.355)#6,582 |
| 81. | 50014 | 2.2% | 1.1%(+1.08)#81 | 1.9%(+0.323)#6,740 |
| 82. | 50273 | 2.2% | 1.1%(+1.07)#82 | 1.9%(+0.315)#6,780 |
| 83. | 50604 | 2.2% | 1.1%(+1.06)#83 | 1.9%(+0.299)#6,856 |
| 84. | 52346 | 2.2% | 1.1%(+1.06)#84 | 1.9%(+0.298)#6,857 |
| 85. | 50530 | 2.2% | 1.1%(+1.04)#85 | 1.9%(+0.286)#6,916 |
| 86. | 52585 | 2.2% | 1.1%(+1.04)#86 | 1.9%(+0.282)#6,930 |
| 87. | 51246 | 2.1% | 1.1%(+0.956)#87 | 1.9%(+0.198)#7,376 |
| 88. | 52329 | 2.1% | 1.1%(+0.950)#88 | 1.9%(+0.192)#7,402 |
| 89. | 50237 | 2.1% | 1.1%(+0.944)#89 | 1.9%(+0.185)#7,435 |
| 90. | 50216 | 2.1% | 1.1%(+0.937)#90 | 1.9%(+0.179)#7,472 |
| 91. | 52402 | 2.1% | 1.1%(+0.932)#91 | 1.9%(+0.174)#7,506 |
| 92. | 51646 | 2.1% | 1.1%(+0.923)#92 | 1.9%(+0.165)#7,556 |
| 93. | 52620 | 2.0% | 1.1%(+0.913)#93 | 1.9%(+0.154)#7,612 |
| 94. | 50151 | 2.0% | 1.1%(+0.907)#94 | 1.9%(+0.149)#7,639 |
| 95. | 50309 | 2.0% | 1.1%(+0.899)#95 | 1.9%(+0.141)#7,675 |
| 96. | 51248 | 2.0% | 1.1%(+0.883)#96 | 1.9%(+0.124)#7,756 |
| 97. | 50009 | 2.0% | 1.1%(+0.878)#97 | 1.9%(+0.119)#7,774 |
| 98. | 52056 | 2.0% | 1.1%(+0.867)#98 | 1.9%(+0.108)#7,845 |
| 99. | 51001 | 2.0% | 1.1%(+0.865)#99 | 1.9%(+0.107)#7,848 |
| 100. | 51105 | 2.0% | 1.1%(+0.864)#100 | 1.9%(+0.105)#7,858 |
Common Questions
What are the Top 10 Zip Codes with the Highest Percentage of Population Employed in Real Estate, Rental & Leasing in Iowa?
Top 10 Zip Codes with the Highest Percentage of Population Employed in Real Estate, Rental & Leasing in Iowa are:
What zip code has the Highest Percentage of Population Employed in Real Estate, Rental & Leasing in Iowa?
51648 has the Highest Percentage of Population Employed in Real Estate, Rental & Leasing in Iowa with 28.4%.
What is the Percentage of Population Employed in Real Estate, Rental & Leasing in the State of Iowa?
Percentage of Population Employed in Real Estate, Rental & Leasing in Iowa is 1.1%.
What is the Percentage of Population Employed in Real Estate, Rental & Leasing in the United States?
Percentage of Population Employed in Real Estate, Rental & Leasing in the United States is 1.9%.