Holiday Lake, IA Map & Demographics
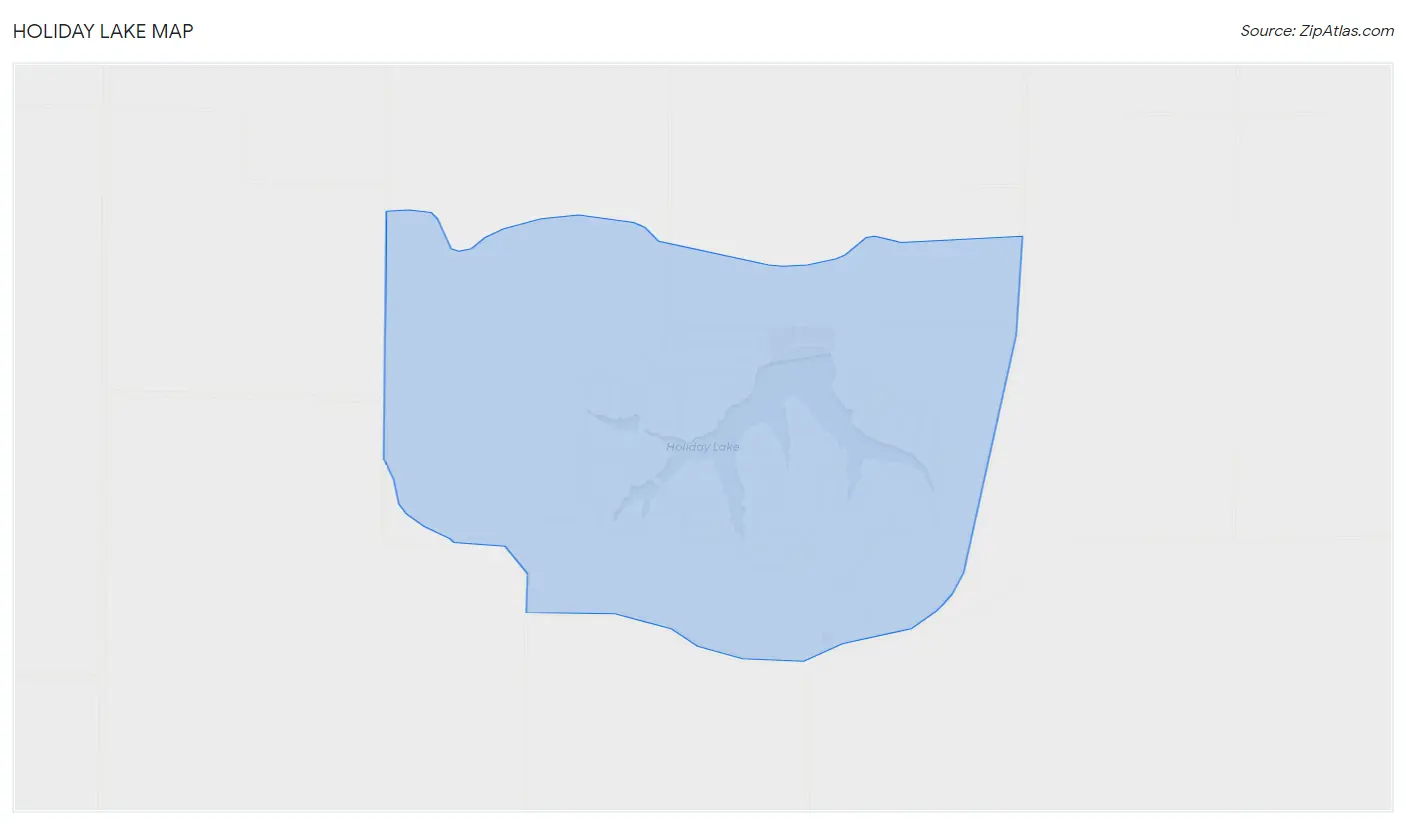
Holiday Lake Map
Holiday Lake Overview
$55,148
PER CAPITA INCOME
$90,313
AVG FAMILY INCOME
$77,841
AVG HOUSEHOLD INCOME
0.37
INEQUALITY / GINI INDEX
371
TOTAL POPULATION
198
MALE POPULATION
173
FEMALE POPULATION
114.45
MALES / 100 FEMALES
87.37
FEMALES / 100 MALES
63.5
MEDIAN AGE
2.4
AVG FAMILY SIZE
1.7
AVG HOUSEHOLD SIZE
196
LABOR FORCE [ PEOPLE ]
57.5%
PERCENT IN LABOR FORCE
Income in Holiday Lake
Income Overview in Holiday Lake
Per Capita Income in Holiday Lake is $55,148, while median incomes of families and households are $90,313 and $77,841 respectively.
| Characteristic | Number | Measure |
| Per Capita Income | 371 | $55,148 |
| Median Family Income | 88 | $90,313 |
| Mean Family Income | 88 | $101,073 |
| Median Household Income | 224 | $77,841 |
| Mean Household Income | 224 | $91,808 |
| Income Deficit | 88 | $0 |
| Wage / Income Gap (%) | 371 | 0.00% |
| Wage / Income Gap ($) | 371 | 100.00¢ per $1 |
| Gini / Inequality Index | 371 | 0.37 |
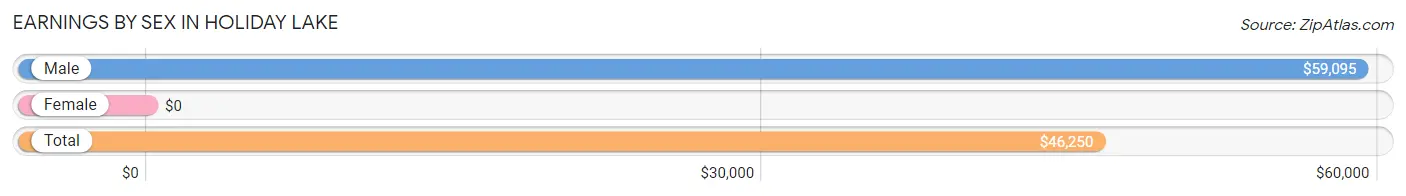
Earnings by Sex in Holiday Lake
| Sex | Number | Average Earnings |
| Male | 123 (55.9%) | $59,095 |
| Female | 97 (44.1%) | $0 |
| Total | 220 (100.0%) | $46,250 |
Earnings by Sex by Income Bracket in Holiday Lake
The most common earnings brackets in Holiday Lake are $55,000 to $64,999 for men (37 | 30.1%) and $30,000 to $34,999 for women (22 | 22.7%).
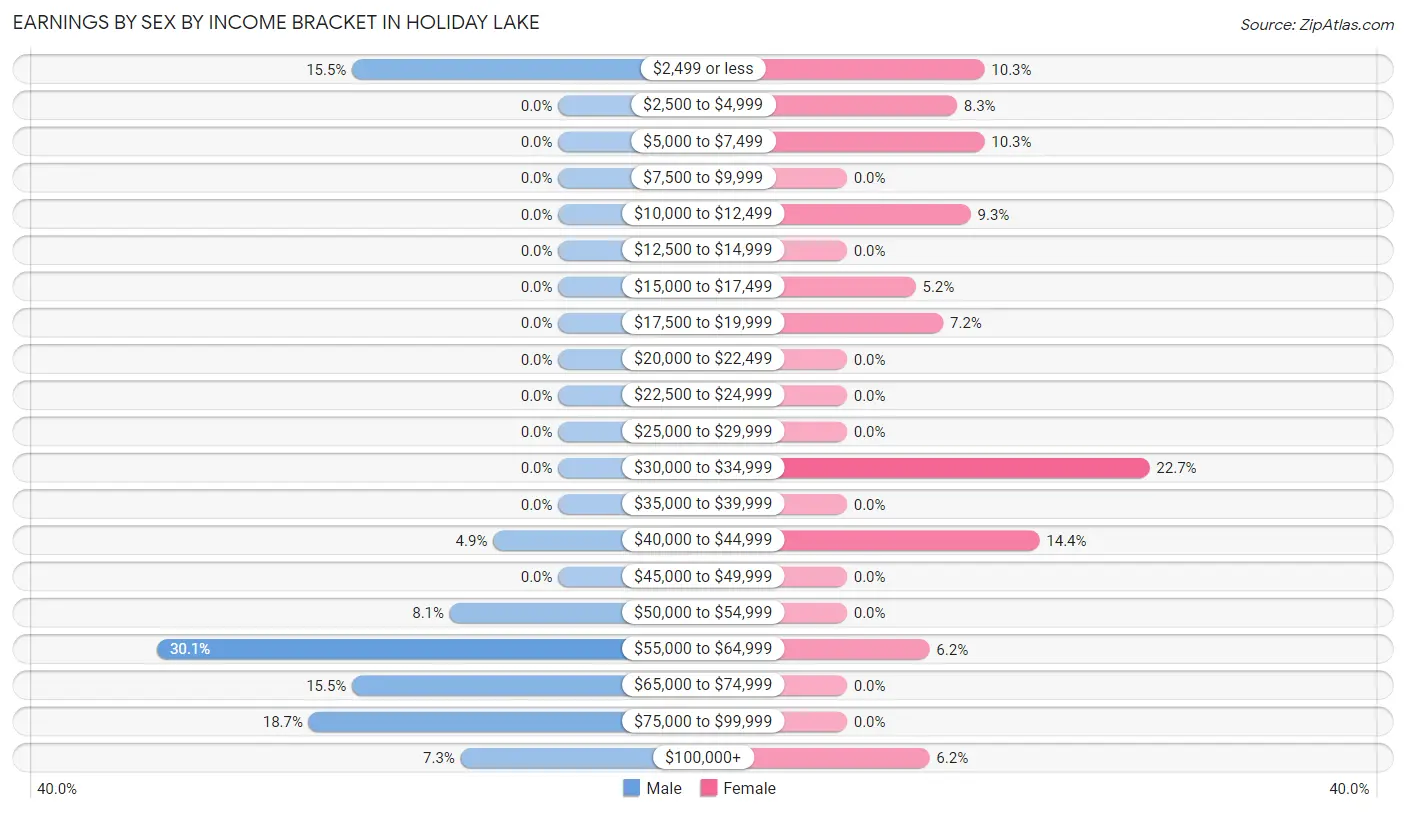
| Income | Male | Female |
| $2,499 or less | 19 (15.4%) | 10 (10.3%) |
| $2,500 to $4,999 | 0 (0.0%) | 8 (8.3%) |
| $5,000 to $7,499 | 0 (0.0%) | 10 (10.3%) |
| $7,500 to $9,999 | 0 (0.0%) | 0 (0.0%) |
| $10,000 to $12,499 | 0 (0.0%) | 9 (9.3%) |
| $12,500 to $14,999 | 0 (0.0%) | 0 (0.0%) |
| $15,000 to $17,499 | 0 (0.0%) | 5 (5.1%) |
| $17,500 to $19,999 | 0 (0.0%) | 7 (7.2%) |
| $20,000 to $22,499 | 0 (0.0%) | 0 (0.0%) |
| $22,500 to $24,999 | 0 (0.0%) | 0 (0.0%) |
| $25,000 to $29,999 | 0 (0.0%) | 0 (0.0%) |
| $30,000 to $34,999 | 0 (0.0%) | 22 (22.7%) |
| $35,000 to $39,999 | 0 (0.0%) | 0 (0.0%) |
| $40,000 to $44,999 | 6 (4.9%) | 14 (14.4%) |
| $45,000 to $49,999 | 0 (0.0%) | 0 (0.0%) |
| $50,000 to $54,999 | 10 (8.1%) | 0 (0.0%) |
| $55,000 to $64,999 | 37 (30.1%) | 6 (6.2%) |
| $65,000 to $74,999 | 19 (15.4%) | 0 (0.0%) |
| $75,000 to $99,999 | 23 (18.7%) | 0 (0.0%) |
| $100,000+ | 9 (7.3%) | 6 (6.2%) |
| Total | 123 (100.0%) | 97 (100.0%) |
Earnings by Sex by Educational Attainment in Holiday Lake
Average earnings in Holiday Lake are $59,095 for men and $30,227 for women, a difference of 48.8%. Men with an educational attainment of college or associate's degree enjoy the highest average annual earnings of $67,083, while those with bachelor's degree education earn the least with $59,028. Women with an educational attainment of high school diploma earn the most with the average annual earnings of $17,679, while those with high school diploma education have the smallest earnings of $17,679.
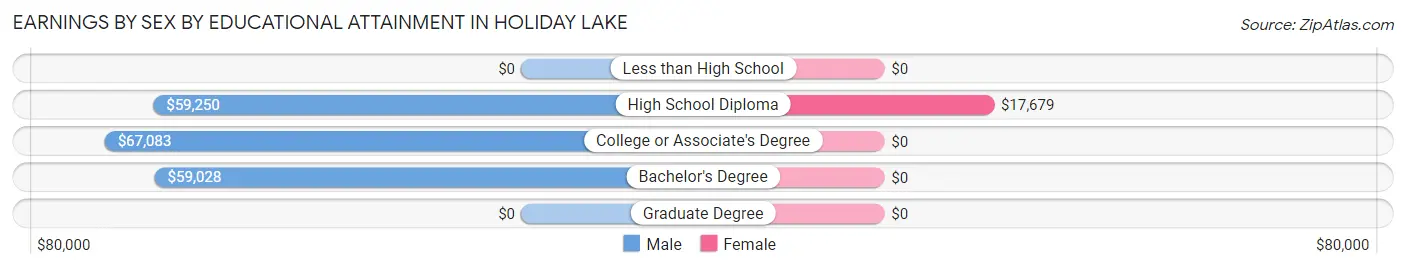
| Educational Attainment | Male Income | Female Income |
| Less than High School | - | - |
| High School Diploma | $59,250 | $17,679 |
| College or Associate's Degree | $67,083 | $0 |
| Bachelor's Degree | $59,028 | $0 |
| Graduate Degree | - | - |
| Total | $59,095 | $30,227 |
Family Income in Holiday Lake
Family Income Brackets in Holiday Lake
According to the Holiday Lake family income data, there are 22 families falling into the $75,000 to $99,999 income range, which is the most common income bracket and makes up 25.0% of all families.
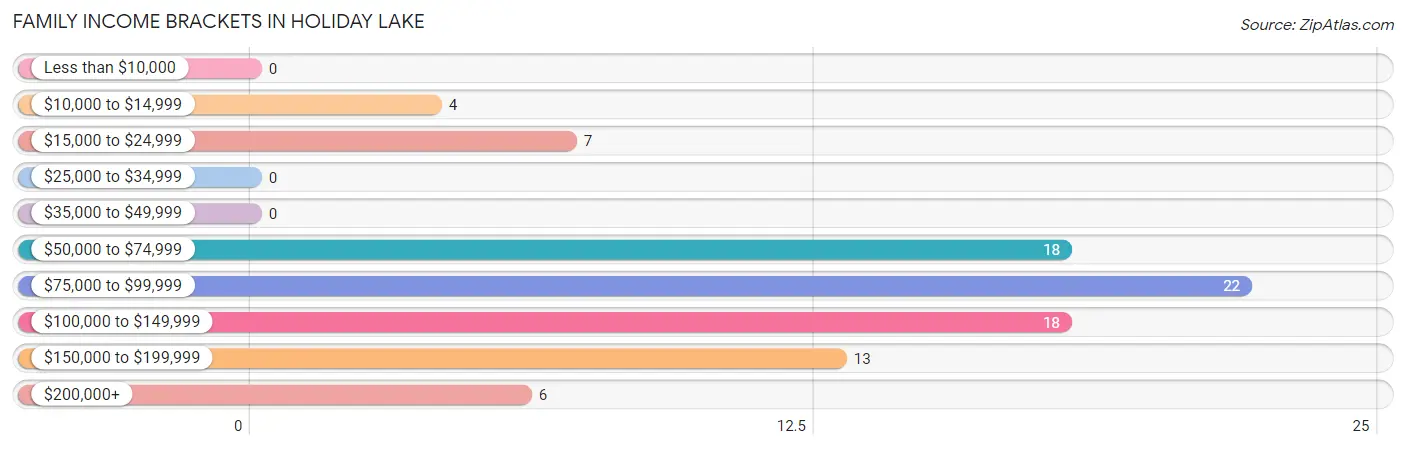
| Income Bracket | # Families | % Families |
| Less than $10,000 | 0 | 0.0% |
| $10,000 to $14,999 | 4 | 4.5% |
| $15,000 to $24,999 | 7 | 8.0% |
| $25,000 to $34,999 | 0 | 0.0% |
| $35,000 to $49,999 | 0 | 0.0% |
| $50,000 to $74,999 | 18 | 20.5% |
| $75,000 to $99,999 | 22 | 25.0% |
| $100,000 to $149,999 | 18 | 20.5% |
| $150,000 to $199,999 | 13 | 14.8% |
| $200,000+ | 6 | 6.8% |
Family Income by Famaliy Size in Holiday Lake
2-person families (64 | 72.7%) account for the highest median family income in Holiday Lake with $92,188 per family, while 2-person families (64 | 72.7%) have the highest median income of $46,094 per family member.
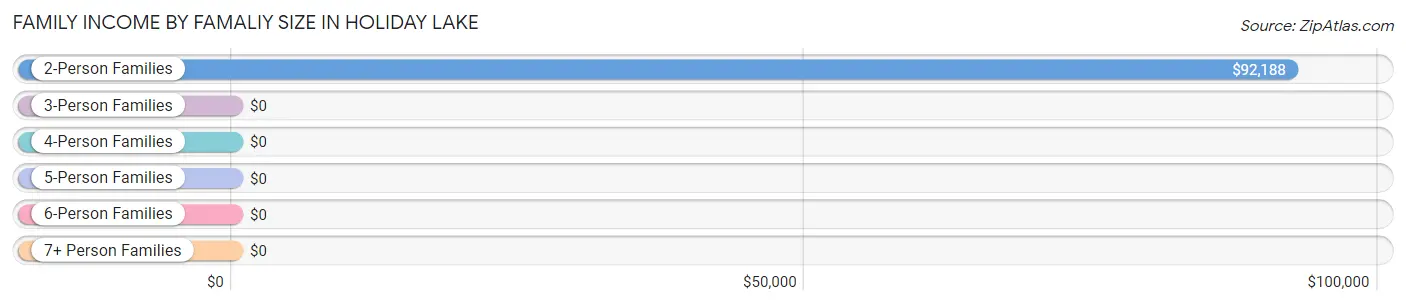
| Income Bracket | # Families | Median Income |
| 2-Person Families | 64 (72.7%) | $92,188 |
| 3-Person Families | 8 (9.1%) | $0 |
| 4-Person Families | 16 (18.2%) | $0 |
| 5-Person Families | 0 (0.0%) | $0 |
| 6-Person Families | 0 (0.0%) | $0 |
| 7+ Person Families | 0 (0.0%) | $0 |
| Total | 88 (100.0%) | $90,313 |
Family Income by Number of Earners in Holiday Lake
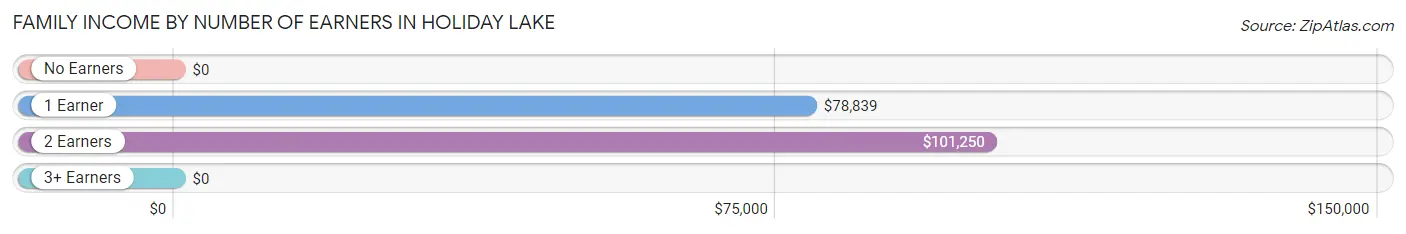
| Number of Earners | # Families | Median Income |
| No Earners | 15 (17.1%) | $0 |
| 1 Earner | 31 (35.2%) | $78,839 |
| 2 Earners | 36 (40.9%) | $101,250 |
| 3+ Earners | 6 (6.8%) | $0 |
| Total | 88 (100.0%) | $90,313 |
Household Income in Holiday Lake
Household Income Brackets in Holiday Lake
With 59 households falling in the category, the $50,000 to $74,999 income range is the most frequent in Holiday Lake, accounting for 26.3% of all households.
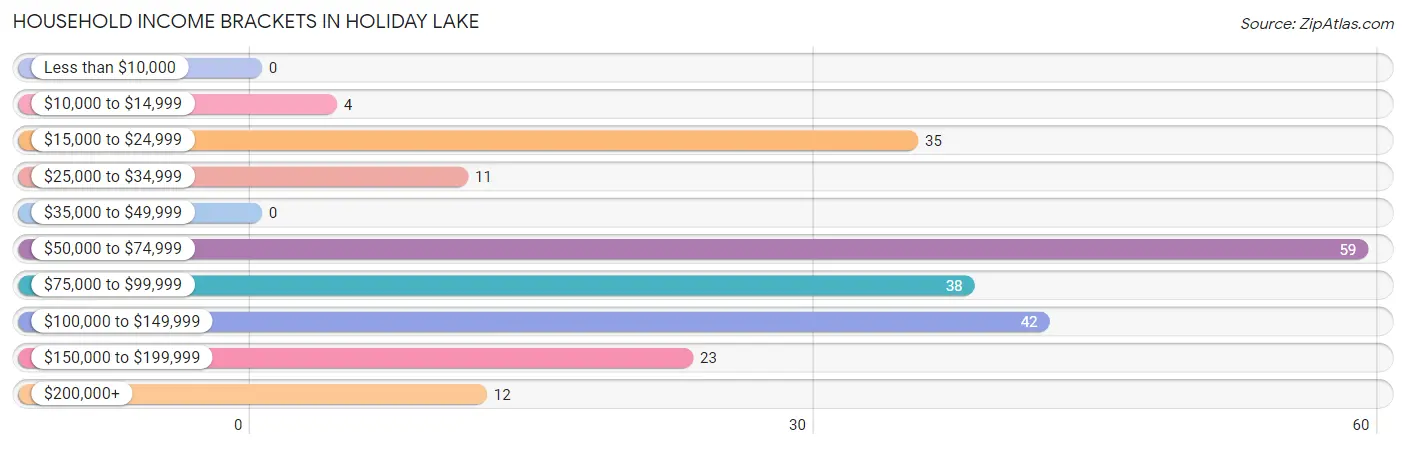
| Income Bracket | # Households | % Households |
| Less than $10,000 | 0 | 0.0% |
| $10,000 to $14,999 | 4 | 1.8% |
| $15,000 to $24,999 | 35 | 15.6% |
| $25,000 to $34,999 | 11 | 4.9% |
| $35,000 to $49,999 | 0 | 0.0% |
| $50,000 to $74,999 | 59 | 26.3% |
| $75,000 to $99,999 | 38 | 17.0% |
| $100,000 to $149,999 | 42 | 18.8% |
| $150,000 to $199,999 | 23 | 10.3% |
| $200,000+ | 12 | 5.4% |
Household Income by Householder Age in Holiday Lake
The median household income in Holiday Lake is $77,841, with the highest median household income of $79,732 found in the 65+ years age bracket for the primary householder. A total of 145 households (64.7%) fall into this category.
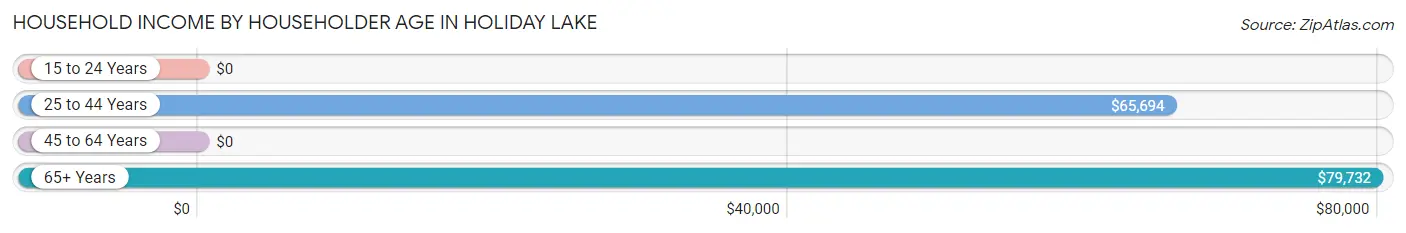
| Income Bracket | # Households | Median Income |
| 15 to 24 Years | 0 (0.0%) | $0 |
| 25 to 44 Years | 65 (29.0%) | $65,694 |
| 45 to 64 Years | 14 (6.2%) | $0 |
| 65+ Years | 145 (64.7%) | $79,732 |
| Total | 224 (100.0%) | $77,841 |
Poverty in Holiday Lake
Income Below Poverty by Sex and Age in Holiday Lake
With 1.5% poverty level for males and 7.5% for females among the residents of Holiday Lake, 75 year old and over males and 25 to 34 year old females are the most vulnerable to poverty, with 3 males (8.8%) and 9 females (100.0%) in their respective age groups living below the poverty level.
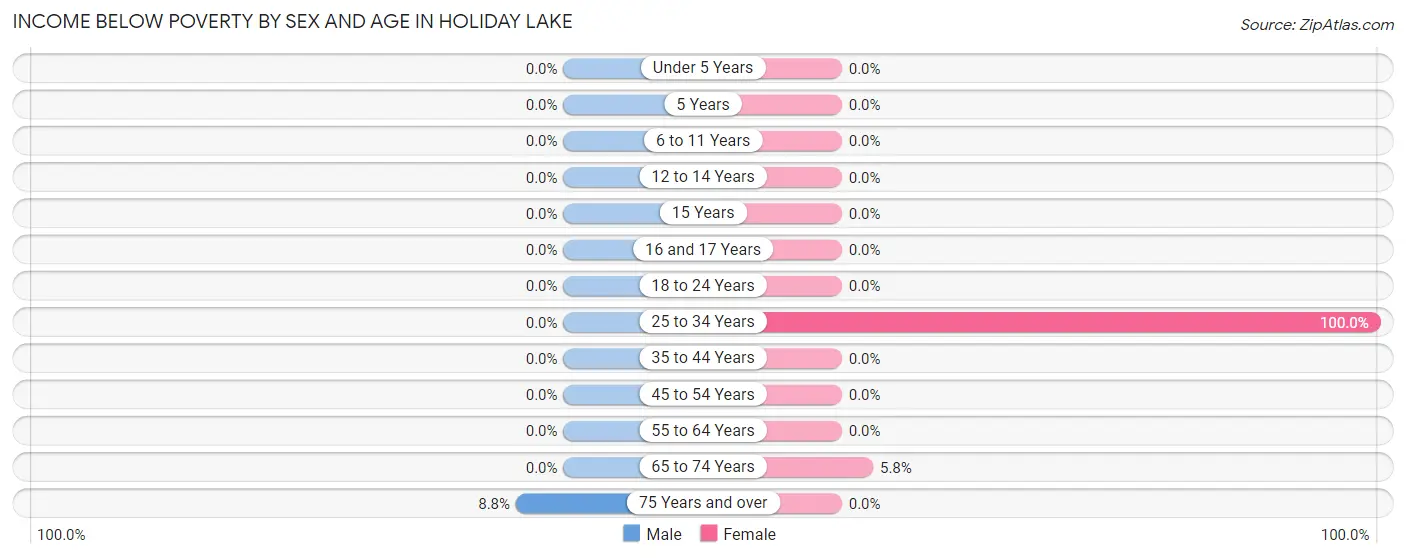
| Age Bracket | Male | Female |
| Under 5 Years | 0 (0.0%) | 0 (0.0%) |
| 5 Years | 0 (0.0%) | 0 (0.0%) |
| 6 to 11 Years | 0 (0.0%) | 0 (0.0%) |
| 12 to 14 Years | 0 (0.0%) | 0 (0.0%) |
| 15 Years | 0 (0.0%) | 0 (0.0%) |
| 16 and 17 Years | 0 (0.0%) | 0 (0.0%) |
| 18 to 24 Years | 0 (0.0%) | 0 (0.0%) |
| 25 to 34 Years | 0 (0.0%) | 9 (100.0%) |
| 35 to 44 Years | 0 (0.0%) | 0 (0.0%) |
| 45 to 54 Years | 0 (0.0%) | 0 (0.0%) |
| 55 to 64 Years | 0 (0.0%) | 0 (0.0%) |
| 65 to 74 Years | 0 (0.0%) | 4 (5.8%) |
| 75 Years and over | 3 (8.8%) | 0 (0.0%) |
| Total | 3 (1.5%) | 13 (7.5%) |
Income Above Poverty by Sex and Age in Holiday Lake
According to the poverty statistics in Holiday Lake, males aged 6 to 11 years and females aged under 5 years are the age groups that are most secure financially, with 100.0% of males and 100.0% of females in these age groups living above the poverty line.
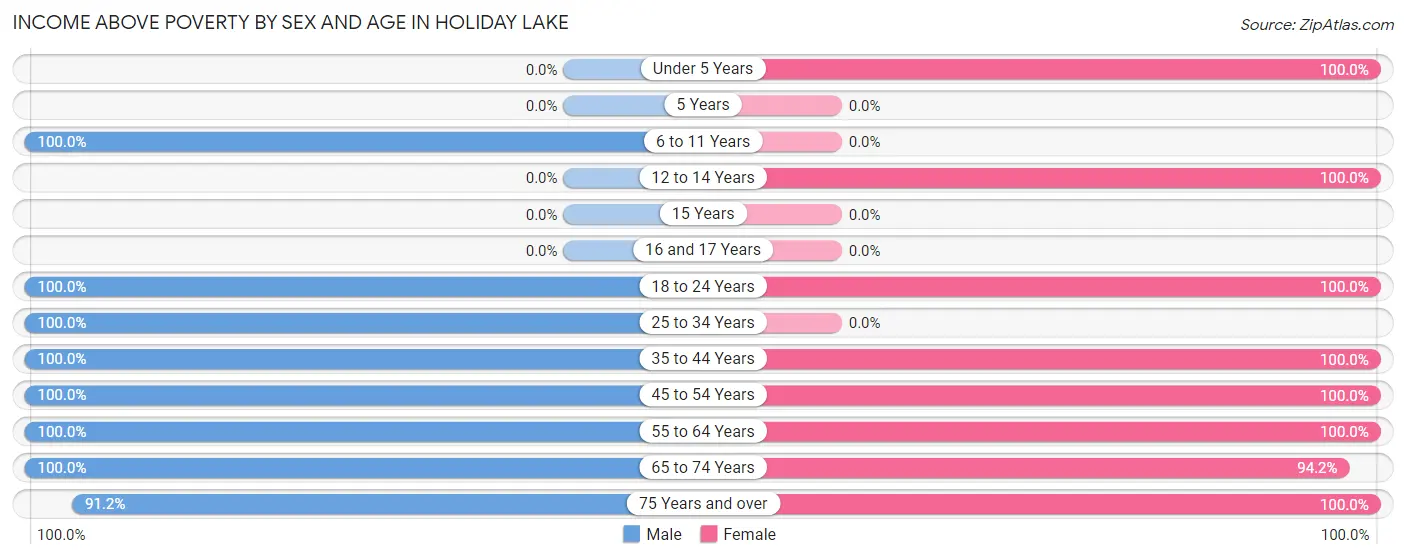
| Age Bracket | Male | Female |
| Under 5 Years | 0 (0.0%) | 7 (100.0%) |
| 5 Years | 0 (0.0%) | 0 (0.0%) |
| 6 to 11 Years | 10 (100.0%) | 0 (0.0%) |
| 12 to 14 Years | 0 (0.0%) | 13 (100.0%) |
| 15 Years | 0 (0.0%) | 0 (0.0%) |
| 16 and 17 Years | 0 (0.0%) | 0 (0.0%) |
| 18 to 24 Years | 14 (100.0%) | 5 (100.0%) |
| 25 to 34 Years | 46 (100.0%) | 0 (0.0%) |
| 35 to 44 Years | 19 (100.0%) | 10 (100.0%) |
| 45 to 54 Years | 8 (100.0%) | 20 (100.0%) |
| 55 to 64 Years | 7 (100.0%) | 32 (100.0%) |
| 65 to 74 Years | 60 (100.0%) | 65 (94.2%) |
| 75 Years and over | 31 (91.2%) | 8 (100.0%) |
| Total | 195 (98.5%) | 160 (92.5%) |
Income Below Poverty Among Married-Couple Families in Holiday Lake
The poverty statistics for married-couple families in Holiday Lake show that 5.0% or 4 of the total 80 families live below the poverty line. Families with no children have the highest poverty rate of 6.2%, comprising of 4 families. On the other hand, families with 1 or 2 children have the lowest poverty rate of 0.0%, which includes 0 families.
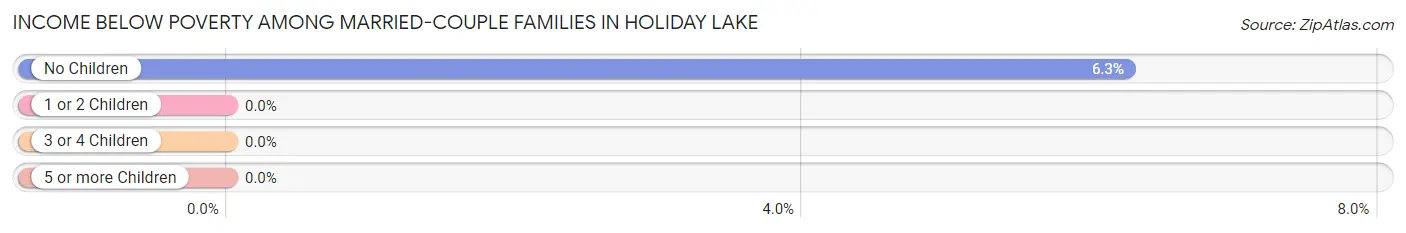
| Children | Above Poverty | Below Poverty |
| No Children | 60 (93.8%) | 4 (6.2%) |
| 1 or 2 Children | 16 (100.0%) | 0 (0.0%) |
| 3 or 4 Children | 0 (0.0%) | 0 (0.0%) |
| 5 or more Children | 0 (0.0%) | 0 (0.0%) |
| Total | 76 (95.0%) | 4 (5.0%) |
Income Below Poverty Among Single-Parent Households in Holiday Lake
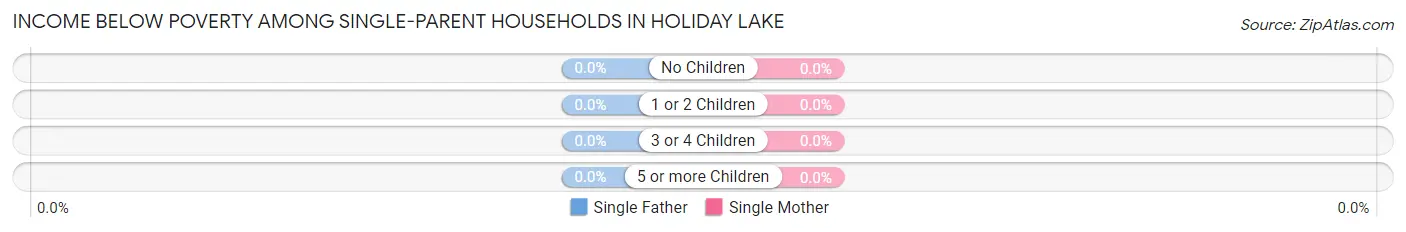
| Children | Single Father | Single Mother |
| No Children | 0 (0.0%) | 0 (0.0%) |
| 1 or 2 Children | 0 (0.0%) | 0 (0.0%) |
| 3 or 4 Children | 0 (0.0%) | 0 (0.0%) |
| 5 or more Children | 0 (0.0%) | 0 (0.0%) |
| Total | 0 (0.0%) | 0 (0.0%) |
Income Below Poverty Among Married-Couple vs Single-Parent Households in Holiday Lake
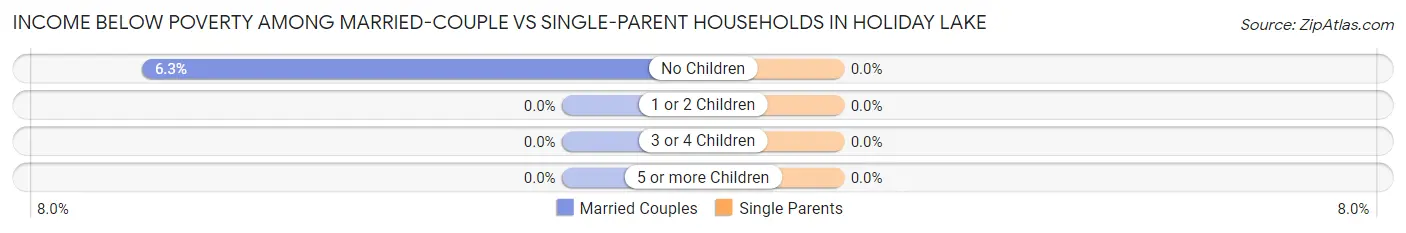
| Children | Married-Couple Families | Single-Parent Households |
| No Children | 4 (6.2%) | 0 (0.0%) |
| 1 or 2 Children | 0 (0.0%) | 0 (0.0%) |
| 3 or 4 Children | 0 (0.0%) | 0 (0.0%) |
| 5 or more Children | 0 (0.0%) | 0 (0.0%) |
| Total | 4 (5.0%) | 0 (0.0%) |
Race in Holiday Lake
The most populous races in Holiday Lake are White / Caucasian (367 | 98.9%), Hispanic or Latino (4 | 1.1%), and Two or more Races (4 | 1.1%).
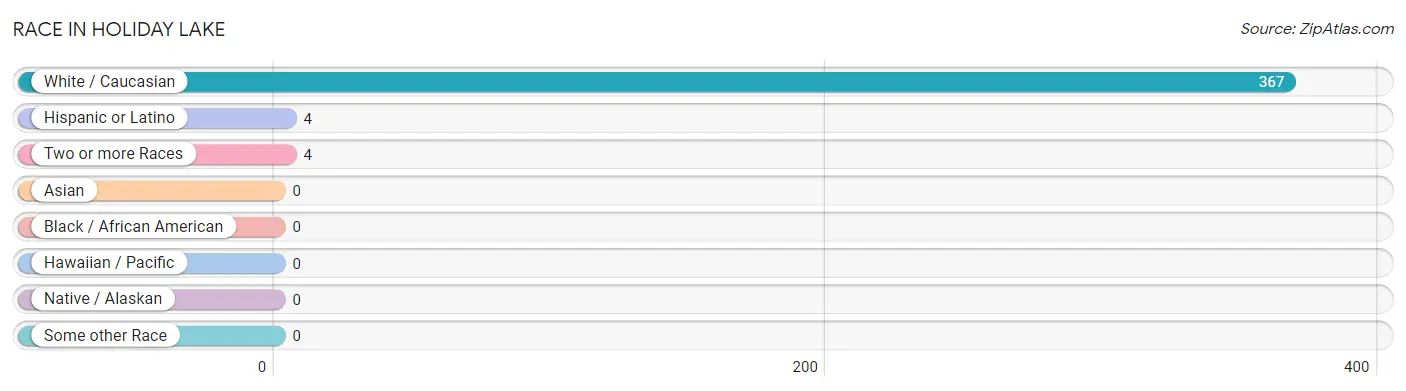
| Race | # Population | % Population |
| Asian | 0 | 0.0% |
| Black / African American | 0 | 0.0% |
| Hawaiian / Pacific | 0 | 0.0% |
| Hispanic or Latino | 4 | 1.1% |
| Native / Alaskan | 0 | 0.0% |
| White / Caucasian | 367 | 98.9% |
| Two or more Races | 4 | 1.1% |
| Some other Race | 0 | 0.0% |
| Total | 371 | 100.0% |
Ancestry in Holiday Lake
The most populous ancestries reported in Holiday Lake are German (103 | 27.8%), Irish (54 | 14.6%), American (46 | 12.4%), English (13 | 3.5%), and Belgian (10 | 2.7%), together accounting for 60.9% of all Holiday Lake residents.
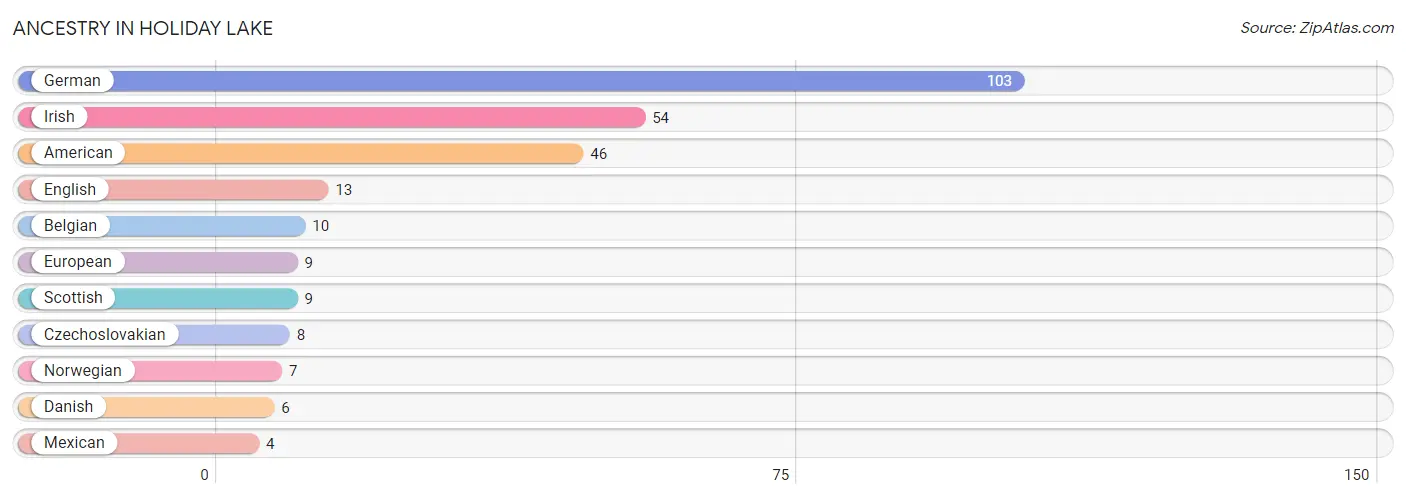
| Ancestry | # Population | % Population |
| American | 46 | 12.4% |
| Belgian | 10 | 2.7% |
| Czechoslovakian | 8 | 2.2% |
| Danish | 6 | 1.6% |
| English | 13 | 3.5% |
| European | 9 | 2.4% |
| German | 103 | 27.8% |
| Irish | 54 | 14.6% |
| Mexican | 4 | 1.1% |
| Norwegian | 7 | 1.9% |
| Scottish | 9 | 2.4% | View All 11 Rows |
Immigrants in Holiday Lake

| Immigration Origin | # Population | % Population | View All 0 Rows |
Sex and Age in Holiday Lake
Sex and Age in Holiday Lake
The most populous age groups in Holiday Lake are 65 to 69 Years (60 | 30.3%) for men and 65 to 69 Years (42 | 24.3%) for women.
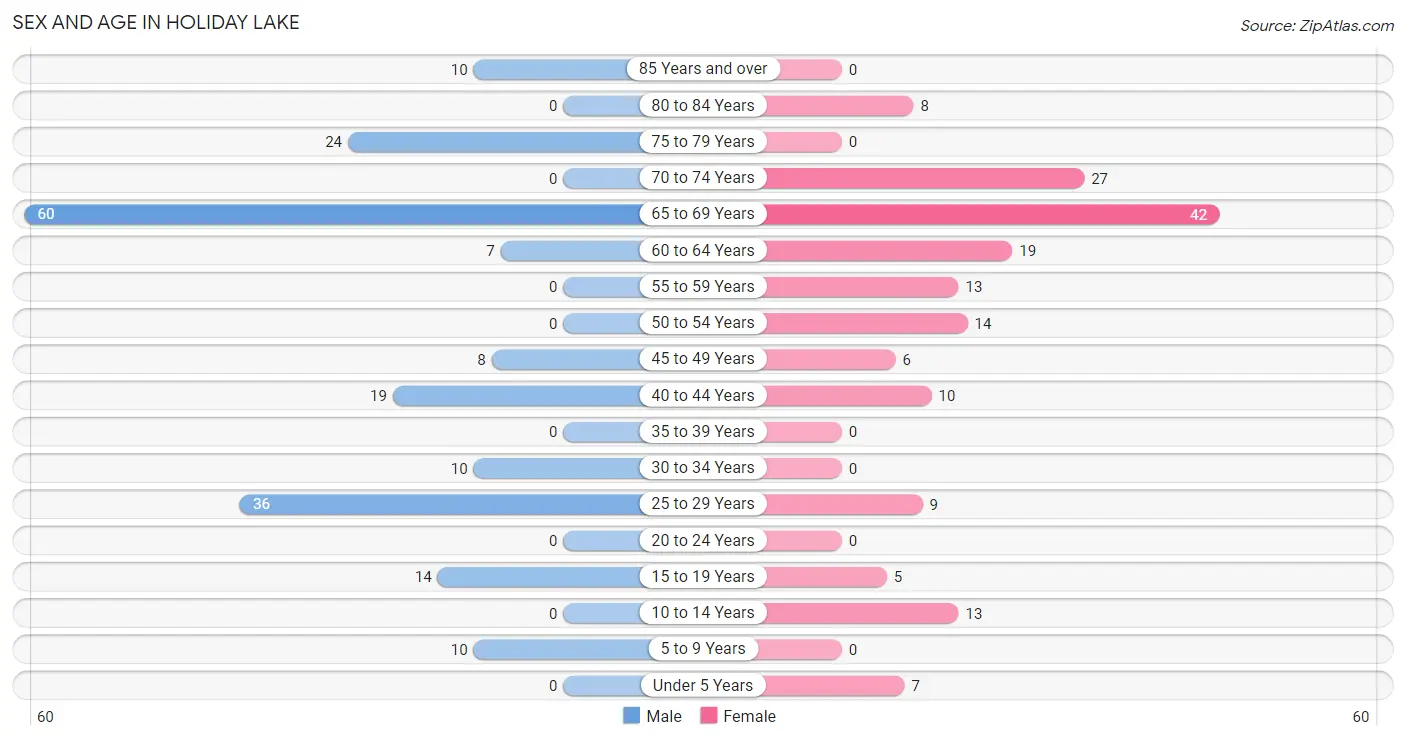
| Age Bracket | Male | Female |
| Under 5 Years | 0 (0.0%) | 7 (4.1%) |
| 5 to 9 Years | 10 (5.1%) | 0 (0.0%) |
| 10 to 14 Years | 0 (0.0%) | 13 (7.5%) |
| 15 to 19 Years | 14 (7.1%) | 5 (2.9%) |
| 20 to 24 Years | 0 (0.0%) | 0 (0.0%) |
| 25 to 29 Years | 36 (18.2%) | 9 (5.2%) |
| 30 to 34 Years | 10 (5.1%) | 0 (0.0%) |
| 35 to 39 Years | 0 (0.0%) | 0 (0.0%) |
| 40 to 44 Years | 19 (9.6%) | 10 (5.8%) |
| 45 to 49 Years | 8 (4.0%) | 6 (3.5%) |
| 50 to 54 Years | 0 (0.0%) | 14 (8.1%) |
| 55 to 59 Years | 0 (0.0%) | 13 (7.5%) |
| 60 to 64 Years | 7 (3.5%) | 19 (11.0%) |
| 65 to 69 Years | 60 (30.3%) | 42 (24.3%) |
| 70 to 74 Years | 0 (0.0%) | 27 (15.6%) |
| 75 to 79 Years | 24 (12.1%) | 0 (0.0%) |
| 80 to 84 Years | 0 (0.0%) | 8 (4.6%) |
| 85 Years and over | 10 (5.1%) | 0 (0.0%) |
| Total | 198 (100.0%) | 173 (100.0%) |
Families and Households in Holiday Lake
Median Family Size in Holiday Lake
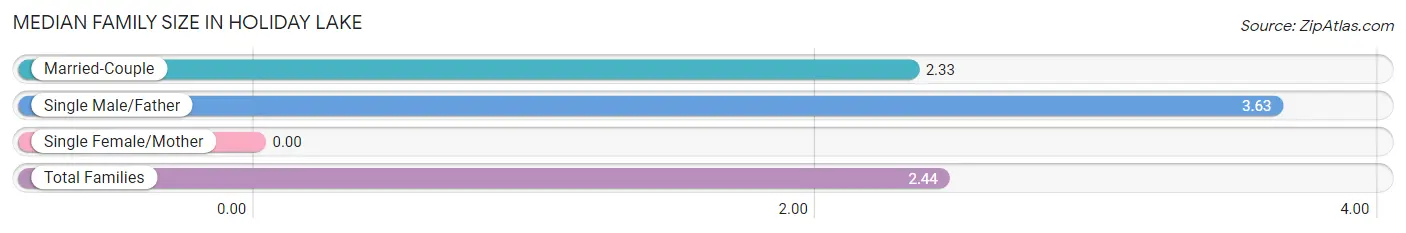
| Family Type | # Families | Family Size |
| Married-Couple | 80 (90.9%) | 2.33 |
| Single Male/Father | 8 (9.1%) | 3.63 |
| Single Female/Mother | 0 (0.0%) | - |
| Total Families | 88 (100.0%) | 2.44 |
Median Household Size in Holiday Lake
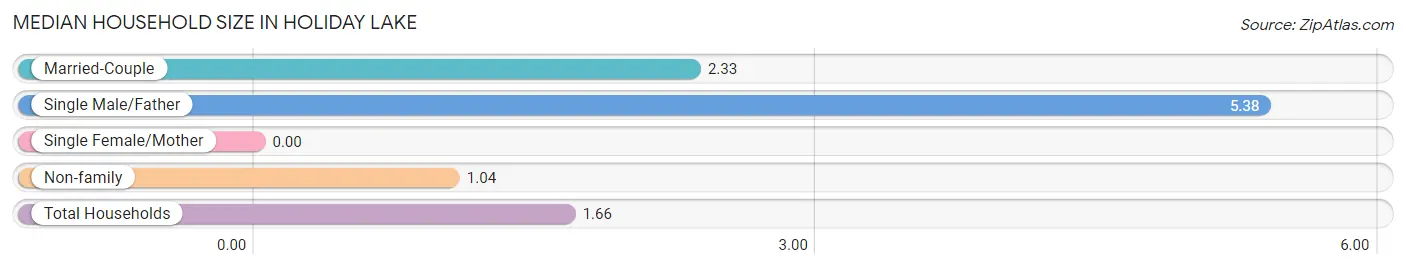
| Household Type | # Households | Household Size |
| Married-Couple | 80 (35.7%) | 2.33 |
| Single Male/Father | 8 (3.6%) | 5.38 |
| Single Female/Mother | 0 (0.0%) | - |
| Non-family | 136 (60.7%) | 1.04 |
| Total Households | 224 (100.0%) | 1.66 |
Household Size by Marriage Status in Holiday Lake
Out of a total of 224 households in Holiday Lake, 88 (39.3%) are family households, while 136 (60.7%) are nonfamily households. The most numerous type of family households are 2-person households, comprising 64, and the most common type of nonfamily households are 1-person households, comprising 128.
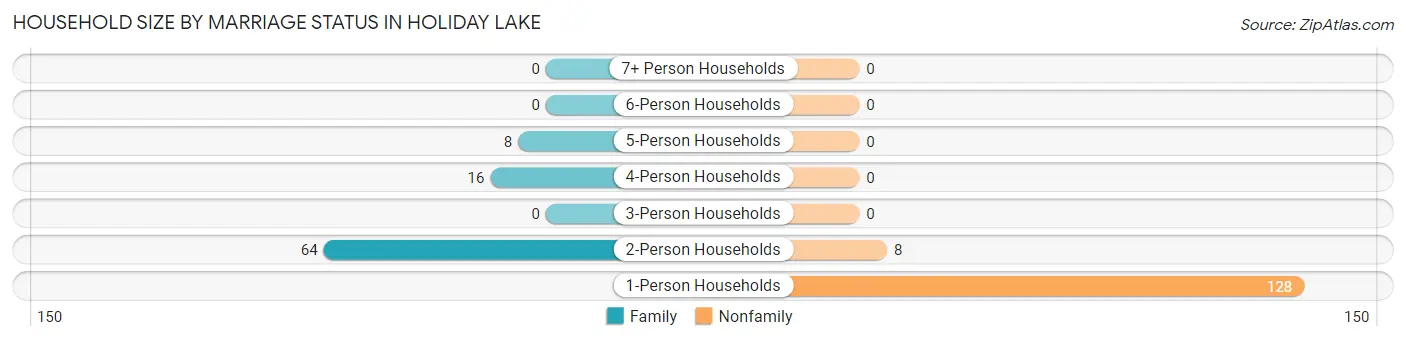
| Household Size | Family Households | Nonfamily Households |
| 1-Person Households | - | 128 (57.1%) |
| 2-Person Households | 64 (28.6%) | 8 (3.6%) |
| 3-Person Households | 0 (0.0%) | 0 (0.0%) |
| 4-Person Households | 16 (7.1%) | 0 (0.0%) |
| 5-Person Households | 8 (3.6%) | 0 (0.0%) |
| 6-Person Households | 0 (0.0%) | 0 (0.0%) |
| 7+ Person Households | 0 (0.0%) | 0 (0.0%) |
| Total | 88 (39.3%) | 136 (60.7%) |
Female Fertility in Holiday Lake
Fertility by Age in Holiday Lake
| Age Bracket | Women with Births | Births / 1,000 Women |
| 15 to 19 years | 0 (0.0%) | 0.0 |
| 20 to 34 years | 0 (0.0%) | 0.0 |
| 35 to 50 years | 0 (0.0%) | 0.0 |
| Total | 0 (0.0%) | 0.0 |
Fertility by Age by Marriage Status in Holiday Lake
| Age Bracket | Married | Unmarried |
| 15 to 19 years | 0 (0.0%) | 0 (0.0%) |
| 20 to 34 years | 0 (0.0%) | 0 (0.0%) |
| 35 to 50 years | 0 (0.0%) | 0 (0.0%) |
| Total | 0 (0.0%) | 0 (0.0%) |
Fertility by Education in Holiday Lake
| Educational Attainment | Women with Births | Births / 1,000 Women |
| Less than High School | 0 (0.0%) | 0.0 |
| High School Diploma | 0 (0.0%) | 0.0 |
| College or Associate's Degree | 0 (0.0%) | 0.0 |
| Bachelor's Degree | 0 (0.0%) | 0.0 |
| Graduate Degree | 0 (0.0%) | 0.0 |
| Total | 0 (0.0%) | 0.0 |
Fertility by Education by Marriage Status in Holiday Lake
| Educational Attainment | Married | Unmarried |
| Less than High School | 0 (0.0%) | 0 (0.0%) |
| High School Diploma | 0 (0.0%) | 0 (0.0%) |
| College or Associate's Degree | 0 (0.0%) | 0 (0.0%) |
| Bachelor's Degree | 0 (0.0%) | 0 (0.0%) |
| Graduate Degree | 0 (0.0%) | 0 (0.0%) |
| Total | 0 (0.0%) | 0 (0.0%) |
Employment Characteristics in Holiday Lake
Employment by Class of Employer in Holiday Lake
Among the 189 employed individuals in Holiday Lake, private company employees (78 | 41.3%), self-employed (not incorporated) (44 | 23.3%), and self-employed (incorporated) (19 | 10.1%) make up the most common classes of employment.
| Employer Class | # Employees | % Employees |
| Private Company Employees | 78 | 41.3% |
| Self-Employed (Incorporated) | 19 | 10.1% |
| Self-Employed (Not Incorporated) | 44 | 23.3% |
| Not-for-profit Organizations | 15 | 7.9% |
| Local Government Employees | 18 | 9.5% |
| State Government Employees | 15 | 7.9% |
| Federal Government Employees | 0 | 0.0% |
| Unpaid Family Workers | 0 | 0.0% |
| Total | 189 | 100.0% |
Employment Status by Age in Holiday Lake
| Age Bracket | In Labor Force | Unemployed |
| 16 to 19 Years | 5 (26.3%) | 0 (0.0%) |
| 20 to 24 Years | 0 (0.0%) | 0 (0.0%) |
| 25 to 29 Years | 45 (100.0%) | 0 (0.0%) |
| 30 to 34 Years | 10 (100.0%) | 0 (0.0%) |
| 35 to 44 Years | 29 (100.0%) | 0 (0.0%) |
| 45 to 54 Years | 28 (100.0%) | 0 (0.0%) |
| 55 to 59 Years | 8 (61.5%) | 0 (0.0%) |
| 60 to 64 Years | 26 (100.0%) | 0 (0.0%) |
| 65 to 74 Years | 45 (34.9%) | 0 (0.0%) |
| 75 Years and over | 0 (0.0%) | 0 (0.0%) |
| Total | 196 (57.5%) | 0 (0.0%) |
Employment Status by Educational Attainment in Holiday Lake
| Educational Attainment | In Labor Force | Unemployed |
| Less than High School | 0 (0.0%) | 0 (0.0%) |
| High School Diploma | 62 (92.5%) | 0 (0.0%) |
| College / Associate Degree | 66 (100.0%) | 0 (0.0%) |
| Bachelor's Degree or higher | 18 (100.0%) | 0 (0.0%) |
| Total | 146 (96.7%) | 0 (0.0%) |
Employment Occupations by Sex in Holiday Lake
Management, Business, Science and Arts Occupations
The most common Management, Business, Science and Arts occupations in Holiday Lake are Community & Social Service (30 | 15.3%), Education Instruction & Library (15 | 7.6%), Health Diagnosing & Treating (15 | 7.6%), Health Technologists (15 | 7.6%), and Management (10 | 5.1%).
Management, Business, Science and Arts Occupations by Sex
Within the Management, Business, Science and Arts occupations in Holiday Lake, the most male-oriented occupations are Management (100.0%), Computers, Engineering & Science (100.0%), and Computers & Mathematics (100.0%), while the most female-oriented occupations are Community & Social Service (100.0%), Education, Arts & Media (100.0%), and Legal Services & Support (100.0%).
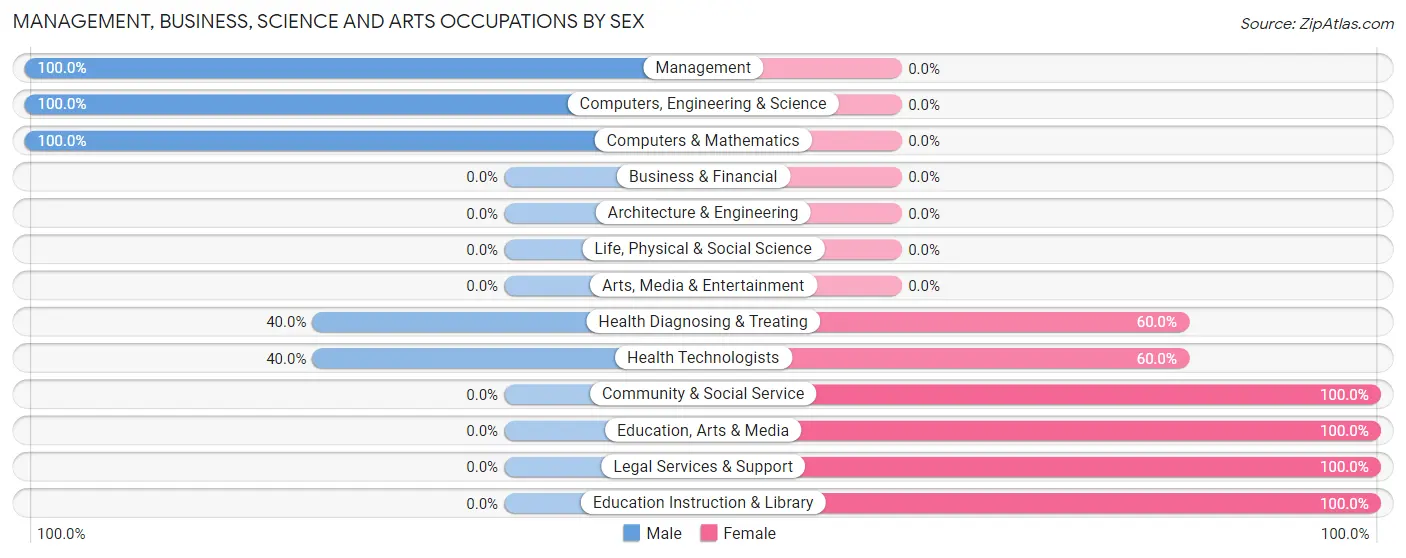
| Occupation | Male | Female |
| Management | 10 (100.0%) | 0 (0.0%) |
| Business & Financial | 0 (0.0%) | 0 (0.0%) |
| Computers, Engineering & Science | 8 (100.0%) | 0 (0.0%) |
| Computers & Mathematics | 8 (100.0%) | 0 (0.0%) |
| Architecture & Engineering | 0 (0.0%) | 0 (0.0%) |
| Life, Physical & Social Science | 0 (0.0%) | 0 (0.0%) |
| Community & Social Service | 0 (0.0%) | 30 (100.0%) |
| Education, Arts & Media | 0 (0.0%) | 9 (100.0%) |
| Legal Services & Support | 0 (0.0%) | 6 (100.0%) |
| Education Instruction & Library | 0 (0.0%) | 15 (100.0%) |
| Arts, Media & Entertainment | 0 (0.0%) | 0 (0.0%) |
| Health Diagnosing & Treating | 6 (40.0%) | 9 (60.0%) |
| Health Technologists | 6 (40.0%) | 9 (60.0%) |
| Total (Category) | 24 (38.1%) | 39 (61.9%) |
| Total (Overall) | 112 (57.1%) | 84 (42.9%) |
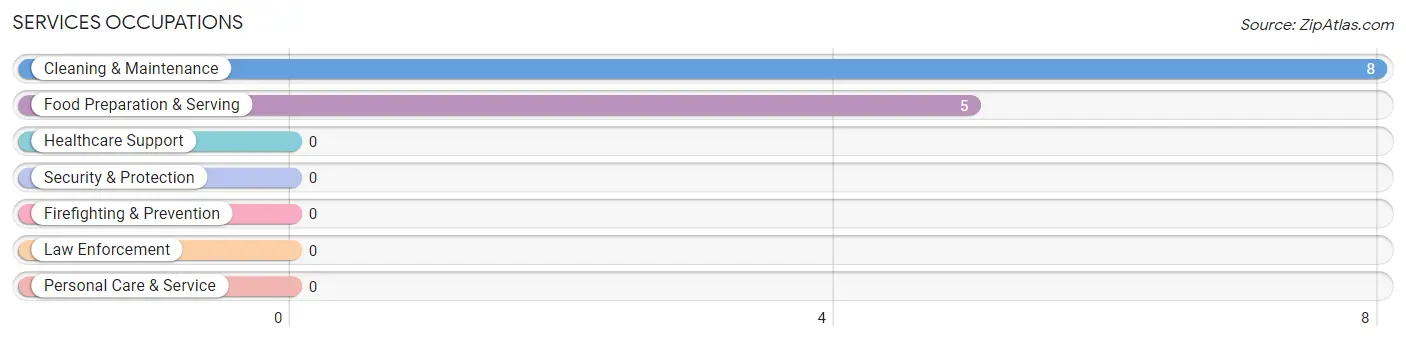
Services Occupations
The most common Services occupations in Holiday Lake are Cleaning & Maintenance (8 | 4.1%), and Food Preparation & Serving (5 | 2.5%).
Services Occupations by Sex
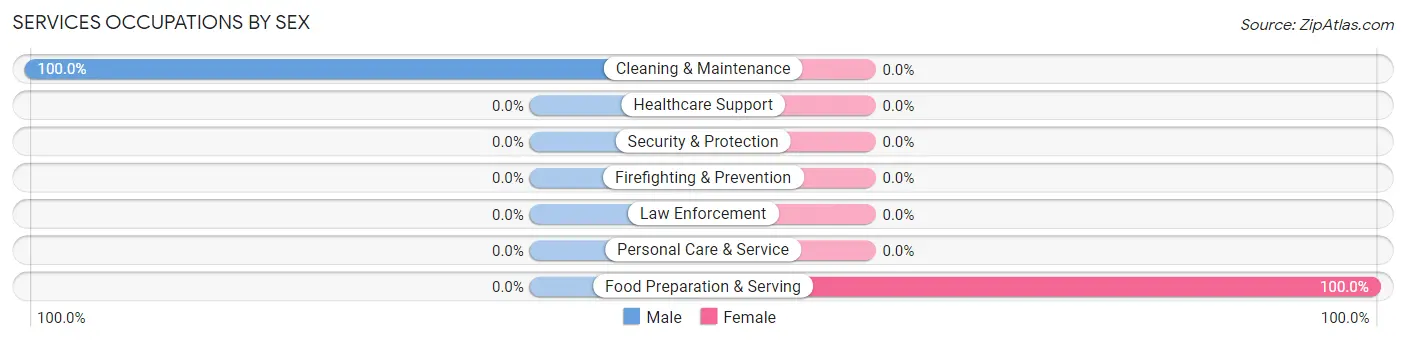
| Occupation | Male | Female |
| Healthcare Support | 0 (0.0%) | 0 (0.0%) |
| Security & Protection | 0 (0.0%) | 0 (0.0%) |
| Firefighting & Prevention | 0 (0.0%) | 0 (0.0%) |
| Law Enforcement | 0 (0.0%) | 0 (0.0%) |
| Food Preparation & Serving | 0 (0.0%) | 5 (100.0%) |
| Cleaning & Maintenance | 8 (100.0%) | 0 (0.0%) |
| Personal Care & Service | 0 (0.0%) | 0 (0.0%) |
| Total (Category) | 8 (61.5%) | 5 (38.5%) |
| Total (Overall) | 112 (57.1%) | 84 (42.9%) |
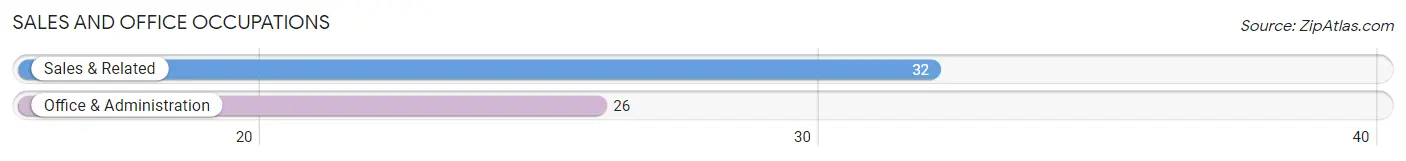
Sales and Office Occupations
The most common Sales and Office occupations in Holiday Lake are Sales & Related (32 | 16.3%), and Office & Administration (26 | 13.3%).
Sales and Office Occupations by Sex
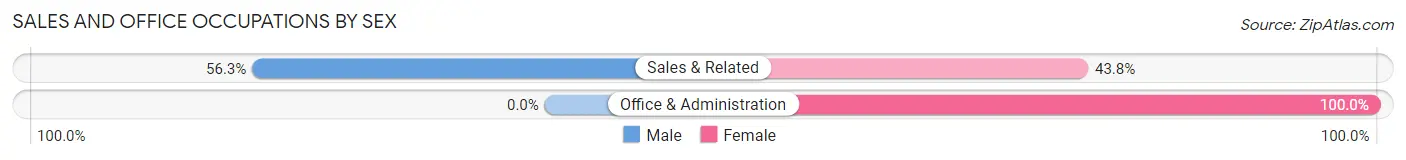
| Occupation | Male | Female |
| Sales & Related | 18 (56.2%) | 14 (43.8%) |
| Office & Administration | 0 (0.0%) | 26 (100.0%) |
| Total (Category) | 18 (31.0%) | 40 (69.0%) |
| Total (Overall) | 112 (57.1%) | 84 (42.9%) |
Natural Resources, Construction and Maintenance Occupations
The most common Natural Resources, Construction and Maintenance occupations in Holiday Lake are , and Installation, Maintenance & Repair (19 | 9.7%).
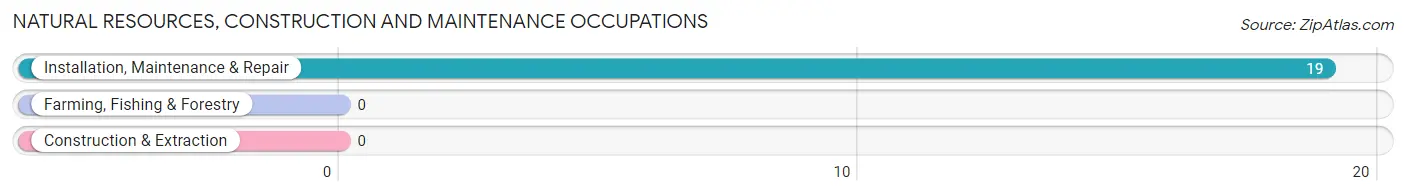
Natural Resources, Construction and Maintenance Occupations by Sex
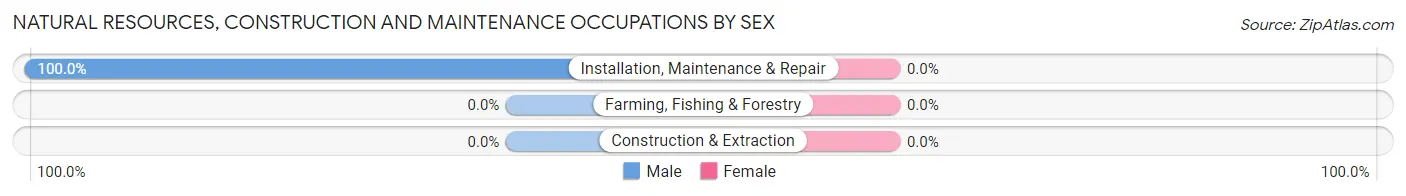
| Occupation | Male | Female |
| Farming, Fishing & Forestry | 0 (0.0%) | 0 (0.0%) |
| Construction & Extraction | 0 (0.0%) | 0 (0.0%) |
| Installation, Maintenance & Repair | 19 (100.0%) | 0 (0.0%) |
| Total (Category) | 19 (100.0%) | 0 (0.0%) |
| Total (Overall) | 112 (57.1%) | 84 (42.9%) |
Production, Transportation and Moving Occupations
The most common Production, Transportation and Moving occupations in Holiday Lake are Transportation (36 | 18.4%), and Production (7 | 3.6%).
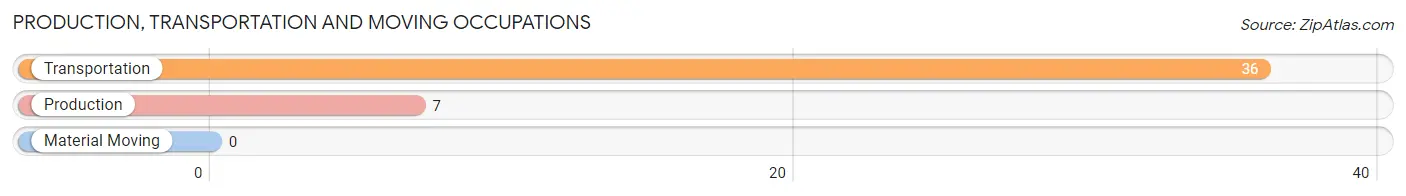
Production, Transportation and Moving Occupations by Sex
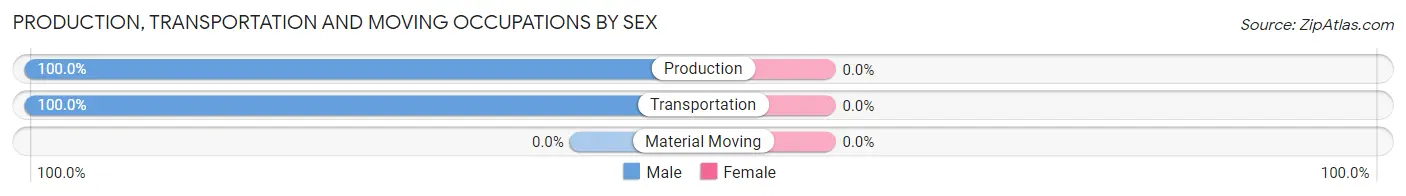
| Occupation | Male | Female |
| Production | 7 (100.0%) | 0 (0.0%) |
| Transportation | 36 (100.0%) | 0 (0.0%) |
| Material Moving | 0 (0.0%) | 0 (0.0%) |
| Total (Category) | 43 (100.0%) | 0 (0.0%) |
| Total (Overall) | 112 (57.1%) | 84 (42.9%) |
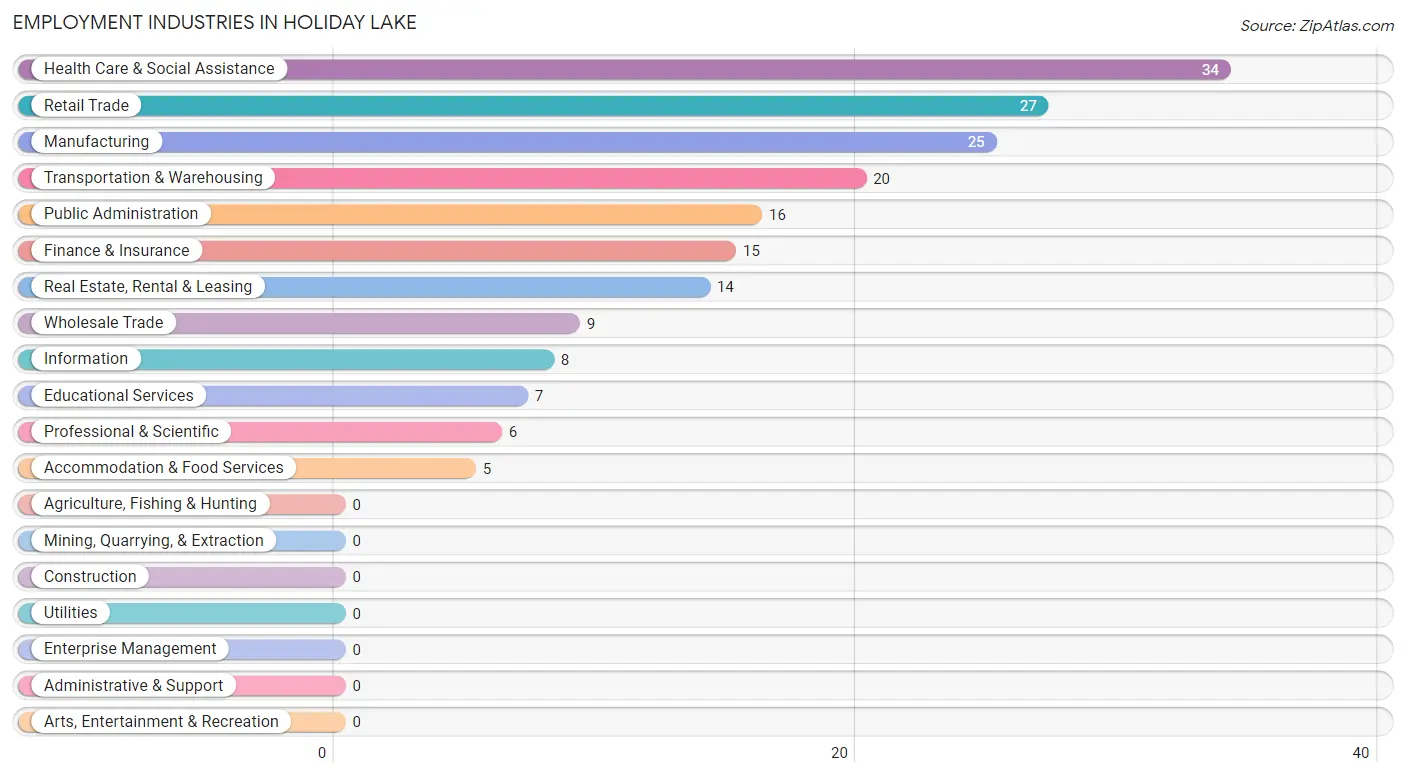
Employment Industries by Sex in Holiday Lake
Employment Industries in Holiday Lake
The major employment industries in Holiday Lake include Health Care & Social Assistance (34 | 17.3%), Retail Trade (27 | 13.8%), Manufacturing (25 | 12.8%), Transportation & Warehousing (20 | 10.2%), and Public Administration (16 | 8.2%).
Employment Industries by Sex in Holiday Lake
The Holiday Lake industries that see more men than women are Manufacturing (100.0%), Wholesale Trade (100.0%), and Transportation & Warehousing (100.0%), whereas the industries that tend to have a higher number of women are Information (100.0%), Real Estate, Rental & Leasing (100.0%), and Educational Services (100.0%).
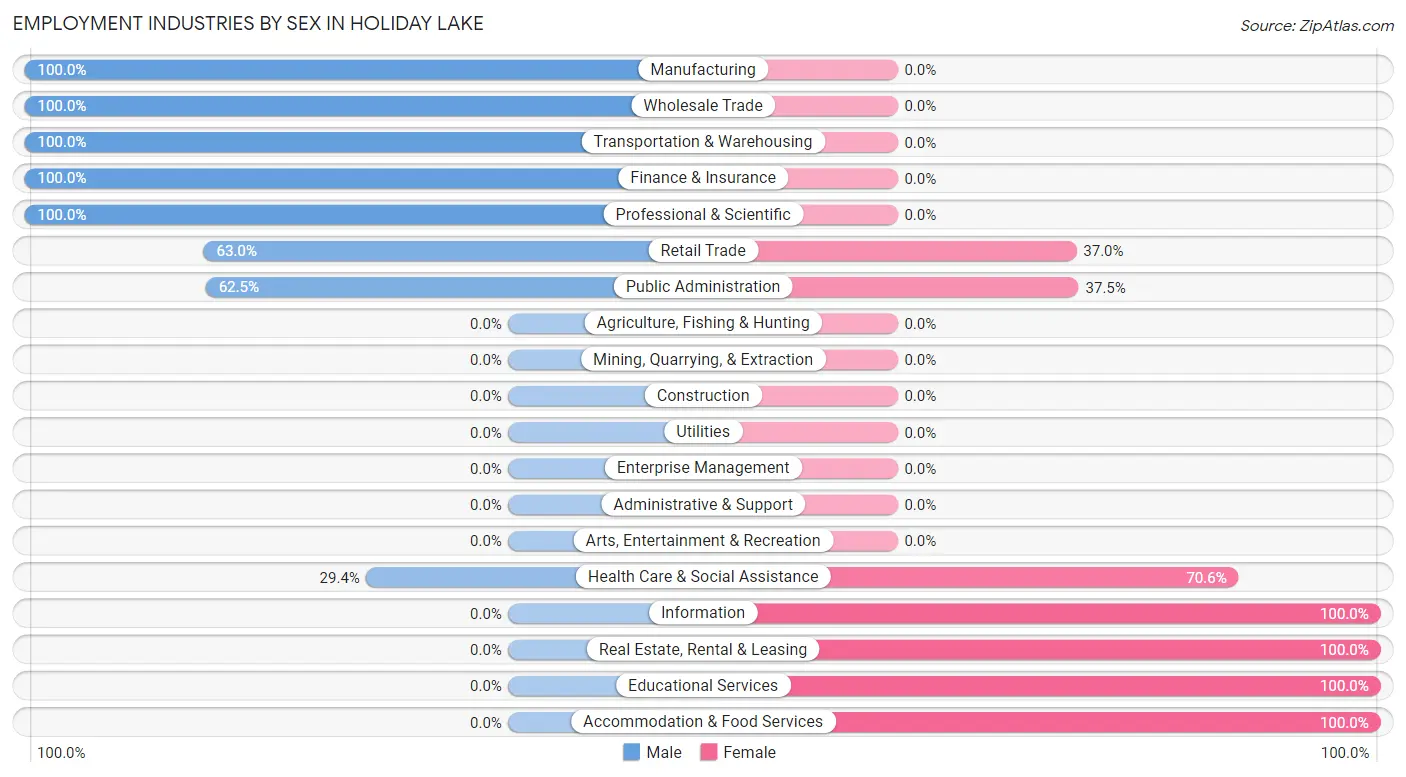
| Industry | Male | Female |
| Agriculture, Fishing & Hunting | 0 (0.0%) | 0 (0.0%) |
| Mining, Quarrying, & Extraction | 0 (0.0%) | 0 (0.0%) |
| Construction | 0 (0.0%) | 0 (0.0%) |
| Manufacturing | 25 (100.0%) | 0 (0.0%) |
| Wholesale Trade | 9 (100.0%) | 0 (0.0%) |
| Retail Trade | 17 (63.0%) | 10 (37.0%) |
| Transportation & Warehousing | 20 (100.0%) | 0 (0.0%) |
| Utilities | 0 (0.0%) | 0 (0.0%) |
| Information | 0 (0.0%) | 8 (100.0%) |
| Finance & Insurance | 15 (100.0%) | 0 (0.0%) |
| Real Estate, Rental & Leasing | 0 (0.0%) | 14 (100.0%) |
| Professional & Scientific | 6 (100.0%) | 0 (0.0%) |
| Enterprise Management | 0 (0.0%) | 0 (0.0%) |
| Administrative & Support | 0 (0.0%) | 0 (0.0%) |
| Educational Services | 0 (0.0%) | 7 (100.0%) |
| Health Care & Social Assistance | 10 (29.4%) | 24 (70.6%) |
| Arts, Entertainment & Recreation | 0 (0.0%) | 0 (0.0%) |
| Accommodation & Food Services | 0 (0.0%) | 5 (100.0%) |
| Public Administration | 10 (62.5%) | 6 (37.5%) |
| Total | 112 (57.1%) | 84 (42.9%) |
Education in Holiday Lake
School Enrollment in Holiday Lake
The most common levels of schooling among the 23 students in Holiday Lake are middle school (13 | 56.5%), and elementary school (10 | 43.5%).
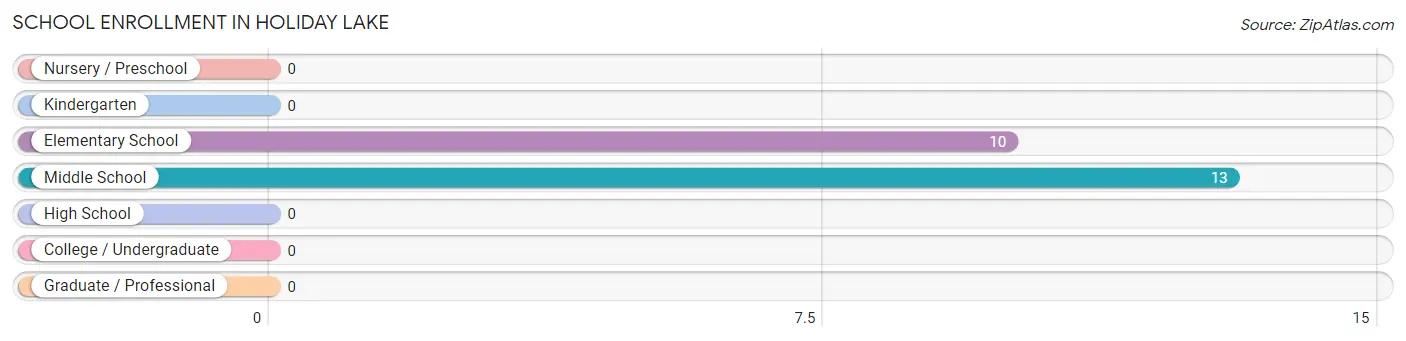
| School Level | # Students | % Students |
| Nursery / Preschool | 0 | 0.0% |
| Kindergarten | 0 | 0.0% |
| Elementary School | 10 | 43.5% |
| Middle School | 13 | 56.5% |
| High School | 0 | 0.0% |
| College / Undergraduate | 0 | 0.0% |
| Graduate / Professional | 0 | 0.0% |
| Total | 23 | 100.0% |
School Enrollment by Age by Funding Source in Holiday Lake
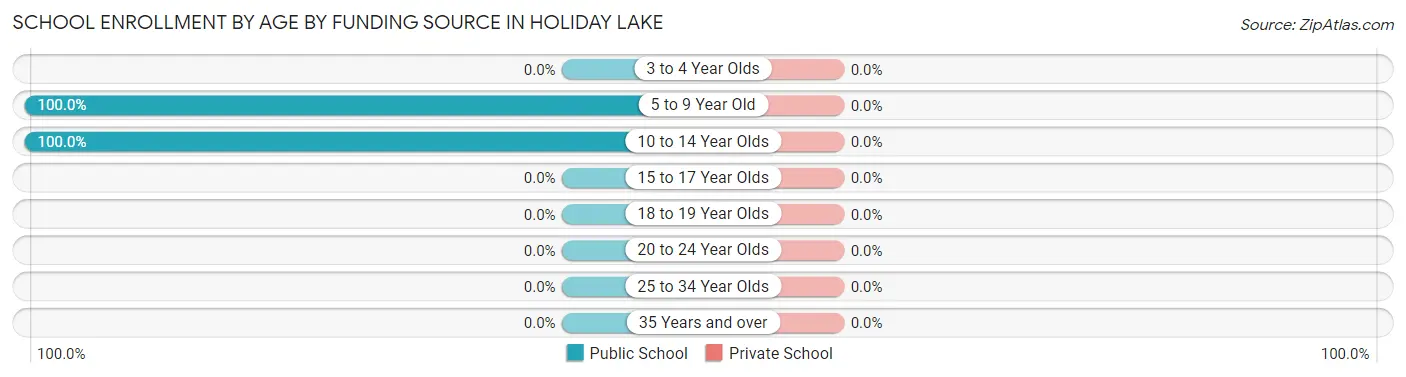
| Age Bracket | Public School | Private School |
| 3 to 4 Year Olds | 0 (0.0%) | 0 (0.0%) |
| 5 to 9 Year Old | 10 (100.0%) | 0 (0.0%) |
| 10 to 14 Year Olds | 13 (100.0%) | 0 (0.0%) |
| 15 to 17 Year Olds | 0 (0.0%) | 0 (0.0%) |
| 18 to 19 Year Olds | 0 (0.0%) | 0 (0.0%) |
| 20 to 24 Year Olds | 0 (0.0%) | 0 (0.0%) |
| 25 to 34 Year Olds | 0 (0.0%) | 0 (0.0%) |
| 35 Years and over | 0 (0.0%) | 0 (0.0%) |
| Total | 23 (100.0%) | 0 (0.0%) |
Educational Attainment by Field of Study in Holiday Lake
Education (34 | 34.0%), bio, nature & agricultural (20 | 20.0%), business (18 | 18.0%), engineering (9 | 9.0%), and liberal arts & history (8 | 8.0%) are the most common fields of study among 100 individuals in Holiday Lake who have obtained a bachelor's degree or higher.
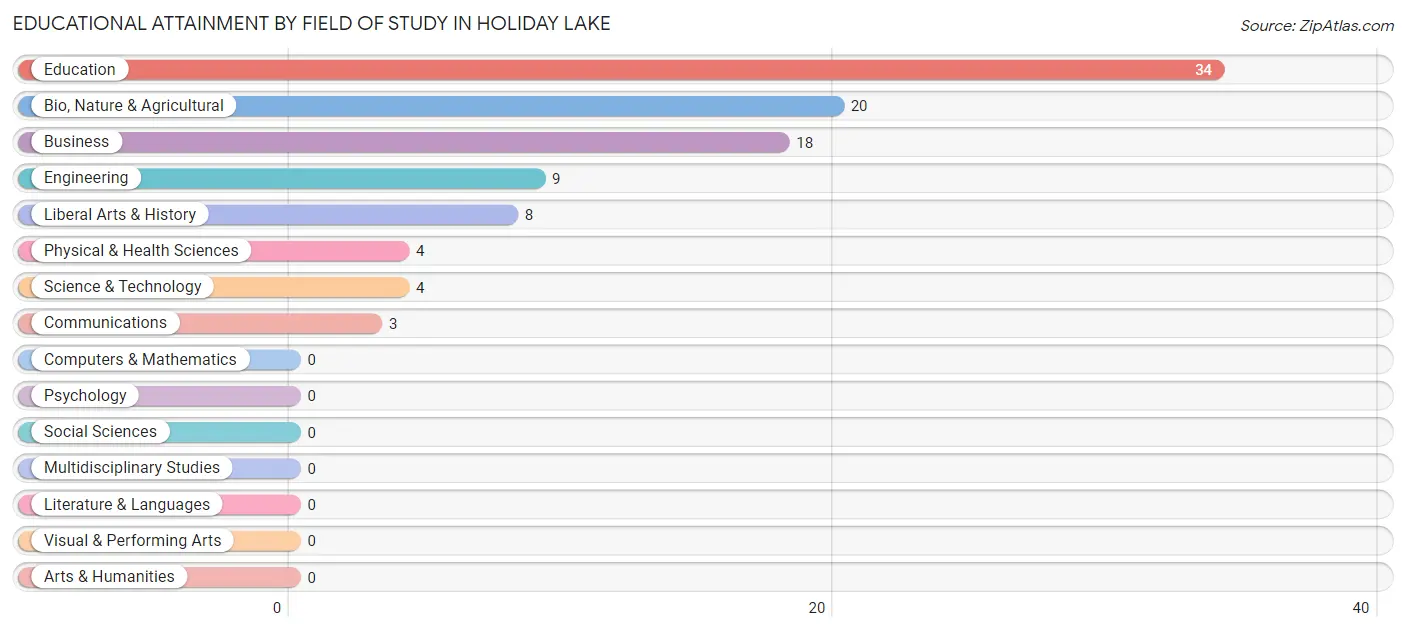
| Field of Study | # Graduates | % Graduates |
| Computers & Mathematics | 0 | 0.0% |
| Bio, Nature & Agricultural | 20 | 20.0% |
| Physical & Health Sciences | 4 | 4.0% |
| Psychology | 0 | 0.0% |
| Social Sciences | 0 | 0.0% |
| Engineering | 9 | 9.0% |
| Multidisciplinary Studies | 0 | 0.0% |
| Science & Technology | 4 | 4.0% |
| Business | 18 | 18.0% |
| Education | 34 | 34.0% |
| Literature & Languages | 0 | 0.0% |
| Liberal Arts & History | 8 | 8.0% |
| Visual & Performing Arts | 0 | 0.0% |
| Communications | 3 | 3.0% |
| Arts & Humanities | 0 | 0.0% |
| Total | 100 | 100.0% |
Transportation & Commute in Holiday Lake
Vehicle Availability by Sex in Holiday Lake
The most prevalent vehicle ownership categories in Holiday Lake are males with 1 vehicle (39, accounting for 37.1%) and females with 1 vehicle (7, making up 46.4%).
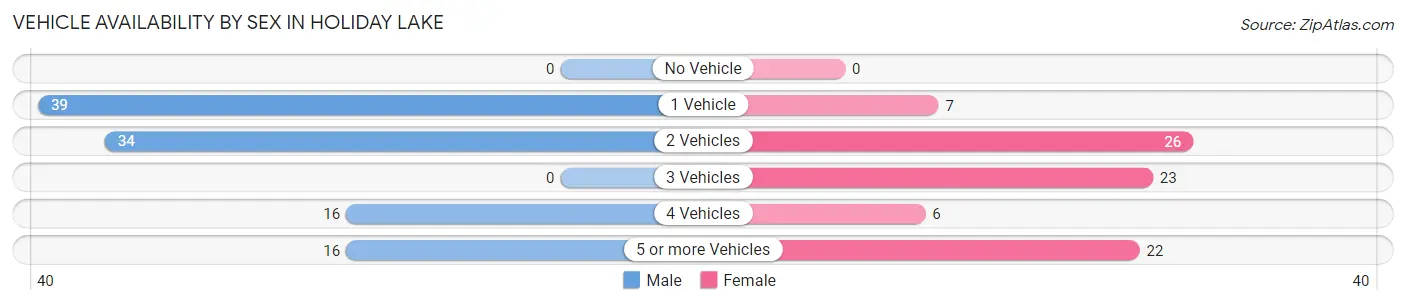
| Vehicles Available | Male | Female |
| No Vehicle | 0 (0.0%) | 0 (0.0%) |
| 1 Vehicle | 39 (37.1%) | 7 (8.3%) |
| 2 Vehicles | 34 (32.4%) | 26 (30.9%) |
| 3 Vehicles | 0 (0.0%) | 23 (27.4%) |
| 4 Vehicles | 16 (15.2%) | 6 (7.1%) |
| 5 or more Vehicles | 16 (15.2%) | 22 (26.2%) |
| Total | 105 (100.0%) | 84 (100.0%) |
Commute Time in Holiday Lake
The most frequently occuring commute durations in Holiday Lake are 30 to 34 minutes (47 commuters, 27.2%), 25 to 29 minutes (37 commuters, 21.4%), and 60 to 89 minutes (28 commuters, 16.2%).
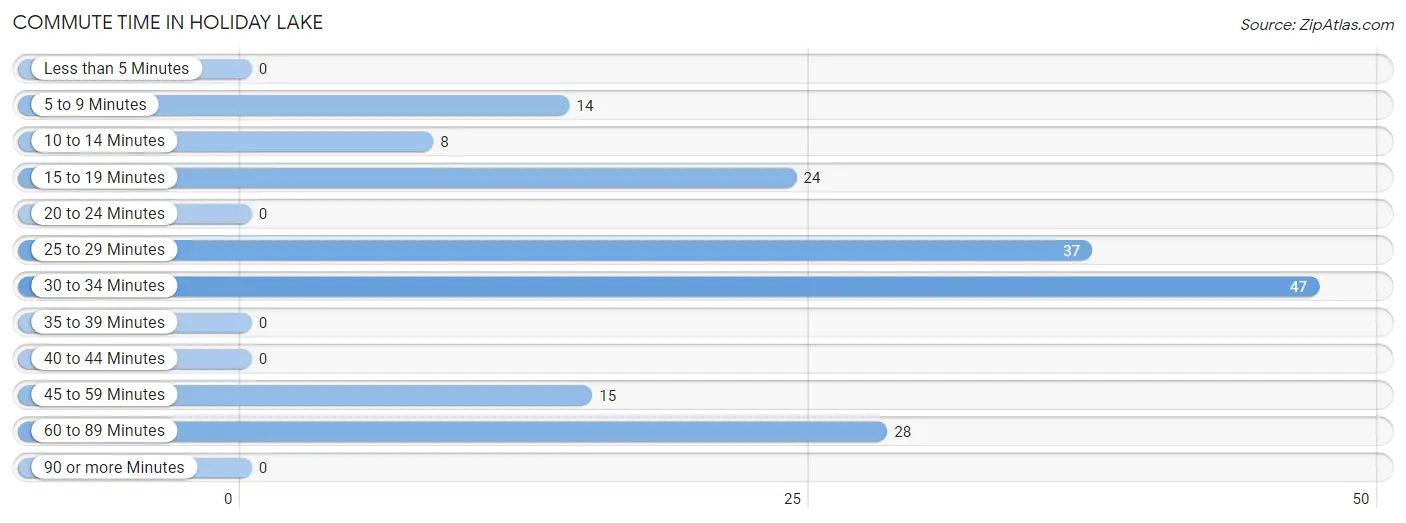
| Commute Time | # Commuters | % Commuters |
| Less than 5 Minutes | 0 | 0.0% |
| 5 to 9 Minutes | 14 | 8.1% |
| 10 to 14 Minutes | 8 | 4.6% |
| 15 to 19 Minutes | 24 | 13.9% |
| 20 to 24 Minutes | 0 | 0.0% |
| 25 to 29 Minutes | 37 | 21.4% |
| 30 to 34 Minutes | 47 | 27.2% |
| 35 to 39 Minutes | 0 | 0.0% |
| 40 to 44 Minutes | 0 | 0.0% |
| 45 to 59 Minutes | 15 | 8.7% |
| 60 to 89 Minutes | 28 | 16.2% |
| 90 or more Minutes | 0 | 0.0% |
Commute Time by Sex in Holiday Lake
The most common commute times in Holiday Lake are 60 to 89 minutes (28 commuters, 29.5%) for males and 25 to 29 minutes (28 commuters, 35.9%) for females.
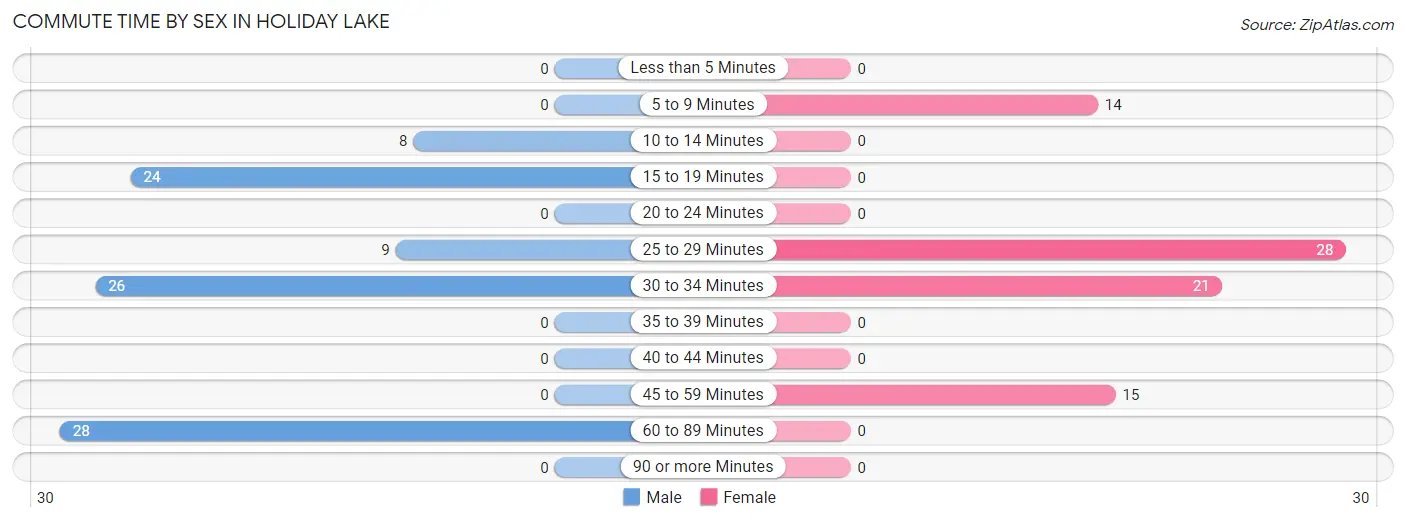
| Commute Time | Male | Female |
| Less than 5 Minutes | 0 (0.0%) | 0 (0.0%) |
| 5 to 9 Minutes | 0 (0.0%) | 14 (17.9%) |
| 10 to 14 Minutes | 8 (8.4%) | 0 (0.0%) |
| 15 to 19 Minutes | 24 (25.3%) | 0 (0.0%) |
| 20 to 24 Minutes | 0 (0.0%) | 0 (0.0%) |
| 25 to 29 Minutes | 9 (9.5%) | 28 (35.9%) |
| 30 to 34 Minutes | 26 (27.4%) | 21 (26.9%) |
| 35 to 39 Minutes | 0 (0.0%) | 0 (0.0%) |
| 40 to 44 Minutes | 0 (0.0%) | 0 (0.0%) |
| 45 to 59 Minutes | 0 (0.0%) | 15 (19.2%) |
| 60 to 89 Minutes | 28 (29.5%) | 0 (0.0%) |
| 90 or more Minutes | 0 (0.0%) | 0 (0.0%) |
Time of Departure to Work by Sex in Holiday Lake
The most frequent times of departure to work in Holiday Lake are 8:00 AM to 8:29 AM (20, 21.0%) for males and 7:30 AM to 7:59 AM (22, 28.2%) for females.
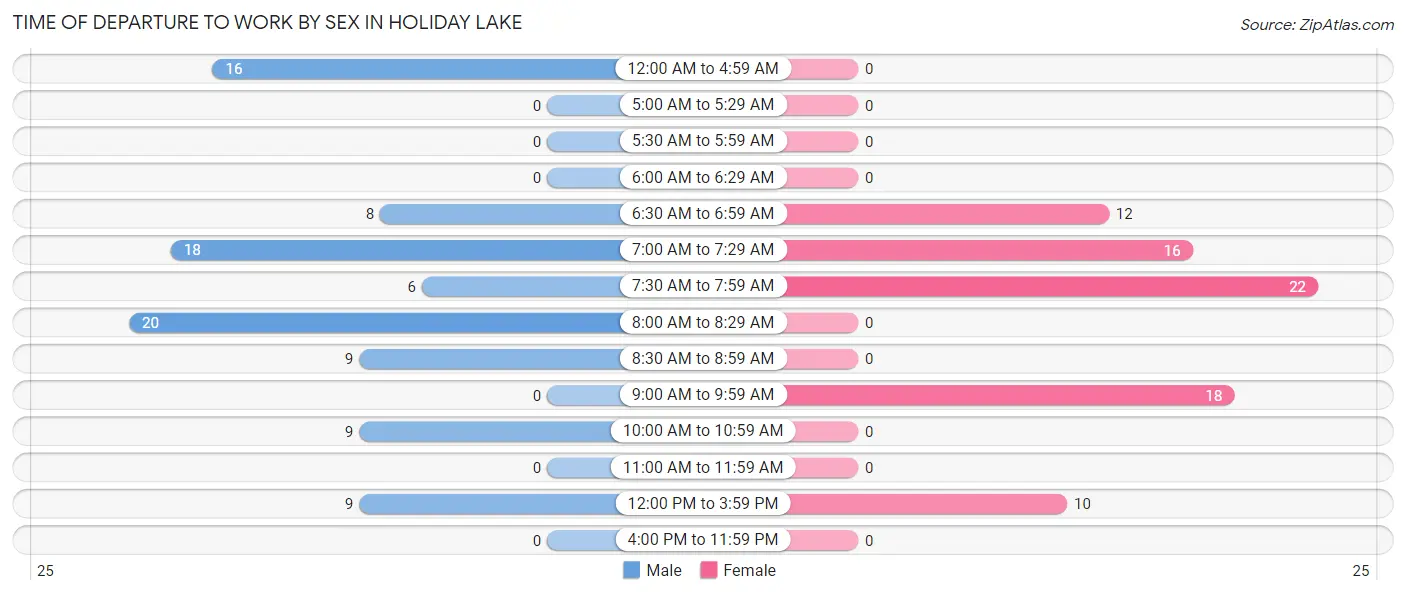
| Time of Departure | Male | Female |
| 12:00 AM to 4:59 AM | 16 (16.8%) | 0 (0.0%) |
| 5:00 AM to 5:29 AM | 0 (0.0%) | 0 (0.0%) |
| 5:30 AM to 5:59 AM | 0 (0.0%) | 0 (0.0%) |
| 6:00 AM to 6:29 AM | 0 (0.0%) | 0 (0.0%) |
| 6:30 AM to 6:59 AM | 8 (8.4%) | 12 (15.4%) |
| 7:00 AM to 7:29 AM | 18 (19.0%) | 16 (20.5%) |
| 7:30 AM to 7:59 AM | 6 (6.3%) | 22 (28.2%) |
| 8:00 AM to 8:29 AM | 20 (21.0%) | 0 (0.0%) |
| 8:30 AM to 8:59 AM | 9 (9.5%) | 0 (0.0%) |
| 9:00 AM to 9:59 AM | 0 (0.0%) | 18 (23.1%) |
| 10:00 AM to 10:59 AM | 9 (9.5%) | 0 (0.0%) |
| 11:00 AM to 11:59 AM | 0 (0.0%) | 0 (0.0%) |
| 12:00 PM to 3:59 PM | 9 (9.5%) | 10 (12.8%) |
| 4:00 PM to 11:59 PM | 0 (0.0%) | 0 (0.0%) |
| Total | 95 (100.0%) | 78 (100.0%) |
Housing Occupancy in Holiday Lake
Occupancy by Ownership in Holiday Lake
Of the total 224 dwellings in Holiday Lake, owner-occupied units account for 214 (95.5%), while renter-occupied units make up 10 (4.5%).
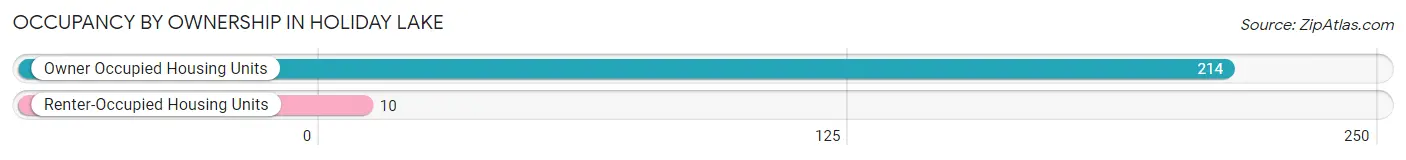
| Occupancy | # Housing Units | % Housing Units |
| Owner Occupied Housing Units | 214 | 95.5% |
| Renter-Occupied Housing Units | 10 | 4.5% |
| Total Occupied Housing Units | 224 | 100.0% |
Occupancy by Household Size in Holiday Lake
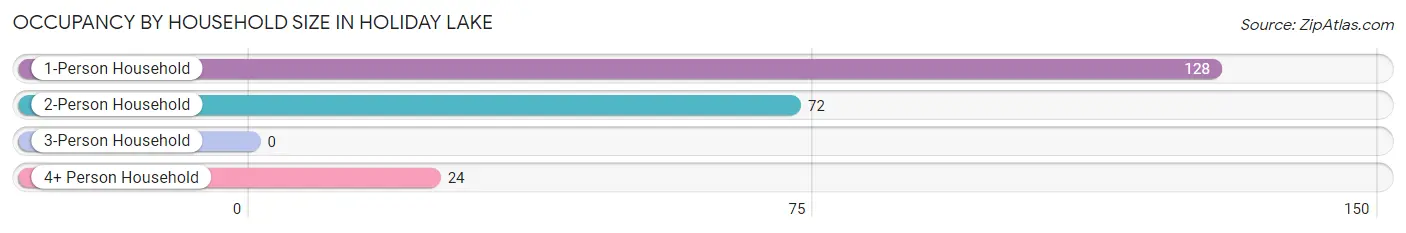
| Household Size | # Housing Units | % Housing Units |
| 1-Person Household | 128 | 57.1% |
| 2-Person Household | 72 | 32.1% |
| 3-Person Household | 0 | 0.0% |
| 4+ Person Household | 24 | 10.7% |
| Total Housing Units | 224 | 100.0% |
Occupancy by Ownership by Household Size in Holiday Lake
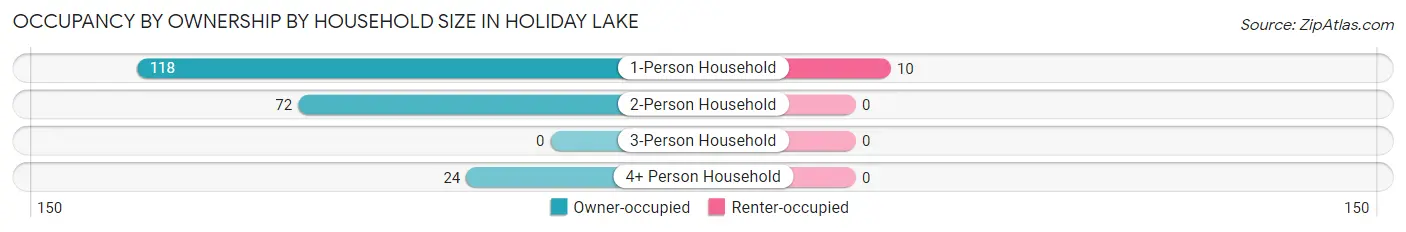
| Household Size | Owner-occupied | Renter-occupied |
| 1-Person Household | 118 (92.2%) | 10 (7.8%) |
| 2-Person Household | 72 (100.0%) | 0 (0.0%) |
| 3-Person Household | 0 (0.0%) | 0 (0.0%) |
| 4+ Person Household | 24 (100.0%) | 0 (0.0%) |
| Total Housing Units | 214 (95.5%) | 10 (4.5%) |
Occupancy by Educational Attainment in Holiday Lake
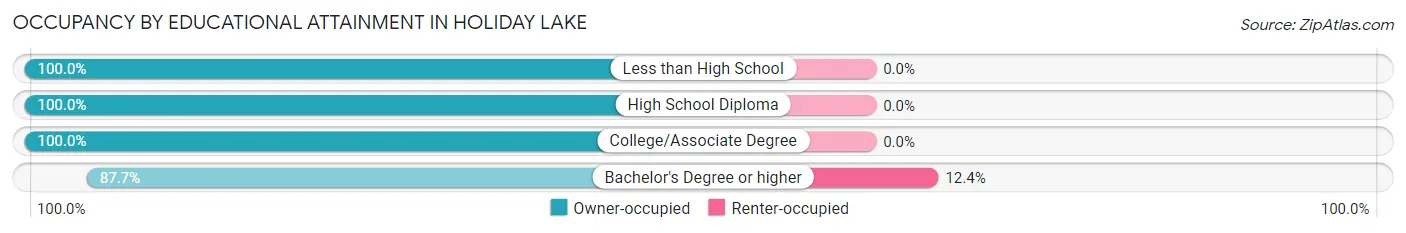
| Household Size | Owner-occupied | Renter-occupied |
| Less than High School | 11 (100.0%) | 0 (0.0%) |
| High School Diploma | 63 (100.0%) | 0 (0.0%) |
| College/Associate Degree | 69 (100.0%) | 0 (0.0%) |
| Bachelor's Degree or higher | 71 (87.6%) | 10 (12.3%) |
Occupancy by Age of Householder in Holiday Lake
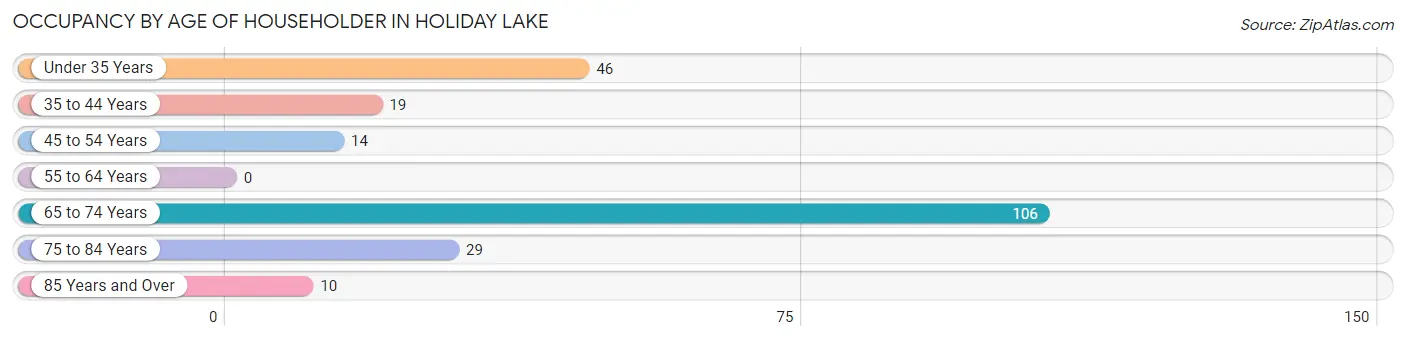
| Age Bracket | # Households | % Households |
| Under 35 Years | 46 | 20.5% |
| 35 to 44 Years | 19 | 8.5% |
| 45 to 54 Years | 14 | 6.2% |
| 55 to 64 Years | 0 | 0.0% |
| 65 to 74 Years | 106 | 47.3% |
| 75 to 84 Years | 29 | 13.0% |
| 85 Years and Over | 10 | 4.5% |
| Total | 224 | 100.0% |
Housing Finances in Holiday Lake
Median Income by Occupancy in Holiday Lake
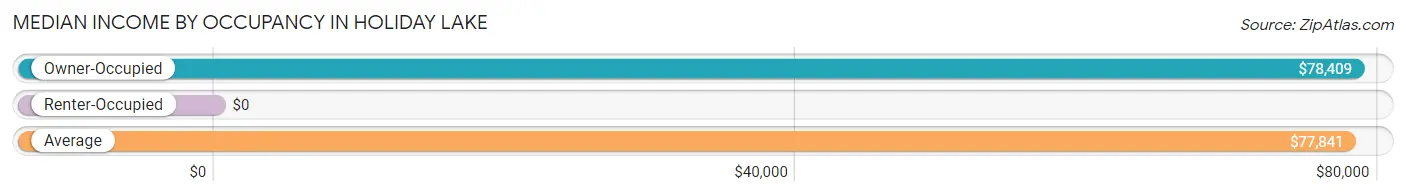
| Occupancy Type | # Households | Median Income |
| Owner-Occupied | 214 (95.5%) | $78,409 |
| Renter-Occupied | 10 (4.5%) | $0 |
| Average | 224 (100.0%) | $77,841 |
Occupancy by Householder Income Bracket in Holiday Lake
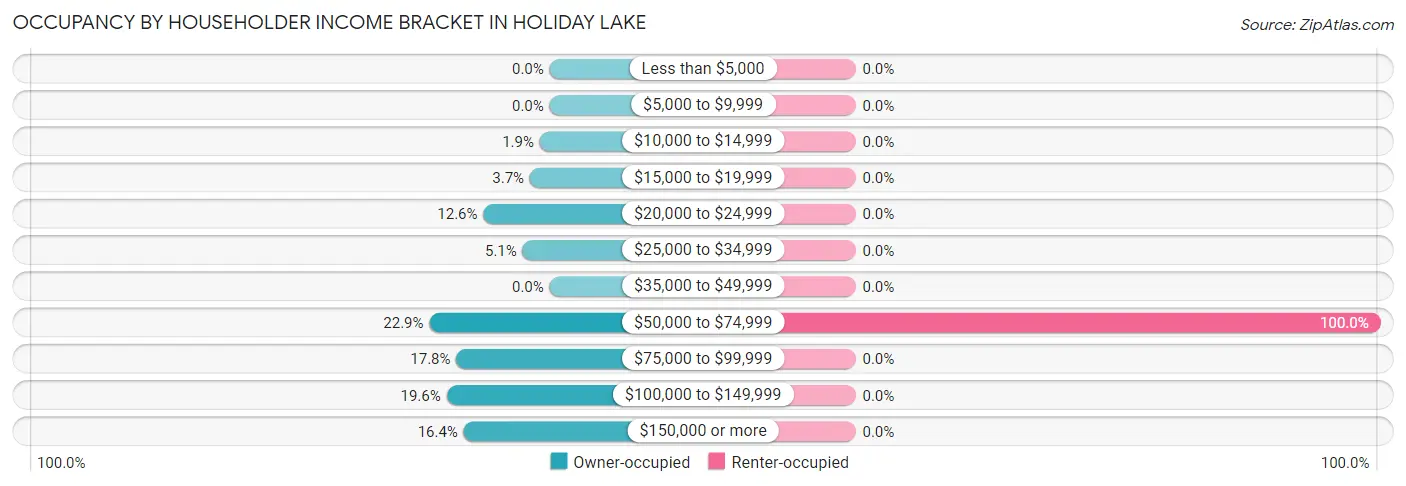
| Income Bracket | Owner-occupied | Renter-occupied |
| Less than $5,000 | 0 (0.0%) | 0 (0.0%) |
| $5,000 to $9,999 | 0 (0.0%) | 0 (0.0%) |
| $10,000 to $14,999 | 4 (1.9%) | 0 (0.0%) |
| $15,000 to $19,999 | 8 (3.7%) | 0 (0.0%) |
| $20,000 to $24,999 | 27 (12.6%) | 0 (0.0%) |
| $25,000 to $34,999 | 11 (5.1%) | 0 (0.0%) |
| $35,000 to $49,999 | 0 (0.0%) | 0 (0.0%) |
| $50,000 to $74,999 | 49 (22.9%) | 10 (100.0%) |
| $75,000 to $99,999 | 38 (17.8%) | 0 (0.0%) |
| $100,000 to $149,999 | 42 (19.6%) | 0 (0.0%) |
| $150,000 or more | 35 (16.4%) | 0 (0.0%) |
| Total | 214 (100.0%) | 10 (100.0%) |
Monthly Housing Cost Tiers in Holiday Lake
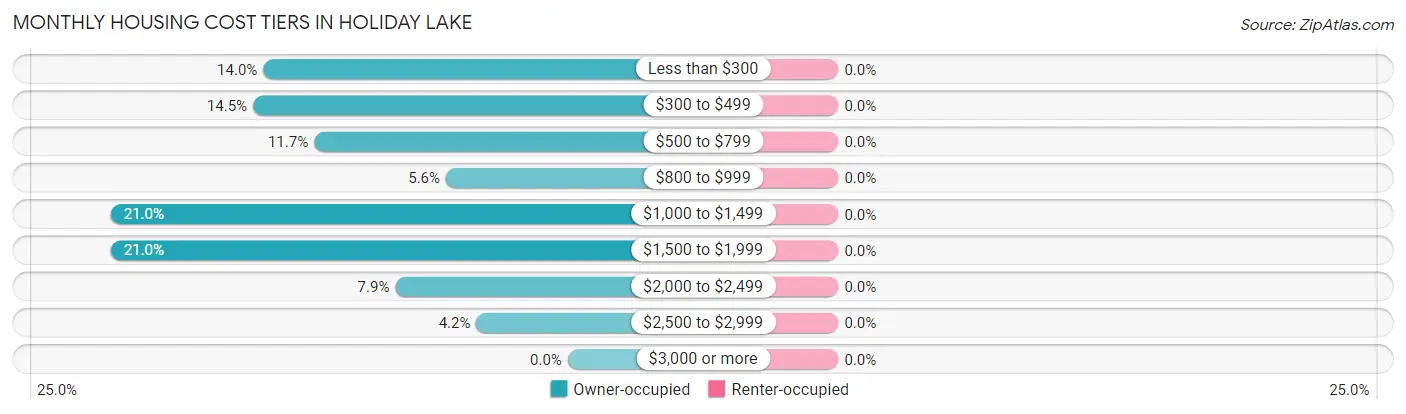
| Monthly Cost | Owner-occupied | Renter-occupied |
| Less than $300 | 30 (14.0%) | 0 (0.0%) |
| $300 to $499 | 31 (14.5%) | 0 (0.0%) |
| $500 to $799 | 25 (11.7%) | 0 (0.0%) |
| $800 to $999 | 12 (5.6%) | 0 (0.0%) |
| $1,000 to $1,499 | 45 (21.0%) | 0 (0.0%) |
| $1,500 to $1,999 | 45 (21.0%) | 0 (0.0%) |
| $2,000 to $2,499 | 17 (7.9%) | 0 (0.0%) |
| $2,500 to $2,999 | 9 (4.2%) | 0 (0.0%) |
| $3,000 or more | 0 (0.0%) | 0 (0.0%) |
| Total | 214 (100.0%) | 10 (100.0%) |
Physical Housing Characteristics in Holiday Lake
Housing Structures in Holiday Lake
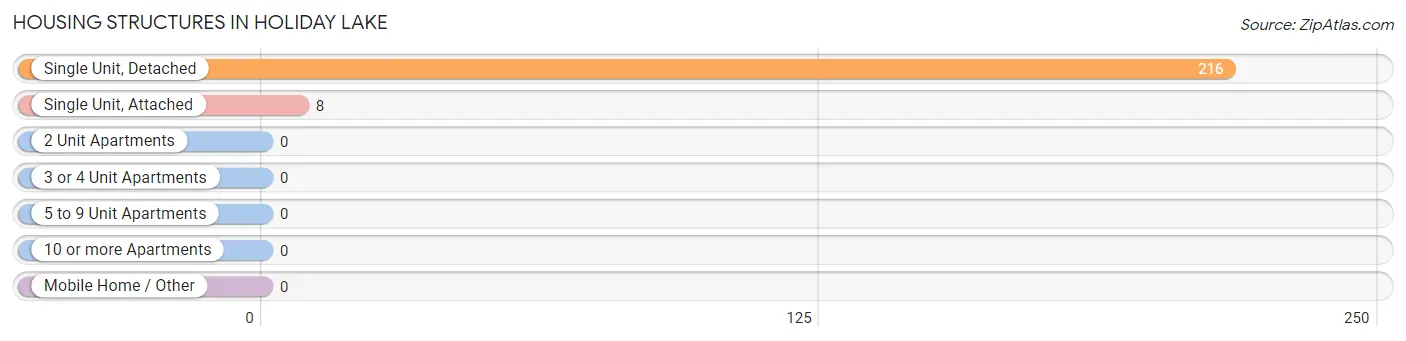
| Structure Type | # Housing Units | % Housing Units |
| Single Unit, Detached | 216 | 96.4% |
| Single Unit, Attached | 8 | 3.6% |
| 2 Unit Apartments | 0 | 0.0% |
| 3 or 4 Unit Apartments | 0 | 0.0% |
| 5 to 9 Unit Apartments | 0 | 0.0% |
| 10 or more Apartments | 0 | 0.0% |
| Mobile Home / Other | 0 | 0.0% |
| Total | 224 | 100.0% |
Housing Structures by Occupancy in Holiday Lake
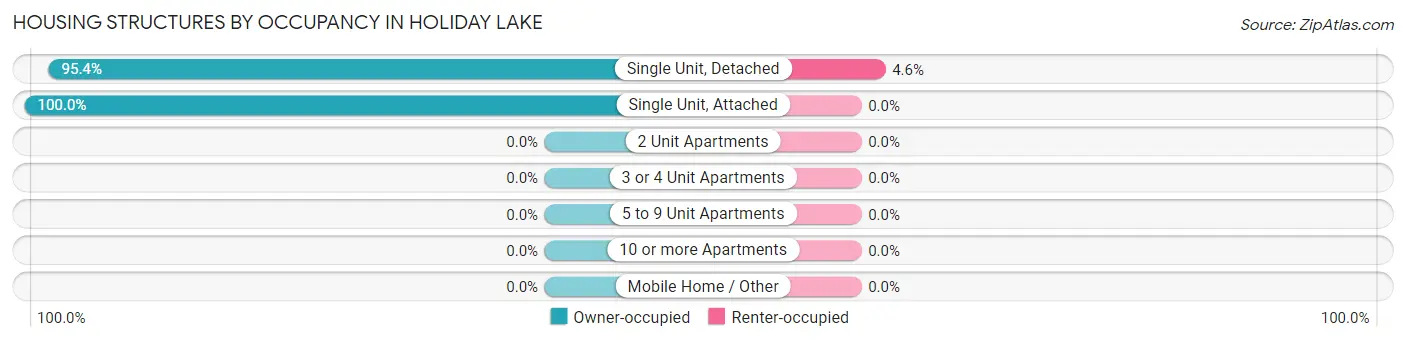
| Structure Type | Owner-occupied | Renter-occupied |
| Single Unit, Detached | 206 (95.4%) | 10 (4.6%) |
| Single Unit, Attached | 8 (100.0%) | 0 (0.0%) |
| 2 Unit Apartments | 0 (0.0%) | 0 (0.0%) |
| 3 or 4 Unit Apartments | 0 (0.0%) | 0 (0.0%) |
| 5 to 9 Unit Apartments | 0 (0.0%) | 0 (0.0%) |
| 10 or more Apartments | 0 (0.0%) | 0 (0.0%) |
| Mobile Home / Other | 0 (0.0%) | 0 (0.0%) |
| Total | 214 (95.5%) | 10 (4.5%) |
Housing Structures by Number of Rooms in Holiday Lake
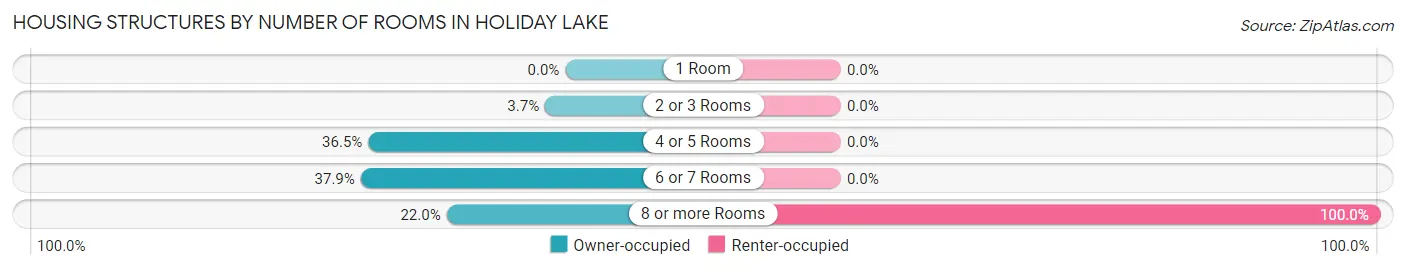
| Number of Rooms | Owner-occupied | Renter-occupied |
| 1 Room | 0 (0.0%) | 0 (0.0%) |
| 2 or 3 Rooms | 8 (3.7%) | 0 (0.0%) |
| 4 or 5 Rooms | 78 (36.4%) | 0 (0.0%) |
| 6 or 7 Rooms | 81 (37.9%) | 0 (0.0%) |
| 8 or more Rooms | 47 (22.0%) | 10 (100.0%) |
| Total | 214 (100.0%) | 10 (100.0%) |
Housing Structure by Heating Type in Holiday Lake
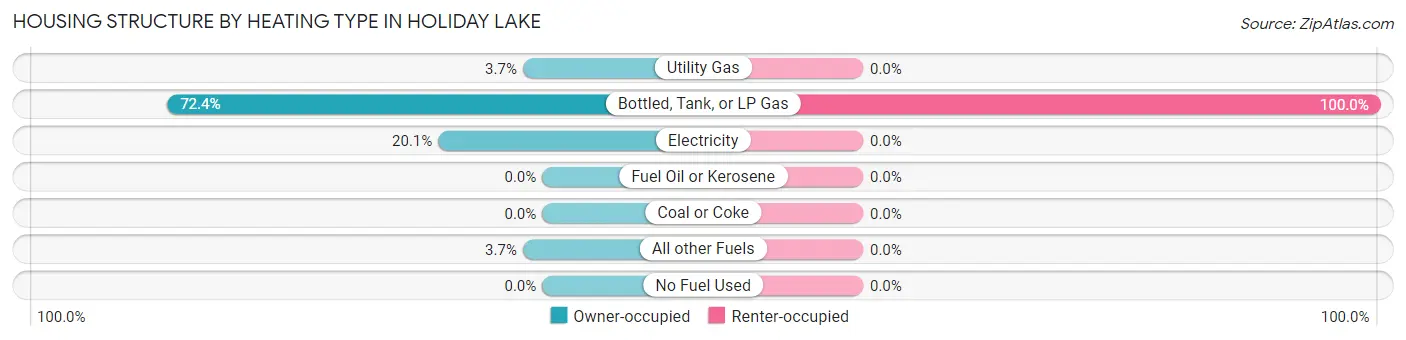
| Heating Type | Owner-occupied | Renter-occupied |
| Utility Gas | 8 (3.7%) | 0 (0.0%) |
| Bottled, Tank, or LP Gas | 155 (72.4%) | 10 (100.0%) |
| Electricity | 43 (20.1%) | 0 (0.0%) |
| Fuel Oil or Kerosene | 0 (0.0%) | 0 (0.0%) |
| Coal or Coke | 0 (0.0%) | 0 (0.0%) |
| All other Fuels | 8 (3.7%) | 0 (0.0%) |
| No Fuel Used | 0 (0.0%) | 0 (0.0%) |
| Total | 214 (100.0%) | 10 (100.0%) |
Household Vehicle Usage in Holiday Lake
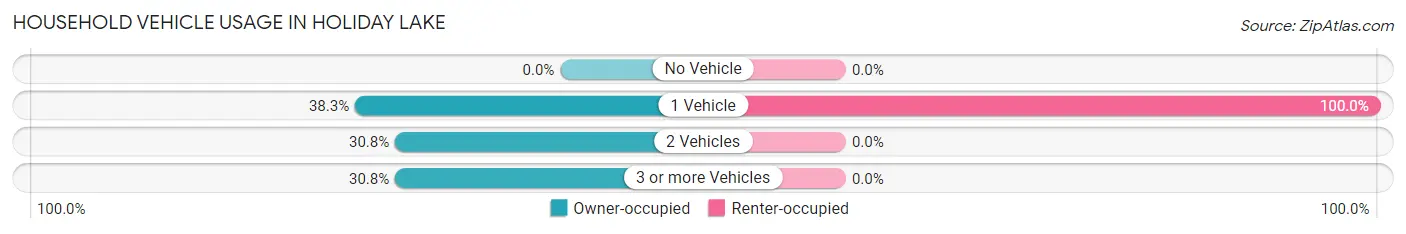
| Vehicles per Household | Owner-occupied | Renter-occupied |
| No Vehicle | 0 (0.0%) | 0 (0.0%) |
| 1 Vehicle | 82 (38.3%) | 10 (100.0%) |
| 2 Vehicles | 66 (30.8%) | 0 (0.0%) |
| 3 or more Vehicles | 66 (30.8%) | 0 (0.0%) |
| Total | 214 (100.0%) | 10 (100.0%) |
Real Estate & Mortgages in Holiday Lake
Real Estate and Mortgage Overview in Holiday Lake
| Characteristic | Without Mortgage | With Mortgage |
| Housing Units | 107 | 107 |
| Median Property Value | - | - |
| Median Household Income | - | - |
| Monthly Housing Costs | $399 | $0 |
| Real Estate Taxes | - | - |
Property Value by Mortgage Status in Holiday Lake
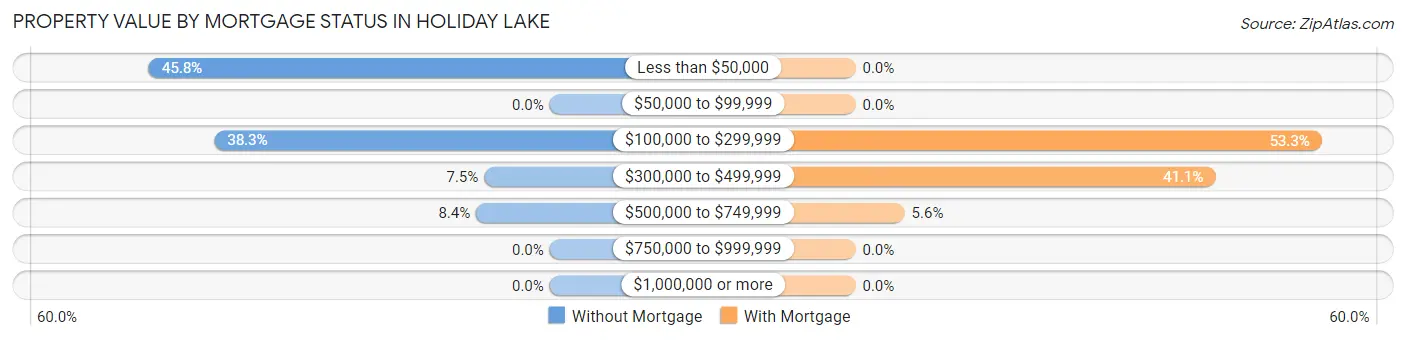
| Property Value | Without Mortgage | With Mortgage |
| Less than $50,000 | 49 (45.8%) | 0 (0.0%) |
| $50,000 to $99,999 | 0 (0.0%) | 0 (0.0%) |
| $100,000 to $299,999 | 41 (38.3%) | 57 (53.3%) |
| $300,000 to $499,999 | 8 (7.5%) | 44 (41.1%) |
| $500,000 to $749,999 | 9 (8.4%) | 6 (5.6%) |
| $750,000 to $999,999 | 0 (0.0%) | 0 (0.0%) |
| $1,000,000 or more | 0 (0.0%) | 0 (0.0%) |
| Total | 107 (100.0%) | 107 (100.0%) |
Household Income by Mortgage Status in Holiday Lake
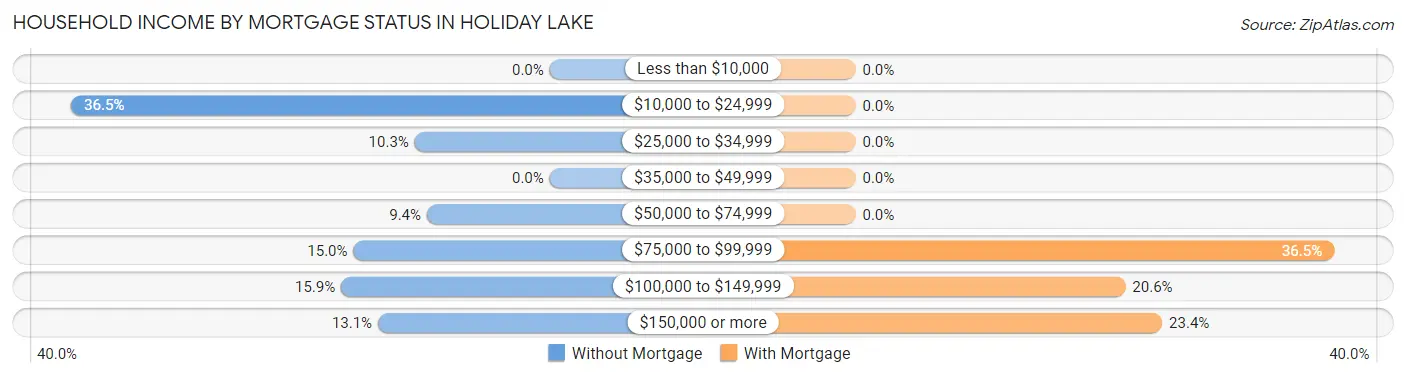
| Household Income | Without Mortgage | With Mortgage |
| Less than $10,000 | 0 (0.0%) | 0 (0.0%) |
| $10,000 to $24,999 | 39 (36.4%) | 0 (0.0%) |
| $25,000 to $34,999 | 11 (10.3%) | 0 (0.0%) |
| $35,000 to $49,999 | 0 (0.0%) | 0 (0.0%) |
| $50,000 to $74,999 | 10 (9.3%) | 0 (0.0%) |
| $75,000 to $99,999 | 16 (14.9%) | 39 (36.4%) |
| $100,000 to $149,999 | 17 (15.9%) | 22 (20.6%) |
| $150,000 or more | 14 (13.1%) | 25 (23.4%) |
| Total | 107 (100.0%) | 107 (100.0%) |
Property Value to Household Income Ratio in Holiday Lake
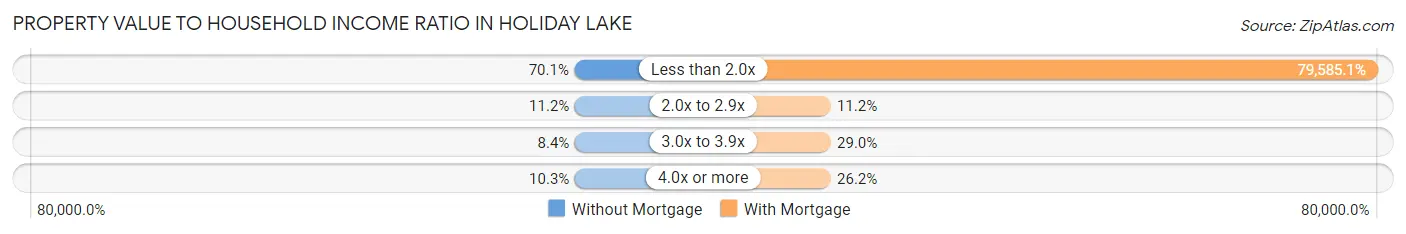
| Value-to-Income Ratio | Without Mortgage | With Mortgage |
| Less than 2.0x | 75 (70.1%) | 85,156 (79,585.1%) |
| 2.0x to 2.9x | 12 (11.2%) | 12 (11.2%) |
| 3.0x to 3.9x | 9 (8.4%) | 31 (29.0%) |
| 4.0x or more | 11 (10.3%) | 28 (26.2%) |
| Total | 107 (100.0%) | 107 (100.0%) |
Real Estate Taxes by Mortgage Status in Holiday Lake
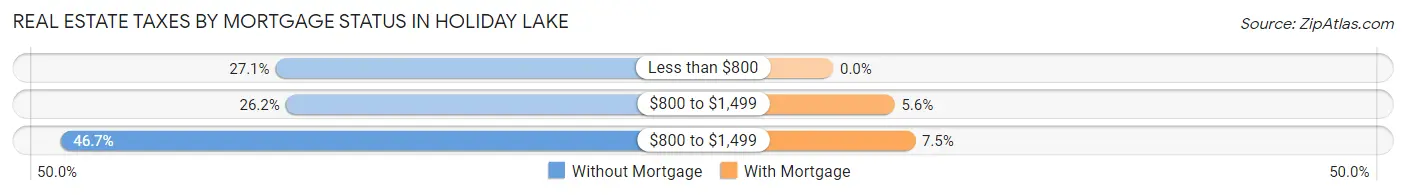
| Property Taxes | Without Mortgage | With Mortgage |
| Less than $800 | 29 (27.1%) | 0 (0.0%) |
| $800 to $1,499 | 28 (26.2%) | 6 (5.6%) |
| $800 to $1,499 | 50 (46.7%) | 8 (7.5%) |
| Total | 107 (100.0%) | 107 (100.0%) |
Health & Disability in Holiday Lake
Health Insurance Coverage by Age in Holiday Lake
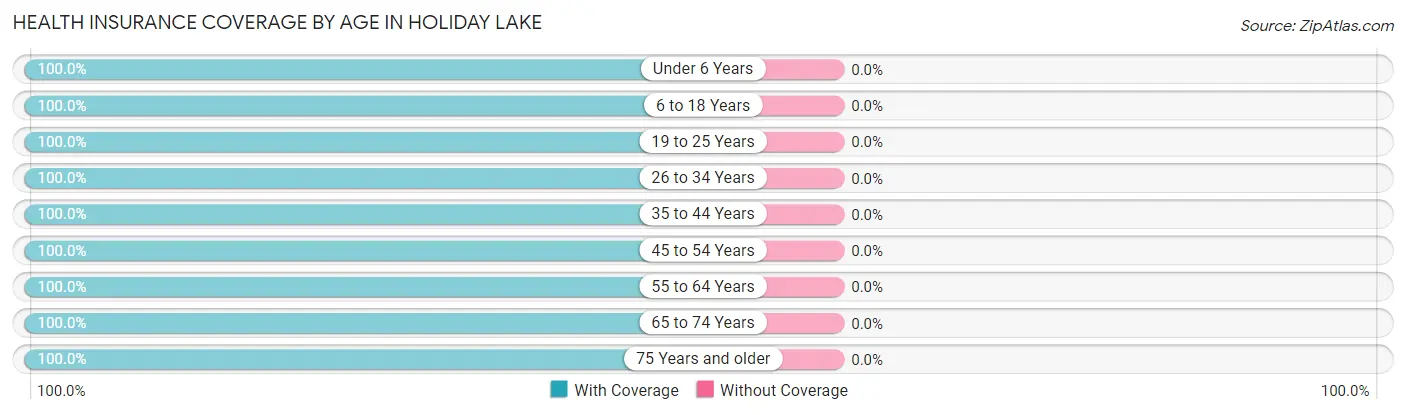
| Age Bracket | With Coverage | Without Coverage |
| Under 6 Years | 7 (100.0%) | 0 (0.0%) |
| 6 to 18 Years | 23 (100.0%) | 0 (0.0%) |
| 19 to 25 Years | 19 (100.0%) | 0 (0.0%) |
| 26 to 34 Years | 55 (100.0%) | 0 (0.0%) |
| 35 to 44 Years | 29 (100.0%) | 0 (0.0%) |
| 45 to 54 Years | 28 (100.0%) | 0 (0.0%) |
| 55 to 64 Years | 39 (100.0%) | 0 (0.0%) |
| 65 to 74 Years | 129 (100.0%) | 0 (0.0%) |
| 75 Years and older | 42 (100.0%) | 0 (0.0%) |
| Total | 371 (100.0%) | 0 (0.0%) |
Health Insurance Coverage by Citizenship Status in Holiday Lake
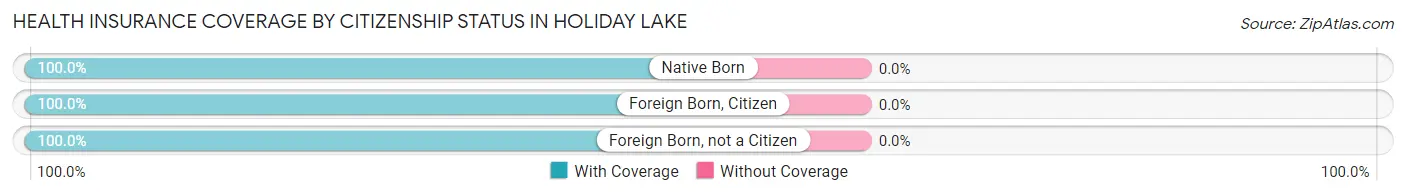
| Citizenship Status | With Coverage | Without Coverage |
| Native Born | 7 (100.0%) | 0 (0.0%) |
| Foreign Born, Citizen | 23 (100.0%) | 0 (0.0%) |
| Foreign Born, not a Citizen | 19 (100.0%) | 0 (0.0%) |
Health Insurance Coverage by Household Income in Holiday Lake
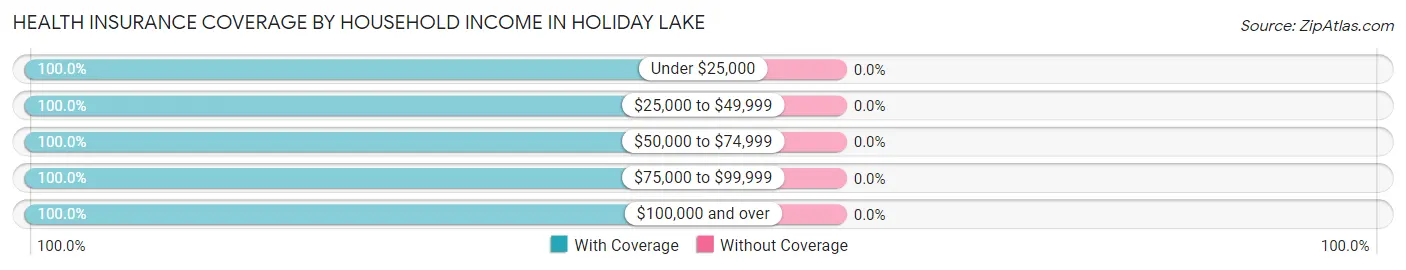
| Household Income | With Coverage | Without Coverage |
| Under $25,000 | 49 (100.0%) | 0 (0.0%) |
| $25,000 to $49,999 | 11 (100.0%) | 0 (0.0%) |
| $50,000 to $74,999 | 88 (100.0%) | 0 (0.0%) |
| $75,000 to $99,999 | 95 (100.0%) | 0 (0.0%) |
| $100,000 and over | 128 (100.0%) | 0 (0.0%) |
Public vs Private Health Insurance Coverage by Age in Holiday Lake
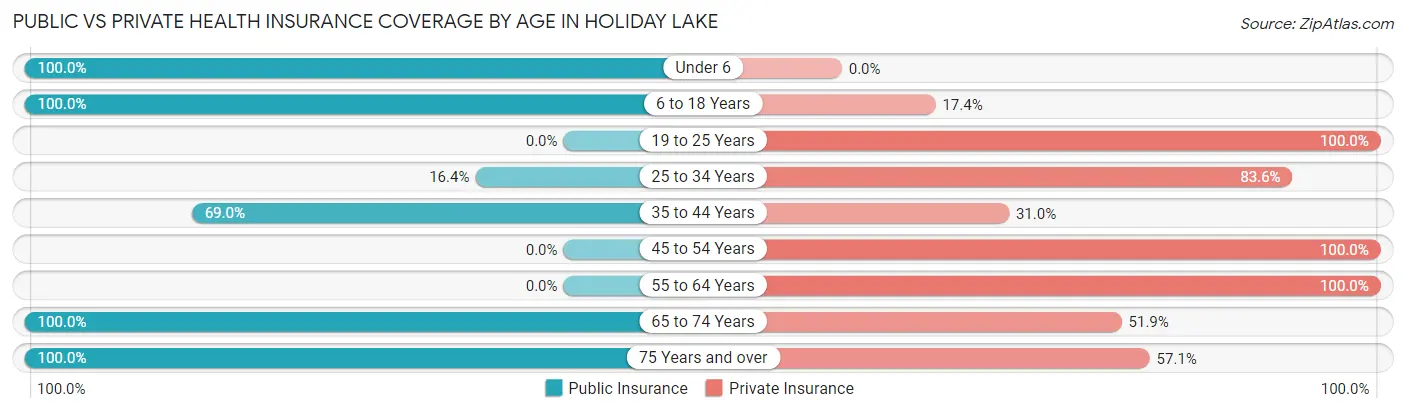
| Age Bracket | Public Insurance | Private Insurance |
| Under 6 | 7 (100.0%) | 0 (0.0%) |
| 6 to 18 Years | 23 (100.0%) | 4 (17.4%) |
| 19 to 25 Years | 0 (0.0%) | 19 (100.0%) |
| 25 to 34 Years | 9 (16.4%) | 46 (83.6%) |
| 35 to 44 Years | 20 (69.0%) | 9 (31.0%) |
| 45 to 54 Years | 0 (0.0%) | 28 (100.0%) |
| 55 to 64 Years | 0 (0.0%) | 39 (100.0%) |
| 65 to 74 Years | 129 (100.0%) | 67 (51.9%) |
| 75 Years and over | 42 (100.0%) | 24 (57.1%) |
| Total | 230 (62.0%) | 236 (63.6%) |
Disability Status by Sex by Age in Holiday Lake
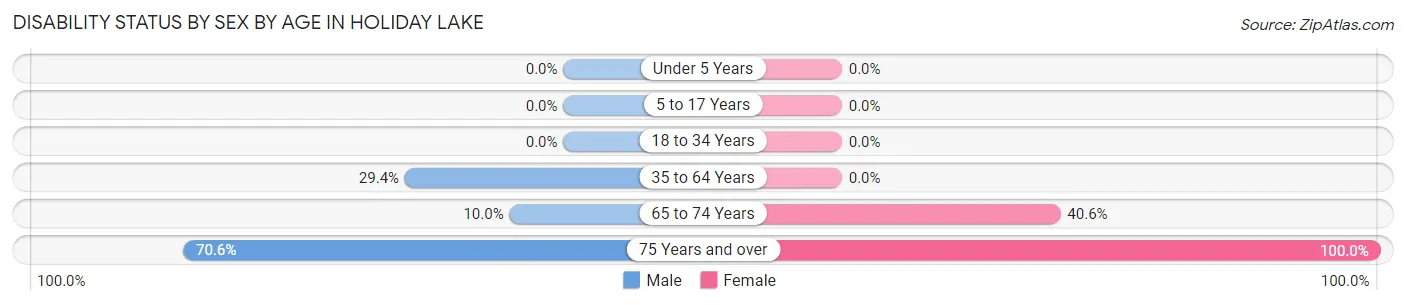
| Age Bracket | Male | Female |
| Under 5 Years | 0 (0.0%) | 0 (0.0%) |
| 5 to 17 Years | 0 (0.0%) | 0 (0.0%) |
| 18 to 34 Years | 0 (0.0%) | 0 (0.0%) |
| 35 to 64 Years | 10 (29.4%) | 0 (0.0%) |
| 65 to 74 Years | 6 (10.0%) | 28 (40.6%) |
| 75 Years and over | 24 (70.6%) | 8 (100.0%) |
Disability Class by Sex by Age in Holiday Lake
Disability Class: Hearing Difficulty
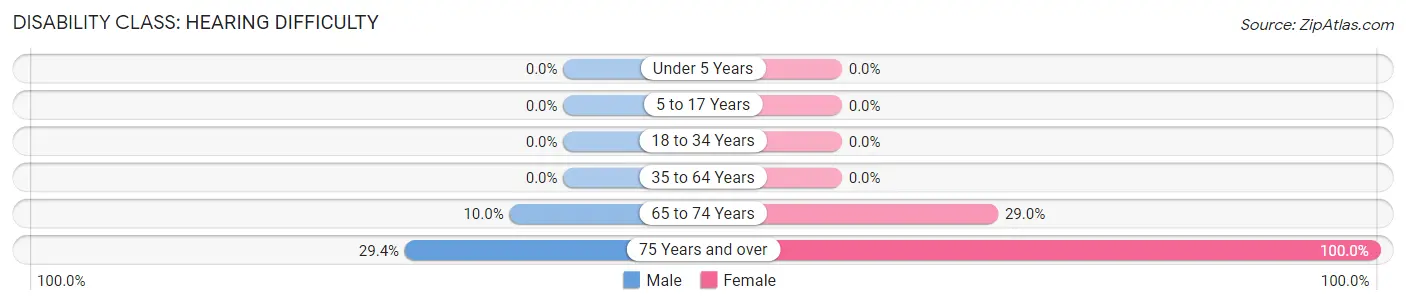
| Age Bracket | Male | Female |
| Under 5 Years | 0 (0.0%) | 0 (0.0%) |
| 5 to 17 Years | 0 (0.0%) | 0 (0.0%) |
| 18 to 34 Years | 0 (0.0%) | 0 (0.0%) |
| 35 to 64 Years | 0 (0.0%) | 0 (0.0%) |
| 65 to 74 Years | 6 (10.0%) | 20 (29.0%) |
| 75 Years and over | 10 (29.4%) | 8 (100.0%) |
Disability Class: Vision Difficulty
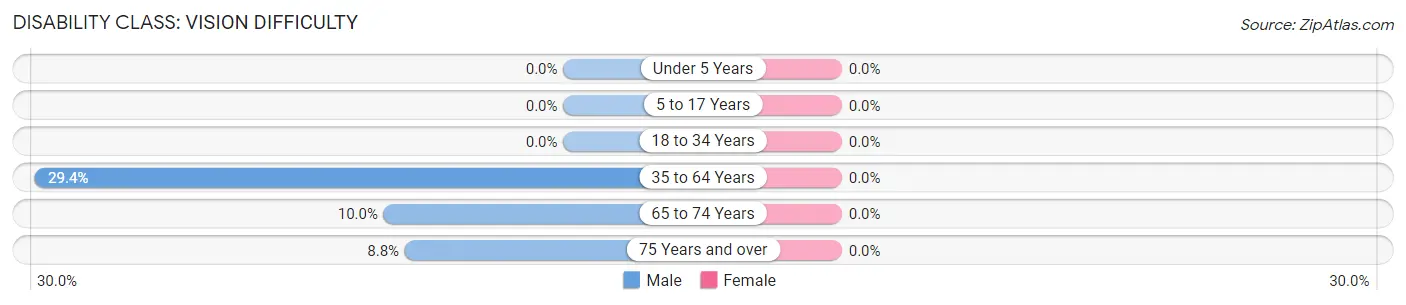
| Age Bracket | Male | Female |
| Under 5 Years | 0 (0.0%) | 0 (0.0%) |
| 5 to 17 Years | 0 (0.0%) | 0 (0.0%) |
| 18 to 34 Years | 0 (0.0%) | 0 (0.0%) |
| 35 to 64 Years | 10 (29.4%) | 0 (0.0%) |
| 65 to 74 Years | 6 (10.0%) | 0 (0.0%) |
| 75 Years and over | 3 (8.8%) | 0 (0.0%) |
Disability Class: Cognitive Difficulty
| Age Bracket | Male | Female |
| 5 to 17 Years | 0 (0.0%) | 0 (0.0%) |
| 18 to 34 Years | 0 (0.0%) | 0 (0.0%) |
| 35 to 64 Years | 0 (0.0%) | 0 (0.0%) |
| 65 to 74 Years | 0 (0.0%) | 0 (0.0%) |
| 75 Years and over | 0 (0.0%) | 0 (0.0%) |
Disability Class: Ambulatory Difficulty
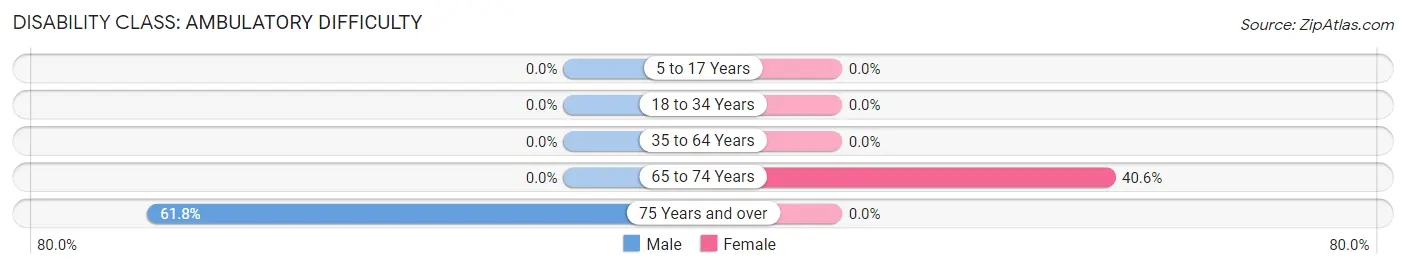
| Age Bracket | Male | Female |
| 5 to 17 Years | 0 (0.0%) | 0 (0.0%) |
| 18 to 34 Years | 0 (0.0%) | 0 (0.0%) |
| 35 to 64 Years | 0 (0.0%) | 0 (0.0%) |
| 65 to 74 Years | 0 (0.0%) | 28 (40.6%) |
| 75 Years and over | 21 (61.8%) | 0 (0.0%) |
Disability Class: Self-Care Difficulty
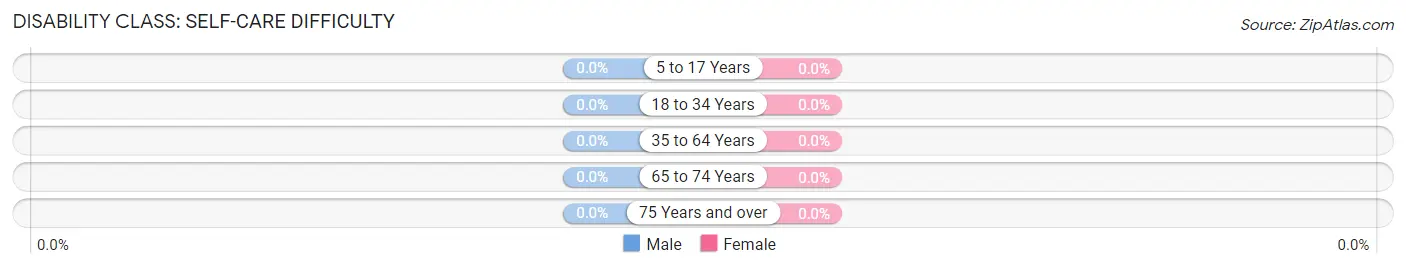
| Age Bracket | Male | Female |
| 5 to 17 Years | 0 (0.0%) | 0 (0.0%) |
| 18 to 34 Years | 0 (0.0%) | 0 (0.0%) |
| 35 to 64 Years | 0 (0.0%) | 0 (0.0%) |
| 65 to 74 Years | 0 (0.0%) | 0 (0.0%) |
| 75 Years and over | 0 (0.0%) | 0 (0.0%) |
Technology Access in Holiday Lake
Computing Device Access in Holiday Lake
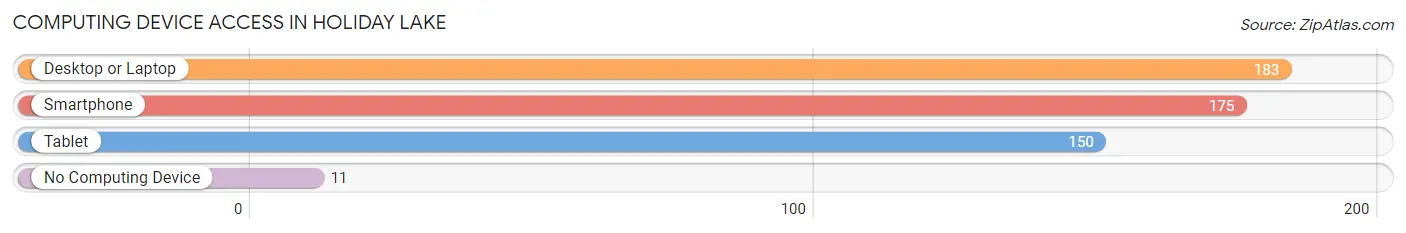
| Device Type | # Households | % Households |
| Desktop or Laptop | 183 | 81.7% |
| Smartphone | 175 | 78.1% |
| Tablet | 150 | 67.0% |
| No Computing Device | 11 | 4.9% |
| Total | 224 | 100.0% |
Internet Access in Holiday Lake
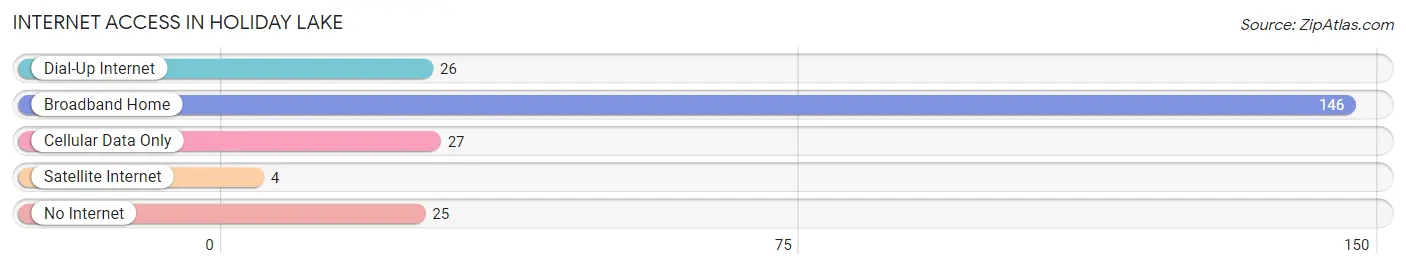
| Internet Type | # Households | % Households |
| Dial-Up Internet | 26 | 11.6% |
| Broadband Home | 146 | 65.2% |
| Cellular Data Only | 27 | 12.0% |
| Satellite Internet | 4 | 1.8% |
| No Internet | 25 | 11.2% |
| Total | 224 | 100.0% |
Holiday Lake Summary
Holiday Lake is a small unincorporated community located in Appanoose County, Iowa. It is situated on the banks of the South Skunk River, approximately five miles south of Centerville. The population of Holiday Lake was estimated to be around 200 people in 2000.
History
Holiday Lake was first settled in the late 1800s by a group of settlers from Ohio. The town was originally known as “Holiday’s Lake” after the first settler, John Holiday. The town was officially incorporated in 1891 and the name was changed to Holiday Lake.
The town was a popular destination for vacationers in the early 1900s. The lake was a popular spot for fishing and swimming, and the town had a number of resorts and hotels. The town also had a post office, a general store, and a few other businesses.
In the 1950s, the town began to decline as the popularity of the lake decreased. The resorts and hotels closed and the population began to dwindle. In the 1970s, the town was almost completely abandoned.
Geography
Holiday Lake is located in Appanoose County, Iowa. It is situated on the banks of the South Skunk River, approximately five miles south of Centerville. The town is surrounded by rolling hills and farmland. The lake itself is approximately two miles long and one mile wide.
The climate in Holiday Lake is typical of the Midwest. Summers are hot and humid, with temperatures reaching into the 90s. Winters are cold and snowy, with temperatures dropping into the single digits.
Economy
The economy of Holiday Lake is largely based on agriculture. The town is surrounded by farmland, and many of the residents are involved in farming. The town also has a few small businesses, including a general store and a post office.
Demographics
The population of Holiday Lake was estimated to be around 200 people in 2000. The racial makeup of the town was 97.5% White, 0.5% African American, 0.5% Native American, and 1.5% from other races. The median household income was $30,000. The median age was 40 years old.
Conclusion
Holiday Lake is a small unincorporated community located in Appanoose County, Iowa. It was first settled in the late 1800s and was a popular destination for vacationers in the early 1900s. The town has since declined in population, but still has a few small businesses and is surrounded by farmland. The population of Holiday Lake was estimated to be around 200 people in 2000, and the median household income was $30,000.
Common Questions
What is Per Capita Income in Holiday Lake?
Per Capita income in Holiday Lake is $55,148.
What is the Median Family Income in Holiday Lake?
Median Family Income in Holiday Lake is $90,313.
What is the Median Household income in Holiday Lake?
Median Household Income in Holiday Lake is $77,841.
What is Inequality or Gini Index in Holiday Lake?
Inequality or Gini Index in Holiday Lake is 0.37.
What is the Total Population of Holiday Lake?
Total Population of Holiday Lake is 371.
What is the Total Male Population of Holiday Lake?
Total Male Population of Holiday Lake is 198.
What is the Total Female Population of Holiday Lake?
Total Female Population of Holiday Lake is 173.
What is the Ratio of Males per 100 Females in Holiday Lake?
There are 114.45 Males per 100 Females in Holiday Lake.
What is the Ratio of Females per 100 Males in Holiday Lake?
There are 87.37 Females per 100 Males in Holiday Lake.
What is the Median Population Age in Holiday Lake?
Median Population Age in Holiday Lake is 63.5 Years.
What is the Average Family Size in Holiday Lake
Average Family Size in Holiday Lake is 2.4 People.
What is the Average Household Size in Holiday Lake
Average Household Size in Holiday Lake is 1.7 People.
How Large is the Labor Force in Holiday Lake?
There are 196 People in the Labor Forcein in Holiday Lake.
What is the Percentage of People in the Labor Force in Holiday Lake?
57.5% of People are in the Labor Force in Holiday Lake.