Kingsley, IA Map & Demographics
Kingsley Map
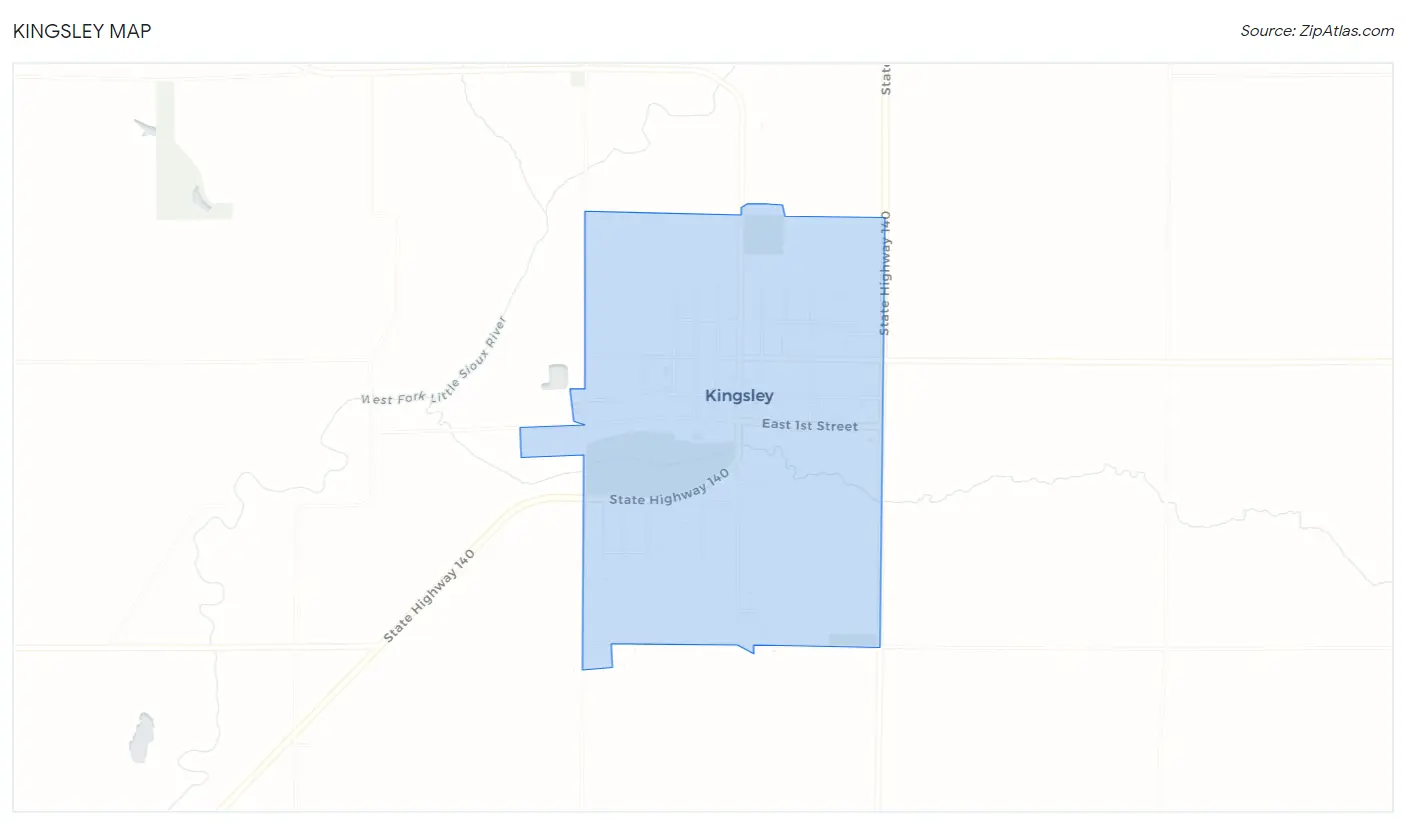
Kingsley Overview
$40,332
PER CAPITA INCOME
$90,417
AVG FAMILY INCOME
$64,524
AVG HOUSEHOLD INCOME
42.4%
WAGE / INCOME GAP [ % ]
57.6¢/ $1
WAGE / INCOME GAP [ $ ]
0.45
INEQUALITY / GINI INDEX
1,382
TOTAL POPULATION
696
MALE POPULATION
686
FEMALE POPULATION
101.46
MALES / 100 FEMALES
98.56
FEMALES / 100 MALES
44.6
MEDIAN AGE
2.8
AVG FAMILY SIZE
2.2
AVG HOUSEHOLD SIZE
724
LABOR FORCE [ PEOPLE ]
64.2%
PERCENT IN LABOR FORCE
Kingsley Zip Codes
Kingsley Area Codes
Income in Kingsley
Income Overview in Kingsley
Per Capita Income in Kingsley is $40,332, while median incomes of families and households are $90,417 and $64,524 respectively.
| Characteristic | Number | Measure |
| Per Capita Income | 1,382 | $40,332 |
| Median Family Income | 390 | $90,417 |
| Mean Family Income | 390 | $113,692 |
| Median Household Income | 622 | $64,524 |
| Mean Household Income | 622 | $89,121 |
| Income Deficit | 390 | $0 |
| Wage / Income Gap (%) | 1,382 | 42.39% |
| Wage / Income Gap ($) | 1,382 | 57.61¢ per $1 |
| Gini / Inequality Index | 1,382 | 0.45 |
Earnings by Sex in Kingsley
Average Earnings in Kingsley are $45,324, $56,500 for men and $32,552 for women, a difference of 42.4%.
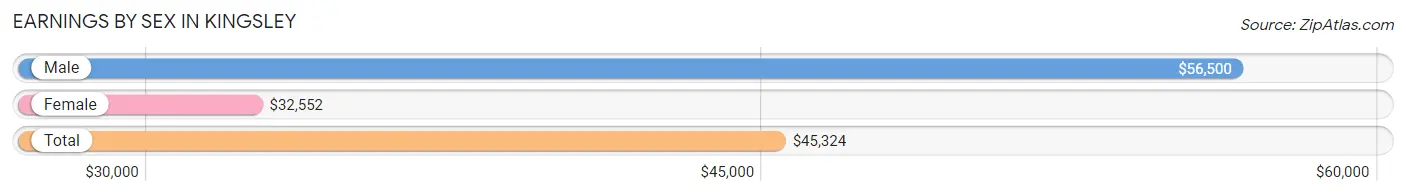
| Sex | Number | Average Earnings |
| Male | 404 (50.6%) | $56,500 |
| Female | 395 (49.4%) | $32,552 |
| Total | 799 (100.0%) | $45,324 |
Earnings by Sex by Income Bracket in Kingsley
The most common earnings brackets in Kingsley are $100,000+ for men (90 | 22.3%) and $25,000 to $29,999 for women (43 | 10.9%).
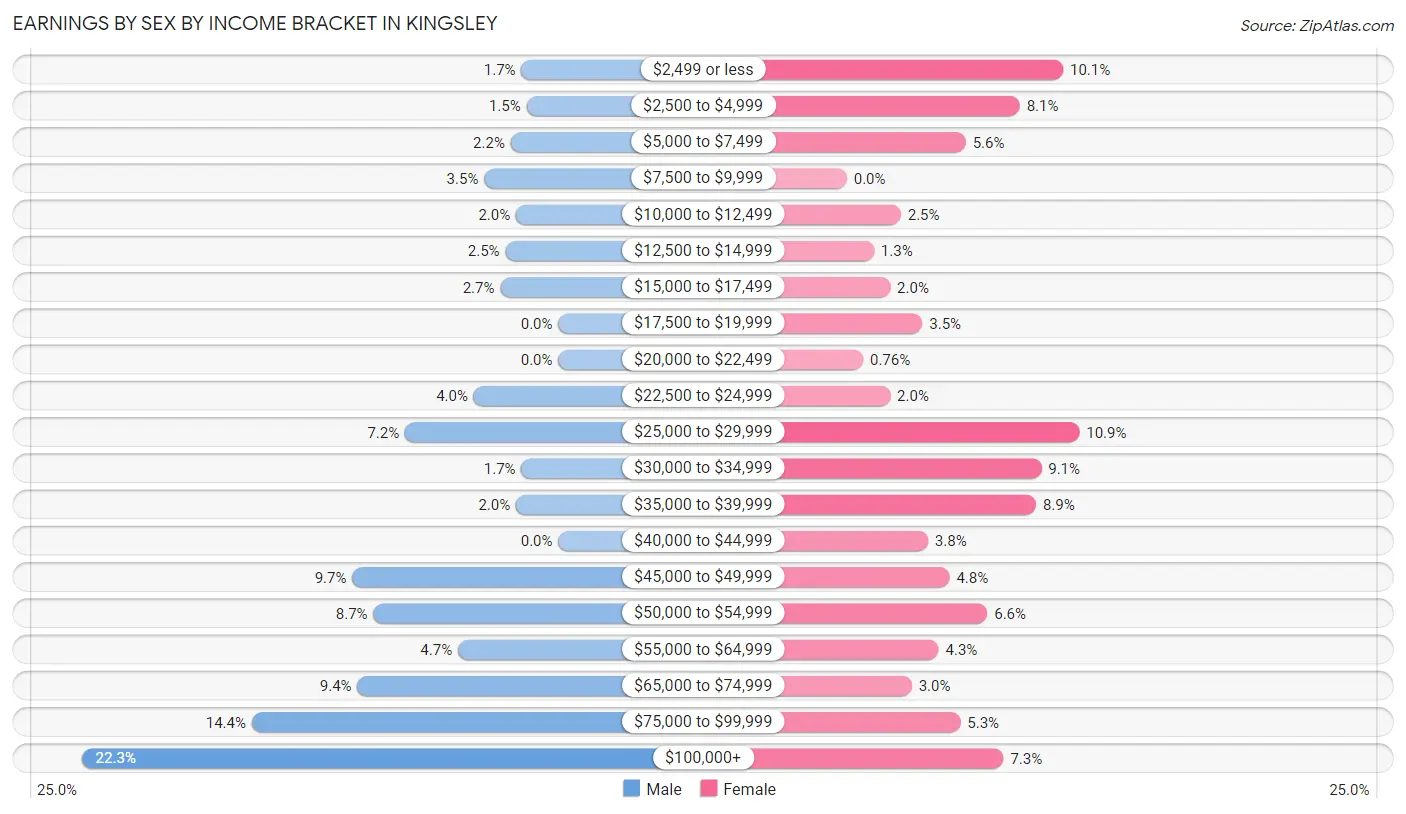
| Income | Male | Female |
| $2,499 or less | 7 (1.7%) | 40 (10.1%) |
| $2,500 to $4,999 | 6 (1.5%) | 32 (8.1%) |
| $5,000 to $7,499 | 9 (2.2%) | 22 (5.6%) |
| $7,500 to $9,999 | 14 (3.5%) | 0 (0.0%) |
| $10,000 to $12,499 | 8 (2.0%) | 10 (2.5%) |
| $12,500 to $14,999 | 10 (2.5%) | 5 (1.3%) |
| $15,000 to $17,499 | 11 (2.7%) | 8 (2.0%) |
| $17,500 to $19,999 | 0 (0.0%) | 14 (3.5%) |
| $20,000 to $22,499 | 0 (0.0%) | 3 (0.8%) |
| $22,500 to $24,999 | 16 (4.0%) | 8 (2.0%) |
| $25,000 to $29,999 | 29 (7.2%) | 43 (10.9%) |
| $30,000 to $34,999 | 7 (1.7%) | 36 (9.1%) |
| $35,000 to $39,999 | 8 (2.0%) | 35 (8.9%) |
| $40,000 to $44,999 | 0 (0.0%) | 15 (3.8%) |
| $45,000 to $49,999 | 39 (9.7%) | 19 (4.8%) |
| $50,000 to $54,999 | 35 (8.7%) | 26 (6.6%) |
| $55,000 to $64,999 | 19 (4.7%) | 17 (4.3%) |
| $65,000 to $74,999 | 38 (9.4%) | 12 (3.0%) |
| $75,000 to $99,999 | 58 (14.4%) | 21 (5.3%) |
| $100,000+ | 90 (22.3%) | 29 (7.3%) |
| Total | 404 (100.0%) | 395 (100.0%) |
Earnings by Sex by Educational Attainment in Kingsley
Average earnings in Kingsley are $57,727 for men and $34,479 for women, a difference of 40.3%. Men with an educational attainment of bachelor's degree enjoy the highest average annual earnings of $88,875, while those with college or associate's degree education earn the least with $49,063. Women with an educational attainment of graduate degree earn the most with the average annual earnings of $75,625, while those with college or associate's degree education have the smallest earnings of $32,031.
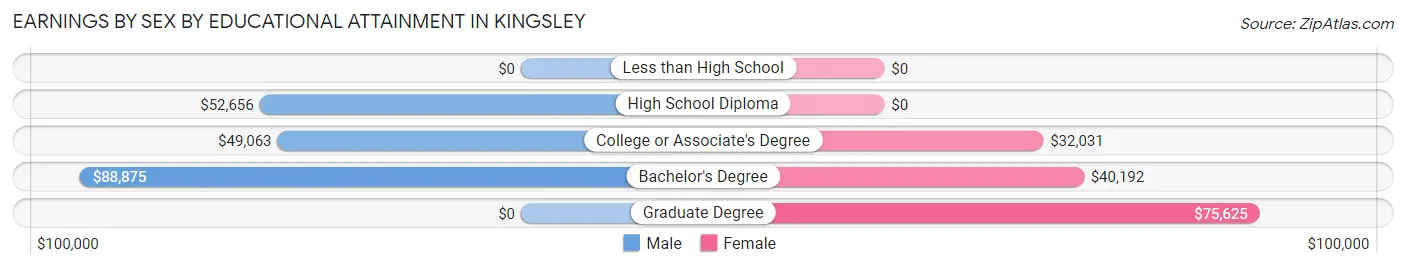
| Educational Attainment | Male Income | Female Income |
| Less than High School | - | - |
| High School Diploma | $52,656 | $0 |
| College or Associate's Degree | $49,063 | $32,031 |
| Bachelor's Degree | $88,875 | $40,192 |
| Graduate Degree | - | - |
| Total | $57,727 | $34,479 |
Family Income in Kingsley
Family Income Brackets in Kingsley
According to the Kingsley family income data, there are 82 families falling into the $50,000 to $74,999 income range, which is the most common income bracket and makes up 21.0% of all families. Conversely, the less than $10,000 income bracket is the least frequent group with only 3 families (0.8%) belonging to this category.
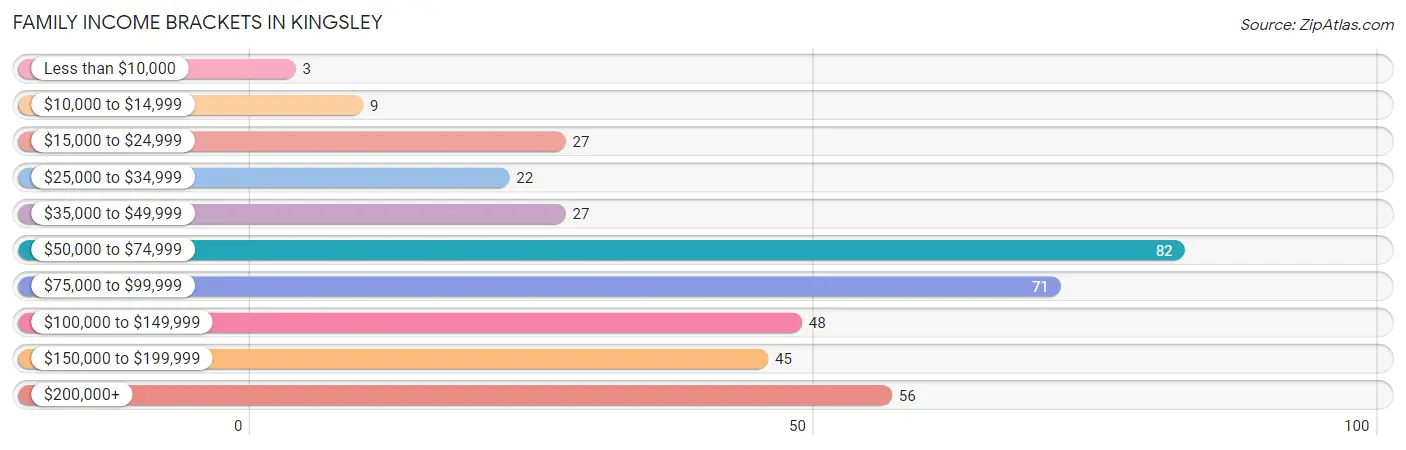
| Income Bracket | # Families | % Families |
| Less than $10,000 | 3 | 0.8% |
| $10,000 to $14,999 | 9 | 2.3% |
| $15,000 to $24,999 | 27 | 6.9% |
| $25,000 to $34,999 | 22 | 5.6% |
| $35,000 to $49,999 | 27 | 6.9% |
| $50,000 to $74,999 | 82 | 21.0% |
| $75,000 to $99,999 | 71 | 18.2% |
| $100,000 to $149,999 | 48 | 12.3% |
| $150,000 to $199,999 | 45 | 11.5% |
| $200,000+ | 56 | 14.4% |
Family Income by Famaliy Size in Kingsley
3-person families (50 | 12.8%) account for the highest median family income in Kingsley with $185,625 per family, while 3-person families (50 | 12.8%) have the highest median income of $61,875 per family member.
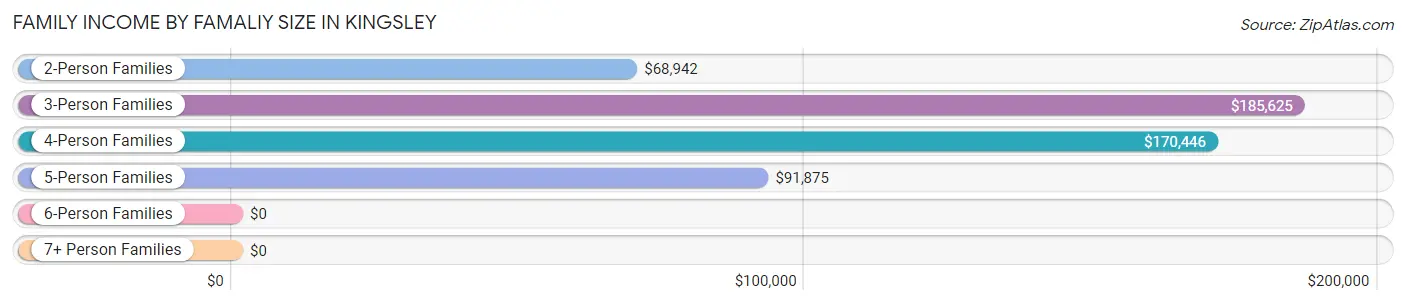
| Income Bracket | # Families | Median Income |
| 2-Person Families | 241 (61.8%) | $68,942 |
| 3-Person Families | 50 (12.8%) | $185,625 |
| 4-Person Families | 63 (16.2%) | $170,446 |
| 5-Person Families | 31 (8.0%) | $91,875 |
| 6-Person Families | 5 (1.3%) | $0 |
| 7+ Person Families | 0 (0.0%) | $0 |
| Total | 390 (100.0%) | $90,417 |
Family Income by Number of Earners in Kingsley
The median family income in Kingsley is $90,417, with families comprising 3+ earners (47) having the highest median family income of $171,696, while families with no earners (52) have the lowest median family income of $38,000, accounting for 12.0% and 13.3% of families, respectively.
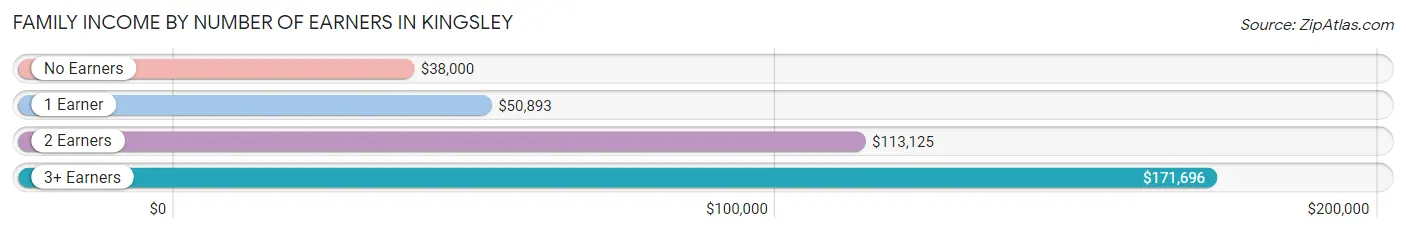
| Number of Earners | # Families | Median Income |
| No Earners | 52 (13.3%) | $38,000 |
| 1 Earner | 115 (29.5%) | $50,893 |
| 2 Earners | 176 (45.1%) | $113,125 |
| 3+ Earners | 47 (12.0%) | $171,696 |
| Total | 390 (100.0%) | $90,417 |
Household Income in Kingsley
Household Income Brackets in Kingsley
With 105 households falling in the category, the $50,000 to $74,999 income range is the most frequent in Kingsley, accounting for 16.9% of all households. In contrast, only 15 households (2.4%) fall into the less than $10,000 income bracket, making it the least populous group.
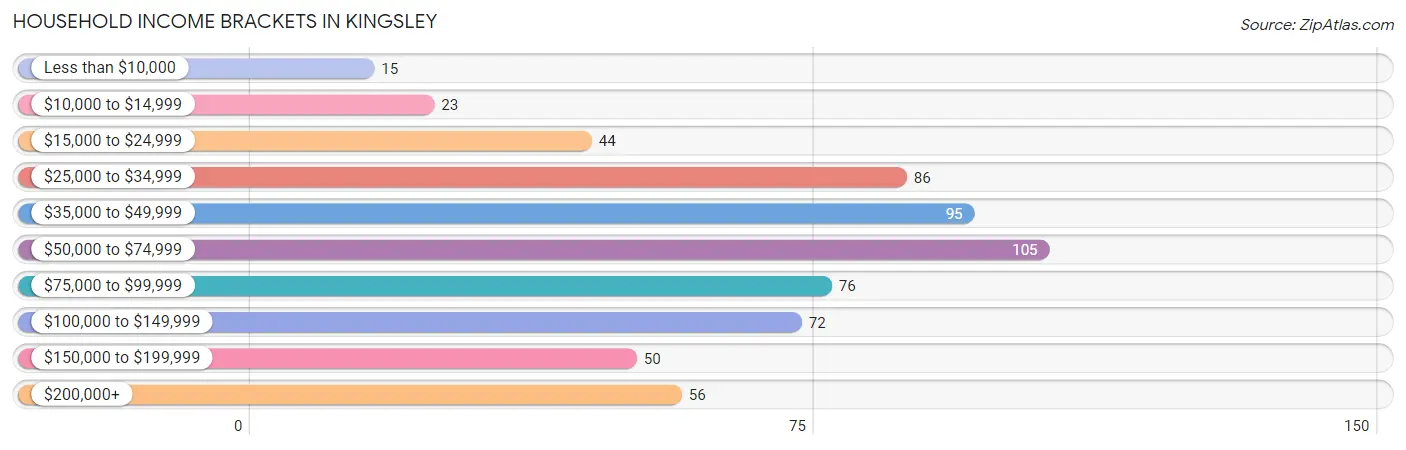
| Income Bracket | # Households | % Households |
| Less than $10,000 | 15 | 2.4% |
| $10,000 to $14,999 | 23 | 3.7% |
| $15,000 to $24,999 | 44 | 7.1% |
| $25,000 to $34,999 | 86 | 13.8% |
| $35,000 to $49,999 | 95 | 15.3% |
| $50,000 to $74,999 | 105 | 16.9% |
| $75,000 to $99,999 | 76 | 12.2% |
| $100,000 to $149,999 | 72 | 11.6% |
| $150,000 to $199,999 | 50 | 8.0% |
| $200,000+ | 56 | 9.0% |
Household Income by Householder Age in Kingsley
The median household income in Kingsley is $64,524, with the highest median household income of $97,961 found in the 15 to 24 years age bracket for the primary householder. A total of 31 households (5.0%) fall into this category. Meanwhile, the 65+ years age bracket for the primary householder has the lowest median household income of $44,722, with 226 households (36.3%) in this group.
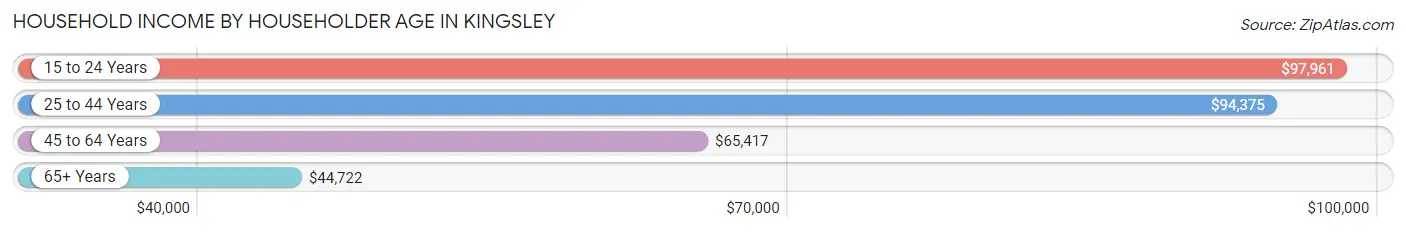
| Income Bracket | # Households | Median Income |
| 15 to 24 Years | 31 (5.0%) | $97,961 |
| 25 to 44 Years | 170 (27.3%) | $94,375 |
| 45 to 64 Years | 195 (31.4%) | $65,417 |
| 65+ Years | 226 (36.3%) | $44,722 |
| Total | 622 (100.0%) | $64,524 |
Poverty in Kingsley
Income Below Poverty by Sex and Age in Kingsley
With 7.0% poverty level for males and 8.3% for females among the residents of Kingsley, 15 year old males and 75 year old and over females are the most vulnerable to poverty, with 6 males (66.7%) and 17 females (25.4%) in their respective age groups living below the poverty level.
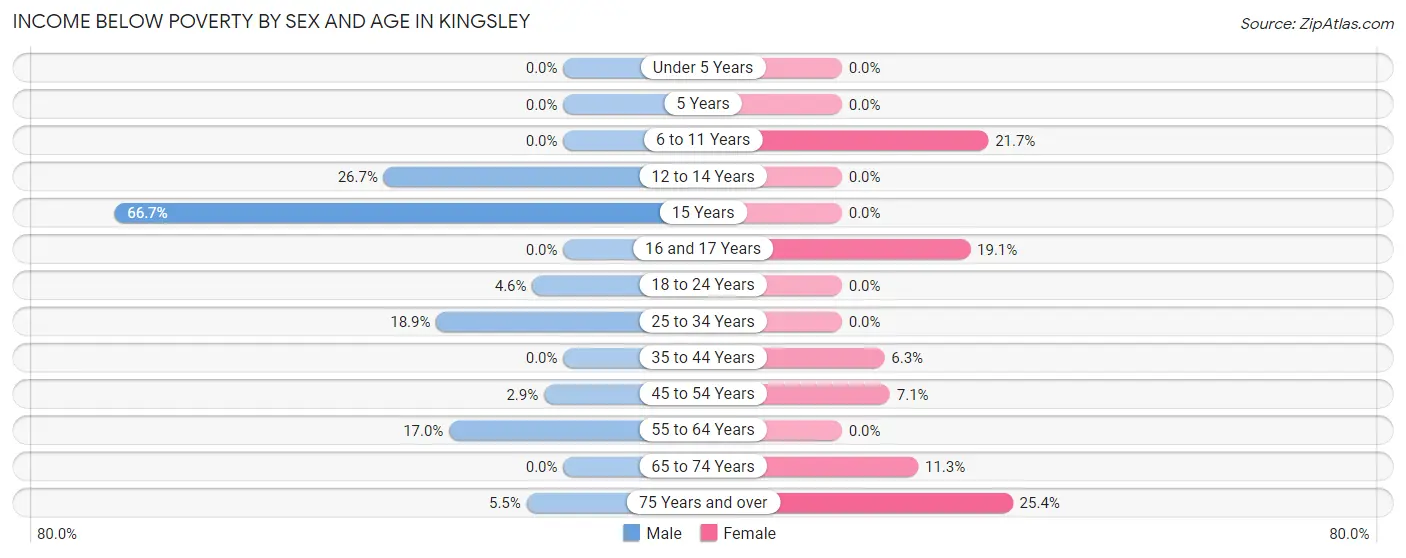
| Age Bracket | Male | Female |
| Under 5 Years | 0 (0.0%) | 0 (0.0%) |
| 5 Years | 0 (0.0%) | 0 (0.0%) |
| 6 to 11 Years | 0 (0.0%) | 10 (21.7%) |
| 12 to 14 Years | 12 (26.7%) | 0 (0.0%) |
| 15 Years | 6 (66.7%) | 0 (0.0%) |
| 16 and 17 Years | 0 (0.0%) | 4 (19.1%) |
| 18 to 24 Years | 4 (4.6%) | 0 (0.0%) |
| 25 to 34 Years | 10 (18.9%) | 0 (0.0%) |
| 35 to 44 Years | 0 (0.0%) | 6 (6.3%) |
| 45 to 54 Years | 3 (2.9%) | 6 (7.1%) |
| 55 to 64 Years | 10 (17.0%) | 0 (0.0%) |
| 65 to 74 Years | 0 (0.0%) | 12 (11.3%) |
| 75 Years and over | 3 (5.4%) | 17 (25.4%) |
| Total | 48 (7.0%) | 55 (8.3%) |
Income Above Poverty by Sex and Age in Kingsley
According to the poverty statistics in Kingsley, males aged under 5 years and females aged under 5 years are the age groups that are most secure financially, with 100.0% of males and 100.0% of females in these age groups living above the poverty line.
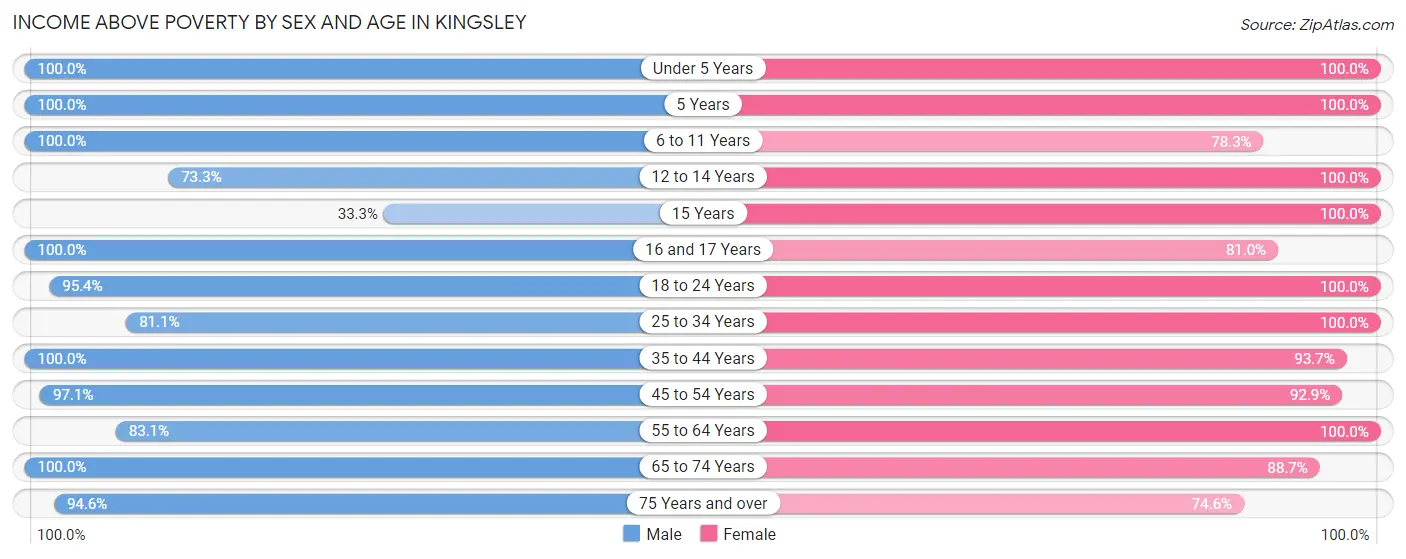
| Age Bracket | Male | Female |
| Under 5 Years | 38 (100.0%) | 11 (100.0%) |
| 5 Years | 8 (100.0%) | 6 (100.0%) |
| 6 to 11 Years | 44 (100.0%) | 36 (78.3%) |
| 12 to 14 Years | 33 (73.3%) | 43 (100.0%) |
| 15 Years | 3 (33.3%) | 5 (100.0%) |
| 16 and 17 Years | 12 (100.0%) | 17 (80.9%) |
| 18 to 24 Years | 83 (95.4%) | 42 (100.0%) |
| 25 to 34 Years | 43 (81.1%) | 57 (100.0%) |
| 35 to 44 Years | 82 (100.0%) | 89 (93.7%) |
| 45 to 54 Years | 102 (97.1%) | 78 (92.9%) |
| 55 to 64 Years | 49 (83.1%) | 79 (100.0%) |
| 65 to 74 Years | 86 (100.0%) | 94 (88.7%) |
| 75 Years and over | 52 (94.6%) | 50 (74.6%) |
| Total | 635 (93.0%) | 607 (91.7%) |
Income Below Poverty Among Married-Couple Families in Kingsley
The poverty statistics for married-couple families in Kingsley show that 0.9% or 3 of the total 328 families live below the poverty line. Families with no children have the highest poverty rate of 1.3%, comprising of 3 families. On the other hand, families with 1 or 2 children have the lowest poverty rate of 0.0%, which includes 0 families.
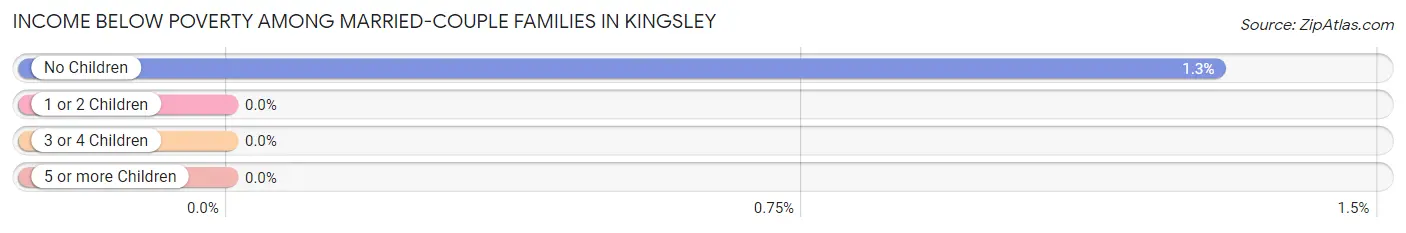
| Children | Above Poverty | Below Poverty |
| No Children | 230 (98.7%) | 3 (1.3%) |
| 1 or 2 Children | 73 (100.0%) | 0 (0.0%) |
| 3 or 4 Children | 22 (100.0%) | 0 (0.0%) |
| 5 or more Children | 0 (0.0%) | 0 (0.0%) |
| Total | 325 (99.1%) | 3 (0.9%) |
Income Below Poverty Among Single-Parent Households in Kingsley
According to the poverty data in Kingsley, 15.4% or 6 single-father households and 39.1% or 9 single-mother households are living below the poverty line. Among single-father households, those with no children have the highest poverty rate, with 3 households (50.0%) experiencing poverty. Likewise, among single-mother households, those with 3 or 4 children have the highest poverty rate, with 6 households (66.7%) falling below the poverty line.
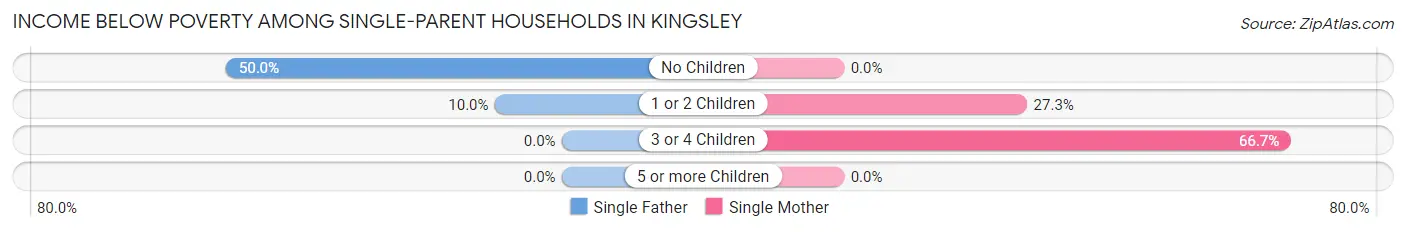
| Children | Single Father | Single Mother |
| No Children | 3 (50.0%) | 0 (0.0%) |
| 1 or 2 Children | 3 (10.0%) | 3 (27.3%) |
| 3 or 4 Children | 0 (0.0%) | 6 (66.7%) |
| 5 or more Children | 0 (0.0%) | 0 (0.0%) |
| Total | 6 (15.4%) | 9 (39.1%) |
Income Below Poverty Among Married-Couple vs Single-Parent Households in Kingsley
The poverty data for Kingsley shows that 3 of the married-couple family households (0.9%) and 15 of the single-parent households (24.2%) are living below the poverty level. Within the married-couple family households, those with no children have the highest poverty rate, with 3 households (1.3%) falling below the poverty line. Among the single-parent households, those with 3 or 4 children have the highest poverty rate, with 6 household (50.0%) living below poverty.
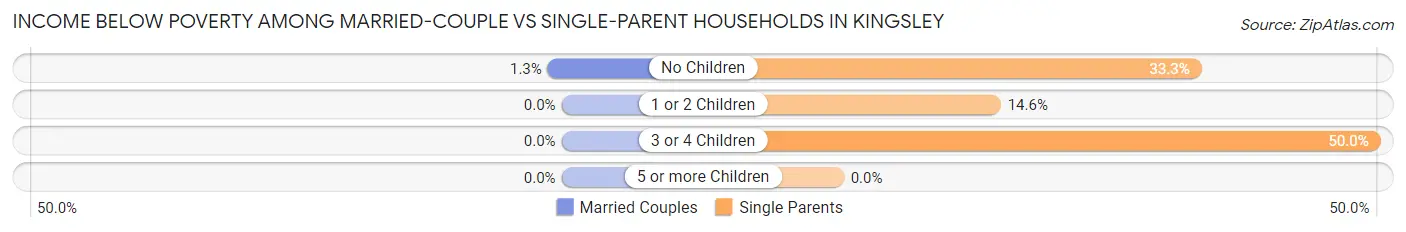
| Children | Married-Couple Families | Single-Parent Households |
| No Children | 3 (1.3%) | 3 (33.3%) |
| 1 or 2 Children | 0 (0.0%) | 6 (14.6%) |
| 3 or 4 Children | 0 (0.0%) | 6 (50.0%) |
| 5 or more Children | 0 (0.0%) | 0 (0.0%) |
| Total | 3 (0.9%) | 15 (24.2%) |
Race in Kingsley
The most populous races in Kingsley are White / Caucasian (1,304 | 94.4%), Hispanic or Latino (49 | 3.5%), and Black / African American (36 | 2.6%).
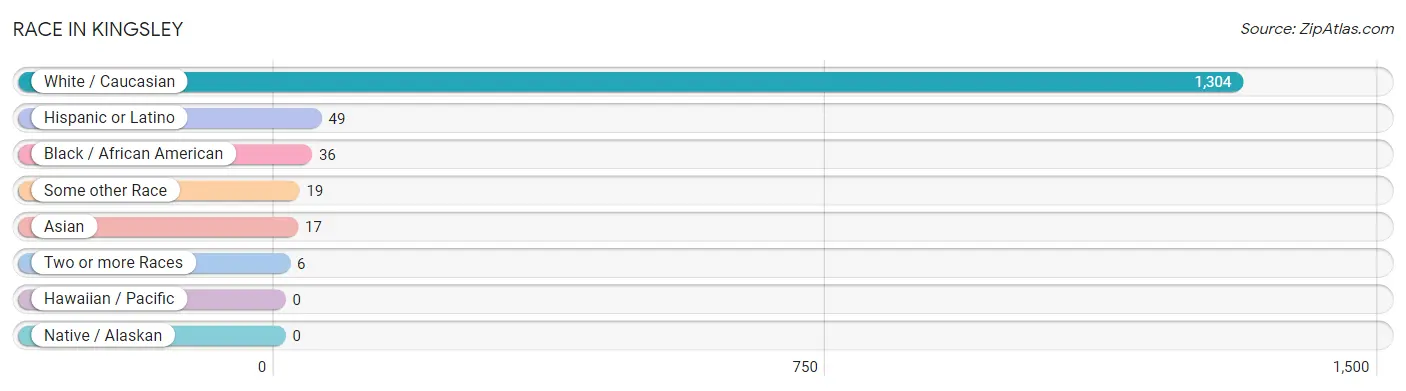
| Race | # Population | % Population |
| Asian | 17 | 1.2% |
| Black / African American | 36 | 2.6% |
| Hawaiian / Pacific | 0 | 0.0% |
| Hispanic or Latino | 49 | 3.5% |
| Native / Alaskan | 0 | 0.0% |
| White / Caucasian | 1,304 | 94.4% |
| Two or more Races | 6 | 0.4% |
| Some other Race | 19 | 1.4% |
| Total | 1,382 | 100.0% |
Ancestry in Kingsley
The most populous ancestries reported in Kingsley are German (586 | 42.4%), Irish (160 | 11.6%), American (149 | 10.8%), English (140 | 10.1%), and European (54 | 3.9%), together accounting for 78.8% of all Kingsley residents.
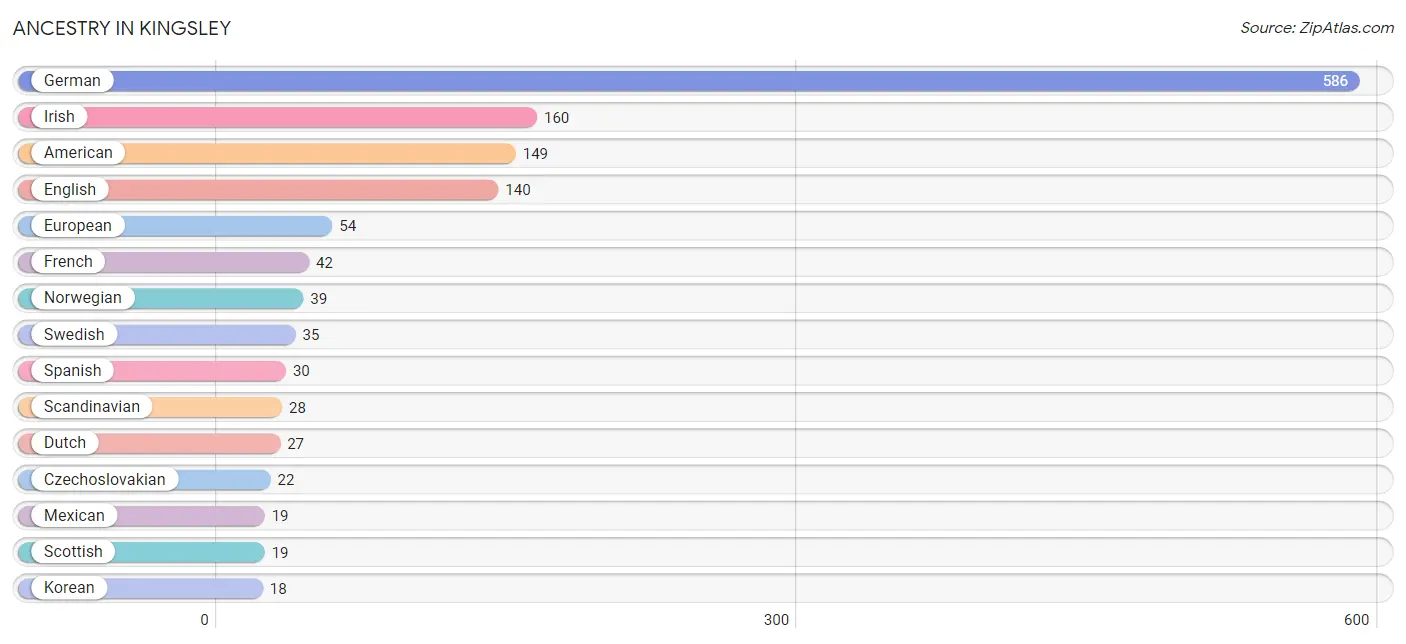
| Ancestry | # Population | % Population |
| American | 149 | 10.8% |
| British | 2 | 0.1% |
| Canadian | 9 | 0.6% |
| Croatian | 3 | 0.2% |
| Czech | 11 | 0.8% |
| Czechoslovakian | 22 | 1.6% |
| Danish | 5 | 0.4% |
| Dutch | 27 | 1.9% |
| English | 140 | 10.1% |
| European | 54 | 3.9% |
| French | 42 | 3.0% |
| German | 586 | 42.4% |
| Greek | 3 | 0.2% |
| Irish | 160 | 11.6% |
| Italian | 2 | 0.1% |
| Korean | 18 | 1.3% |
| Luxembourger | 7 | 0.5% |
| Malaysian | 4 | 0.3% |
| Mexican | 19 | 1.4% |
| Native Hawaiian | 5 | 0.4% |
| Norwegian | 39 | 2.8% |
| Polish | 3 | 0.2% |
| Portuguese | 10 | 0.7% |
| Scandinavian | 28 | 2.0% |
| Scotch-Irish | 10 | 0.7% |
| Scottish | 19 | 1.4% |
| Spanish | 30 | 2.2% |
| Swedish | 35 | 2.5% | View All 28 Rows |
Immigrants in Kingsley
The most numerous immigrant groups reported in Kingsley came from Asia (13 | 0.9%), Philippines (13 | 0.9%), and South Eastern Asia (13 | 0.9%), together accounting for 2.8% of all Kingsley residents.
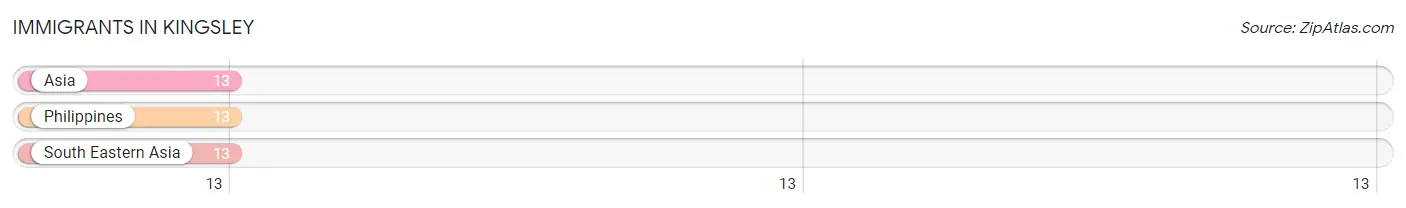
| Immigration Origin | # Population | % Population |
| Asia | 13 | 0.9% |
| Philippines | 13 | 0.9% |
| South Eastern Asia | 13 | 0.9% | View All 3 Rows |
Sex and Age in Kingsley
Sex and Age in Kingsley
The most populous age groups in Kingsley are 10 to 14 Years (72 | 10.3%) for men and 65 to 69 Years (75 | 10.9%) for women.
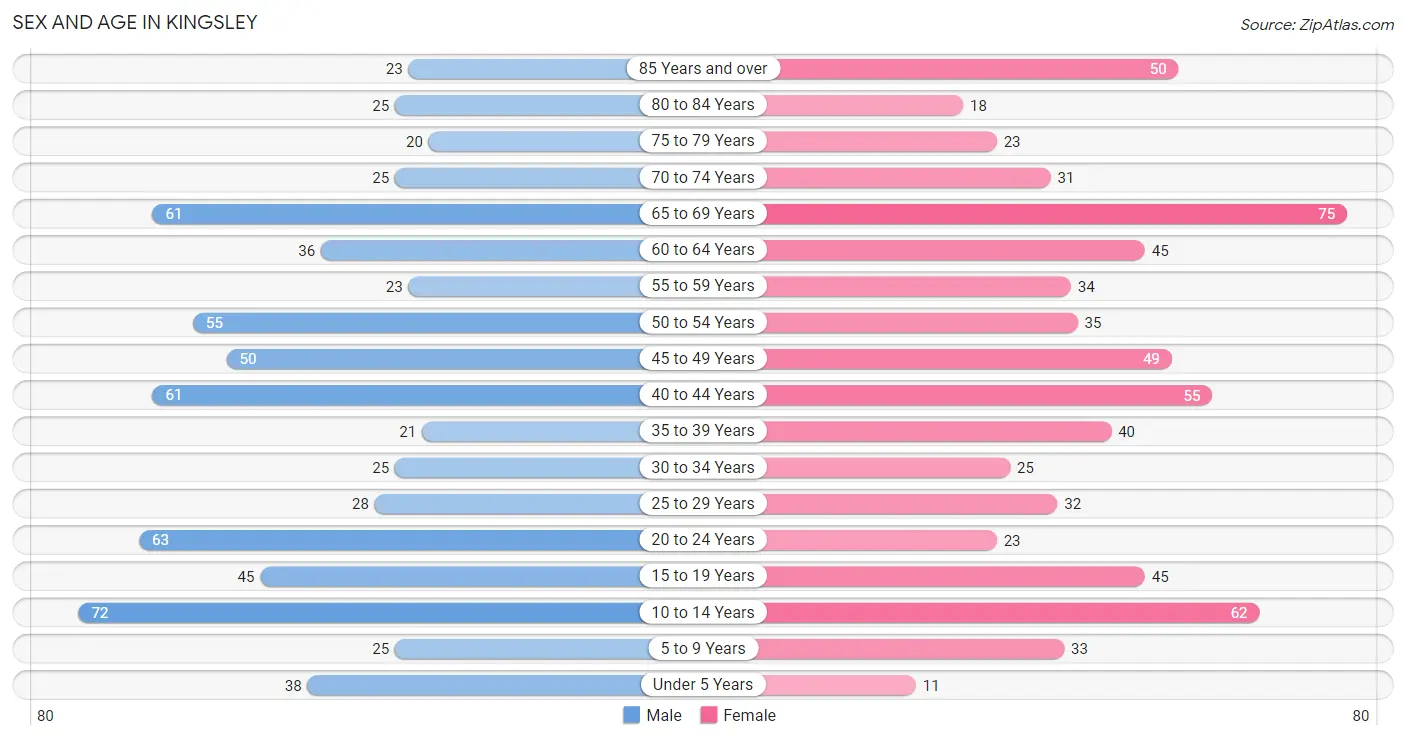
| Age Bracket | Male | Female |
| Under 5 Years | 38 (5.5%) | 11 (1.6%) |
| 5 to 9 Years | 25 (3.6%) | 33 (4.8%) |
| 10 to 14 Years | 72 (10.3%) | 62 (9.0%) |
| 15 to 19 Years | 45 (6.5%) | 45 (6.6%) |
| 20 to 24 Years | 63 (9.0%) | 23 (3.4%) |
| 25 to 29 Years | 28 (4.0%) | 32 (4.7%) |
| 30 to 34 Years | 25 (3.6%) | 25 (3.6%) |
| 35 to 39 Years | 21 (3.0%) | 40 (5.8%) |
| 40 to 44 Years | 61 (8.8%) | 55 (8.0%) |
| 45 to 49 Years | 50 (7.2%) | 49 (7.1%) |
| 50 to 54 Years | 55 (7.9%) | 35 (5.1%) |
| 55 to 59 Years | 23 (3.3%) | 34 (5.0%) |
| 60 to 64 Years | 36 (5.2%) | 45 (6.6%) |
| 65 to 69 Years | 61 (8.8%) | 75 (10.9%) |
| 70 to 74 Years | 25 (3.6%) | 31 (4.5%) |
| 75 to 79 Years | 20 (2.9%) | 23 (3.4%) |
| 80 to 84 Years | 25 (3.6%) | 18 (2.6%) |
| 85 Years and over | 23 (3.3%) | 50 (7.3%) |
| Total | 696 (100.0%) | 686 (100.0%) |
Families and Households in Kingsley
Median Family Size in Kingsley
The median family size in Kingsley is 2.78 persons per family, with single female/mother families (23 | 5.9%) accounting for the largest median family size of 3.78 persons per family. On the other hand, single male/father families (39 | 10.0%) represent the smallest median family size with 2.10 persons per family.
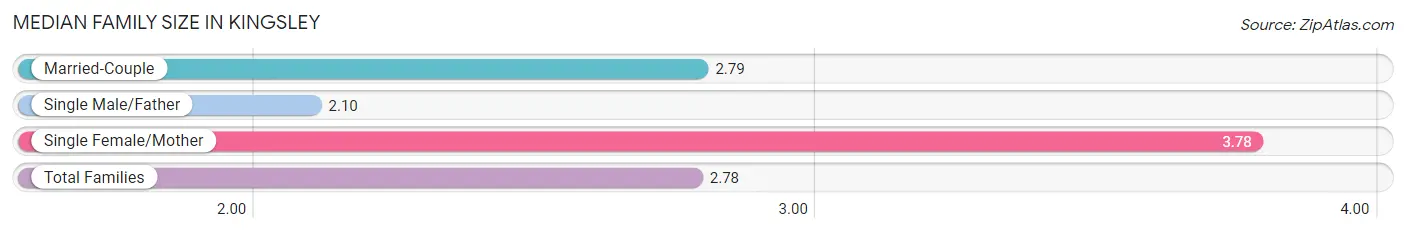
| Family Type | # Families | Family Size |
| Married-Couple | 328 (84.1%) | 2.79 |
| Single Male/Father | 39 (10.0%) | 2.10 |
| Single Female/Mother | 23 (5.9%) | 3.78 |
| Total Families | 390 (100.0%) | 2.78 |
Median Household Size in Kingsley
The median household size in Kingsley is 2.16 persons per household, with single female/mother households (23 | 3.7%) accounting for the largest median household size of 4.13 persons per household. non-family households (232 | 37.3%) represent the smallest median household size with 1.04 persons per household.
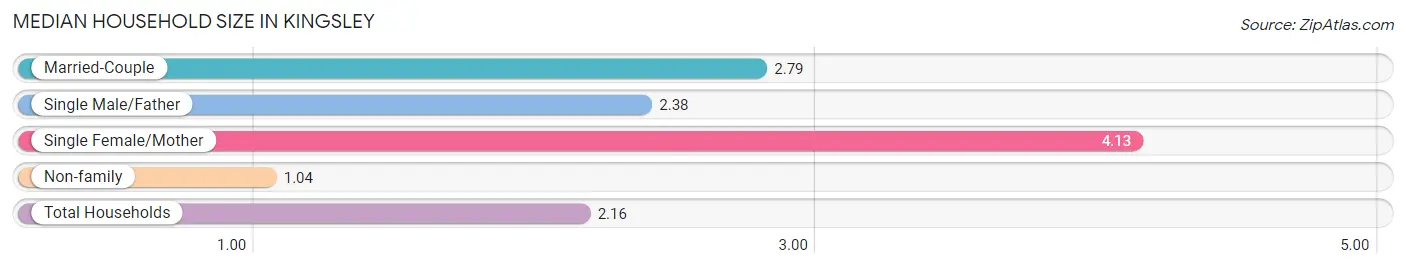
| Household Type | # Households | Household Size |
| Married-Couple | 328 (52.7%) | 2.79 |
| Single Male/Father | 39 (6.3%) | 2.38 |
| Single Female/Mother | 23 (3.7%) | 4.13 |
| Non-family | 232 (37.3%) | 1.04 |
| Total Households | 622 (100.0%) | 2.16 |
Household Size by Marriage Status in Kingsley
Out of a total of 622 households in Kingsley, 390 (62.7%) are family households, while 232 (37.3%) are nonfamily households. The most numerous type of family households are 2-person households, comprising 226, and the most common type of nonfamily households are 1-person households, comprising 221.
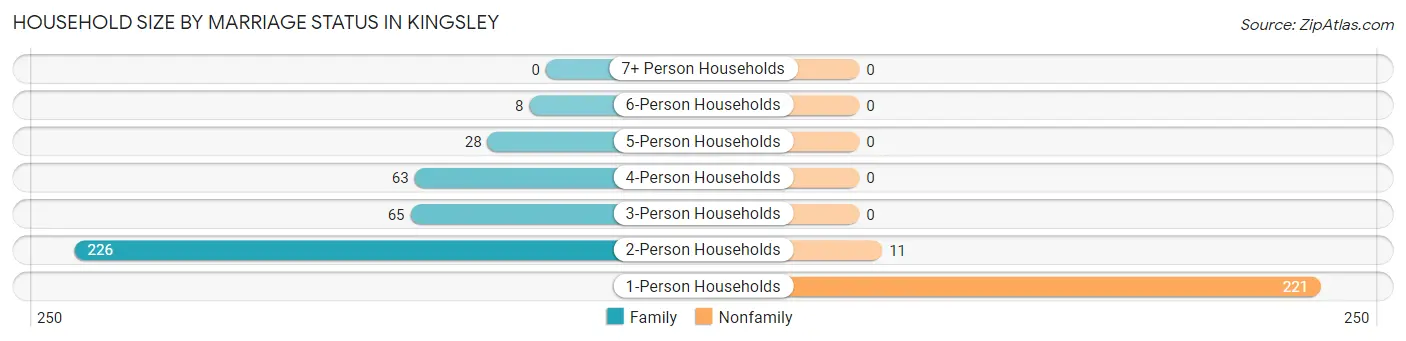
| Household Size | Family Households | Nonfamily Households |
| 1-Person Households | - | 221 (35.5%) |
| 2-Person Households | 226 (36.3%) | 11 (1.8%) |
| 3-Person Households | 65 (10.4%) | 0 (0.0%) |
| 4-Person Households | 63 (10.1%) | 0 (0.0%) |
| 5-Person Households | 28 (4.5%) | 0 (0.0%) |
| 6-Person Households | 8 (1.3%) | 0 (0.0%) |
| 7+ Person Households | 0 (0.0%) | 0 (0.0%) |
| Total | 390 (62.7%) | 232 (37.3%) |
Female Fertility in Kingsley
Fertility by Age in Kingsley
Average fertility rate in Kingsley is 10.0 births per 1,000 women. Women in the age bracket of 35 to 50 years have the highest fertility rate with 19.0 births per 1,000 women. Women in the age bracket of 35 to 50 years acount for 100.0% of all women with births.
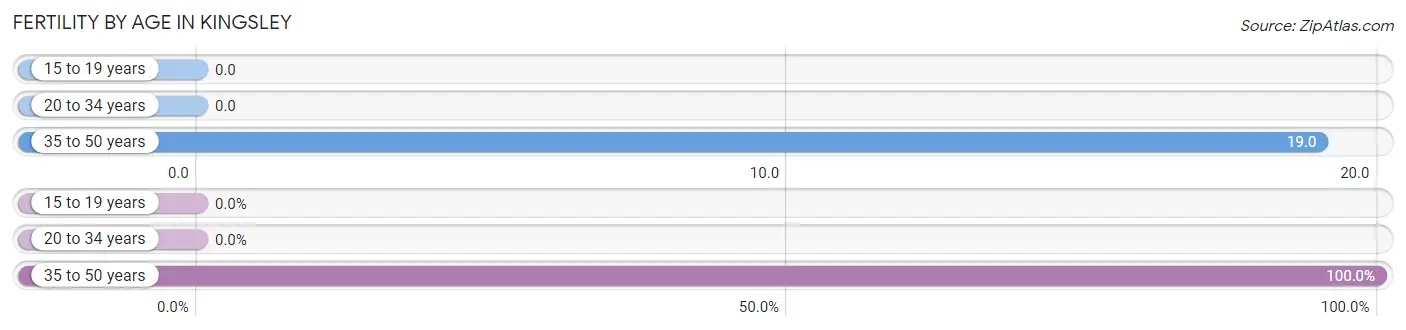
| Age Bracket | Women with Births | Births / 1,000 Women |
| 15 to 19 years | 0 (0.0%) | 0.0 |
| 20 to 34 years | 0 (0.0%) | 0.0 |
| 35 to 50 years | 3 (100.0%) | 19.0 |
| Total | 3 (100.0%) | 10.0 |
Fertility by Age by Marriage Status in Kingsley
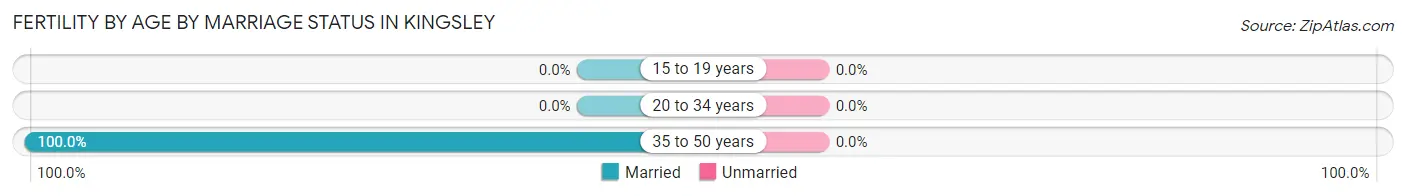
| Age Bracket | Married | Unmarried |
| 15 to 19 years | 0 (0.0%) | 0 (0.0%) |
| 20 to 34 years | 0 (0.0%) | 0 (0.0%) |
| 35 to 50 years | 3 (100.0%) | 0 (0.0%) |
| Total | 3 (100.0%) | 0 (0.0%) |
Fertility by Education in Kingsley
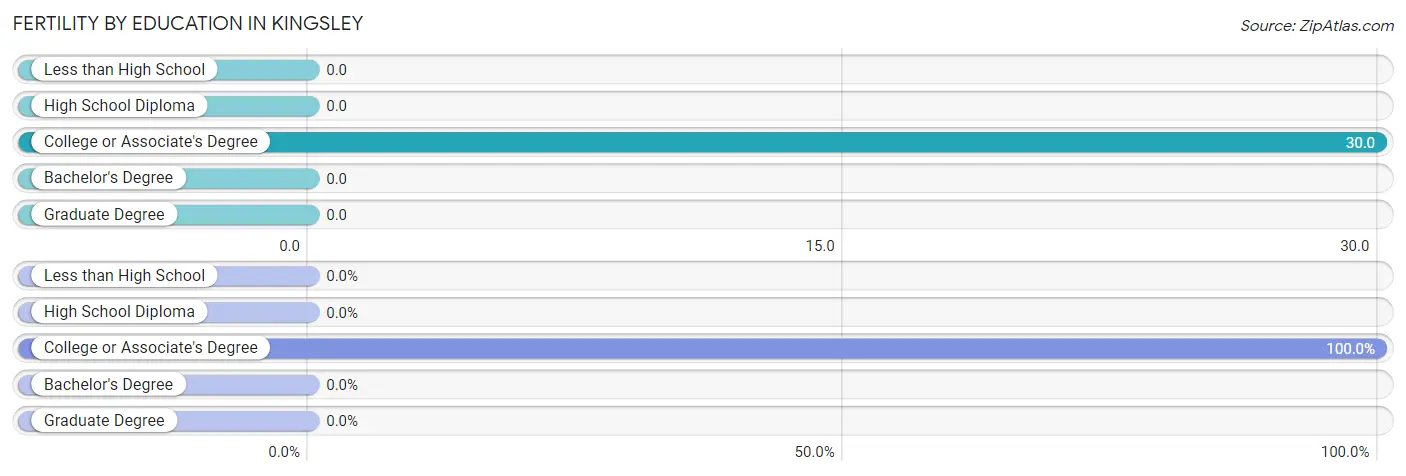
| Educational Attainment | Women with Births | Births / 1,000 Women |
| Less than High School | 0 (0.0%) | 0.0 |
| High School Diploma | 0 (0.0%) | 0.0 |
| College or Associate's Degree | 3 (100.0%) | 30.0 |
| Bachelor's Degree | 0 (0.0%) | 0.0 |
| Graduate Degree | 0 (0.0%) | 0.0 |
| Total | 3 (100.0%) | 10.0 |
Fertility by Education by Marriage Status in Kingsley
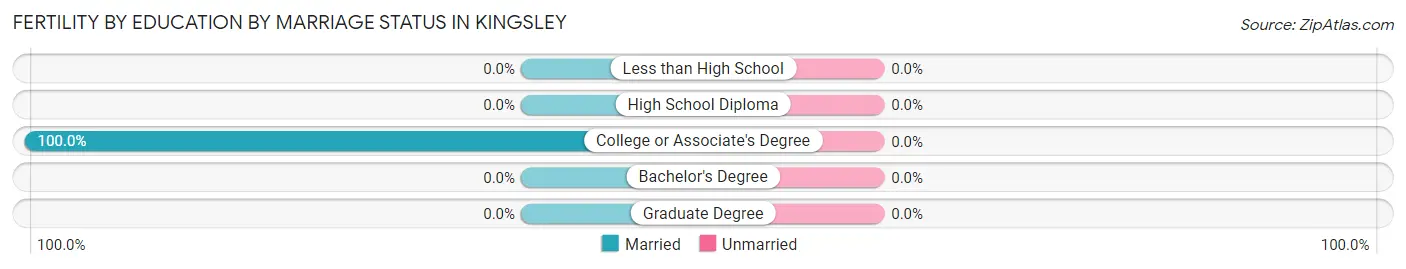
| Educational Attainment | Married | Unmarried |
| Less than High School | 0 (0.0%) | 0 (0.0%) |
| High School Diploma | 0 (0.0%) | 0 (0.0%) |
| College or Associate's Degree | 3 (100.0%) | 0 (0.0%) |
| Bachelor's Degree | 0 (0.0%) | 0 (0.0%) |
| Graduate Degree | 0 (0.0%) | 0 (0.0%) |
| Total | 3 (100.0%) | 0 (0.0%) |
Employment Characteristics in Kingsley
Employment by Class of Employer in Kingsley
Among the 696 employed individuals in Kingsley, private company employees (439 | 63.1%), self-employed (not incorporated) (73 | 10.5%), and not-for-profit organizations (53 | 7.6%) make up the most common classes of employment.
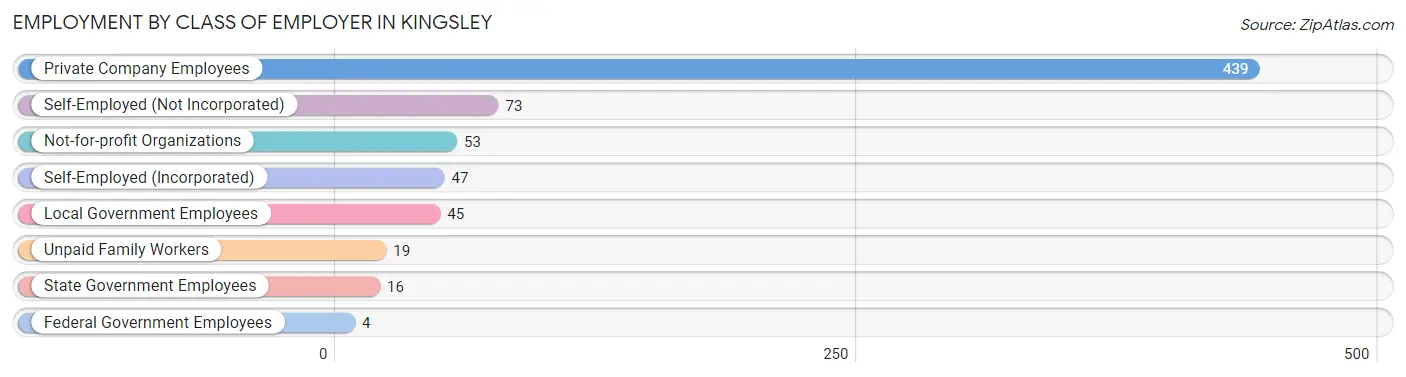
| Employer Class | # Employees | % Employees |
| Private Company Employees | 439 | 63.1% |
| Self-Employed (Incorporated) | 47 | 6.8% |
| Self-Employed (Not Incorporated) | 73 | 10.5% |
| Not-for-profit Organizations | 53 | 7.6% |
| Local Government Employees | 45 | 6.5% |
| State Government Employees | 16 | 2.3% |
| Federal Government Employees | 4 | 0.6% |
| Unpaid Family Workers | 19 | 2.7% |
| Total | 696 | 100.0% |
Employment Status by Age in Kingsley
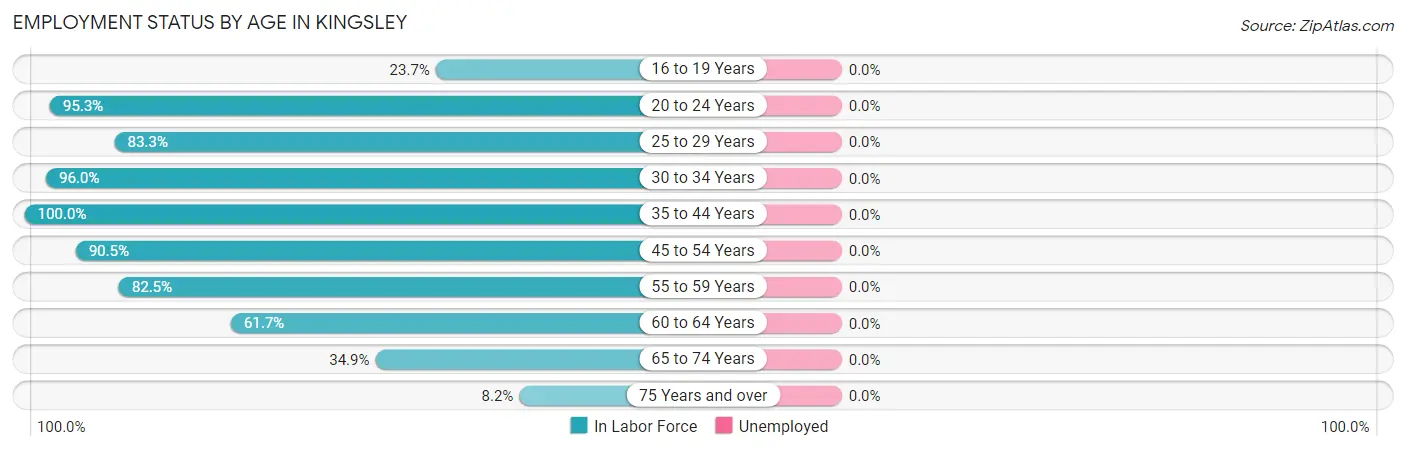
| Age Bracket | In Labor Force | Unemployed |
| 16 to 19 Years | 18 (23.7%) | 0 (0.0%) |
| 20 to 24 Years | 82 (95.3%) | 0 (0.0%) |
| 25 to 29 Years | 50 (83.3%) | 0 (0.0%) |
| 30 to 34 Years | 48 (96.0%) | 0 (0.0%) |
| 35 to 44 Years | 177 (100.0%) | 0 (0.0%) |
| 45 to 54 Years | 171 (90.5%) | 0 (0.0%) |
| 55 to 59 Years | 47 (82.5%) | 0 (0.0%) |
| 60 to 64 Years | 50 (61.7%) | 0 (0.0%) |
| 65 to 74 Years | 67 (34.9%) | 0 (0.0%) |
| 75 Years and over | 13 (8.2%) | 0 (0.0%) |
| Total | 724 (64.2%) | 0 (0.0%) |
Employment Status by Educational Attainment in Kingsley
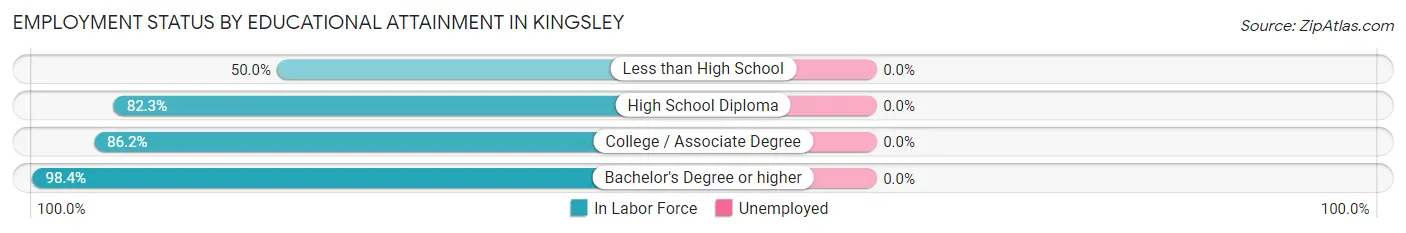
| Educational Attainment | In Labor Force | Unemployed |
| Less than High School | 3 (50.0%) | 0 (0.0%) |
| High School Diploma | 158 (82.3%) | 0 (0.0%) |
| College / Associate Degree | 193 (86.2%) | 0 (0.0%) |
| Bachelor's Degree or higher | 189 (98.4%) | 0 (0.0%) |
| Total | 543 (88.4%) | 0 (0.0%) |
Employment Occupations by Sex in Kingsley
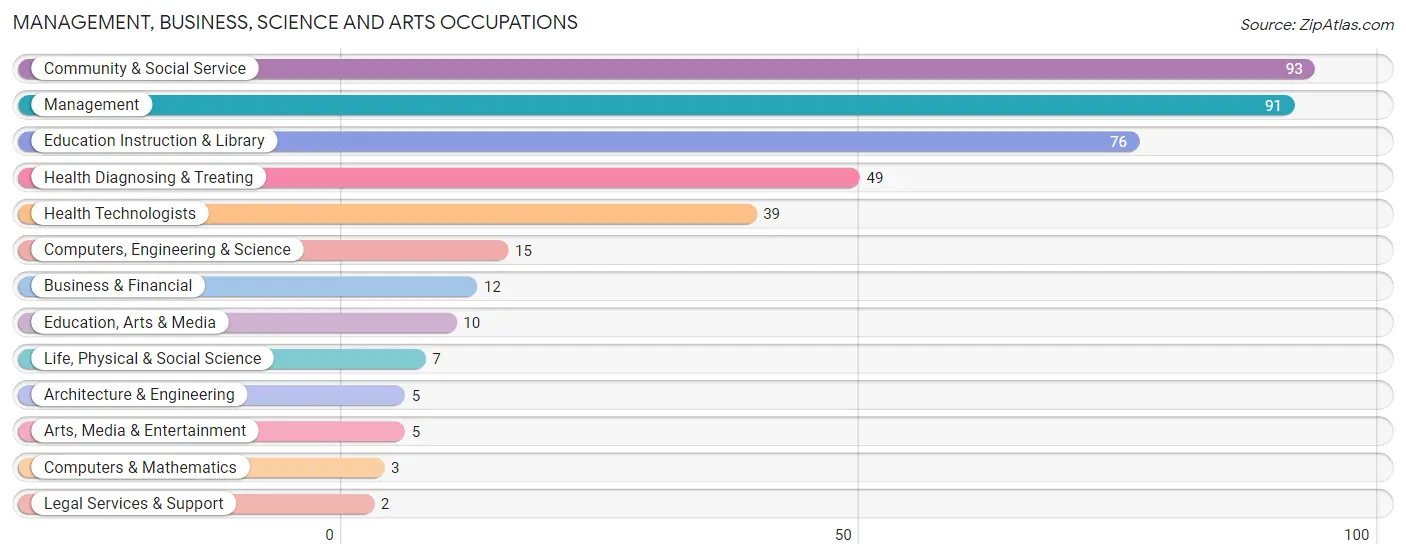
Management, Business, Science and Arts Occupations
The most common Management, Business, Science and Arts occupations in Kingsley are Community & Social Service (93 | 12.9%), Management (91 | 12.6%), Education Instruction & Library (76 | 10.5%), Health Diagnosing & Treating (49 | 6.8%), and Health Technologists (39 | 5.4%).
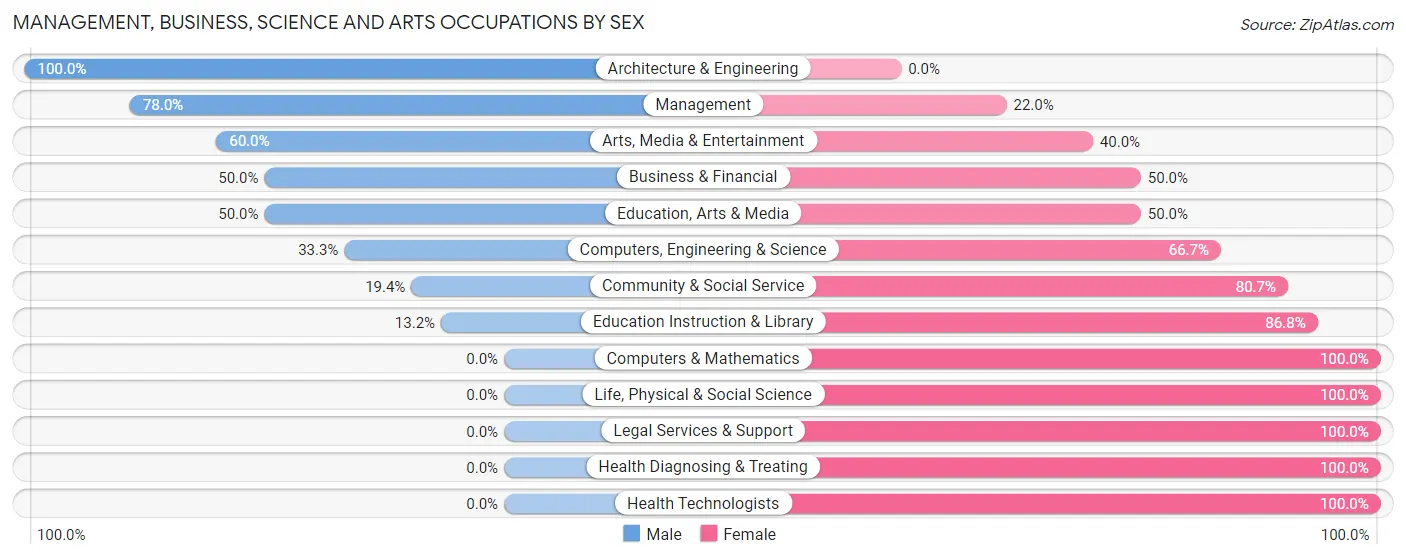
Management, Business, Science and Arts Occupations by Sex
Within the Management, Business, Science and Arts occupations in Kingsley, the most male-oriented occupations are Architecture & Engineering (100.0%), Management (78.0%), and Arts, Media & Entertainment (60.0%), while the most female-oriented occupations are Computers & Mathematics (100.0%), Life, Physical & Social Science (100.0%), and Legal Services & Support (100.0%).
| Occupation | Male | Female |
| Management | 71 (78.0%) | 20 (22.0%) |
| Business & Financial | 6 (50.0%) | 6 (50.0%) |
| Computers, Engineering & Science | 5 (33.3%) | 10 (66.7%) |
| Computers & Mathematics | 0 (0.0%) | 3 (100.0%) |
| Architecture & Engineering | 5 (100.0%) | 0 (0.0%) |
| Life, Physical & Social Science | 0 (0.0%) | 7 (100.0%) |
| Community & Social Service | 18 (19.4%) | 75 (80.6%) |
| Education, Arts & Media | 5 (50.0%) | 5 (50.0%) |
| Legal Services & Support | 0 (0.0%) | 2 (100.0%) |
| Education Instruction & Library | 10 (13.2%) | 66 (86.8%) |
| Arts, Media & Entertainment | 3 (60.0%) | 2 (40.0%) |
| Health Diagnosing & Treating | 0 (0.0%) | 49 (100.0%) |
| Health Technologists | 0 (0.0%) | 39 (100.0%) |
| Total (Category) | 100 (38.5%) | 160 (61.5%) |
| Total (Overall) | 376 (52.0%) | 347 (48.0%) |
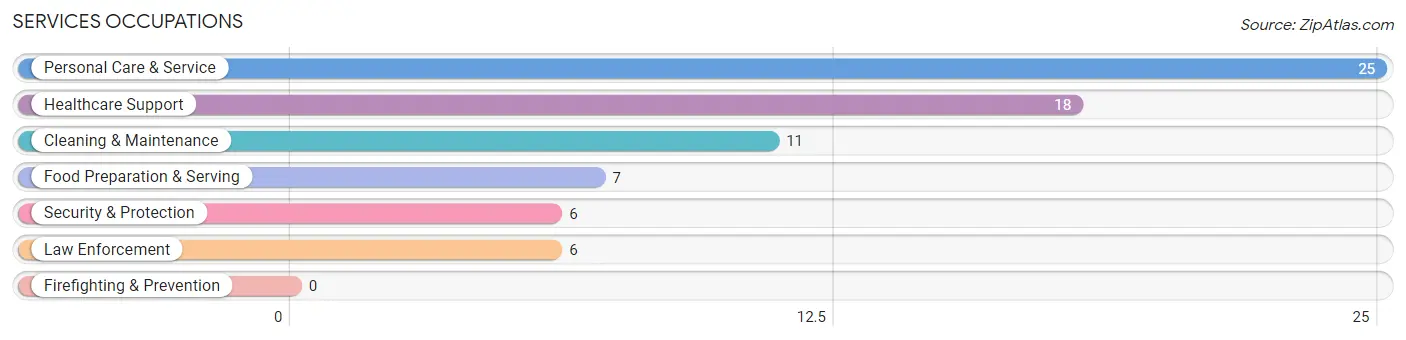
Services Occupations
The most common Services occupations in Kingsley are Personal Care & Service (25 | 3.5%), Healthcare Support (18 | 2.5%), Cleaning & Maintenance (11 | 1.5%), Food Preparation & Serving (7 | 1.0%), and Security & Protection (6 | 0.8%).
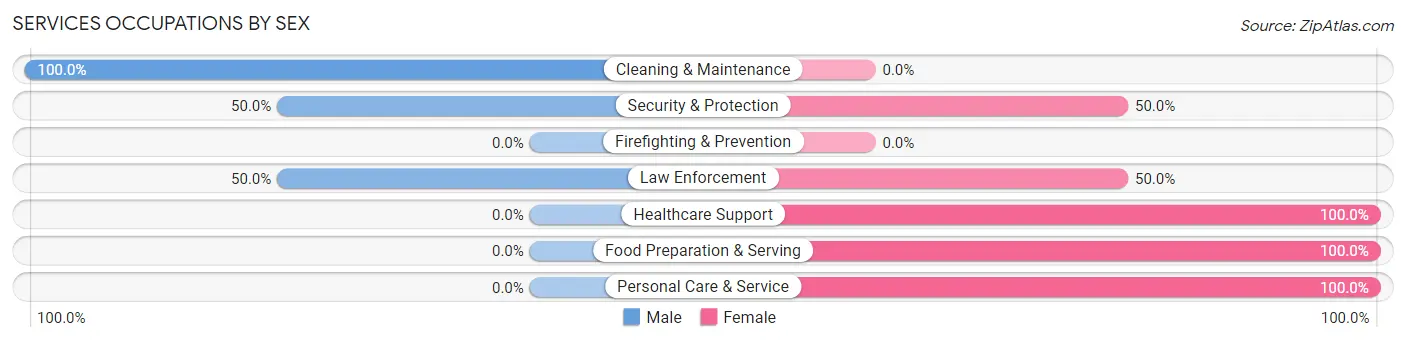
Services Occupations by Sex
Within the Services occupations in Kingsley, the most male-oriented occupations are Cleaning & Maintenance (100.0%), Security & Protection (50.0%), and Law Enforcement (50.0%), while the most female-oriented occupations are Healthcare Support (100.0%), Food Preparation & Serving (100.0%), and Personal Care & Service (100.0%).
| Occupation | Male | Female |
| Healthcare Support | 0 (0.0%) | 18 (100.0%) |
| Security & Protection | 3 (50.0%) | 3 (50.0%) |
| Firefighting & Prevention | 0 (0.0%) | 0 (0.0%) |
| Law Enforcement | 3 (50.0%) | 3 (50.0%) |
| Food Preparation & Serving | 0 (0.0%) | 7 (100.0%) |
| Cleaning & Maintenance | 11 (100.0%) | 0 (0.0%) |
| Personal Care & Service | 0 (0.0%) | 25 (100.0%) |
| Total (Category) | 14 (20.9%) | 53 (79.1%) |
| Total (Overall) | 376 (52.0%) | 347 (48.0%) |
Sales and Office Occupations
The most common Sales and Office occupations in Kingsley are Sales & Related (103 | 14.2%), and Office & Administration (74 | 10.2%).
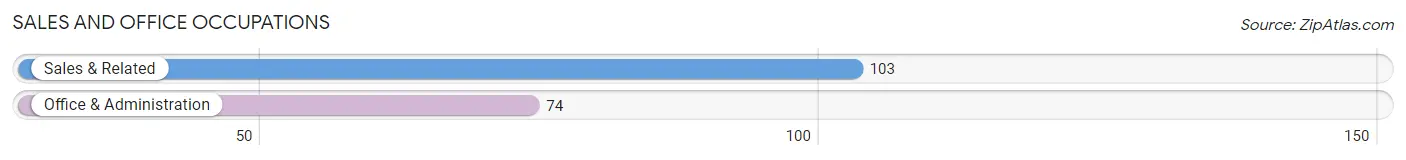
Sales and Office Occupations by Sex
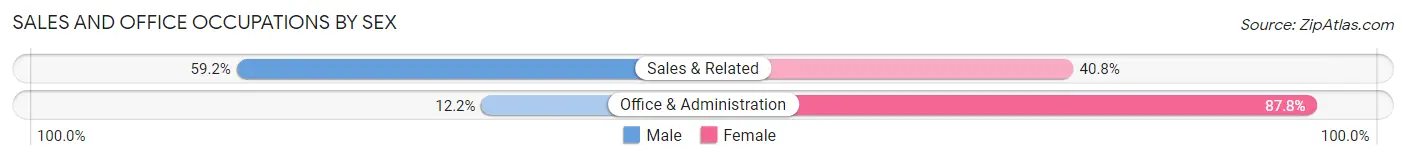
| Occupation | Male | Female |
| Sales & Related | 61 (59.2%) | 42 (40.8%) |
| Office & Administration | 9 (12.2%) | 65 (87.8%) |
| Total (Category) | 70 (39.6%) | 107 (60.5%) |
| Total (Overall) | 376 (52.0%) | 347 (48.0%) |
Natural Resources, Construction and Maintenance Occupations
The most common Natural Resources, Construction and Maintenance occupations in Kingsley are Construction & Extraction (32 | 4.4%), Installation, Maintenance & Repair (31 | 4.3%), and Farming, Fishing & Forestry (14 | 1.9%).
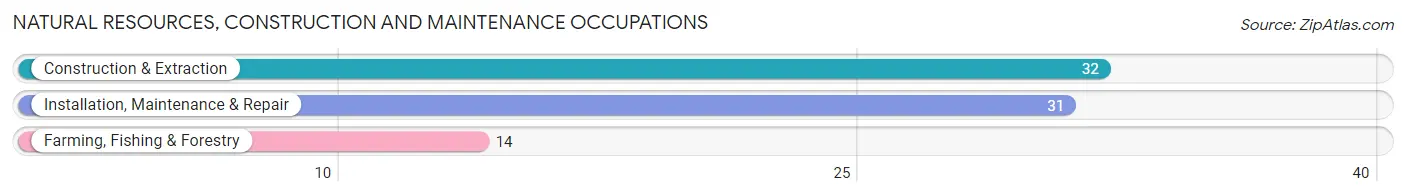
Natural Resources, Construction and Maintenance Occupations by Sex
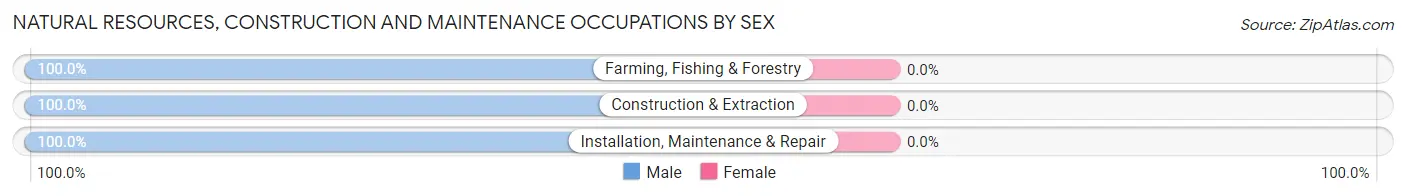
| Occupation | Male | Female |
| Farming, Fishing & Forestry | 14 (100.0%) | 0 (0.0%) |
| Construction & Extraction | 32 (100.0%) | 0 (0.0%) |
| Installation, Maintenance & Repair | 31 (100.0%) | 0 (0.0%) |
| Total (Category) | 77 (100.0%) | 0 (0.0%) |
| Total (Overall) | 376 (52.0%) | 347 (48.0%) |
Production, Transportation and Moving Occupations
The most common Production, Transportation and Moving occupations in Kingsley are Transportation (100 | 13.8%), Production (26 | 3.6%), and Material Moving (16 | 2.2%).
Production, Transportation and Moving Occupations by Sex
| Occupation | Male | Female |
| Production | 26 (100.0%) | 0 (0.0%) |
| Transportation | 81 (81.0%) | 19 (19.0%) |
| Material Moving | 8 (50.0%) | 8 (50.0%) |
| Total (Category) | 115 (81.0%) | 27 (19.0%) |
| Total (Overall) | 376 (52.0%) | 347 (48.0%) |
Employment Industries by Sex in Kingsley
Employment Industries in Kingsley
The major employment industries in Kingsley include Health Care & Social Assistance (137 | 19.0%), Transportation & Warehousing (92 | 12.7%), Agriculture, Fishing & Hunting (80 | 11.1%), Retail Trade (73 | 10.1%), and Educational Services (73 | 10.1%).
Employment Industries by Sex in Kingsley
The Kingsley industries that see more men than women are Wholesale Trade (100.0%), Utilities (100.0%), and Manufacturing (97.6%), whereas the industries that tend to have a higher number of women are Real Estate, Rental & Leasing (100.0%), Professional & Scientific (100.0%), and Administrative & Support (100.0%).
| Industry | Male | Female |
| Agriculture, Fishing & Hunting | 69 (86.3%) | 11 (13.8%) |
| Mining, Quarrying, & Extraction | 0 (0.0%) | 0 (0.0%) |
| Construction | 50 (76.9%) | 15 (23.1%) |
| Manufacturing | 41 (97.6%) | 1 (2.4%) |
| Wholesale Trade | 23 (100.0%) | 0 (0.0%) |
| Retail Trade | 42 (57.5%) | 31 (42.5%) |
| Transportation & Warehousing | 64 (69.6%) | 28 (30.4%) |
| Utilities | 3 (100.0%) | 0 (0.0%) |
| Information | 9 (64.3%) | 5 (35.7%) |
| Finance & Insurance | 17 (56.7%) | 13 (43.3%) |
| Real Estate, Rental & Leasing | 0 (0.0%) | 15 (100.0%) |
| Professional & Scientific | 0 (0.0%) | 5 (100.0%) |
| Enterprise Management | 0 (0.0%) | 0 (0.0%) |
| Administrative & Support | 0 (0.0%) | 4 (100.0%) |
| Educational Services | 17 (23.3%) | 56 (76.7%) |
| Health Care & Social Assistance | 0 (0.0%) | 137 (100.0%) |
| Arts, Entertainment & Recreation | 0 (0.0%) | 5 (100.0%) |
| Accommodation & Food Services | 3 (30.0%) | 7 (70.0%) |
| Public Administration | 17 (68.0%) | 8 (32.0%) |
| Total | 376 (52.0%) | 347 (48.0%) |
Education in Kingsley
School Enrollment in Kingsley
The most common levels of schooling among the 320 students in Kingsley are high school (102 | 31.9%), middle school (79 | 24.7%), and elementary school (76 | 23.7%).
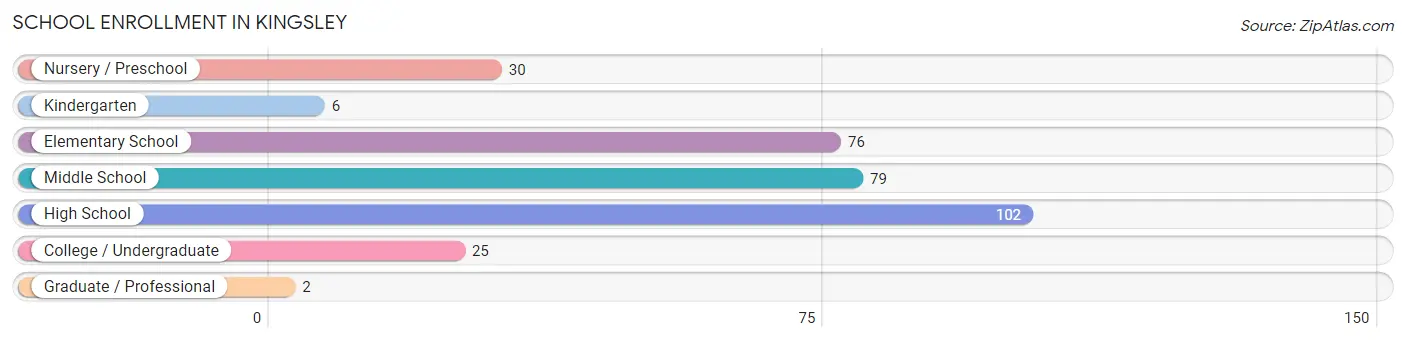
| School Level | # Students | % Students |
| Nursery / Preschool | 30 | 9.4% |
| Kindergarten | 6 | 1.9% |
| Elementary School | 76 | 23.7% |
| Middle School | 79 | 24.7% |
| High School | 102 | 31.9% |
| College / Undergraduate | 25 | 7.8% |
| Graduate / Professional | 2 | 0.6% |
| Total | 320 | 100.0% |
School Enrollment by Age by Funding Source in Kingsley
Out of a total of 320 students who are enrolled in schools in Kingsley, 20 (6.3%) attend a private institution, while the remaining 300 (93.7%) are enrolled in public schools. The age group of 35 years and over has the highest likelihood of being enrolled in private schools, with 2 (100.0% in the age bracket) enrolled. Conversely, the age group of 3 to 4 year olds has the lowest likelihood of being enrolled in a private school, with 22 (100.0% in the age bracket) attending a public institution.
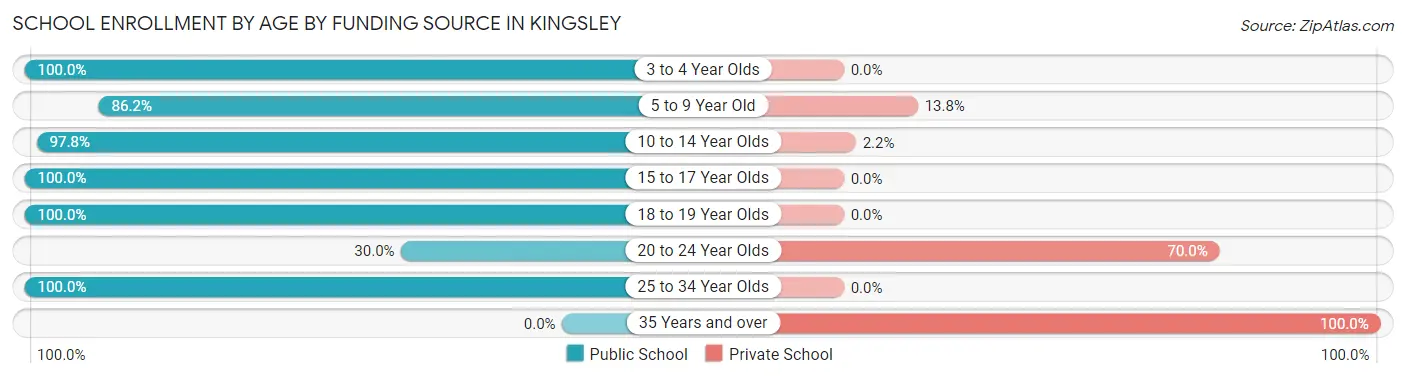
| Age Bracket | Public School | Private School |
| 3 to 4 Year Olds | 22 (100.0%) | 0 (0.0%) |
| 5 to 9 Year Old | 50 (86.2%) | 8 (13.8%) |
| 10 to 14 Year Olds | 131 (97.8%) | 3 (2.2%) |
| 15 to 17 Year Olds | 47 (100.0%) | 0 (0.0%) |
| 18 to 19 Year Olds | 37 (100.0%) | 0 (0.0%) |
| 20 to 24 Year Olds | 3 (30.0%) | 7 (70.0%) |
| 25 to 34 Year Olds | 10 (100.0%) | 0 (0.0%) |
| 35 Years and over | 0 (0.0%) | 2 (100.0%) |
| Total | 300 (93.8%) | 20 (6.3%) |
Educational Attainment by Field of Study in Kingsley
Education (74 | 23.9%), business (55 | 17.8%), science & technology (52 | 16.8%), literature & languages (27 | 8.7%), and bio, nature & agricultural (26 | 8.4%) are the most common fields of study among 309 individuals in Kingsley who have obtained a bachelor's degree or higher.
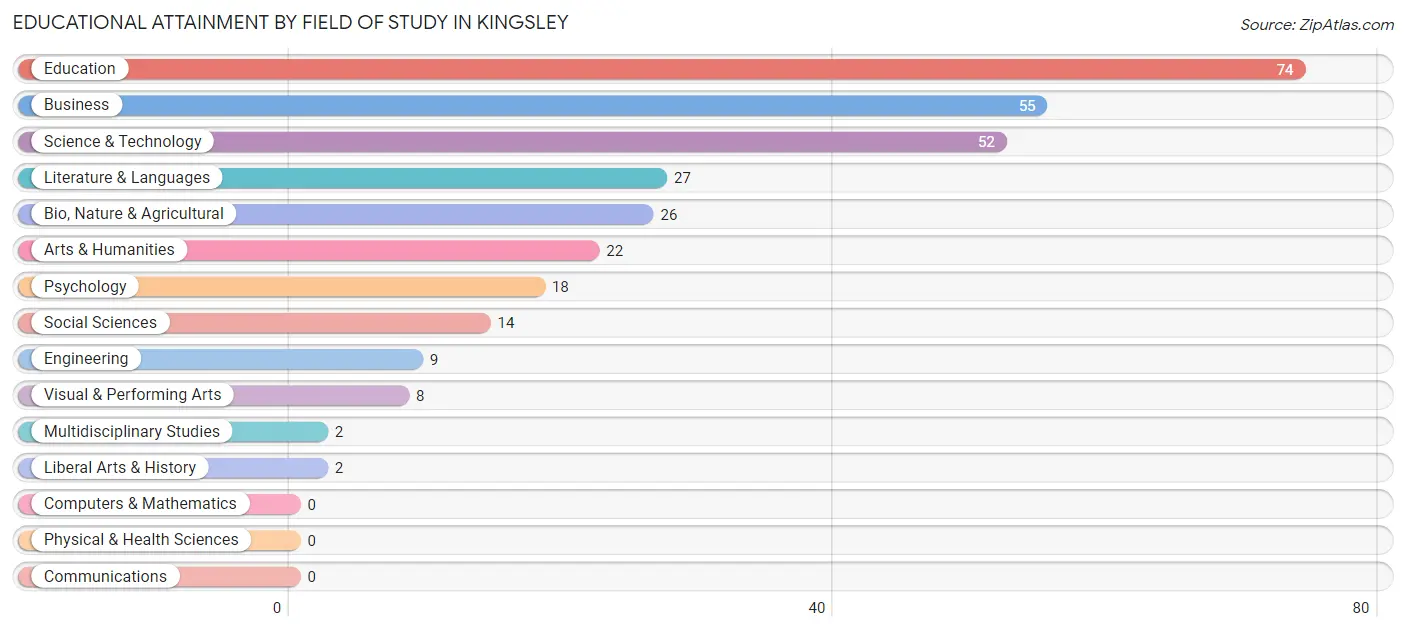
| Field of Study | # Graduates | % Graduates |
| Computers & Mathematics | 0 | 0.0% |
| Bio, Nature & Agricultural | 26 | 8.4% |
| Physical & Health Sciences | 0 | 0.0% |
| Psychology | 18 | 5.8% |
| Social Sciences | 14 | 4.5% |
| Engineering | 9 | 2.9% |
| Multidisciplinary Studies | 2 | 0.6% |
| Science & Technology | 52 | 16.8% |
| Business | 55 | 17.8% |
| Education | 74 | 23.9% |
| Literature & Languages | 27 | 8.7% |
| Liberal Arts & History | 2 | 0.6% |
| Visual & Performing Arts | 8 | 2.6% |
| Communications | 0 | 0.0% |
| Arts & Humanities | 22 | 7.1% |
| Total | 309 | 100.0% |
Transportation & Commute in Kingsley
Vehicle Availability by Sex in Kingsley
The most prevalent vehicle ownership categories in Kingsley are males with 2 vehicles (114, accounting for 31.8%) and females with 2 vehicles (118, making up 33.7%).
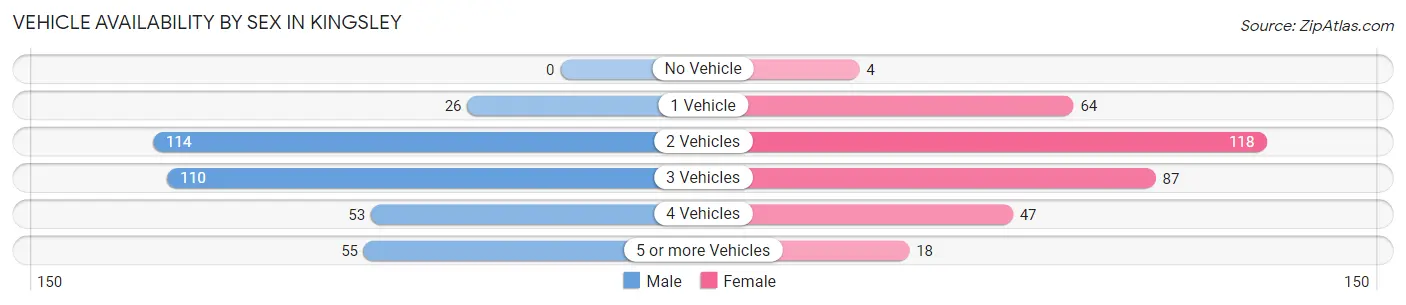
| Vehicles Available | Male | Female |
| No Vehicle | 0 (0.0%) | 4 (1.2%) |
| 1 Vehicle | 26 (7.3%) | 64 (18.9%) |
| 2 Vehicles | 114 (31.8%) | 118 (34.9%) |
| 3 Vehicles | 110 (30.7%) | 87 (25.7%) |
| 4 Vehicles | 53 (14.8%) | 47 (13.9%) |
| 5 or more Vehicles | 55 (15.4%) | 18 (5.3%) |
| Total | 358 (100.0%) | 338 (100.0%) |
Commute Time in Kingsley
The most frequently occuring commute durations in Kingsley are 30 to 34 minutes (95 commuters, 16.3%), less than 5 minutes (83 commuters, 14.2%), and 5 to 9 minutes (78 commuters, 13.4%).
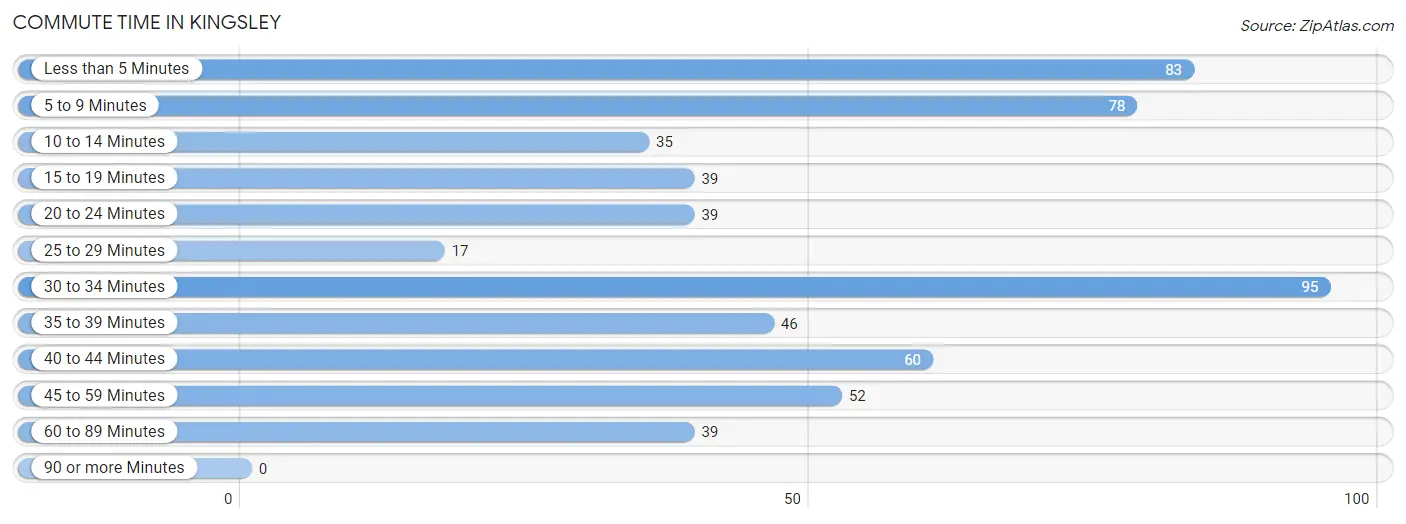
| Commute Time | # Commuters | % Commuters |
| Less than 5 Minutes | 83 | 14.2% |
| 5 to 9 Minutes | 78 | 13.4% |
| 10 to 14 Minutes | 35 | 6.0% |
| 15 to 19 Minutes | 39 | 6.7% |
| 20 to 24 Minutes | 39 | 6.7% |
| 25 to 29 Minutes | 17 | 2.9% |
| 30 to 34 Minutes | 95 | 16.3% |
| 35 to 39 Minutes | 46 | 7.9% |
| 40 to 44 Minutes | 60 | 10.3% |
| 45 to 59 Minutes | 52 | 8.9% |
| 60 to 89 Minutes | 39 | 6.7% |
| 90 or more Minutes | 0 | 0.0% |
Commute Time by Sex in Kingsley
The most common commute times in Kingsley are less than 5 minutes (53 commuters, 17.4%) for males and 40 to 44 minutes (44 commuters, 15.8%) for females.
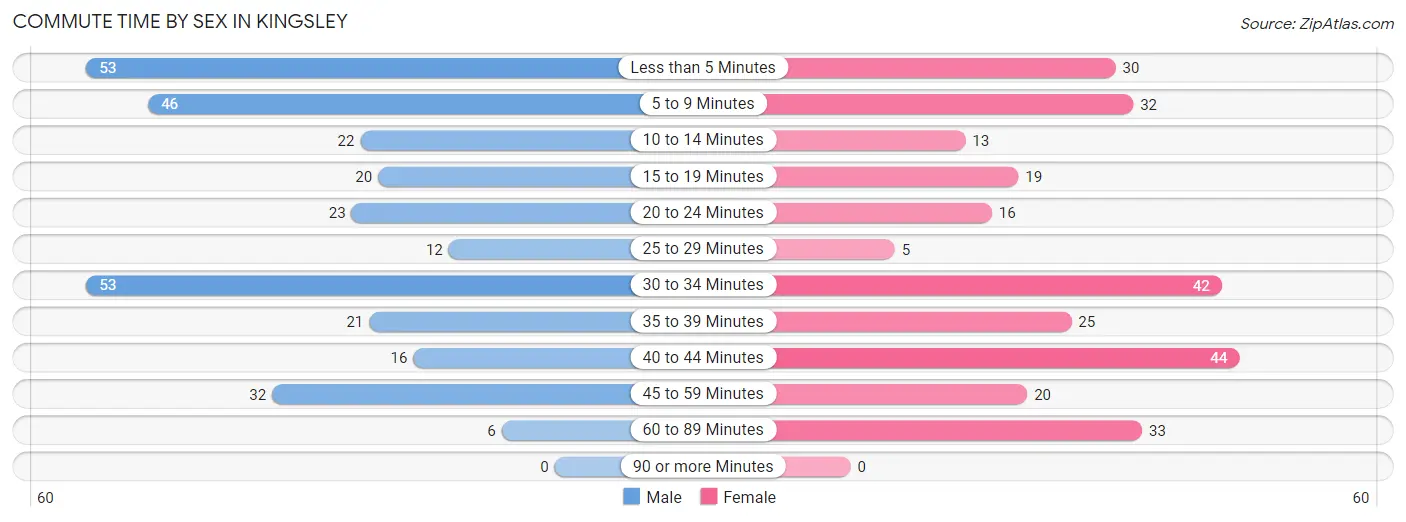
| Commute Time | Male | Female |
| Less than 5 Minutes | 53 (17.4%) | 30 (10.7%) |
| 5 to 9 Minutes | 46 (15.1%) | 32 (11.5%) |
| 10 to 14 Minutes | 22 (7.2%) | 13 (4.7%) |
| 15 to 19 Minutes | 20 (6.6%) | 19 (6.8%) |
| 20 to 24 Minutes | 23 (7.6%) | 16 (5.7%) |
| 25 to 29 Minutes | 12 (4.0%) | 5 (1.8%) |
| 30 to 34 Minutes | 53 (17.4%) | 42 (15.0%) |
| 35 to 39 Minutes | 21 (6.9%) | 25 (9.0%) |
| 40 to 44 Minutes | 16 (5.3%) | 44 (15.8%) |
| 45 to 59 Minutes | 32 (10.5%) | 20 (7.2%) |
| 60 to 89 Minutes | 6 (2.0%) | 33 (11.8%) |
| 90 or more Minutes | 0 (0.0%) | 0 (0.0%) |
Time of Departure to Work by Sex in Kingsley
The most frequent times of departure to work in Kingsley are 6:00 AM to 6:29 AM (68, 22.4%) for males and 7:00 AM to 7:29 AM (82, 29.4%) for females.
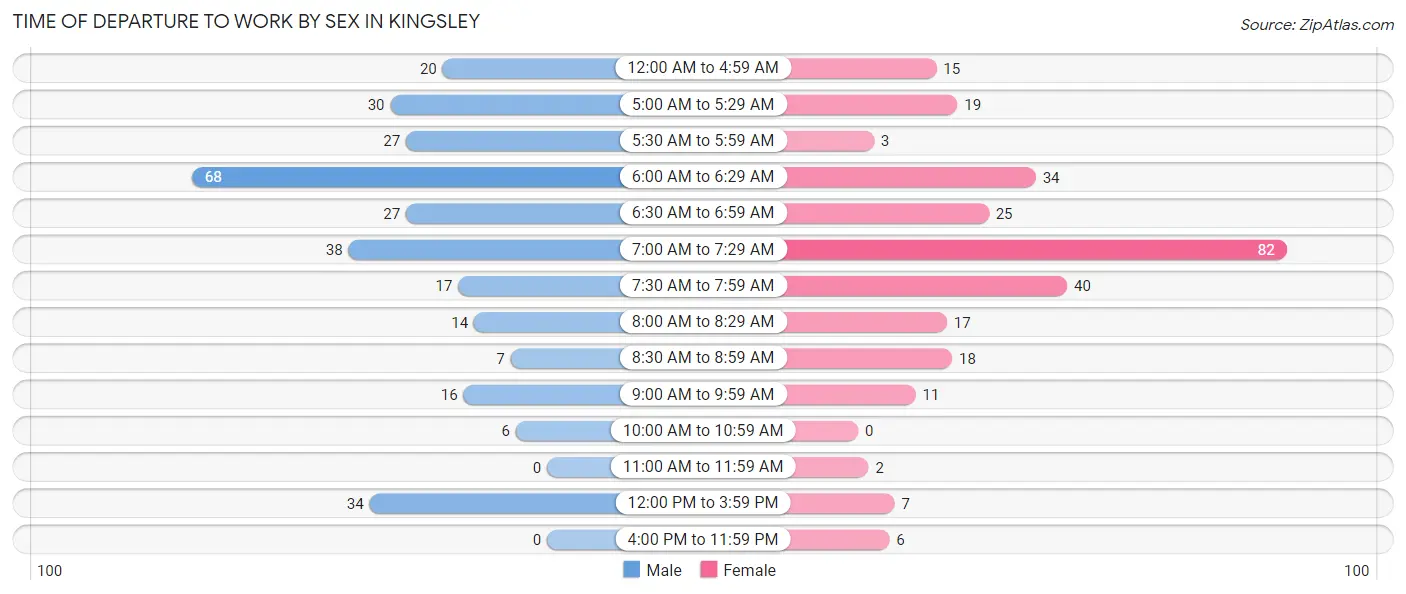
| Time of Departure | Male | Female |
| 12:00 AM to 4:59 AM | 20 (6.6%) | 15 (5.4%) |
| 5:00 AM to 5:29 AM | 30 (9.9%) | 19 (6.8%) |
| 5:30 AM to 5:59 AM | 27 (8.9%) | 3 (1.1%) |
| 6:00 AM to 6:29 AM | 68 (22.4%) | 34 (12.2%) |
| 6:30 AM to 6:59 AM | 27 (8.9%) | 25 (9.0%) |
| 7:00 AM to 7:29 AM | 38 (12.5%) | 82 (29.4%) |
| 7:30 AM to 7:59 AM | 17 (5.6%) | 40 (14.3%) |
| 8:00 AM to 8:29 AM | 14 (4.6%) | 17 (6.1%) |
| 8:30 AM to 8:59 AM | 7 (2.3%) | 18 (6.5%) |
| 9:00 AM to 9:59 AM | 16 (5.3%) | 11 (3.9%) |
| 10:00 AM to 10:59 AM | 6 (2.0%) | 0 (0.0%) |
| 11:00 AM to 11:59 AM | 0 (0.0%) | 2 (0.7%) |
| 12:00 PM to 3:59 PM | 34 (11.2%) | 7 (2.5%) |
| 4:00 PM to 11:59 PM | 0 (0.0%) | 6 (2.1%) |
| Total | 304 (100.0%) | 279 (100.0%) |
Housing Occupancy in Kingsley
Occupancy by Ownership in Kingsley
Of the total 622 dwellings in Kingsley, owner-occupied units account for 475 (76.4%), while renter-occupied units make up 147 (23.6%).
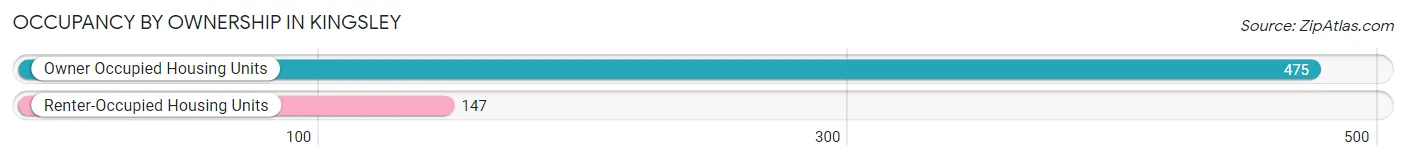
| Occupancy | # Housing Units | % Housing Units |
| Owner Occupied Housing Units | 475 | 76.4% |
| Renter-Occupied Housing Units | 147 | 23.6% |
| Total Occupied Housing Units | 622 | 100.0% |
Occupancy by Household Size in Kingsley
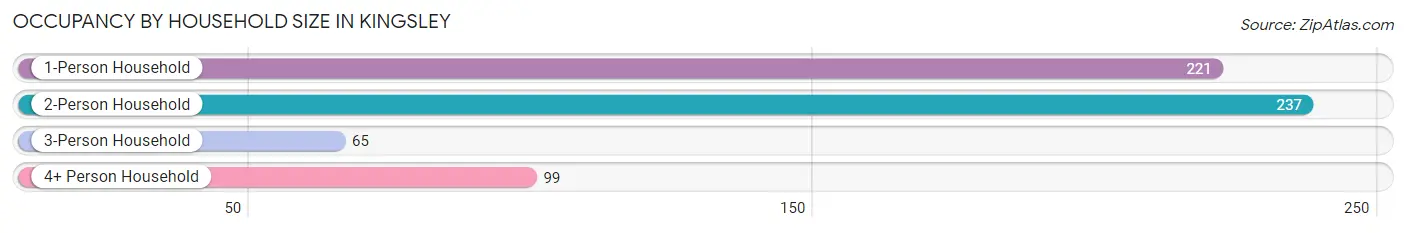
| Household Size | # Housing Units | % Housing Units |
| 1-Person Household | 221 | 35.5% |
| 2-Person Household | 237 | 38.1% |
| 3-Person Household | 65 | 10.4% |
| 4+ Person Household | 99 | 15.9% |
| Total Housing Units | 622 | 100.0% |
Occupancy by Ownership by Household Size in Kingsley
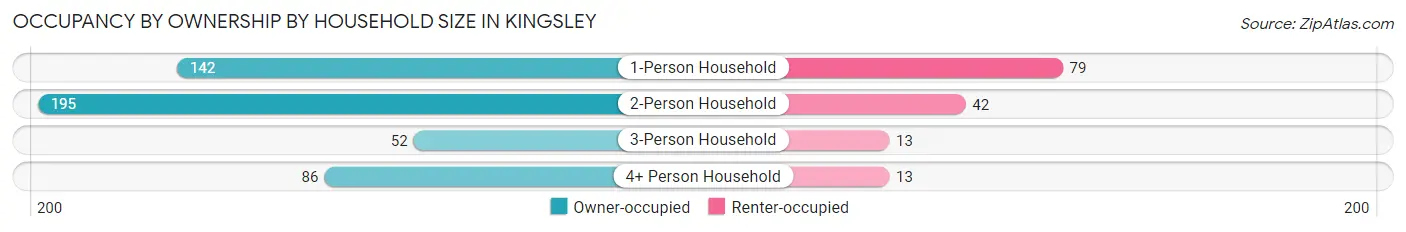
| Household Size | Owner-occupied | Renter-occupied |
| 1-Person Household | 142 (64.2%) | 79 (35.7%) |
| 2-Person Household | 195 (82.3%) | 42 (17.7%) |
| 3-Person Household | 52 (80.0%) | 13 (20.0%) |
| 4+ Person Household | 86 (86.9%) | 13 (13.1%) |
| Total Housing Units | 475 (76.4%) | 147 (23.6%) |
Occupancy by Educational Attainment in Kingsley
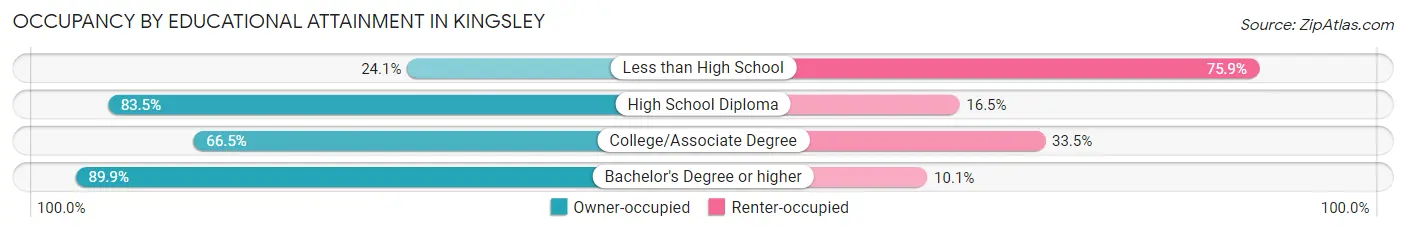
| Household Size | Owner-occupied | Renter-occupied |
| Less than High School | 7 (24.1%) | 22 (75.9%) |
| High School Diploma | 157 (83.5%) | 31 (16.5%) |
| College/Associate Degree | 151 (66.5%) | 76 (33.5%) |
| Bachelor's Degree or higher | 160 (89.9%) | 18 (10.1%) |
Occupancy by Age of Householder in Kingsley
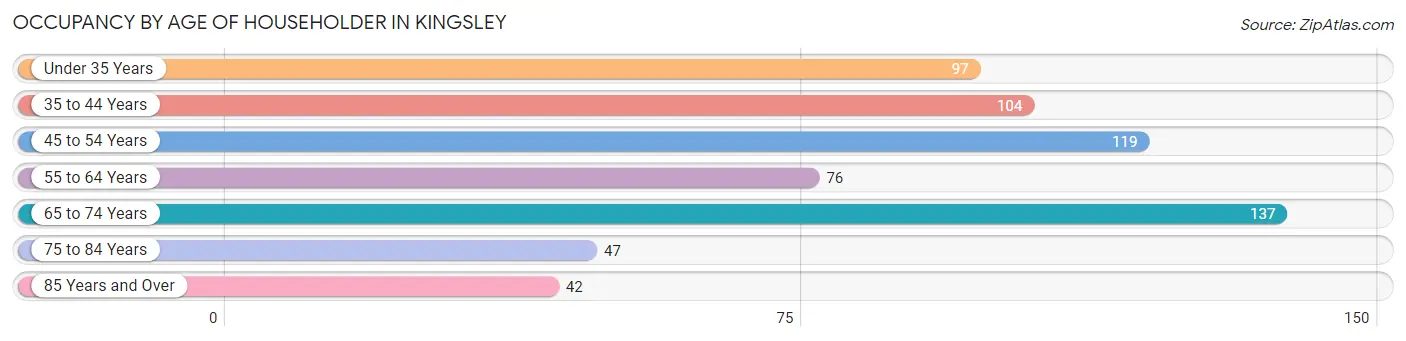
| Age Bracket | # Households | % Households |
| Under 35 Years | 97 | 15.6% |
| 35 to 44 Years | 104 | 16.7% |
| 45 to 54 Years | 119 | 19.1% |
| 55 to 64 Years | 76 | 12.2% |
| 65 to 74 Years | 137 | 22.0% |
| 75 to 84 Years | 47 | 7.6% |
| 85 Years and Over | 42 | 6.8% |
| Total | 622 | 100.0% |
Housing Finances in Kingsley
Median Income by Occupancy in Kingsley
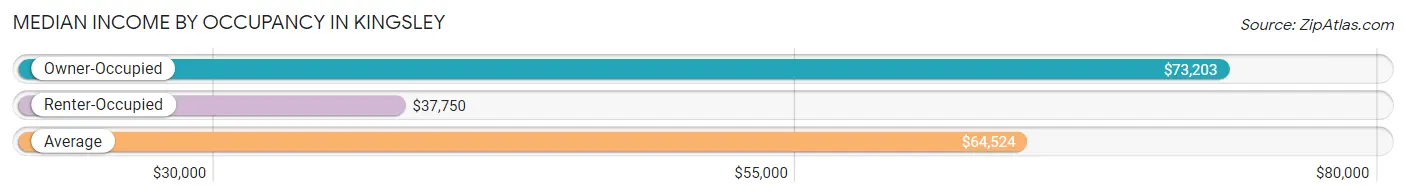
| Occupancy Type | # Households | Median Income |
| Owner-Occupied | 475 (76.4%) | $73,203 |
| Renter-Occupied | 147 (23.6%) | $37,750 |
| Average | 622 (100.0%) | $64,524 |
Occupancy by Householder Income Bracket in Kingsley
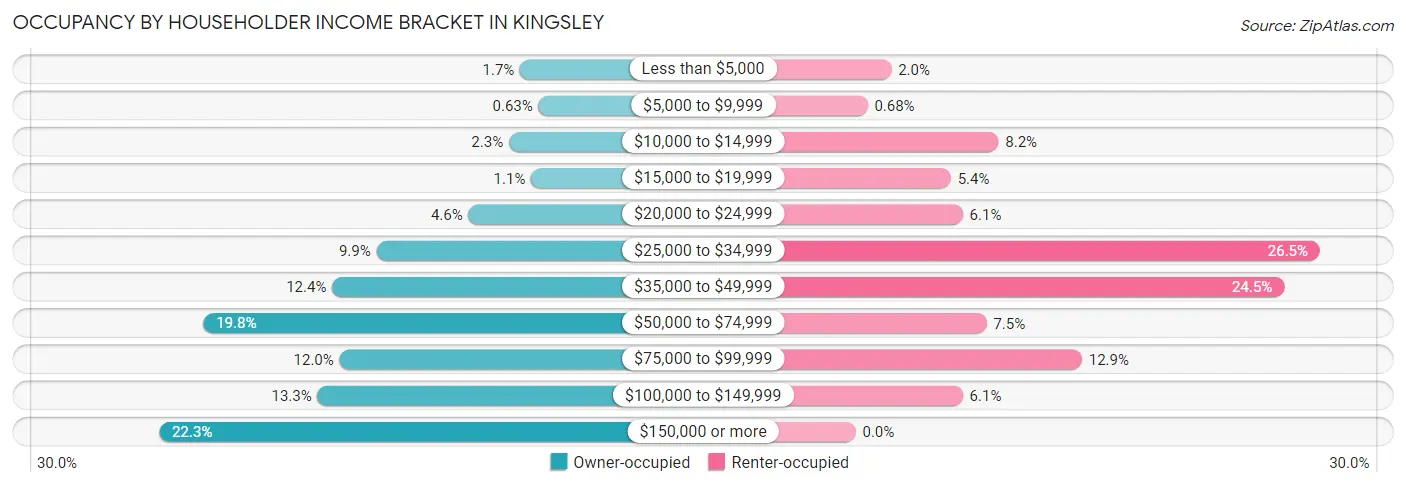
| Income Bracket | Owner-occupied | Renter-occupied |
| Less than $5,000 | 8 (1.7%) | 3 (2.0%) |
| $5,000 to $9,999 | 3 (0.6%) | 1 (0.7%) |
| $10,000 to $14,999 | 11 (2.3%) | 12 (8.2%) |
| $15,000 to $19,999 | 5 (1.1%) | 8 (5.4%) |
| $20,000 to $24,999 | 22 (4.6%) | 9 (6.1%) |
| $25,000 to $34,999 | 47 (9.9%) | 39 (26.5%) |
| $35,000 to $49,999 | 59 (12.4%) | 36 (24.5%) |
| $50,000 to $74,999 | 94 (19.8%) | 11 (7.5%) |
| $75,000 to $99,999 | 57 (12.0%) | 19 (12.9%) |
| $100,000 to $149,999 | 63 (13.3%) | 9 (6.1%) |
| $150,000 or more | 106 (22.3%) | 0 (0.0%) |
| Total | 475 (100.0%) | 147 (100.0%) |
Monthly Housing Cost Tiers in Kingsley
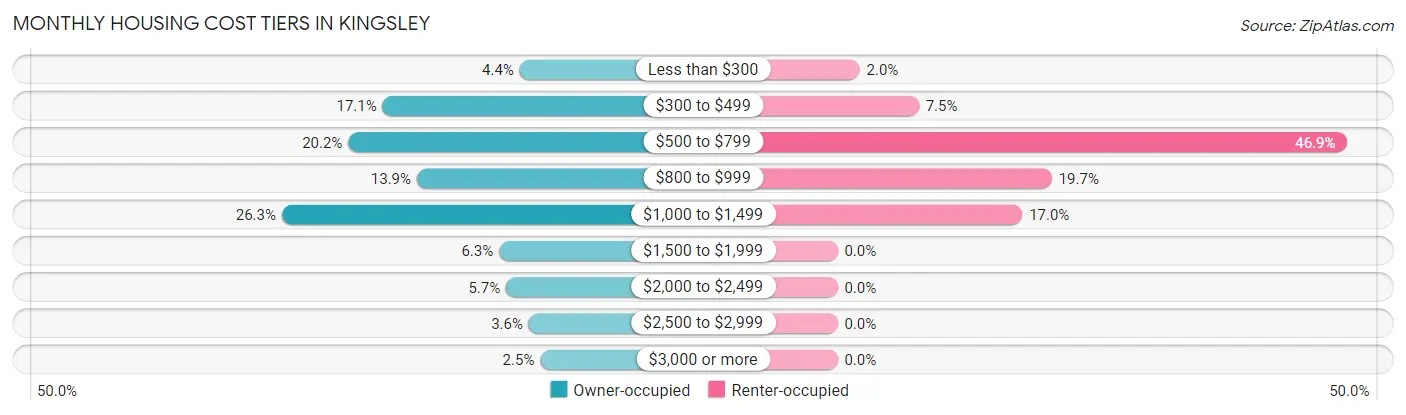
| Monthly Cost | Owner-occupied | Renter-occupied |
| Less than $300 | 21 (4.4%) | 3 (2.0%) |
| $300 to $499 | 81 (17.1%) | 11 (7.5%) |
| $500 to $799 | 96 (20.2%) | 69 (46.9%) |
| $800 to $999 | 66 (13.9%) | 29 (19.7%) |
| $1,000 to $1,499 | 125 (26.3%) | 25 (17.0%) |
| $1,500 to $1,999 | 30 (6.3%) | 0 (0.0%) |
| $2,000 to $2,499 | 27 (5.7%) | 0 (0.0%) |
| $2,500 to $2,999 | 17 (3.6%) | 0 (0.0%) |
| $3,000 or more | 12 (2.5%) | 0 (0.0%) |
| Total | 475 (100.0%) | 147 (100.0%) |
Physical Housing Characteristics in Kingsley
Housing Structures in Kingsley
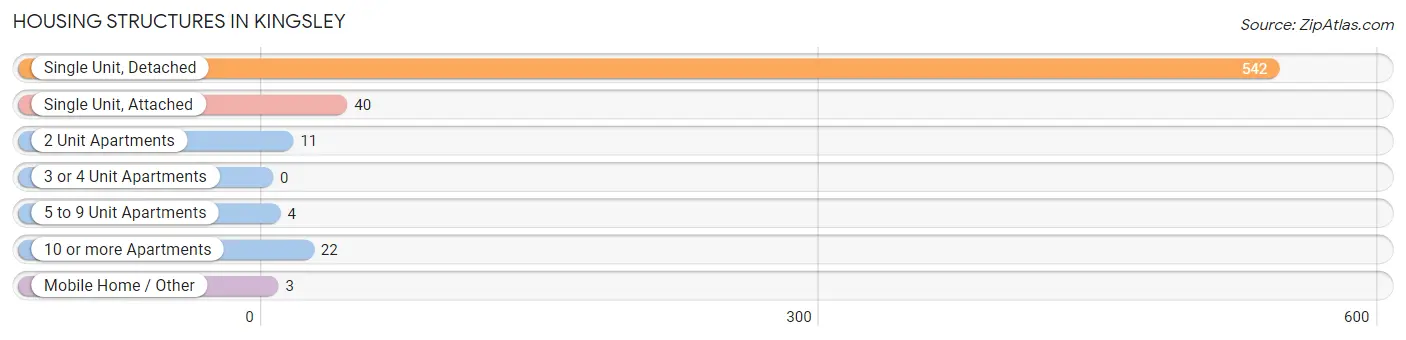
| Structure Type | # Housing Units | % Housing Units |
| Single Unit, Detached | 542 | 87.1% |
| Single Unit, Attached | 40 | 6.4% |
| 2 Unit Apartments | 11 | 1.8% |
| 3 or 4 Unit Apartments | 0 | 0.0% |
| 5 to 9 Unit Apartments | 4 | 0.6% |
| 10 or more Apartments | 22 | 3.5% |
| Mobile Home / Other | 3 | 0.5% |
| Total | 622 | 100.0% |
Housing Structures by Occupancy in Kingsley
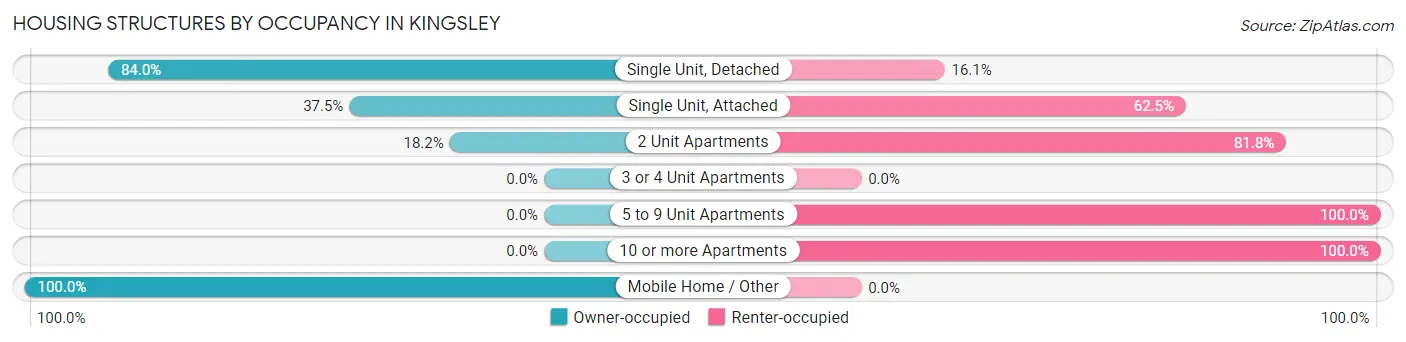
| Structure Type | Owner-occupied | Renter-occupied |
| Single Unit, Detached | 455 (84.0%) | 87 (16.1%) |
| Single Unit, Attached | 15 (37.5%) | 25 (62.5%) |
| 2 Unit Apartments | 2 (18.2%) | 9 (81.8%) |
| 3 or 4 Unit Apartments | 0 (0.0%) | 0 (0.0%) |
| 5 to 9 Unit Apartments | 0 (0.0%) | 4 (100.0%) |
| 10 or more Apartments | 0 (0.0%) | 22 (100.0%) |
| Mobile Home / Other | 3 (100.0%) | 0 (0.0%) |
| Total | 475 (76.4%) | 147 (23.6%) |
Housing Structures by Number of Rooms in Kingsley
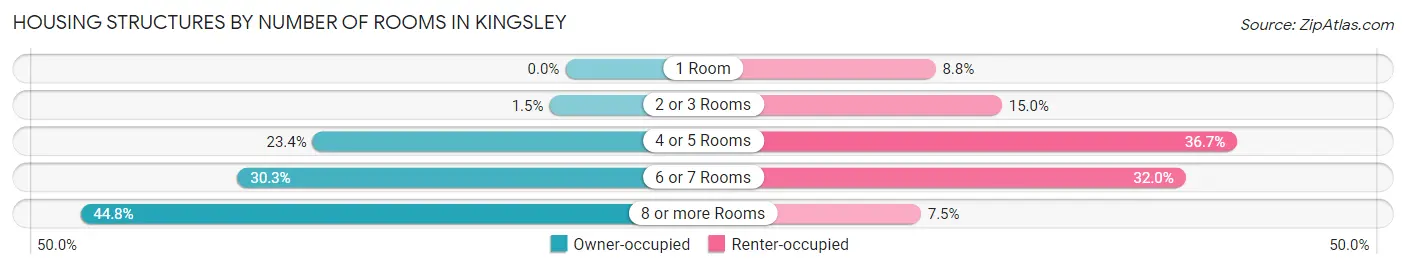
| Number of Rooms | Owner-occupied | Renter-occupied |
| 1 Room | 0 (0.0%) | 13 (8.8%) |
| 2 or 3 Rooms | 7 (1.5%) | 22 (15.0%) |
| 4 or 5 Rooms | 111 (23.4%) | 54 (36.7%) |
| 6 or 7 Rooms | 144 (30.3%) | 47 (32.0%) |
| 8 or more Rooms | 213 (44.8%) | 11 (7.5%) |
| Total | 475 (100.0%) | 147 (100.0%) |
Housing Structure by Heating Type in Kingsley
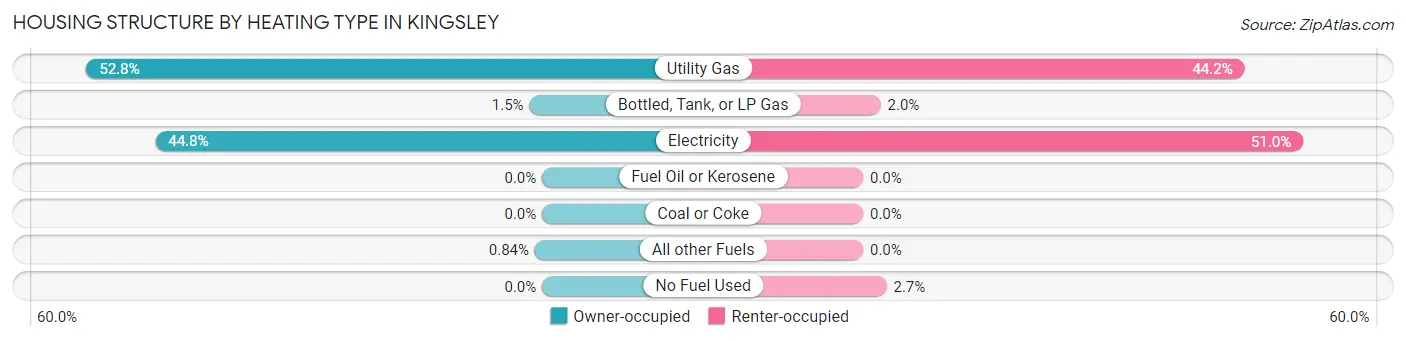
| Heating Type | Owner-occupied | Renter-occupied |
| Utility Gas | 251 (52.8%) | 65 (44.2%) |
| Bottled, Tank, or LP Gas | 7 (1.5%) | 3 (2.0%) |
| Electricity | 213 (44.8%) | 75 (51.0%) |
| Fuel Oil or Kerosene | 0 (0.0%) | 0 (0.0%) |
| Coal or Coke | 0 (0.0%) | 0 (0.0%) |
| All other Fuels | 4 (0.8%) | 0 (0.0%) |
| No Fuel Used | 0 (0.0%) | 4 (2.7%) |
| Total | 475 (100.0%) | 147 (100.0%) |
Household Vehicle Usage in Kingsley
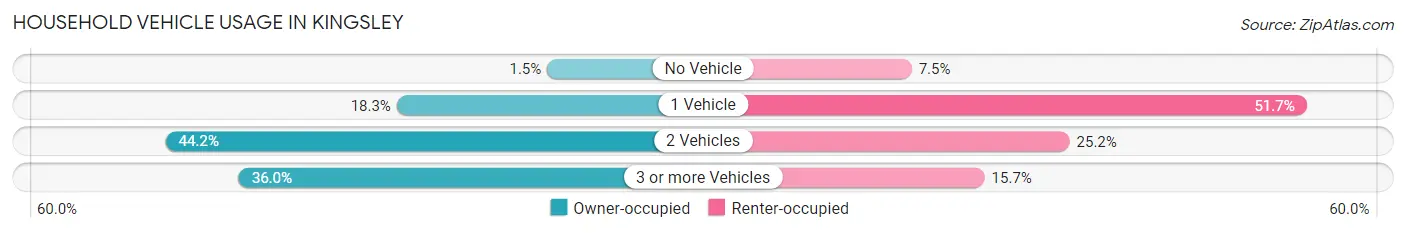
| Vehicles per Household | Owner-occupied | Renter-occupied |
| No Vehicle | 7 (1.5%) | 11 (7.5%) |
| 1 Vehicle | 87 (18.3%) | 76 (51.7%) |
| 2 Vehicles | 210 (44.2%) | 37 (25.2%) |
| 3 or more Vehicles | 171 (36.0%) | 23 (15.7%) |
| Total | 475 (100.0%) | 147 (100.0%) |
Real Estate & Mortgages in Kingsley
Real Estate and Mortgage Overview in Kingsley
| Characteristic | Without Mortgage | With Mortgage |
| Housing Units | 180 | 295 |
| Median Property Value | $142,700 | $142,800 |
| Median Household Income | $52,500 | $65 |
| Monthly Housing Costs | $520 | $12 |
| Real Estate Taxes | $2,071 | $3 |
Property Value by Mortgage Status in Kingsley
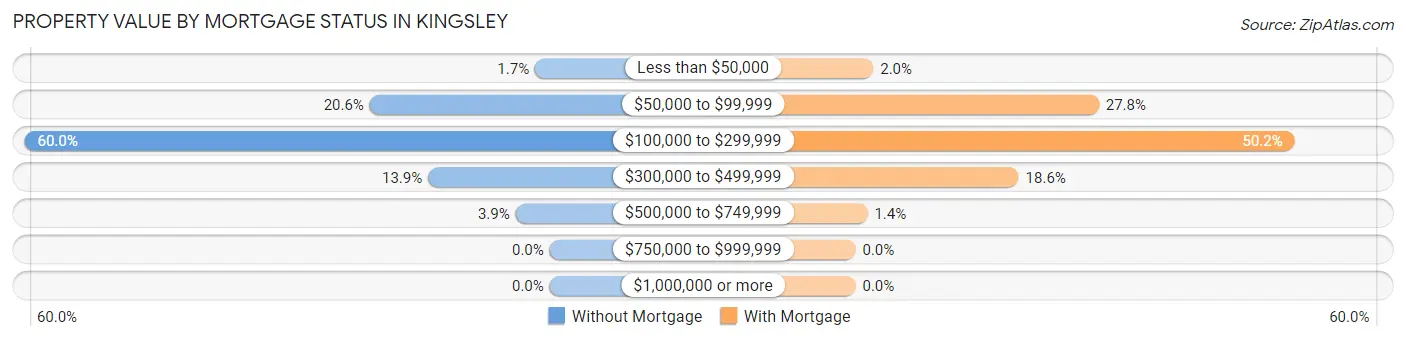
| Property Value | Without Mortgage | With Mortgage |
| Less than $50,000 | 3 (1.7%) | 6 (2.0%) |
| $50,000 to $99,999 | 37 (20.6%) | 82 (27.8%) |
| $100,000 to $299,999 | 108 (60.0%) | 148 (50.2%) |
| $300,000 to $499,999 | 25 (13.9%) | 55 (18.6%) |
| $500,000 to $749,999 | 7 (3.9%) | 4 (1.4%) |
| $750,000 to $999,999 | 0 (0.0%) | 0 (0.0%) |
| $1,000,000 or more | 0 (0.0%) | 0 (0.0%) |
| Total | 180 (100.0%) | 295 (100.0%) |
Household Income by Mortgage Status in Kingsley
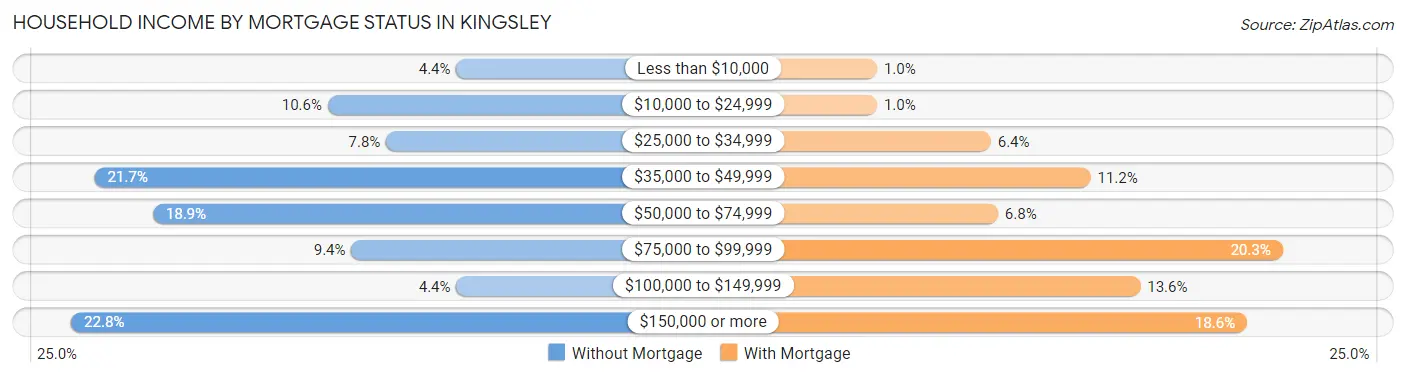
| Household Income | Without Mortgage | With Mortgage |
| Less than $10,000 | 8 (4.4%) | 3 (1.0%) |
| $10,000 to $24,999 | 19 (10.6%) | 3 (1.0%) |
| $25,000 to $34,999 | 14 (7.8%) | 19 (6.4%) |
| $35,000 to $49,999 | 39 (21.7%) | 33 (11.2%) |
| $50,000 to $74,999 | 34 (18.9%) | 20 (6.8%) |
| $75,000 to $99,999 | 17 (9.4%) | 60 (20.3%) |
| $100,000 to $149,999 | 8 (4.4%) | 40 (13.6%) |
| $150,000 or more | 41 (22.8%) | 55 (18.6%) |
| Total | 180 (100.0%) | 295 (100.0%) |
Property Value to Household Income Ratio in Kingsley
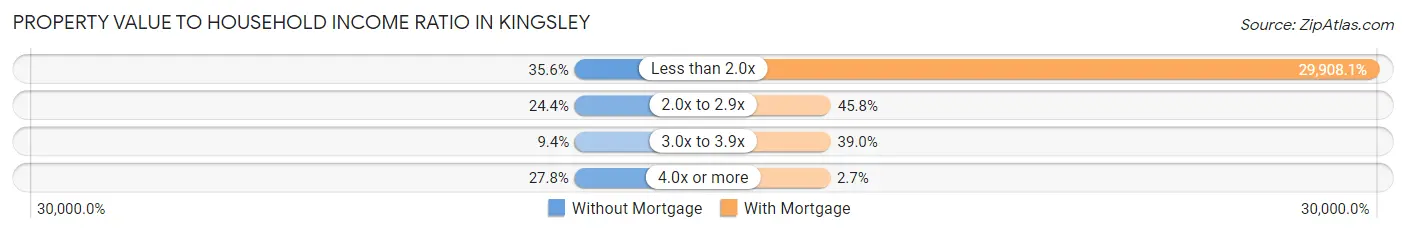
| Value-to-Income Ratio | Without Mortgage | With Mortgage |
| Less than 2.0x | 64 (35.6%) | 88,229 (29,908.1%) |
| 2.0x to 2.9x | 44 (24.4%) | 135 (45.8%) |
| 3.0x to 3.9x | 17 (9.4%) | 115 (39.0%) |
| 4.0x or more | 50 (27.8%) | 8 (2.7%) |
| Total | 180 (100.0%) | 295 (100.0%) |
Real Estate Taxes by Mortgage Status in Kingsley
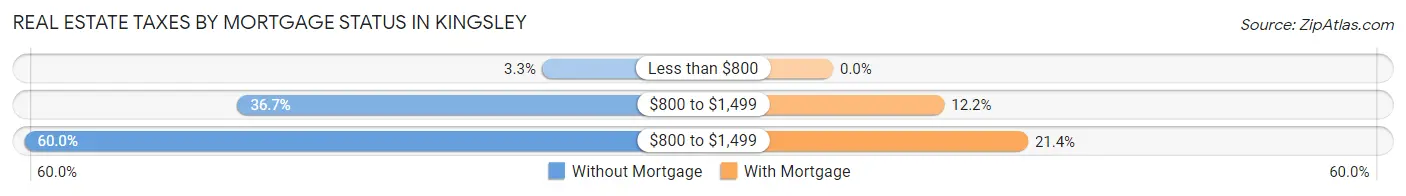
| Property Taxes | Without Mortgage | With Mortgage |
| Less than $800 | 6 (3.3%) | 0 (0.0%) |
| $800 to $1,499 | 66 (36.7%) | 36 (12.2%) |
| $800 to $1,499 | 108 (60.0%) | 63 (21.4%) |
| Total | 180 (100.0%) | 295 (100.0%) |
Health & Disability in Kingsley
Health Insurance Coverage by Age in Kingsley
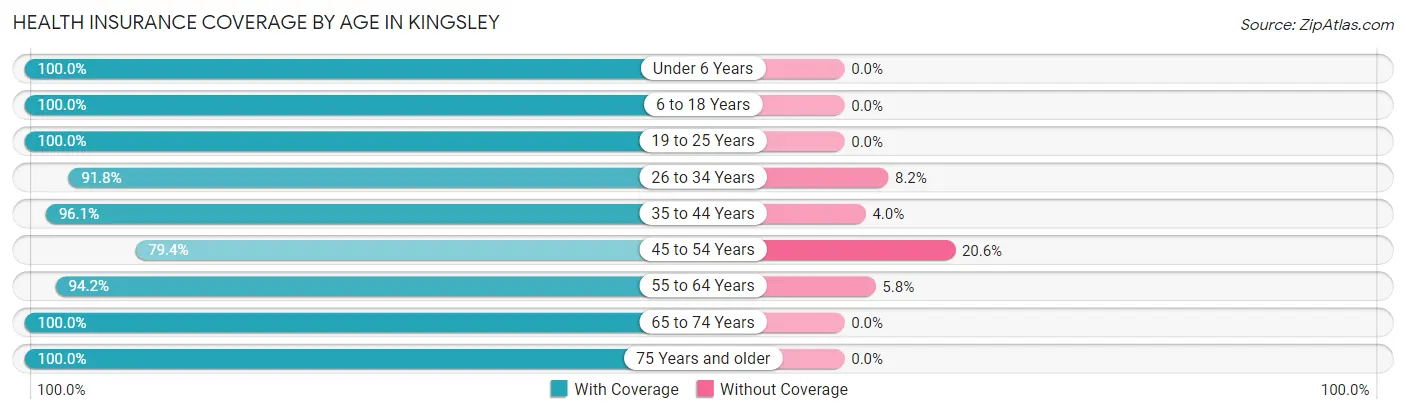
| Age Bracket | With Coverage | Without Coverage |
| Under 6 Years | 63 (100.0%) | 0 (0.0%) |
| 6 to 18 Years | 262 (100.0%) | 0 (0.0%) |
| 19 to 25 Years | 104 (100.0%) | 0 (0.0%) |
| 26 to 34 Years | 90 (91.8%) | 8 (8.2%) |
| 35 to 44 Years | 170 (96.1%) | 7 (4.0%) |
| 45 to 54 Years | 150 (79.4%) | 39 (20.6%) |
| 55 to 64 Years | 130 (94.2%) | 8 (5.8%) |
| 65 to 74 Years | 192 (100.0%) | 0 (0.0%) |
| 75 Years and older | 122 (100.0%) | 0 (0.0%) |
| Total | 1,283 (95.4%) | 62 (4.6%) |
Health Insurance Coverage by Citizenship Status in Kingsley
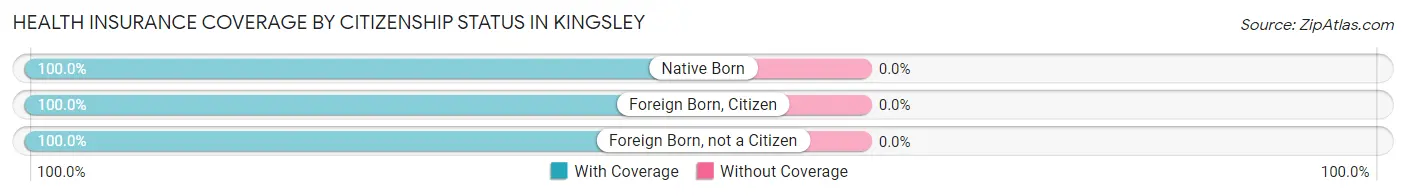
| Citizenship Status | With Coverage | Without Coverage |
| Native Born | 63 (100.0%) | 0 (0.0%) |
| Foreign Born, Citizen | 262 (100.0%) | 0 (0.0%) |
| Foreign Born, not a Citizen | 104 (100.0%) | 0 (0.0%) |
Health Insurance Coverage by Household Income in Kingsley
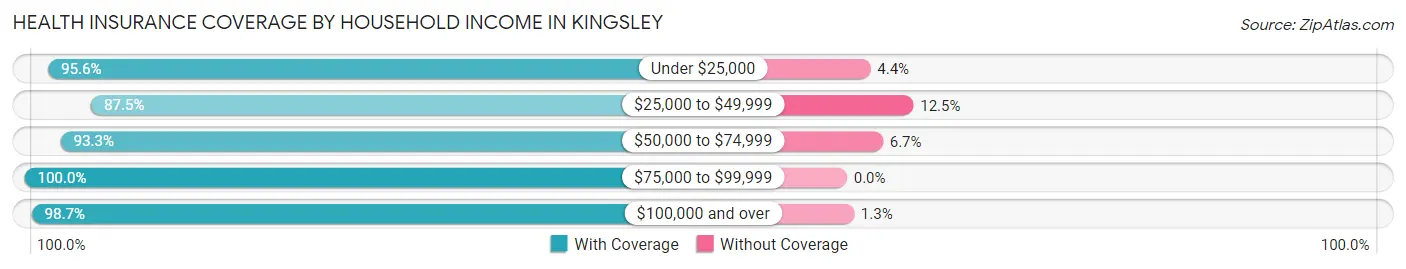
| Household Income | With Coverage | Without Coverage |
| Under $25,000 | 108 (95.6%) | 5 (4.4%) |
| $25,000 to $49,999 | 260 (87.5%) | 37 (12.5%) |
| $50,000 to $74,999 | 180 (93.3%) | 13 (6.7%) |
| $75,000 to $99,999 | 215 (100.0%) | 0 (0.0%) |
| $100,000 and over | 520 (98.7%) | 7 (1.3%) |
Public vs Private Health Insurance Coverage by Age in Kingsley
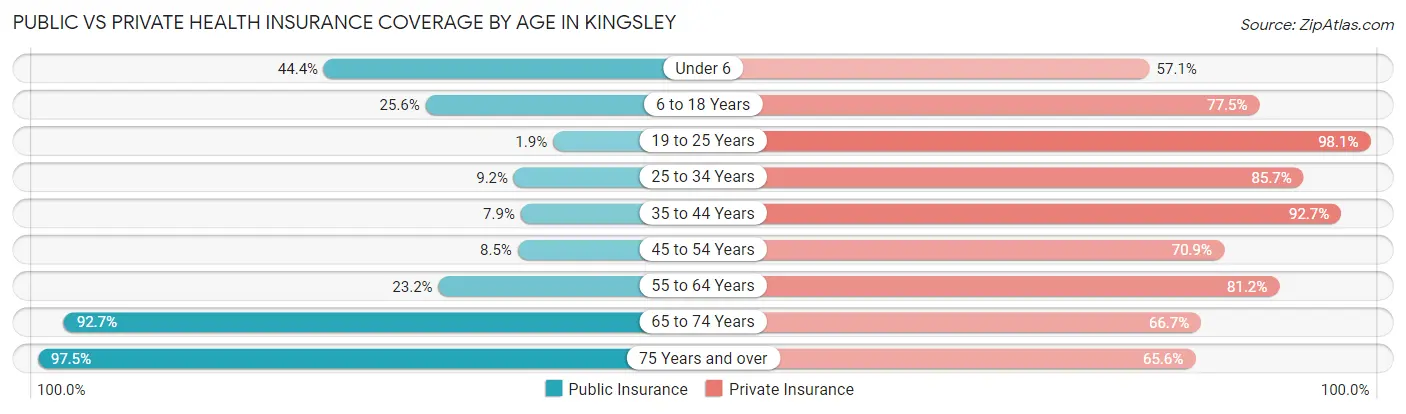
| Age Bracket | Public Insurance | Private Insurance |
| Under 6 | 28 (44.4%) | 36 (57.1%) |
| 6 to 18 Years | 67 (25.6%) | 203 (77.5%) |
| 19 to 25 Years | 2 (1.9%) | 102 (98.1%) |
| 25 to 34 Years | 9 (9.2%) | 84 (85.7%) |
| 35 to 44 Years | 14 (7.9%) | 164 (92.7%) |
| 45 to 54 Years | 16 (8.5%) | 134 (70.9%) |
| 55 to 64 Years | 32 (23.2%) | 112 (81.2%) |
| 65 to 74 Years | 178 (92.7%) | 128 (66.7%) |
| 75 Years and over | 119 (97.5%) | 80 (65.6%) |
| Total | 465 (34.6%) | 1,043 (77.5%) |
Disability Status by Sex by Age in Kingsley
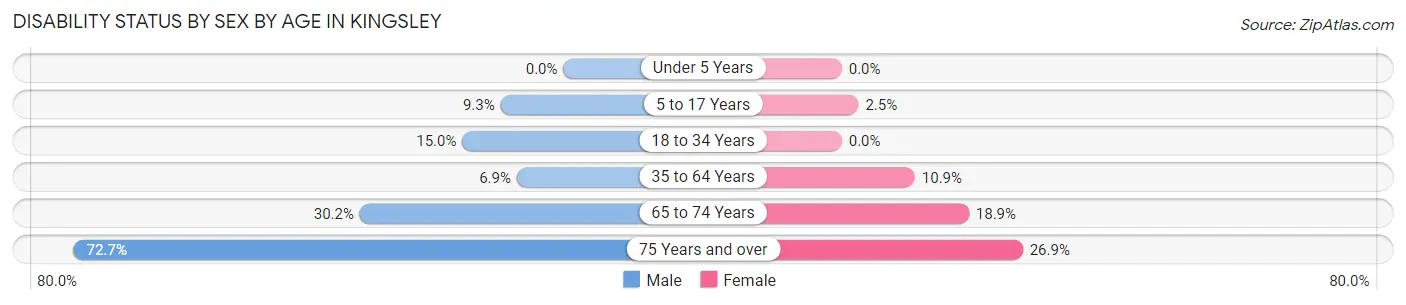
| Age Bracket | Male | Female |
| Under 5 Years | 0 (0.0%) | 0 (0.0%) |
| 5 to 17 Years | 11 (9.3%) | 3 (2.5%) |
| 18 to 34 Years | 21 (15.0%) | 0 (0.0%) |
| 35 to 64 Years | 17 (6.9%) | 28 (10.8%) |
| 65 to 74 Years | 26 (30.2%) | 20 (18.9%) |
| 75 Years and over | 40 (72.7%) | 18 (26.9%) |
Disability Class by Sex by Age in Kingsley
Disability Class: Hearing Difficulty
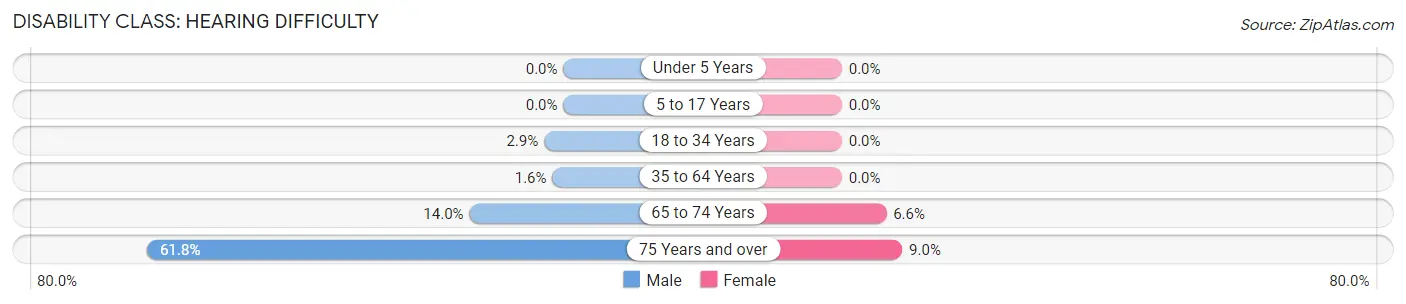
| Age Bracket | Male | Female |
| Under 5 Years | 0 (0.0%) | 0 (0.0%) |
| 5 to 17 Years | 0 (0.0%) | 0 (0.0%) |
| 18 to 34 Years | 4 (2.9%) | 0 (0.0%) |
| 35 to 64 Years | 4 (1.6%) | 0 (0.0%) |
| 65 to 74 Years | 12 (14.0%) | 7 (6.6%) |
| 75 Years and over | 34 (61.8%) | 6 (9.0%) |
Disability Class: Vision Difficulty
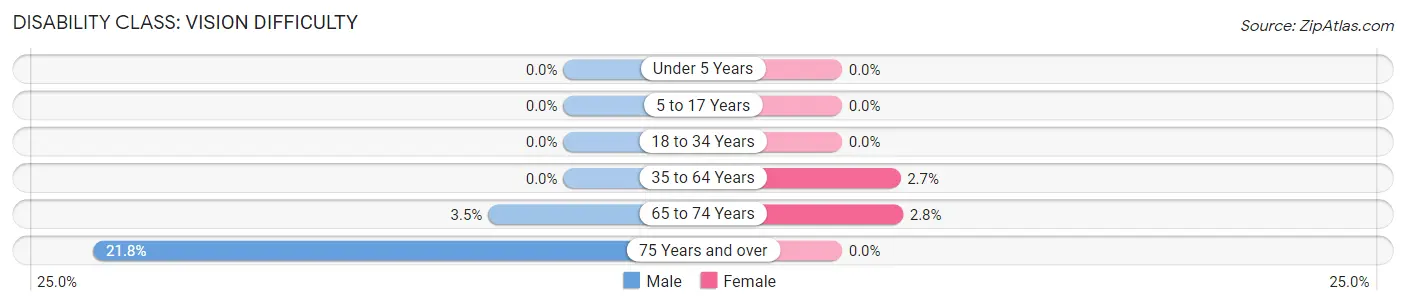
| Age Bracket | Male | Female |
| Under 5 Years | 0 (0.0%) | 0 (0.0%) |
| 5 to 17 Years | 0 (0.0%) | 0 (0.0%) |
| 18 to 34 Years | 0 (0.0%) | 0 (0.0%) |
| 35 to 64 Years | 0 (0.0%) | 7 (2.7%) |
| 65 to 74 Years | 3 (3.5%) | 3 (2.8%) |
| 75 Years and over | 12 (21.8%) | 0 (0.0%) |
Disability Class: Cognitive Difficulty
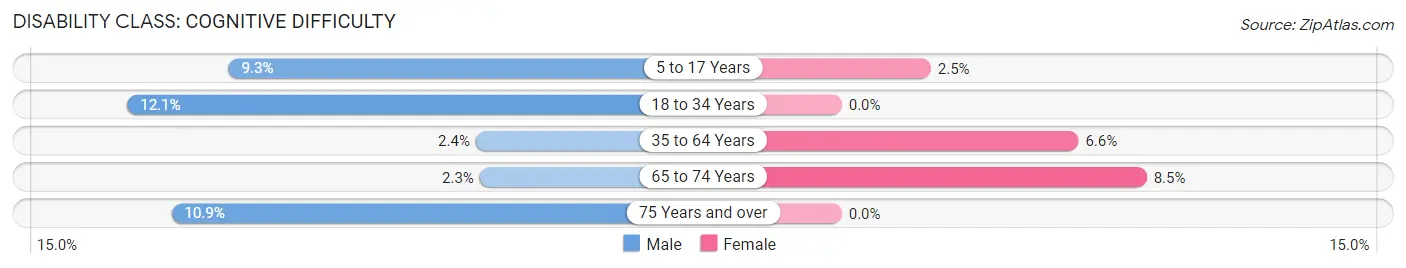
| Age Bracket | Male | Female |
| 5 to 17 Years | 11 (9.3%) | 3 (2.5%) |
| 18 to 34 Years | 17 (12.1%) | 0 (0.0%) |
| 35 to 64 Years | 6 (2.4%) | 17 (6.6%) |
| 65 to 74 Years | 2 (2.3%) | 9 (8.5%) |
| 75 Years and over | 6 (10.9%) | 0 (0.0%) |
Disability Class: Ambulatory Difficulty
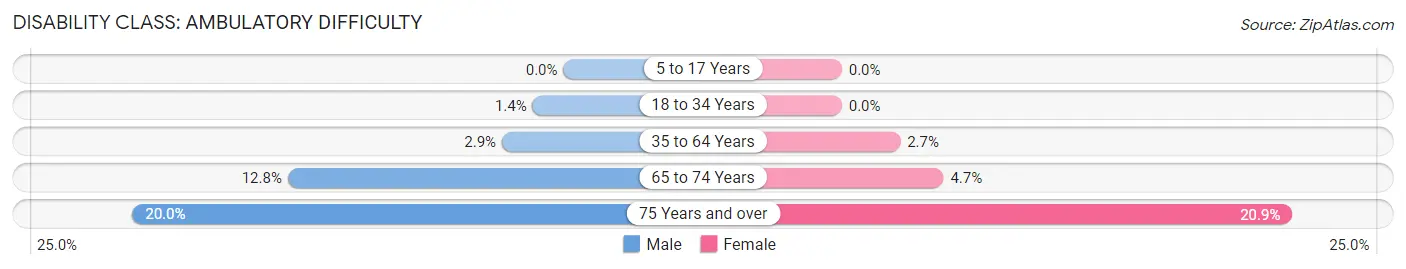
| Age Bracket | Male | Female |
| 5 to 17 Years | 0 (0.0%) | 0 (0.0%) |
| 18 to 34 Years | 2 (1.4%) | 0 (0.0%) |
| 35 to 64 Years | 7 (2.9%) | 7 (2.7%) |
| 65 to 74 Years | 11 (12.8%) | 5 (4.7%) |
| 75 Years and over | 11 (20.0%) | 14 (20.9%) |
Disability Class: Self-Care Difficulty
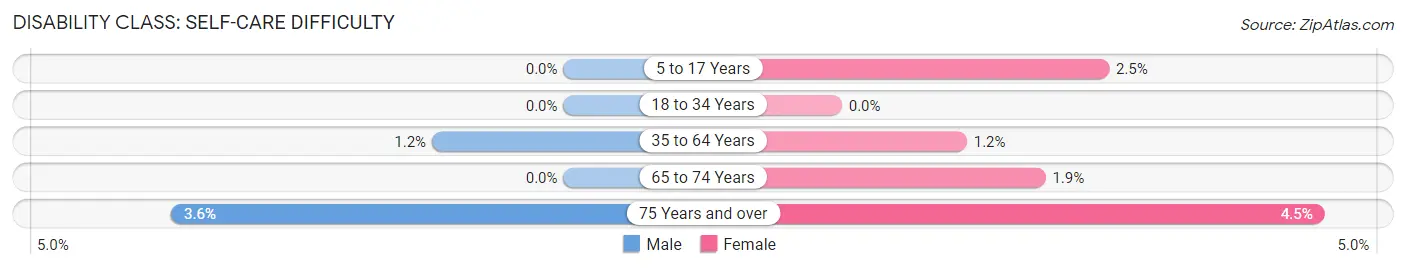
| Age Bracket | Male | Female |
| 5 to 17 Years | 0 (0.0%) | 3 (2.5%) |
| 18 to 34 Years | 0 (0.0%) | 0 (0.0%) |
| 35 to 64 Years | 3 (1.2%) | 3 (1.2%) |
| 65 to 74 Years | 0 (0.0%) | 2 (1.9%) |
| 75 Years and over | 2 (3.6%) | 3 (4.5%) |
Technology Access in Kingsley
Computing Device Access in Kingsley
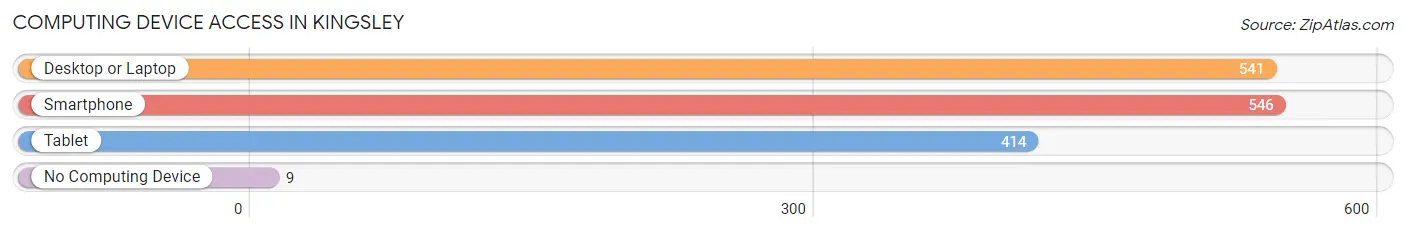
| Device Type | # Households | % Households |
| Desktop or Laptop | 541 | 87.0% |
| Smartphone | 546 | 87.8% |
| Tablet | 414 | 66.6% |
| No Computing Device | 9 | 1.5% |
| Total | 622 | 100.0% |
Internet Access in Kingsley
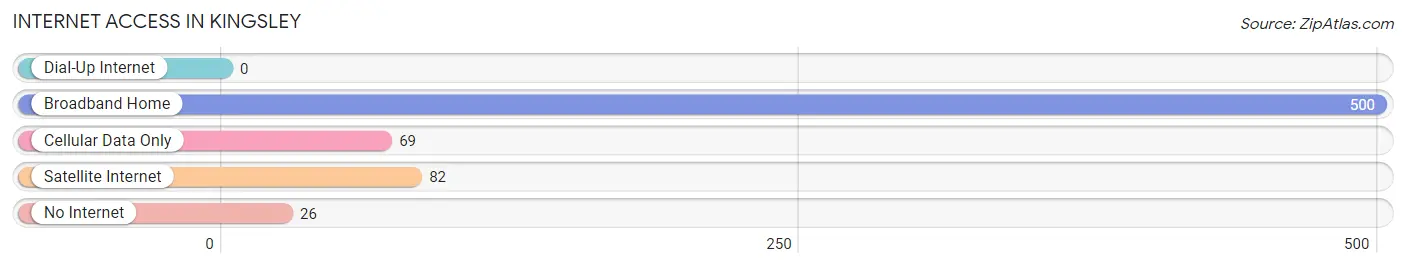
| Internet Type | # Households | % Households |
| Dial-Up Internet | 0 | 0.0% |
| Broadband Home | 500 | 80.4% |
| Cellular Data Only | 69 | 11.1% |
| Satellite Internet | 82 | 13.2% |
| No Internet | 26 | 4.2% |
| Total | 622 | 100.0% |
Kingsley Summary
Kingsley, Iowa is a small city located in the northwest corner of the state, in Plymouth County. It is situated on the banks of the Little Sioux River, and is surrounded by rolling hills and farmland. The city has a population of 1,845 people, according to the 2010 census.
History
Kingsley was founded in 1881 by a group of settlers from Kingsley, Michigan. The city was named after the Michigan town, and was incorporated in 1883. The first settlers were mostly farmers, and the city quickly grew to become a thriving agricultural center. The first post office was established in 1883, and the first school was built in 1884.
The city was a major stop on the Chicago and Northwestern Railroad, and the railroad was a major factor in the city's growth. The railroad brought in new businesses and industries, and the city's population grew rapidly. By the early 1900s, Kingsley had become a bustling small town, with a variety of stores, churches, and other businesses.
Geography
Kingsley is located in the northwest corner of Plymouth County, in the northwest corner of Iowa. It is situated on the banks of the Little Sioux River, and is surrounded by rolling hills and farmland. The city has a total area of 1.2 square miles, all of which is land.
Economy
The economy of Kingsley is largely based on agriculture. The city is home to several large farms, and the surrounding area is known for its production of corn, soybeans, and other crops. The city also has a number of small businesses, including restaurants, retail stores, and service providers.
Demographics
According to the 2010 census, the population of Kingsley was 1,845 people. The racial makeup of the city was 97.3% White, 0.3% African American, 0.2% Native American, 0.3% Asian, 0.1% Pacific Islander, 0.7% from other races, and 1.1% from two or more races. Hispanic or Latino of any race were 1.7% of the population.
The median income for a household in Kingsley was $41,250, and the median income for a family was $50,000. The per capita income for the city was $19,945. About 8.3% of families and 10.2% of the population were below the poverty line, including 13.2% of those under age 18 and 8.2% of those age 65 or over.
Kingsley is a small city with a rich history and a strong agricultural economy. The city is home to a diverse population, and is a great place to live and work. With its beautiful scenery and friendly people, Kingsley is a great place to call home.
Common Questions
What is Per Capita Income in Kingsley?
Per Capita income in Kingsley is $40,332.
What is the Median Family Income in Kingsley?
Median Family Income in Kingsley is $90,417.
What is the Median Household income in Kingsley?
Median Household Income in Kingsley is $64,524.
What is Income or Wage Gap in Kingsley?
Income or Wage Gap in Kingsley is 42.4%.
Women in Kingsley earn 57.6 cents for every dollar earned by a man.
What is Inequality or Gini Index in Kingsley?
Inequality or Gini Index in Kingsley is 0.45.
What is the Total Population of Kingsley?
Total Population of Kingsley is 1,382.
What is the Total Male Population of Kingsley?
Total Male Population of Kingsley is 696.
What is the Total Female Population of Kingsley?
Total Female Population of Kingsley is 686.
What is the Ratio of Males per 100 Females in Kingsley?
There are 101.46 Males per 100 Females in Kingsley.
What is the Ratio of Females per 100 Males in Kingsley?
There are 98.56 Females per 100 Males in Kingsley.
What is the Median Population Age in Kingsley?
Median Population Age in Kingsley is 44.6 Years.
What is the Average Family Size in Kingsley
Average Family Size in Kingsley is 2.8 People.
What is the Average Household Size in Kingsley
Average Household Size in Kingsley is 2.2 People.
How Large is the Labor Force in Kingsley?
There are 724 People in the Labor Forcein in Kingsley.
What is the Percentage of People in the Labor Force in Kingsley?
64.2% of People are in the Labor Force in Kingsley.