Winterset, IA Map & Demographics
Winterset Map
Winterset Overview
$32,191
PER CAPITA INCOME
$82,206
AVG FAMILY INCOME
$71,411
AVG HOUSEHOLD INCOME
28.9%
WAGE / INCOME GAP [ % ]
71.1¢/ $1
WAGE / INCOME GAP [ $ ]
0.37
INEQUALITY / GINI INDEX
5,366
TOTAL POPULATION
2,530
MALE POPULATION
2,836
FEMALE POPULATION
89.21
MALES / 100 FEMALES
112.09
FEMALES / 100 MALES
36.9
MEDIAN AGE
3.2
AVG FAMILY SIZE
2.3
AVG HOUSEHOLD SIZE
2,824
LABOR FORCE [ PEOPLE ]
69.9%
PERCENT IN LABOR FORCE
1.1%
UNEMPLOYMENT RATE
Winterset Zip Codes
Winterset Area Codes
Income in Winterset
Income Overview in Winterset
Per Capita Income in Winterset is $32,191, while median incomes of families and households are $82,206 and $71,411 respectively.
| Characteristic | Number | Measure |
| Per Capita Income | 5,366 | $32,191 |
| Median Family Income | 1,204 | $82,206 |
| Mean Family Income | 1,204 | $93,004 |
| Median Household Income | 2,227 | $71,411 |
| Mean Household Income | 2,227 | $74,801 |
| Income Deficit | 1,204 | $0 |
| Wage / Income Gap (%) | 5,366 | 28.87% |
| Wage / Income Gap ($) | 5,366 | 71.13¢ per $1 |
| Gini / Inequality Index | 5,366 | 0.37 |
Earnings by Sex in Winterset
Average Earnings in Winterset are $45,027, $52,074 for men and $37,039 for women, a difference of 28.9%.
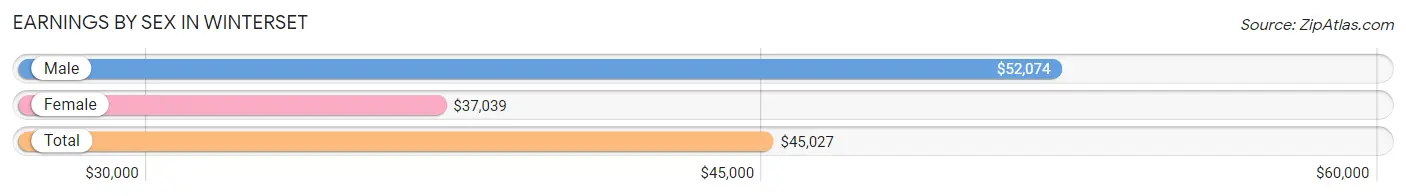
| Sex | Number | Average Earnings |
| Male | 1,579 (53.2%) | $52,074 |
| Female | 1,389 (46.8%) | $37,039 |
| Total | 2,968 (100.0%) | $45,027 |
Earnings by Sex by Income Bracket in Winterset
The most common earnings brackets in Winterset are $55,000 to $64,999 for men (275 | 17.4%) and $40,000 to $44,999 for women (171 | 12.3%).
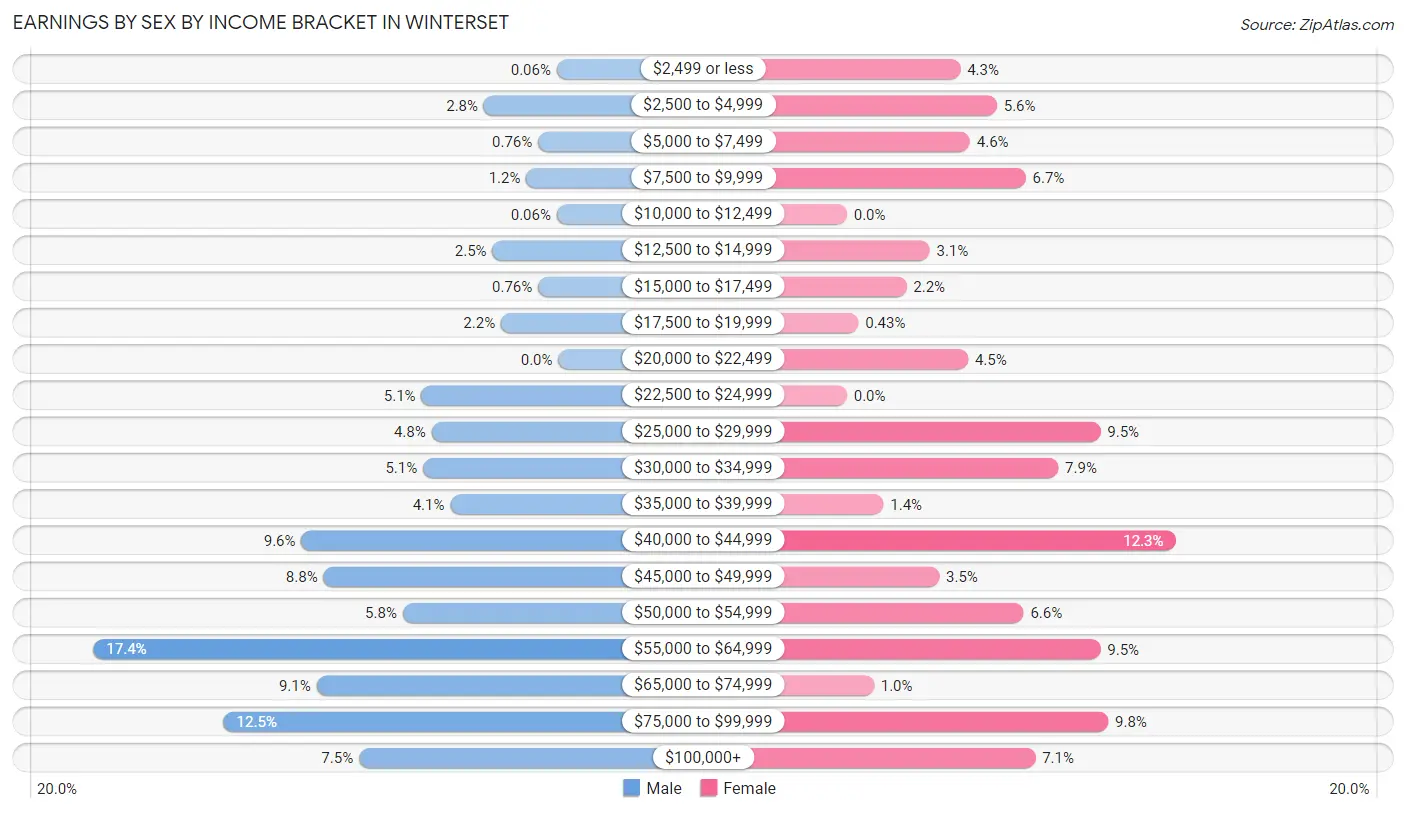
| Income | Male | Female |
| $2,499 or less | 1 (0.1%) | 59 (4.3%) |
| $2,500 to $4,999 | 44 (2.8%) | 78 (5.6%) |
| $5,000 to $7,499 | 12 (0.8%) | 64 (4.6%) |
| $7,500 to $9,999 | 19 (1.2%) | 93 (6.7%) |
| $10,000 to $12,499 | 1 (0.1%) | 0 (0.0%) |
| $12,500 to $14,999 | 39 (2.5%) | 43 (3.1%) |
| $15,000 to $17,499 | 12 (0.8%) | 31 (2.2%) |
| $17,500 to $19,999 | 34 (2.1%) | 6 (0.4%) |
| $20,000 to $22,499 | 0 (0.0%) | 63 (4.5%) |
| $22,500 to $24,999 | 81 (5.1%) | 0 (0.0%) |
| $25,000 to $29,999 | 75 (4.8%) | 132 (9.5%) |
| $30,000 to $34,999 | 80 (5.1%) | 110 (7.9%) |
| $35,000 to $39,999 | 64 (4.1%) | 19 (1.4%) |
| $40,000 to $44,999 | 152 (9.6%) | 171 (12.3%) |
| $45,000 to $49,999 | 139 (8.8%) | 48 (3.5%) |
| $50,000 to $54,999 | 92 (5.8%) | 92 (6.6%) |
| $55,000 to $64,999 | 275 (17.4%) | 132 (9.5%) |
| $65,000 to $74,999 | 143 (9.1%) | 14 (1.0%) |
| $75,000 to $99,999 | 198 (12.5%) | 136 (9.8%) |
| $100,000+ | 118 (7.5%) | 98 (7.1%) |
| Total | 1,579 (100.0%) | 1,389 (100.0%) |
Earnings by Sex by Educational Attainment in Winterset
Average earnings in Winterset are $55,559 for men and $41,126 for women, a difference of 26.0%. Men with an educational attainment of graduate degree enjoy the highest average annual earnings of $95,203, while those with bachelor's degree education earn the least with $52,434. Women with an educational attainment of bachelor's degree earn the most with the average annual earnings of $57,929, while those with high school diploma education have the smallest earnings of $28,304.
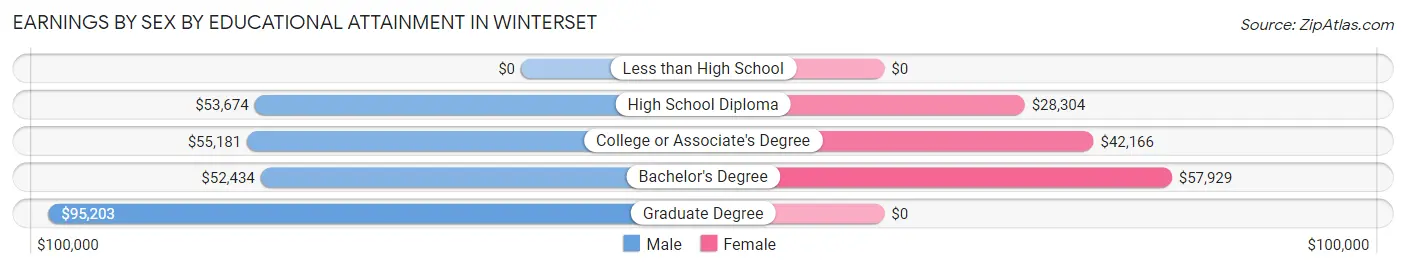
| Educational Attainment | Male Income | Female Income |
| Less than High School | - | - |
| High School Diploma | $53,674 | $28,304 |
| College or Associate's Degree | $55,181 | $42,166 |
| Bachelor's Degree | $52,434 | $57,929 |
| Graduate Degree | $95,203 | $0 |
| Total | $55,559 | $41,126 |
Family Income in Winterset
Family Income Brackets in Winterset
According to the Winterset family income data, there are 317 families falling into the $75,000 to $99,999 income range, which is the most common income bracket and makes up 26.3% of all families.
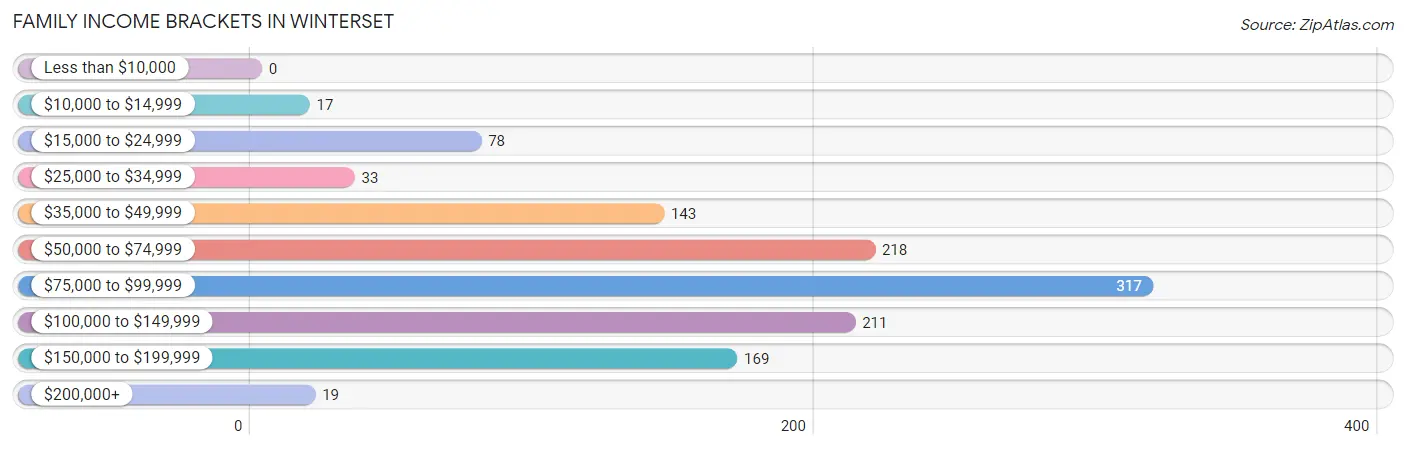
| Income Bracket | # Families | % Families |
| Less than $10,000 | 0 | 0.0% |
| $10,000 to $14,999 | 17 | 1.4% |
| $15,000 to $24,999 | 78 | 6.5% |
| $25,000 to $34,999 | 33 | 2.7% |
| $35,000 to $49,999 | 143 | 11.9% |
| $50,000 to $74,999 | 218 | 18.1% |
| $75,000 to $99,999 | 317 | 26.3% |
| $100,000 to $149,999 | 211 | 17.5% |
| $150,000 to $199,999 | 169 | 14.0% |
| $200,000+ | 19 | 1.6% |
Family Income by Famaliy Size in Winterset
4-person families (420 | 34.9%) account for the highest median family income in Winterset with $91,484 per family, while 2-person families (458 | 38.0%) have the highest median income of $43,840 per family member.
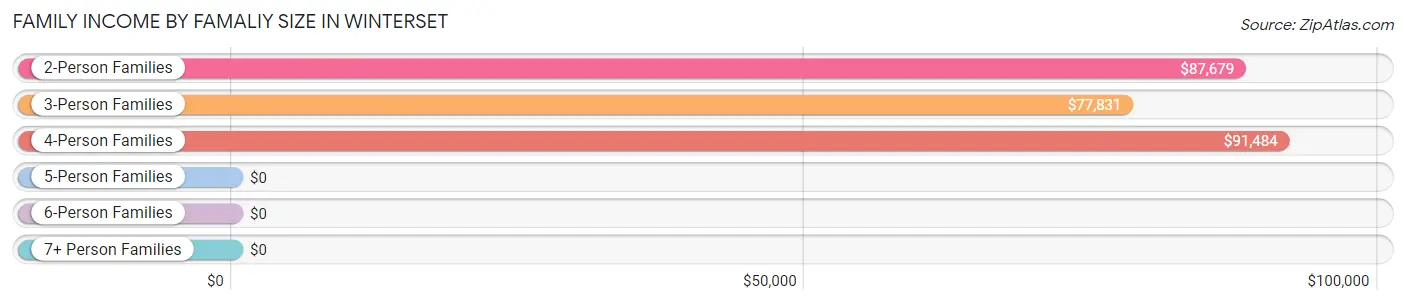
| Income Bracket | # Families | Median Income |
| 2-Person Families | 458 (38.0%) | $87,679 |
| 3-Person Families | 283 (23.5%) | $77,831 |
| 4-Person Families | 420 (34.9%) | $91,484 |
| 5-Person Families | 18 (1.5%) | $0 |
| 6-Person Families | 25 (2.1%) | $0 |
| 7+ Person Families | 0 (0.0%) | $0 |
| Total | 1,204 (100.0%) | $82,206 |
Family Income by Number of Earners in Winterset
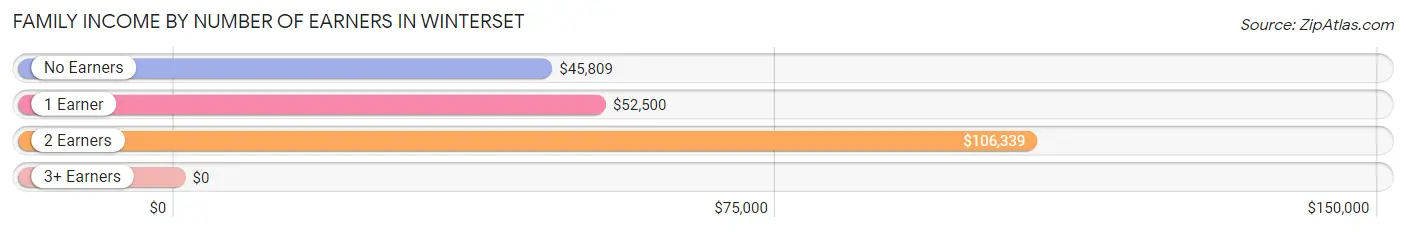
| Number of Earners | # Families | Median Income |
| No Earners | 81 (6.7%) | $45,809 |
| 1 Earner | 400 (33.2%) | $52,500 |
| 2 Earners | 577 (47.9%) | $106,339 |
| 3+ Earners | 146 (12.1%) | $0 |
| Total | 1,204 (100.0%) | $82,206 |
Household Income in Winterset
Household Income Brackets in Winterset
With 499 households falling in the category, the $75,000 to $99,999 income range is the most frequent in Winterset, accounting for 22.4% of all households. In contrast, only 29 households (1.3%) fall into the $200,000+ income bracket, making it the least populous group.
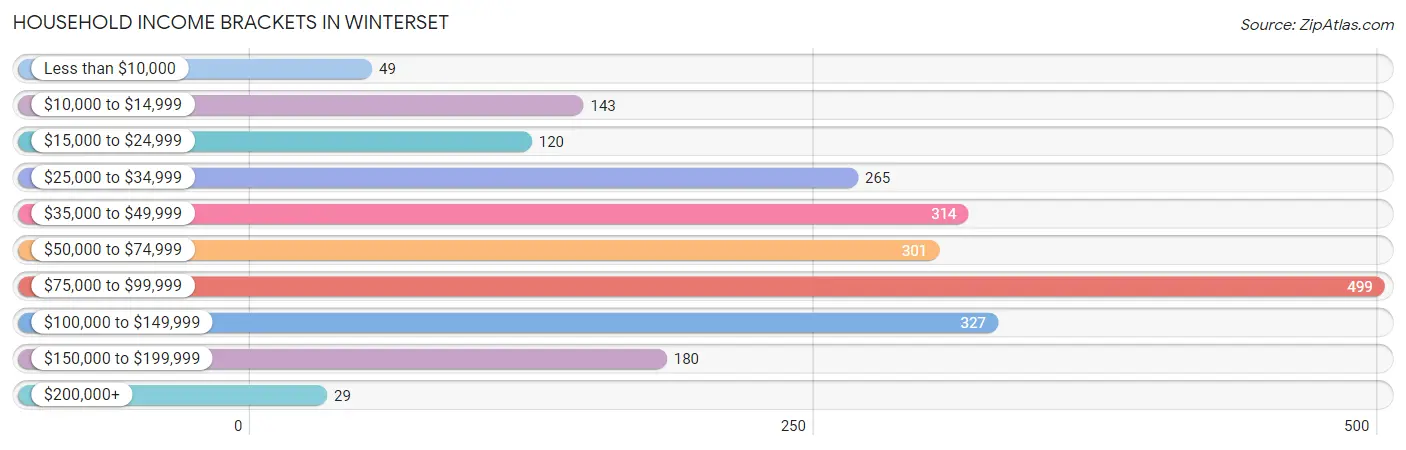
| Income Bracket | # Households | % Households |
| Less than $10,000 | 49 | 2.2% |
| $10,000 to $14,999 | 143 | 6.4% |
| $15,000 to $24,999 | 120 | 5.4% |
| $25,000 to $34,999 | 265 | 11.9% |
| $35,000 to $49,999 | 314 | 14.1% |
| $50,000 to $74,999 | 301 | 13.5% |
| $75,000 to $99,999 | 499 | 22.4% |
| $100,000 to $149,999 | 327 | 14.7% |
| $150,000 to $199,999 | 180 | 8.1% |
| $200,000+ | 29 | 1.3% |
Household Income by Householder Age in Winterset
The median household income in Winterset is $71,411, with the highest median household income of $91,935 found in the 45 to 64 years age bracket for the primary householder. A total of 632 households (28.4%) fall into this category. Meanwhile, the 65+ years age bracket for the primary householder has the lowest median household income of $36,563, with 713 households (32.0%) in this group.
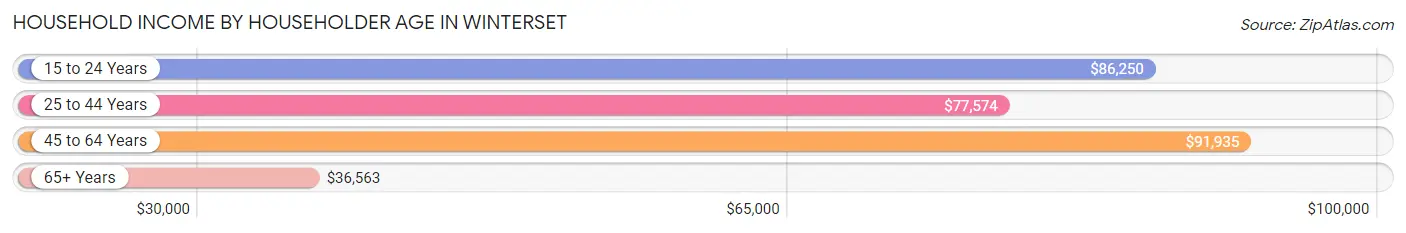
| Income Bracket | # Households | Median Income |
| 15 to 24 Years | 76 (3.4%) | $86,250 |
| 25 to 44 Years | 806 (36.2%) | $77,574 |
| 45 to 64 Years | 632 (28.4%) | $91,935 |
| 65+ Years | 713 (32.0%) | $36,563 |
| Total | 2,227 (100.0%) | $71,411 |
Poverty in Winterset
Income Below Poverty by Sex and Age in Winterset
With 5.4% poverty level for males and 14.0% for females among the residents of Winterset, 6 to 11 year old males and 15 year old females are the most vulnerable to poverty, with 57 males (18.6%) and 21 females (100.0%) in their respective age groups living below the poverty level.
| Age Bracket | Male | Female |
| Under 5 Years | 0 (0.0%) | 39 (24.1%) |
| 5 Years | 0 (0.0%) | 0 (0.0%) |
| 6 to 11 Years | 57 (18.6%) | 1 (0.4%) |
| 12 to 14 Years | 0 (0.0%) | 17 (16.0%) |
| 15 Years | 0 (0.0%) | 21 (100.0%) |
| 16 and 17 Years | 0 (0.0%) | 21 (17.8%) |
| 18 to 24 Years | 17 (7.7%) | 0 (0.0%) |
| 25 to 34 Years | 0 (0.0%) | 107 (30.8%) |
| 35 to 44 Years | 26 (6.6%) | 17 (4.5%) |
| 45 to 54 Years | 0 (0.0%) | 3 (0.9%) |
| 55 to 64 Years | 19 (10.7%) | 53 (17.9%) |
| 65 to 74 Years | 16 (7.0%) | 0 (0.0%) |
| 75 Years and over | 0 (0.0%) | 101 (30.1%) |
| Total | 135 (5.4%) | 380 (14.0%) |
Income Above Poverty by Sex and Age in Winterset
According to the poverty statistics in Winterset, males aged under 5 years and females aged 5 years are the age groups that are most secure financially, with 100.0% of males and 100.0% of females in these age groups living above the poverty line.
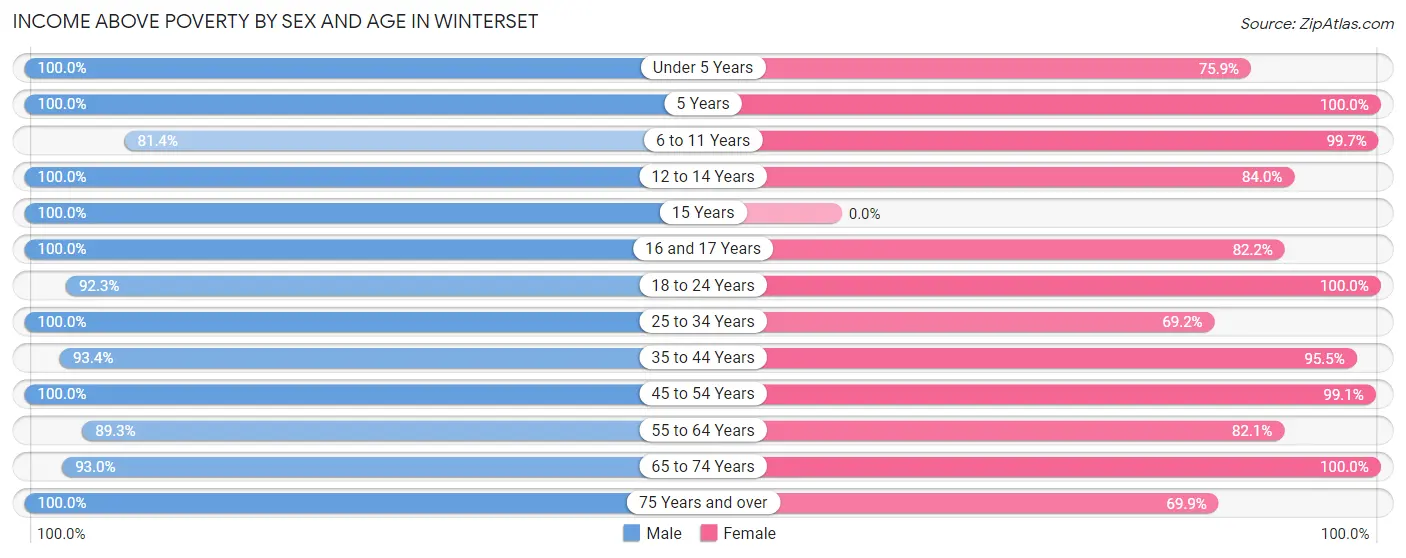
| Age Bracket | Male | Female |
| Under 5 Years | 134 (100.0%) | 123 (75.9%) |
| 5 Years | 63 (100.0%) | 57 (100.0%) |
| 6 to 11 Years | 250 (81.4%) | 285 (99.7%) |
| 12 to 14 Years | 117 (100.0%) | 89 (84.0%) |
| 15 Years | 73 (100.0%) | 0 (0.0%) |
| 16 and 17 Years | 43 (100.0%) | 97 (82.2%) |
| 18 to 24 Years | 204 (92.3%) | 108 (100.0%) |
| 25 to 34 Years | 292 (100.0%) | 240 (69.2%) |
| 35 to 44 Years | 370 (93.4%) | 364 (95.5%) |
| 45 to 54 Years | 334 (100.0%) | 319 (99.1%) |
| 55 to 64 Years | 158 (89.3%) | 243 (82.1%) |
| 65 to 74 Years | 213 (93.0%) | 175 (100.0%) |
| 75 Years and over | 105 (100.0%) | 235 (69.9%) |
| Total | 2,356 (94.6%) | 2,335 (86.0%) |
Income Below Poverty Among Married-Couple Families in Winterset
The poverty statistics for married-couple families in Winterset show that 1.8% or 16 of the total 890 families live below the poverty line. Families with no children have the highest poverty rate of 3.4%, comprising of 15 families. On the other hand, families with 1 or 2 children have the lowest poverty rate of 0.0%, which includes 0 families.
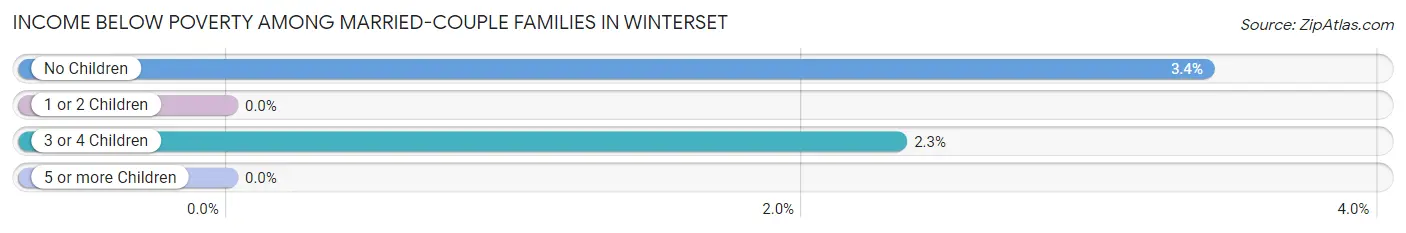
| Children | Above Poverty | Below Poverty |
| No Children | 426 (96.6%) | 15 (3.4%) |
| 1 or 2 Children | 406 (100.0%) | 0 (0.0%) |
| 3 or 4 Children | 42 (97.7%) | 1 (2.3%) |
| 5 or more Children | 0 (0.0%) | 0 (0.0%) |
| Total | 874 (98.2%) | 16 (1.8%) |
Income Below Poverty Among Single-Parent Households in Winterset
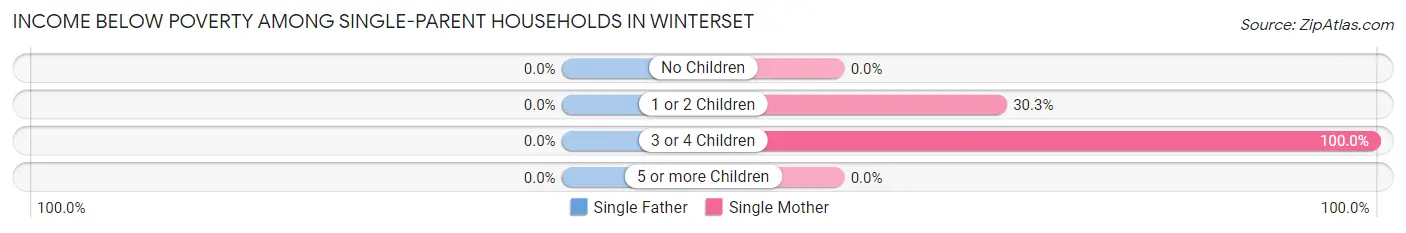
| Children | Single Father | Single Mother |
| No Children | 0 (0.0%) | 0 (0.0%) |
| 1 or 2 Children | 0 (0.0%) | 43 (30.3%) |
| 3 or 4 Children | 0 (0.0%) | 17 (100.0%) |
| 5 or more Children | 0 (0.0%) | 0 (0.0%) |
| Total | 0 (0.0%) | 60 (27.9%) |
Income Below Poverty Among Married-Couple vs Single-Parent Households in Winterset
The poverty data for Winterset shows that 16 of the married-couple family households (1.8%) and 60 of the single-parent households (19.1%) are living below the poverty level. Within the married-couple family households, those with no children have the highest poverty rate, with 15 households (3.4%) falling below the poverty line. Among the single-parent households, those with 3 or 4 children have the highest poverty rate, with 17 household (27.9%) living below poverty.
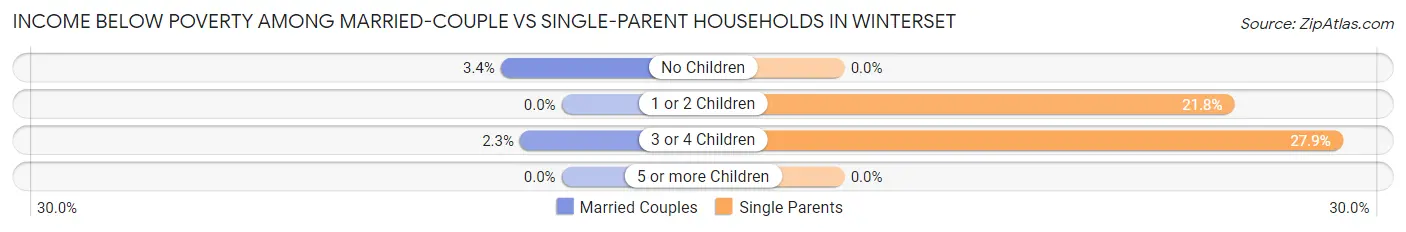
| Children | Married-Couple Families | Single-Parent Households |
| No Children | 15 (3.4%) | 0 (0.0%) |
| 1 or 2 Children | 0 (0.0%) | 43 (21.8%) |
| 3 or 4 Children | 1 (2.3%) | 17 (27.9%) |
| 5 or more Children | 0 (0.0%) | 0 (0.0%) |
| Total | 16 (1.8%) | 60 (19.1%) |
Race in Winterset
The most populous races in Winterset are White / Caucasian (5,138 | 95.8%), Black / African American (163 | 3.0%), and Hispanic or Latino (88 | 1.6%).
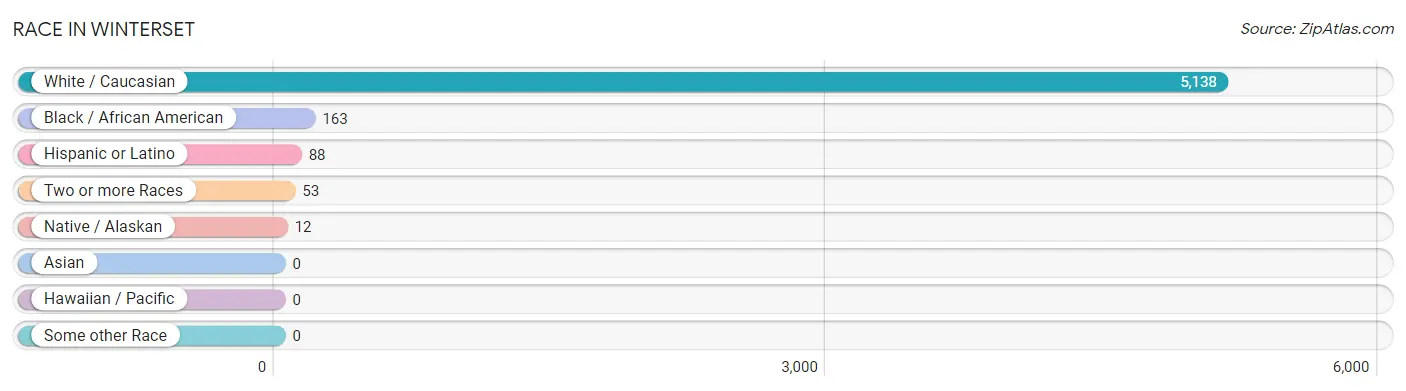
| Race | # Population | % Population |
| Asian | 0 | 0.0% |
| Black / African American | 163 | 3.0% |
| Hawaiian / Pacific | 0 | 0.0% |
| Hispanic or Latino | 88 | 1.6% |
| Native / Alaskan | 12 | 0.2% |
| White / Caucasian | 5,138 | 95.8% |
| Two or more Races | 53 | 1.0% |
| Some other Race | 0 | 0.0% |
| Total | 5,366 | 100.0% |
Ancestry in Winterset
The most populous ancestries reported in Winterset are German (1,609 | 30.0%), Irish (880 | 16.4%), English (290 | 5.4%), American (241 | 4.5%), and Dutch (174 | 3.2%), together accounting for 59.5% of all Winterset residents.
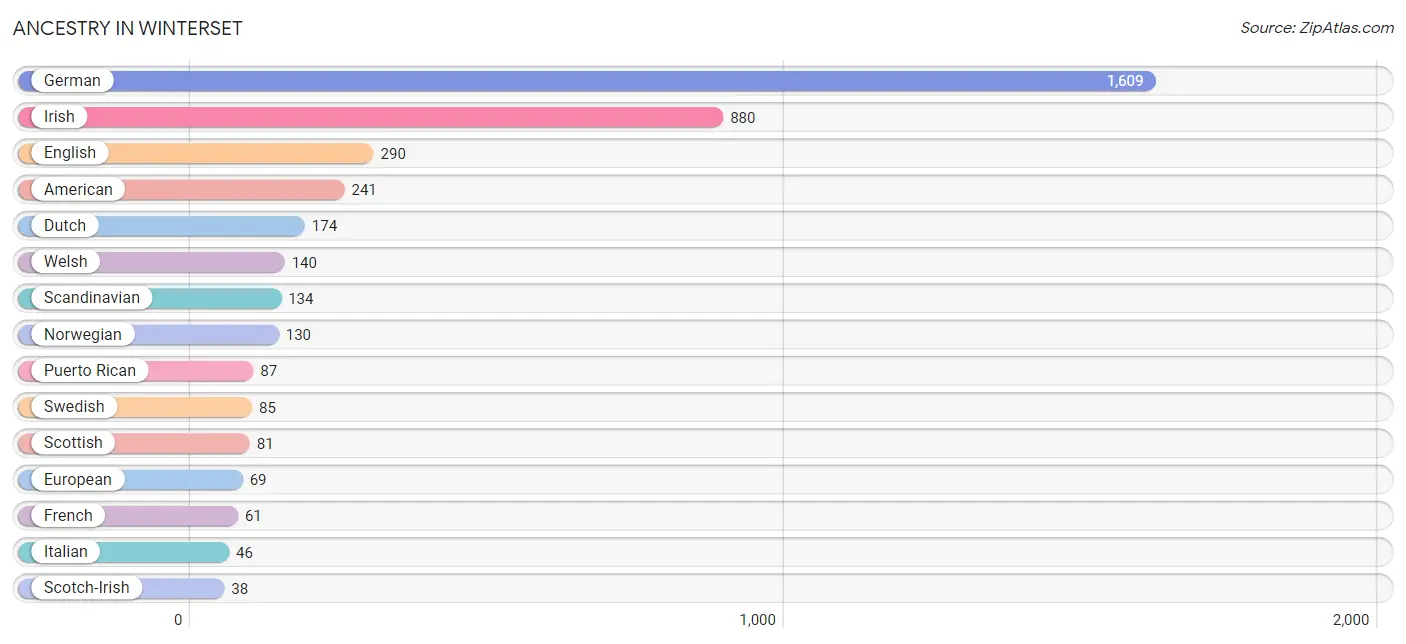
| Ancestry | # Population | % Population |
| American | 241 | 4.5% |
| Belgian | 28 | 0.5% |
| British | 17 | 0.3% |
| Czech | 37 | 0.7% |
| Danish | 15 | 0.3% |
| Dutch | 174 | 3.2% |
| English | 290 | 5.4% |
| European | 69 | 1.3% |
| French | 61 | 1.1% |
| German | 1,609 | 30.0% |
| Irish | 880 | 16.4% |
| Iroquois | 12 | 0.2% |
| Italian | 46 | 0.9% |
| Mexican | 1 | 0.0% |
| Norwegian | 130 | 2.4% |
| Pennsylvania German | 11 | 0.2% |
| Puerto Rican | 87 | 1.6% |
| Scandinavian | 134 | 2.5% |
| Scotch-Irish | 38 | 0.7% |
| Scottish | 81 | 1.5% |
| Swedish | 85 | 1.6% |
| Swiss | 21 | 0.4% |
| Welsh | 140 | 2.6% | View All 23 Rows |
Immigrants in Winterset

| Immigration Origin | # Population | % Population | View All 0 Rows |
Sex and Age in Winterset
Sex and Age in Winterset
The most populous age groups in Winterset are 5 to 9 Years (278 | 11.0%) for men and 5 to 9 Years (324 | 11.4%) for women.
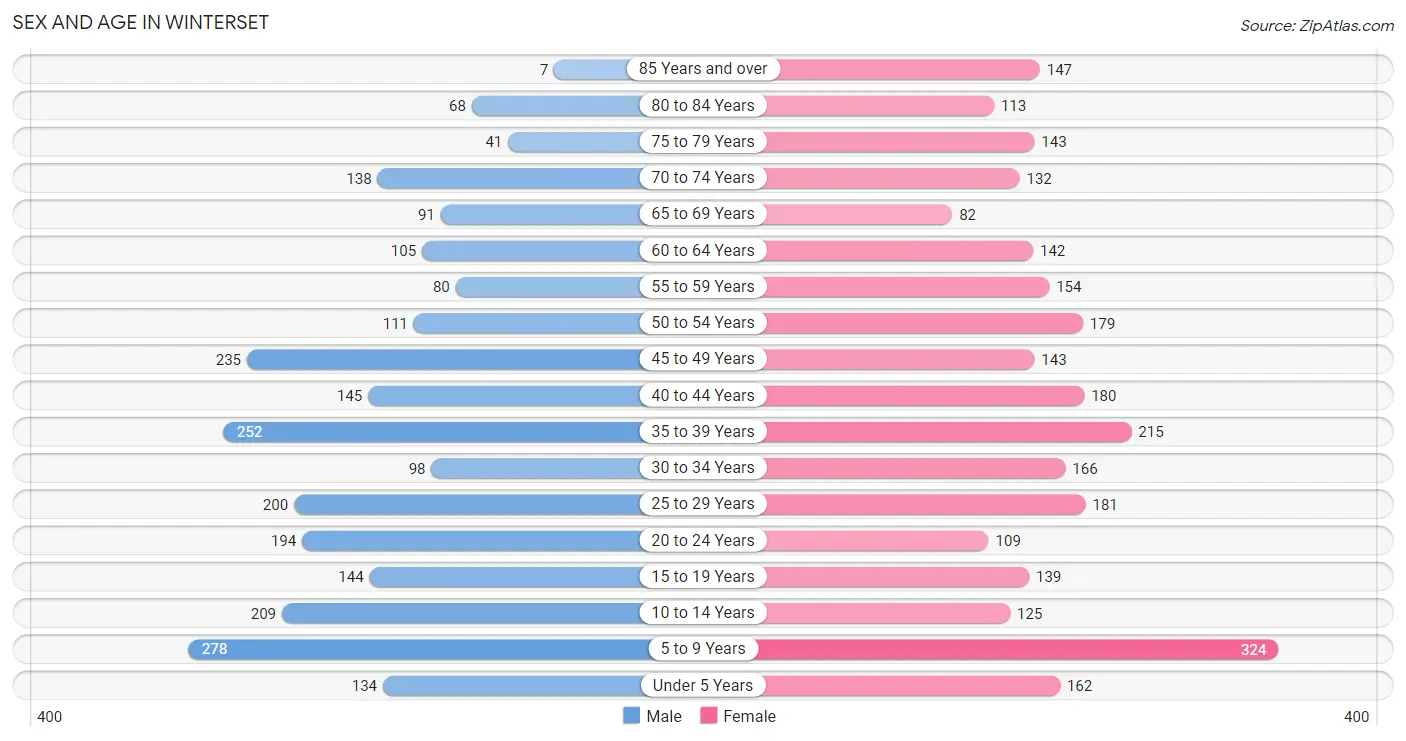
| Age Bracket | Male | Female |
| Under 5 Years | 134 (5.3%) | 162 (5.7%) |
| 5 to 9 Years | 278 (11.0%) | 324 (11.4%) |
| 10 to 14 Years | 209 (8.3%) | 125 (4.4%) |
| 15 to 19 Years | 144 (5.7%) | 139 (4.9%) |
| 20 to 24 Years | 194 (7.7%) | 109 (3.8%) |
| 25 to 29 Years | 200 (7.9%) | 181 (6.4%) |
| 30 to 34 Years | 98 (3.9%) | 166 (5.9%) |
| 35 to 39 Years | 252 (10.0%) | 215 (7.6%) |
| 40 to 44 Years | 145 (5.7%) | 180 (6.4%) |
| 45 to 49 Years | 235 (9.3%) | 143 (5.0%) |
| 50 to 54 Years | 111 (4.4%) | 179 (6.3%) |
| 55 to 59 Years | 80 (3.2%) | 154 (5.4%) |
| 60 to 64 Years | 105 (4.2%) | 142 (5.0%) |
| 65 to 69 Years | 91 (3.6%) | 82 (2.9%) |
| 70 to 74 Years | 138 (5.4%) | 132 (4.6%) |
| 75 to 79 Years | 41 (1.6%) | 143 (5.0%) |
| 80 to 84 Years | 68 (2.7%) | 113 (4.0%) |
| 85 Years and over | 7 (0.3%) | 147 (5.2%) |
| Total | 2,530 (100.0%) | 2,836 (100.0%) |
Families and Households in Winterset
Median Family Size in Winterset
The median family size in Winterset is 3.17 persons per family, with single male/father families (99 | 8.2%) accounting for the largest median family size of 3.84 persons per family. On the other hand, married-couple families (890 | 73.9%) represent the smallest median family size with 3.05 persons per family.
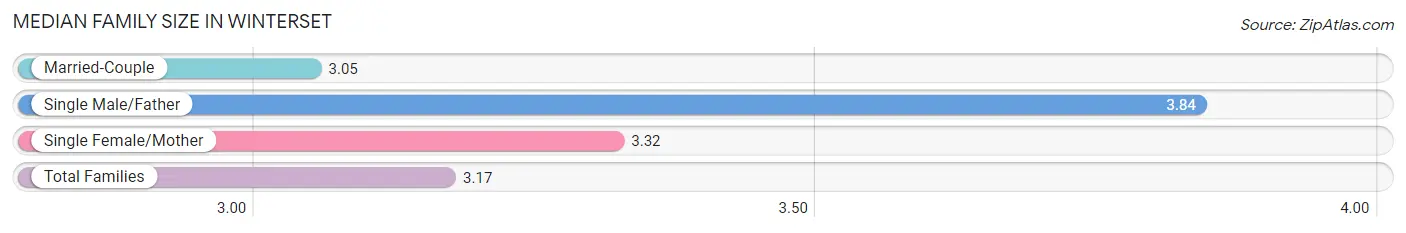
| Family Type | # Families | Family Size |
| Married-Couple | 890 (73.9%) | 3.05 |
| Single Male/Father | 99 (8.2%) | 3.84 |
| Single Female/Mother | 215 (17.9%) | 3.32 |
| Total Families | 1,204 (100.0%) | 3.17 |
Median Household Size in Winterset
The median household size in Winterset is 2.33 persons per household, with single male/father households (99 | 4.4%) accounting for the largest median household size of 4.45 persons per household. non-family households (1,023 | 45.9%) represent the smallest median household size with 1.14 persons per household.
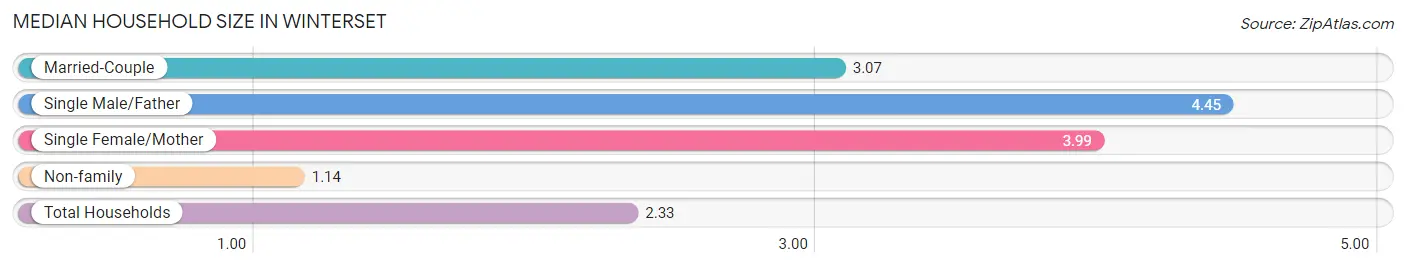
| Household Type | # Households | Household Size |
| Married-Couple | 890 (40.0%) | 3.07 |
| Single Male/Father | 99 (4.4%) | 4.45 |
| Single Female/Mother | 215 (9.7%) | 3.99 |
| Non-family | 1,023 (45.9%) | 1.14 |
| Total Households | 2,227 (100.0%) | 2.33 |
Household Size by Marriage Status in Winterset
Out of a total of 2,227 households in Winterset, 1,204 (54.1%) are family households, while 1,023 (45.9%) are nonfamily households. The most numerous type of family households are 4-person households, comprising 452, and the most common type of nonfamily households are 1-person households, comprising 892.
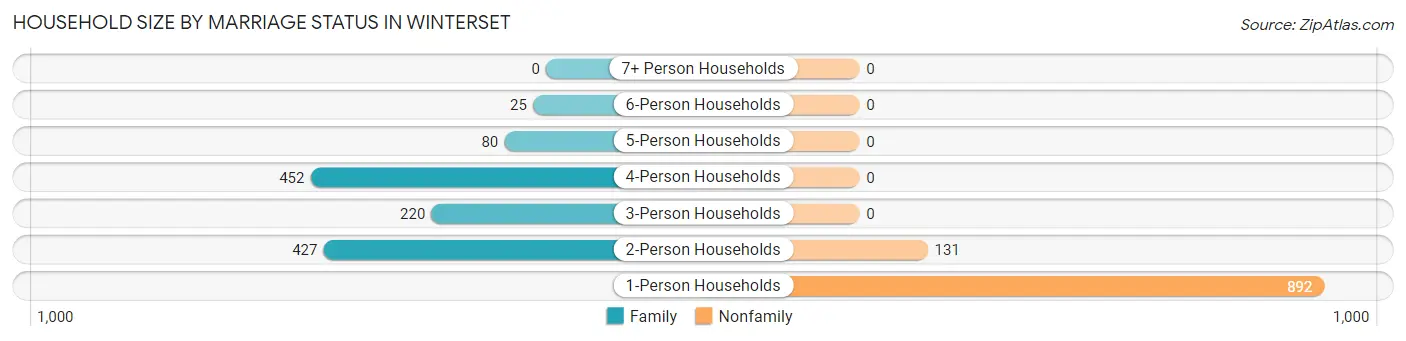
| Household Size | Family Households | Nonfamily Households |
| 1-Person Households | - | 892 (40.1%) |
| 2-Person Households | 427 (19.2%) | 131 (5.9%) |
| 3-Person Households | 220 (9.9%) | 0 (0.0%) |
| 4-Person Households | 452 (20.3%) | 0 (0.0%) |
| 5-Person Households | 80 (3.6%) | 0 (0.0%) |
| 6-Person Households | 25 (1.1%) | 0 (0.0%) |
| 7+ Person Households | 0 (0.0%) | 0 (0.0%) |
| Total | 1,204 (54.1%) | 1,023 (45.9%) |
Female Fertility in Winterset
Fertility by Age in Winterset
Average fertility rate in Winterset is 88.0 births per 1,000 women. Women in the age bracket of 20 to 34 years have the highest fertility rate with 224.0 births per 1,000 women. Women in the age bracket of 20 to 34 years acount for 100.0% of all women with births.
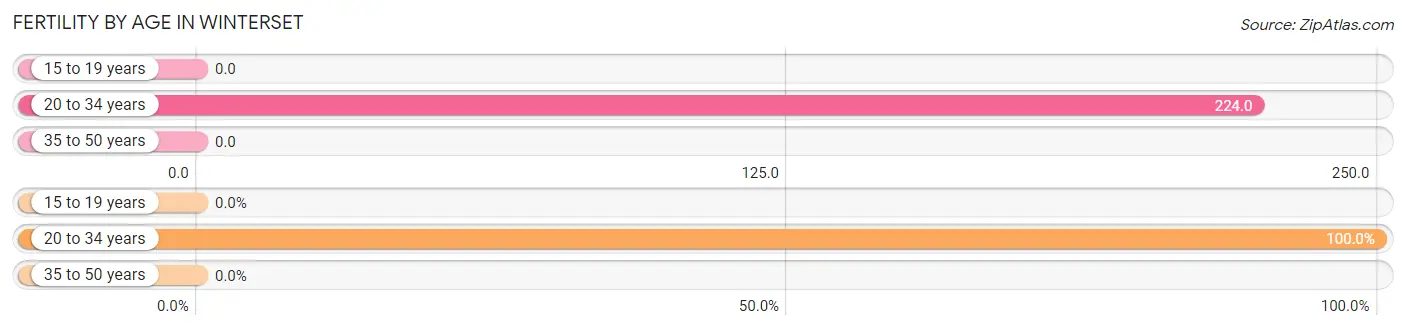
| Age Bracket | Women with Births | Births / 1,000 Women |
| 15 to 19 years | 0 (0.0%) | 0.0 |
| 20 to 34 years | 102 (100.0%) | 224.0 |
| 35 to 50 years | 0 (0.0%) | 0.0 |
| Total | 102 (100.0%) | 88.0 |
Fertility by Age by Marriage Status in Winterset
63.7% of women with births (102) in Winterset are married. The highest percentage of unmarried women with births falls into 20 to 34 years age bracket with 36.3% of them unmarried at the time of birth, while the lowest percentage of unmarried women with births belong to 20 to 34 years age bracket with 36.3% of them unmarried.
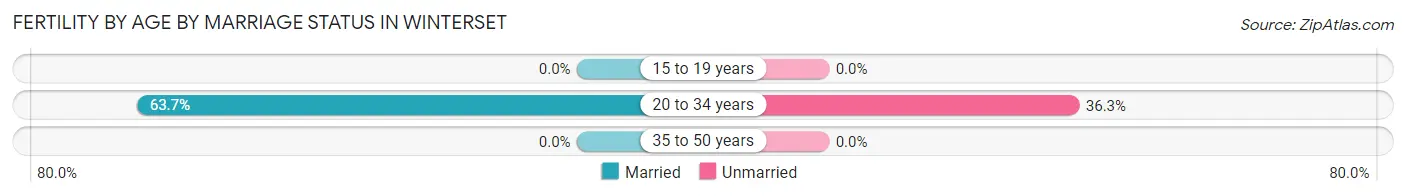
| Age Bracket | Married | Unmarried |
| 15 to 19 years | 0 (0.0%) | 0 (0.0%) |
| 20 to 34 years | 65 (63.7%) | 37 (36.3%) |
| 35 to 50 years | 0 (0.0%) | 0 (0.0%) |
| Total | 65 (63.7%) | 37 (36.3%) |
Fertility by Education in Winterset
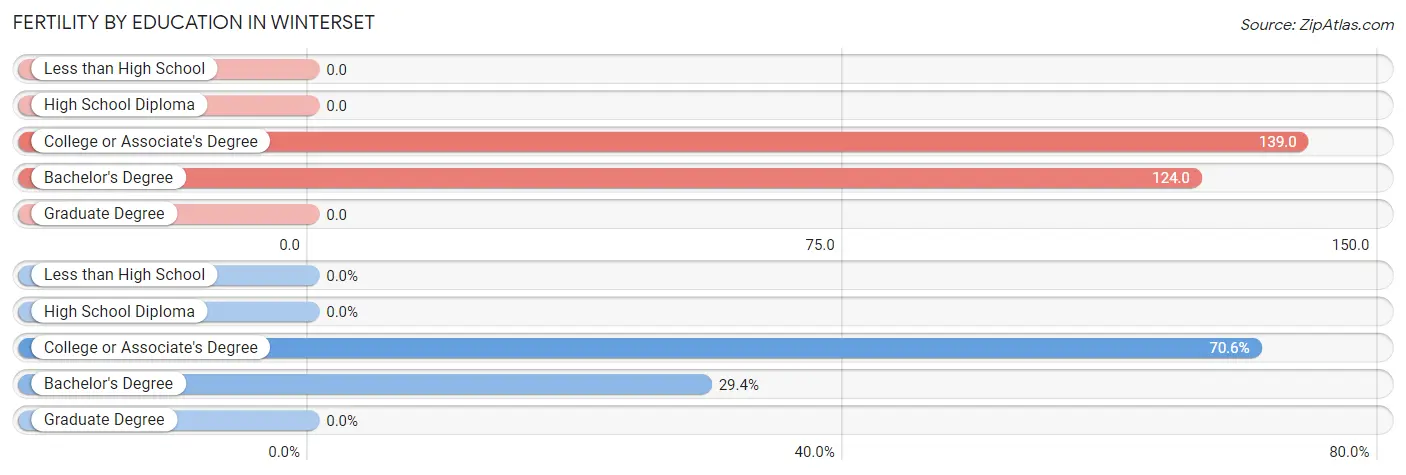
| Educational Attainment | Women with Births | Births / 1,000 Women |
| Less than High School | 0 (0.0%) | 0.0 |
| High School Diploma | 0 (0.0%) | 0.0 |
| College or Associate's Degree | 72 (70.6%) | 139.0 |
| Bachelor's Degree | 30 (29.4%) | 124.0 |
| Graduate Degree | 0 (0.0%) | 0.0 |
| Total | 102 (100.0%) | 88.0 |
Fertility by Education by Marriage Status in Winterset
36.3% of women with births in Winterset are unmarried. Women with the educational attainment of bachelor's degree are most likely to be married with 100.0% of them married at childbirth, while women with the educational attainment of college or associate's degree are least likely to be married with 51.4% of them unmarried at childbirth.
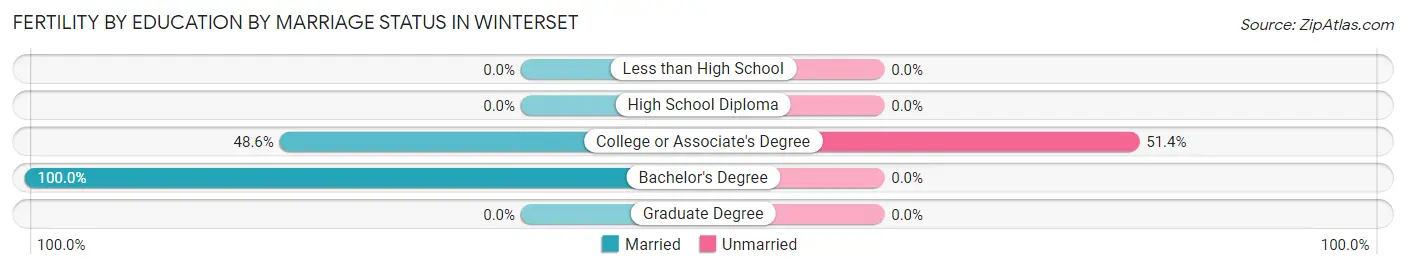
| Educational Attainment | Married | Unmarried |
| Less than High School | 0 (0.0%) | 0 (0.0%) |
| High School Diploma | 0 (0.0%) | 0 (0.0%) |
| College or Associate's Degree | 35 (48.6%) | 37 (51.4%) |
| Bachelor's Degree | 30 (100.0%) | 0 (0.0%) |
| Graduate Degree | 0 (0.0%) | 0 (0.0%) |
| Total | 65 (63.7%) | 37 (36.3%) |
Employment Characteristics in Winterset
Employment by Class of Employer in Winterset
Among the 2,704 employed individuals in Winterset, private company employees (1,783 | 65.9%), self-employed (not incorporated) (323 | 11.9%), and local government employees (250 | 9.2%) make up the most common classes of employment.
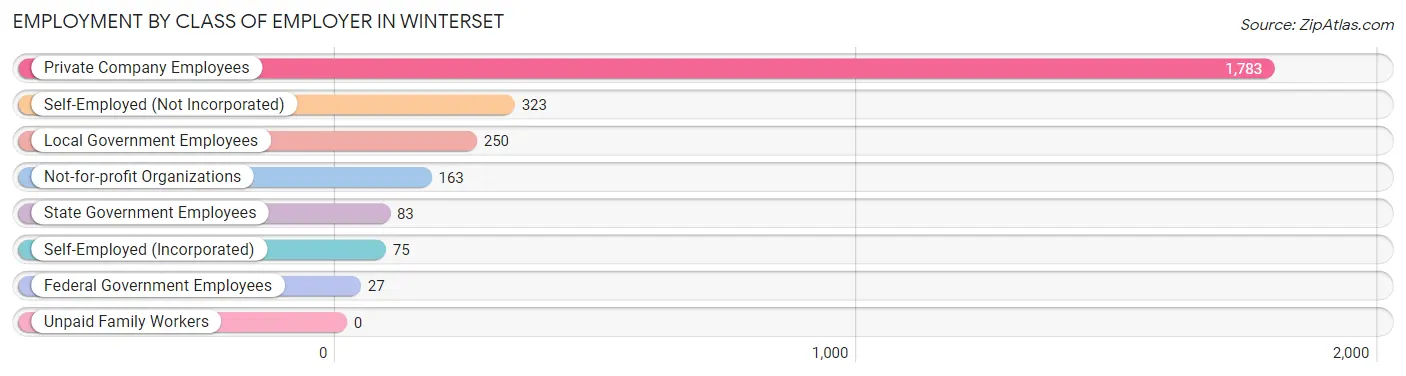
| Employer Class | # Employees | % Employees |
| Private Company Employees | 1,783 | 65.9% |
| Self-Employed (Incorporated) | 75 | 2.8% |
| Self-Employed (Not Incorporated) | 323 | 11.9% |
| Not-for-profit Organizations | 163 | 6.0% |
| Local Government Employees | 250 | 9.2% |
| State Government Employees | 83 | 3.1% |
| Federal Government Employees | 27 | 1.0% |
| Unpaid Family Workers | 0 | 0.0% |
| Total | 2,704 | 100.0% |
Employment Status by Age in Winterset
According to the labor force statistics for Winterset, out of the total population over 16 years of age (4,040), 69.9% or 2,824 individuals are in the labor force, with 1.1% or 31 of them unemployed. The age group with the highest labor force participation rate is 20 to 24 years, with 99.3% or 301 individuals in the labor force. Within the labor force, the 35 to 44 years age range has the highest percentage of unemployed individuals, with 3.7% or 25 of them being unemployed.
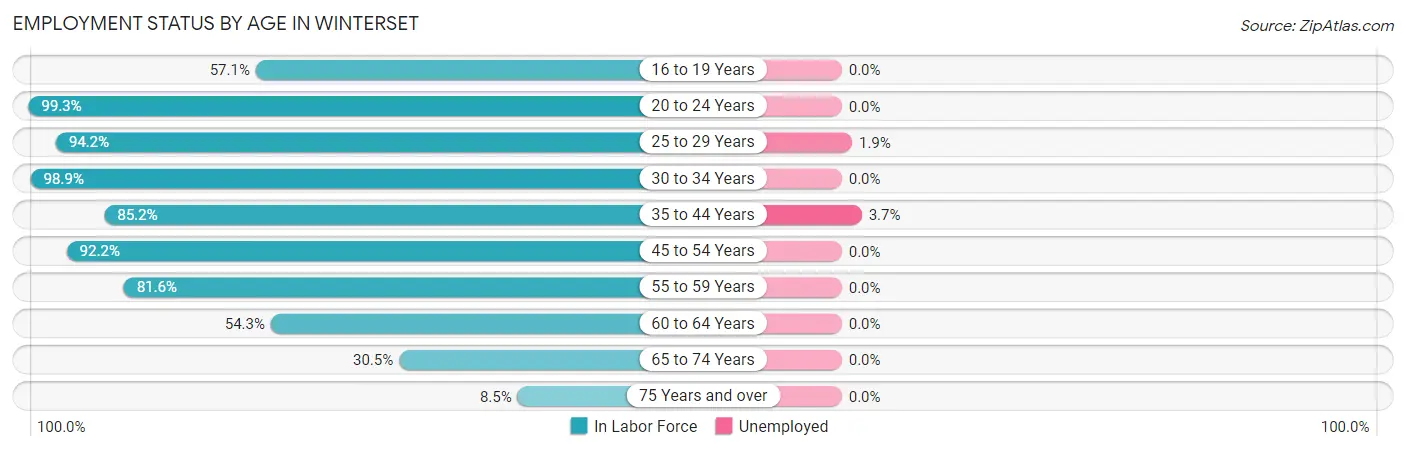
| Age Bracket | In Labor Force | Unemployed |
| 16 to 19 Years | 108 (57.1%) | 0 (0.0%) |
| 20 to 24 Years | 301 (99.3%) | 0 (0.0%) |
| 25 to 29 Years | 359 (94.2%) | 7 (1.9%) |
| 30 to 34 Years | 261 (98.9%) | 0 (0.0%) |
| 35 to 44 Years | 675 (85.2%) | 25 (3.7%) |
| 45 to 54 Years | 616 (92.2%) | 0 (0.0%) |
| 55 to 59 Years | 191 (81.6%) | 0 (0.0%) |
| 60 to 64 Years | 134 (54.3%) | 0 (0.0%) |
| 65 to 74 Years | 135 (30.5%) | 0 (0.0%) |
| 75 Years and over | 44 (8.5%) | 0 (0.0%) |
| Total | 2,824 (69.9%) | 31 (1.1%) |
Employment Status by Educational Attainment in Winterset
According to labor force statistics for Winterset, 86.5% of individuals (2,237) out of the total population between 25 and 64 years of age (2,586) are in the labor force, with 1.4% or 31 of them being unemployed. The group with the highest labor force participation rate are those with the educational attainment of college / associate degree, with 89.2% or 962 individuals in the labor force. Within the labor force, individuals with high school diploma education have the highest percentage of unemployment, with 3.5% or 25 of them being unemployed.
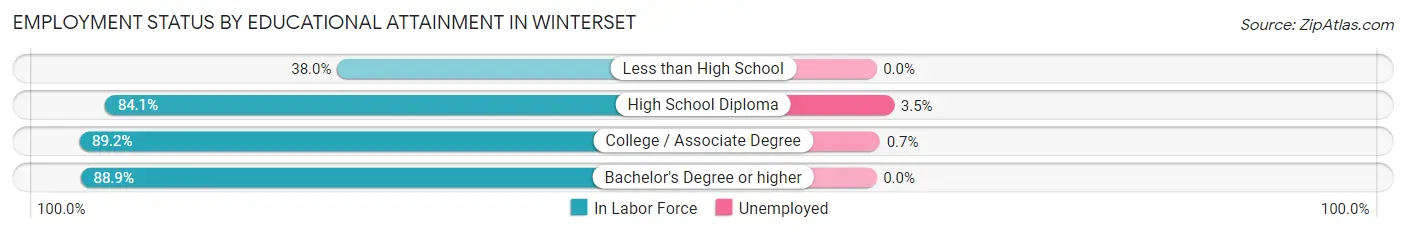
| Educational Attainment | In Labor Force | Unemployed |
| Less than High School | 19 (38.0%) | 0 (0.0%) |
| High School Diploma | 723 (84.1%) | 30 (3.5%) |
| College / Associate Degree | 962 (89.2%) | 8 (0.7%) |
| Bachelor's Degree or higher | 531 (88.9%) | 0 (0.0%) |
| Total | 2,237 (86.5%) | 36 (1.4%) |
Employment Occupations by Sex in Winterset
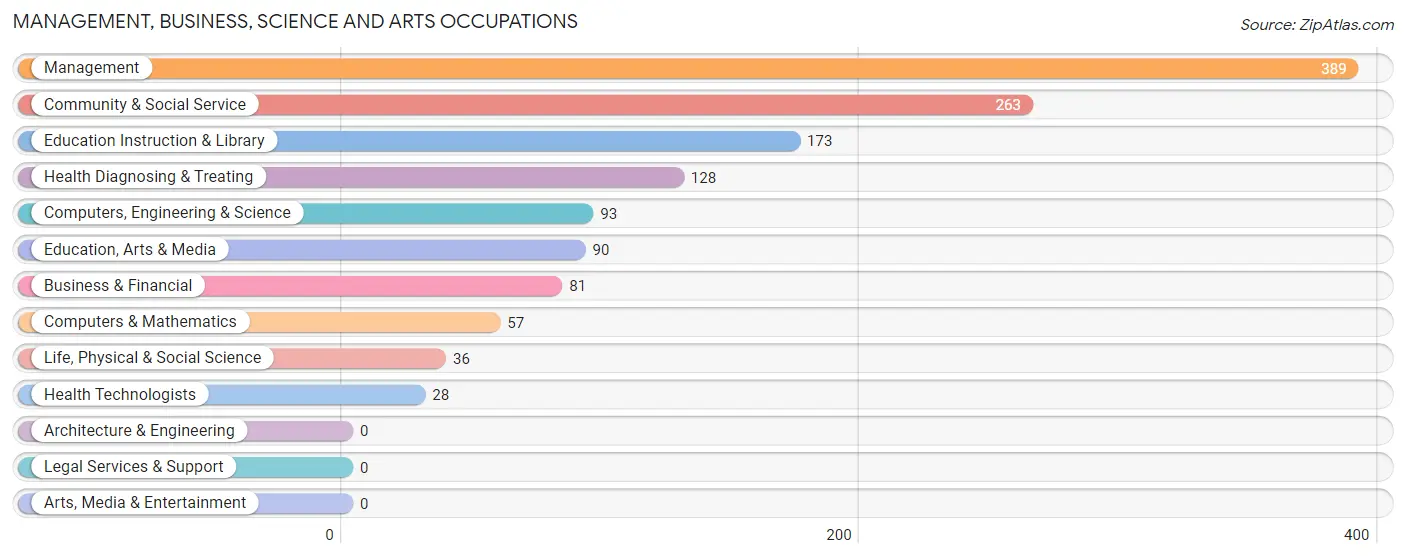
Management, Business, Science and Arts Occupations
The most common Management, Business, Science and Arts occupations in Winterset are Management (389 | 13.9%), Community & Social Service (263 | 9.4%), Education Instruction & Library (173 | 6.2%), Health Diagnosing & Treating (128 | 4.6%), and Computers, Engineering & Science (93 | 3.3%).
Management, Business, Science and Arts Occupations by Sex
Within the Management, Business, Science and Arts occupations in Winterset, the most male-oriented occupations are Life, Physical & Social Science (100.0%), Computers, Engineering & Science (80.6%), and Computers & Mathematics (68.4%), while the most female-oriented occupations are Health Diagnosing & Treating (100.0%), Health Technologists (100.0%), and Education Instruction & Library (68.2%).
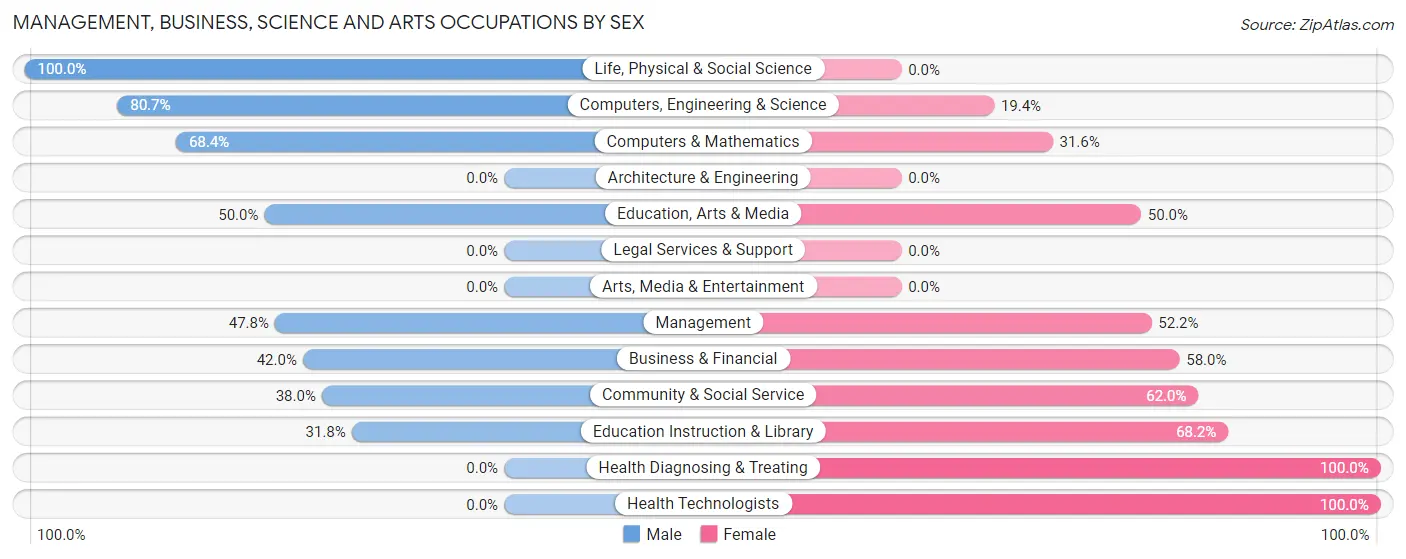
| Occupation | Male | Female |
| Management | 186 (47.8%) | 203 (52.2%) |
| Business & Financial | 34 (42.0%) | 47 (58.0%) |
| Computers, Engineering & Science | 75 (80.6%) | 18 (19.4%) |
| Computers & Mathematics | 39 (68.4%) | 18 (31.6%) |
| Architecture & Engineering | 0 (0.0%) | 0 (0.0%) |
| Life, Physical & Social Science | 36 (100.0%) | 0 (0.0%) |
| Community & Social Service | 100 (38.0%) | 163 (62.0%) |
| Education, Arts & Media | 45 (50.0%) | 45 (50.0%) |
| Legal Services & Support | 0 (0.0%) | 0 (0.0%) |
| Education Instruction & Library | 55 (31.8%) | 118 (68.2%) |
| Arts, Media & Entertainment | 0 (0.0%) | 0 (0.0%) |
| Health Diagnosing & Treating | 0 (0.0%) | 128 (100.0%) |
| Health Technologists | 0 (0.0%) | 28 (100.0%) |
| Total (Category) | 395 (41.4%) | 559 (58.6%) |
| Total (Overall) | 1,541 (55.2%) | 1,251 (44.8%) |
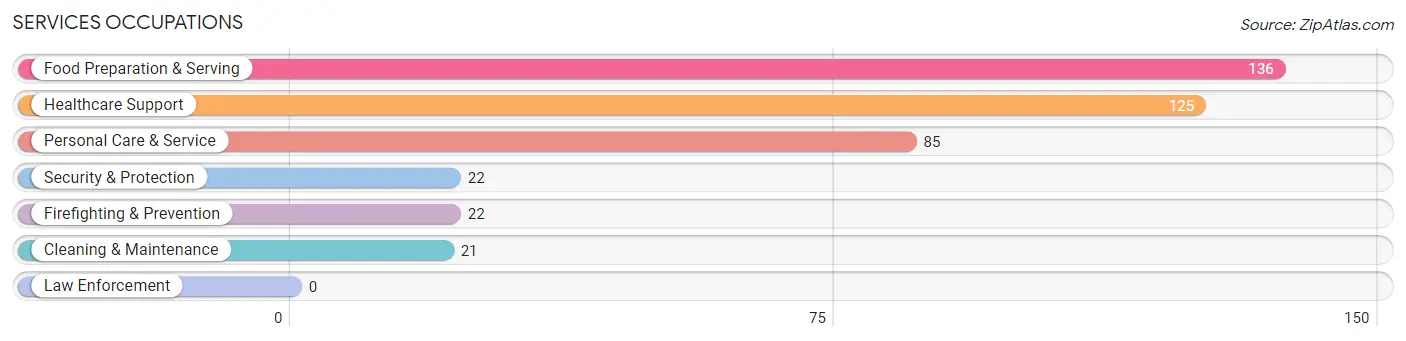
Services Occupations
The most common Services occupations in Winterset are Food Preparation & Serving (136 | 4.9%), Healthcare Support (125 | 4.5%), Personal Care & Service (85 | 3.0%), Security & Protection (22 | 0.8%), and Firefighting & Prevention (22 | 0.8%).
Services Occupations by Sex
Within the Services occupations in Winterset, the most male-oriented occupations are Security & Protection (100.0%), Firefighting & Prevention (100.0%), and Food Preparation & Serving (58.1%), while the most female-oriented occupations are Healthcare Support (100.0%), Cleaning & Maintenance (100.0%), and Personal Care & Service (100.0%).
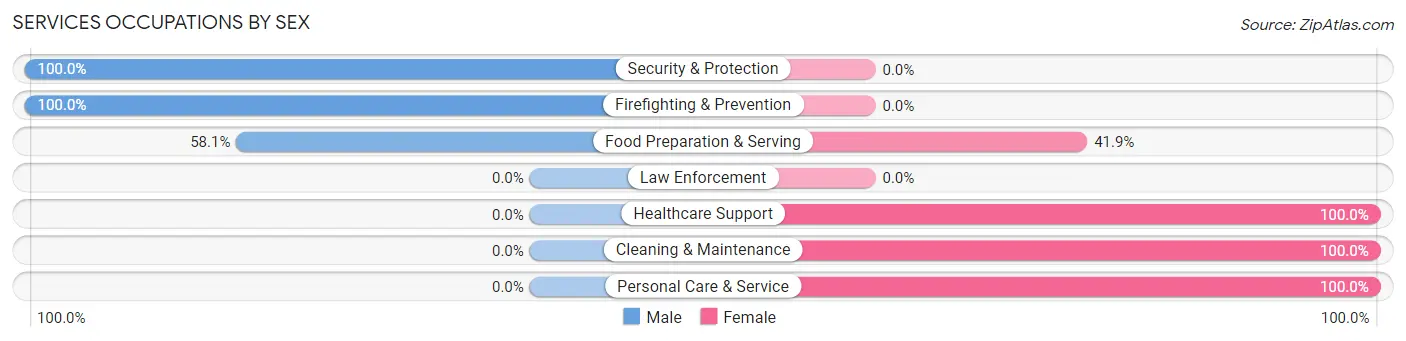
| Occupation | Male | Female |
| Healthcare Support | 0 (0.0%) | 125 (100.0%) |
| Security & Protection | 22 (100.0%) | 0 (0.0%) |
| Firefighting & Prevention | 22 (100.0%) | 0 (0.0%) |
| Law Enforcement | 0 (0.0%) | 0 (0.0%) |
| Food Preparation & Serving | 79 (58.1%) | 57 (41.9%) |
| Cleaning & Maintenance | 0 (0.0%) | 21 (100.0%) |
| Personal Care & Service | 0 (0.0%) | 85 (100.0%) |
| Total (Category) | 101 (26.0%) | 288 (74.0%) |
| Total (Overall) | 1,541 (55.2%) | 1,251 (44.8%) |
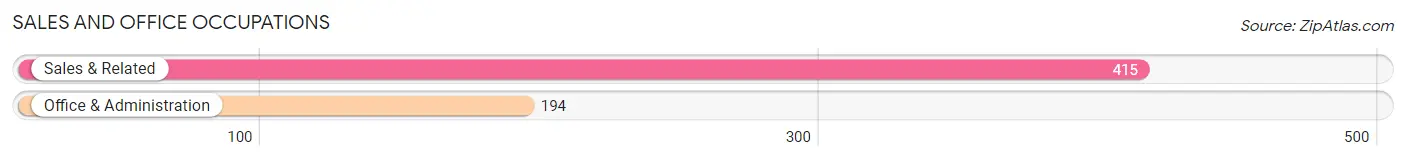
Sales and Office Occupations
The most common Sales and Office occupations in Winterset are Sales & Related (415 | 14.9%), and Office & Administration (194 | 7.0%).
Sales and Office Occupations by Sex
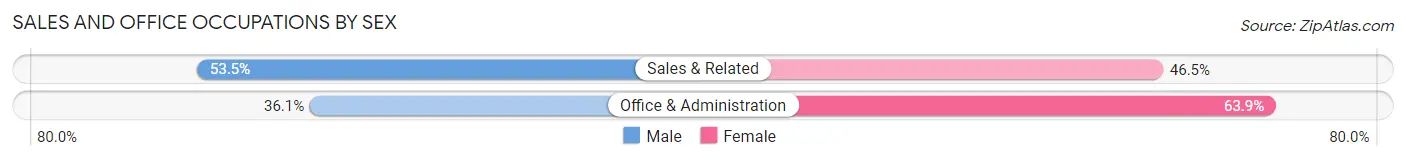
| Occupation | Male | Female |
| Sales & Related | 222 (53.5%) | 193 (46.5%) |
| Office & Administration | 70 (36.1%) | 124 (63.9%) |
| Total (Category) | 292 (47.9%) | 317 (52.0%) |
| Total (Overall) | 1,541 (55.2%) | 1,251 (44.8%) |
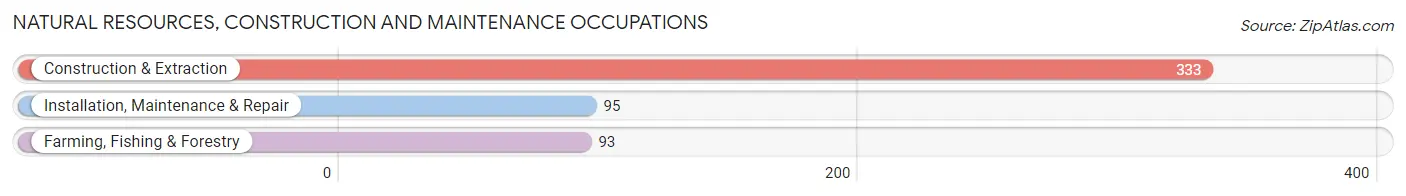
Natural Resources, Construction and Maintenance Occupations
The most common Natural Resources, Construction and Maintenance occupations in Winterset are Construction & Extraction (333 | 11.9%), Installation, Maintenance & Repair (95 | 3.4%), and Farming, Fishing & Forestry (93 | 3.3%).
Natural Resources, Construction and Maintenance Occupations by Sex
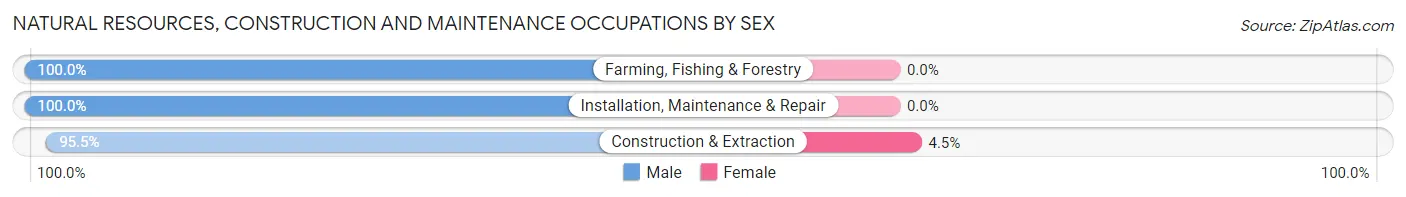
| Occupation | Male | Female |
| Farming, Fishing & Forestry | 93 (100.0%) | 0 (0.0%) |
| Construction & Extraction | 318 (95.5%) | 15 (4.5%) |
| Installation, Maintenance & Repair | 95 (100.0%) | 0 (0.0%) |
| Total (Category) | 506 (97.1%) | 15 (2.9%) |
| Total (Overall) | 1,541 (55.2%) | 1,251 (44.8%) |
Production, Transportation and Moving Occupations
The most common Production, Transportation and Moving occupations in Winterset are Transportation (133 | 4.8%), Production (109 | 3.9%), and Material Moving (77 | 2.8%).
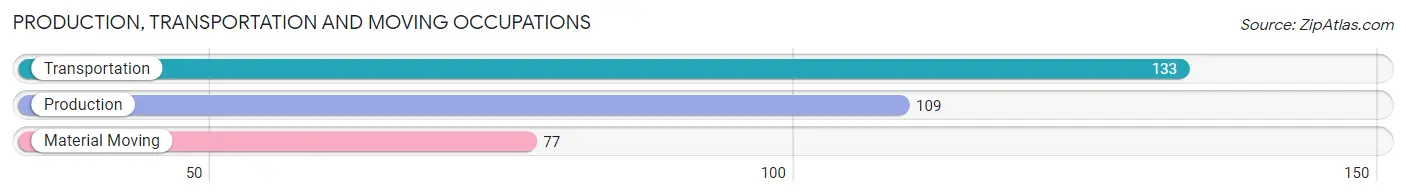
Production, Transportation and Moving Occupations by Sex
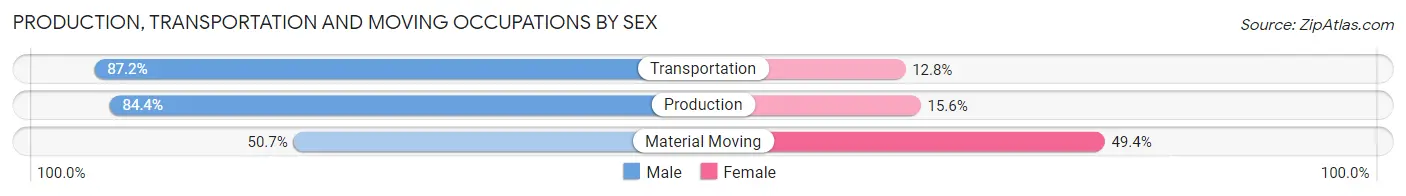
| Occupation | Male | Female |
| Production | 92 (84.4%) | 17 (15.6%) |
| Transportation | 116 (87.2%) | 17 (12.8%) |
| Material Moving | 39 (50.6%) | 38 (49.3%) |
| Total (Category) | 247 (77.4%) | 72 (22.6%) |
| Total (Overall) | 1,541 (55.2%) | 1,251 (44.8%) |
Employment Industries by Sex in Winterset
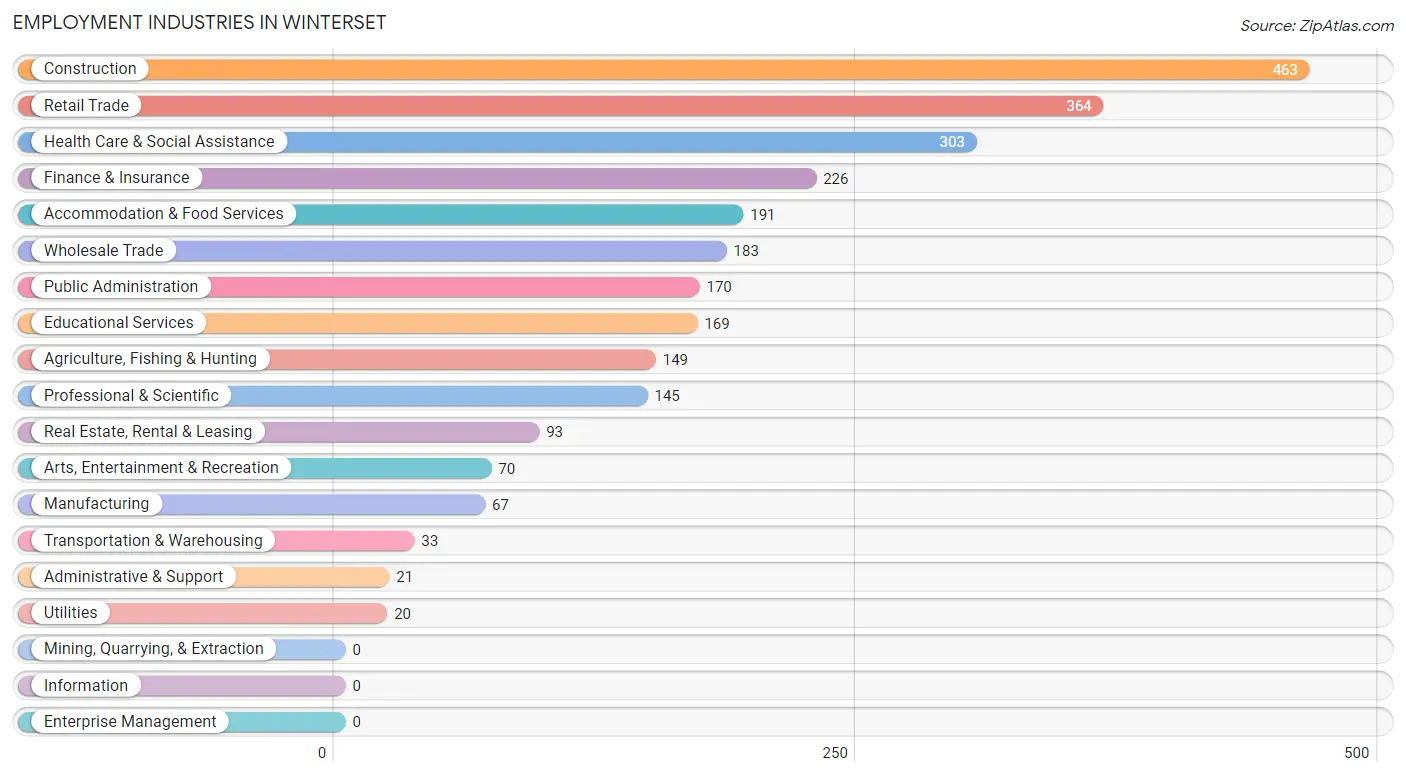
Employment Industries in Winterset
The major employment industries in Winterset include Construction (463 | 16.6%), Retail Trade (364 | 13.0%), Health Care & Social Assistance (303 | 10.8%), Finance & Insurance (226 | 8.1%), and Accommodation & Food Services (191 | 6.8%).
Employment Industries by Sex in Winterset
The Winterset industries that see more men than women are Agriculture, Fishing & Hunting (100.0%), Utilities (100.0%), and Construction (86.8%), whereas the industries that tend to have a higher number of women are Administrative & Support (100.0%), Health Care & Social Assistance (93.1%), and Arts, Entertainment & Recreation (80.0%).
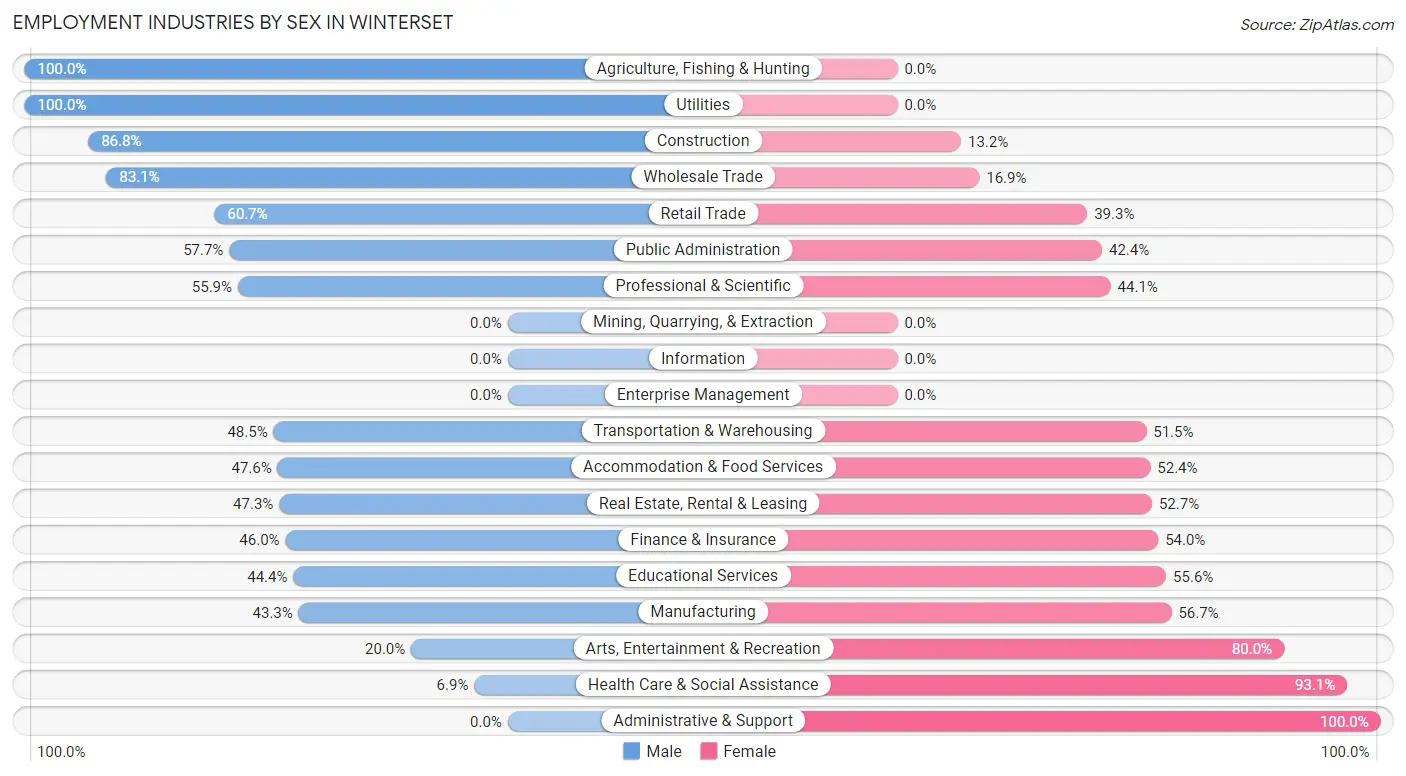
| Industry | Male | Female |
| Agriculture, Fishing & Hunting | 149 (100.0%) | 0 (0.0%) |
| Mining, Quarrying, & Extraction | 0 (0.0%) | 0 (0.0%) |
| Construction | 402 (86.8%) | 61 (13.2%) |
| Manufacturing | 29 (43.3%) | 38 (56.7%) |
| Wholesale Trade | 152 (83.1%) | 31 (16.9%) |
| Retail Trade | 221 (60.7%) | 143 (39.3%) |
| Transportation & Warehousing | 16 (48.5%) | 17 (51.5%) |
| Utilities | 20 (100.0%) | 0 (0.0%) |
| Information | 0 (0.0%) | 0 (0.0%) |
| Finance & Insurance | 104 (46.0%) | 122 (54.0%) |
| Real Estate, Rental & Leasing | 44 (47.3%) | 49 (52.7%) |
| Professional & Scientific | 81 (55.9%) | 64 (44.1%) |
| Enterprise Management | 0 (0.0%) | 0 (0.0%) |
| Administrative & Support | 0 (0.0%) | 21 (100.0%) |
| Educational Services | 75 (44.4%) | 94 (55.6%) |
| Health Care & Social Assistance | 21 (6.9%) | 282 (93.1%) |
| Arts, Entertainment & Recreation | 14 (20.0%) | 56 (80.0%) |
| Accommodation & Food Services | 91 (47.6%) | 100 (52.4%) |
| Public Administration | 98 (57.7%) | 72 (42.3%) |
| Total | 1,541 (55.2%) | 1,251 (44.8%) |
Education in Winterset
School Enrollment in Winterset
The most common levels of schooling among the 1,406 students in Winterset are elementary school (417 | 29.7%), middle school (304 | 21.6%), and high school (265 | 18.9%).
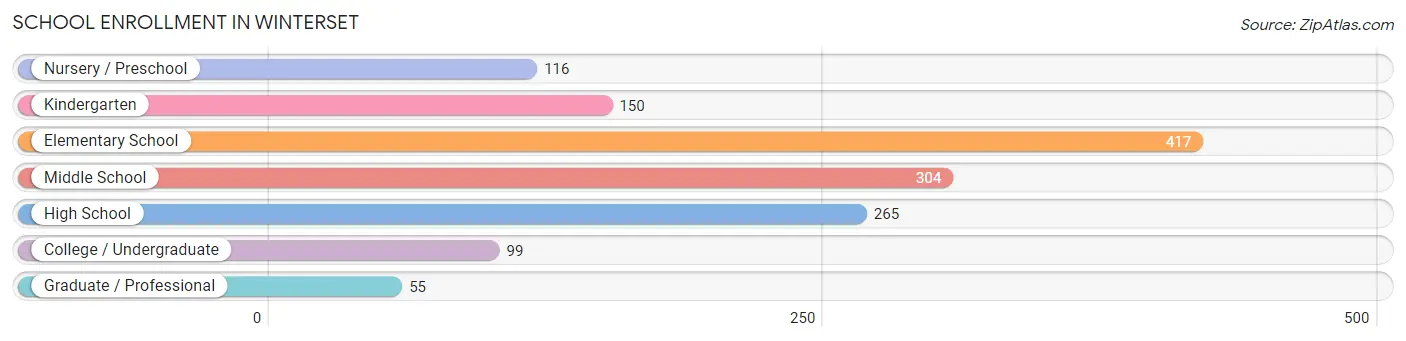
| School Level | # Students | % Students |
| Nursery / Preschool | 116 | 8.3% |
| Kindergarten | 150 | 10.7% |
| Elementary School | 417 | 29.7% |
| Middle School | 304 | 21.6% |
| High School | 265 | 18.9% |
| College / Undergraduate | 99 | 7.0% |
| Graduate / Professional | 55 | 3.9% |
| Total | 1,406 | 100.0% |
School Enrollment by Age by Funding Source in Winterset
Out of a total of 1,406 students who are enrolled in schools in Winterset, 77 (5.5%) attend a private institution, while the remaining 1,329 (94.5%) are enrolled in public schools. The age group of 35 years and over has the highest likelihood of being enrolled in private schools, with 29 (100.0% in the age bracket) enrolled. Conversely, the age group of 3 to 4 year olds has the lowest likelihood of being enrolled in a private school, with 59 (100.0% in the age bracket) attending a public institution.
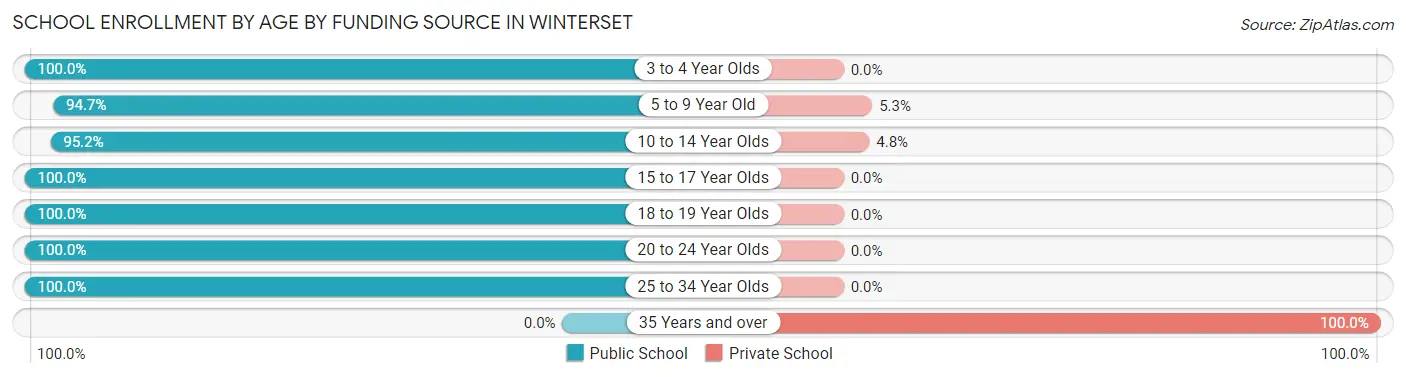
| Age Bracket | Public School | Private School |
| 3 to 4 Year Olds | 59 (100.0%) | 0 (0.0%) |
| 5 to 9 Year Old | 570 (94.7%) | 32 (5.3%) |
| 10 to 14 Year Olds | 318 (95.2%) | 16 (4.8%) |
| 15 to 17 Year Olds | 255 (100.0%) | 0 (0.0%) |
| 18 to 19 Year Olds | 2 (100.0%) | 0 (0.0%) |
| 20 to 24 Year Olds | 84 (100.0%) | 0 (0.0%) |
| 25 to 34 Year Olds | 41 (100.0%) | 0 (0.0%) |
| 35 Years and over | 0 (0.0%) | 29 (100.0%) |
| Total | 1,329 (94.5%) | 77 (5.5%) |
Educational Attainment by Field of Study in Winterset
Education (338 | 40.6%), business (157 | 18.9%), science & technology (81 | 9.7%), bio, nature & agricultural (58 | 7.0%), and communications (44 | 5.3%) are the most common fields of study among 832 individuals in Winterset who have obtained a bachelor's degree or higher.
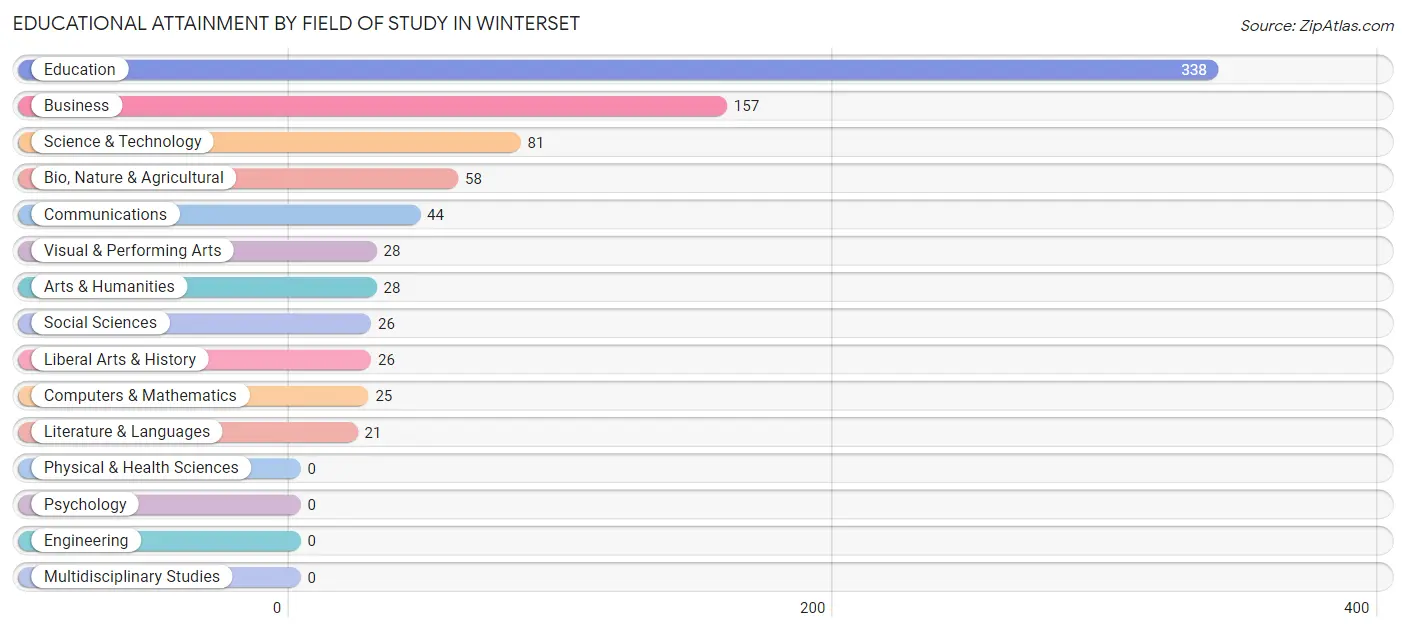
| Field of Study | # Graduates | % Graduates |
| Computers & Mathematics | 25 | 3.0% |
| Bio, Nature & Agricultural | 58 | 7.0% |
| Physical & Health Sciences | 0 | 0.0% |
| Psychology | 0 | 0.0% |
| Social Sciences | 26 | 3.1% |
| Engineering | 0 | 0.0% |
| Multidisciplinary Studies | 0 | 0.0% |
| Science & Technology | 81 | 9.7% |
| Business | 157 | 18.9% |
| Education | 338 | 40.6% |
| Literature & Languages | 21 | 2.5% |
| Liberal Arts & History | 26 | 3.1% |
| Visual & Performing Arts | 28 | 3.4% |
| Communications | 44 | 5.3% |
| Arts & Humanities | 28 | 3.4% |
| Total | 832 | 100.0% |
Transportation & Commute in Winterset
Vehicle Availability by Sex in Winterset
The most prevalent vehicle ownership categories in Winterset are males with 2 vehicles (692, accounting for 44.9%) and females with 2 vehicles (353, making up 59.5%).
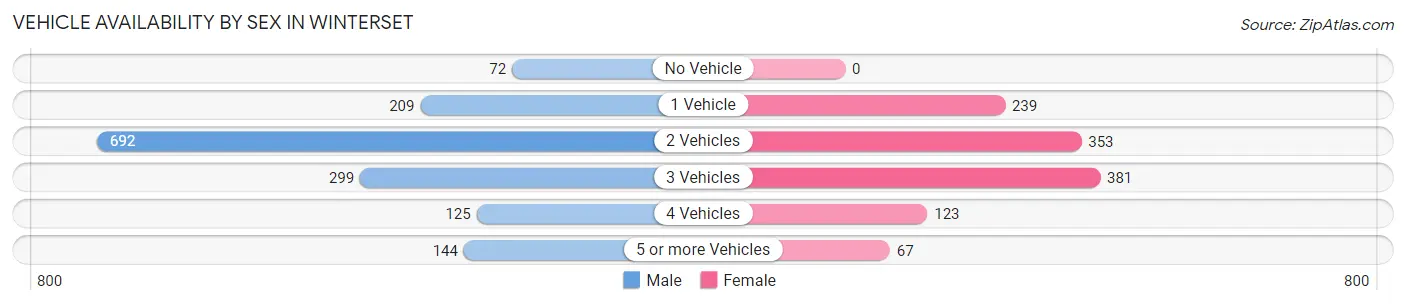
| Vehicles Available | Male | Female |
| No Vehicle | 72 (4.7%) | 0 (0.0%) |
| 1 Vehicle | 209 (13.6%) | 239 (20.5%) |
| 2 Vehicles | 692 (44.9%) | 353 (30.3%) |
| 3 Vehicles | 299 (19.4%) | 381 (32.8%) |
| 4 Vehicles | 125 (8.1%) | 123 (10.6%) |
| 5 or more Vehicles | 144 (9.3%) | 67 (5.8%) |
| Total | 1,541 (100.0%) | 1,163 (100.0%) |
Commute Time in Winterset
The most frequently occuring commute durations in Winterset are 5 to 9 minutes (688 commuters, 28.4%), less than 5 minutes (408 commuters, 16.9%), and 10 to 14 minutes (339 commuters, 14.0%).
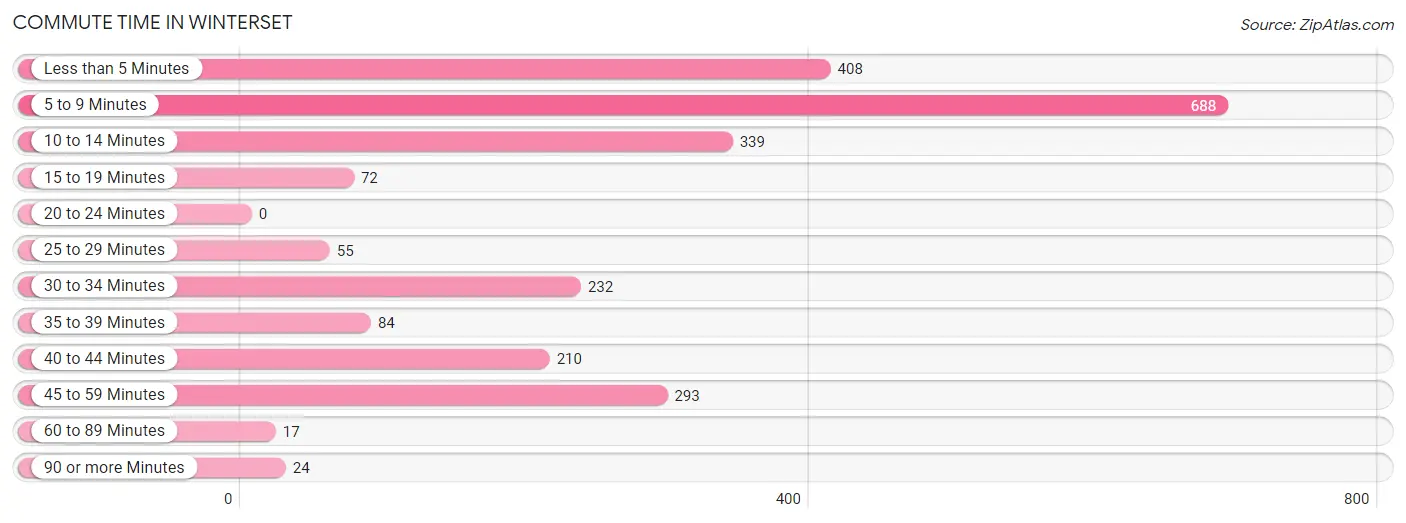
| Commute Time | # Commuters | % Commuters |
| Less than 5 Minutes | 408 | 16.9% |
| 5 to 9 Minutes | 688 | 28.4% |
| 10 to 14 Minutes | 339 | 14.0% |
| 15 to 19 Minutes | 72 | 3.0% |
| 20 to 24 Minutes | 0 | 0.0% |
| 25 to 29 Minutes | 55 | 2.3% |
| 30 to 34 Minutes | 232 | 9.6% |
| 35 to 39 Minutes | 84 | 3.5% |
| 40 to 44 Minutes | 210 | 8.7% |
| 45 to 59 Minutes | 293 | 12.1% |
| 60 to 89 Minutes | 17 | 0.7% |
| 90 or more Minutes | 24 | 1.0% |
Commute Time by Sex in Winterset
The most common commute times in Winterset are 5 to 9 minutes (383 commuters, 27.2%) for males and 5 to 9 minutes (305 commuters, 30.0%) for females.
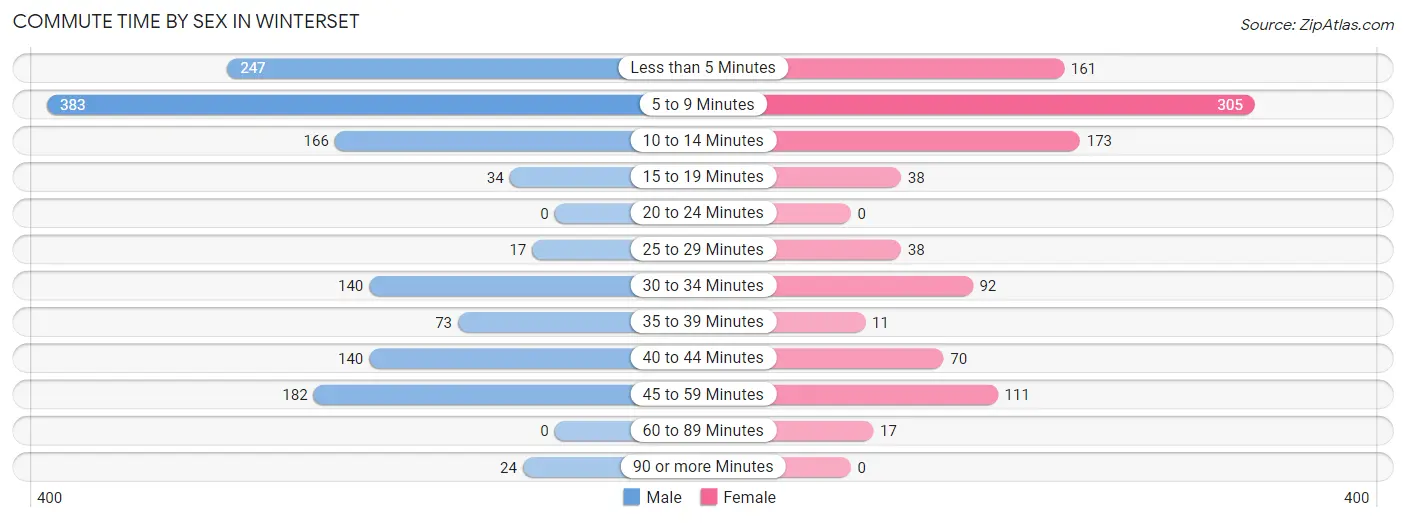
| Commute Time | Male | Female |
| Less than 5 Minutes | 247 (17.6%) | 161 (15.9%) |
| 5 to 9 Minutes | 383 (27.2%) | 305 (30.0%) |
| 10 to 14 Minutes | 166 (11.8%) | 173 (17.0%) |
| 15 to 19 Minutes | 34 (2.4%) | 38 (3.7%) |
| 20 to 24 Minutes | 0 (0.0%) | 0 (0.0%) |
| 25 to 29 Minutes | 17 (1.2%) | 38 (3.7%) |
| 30 to 34 Minutes | 140 (10.0%) | 92 (9.1%) |
| 35 to 39 Minutes | 73 (5.2%) | 11 (1.1%) |
| 40 to 44 Minutes | 140 (10.0%) | 70 (6.9%) |
| 45 to 59 Minutes | 182 (12.9%) | 111 (10.9%) |
| 60 to 89 Minutes | 0 (0.0%) | 17 (1.7%) |
| 90 or more Minutes | 24 (1.7%) | 0 (0.0%) |
Time of Departure to Work by Sex in Winterset
The most frequent times of departure to work in Winterset are 6:30 AM to 6:59 AM (315, 22.4%) for males and 6:00 AM to 6:29 AM (202, 19.9%) for females.
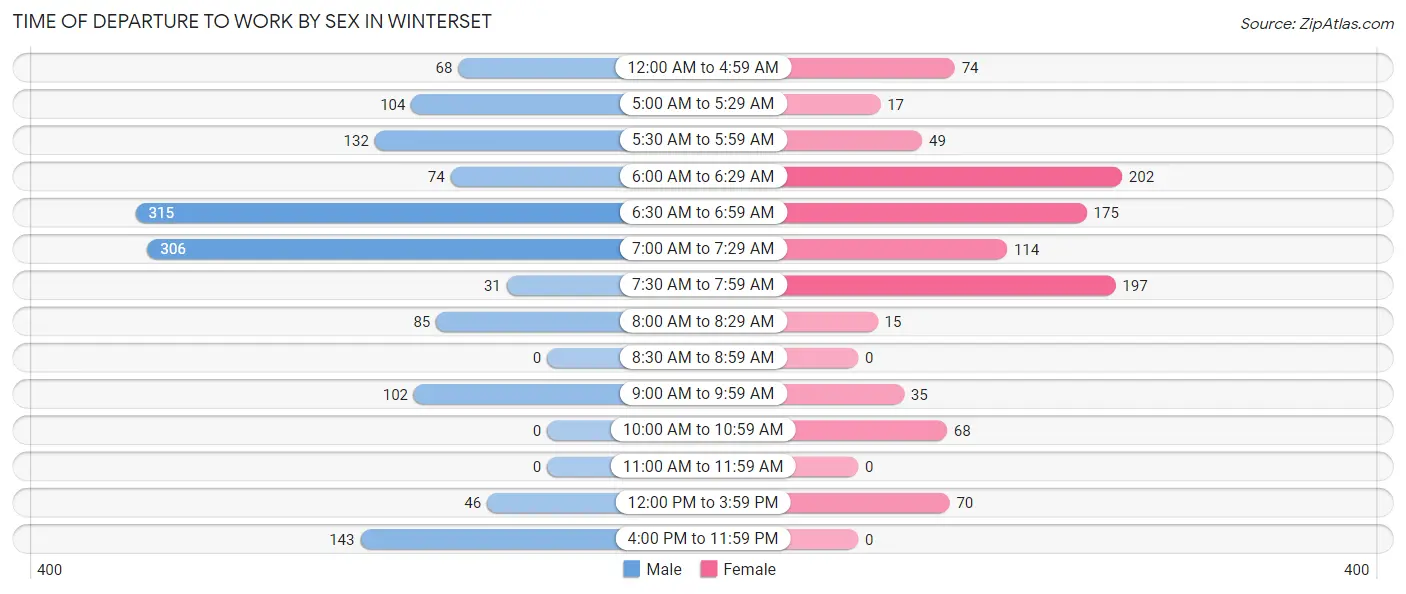
| Time of Departure | Male | Female |
| 12:00 AM to 4:59 AM | 68 (4.8%) | 74 (7.3%) |
| 5:00 AM to 5:29 AM | 104 (7.4%) | 17 (1.7%) |
| 5:30 AM to 5:59 AM | 132 (9.4%) | 49 (4.8%) |
| 6:00 AM to 6:29 AM | 74 (5.3%) | 202 (19.9%) |
| 6:30 AM to 6:59 AM | 315 (22.4%) | 175 (17.2%) |
| 7:00 AM to 7:29 AM | 306 (21.8%) | 114 (11.2%) |
| 7:30 AM to 7:59 AM | 31 (2.2%) | 197 (19.4%) |
| 8:00 AM to 8:29 AM | 85 (6.0%) | 15 (1.5%) |
| 8:30 AM to 8:59 AM | 0 (0.0%) | 0 (0.0%) |
| 9:00 AM to 9:59 AM | 102 (7.2%) | 35 (3.4%) |
| 10:00 AM to 10:59 AM | 0 (0.0%) | 68 (6.7%) |
| 11:00 AM to 11:59 AM | 0 (0.0%) | 0 (0.0%) |
| 12:00 PM to 3:59 PM | 46 (3.3%) | 70 (6.9%) |
| 4:00 PM to 11:59 PM | 143 (10.2%) | 0 (0.0%) |
| Total | 1,406 (100.0%) | 1,016 (100.0%) |
Housing Occupancy in Winterset
Occupancy by Ownership in Winterset
Of the total 2,227 dwellings in Winterset, owner-occupied units account for 1,589 (71.4%), while renter-occupied units make up 638 (28.6%).
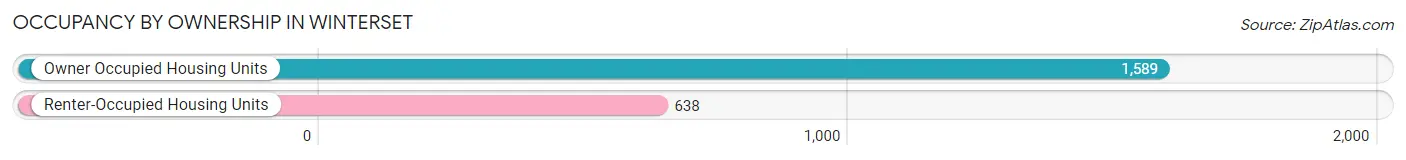
| Occupancy | # Housing Units | % Housing Units |
| Owner Occupied Housing Units | 1,589 | 71.4% |
| Renter-Occupied Housing Units | 638 | 28.6% |
| Total Occupied Housing Units | 2,227 | 100.0% |
Occupancy by Household Size in Winterset
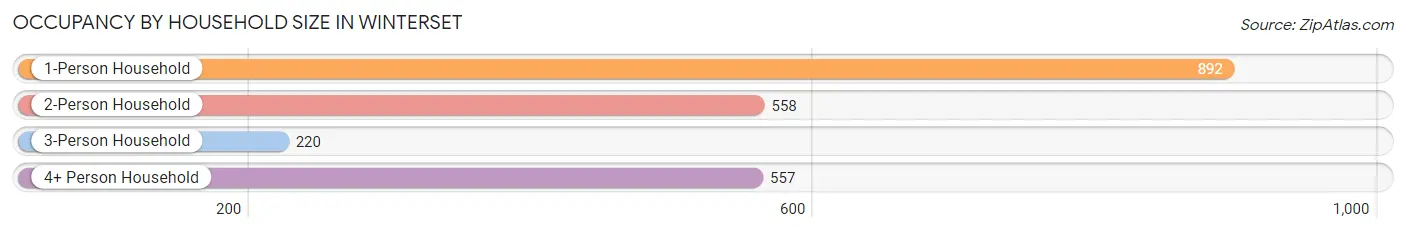
| Household Size | # Housing Units | % Housing Units |
| 1-Person Household | 892 | 40.1% |
| 2-Person Household | 558 | 25.1% |
| 3-Person Household | 220 | 9.9% |
| 4+ Person Household | 557 | 25.0% |
| Total Housing Units | 2,227 | 100.0% |
Occupancy by Ownership by Household Size in Winterset
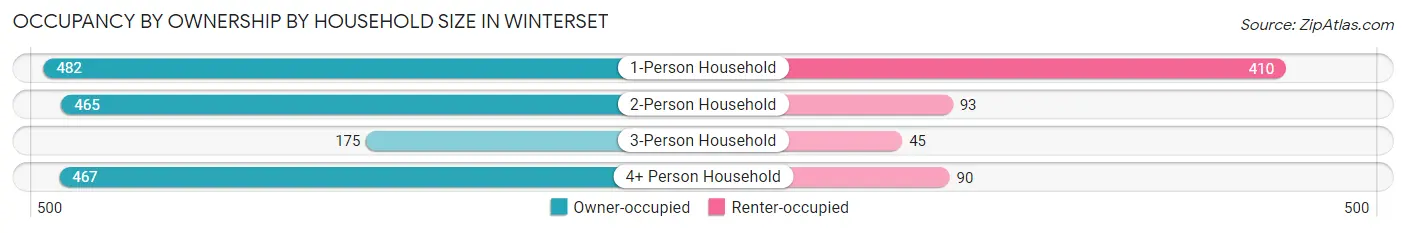
| Household Size | Owner-occupied | Renter-occupied |
| 1-Person Household | 482 (54.0%) | 410 (46.0%) |
| 2-Person Household | 465 (83.3%) | 93 (16.7%) |
| 3-Person Household | 175 (79.5%) | 45 (20.4%) |
| 4+ Person Household | 467 (83.8%) | 90 (16.2%) |
| Total Housing Units | 1,589 (71.4%) | 638 (28.6%) |
Occupancy by Educational Attainment in Winterset
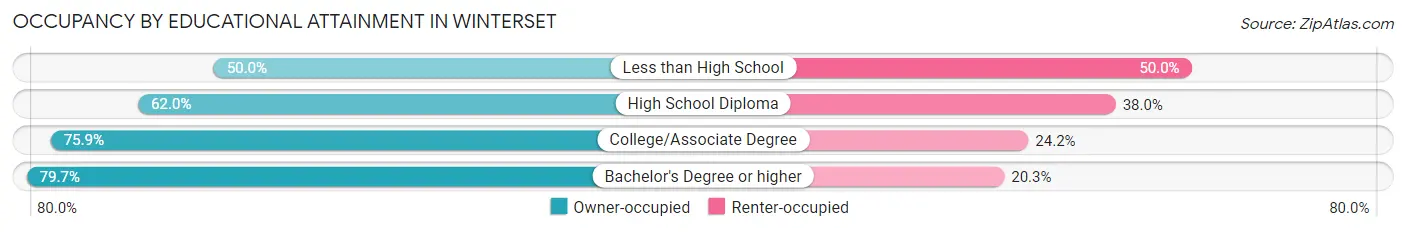
| Household Size | Owner-occupied | Renter-occupied |
| Less than High School | 36 (50.0%) | 36 (50.0%) |
| High School Diploma | 462 (62.0%) | 283 (38.0%) |
| College/Associate Degree | 644 (75.8%) | 205 (24.1%) |
| Bachelor's Degree or higher | 447 (79.7%) | 114 (20.3%) |
Occupancy by Age of Householder in Winterset
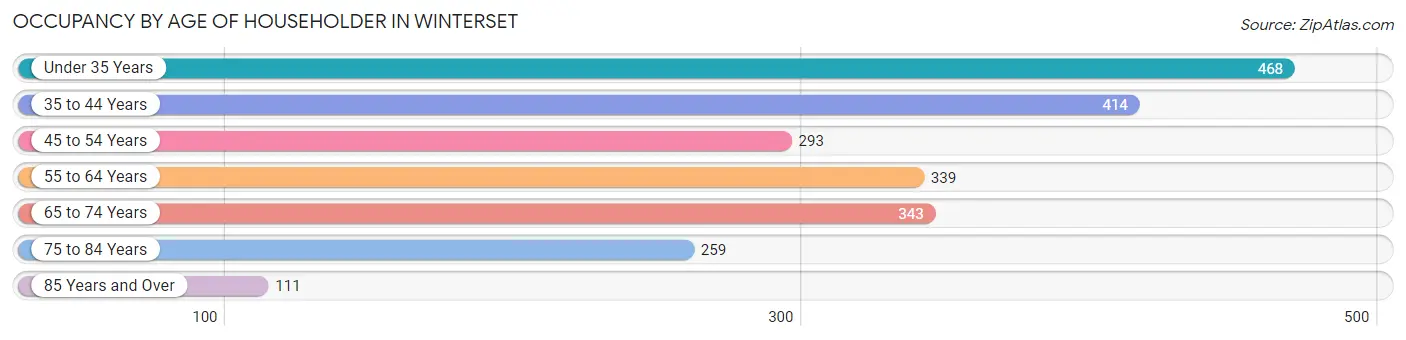
| Age Bracket | # Households | % Households |
| Under 35 Years | 468 | 21.0% |
| 35 to 44 Years | 414 | 18.6% |
| 45 to 54 Years | 293 | 13.2% |
| 55 to 64 Years | 339 | 15.2% |
| 65 to 74 Years | 343 | 15.4% |
| 75 to 84 Years | 259 | 11.6% |
| 85 Years and Over | 111 | 5.0% |
| Total | 2,227 | 100.0% |
Housing Finances in Winterset
Median Income by Occupancy in Winterset
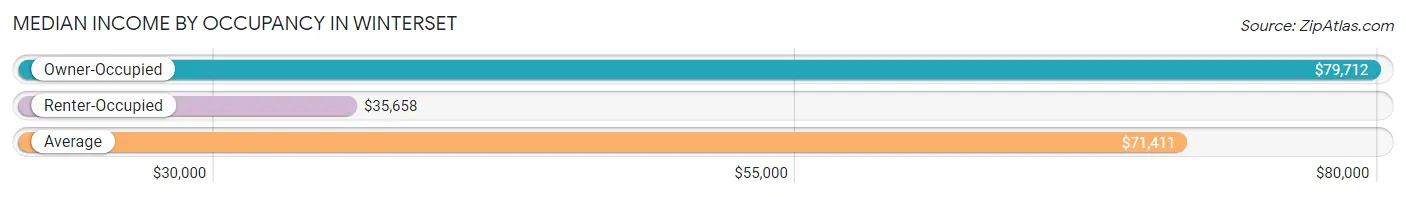
| Occupancy Type | # Households | Median Income |
| Owner-Occupied | 1,589 (71.4%) | $79,712 |
| Renter-Occupied | 638 (28.6%) | $35,658 |
| Average | 2,227 (100.0%) | $71,411 |
Occupancy by Householder Income Bracket in Winterset
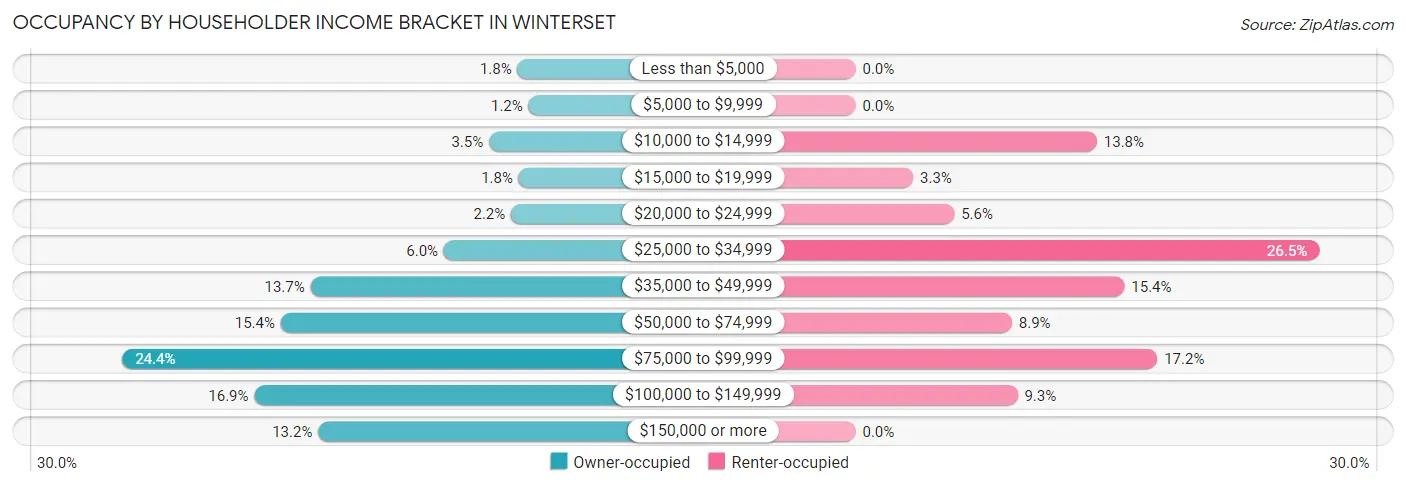
| Income Bracket | Owner-occupied | Renter-occupied |
| Less than $5,000 | 29 (1.8%) | 0 (0.0%) |
| $5,000 to $9,999 | 19 (1.2%) | 0 (0.0%) |
| $10,000 to $14,999 | 55 (3.5%) | 88 (13.8%) |
| $15,000 to $19,999 | 28 (1.8%) | 21 (3.3%) |
| $20,000 to $24,999 | 35 (2.2%) | 36 (5.6%) |
| $25,000 to $34,999 | 96 (6.0%) | 169 (26.5%) |
| $35,000 to $49,999 | 217 (13.7%) | 98 (15.4%) |
| $50,000 to $74,999 | 244 (15.4%) | 57 (8.9%) |
| $75,000 to $99,999 | 388 (24.4%) | 110 (17.2%) |
| $100,000 to $149,999 | 268 (16.9%) | 59 (9.2%) |
| $150,000 or more | 210 (13.2%) | 0 (0.0%) |
| Total | 1,589 (100.0%) | 638 (100.0%) |
Monthly Housing Cost Tiers in Winterset
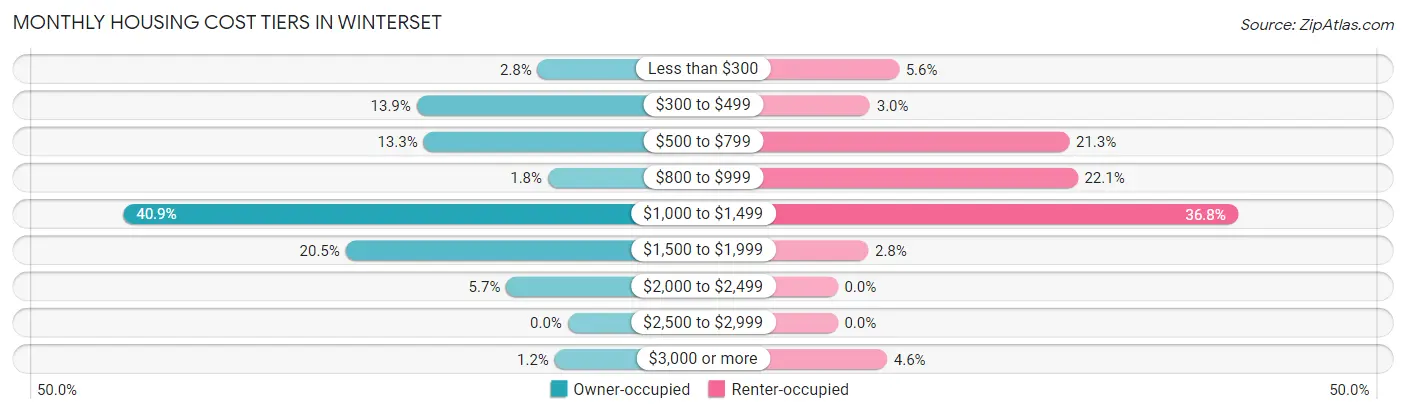
| Monthly Cost | Owner-occupied | Renter-occupied |
| Less than $300 | 44 (2.8%) | 36 (5.6%) |
| $300 to $499 | 221 (13.9%) | 19 (3.0%) |
| $500 to $799 | 211 (13.3%) | 136 (21.3%) |
| $800 to $999 | 29 (1.8%) | 141 (22.1%) |
| $1,000 to $1,499 | 650 (40.9%) | 235 (36.8%) |
| $1,500 to $1,999 | 325 (20.4%) | 18 (2.8%) |
| $2,000 to $2,499 | 90 (5.7%) | 0 (0.0%) |
| $2,500 to $2,999 | 0 (0.0%) | 0 (0.0%) |
| $3,000 or more | 19 (1.2%) | 29 (4.5%) |
| Total | 1,589 (100.0%) | 638 (100.0%) |
Physical Housing Characteristics in Winterset
Housing Structures in Winterset
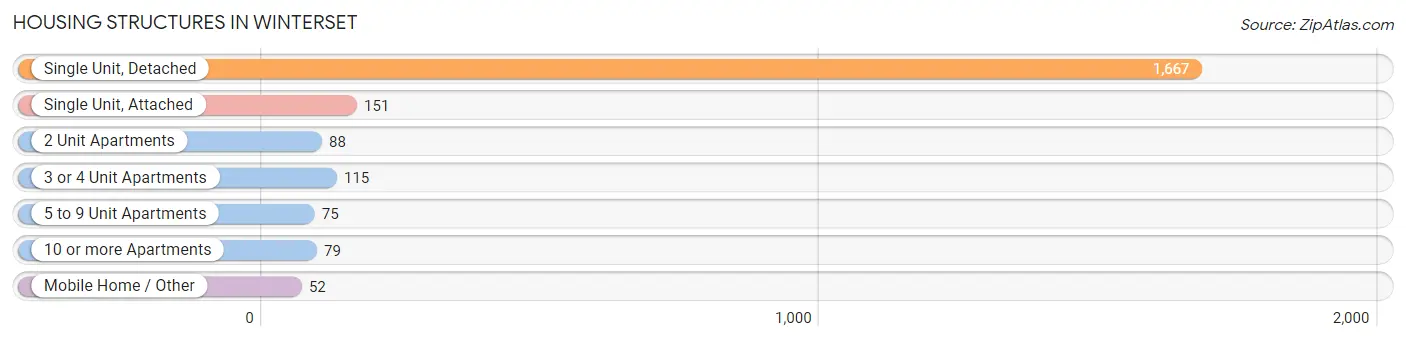
| Structure Type | # Housing Units | % Housing Units |
| Single Unit, Detached | 1,667 | 74.9% |
| Single Unit, Attached | 151 | 6.8% |
| 2 Unit Apartments | 88 | 4.0% |
| 3 or 4 Unit Apartments | 115 | 5.2% |
| 5 to 9 Unit Apartments | 75 | 3.4% |
| 10 or more Apartments | 79 | 3.5% |
| Mobile Home / Other | 52 | 2.3% |
| Total | 2,227 | 100.0% |
Housing Structures by Occupancy in Winterset
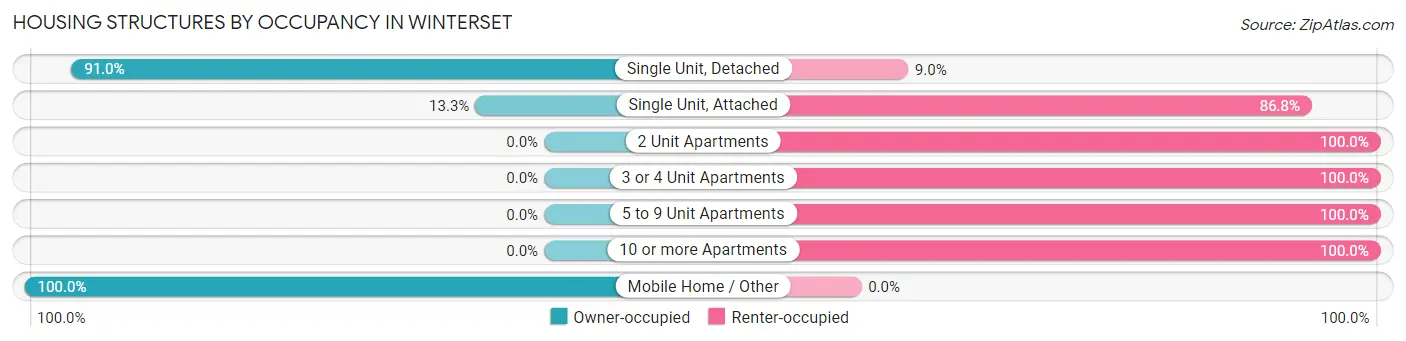
| Structure Type | Owner-occupied | Renter-occupied |
| Single Unit, Detached | 1,517 (91.0%) | 150 (9.0%) |
| Single Unit, Attached | 20 (13.3%) | 131 (86.8%) |
| 2 Unit Apartments | 0 (0.0%) | 88 (100.0%) |
| 3 or 4 Unit Apartments | 0 (0.0%) | 115 (100.0%) |
| 5 to 9 Unit Apartments | 0 (0.0%) | 75 (100.0%) |
| 10 or more Apartments | 0 (0.0%) | 79 (100.0%) |
| Mobile Home / Other | 52 (100.0%) | 0 (0.0%) |
| Total | 1,589 (71.4%) | 638 (28.6%) |
Housing Structures by Number of Rooms in Winterset
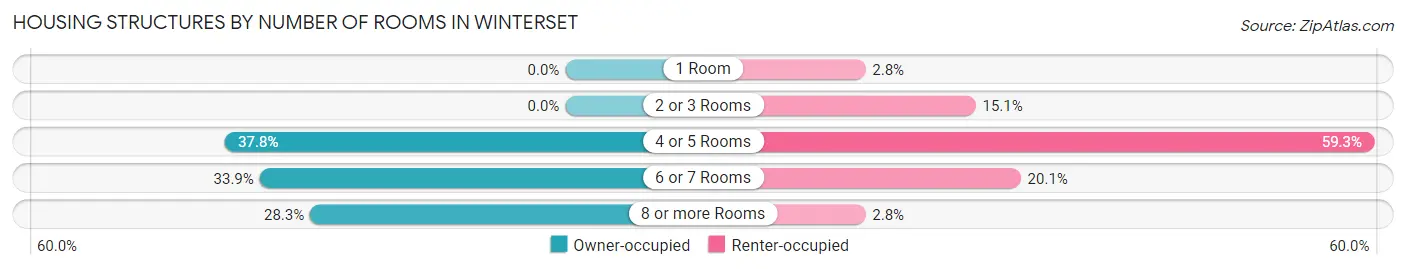
| Number of Rooms | Owner-occupied | Renter-occupied |
| 1 Room | 0 (0.0%) | 18 (2.8%) |
| 2 or 3 Rooms | 0 (0.0%) | 96 (15.0%) |
| 4 or 5 Rooms | 600 (37.8%) | 378 (59.3%) |
| 6 or 7 Rooms | 539 (33.9%) | 128 (20.1%) |
| 8 or more Rooms | 450 (28.3%) | 18 (2.8%) |
| Total | 1,589 (100.0%) | 638 (100.0%) |
Housing Structure by Heating Type in Winterset
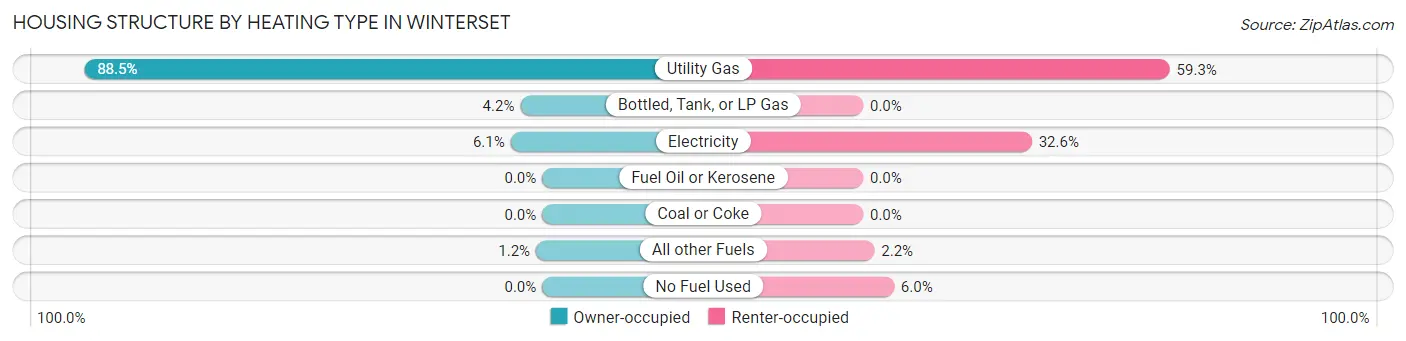
| Heating Type | Owner-occupied | Renter-occupied |
| Utility Gas | 1,406 (88.5%) | 378 (59.3%) |
| Bottled, Tank, or LP Gas | 67 (4.2%) | 0 (0.0%) |
| Electricity | 97 (6.1%) | 208 (32.6%) |
| Fuel Oil or Kerosene | 0 (0.0%) | 0 (0.0%) |
| Coal or Coke | 0 (0.0%) | 0 (0.0%) |
| All other Fuels | 19 (1.2%) | 14 (2.2%) |
| No Fuel Used | 0 (0.0%) | 38 (6.0%) |
| Total | 1,589 (100.0%) | 638 (100.0%) |
Household Vehicle Usage in Winterset
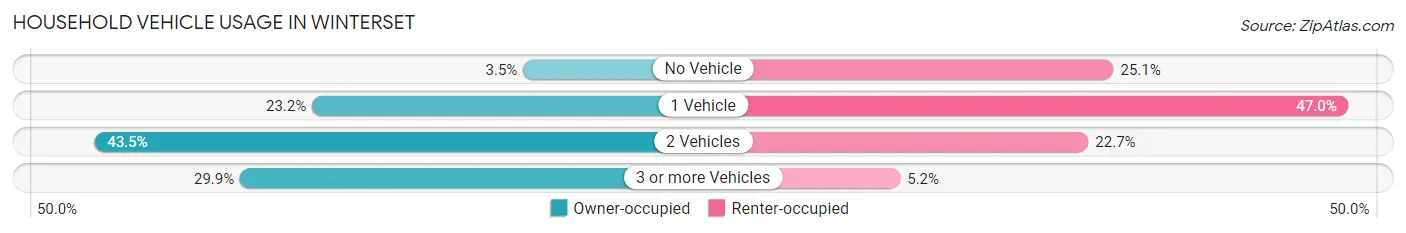
| Vehicles per Household | Owner-occupied | Renter-occupied |
| No Vehicle | 55 (3.5%) | 160 (25.1%) |
| 1 Vehicle | 368 (23.2%) | 300 (47.0%) |
| 2 Vehicles | 691 (43.5%) | 145 (22.7%) |
| 3 or more Vehicles | 475 (29.9%) | 33 (5.2%) |
| Total | 1,589 (100.0%) | 638 (100.0%) |
Real Estate & Mortgages in Winterset
Real Estate and Mortgage Overview in Winterset
| Characteristic | Without Mortgage | With Mortgage |
| Housing Units | 478 | 1,111 |
| Median Property Value | $154,700 | $193,200 |
| Median Household Income | $44,464 | $182 |
| Monthly Housing Costs | $478 | $19 |
| Real Estate Taxes | $2,750 | $0 |
Property Value by Mortgage Status in Winterset
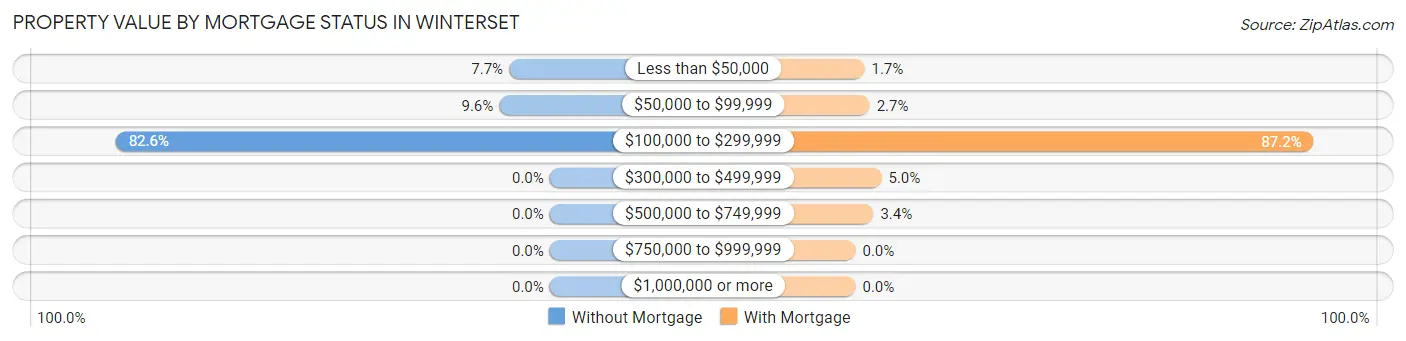
| Property Value | Without Mortgage | With Mortgage |
| Less than $50,000 | 37 (7.7%) | 19 (1.7%) |
| $50,000 to $99,999 | 46 (9.6%) | 30 (2.7%) |
| $100,000 to $299,999 | 395 (82.6%) | 969 (87.2%) |
| $300,000 to $499,999 | 0 (0.0%) | 55 (5.0%) |
| $500,000 to $749,999 | 0 (0.0%) | 38 (3.4%) |
| $750,000 to $999,999 | 0 (0.0%) | 0 (0.0%) |
| $1,000,000 or more | 0 (0.0%) | 0 (0.0%) |
| Total | 478 (100.0%) | 1,111 (100.0%) |
Household Income by Mortgage Status in Winterset
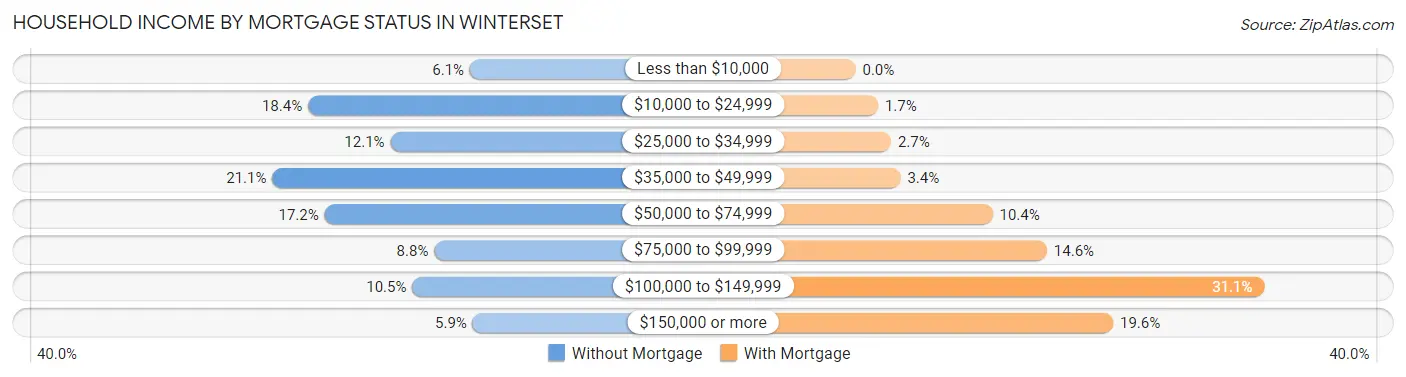
| Household Income | Without Mortgage | With Mortgage |
| Less than $10,000 | 29 (6.1%) | 0 (0.0%) |
| $10,000 to $24,999 | 88 (18.4%) | 19 (1.7%) |
| $25,000 to $34,999 | 58 (12.1%) | 30 (2.7%) |
| $35,000 to $49,999 | 101 (21.1%) | 38 (3.4%) |
| $50,000 to $74,999 | 82 (17.2%) | 116 (10.4%) |
| $75,000 to $99,999 | 42 (8.8%) | 162 (14.6%) |
| $100,000 to $149,999 | 50 (10.5%) | 346 (31.1%) |
| $150,000 or more | 28 (5.9%) | 218 (19.6%) |
| Total | 478 (100.0%) | 1,111 (100.0%) |
Property Value to Household Income Ratio in Winterset
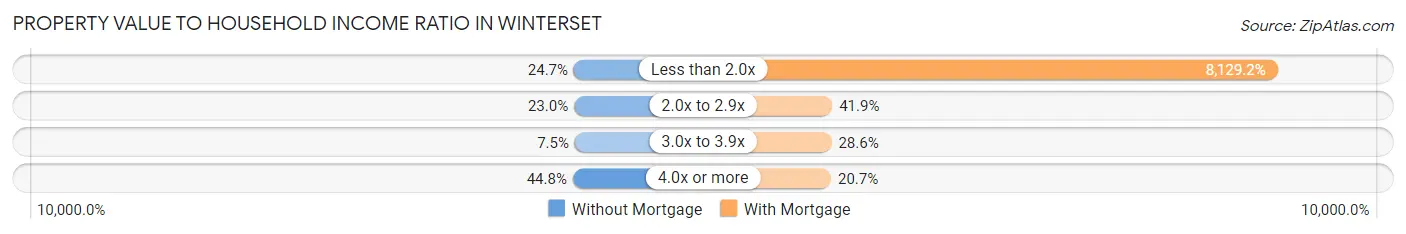
| Value-to-Income Ratio | Without Mortgage | With Mortgage |
| Less than 2.0x | 118 (24.7%) | 90,315 (8,129.2%) |
| 2.0x to 2.9x | 110 (23.0%) | 465 (41.8%) |
| 3.0x to 3.9x | 36 (7.5%) | 318 (28.6%) |
| 4.0x or more | 214 (44.8%) | 230 (20.7%) |
| Total | 478 (100.0%) | 1,111 (100.0%) |
Real Estate Taxes by Mortgage Status in Winterset
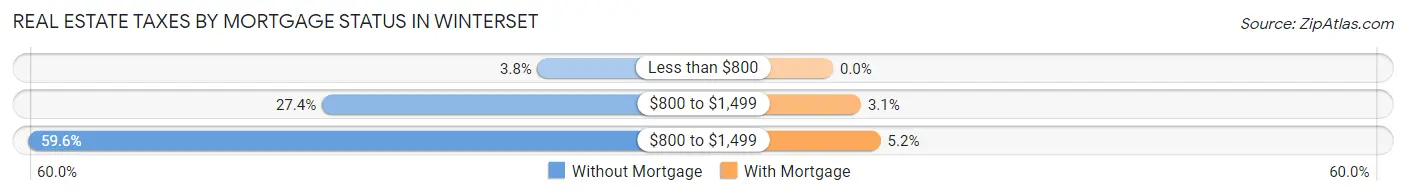
| Property Taxes | Without Mortgage | With Mortgage |
| Less than $800 | 18 (3.8%) | 0 (0.0%) |
| $800 to $1,499 | 131 (27.4%) | 34 (3.1%) |
| $800 to $1,499 | 285 (59.6%) | 58 (5.2%) |
| Total | 478 (100.0%) | 1,111 (100.0%) |
Health & Disability in Winterset
Health Insurance Coverage by Age in Winterset
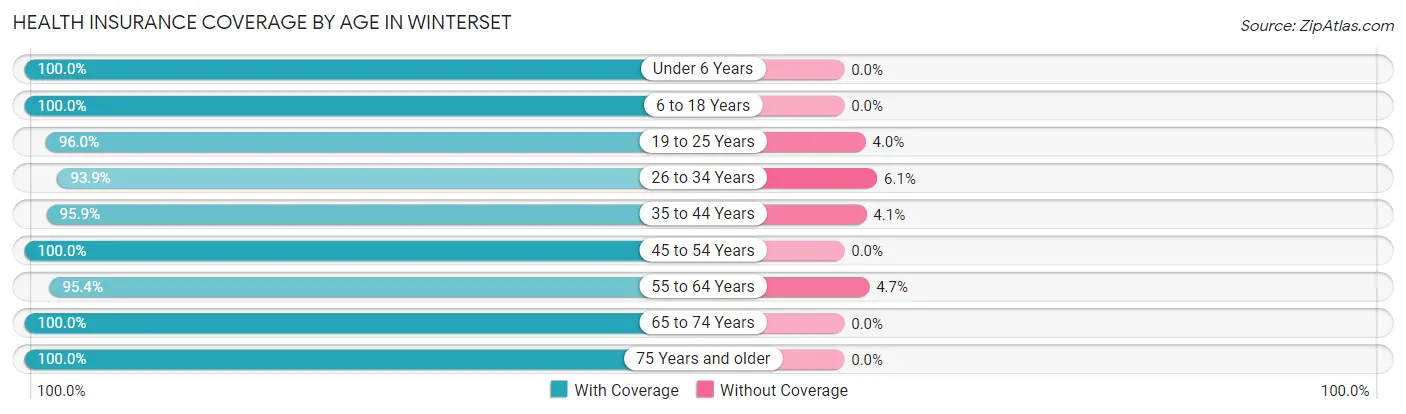
| Age Bracket | With Coverage | Without Coverage |
| Under 6 Years | 416 (100.0%) | 0 (0.0%) |
| 6 to 18 Years | 1,073 (100.0%) | 0 (0.0%) |
| 19 to 25 Years | 364 (96.0%) | 15 (4.0%) |
| 26 to 34 Years | 551 (93.9%) | 36 (6.1%) |
| 35 to 44 Years | 745 (95.9%) | 32 (4.1%) |
| 45 to 54 Years | 656 (100.0%) | 0 (0.0%) |
| 55 to 64 Years | 451 (95.4%) | 22 (4.6%) |
| 65 to 74 Years | 404 (100.0%) | 0 (0.0%) |
| 75 Years and older | 441 (100.0%) | 0 (0.0%) |
| Total | 5,101 (98.0%) | 105 (2.0%) |
Health Insurance Coverage by Citizenship Status in Winterset
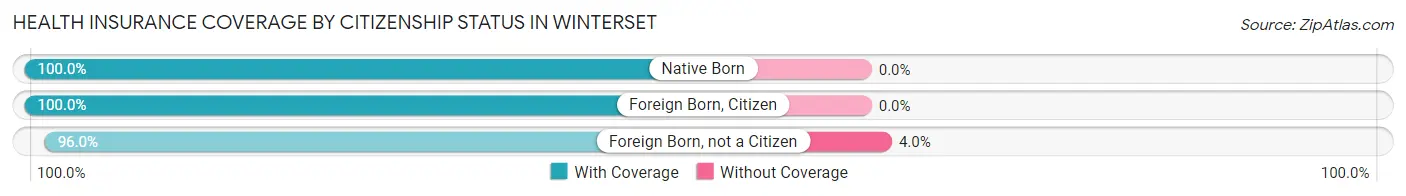
| Citizenship Status | With Coverage | Without Coverage |
| Native Born | 416 (100.0%) | 0 (0.0%) |
| Foreign Born, Citizen | 1,073 (100.0%) | 0 (0.0%) |
| Foreign Born, not a Citizen | 364 (96.0%) | 15 (4.0%) |
Health Insurance Coverage by Household Income in Winterset
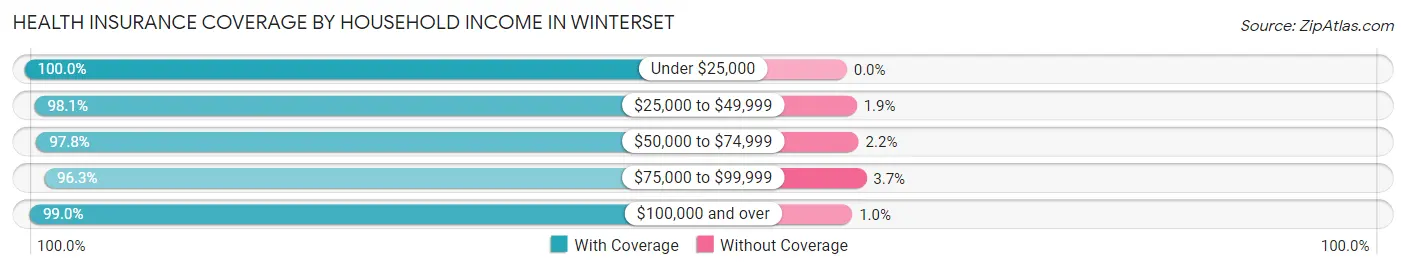
| Household Income | With Coverage | Without Coverage |
| Under $25,000 | 432 (100.0%) | 0 (0.0%) |
| $25,000 to $49,999 | 791 (98.1%) | 15 (1.9%) |
| $50,000 to $74,999 | 1,058 (97.8%) | 24 (2.2%) |
| $75,000 to $99,999 | 1,344 (96.3%) | 51 (3.7%) |
| $100,000 and over | 1,464 (99.0%) | 15 (1.0%) |
Public vs Private Health Insurance Coverage by Age in Winterset
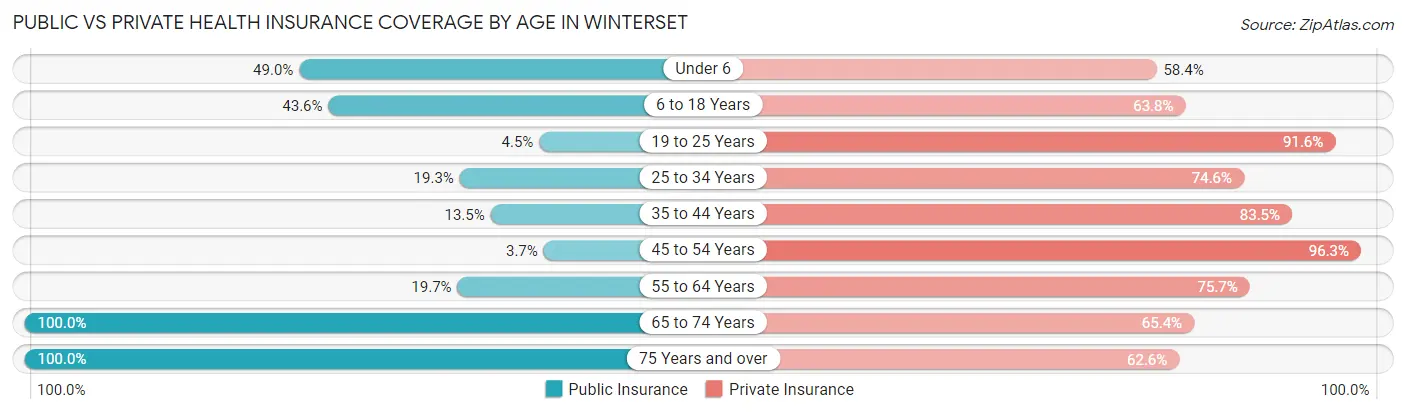
| Age Bracket | Public Insurance | Private Insurance |
| Under 6 | 204 (49.0%) | 243 (58.4%) |
| 6 to 18 Years | 468 (43.6%) | 684 (63.7%) |
| 19 to 25 Years | 17 (4.5%) | 347 (91.6%) |
| 25 to 34 Years | 113 (19.3%) | 438 (74.6%) |
| 35 to 44 Years | 105 (13.5%) | 649 (83.5%) |
| 45 to 54 Years | 24 (3.7%) | 632 (96.3%) |
| 55 to 64 Years | 93 (19.7%) | 358 (75.7%) |
| 65 to 74 Years | 404 (100.0%) | 264 (65.3%) |
| 75 Years and over | 441 (100.0%) | 276 (62.6%) |
| Total | 1,869 (35.9%) | 3,891 (74.7%) |
Disability Status by Sex by Age in Winterset
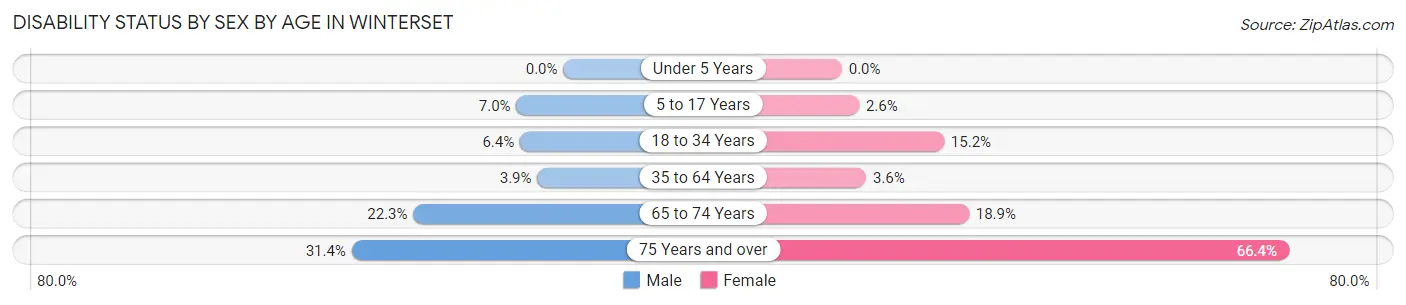
| Age Bracket | Male | Female |
| Under 5 Years | 0 (0.0%) | 0 (0.0%) |
| 5 to 17 Years | 42 (7.0%) | 15 (2.5%) |
| 18 to 34 Years | 33 (6.4%) | 69 (15.2%) |
| 35 to 64 Years | 35 (3.9%) | 36 (3.6%) |
| 65 to 74 Years | 51 (22.3%) | 33 (18.9%) |
| 75 Years and over | 33 (31.4%) | 223 (66.4%) |
Disability Class by Sex by Age in Winterset
Disability Class: Hearing Difficulty
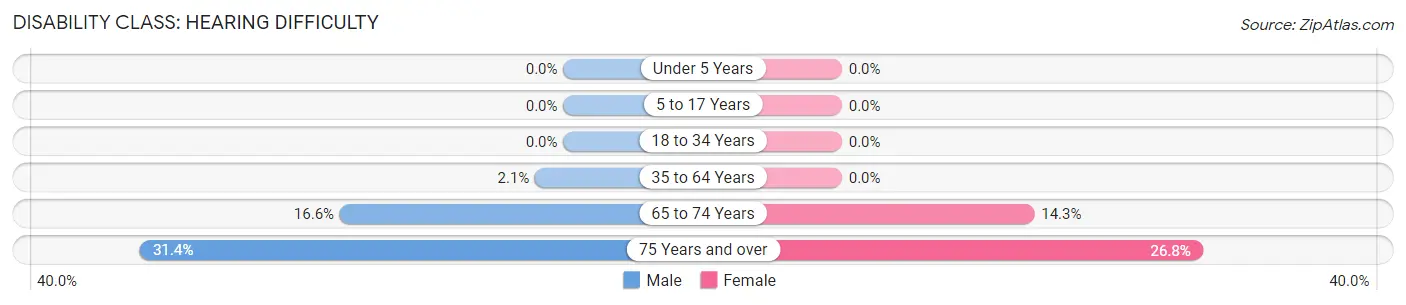
| Age Bracket | Male | Female |
| Under 5 Years | 0 (0.0%) | 0 (0.0%) |
| 5 to 17 Years | 0 (0.0%) | 0 (0.0%) |
| 18 to 34 Years | 0 (0.0%) | 0 (0.0%) |
| 35 to 64 Years | 19 (2.1%) | 0 (0.0%) |
| 65 to 74 Years | 38 (16.6%) | 25 (14.3%) |
| 75 Years and over | 33 (31.4%) | 90 (26.8%) |
Disability Class: Vision Difficulty
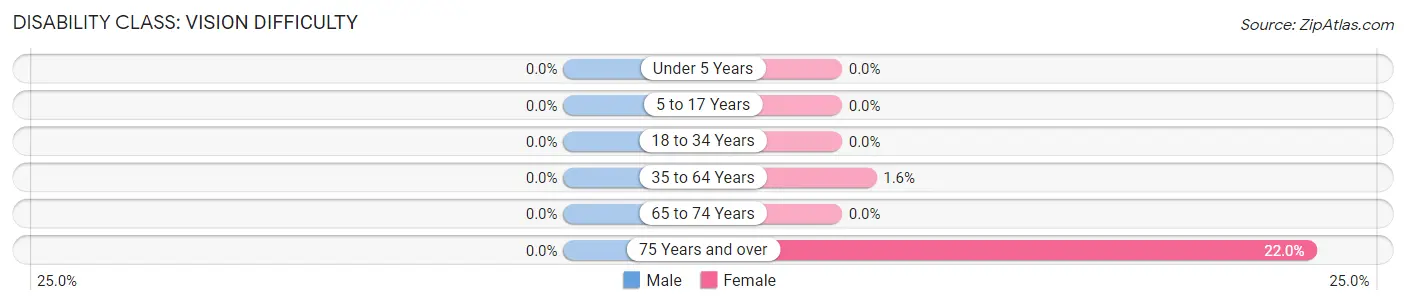
| Age Bracket | Male | Female |
| Under 5 Years | 0 (0.0%) | 0 (0.0%) |
| 5 to 17 Years | 0 (0.0%) | 0 (0.0%) |
| 18 to 34 Years | 0 (0.0%) | 0 (0.0%) |
| 35 to 64 Years | 0 (0.0%) | 16 (1.6%) |
| 65 to 74 Years | 0 (0.0%) | 0 (0.0%) |
| 75 Years and over | 0 (0.0%) | 74 (22.0%) |
Disability Class: Cognitive Difficulty
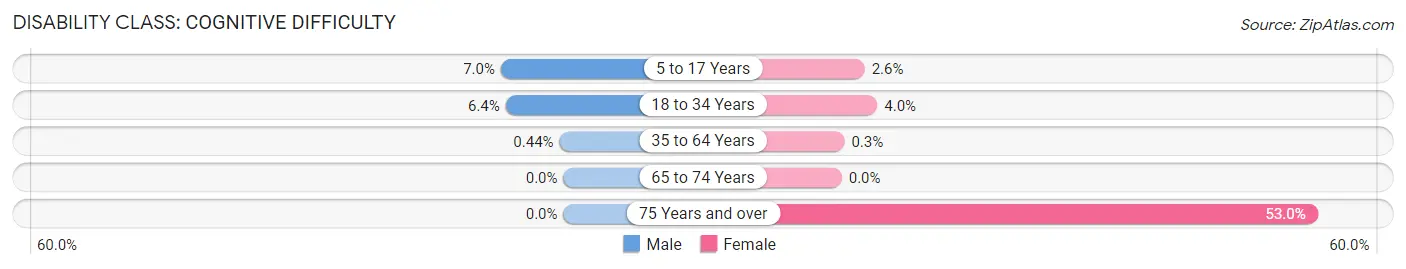
| Age Bracket | Male | Female |
| 5 to 17 Years | 42 (7.0%) | 15 (2.5%) |
| 18 to 34 Years | 33 (6.4%) | 18 (4.0%) |
| 35 to 64 Years | 4 (0.4%) | 3 (0.3%) |
| 65 to 74 Years | 0 (0.0%) | 0 (0.0%) |
| 75 Years and over | 0 (0.0%) | 178 (53.0%) |
Disability Class: Ambulatory Difficulty
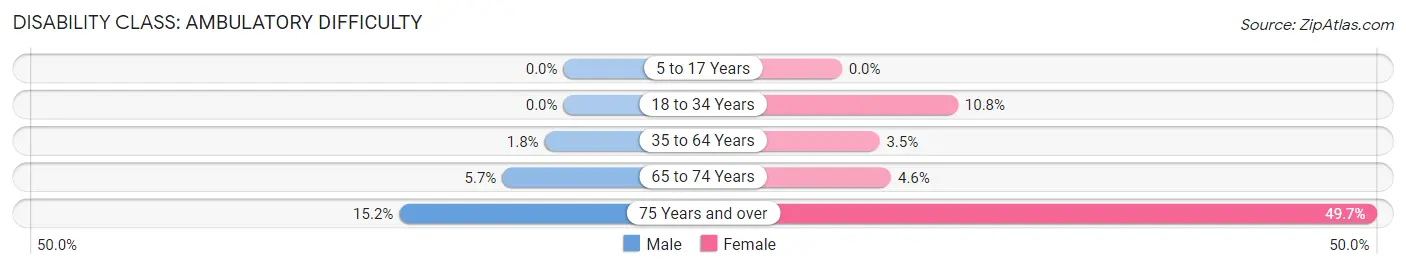
| Age Bracket | Male | Female |
| 5 to 17 Years | 0 (0.0%) | 0 (0.0%) |
| 18 to 34 Years | 0 (0.0%) | 49 (10.8%) |
| 35 to 64 Years | 16 (1.8%) | 35 (3.5%) |
| 65 to 74 Years | 13 (5.7%) | 8 (4.6%) |
| 75 Years and over | 16 (15.2%) | 167 (49.7%) |
Disability Class: Self-Care Difficulty
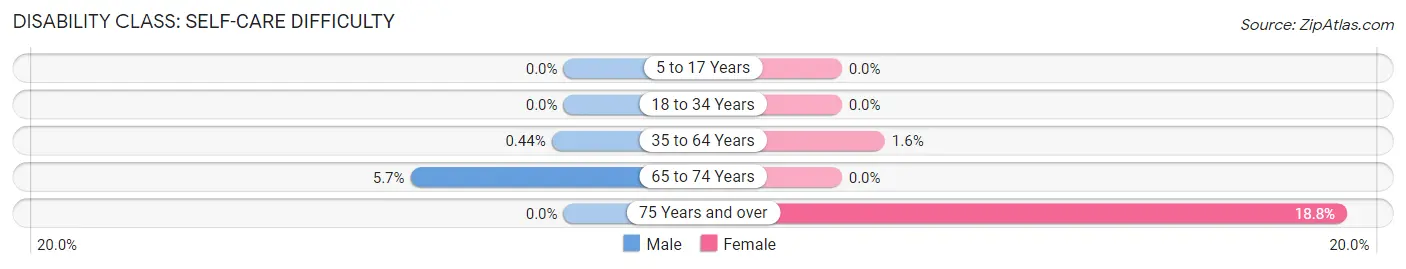
| Age Bracket | Male | Female |
| 5 to 17 Years | 0 (0.0%) | 0 (0.0%) |
| 18 to 34 Years | 0 (0.0%) | 0 (0.0%) |
| 35 to 64 Years | 4 (0.4%) | 16 (1.6%) |
| 65 to 74 Years | 13 (5.7%) | 0 (0.0%) |
| 75 Years and over | 0 (0.0%) | 63 (18.8%) |
Technology Access in Winterset
Computing Device Access in Winterset
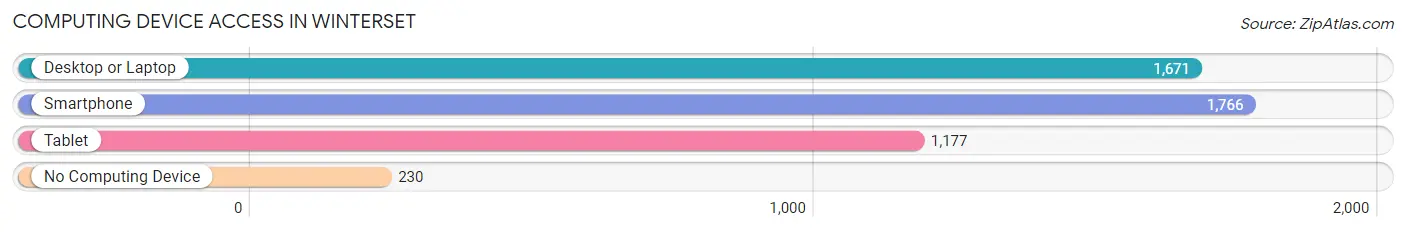
| Device Type | # Households | % Households |
| Desktop or Laptop | 1,671 | 75.0% |
| Smartphone | 1,766 | 79.3% |
| Tablet | 1,177 | 52.8% |
| No Computing Device | 230 | 10.3% |
| Total | 2,227 | 100.0% |
Internet Access in Winterset
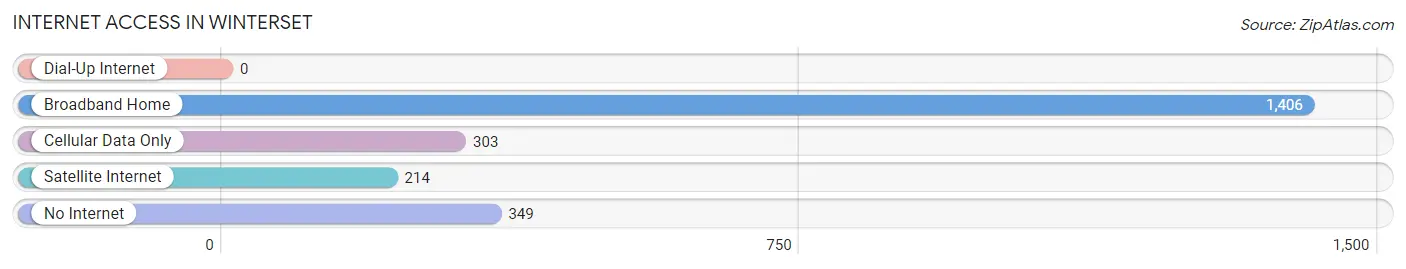
| Internet Type | # Households | % Households |
| Dial-Up Internet | 0 | 0.0% |
| Broadband Home | 1,406 | 63.1% |
| Cellular Data Only | 303 | 13.6% |
| Satellite Internet | 214 | 9.6% |
| No Internet | 349 | 15.7% |
| Total | 2,227 | 100.0% |
Winterset Summary
Winterset, Iowa is a small city located in Madison County, Iowa, United States. It is the county seat of Madison County and is located approximately 30 miles southwest of Des Moines. The population of Winterset was 5,190 at the 2010 census, an increase of 8.3% from the 2000 census.
History
The area that is now Winterset was first settled in 1849 by a group of settlers from Ohio. The town was originally named Madison City, but was later changed to Winterset in 1851. The name was chosen to honor the novel "Ivanhoe" by Sir Walter Scott, which was set in the fictional town of "Winterset".
The town was officially incorporated in 1853 and the first mayor was elected in 1854. In 1855, the first courthouse was built and the town began to grow. By the late 1800s, Winterset had become a thriving agricultural center and was home to several businesses, including a flour mill, a sawmill, a brickyard, and a furniture factory.
In the early 1900s, Winterset experienced a period of growth and prosperity. The town was home to several banks, a newspaper, a hotel, and a variety of other businesses. The town also had a thriving entertainment scene, with several theaters, a roller rink, and a movie theater.
Geography
Winterset is located at 41°17'45" North, 94°0'45" West (41.295833, -94.0125). According to the United States Census Bureau, the city has a total area of 4.2 square miles (10.8 km2), all of it land.
Economy
The economy of Winterset is largely based on agriculture. The town is home to several large farms, as well as several smaller family farms. The town is also home to several businesses, including a grocery store, a hardware store, a pharmacy, and several restaurants.
Demographics
As of the 2010 census, there were 5,190 people, 2,093 households, and 1,372 families residing in the city. The population density was 1,233.3 people per square mile (476.2/km2). There were 2,269 housing units at an average density of 545.2 per square mile (210.7/km2). The racial makeup of the city was 97.2% White, 0.7% African American, 0.2% Native American, 0.3% Asian, 0.2% from other races, and 1.4% from two or more races. Hispanic or Latino of any race were 1.2% of the population.
There were 2,093 households, out of which 30.2% had children under the age of 18 living with them, 49.2% were married couples living together, 11.2% had a female householder with no husband present, and 35.2% were non-families. 30.2% of all households were made up of individuals, and 14.7% had someone living alone who was 65 years of age or older. The average household size was 2.41 and the average family size was 2.98.
In the city, the population was spread out, with 25.2% under the age of 18, 7.2% from 18 to 24, 25.7% from 25 to 44, 22.7% from 45 to 64, and 19.2% who were 65 years of age or older. The median age was 39 years. For every 100 females, there were 91.2 males. For every 100 females age 18 and over, there were 87.2 males.
The median income for a household in the city was $37,917, and the median income for a family was $45,938. Males had a median income of $31,917 versus $22,917 for females. The per capita income for the city was $18,917. About 6.2% of families and 8.7% of the population were below the poverty line, including 10.7% of those under age 18 and 8.2% of those age 65 or over.
Common Questions
What is Per Capita Income in Winterset?
Per Capita income in Winterset is $32,191.
What is the Median Family Income in Winterset?
Median Family Income in Winterset is $82,206.
What is the Median Household income in Winterset?
Median Household Income in Winterset is $71,411.
What is Income or Wage Gap in Winterset?
Income or Wage Gap in Winterset is 28.9%.
Women in Winterset earn 71.1 cents for every dollar earned by a man.
What is Inequality or Gini Index in Winterset?
Inequality or Gini Index in Winterset is 0.37.
What is the Total Population of Winterset?
Total Population of Winterset is 5,366.
What is the Total Male Population of Winterset?
Total Male Population of Winterset is 2,530.
What is the Total Female Population of Winterset?
Total Female Population of Winterset is 2,836.
What is the Ratio of Males per 100 Females in Winterset?
There are 89.21 Males per 100 Females in Winterset.
What is the Ratio of Females per 100 Males in Winterset?
There are 112.09 Females per 100 Males in Winterset.
What is the Median Population Age in Winterset?
Median Population Age in Winterset is 36.9 Years.
What is the Average Family Size in Winterset
Average Family Size in Winterset is 3.2 People.
What is the Average Household Size in Winterset
Average Household Size in Winterset is 2.3 People.
How Large is the Labor Force in Winterset?
There are 2,824 People in the Labor Forcein in Winterset.
What is the Percentage of People in the Labor Force in Winterset?
69.9% of People are in the Labor Force in Winterset.
What is the Unemployment Rate in Winterset?
Unemployment Rate in Winterset is 1.1%.