Portsmouth, IA Map & Demographics
Portsmouth Map
Portsmouth Overview
$37,514
PER CAPITA INCOME
$91,000
AVG FAMILY INCOME
$78,125
AVG HOUSEHOLD INCOME
37.9%
WAGE / INCOME GAP [ % ]
62.1¢/ $1
WAGE / INCOME GAP [ $ ]
0.33
INEQUALITY / GINI INDEX
175
TOTAL POPULATION
82
MALE POPULATION
93
FEMALE POPULATION
88.17
MALES / 100 FEMALES
113.41
FEMALES / 100 MALES
50.5
MEDIAN AGE
2.6
AVG FAMILY SIZE
2.0
AVG HOUSEHOLD SIZE
108
LABOR FORCE [ PEOPLE ]
78.3%
PERCENT IN LABOR FORCE
Portsmouth Zip Codes
Portsmouth Area Codes
Income in Portsmouth
Income Overview in Portsmouth
Per Capita Income in Portsmouth is $37,514, while median incomes of families and households are $91,000 and $78,125 respectively.
| Characteristic | Number | Measure |
| Per Capita Income | 175 | $37,514 |
| Median Family Income | 50 | $91,000 |
| Mean Family Income | 50 | $98,988 |
| Median Household Income | 87 | $78,125 |
| Mean Household Income | 87 | $81,389 |
| Income Deficit | 50 | $0 |
| Wage / Income Gap (%) | 175 | 37.88% |
| Wage / Income Gap ($) | 175 | 62.12¢ per $1 |
| Gini / Inequality Index | 175 | 0.33 |
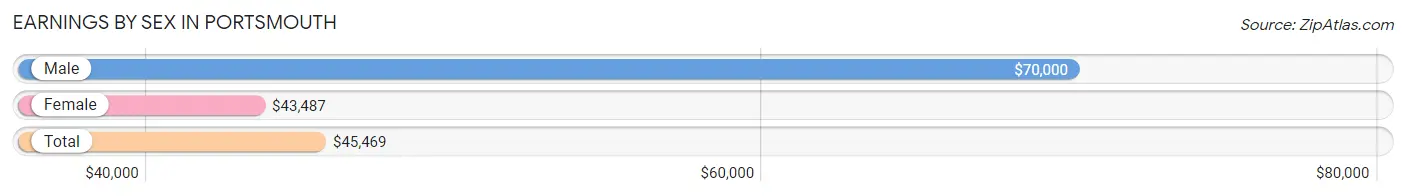
Earnings by Sex in Portsmouth
Average Earnings in Portsmouth are $45,469, $70,000 for men and $43,487 for women, a difference of 37.9%.
| Sex | Number | Average Earnings |
| Male | 56 (49.6%) | $70,000 |
| Female | 57 (50.4%) | $43,487 |
| Total | 113 (100.0%) | $45,469 |
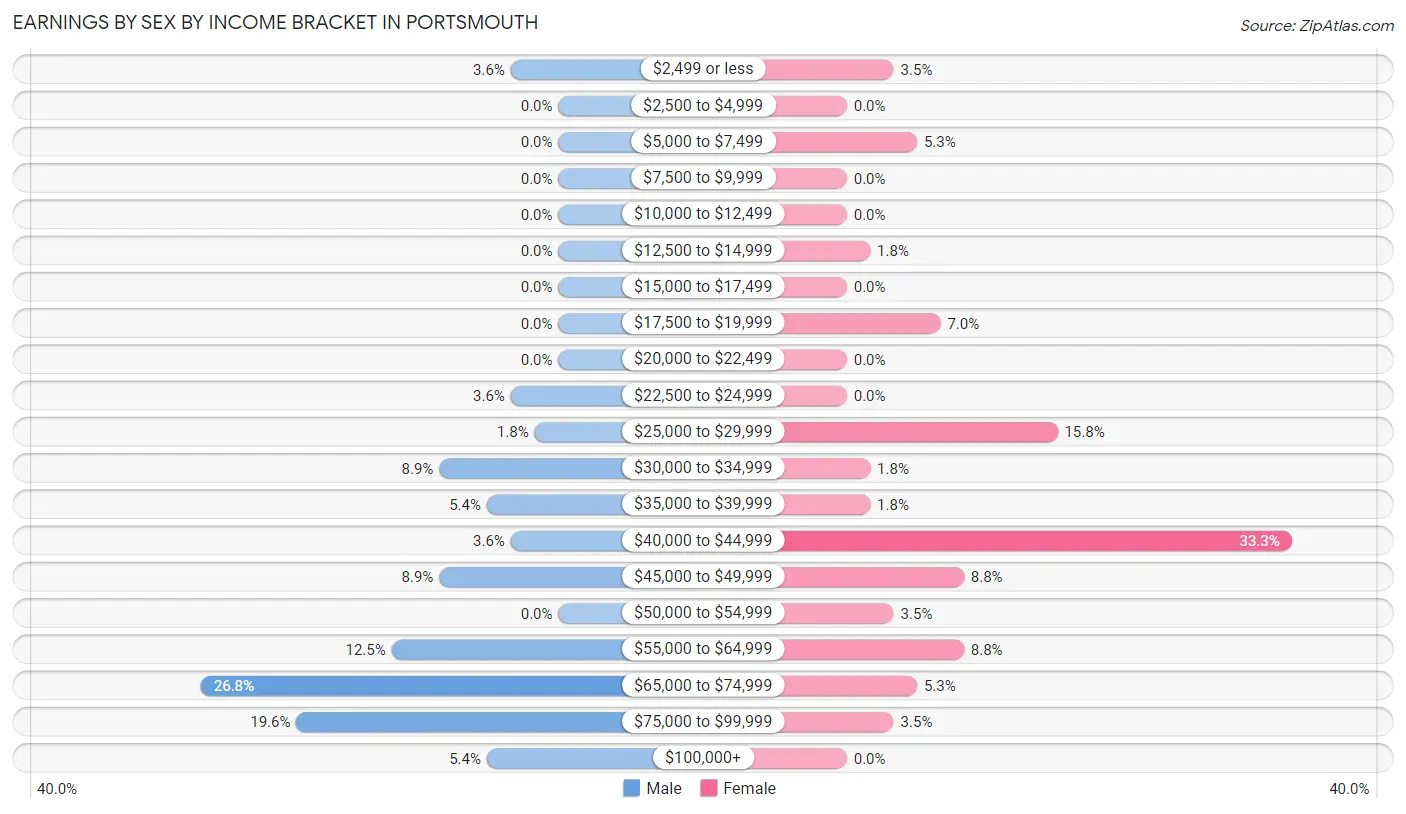
Earnings by Sex by Income Bracket in Portsmouth
The most common earnings brackets in Portsmouth are $65,000 to $74,999 for men (15 | 26.8%) and $40,000 to $44,999 for women (19 | 33.3%).
| Income | Male | Female |
| $2,499 or less | 2 (3.6%) | 2 (3.5%) |
| $2,500 to $4,999 | 0 (0.0%) | 0 (0.0%) |
| $5,000 to $7,499 | 0 (0.0%) | 3 (5.3%) |
| $7,500 to $9,999 | 0 (0.0%) | 0 (0.0%) |
| $10,000 to $12,499 | 0 (0.0%) | 0 (0.0%) |
| $12,500 to $14,999 | 0 (0.0%) | 1 (1.8%) |
| $15,000 to $17,499 | 0 (0.0%) | 0 (0.0%) |
| $17,500 to $19,999 | 0 (0.0%) | 4 (7.0%) |
| $20,000 to $22,499 | 0 (0.0%) | 0 (0.0%) |
| $22,500 to $24,999 | 2 (3.6%) | 0 (0.0%) |
| $25,000 to $29,999 | 1 (1.8%) | 9 (15.8%) |
| $30,000 to $34,999 | 5 (8.9%) | 1 (1.8%) |
| $35,000 to $39,999 | 3 (5.4%) | 1 (1.8%) |
| $40,000 to $44,999 | 2 (3.6%) | 19 (33.3%) |
| $45,000 to $49,999 | 5 (8.9%) | 5 (8.8%) |
| $50,000 to $54,999 | 0 (0.0%) | 2 (3.5%) |
| $55,000 to $64,999 | 7 (12.5%) | 5 (8.8%) |
| $65,000 to $74,999 | 15 (26.8%) | 3 (5.3%) |
| $75,000 to $99,999 | 11 (19.6%) | 2 (3.5%) |
| $100,000+ | 3 (5.4%) | 0 (0.0%) |
| Total | 56 (100.0%) | 57 (100.0%) |
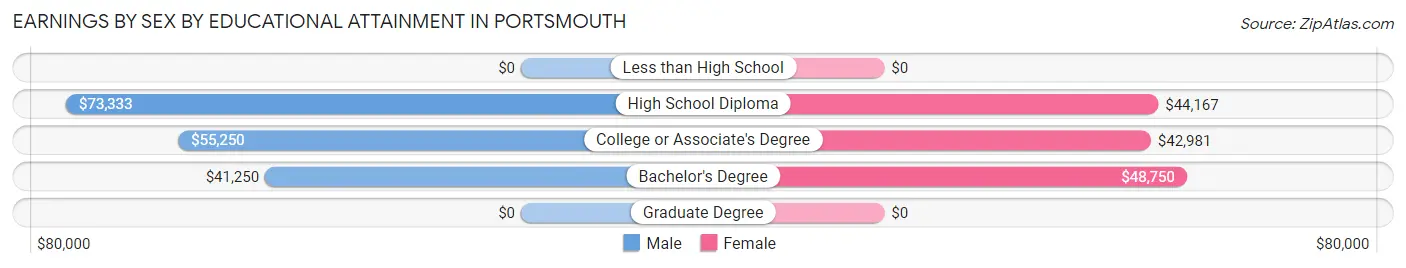
Earnings by Sex by Educational Attainment in Portsmouth
Average earnings in Portsmouth are $70,000 for men and $43,816 for women, a difference of 37.4%. Men with an educational attainment of high school diploma enjoy the highest average annual earnings of $73,333, while those with bachelor's degree education earn the least with $41,250. Women with an educational attainment of bachelor's degree earn the most with the average annual earnings of $48,750, while those with college or associate's degree education have the smallest earnings of $42,981.
| Educational Attainment | Male Income | Female Income |
| Less than High School | - | - |
| High School Diploma | $73,333 | $44,167 |
| College or Associate's Degree | $55,250 | $42,981 |
| Bachelor's Degree | $41,250 | $48,750 |
| Graduate Degree | - | - |
| Total | $70,000 | $43,816 |
Family Income in Portsmouth
Family Income Brackets in Portsmouth
According to the Portsmouth family income data, there are 18 families falling into the $75,000 to $99,999 income range, which is the most common income bracket and makes up 36.0% of all families.
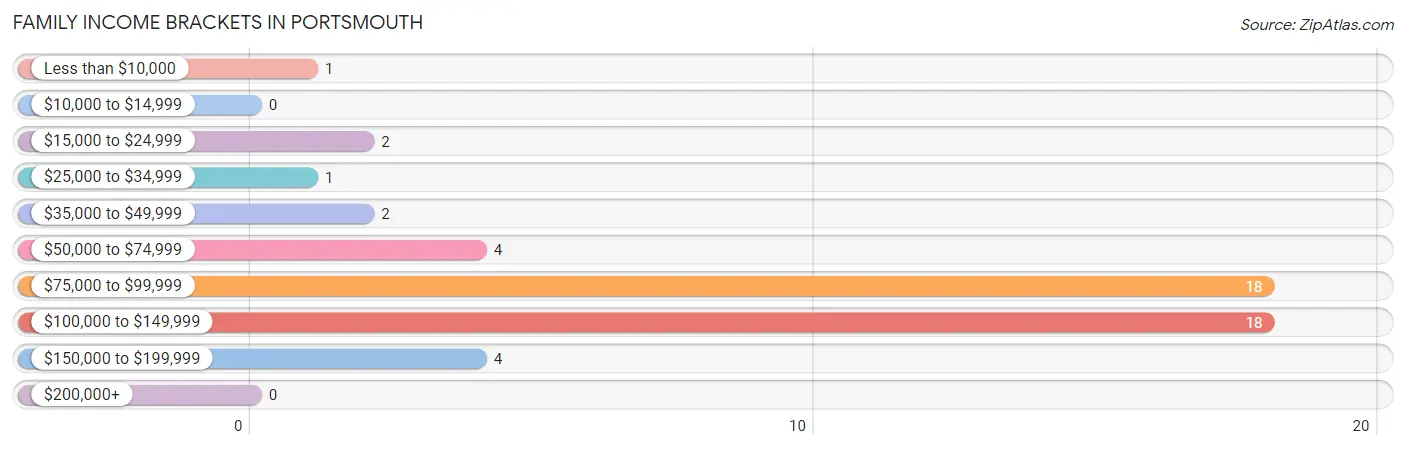
| Income Bracket | # Families | % Families |
| Less than $10,000 | 1 | 2.0% |
| $10,000 to $14,999 | 0 | 0.0% |
| $15,000 to $24,999 | 2 | 4.0% |
| $25,000 to $34,999 | 1 | 2.0% |
| $35,000 to $49,999 | 2 | 4.0% |
| $50,000 to $74,999 | 4 | 8.0% |
| $75,000 to $99,999 | 18 | 36.0% |
| $100,000 to $149,999 | 18 | 36.0% |
| $150,000 to $199,999 | 4 | 8.0% |
| $200,000+ | 0 | 0.0% |
Family Income by Famaliy Size in Portsmouth
2-person families (33 | 66.0%) account for the highest median family income in Portsmouth with $120,625 per family, while 2-person families (33 | 66.0%) have the highest median income of $60,312 per family member.
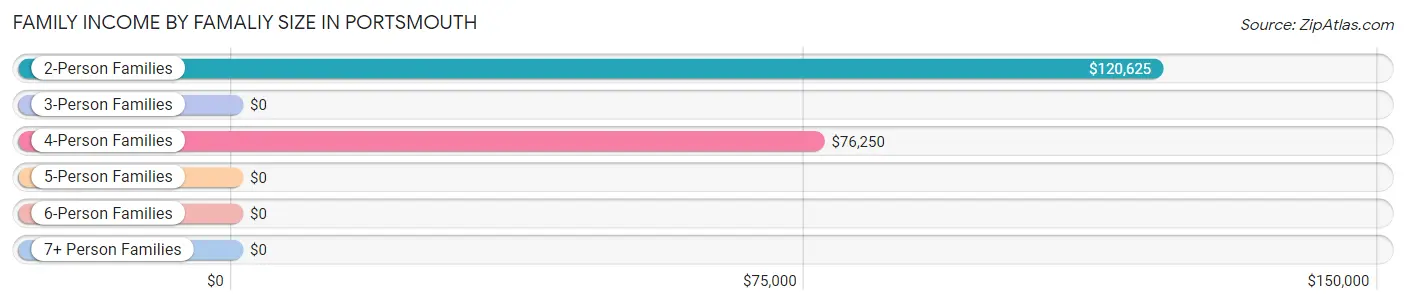
| Income Bracket | # Families | Median Income |
| 2-Person Families | 33 (66.0%) | $120,625 |
| 3-Person Families | 3 (6.0%) | $0 |
| 4-Person Families | 6 (12.0%) | $76,250 |
| 5-Person Families | 2 (4.0%) | $0 |
| 6-Person Families | 6 (12.0%) | $0 |
| 7+ Person Families | 0 (0.0%) | $0 |
| Total | 50 (100.0%) | $91,000 |
Family Income by Number of Earners in Portsmouth
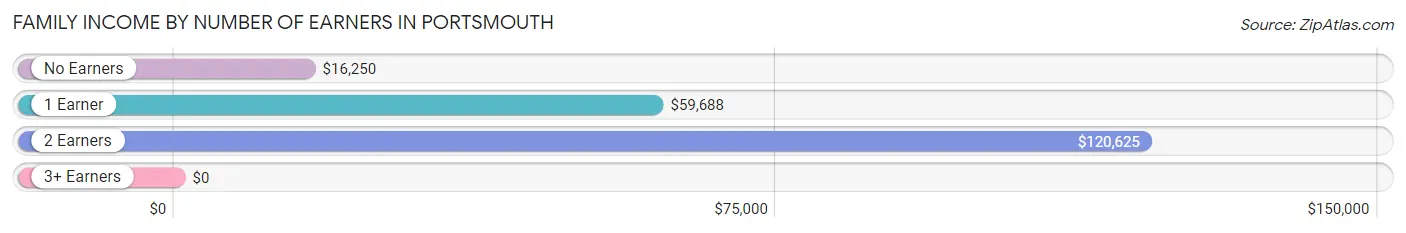
| Number of Earners | # Families | Median Income |
| No Earners | 3 (6.0%) | $16,250 |
| 1 Earner | 9 (18.0%) | $59,688 |
| 2 Earners | 37 (74.0%) | $120,625 |
| 3+ Earners | 1 (2.0%) | $0 |
| Total | 50 (100.0%) | $91,000 |
Household Income in Portsmouth
Household Income Brackets in Portsmouth
With 24 households falling in the category, the $100,000 to $149,999 income range is the most frequent in Portsmouth, accounting for 27.6% of all households.
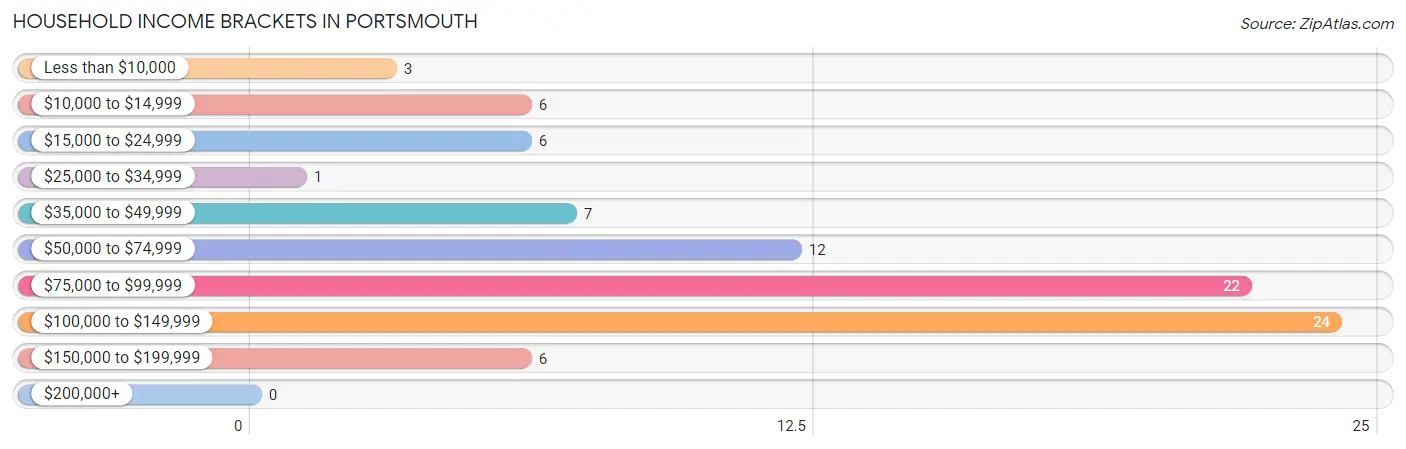
| Income Bracket | # Households | % Households |
| Less than $10,000 | 3 | 3.4% |
| $10,000 to $14,999 | 6 | 6.9% |
| $15,000 to $24,999 | 6 | 6.9% |
| $25,000 to $34,999 | 1 | 1.1% |
| $35,000 to $49,999 | 7 | 8.0% |
| $50,000 to $74,999 | 12 | 13.8% |
| $75,000 to $99,999 | 22 | 25.3% |
| $100,000 to $149,999 | 24 | 27.6% |
| $150,000 to $199,999 | 6 | 6.9% |
| $200,000+ | 0 | 0.0% |
Household Income by Householder Age in Portsmouth
The median household income in Portsmouth is $78,125, with the highest median household income of $113,125 found in the 45 to 64 years age bracket for the primary householder. A total of 41 households (47.1%) fall into this category.
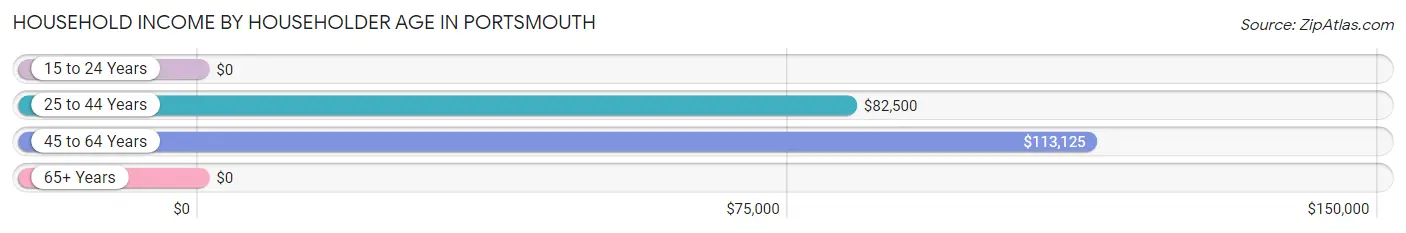
| Income Bracket | # Households | Median Income |
| 15 to 24 Years | 0 (0.0%) | $0 |
| 25 to 44 Years | 22 (25.3%) | $82,500 |
| 45 to 64 Years | 41 (47.1%) | $113,125 |
| 65+ Years | 24 (27.6%) | $0 |
| Total | 87 (100.0%) | $78,125 |
Poverty in Portsmouth
Income Below Poverty by Sex and Age in Portsmouth
With 11.0% poverty level for males and 3.2% for females among the residents of Portsmouth, 75 year old and over males and 75 year old and over females are the most vulnerable to poverty, with 7 males (87.5%) and 3 females (60.0%) in their respective age groups living below the poverty level.
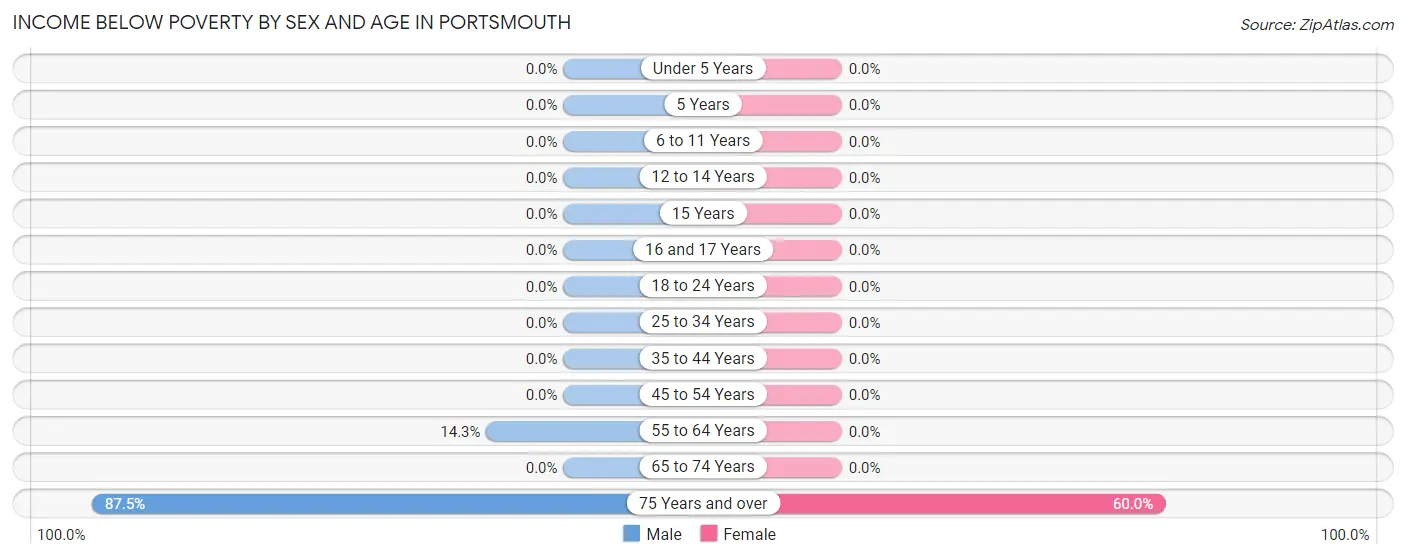
| Age Bracket | Male | Female |
| Under 5 Years | 0 (0.0%) | 0 (0.0%) |
| 5 Years | 0 (0.0%) | 0 (0.0%) |
| 6 to 11 Years | 0 (0.0%) | 0 (0.0%) |
| 12 to 14 Years | 0 (0.0%) | 0 (0.0%) |
| 15 Years | 0 (0.0%) | 0 (0.0%) |
| 16 and 17 Years | 0 (0.0%) | 0 (0.0%) |
| 18 to 24 Years | 0 (0.0%) | 0 (0.0%) |
| 25 to 34 Years | 0 (0.0%) | 0 (0.0%) |
| 35 to 44 Years | 0 (0.0%) | 0 (0.0%) |
| 45 to 54 Years | 0 (0.0%) | 0 (0.0%) |
| 55 to 64 Years | 2 (14.3%) | 0 (0.0%) |
| 65 to 74 Years | 0 (0.0%) | 0 (0.0%) |
| 75 Years and over | 7 (87.5%) | 3 (60.0%) |
| Total | 9 (11.0%) | 3 (3.2%) |
Income Above Poverty by Sex and Age in Portsmouth
According to the poverty statistics in Portsmouth, males aged under 5 years and females aged under 5 years are the age groups that are most secure financially, with 100.0% of males and 100.0% of females in these age groups living above the poverty line.
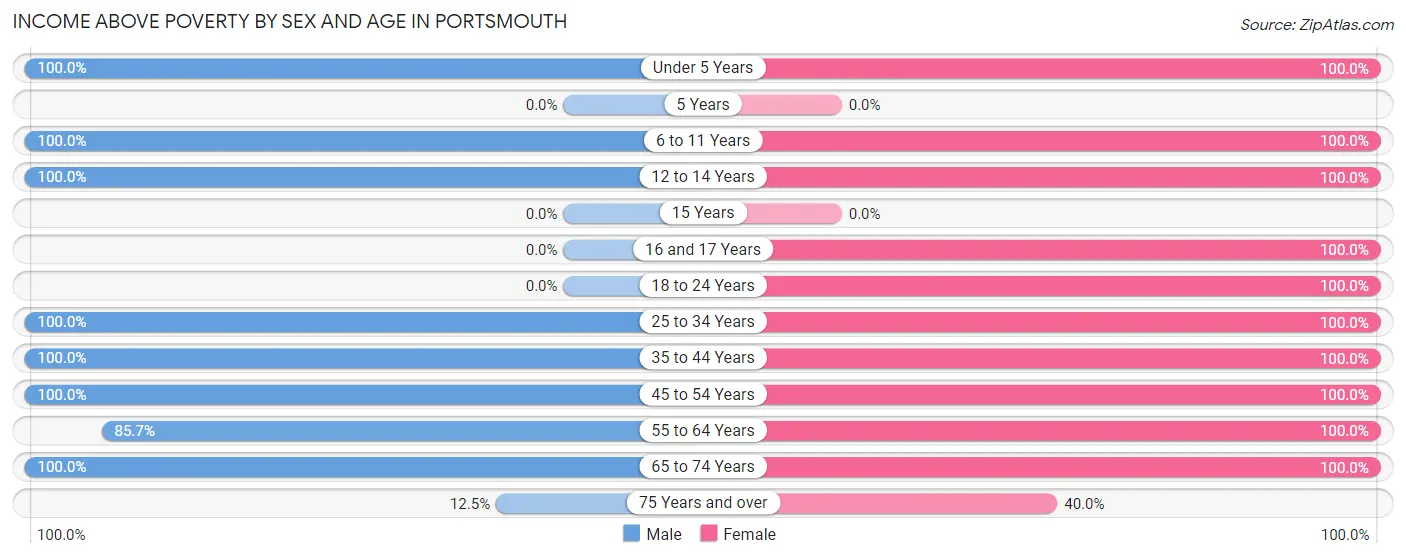
| Age Bracket | Male | Female |
| Under 5 Years | 6 (100.0%) | 10 (100.0%) |
| 5 Years | 0 (0.0%) | 0 (0.0%) |
| 6 to 11 Years | 6 (100.0%) | 10 (100.0%) |
| 12 to 14 Years | 2 (100.0%) | 3 (100.0%) |
| 15 Years | 0 (0.0%) | 0 (0.0%) |
| 16 and 17 Years | 0 (0.0%) | 2 (100.0%) |
| 18 to 24 Years | 0 (0.0%) | 3 (100.0%) |
| 25 to 34 Years | 15 (100.0%) | 14 (100.0%) |
| 35 to 44 Years | 7 (100.0%) | 4 (100.0%) |
| 45 to 54 Years | 7 (100.0%) | 16 (100.0%) |
| 55 to 64 Years | 12 (85.7%) | 20 (100.0%) |
| 65 to 74 Years | 17 (100.0%) | 6 (100.0%) |
| 75 Years and over | 1 (12.5%) | 2 (40.0%) |
| Total | 73 (89.0%) | 90 (96.8%) |
Income Below Poverty Among Married-Couple Families in Portsmouth
The poverty statistics for married-couple families in Portsmouth show that 4.6% or 2 of the total 43 families live below the poverty line. Families with no children have the highest poverty rate of 7.7%, comprising of 2 families. On the other hand, families with 1 or 2 children have the lowest poverty rate of 0.0%, which includes 0 families.
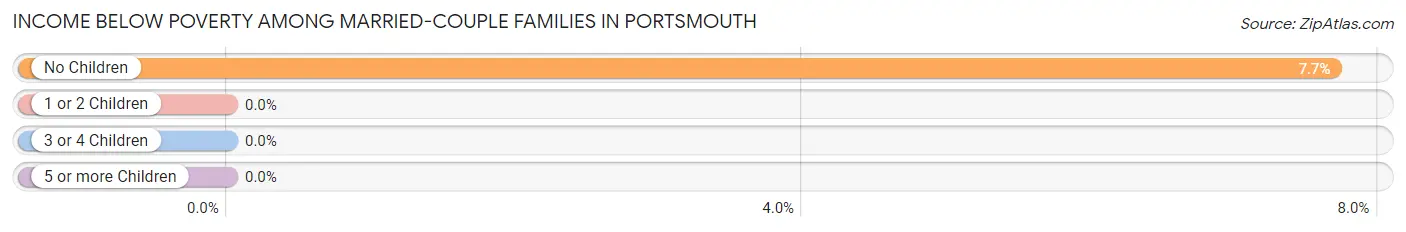
| Children | Above Poverty | Below Poverty |
| No Children | 24 (92.3%) | 2 (7.7%) |
| 1 or 2 Children | 9 (100.0%) | 0 (0.0%) |
| 3 or 4 Children | 8 (100.0%) | 0 (0.0%) |
| 5 or more Children | 0 (0.0%) | 0 (0.0%) |
| Total | 41 (95.4%) | 2 (4.6%) |
Income Below Poverty Among Single-Parent Households in Portsmouth
| Children | Single Father | Single Mother |
| No Children | 0 (0.0%) | 0 (0.0%) |
| 1 or 2 Children | 0 (0.0%) | 0 (0.0%) |
| 3 or 4 Children | 0 (0.0%) | 0 (0.0%) |
| 5 or more Children | 0 (0.0%) | 0 (0.0%) |
| Total | 0 (0.0%) | 0 (0.0%) |
Income Below Poverty Among Married-Couple vs Single-Parent Households in Portsmouth
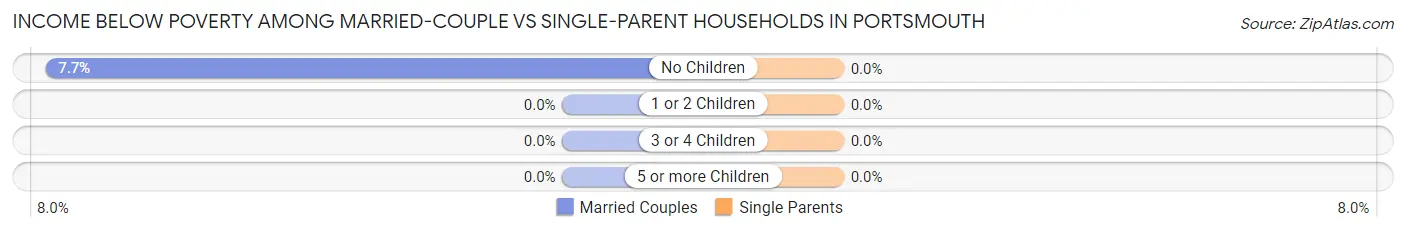
| Children | Married-Couple Families | Single-Parent Households |
| No Children | 2 (7.7%) | 0 (0.0%) |
| 1 or 2 Children | 0 (0.0%) | 0 (0.0%) |
| 3 or 4 Children | 0 (0.0%) | 0 (0.0%) |
| 5 or more Children | 0 (0.0%) | 0 (0.0%) |
| Total | 2 (4.6%) | 0 (0.0%) |
Race in Portsmouth
The most populous races in Portsmouth are White / Caucasian (166 | 94.9%), and Two or more Races (9 | 5.1%).
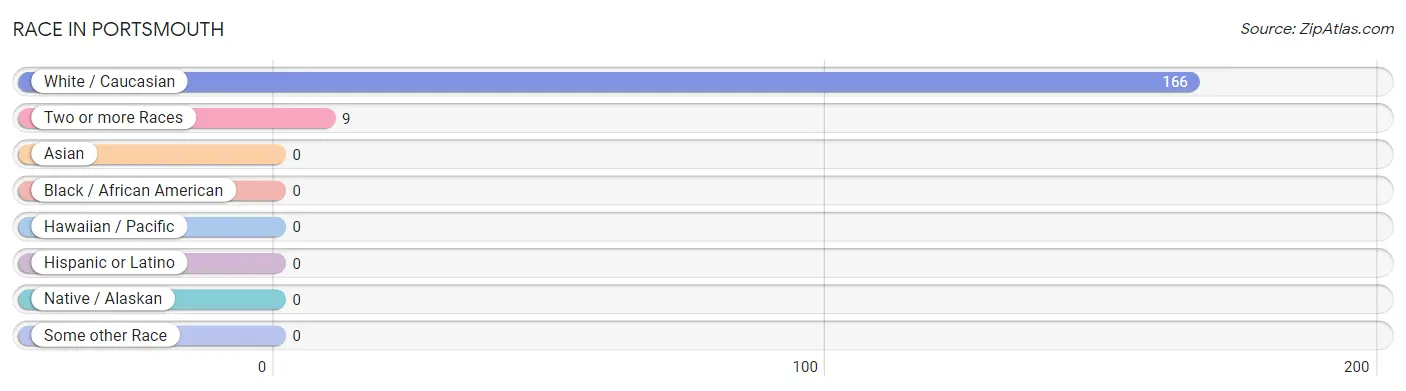
| Race | # Population | % Population |
| Asian | 0 | 0.0% |
| Black / African American | 0 | 0.0% |
| Hawaiian / Pacific | 0 | 0.0% |
| Hispanic or Latino | 0 | 0.0% |
| Native / Alaskan | 0 | 0.0% |
| White / Caucasian | 166 | 94.9% |
| Two or more Races | 9 | 5.1% |
| Some other Race | 0 | 0.0% |
| Total | 175 | 100.0% |
Ancestry in Portsmouth
The most populous ancestries reported in Portsmouth are German (93 | 53.1%), Irish (25 | 14.3%), American (11 | 6.3%), Hungarian (11 | 6.3%), and English (8 | 4.6%), together accounting for 84.6% of all Portsmouth residents.
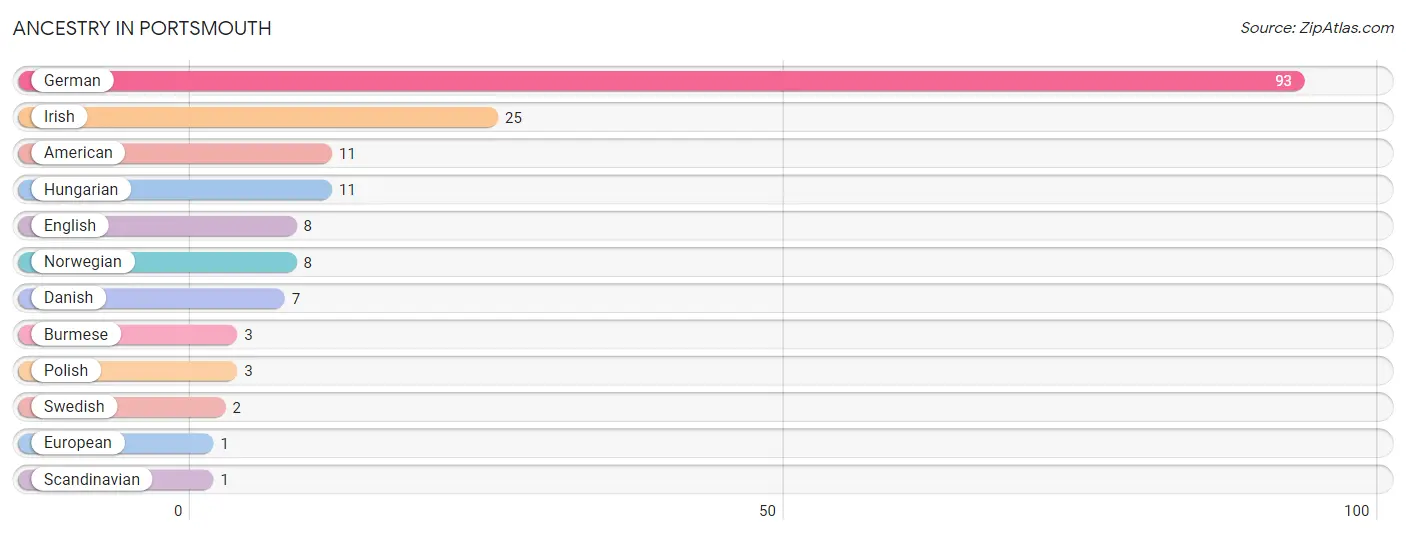
| Ancestry | # Population | % Population |
| American | 11 | 6.3% |
| Burmese | 3 | 1.7% |
| Danish | 7 | 4.0% |
| English | 8 | 4.6% |
| European | 1 | 0.6% |
| German | 93 | 53.1% |
| Hungarian | 11 | 6.3% |
| Irish | 25 | 14.3% |
| Norwegian | 8 | 4.6% |
| Polish | 3 | 1.7% |
| Scandinavian | 1 | 0.6% |
| Swedish | 2 | 1.1% | View All 12 Rows |
Immigrants in Portsmouth

| Immigration Origin | # Population | % Population | View All 0 Rows |
Sex and Age in Portsmouth
Sex and Age in Portsmouth
The most populous age groups in Portsmouth are 65 to 69 Years (14 | 17.1%) for men and 55 to 59 Years (14 | 15.0%) for women.
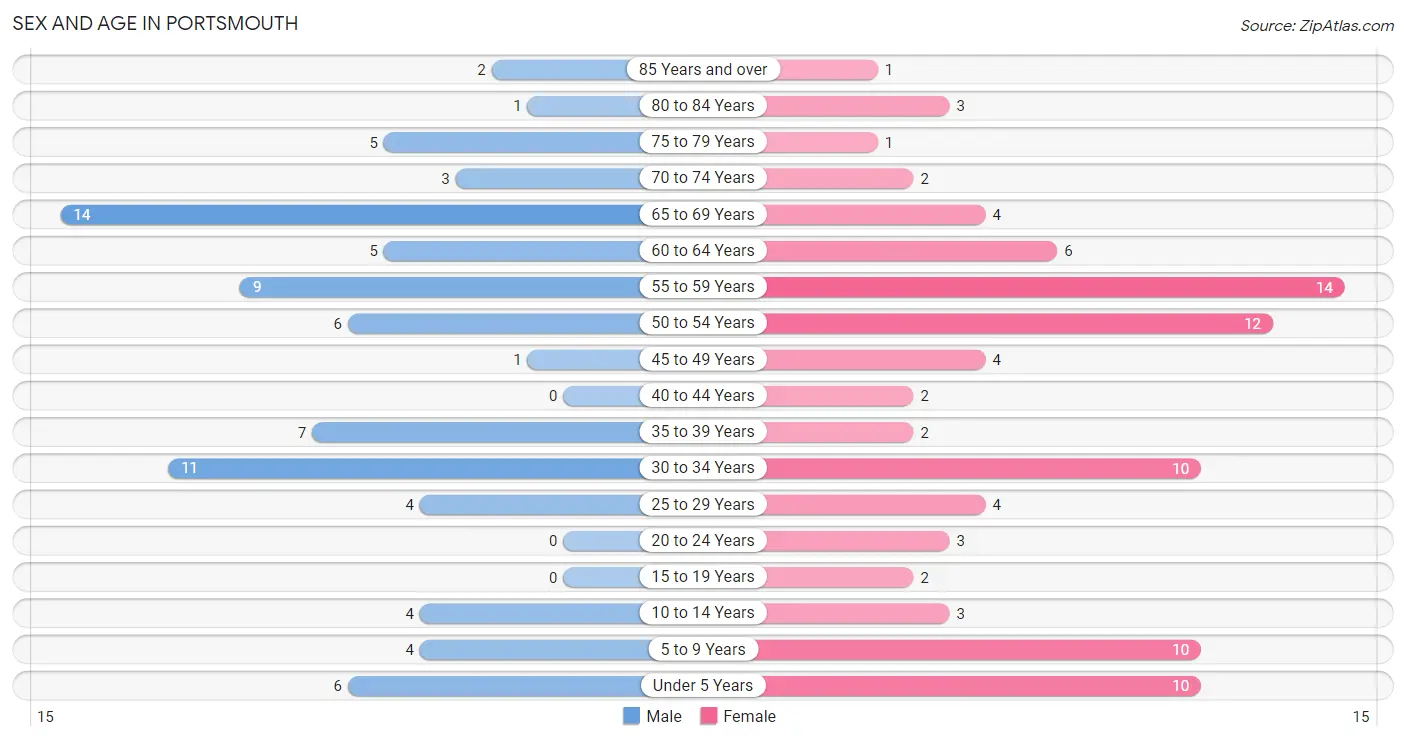
| Age Bracket | Male | Female |
| Under 5 Years | 6 (7.3%) | 10 (10.7%) |
| 5 to 9 Years | 4 (4.9%) | 10 (10.7%) |
| 10 to 14 Years | 4 (4.9%) | 3 (3.2%) |
| 15 to 19 Years | 0 (0.0%) | 2 (2.1%) |
| 20 to 24 Years | 0 (0.0%) | 3 (3.2%) |
| 25 to 29 Years | 4 (4.9%) | 4 (4.3%) |
| 30 to 34 Years | 11 (13.4%) | 10 (10.7%) |
| 35 to 39 Years | 7 (8.5%) | 2 (2.1%) |
| 40 to 44 Years | 0 (0.0%) | 2 (2.1%) |
| 45 to 49 Years | 1 (1.2%) | 4 (4.3%) |
| 50 to 54 Years | 6 (7.3%) | 12 (12.9%) |
| 55 to 59 Years | 9 (11.0%) | 14 (15.0%) |
| 60 to 64 Years | 5 (6.1%) | 6 (6.5%) |
| 65 to 69 Years | 14 (17.1%) | 4 (4.3%) |
| 70 to 74 Years | 3 (3.7%) | 2 (2.1%) |
| 75 to 79 Years | 5 (6.1%) | 1 (1.1%) |
| 80 to 84 Years | 1 (1.2%) | 3 (3.2%) |
| 85 Years and over | 2 (2.4%) | 1 (1.1%) |
| Total | 82 (100.0%) | 93 (100.0%) |
Families and Households in Portsmouth
Median Family Size in Portsmouth
The median family size in Portsmouth is 2.60 persons per family, with married-couple families (43 | 86.0%) accounting for the largest median family size of 2.74 persons per family. On the other hand, single female/mother families (5 | 10.0%) represent the smallest median family size with 1.60 persons per family.
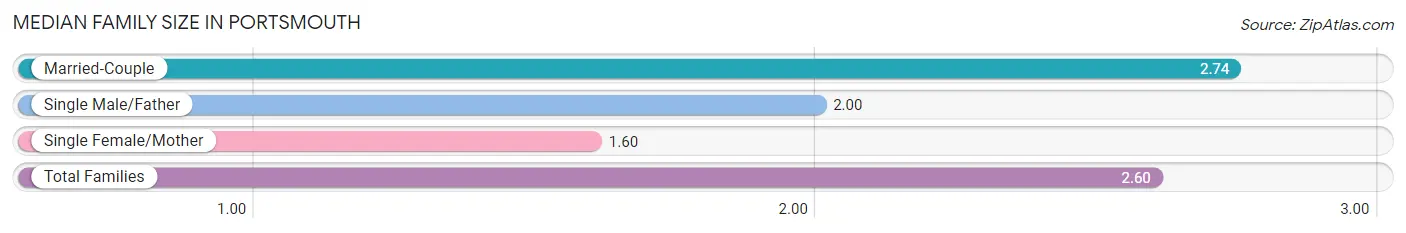
| Family Type | # Families | Family Size |
| Married-Couple | 43 (86.0%) | 2.74 |
| Single Male/Father | 2 (4.0%) | 2.00 |
| Single Female/Mother | 5 (10.0%) | 1.60 |
| Total Families | 50 (100.0%) | 2.60 |
Median Household Size in Portsmouth
The median household size in Portsmouth is 2.01 persons per household, with married-couple households (43 | 49.4%) accounting for the largest median household size of 2.74 persons per household. non-family households (37 | 42.5%) represent the smallest median household size with 1.22 persons per household.
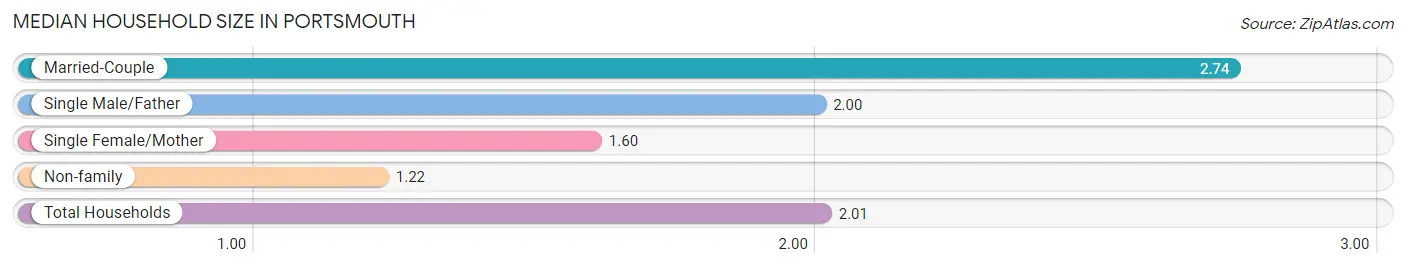
| Household Type | # Households | Household Size |
| Married-Couple | 43 (49.4%) | 2.74 |
| Single Male/Father | 2 (2.3%) | 2.00 |
| Single Female/Mother | 5 (5.8%) | 1.60 |
| Non-family | 37 (42.5%) | 1.22 |
| Total Households | 87 (100.0%) | 2.01 |
Household Size by Marriage Status in Portsmouth
Out of a total of 87 households in Portsmouth, 50 (57.5%) are family households, while 37 (42.5%) are nonfamily households. The most numerous type of family households are 2-person households, comprising 33, and the most common type of nonfamily households are 1-person households, comprising 28.
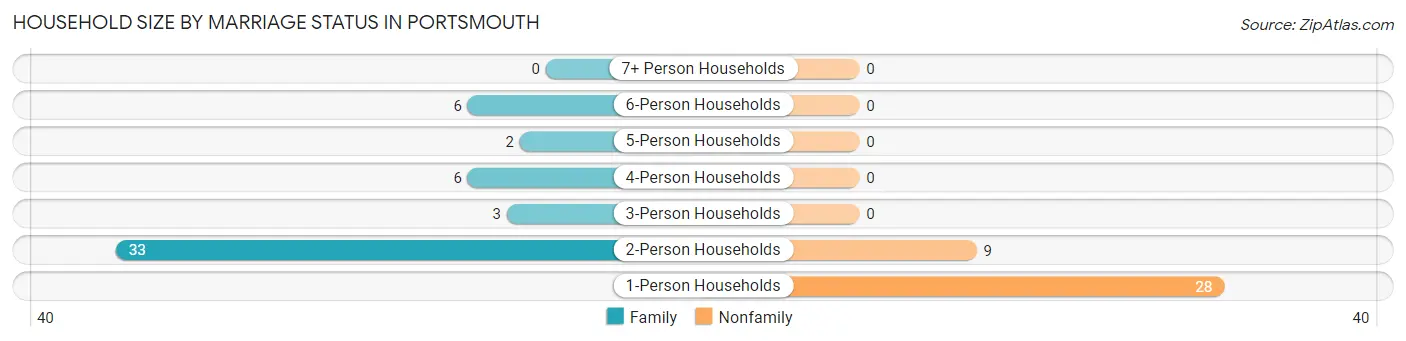
| Household Size | Family Households | Nonfamily Households |
| 1-Person Households | - | 28 (32.2%) |
| 2-Person Households | 33 (37.9%) | 9 (10.3%) |
| 3-Person Households | 3 (3.5%) | 0 (0.0%) |
| 4-Person Households | 6 (6.9%) | 0 (0.0%) |
| 5-Person Households | 2 (2.3%) | 0 (0.0%) |
| 6-Person Households | 6 (6.9%) | 0 (0.0%) |
| 7+ Person Households | 0 (0.0%) | 0 (0.0%) |
| Total | 50 (57.5%) | 37 (42.5%) |
Female Fertility in Portsmouth
Fertility by Age in Portsmouth
| Age Bracket | Women with Births | Births / 1,000 Women |
| 15 to 19 years | 0 (0.0%) | 0.0 |
| 20 to 34 years | 0 (0.0%) | 0.0 |
| 35 to 50 years | 0 (0.0%) | 0.0 |
| Total | 0 (0.0%) | 0.0 |
Fertility by Age by Marriage Status in Portsmouth
| Age Bracket | Married | Unmarried |
| 15 to 19 years | 0 (0.0%) | 0 (0.0%) |
| 20 to 34 years | 0 (0.0%) | 0 (0.0%) |
| 35 to 50 years | 0 (0.0%) | 0 (0.0%) |
| Total | 0 (0.0%) | 0 (0.0%) |
Fertility by Education in Portsmouth
| Educational Attainment | Women with Births | Births / 1,000 Women |
| Less than High School | 0 (0.0%) | 0.0 |
| High School Diploma | 0 (0.0%) | 0.0 |
| College or Associate's Degree | 0 (0.0%) | 0.0 |
| Bachelor's Degree | 0 (0.0%) | 0.0 |
| Graduate Degree | 0 (0.0%) | 0.0 |
| Total | 0 (0.0%) | 0.0 |
Fertility by Education by Marriage Status in Portsmouth
| Educational Attainment | Married | Unmarried |
| Less than High School | 0 (0.0%) | 0 (0.0%) |
| High School Diploma | 0 (0.0%) | 0 (0.0%) |
| College or Associate's Degree | 0 (0.0%) | 0 (0.0%) |
| Bachelor's Degree | 0 (0.0%) | 0 (0.0%) |
| Graduate Degree | 0 (0.0%) | 0 (0.0%) |
| Total | 0 (0.0%) | 0 (0.0%) |
Employment Characteristics in Portsmouth
Employment by Class of Employer in Portsmouth
Among the 108 employed individuals in Portsmouth, private company employees (61 | 56.5%), local government employees (18 | 16.7%), and self-employed (not incorporated) (10 | 9.3%) make up the most common classes of employment.
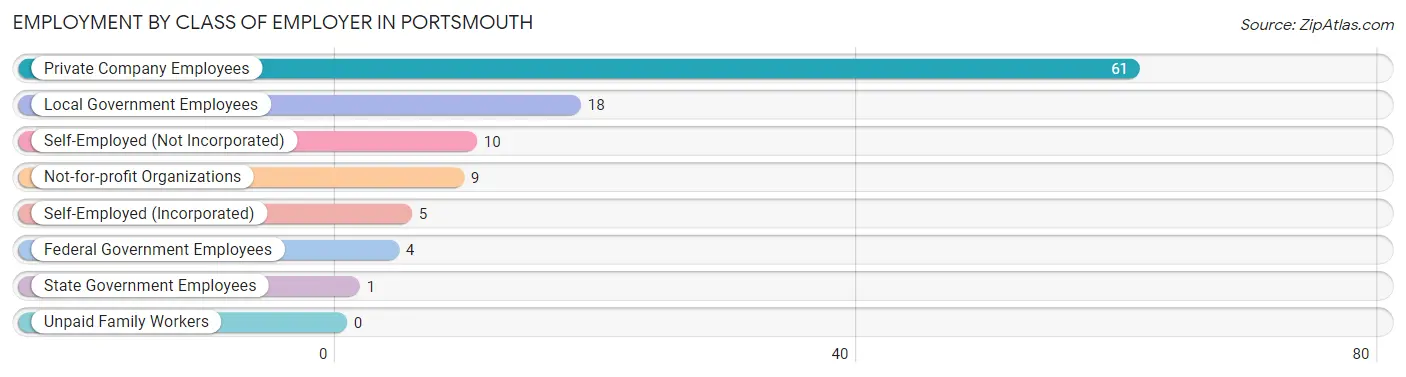
| Employer Class | # Employees | % Employees |
| Private Company Employees | 61 | 56.5% |
| Self-Employed (Incorporated) | 5 | 4.6% |
| Self-Employed (Not Incorporated) | 10 | 9.3% |
| Not-for-profit Organizations | 9 | 8.3% |
| Local Government Employees | 18 | 16.7% |
| State Government Employees | 1 | 0.9% |
| Federal Government Employees | 4 | 3.7% |
| Unpaid Family Workers | 0 | 0.0% |
| Total | 108 | 100.0% |
Employment Status by Age in Portsmouth
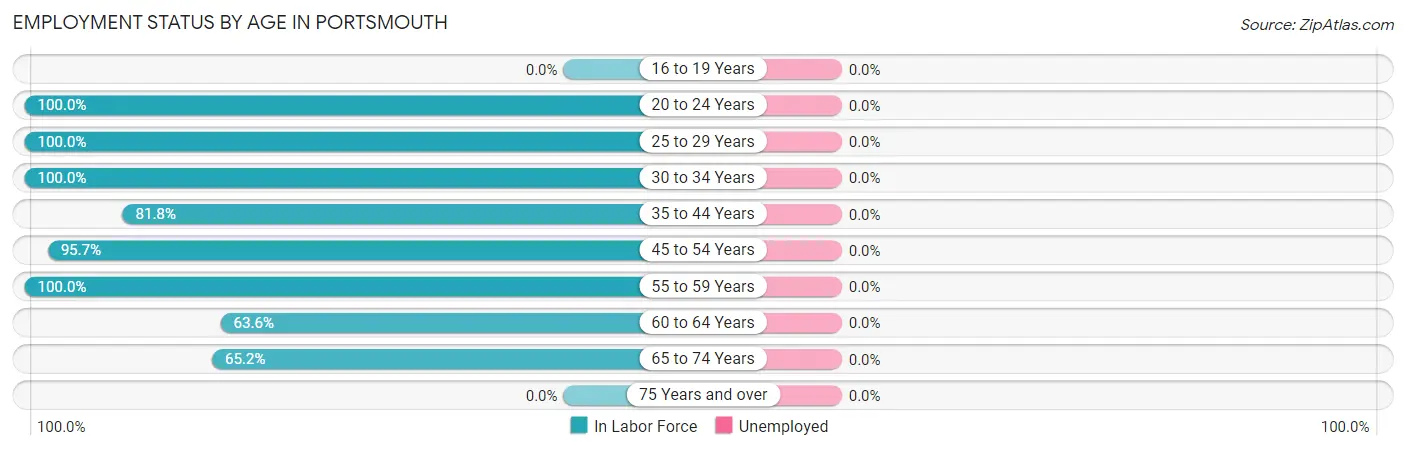
| Age Bracket | In Labor Force | Unemployed |
| 16 to 19 Years | 0 (0.0%) | 0 (0.0%) |
| 20 to 24 Years | 3 (100.0%) | 0 (0.0%) |
| 25 to 29 Years | 8 (100.0%) | 0 (0.0%) |
| 30 to 34 Years | 21 (100.0%) | 0 (0.0%) |
| 35 to 44 Years | 9 (81.8%) | 0 (0.0%) |
| 45 to 54 Years | 22 (95.7%) | 0 (0.0%) |
| 55 to 59 Years | 23 (100.0%) | 0 (0.0%) |
| 60 to 64 Years | 7 (63.6%) | 0 (0.0%) |
| 65 to 74 Years | 15 (65.2%) | 0 (0.0%) |
| 75 Years and over | 0 (0.0%) | 0 (0.0%) |
| Total | 108 (78.3%) | 0 (0.0%) |
Employment Status by Educational Attainment in Portsmouth
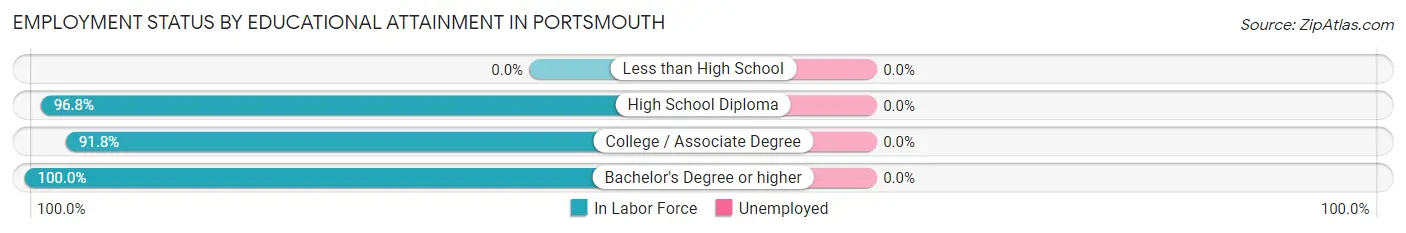
| Educational Attainment | In Labor Force | Unemployed |
| Less than High School | 0 (0.0%) | 0 (0.0%) |
| High School Diploma | 30 (96.8%) | 0 (0.0%) |
| College / Associate Degree | 45 (91.8%) | 0 (0.0%) |
| Bachelor's Degree or higher | 15 (100.0%) | 0 (0.0%) |
| Total | 90 (92.8%) | 0 (0.0%) |
Employment Occupations by Sex in Portsmouth
Management, Business, Science and Arts Occupations
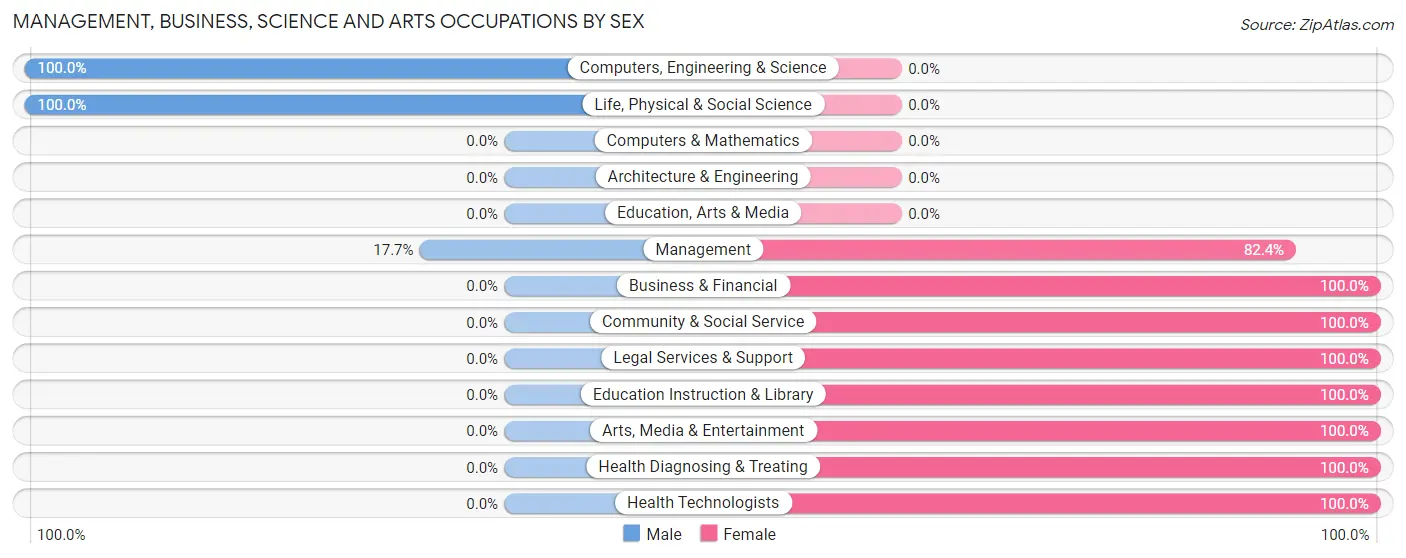
The most common Management, Business, Science and Arts occupations in Portsmouth are Management (17 | 15.7%), Community & Social Service (6 | 5.6%), Business & Financial (5 | 4.6%), Health Diagnosing & Treating (3 | 2.8%), and Computers, Engineering & Science (2 | 1.8%).
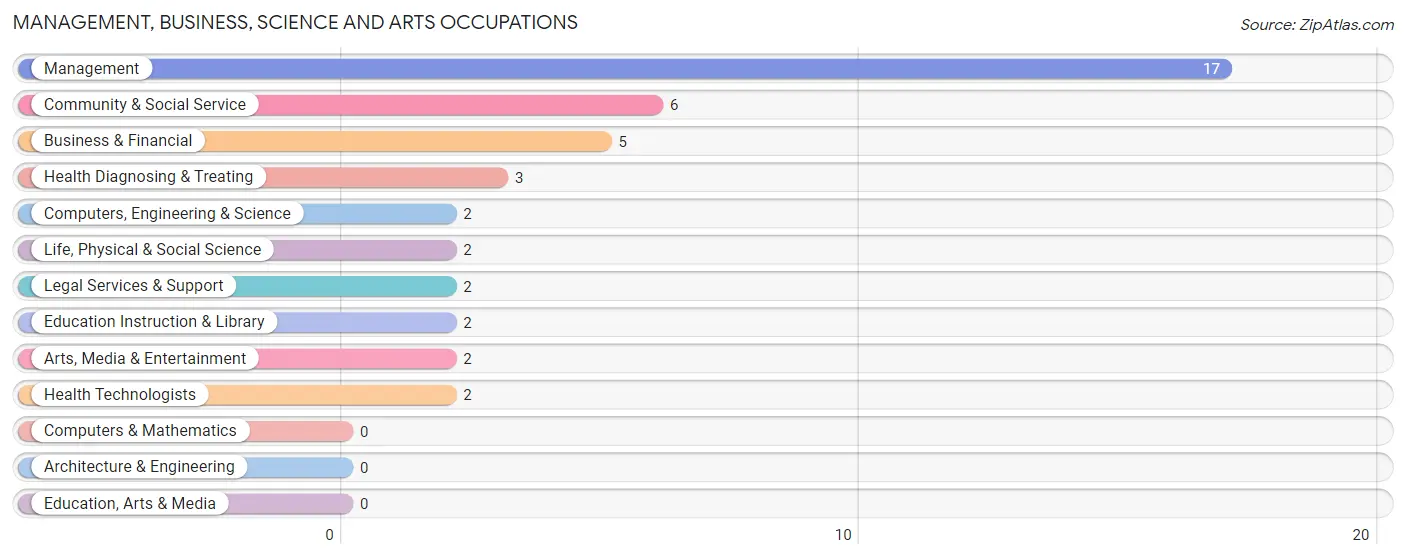
Management, Business, Science and Arts Occupations by Sex
Within the Management, Business, Science and Arts occupations in Portsmouth, the most male-oriented occupations are Computers, Engineering & Science (100.0%), Life, Physical & Social Science (100.0%), and Management (17.6%), while the most female-oriented occupations are Business & Financial (100.0%), Community & Social Service (100.0%), and Legal Services & Support (100.0%).
| Occupation | Male | Female |
| Management | 3 (17.6%) | 14 (82.4%) |
| Business & Financial | 0 (0.0%) | 5 (100.0%) |
| Computers, Engineering & Science | 2 (100.0%) | 0 (0.0%) |
| Computers & Mathematics | 0 (0.0%) | 0 (0.0%) |
| Architecture & Engineering | 0 (0.0%) | 0 (0.0%) |
| Life, Physical & Social Science | 2 (100.0%) | 0 (0.0%) |
| Community & Social Service | 0 (0.0%) | 6 (100.0%) |
| Education, Arts & Media | 0 (0.0%) | 0 (0.0%) |
| Legal Services & Support | 0 (0.0%) | 2 (100.0%) |
| Education Instruction & Library | 0 (0.0%) | 2 (100.0%) |
| Arts, Media & Entertainment | 0 (0.0%) | 2 (100.0%) |
| Health Diagnosing & Treating | 0 (0.0%) | 3 (100.0%) |
| Health Technologists | 0 (0.0%) | 2 (100.0%) |
| Total (Category) | 5 (15.1%) | 28 (84.9%) |
| Total (Overall) | 56 (51.8%) | 52 (48.1%) |
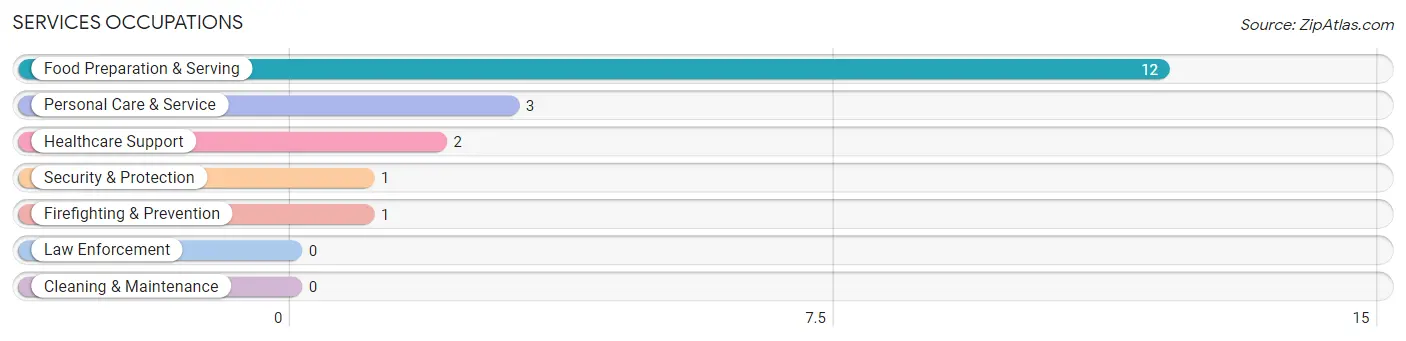
Services Occupations
The most common Services occupations in Portsmouth are Food Preparation & Serving (12 | 11.1%), Personal Care & Service (3 | 2.8%), Healthcare Support (2 | 1.8%), Security & Protection (1 | 0.9%), and Firefighting & Prevention (1 | 0.9%).
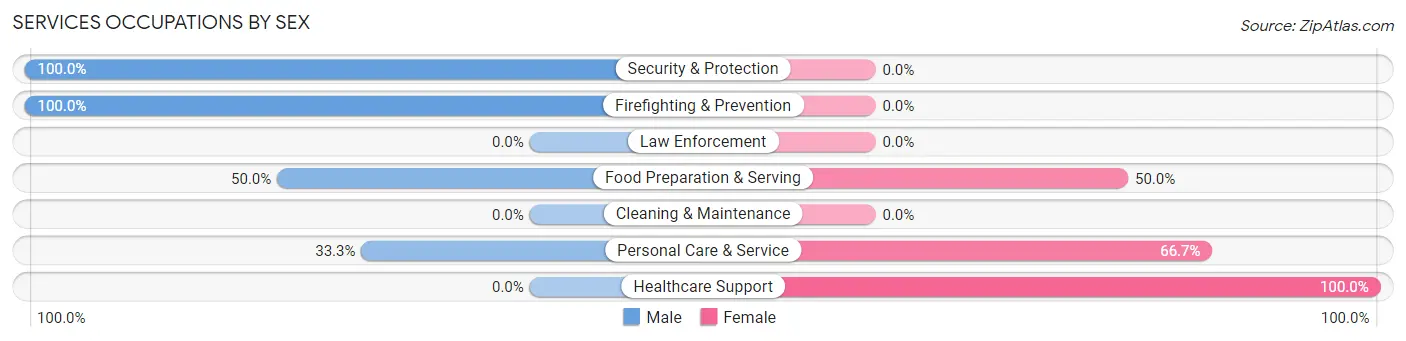
Services Occupations by Sex
Within the Services occupations in Portsmouth, the most male-oriented occupations are Security & Protection (100.0%), Firefighting & Prevention (100.0%), and Food Preparation & Serving (50.0%), while the most female-oriented occupations are Healthcare Support (100.0%), Personal Care & Service (66.7%), and Food Preparation & Serving (50.0%).
| Occupation | Male | Female |
| Healthcare Support | 0 (0.0%) | 2 (100.0%) |
| Security & Protection | 1 (100.0%) | 0 (0.0%) |
| Firefighting & Prevention | 1 (100.0%) | 0 (0.0%) |
| Law Enforcement | 0 (0.0%) | 0 (0.0%) |
| Food Preparation & Serving | 6 (50.0%) | 6 (50.0%) |
| Cleaning & Maintenance | 0 (0.0%) | 0 (0.0%) |
| Personal Care & Service | 1 (33.3%) | 2 (66.7%) |
| Total (Category) | 8 (44.4%) | 10 (55.6%) |
| Total (Overall) | 56 (51.8%) | 52 (48.1%) |
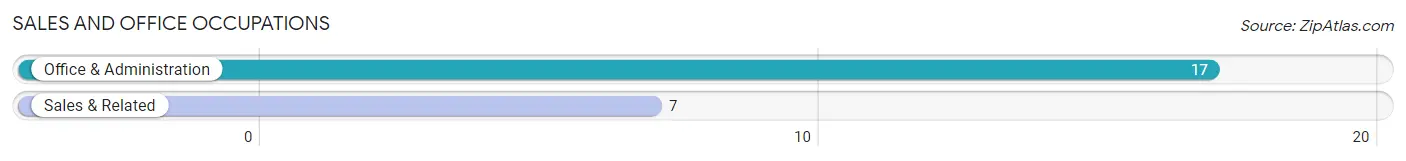
Sales and Office Occupations
The most common Sales and Office occupations in Portsmouth are Office & Administration (17 | 15.7%), and Sales & Related (7 | 6.5%).
Sales and Office Occupations by Sex
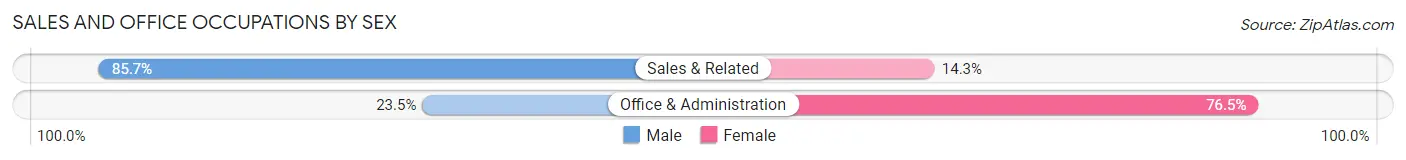
| Occupation | Male | Female |
| Sales & Related | 6 (85.7%) | 1 (14.3%) |
| Office & Administration | 4 (23.5%) | 13 (76.5%) |
| Total (Category) | 10 (41.7%) | 14 (58.3%) |
| Total (Overall) | 56 (51.8%) | 52 (48.1%) |
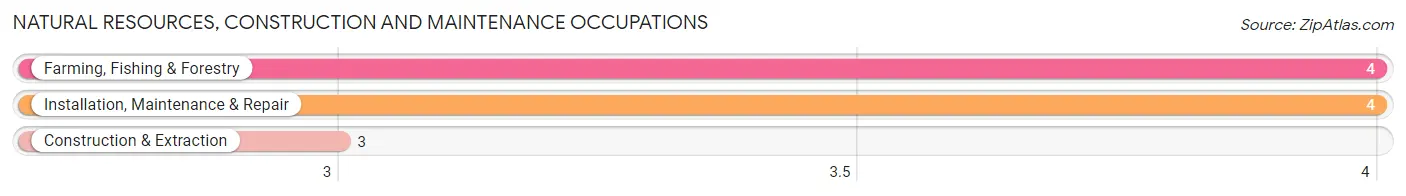
Natural Resources, Construction and Maintenance Occupations
The most common Natural Resources, Construction and Maintenance occupations in Portsmouth are Farming, Fishing & Forestry (4 | 3.7%), Installation, Maintenance & Repair (4 | 3.7%), and Construction & Extraction (3 | 2.8%).
Natural Resources, Construction and Maintenance Occupations by Sex
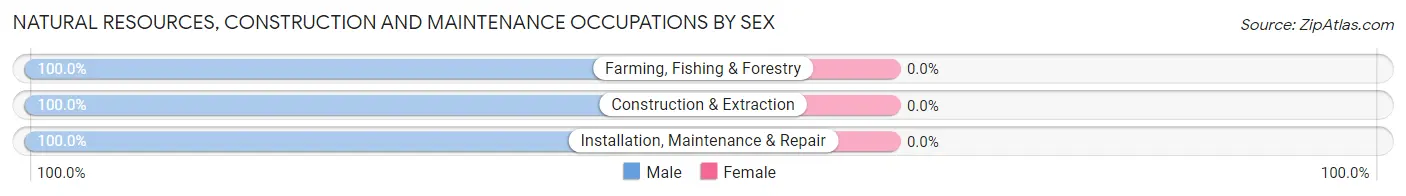
| Occupation | Male | Female |
| Farming, Fishing & Forestry | 4 (100.0%) | 0 (0.0%) |
| Construction & Extraction | 3 (100.0%) | 0 (0.0%) |
| Installation, Maintenance & Repair | 4 (100.0%) | 0 (0.0%) |
| Total (Category) | 11 (100.0%) | 0 (0.0%) |
| Total (Overall) | 56 (51.8%) | 52 (48.1%) |
Production, Transportation and Moving Occupations
The most common Production, Transportation and Moving occupations in Portsmouth are Transportation (10 | 9.3%), Production (8 | 7.4%), and Material Moving (4 | 3.7%).
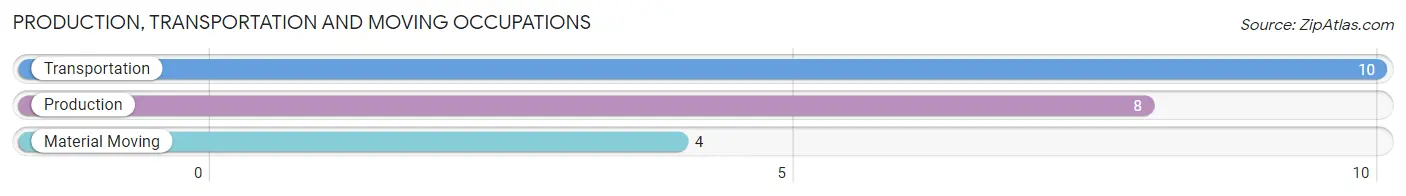
Production, Transportation and Moving Occupations by Sex
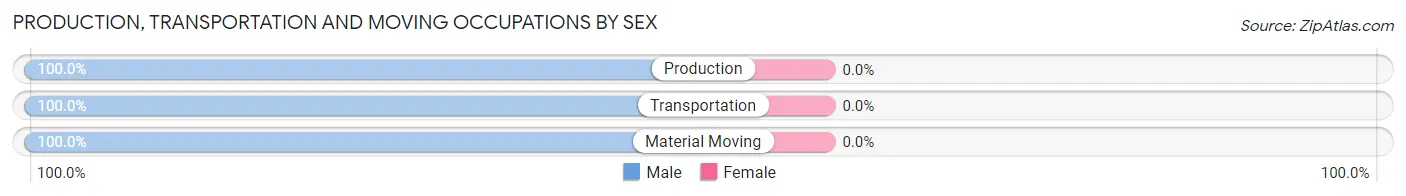
| Occupation | Male | Female |
| Production | 8 (100.0%) | 0 (0.0%) |
| Transportation | 10 (100.0%) | 0 (0.0%) |
| Material Moving | 4 (100.0%) | 0 (0.0%) |
| Total (Category) | 22 (100.0%) | 0 (0.0%) |
| Total (Overall) | 56 (51.8%) | 52 (48.1%) |
Employment Industries by Sex in Portsmouth
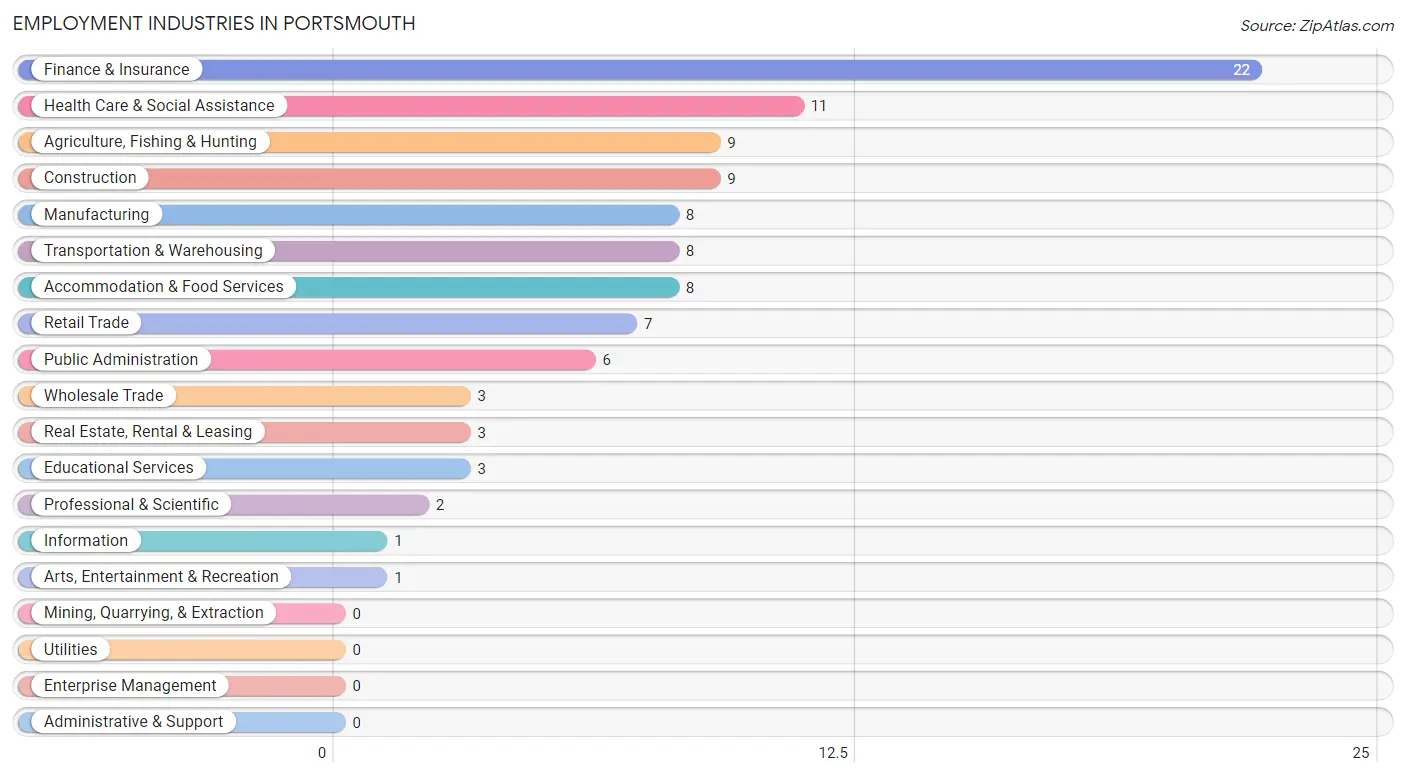
Employment Industries in Portsmouth
The major employment industries in Portsmouth include Finance & Insurance (22 | 20.4%), Health Care & Social Assistance (11 | 10.2%), Agriculture, Fishing & Hunting (9 | 8.3%), Construction (9 | 8.3%), and Manufacturing (8 | 7.4%).
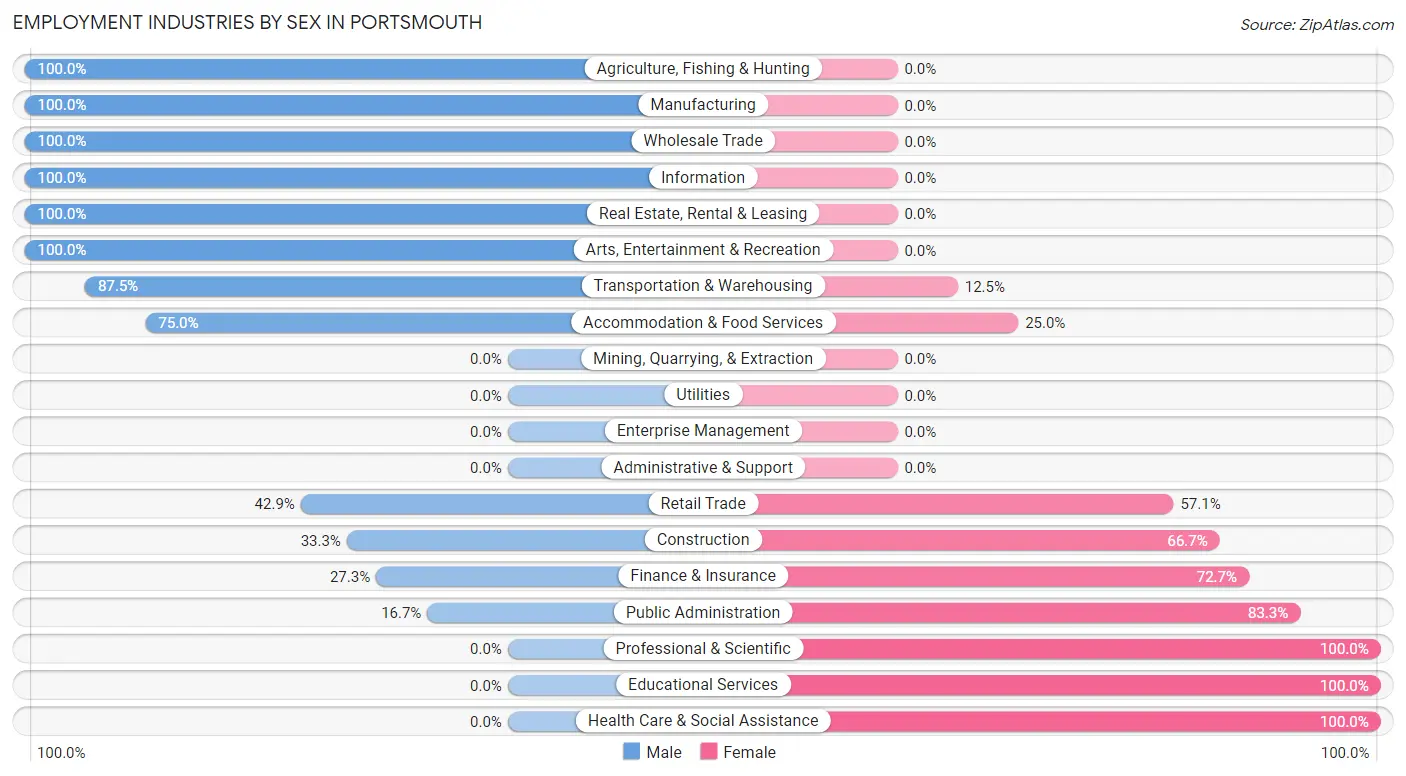
Employment Industries by Sex in Portsmouth
The Portsmouth industries that see more men than women are Agriculture, Fishing & Hunting (100.0%), Manufacturing (100.0%), and Wholesale Trade (100.0%), whereas the industries that tend to have a higher number of women are Professional & Scientific (100.0%), Educational Services (100.0%), and Health Care & Social Assistance (100.0%).
| Industry | Male | Female |
| Agriculture, Fishing & Hunting | 9 (100.0%) | 0 (0.0%) |
| Mining, Quarrying, & Extraction | 0 (0.0%) | 0 (0.0%) |
| Construction | 3 (33.3%) | 6 (66.7%) |
| Manufacturing | 8 (100.0%) | 0 (0.0%) |
| Wholesale Trade | 3 (100.0%) | 0 (0.0%) |
| Retail Trade | 3 (42.9%) | 4 (57.1%) |
| Transportation & Warehousing | 7 (87.5%) | 1 (12.5%) |
| Utilities | 0 (0.0%) | 0 (0.0%) |
| Information | 1 (100.0%) | 0 (0.0%) |
| Finance & Insurance | 6 (27.3%) | 16 (72.7%) |
| Real Estate, Rental & Leasing | 3 (100.0%) | 0 (0.0%) |
| Professional & Scientific | 0 (0.0%) | 2 (100.0%) |
| Enterprise Management | 0 (0.0%) | 0 (0.0%) |
| Administrative & Support | 0 (0.0%) | 0 (0.0%) |
| Educational Services | 0 (0.0%) | 3 (100.0%) |
| Health Care & Social Assistance | 0 (0.0%) | 11 (100.0%) |
| Arts, Entertainment & Recreation | 1 (100.0%) | 0 (0.0%) |
| Accommodation & Food Services | 6 (75.0%) | 2 (25.0%) |
| Public Administration | 1 (16.7%) | 5 (83.3%) |
| Total | 56 (51.8%) | 52 (48.1%) |
Education in Portsmouth
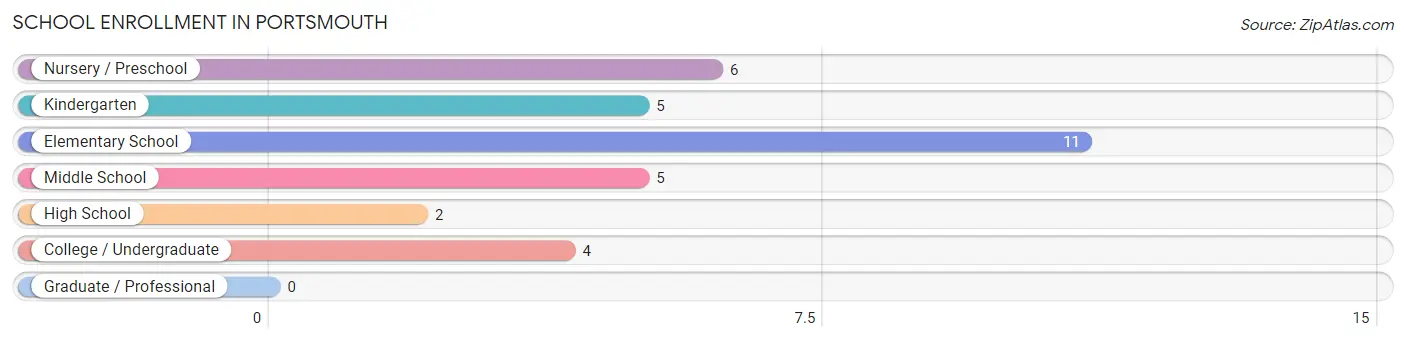
School Enrollment in Portsmouth
The most common levels of schooling among the 33 students in Portsmouth are elementary school (11 | 33.3%), nursery / preschool (6 | 18.2%), and kindergarten (5 | 15.1%).
| School Level | # Students | % Students |
| Nursery / Preschool | 6 | 18.2% |
| Kindergarten | 5 | 15.1% |
| Elementary School | 11 | 33.3% |
| Middle School | 5 | 15.1% |
| High School | 2 | 6.1% |
| College / Undergraduate | 4 | 12.1% |
| Graduate / Professional | 0 | 0.0% |
| Total | 33 | 100.0% |
School Enrollment by Age by Funding Source in Portsmouth
Out of a total of 33 students who are enrolled in schools in Portsmouth, 13 (39.4%) attend a private institution, while the remaining 20 (60.6%) are enrolled in public schools. The age group of 25 to 34 year olds has the highest likelihood of being enrolled in private schools, with 2 (100.0% in the age bracket) enrolled. Conversely, the age group of 3 to 4 year olds has the lowest likelihood of being enrolled in a private school, with 6 (100.0% in the age bracket) attending a public institution.
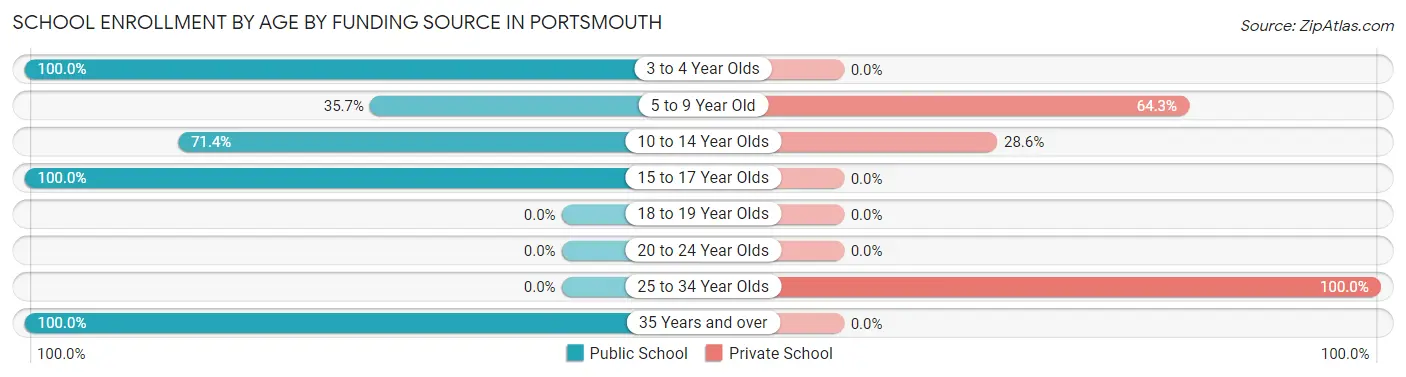
| Age Bracket | Public School | Private School |
| 3 to 4 Year Olds | 6 (100.0%) | 0 (0.0%) |
| 5 to 9 Year Old | 5 (35.7%) | 9 (64.3%) |
| 10 to 14 Year Olds | 5 (71.4%) | 2 (28.6%) |
| 15 to 17 Year Olds | 2 (100.0%) | 0 (0.0%) |
| 18 to 19 Year Olds | 0 (0.0%) | 0 (0.0%) |
| 20 to 24 Year Olds | 0 (0.0%) | 0 (0.0%) |
| 25 to 34 Year Olds | 0 (0.0%) | 2 (100.0%) |
| 35 Years and over | 2 (100.0%) | 0 (0.0%) |
| Total | 20 (60.6%) | 13 (39.4%) |
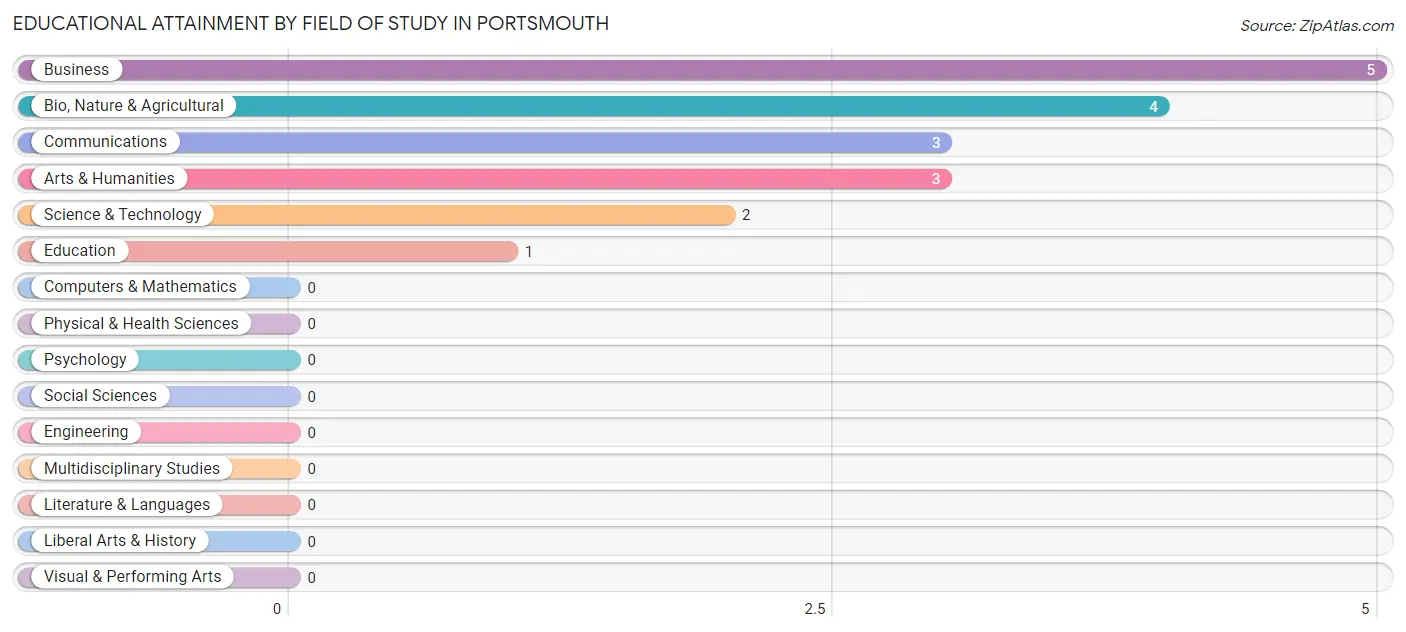
Educational Attainment by Field of Study in Portsmouth
Business (5 | 27.8%), bio, nature & agricultural (4 | 22.2%), communications (3 | 16.7%), arts & humanities (3 | 16.7%), and science & technology (2 | 11.1%) are the most common fields of study among 18 individuals in Portsmouth who have obtained a bachelor's degree or higher.
| Field of Study | # Graduates | % Graduates |
| Computers & Mathematics | 0 | 0.0% |
| Bio, Nature & Agricultural | 4 | 22.2% |
| Physical & Health Sciences | 0 | 0.0% |
| Psychology | 0 | 0.0% |
| Social Sciences | 0 | 0.0% |
| Engineering | 0 | 0.0% |
| Multidisciplinary Studies | 0 | 0.0% |
| Science & Technology | 2 | 11.1% |
| Business | 5 | 27.8% |
| Education | 1 | 5.6% |
| Literature & Languages | 0 | 0.0% |
| Liberal Arts & History | 0 | 0.0% |
| Visual & Performing Arts | 0 | 0.0% |
| Communications | 3 | 16.7% |
| Arts & Humanities | 3 | 16.7% |
| Total | 18 | 100.0% |
Transportation & Commute in Portsmouth
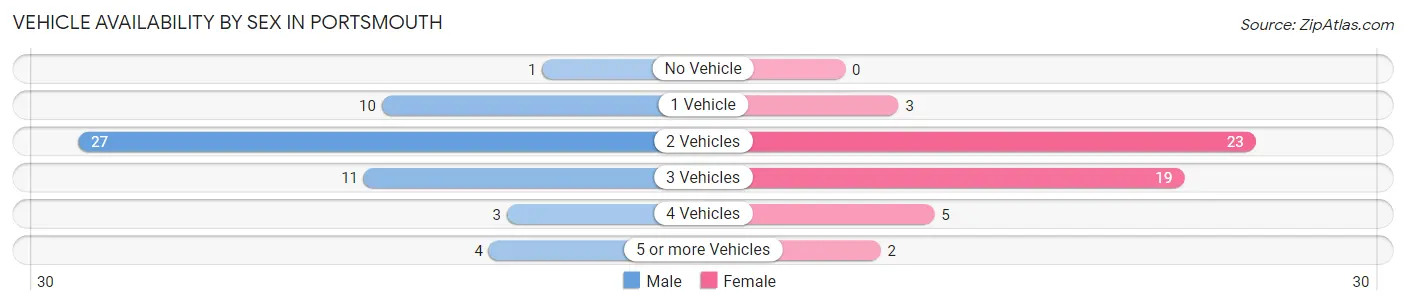
Vehicle Availability by Sex in Portsmouth
The most prevalent vehicle ownership categories in Portsmouth are males with 2 vehicles (27, accounting for 48.2%) and females with 2 vehicles (23, making up 51.9%).
| Vehicles Available | Male | Female |
| No Vehicle | 1 (1.8%) | 0 (0.0%) |
| 1 Vehicle | 10 (17.9%) | 3 (5.8%) |
| 2 Vehicles | 27 (48.2%) | 23 (44.2%) |
| 3 Vehicles | 11 (19.6%) | 19 (36.5%) |
| 4 Vehicles | 3 (5.4%) | 5 (9.6%) |
| 5 or more Vehicles | 4 (7.1%) | 2 (3.8%) |
| Total | 56 (100.0%) | 52 (100.0%) |
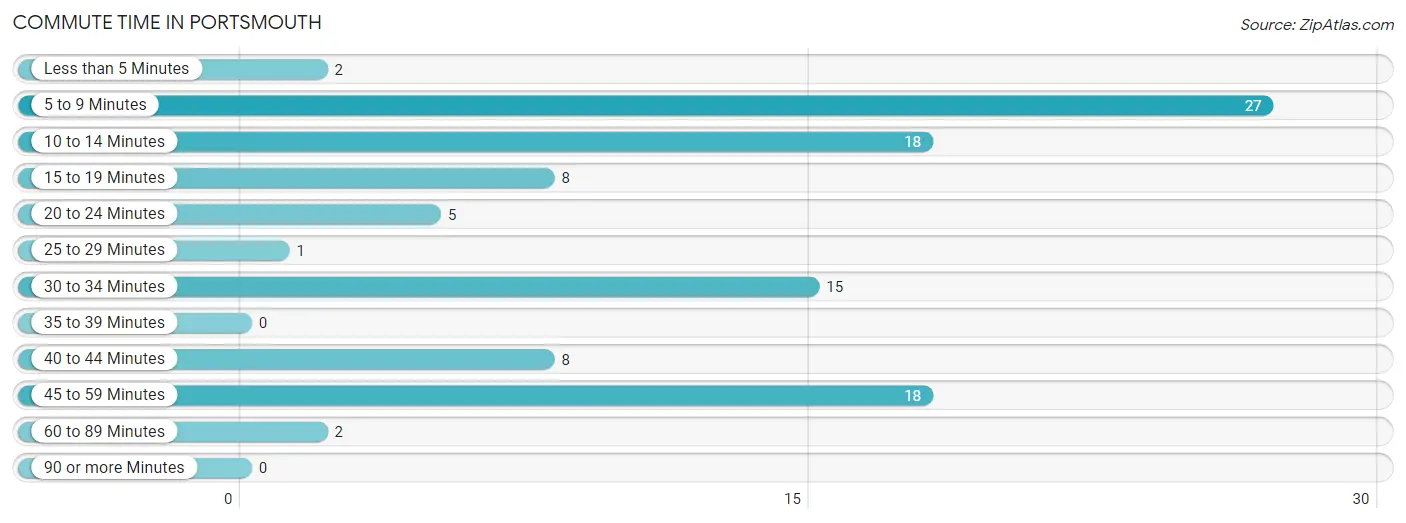
Commute Time in Portsmouth
The most frequently occuring commute durations in Portsmouth are 5 to 9 minutes (27 commuters, 26.0%), 10 to 14 minutes (18 commuters, 17.3%), and 45 to 59 minutes (18 commuters, 17.3%).
| Commute Time | # Commuters | % Commuters |
| Less than 5 Minutes | 2 | 1.9% |
| 5 to 9 Minutes | 27 | 26.0% |
| 10 to 14 Minutes | 18 | 17.3% |
| 15 to 19 Minutes | 8 | 7.7% |
| 20 to 24 Minutes | 5 | 4.8% |
| 25 to 29 Minutes | 1 | 1.0% |
| 30 to 34 Minutes | 15 | 14.4% |
| 35 to 39 Minutes | 0 | 0.0% |
| 40 to 44 Minutes | 8 | 7.7% |
| 45 to 59 Minutes | 18 | 17.3% |
| 60 to 89 Minutes | 2 | 1.9% |
| 90 or more Minutes | 0 | 0.0% |
Commute Time by Sex in Portsmouth
The most common commute times in Portsmouth are 5 to 9 minutes (13 commuters, 24.1%) for males and 5 to 9 minutes (14 commuters, 28.0%) for females.
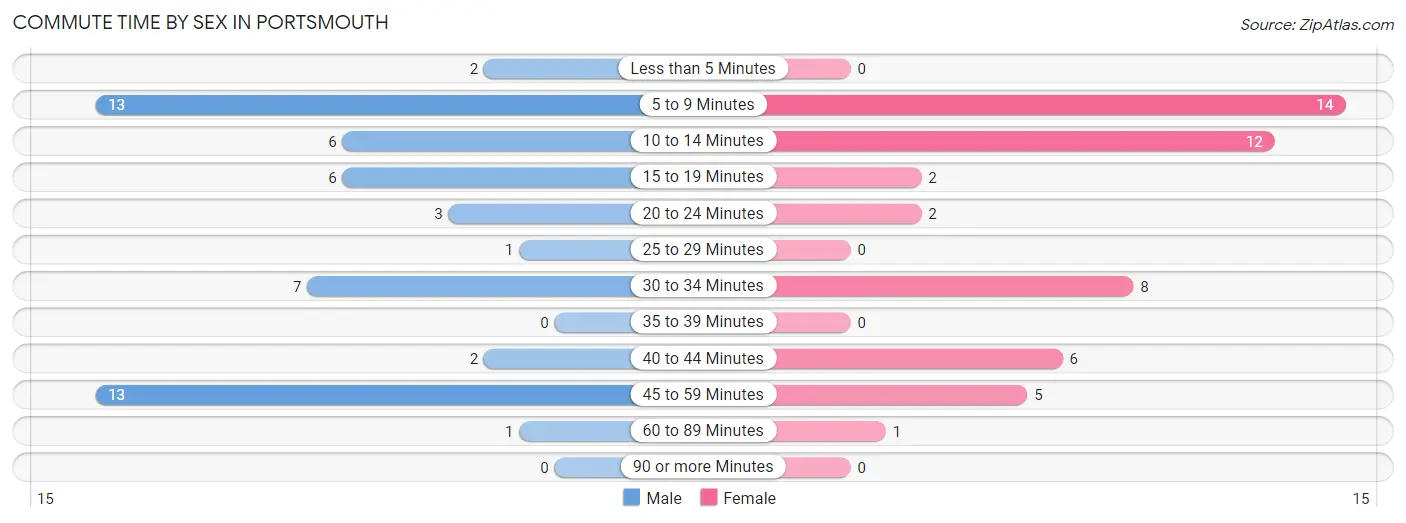
| Commute Time | Male | Female |
| Less than 5 Minutes | 2 (3.7%) | 0 (0.0%) |
| 5 to 9 Minutes | 13 (24.1%) | 14 (28.0%) |
| 10 to 14 Minutes | 6 (11.1%) | 12 (24.0%) |
| 15 to 19 Minutes | 6 (11.1%) | 2 (4.0%) |
| 20 to 24 Minutes | 3 (5.6%) | 2 (4.0%) |
| 25 to 29 Minutes | 1 (1.8%) | 0 (0.0%) |
| 30 to 34 Minutes | 7 (13.0%) | 8 (16.0%) |
| 35 to 39 Minutes | 0 (0.0%) | 0 (0.0%) |
| 40 to 44 Minutes | 2 (3.7%) | 6 (12.0%) |
| 45 to 59 Minutes | 13 (24.1%) | 5 (10.0%) |
| 60 to 89 Minutes | 1 (1.8%) | 1 (2.0%) |
| 90 or more Minutes | 0 (0.0%) | 0 (0.0%) |
Time of Departure to Work by Sex in Portsmouth
The most frequent times of departure to work in Portsmouth are 6:00 AM to 6:29 AM (14, 25.9%) for males and 7:00 AM to 7:29 AM (15, 30.0%) for females.
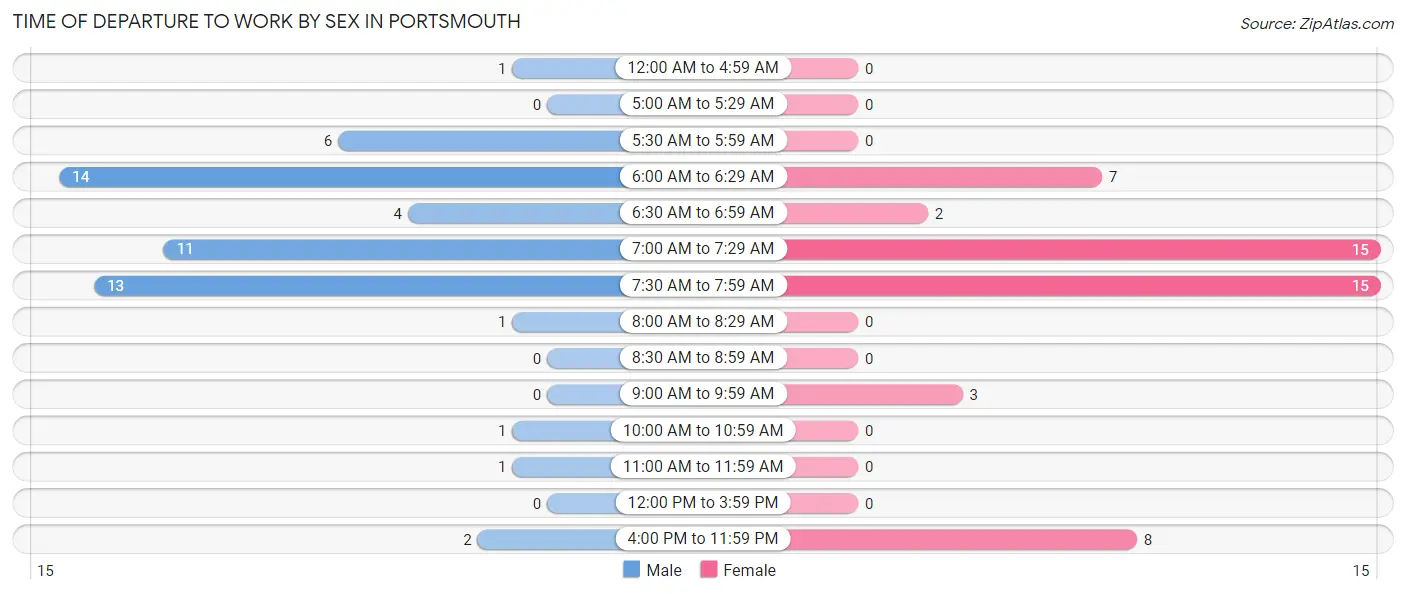
| Time of Departure | Male | Female |
| 12:00 AM to 4:59 AM | 1 (1.8%) | 0 (0.0%) |
| 5:00 AM to 5:29 AM | 0 (0.0%) | 0 (0.0%) |
| 5:30 AM to 5:59 AM | 6 (11.1%) | 0 (0.0%) |
| 6:00 AM to 6:29 AM | 14 (25.9%) | 7 (14.0%) |
| 6:30 AM to 6:59 AM | 4 (7.4%) | 2 (4.0%) |
| 7:00 AM to 7:29 AM | 11 (20.4%) | 15 (30.0%) |
| 7:30 AM to 7:59 AM | 13 (24.1%) | 15 (30.0%) |
| 8:00 AM to 8:29 AM | 1 (1.8%) | 0 (0.0%) |
| 8:30 AM to 8:59 AM | 0 (0.0%) | 0 (0.0%) |
| 9:00 AM to 9:59 AM | 0 (0.0%) | 3 (6.0%) |
| 10:00 AM to 10:59 AM | 1 (1.8%) | 0 (0.0%) |
| 11:00 AM to 11:59 AM | 1 (1.8%) | 0 (0.0%) |
| 12:00 PM to 3:59 PM | 0 (0.0%) | 0 (0.0%) |
| 4:00 PM to 11:59 PM | 2 (3.7%) | 8 (16.0%) |
| Total | 54 (100.0%) | 50 (100.0%) |
Housing Occupancy in Portsmouth
Occupancy by Ownership in Portsmouth
Of the total 87 dwellings in Portsmouth, owner-occupied units account for 74 (85.1%), while renter-occupied units make up 13 (14.9%).
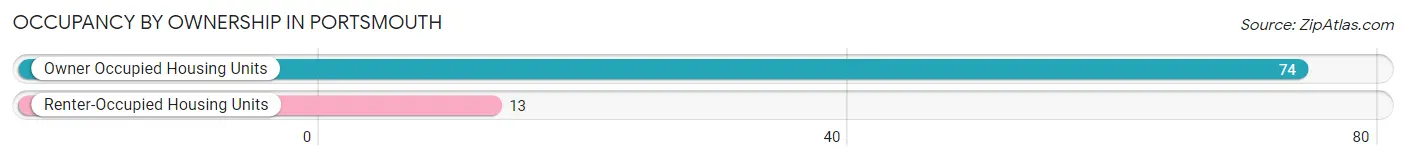
| Occupancy | # Housing Units | % Housing Units |
| Owner Occupied Housing Units | 74 | 85.1% |
| Renter-Occupied Housing Units | 13 | 14.9% |
| Total Occupied Housing Units | 87 | 100.0% |
Occupancy by Household Size in Portsmouth
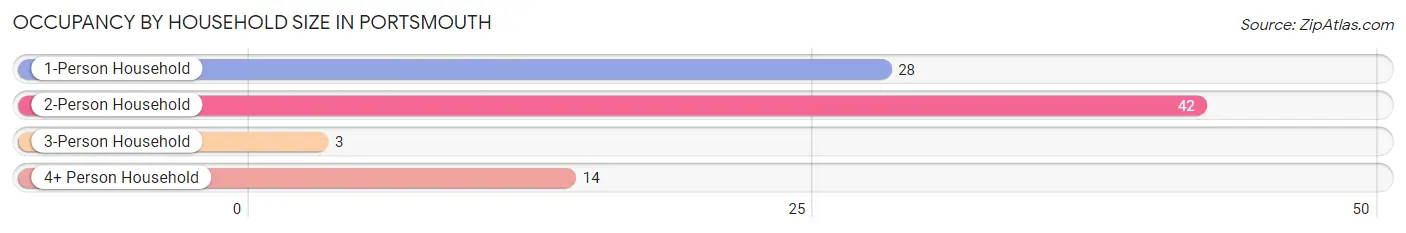
| Household Size | # Housing Units | % Housing Units |
| 1-Person Household | 28 | 32.2% |
| 2-Person Household | 42 | 48.3% |
| 3-Person Household | 3 | 3.5% |
| 4+ Person Household | 14 | 16.1% |
| Total Housing Units | 87 | 100.0% |
Occupancy by Ownership by Household Size in Portsmouth
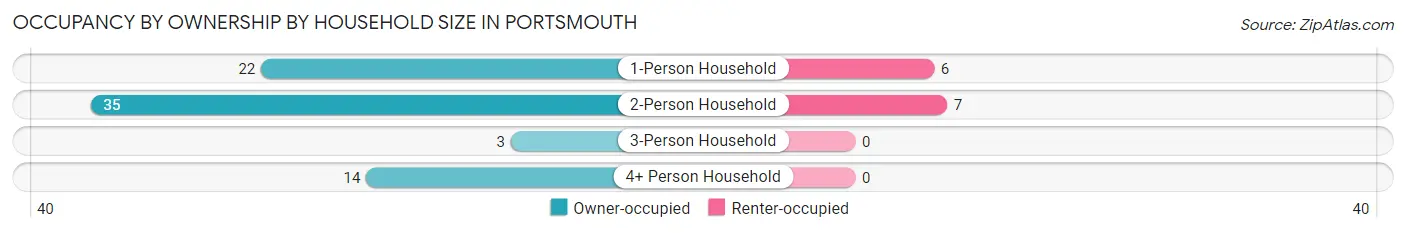
| Household Size | Owner-occupied | Renter-occupied |
| 1-Person Household | 22 (78.6%) | 6 (21.4%) |
| 2-Person Household | 35 (83.3%) | 7 (16.7%) |
| 3-Person Household | 3 (100.0%) | 0 (0.0%) |
| 4+ Person Household | 14 (100.0%) | 0 (0.0%) |
| Total Housing Units | 74 (85.1%) | 13 (14.9%) |
Occupancy by Educational Attainment in Portsmouth
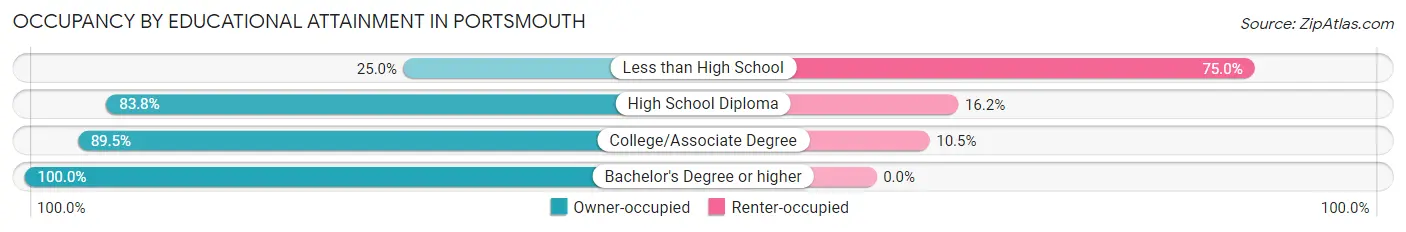
| Household Size | Owner-occupied | Renter-occupied |
| Less than High School | 1 (25.0%) | 3 (75.0%) |
| High School Diploma | 31 (83.8%) | 6 (16.2%) |
| College/Associate Degree | 34 (89.5%) | 4 (10.5%) |
| Bachelor's Degree or higher | 8 (100.0%) | 0 (0.0%) |
Occupancy by Age of Householder in Portsmouth
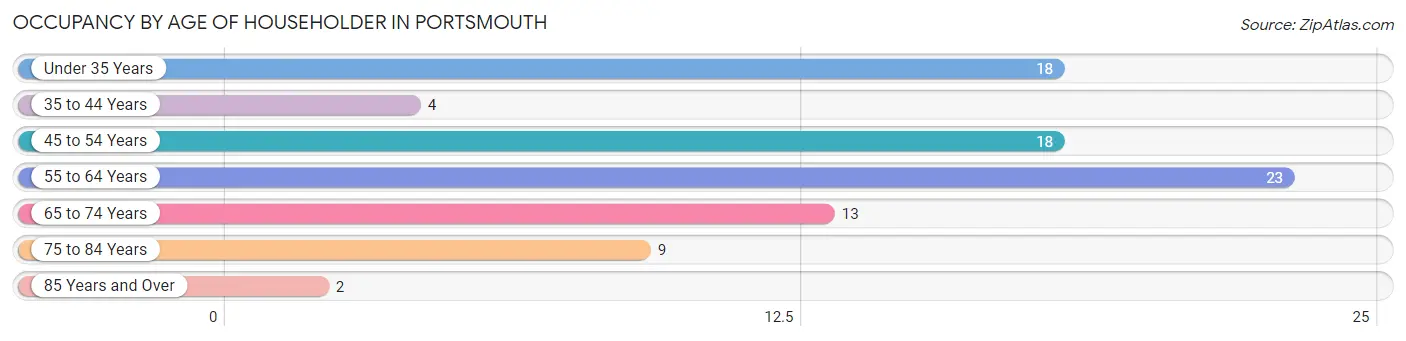
| Age Bracket | # Households | % Households |
| Under 35 Years | 18 | 20.7% |
| 35 to 44 Years | 4 | 4.6% |
| 45 to 54 Years | 18 | 20.7% |
| 55 to 64 Years | 23 | 26.4% |
| 65 to 74 Years | 13 | 14.9% |
| 75 to 84 Years | 9 | 10.3% |
| 85 Years and Over | 2 | 2.3% |
| Total | 87 | 100.0% |
Housing Finances in Portsmouth
Median Income by Occupancy in Portsmouth
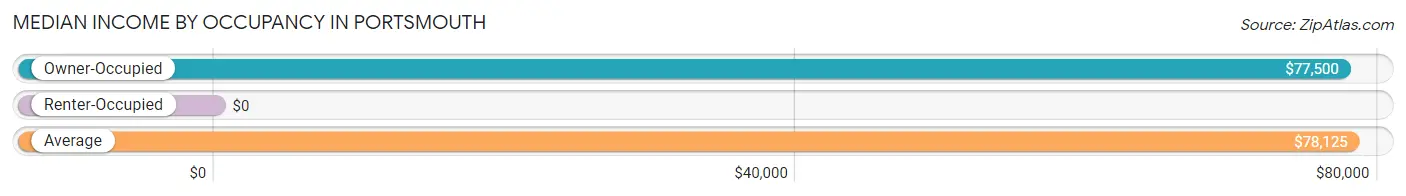
| Occupancy Type | # Households | Median Income |
| Owner-Occupied | 74 (85.1%) | $77,500 |
| Renter-Occupied | 13 (14.9%) | $0 |
| Average | 87 (100.0%) | $78,125 |
Occupancy by Householder Income Bracket in Portsmouth
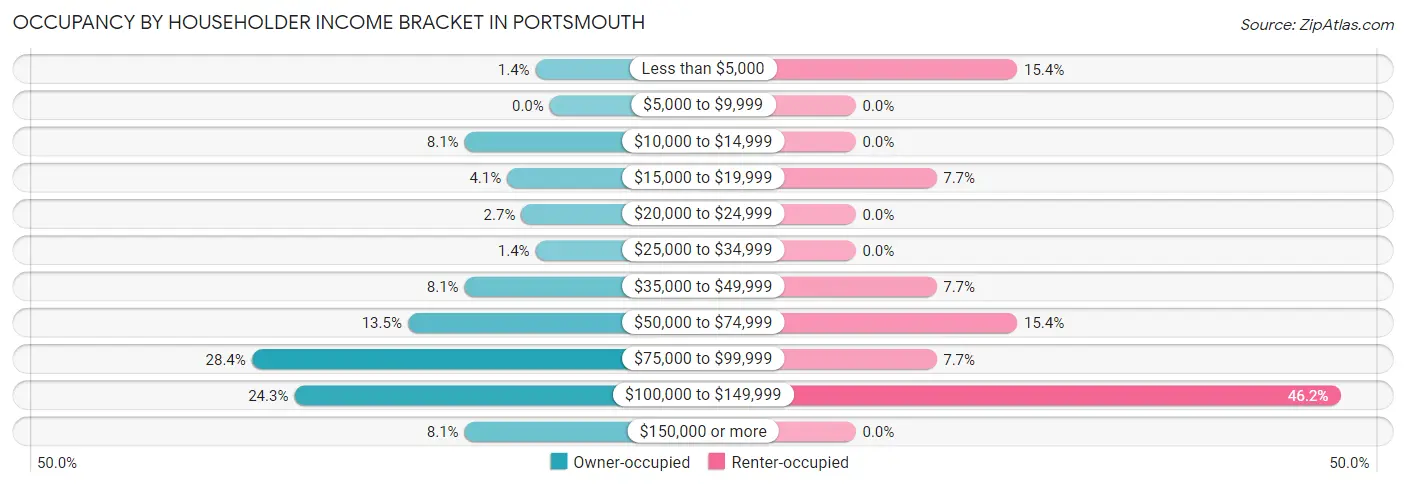
| Income Bracket | Owner-occupied | Renter-occupied |
| Less than $5,000 | 1 (1.3%) | 2 (15.4%) |
| $5,000 to $9,999 | 0 (0.0%) | 0 (0.0%) |
| $10,000 to $14,999 | 6 (8.1%) | 0 (0.0%) |
| $15,000 to $19,999 | 3 (4.1%) | 1 (7.7%) |
| $20,000 to $24,999 | 2 (2.7%) | 0 (0.0%) |
| $25,000 to $34,999 | 1 (1.3%) | 0 (0.0%) |
| $35,000 to $49,999 | 6 (8.1%) | 1 (7.7%) |
| $50,000 to $74,999 | 10 (13.5%) | 2 (15.4%) |
| $75,000 to $99,999 | 21 (28.4%) | 1 (7.7%) |
| $100,000 to $149,999 | 18 (24.3%) | 6 (46.2%) |
| $150,000 or more | 6 (8.1%) | 0 (0.0%) |
| Total | 74 (100.0%) | 13 (100.0%) |
Monthly Housing Cost Tiers in Portsmouth
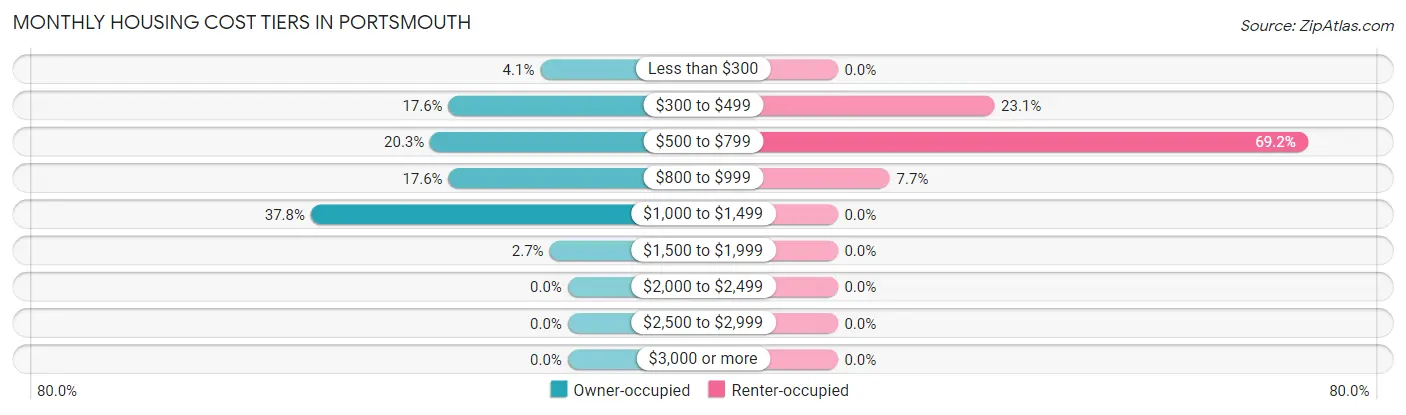
| Monthly Cost | Owner-occupied | Renter-occupied |
| Less than $300 | 3 (4.1%) | 0 (0.0%) |
| $300 to $499 | 13 (17.6%) | 3 (23.1%) |
| $500 to $799 | 15 (20.3%) | 9 (69.2%) |
| $800 to $999 | 13 (17.6%) | 1 (7.7%) |
| $1,000 to $1,499 | 28 (37.8%) | 0 (0.0%) |
| $1,500 to $1,999 | 2 (2.7%) | 0 (0.0%) |
| $2,000 to $2,499 | 0 (0.0%) | 0 (0.0%) |
| $2,500 to $2,999 | 0 (0.0%) | 0 (0.0%) |
| $3,000 or more | 0 (0.0%) | 0 (0.0%) |
| Total | 74 (100.0%) | 13 (100.0%) |
Physical Housing Characteristics in Portsmouth
Housing Structures in Portsmouth
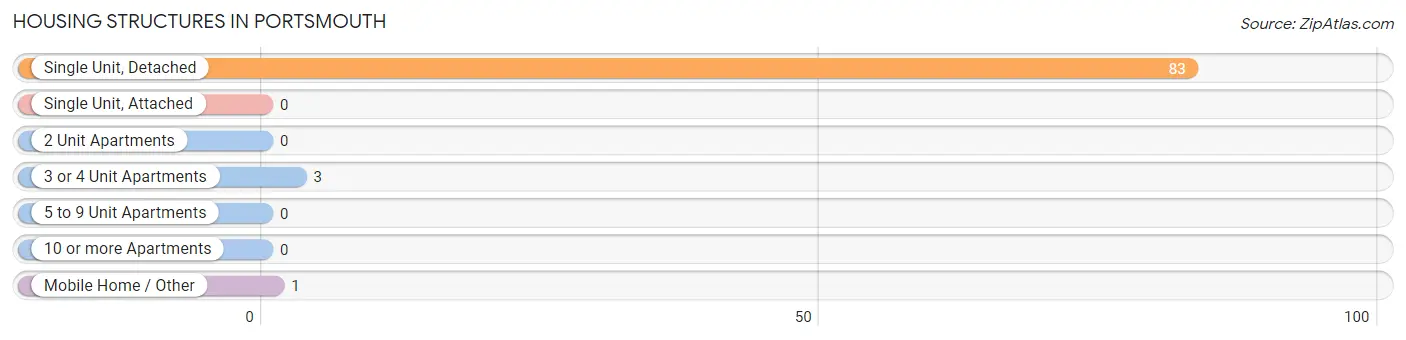
| Structure Type | # Housing Units | % Housing Units |
| Single Unit, Detached | 83 | 95.4% |
| Single Unit, Attached | 0 | 0.0% |
| 2 Unit Apartments | 0 | 0.0% |
| 3 or 4 Unit Apartments | 3 | 3.5% |
| 5 to 9 Unit Apartments | 0 | 0.0% |
| 10 or more Apartments | 0 | 0.0% |
| Mobile Home / Other | 1 | 1.1% |
| Total | 87 | 100.0% |
Housing Structures by Occupancy in Portsmouth
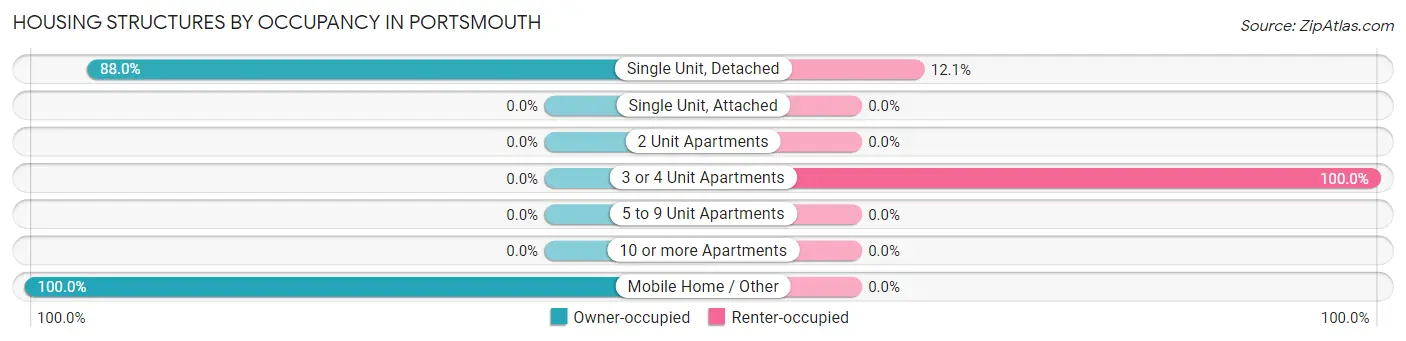
| Structure Type | Owner-occupied | Renter-occupied |
| Single Unit, Detached | 73 (87.9%) | 10 (12.0%) |
| Single Unit, Attached | 0 (0.0%) | 0 (0.0%) |
| 2 Unit Apartments | 0 (0.0%) | 0 (0.0%) |
| 3 or 4 Unit Apartments | 0 (0.0%) | 3 (100.0%) |
| 5 to 9 Unit Apartments | 0 (0.0%) | 0 (0.0%) |
| 10 or more Apartments | 0 (0.0%) | 0 (0.0%) |
| Mobile Home / Other | 1 (100.0%) | 0 (0.0%) |
| Total | 74 (85.1%) | 13 (14.9%) |
Housing Structures by Number of Rooms in Portsmouth
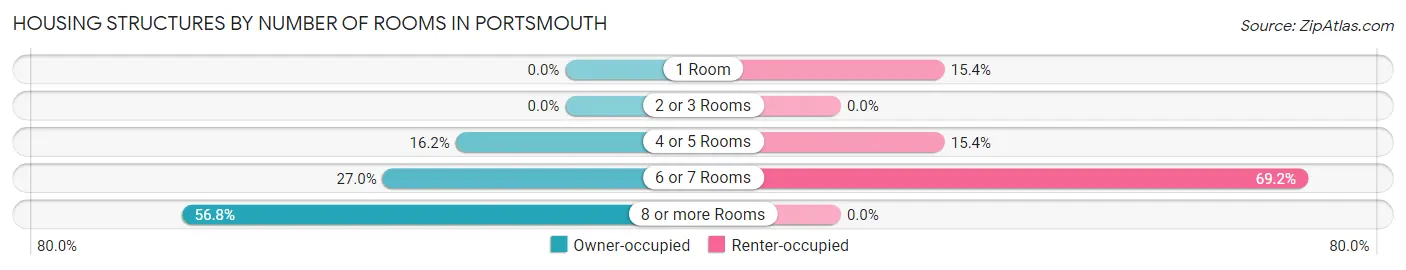
| Number of Rooms | Owner-occupied | Renter-occupied |
| 1 Room | 0 (0.0%) | 2 (15.4%) |
| 2 or 3 Rooms | 0 (0.0%) | 0 (0.0%) |
| 4 or 5 Rooms | 12 (16.2%) | 2 (15.4%) |
| 6 or 7 Rooms | 20 (27.0%) | 9 (69.2%) |
| 8 or more Rooms | 42 (56.8%) | 0 (0.0%) |
| Total | 74 (100.0%) | 13 (100.0%) |
Housing Structure by Heating Type in Portsmouth
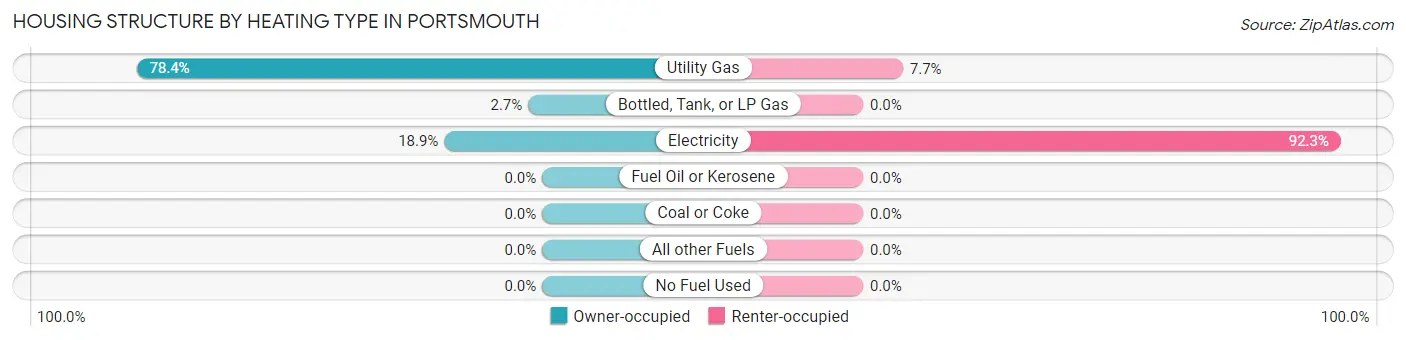
| Heating Type | Owner-occupied | Renter-occupied |
| Utility Gas | 58 (78.4%) | 1 (7.7%) |
| Bottled, Tank, or LP Gas | 2 (2.7%) | 0 (0.0%) |
| Electricity | 14 (18.9%) | 12 (92.3%) |
| Fuel Oil or Kerosene | 0 (0.0%) | 0 (0.0%) |
| Coal or Coke | 0 (0.0%) | 0 (0.0%) |
| All other Fuels | 0 (0.0%) | 0 (0.0%) |
| No Fuel Used | 0 (0.0%) | 0 (0.0%) |
| Total | 74 (100.0%) | 13 (100.0%) |
Household Vehicle Usage in Portsmouth
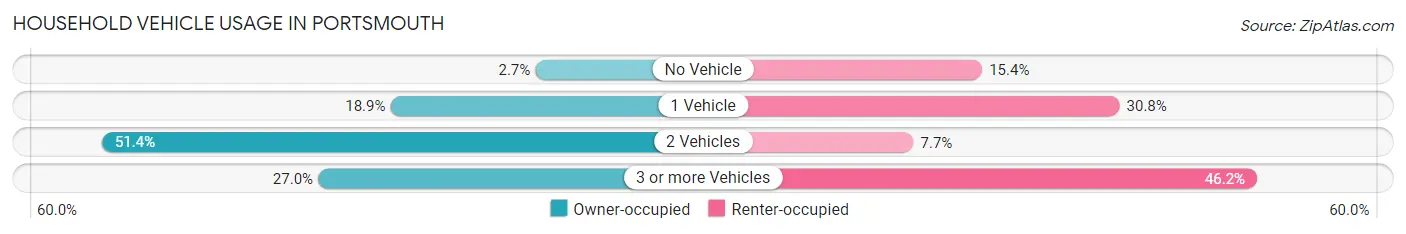
| Vehicles per Household | Owner-occupied | Renter-occupied |
| No Vehicle | 2 (2.7%) | 2 (15.4%) |
| 1 Vehicle | 14 (18.9%) | 4 (30.8%) |
| 2 Vehicles | 38 (51.3%) | 1 (7.7%) |
| 3 or more Vehicles | 20 (27.0%) | 6 (46.2%) |
| Total | 74 (100.0%) | 13 (100.0%) |
Real Estate & Mortgages in Portsmouth
Real Estate and Mortgage Overview in Portsmouth
| Characteristic | Without Mortgage | With Mortgage |
| Housing Units | 21 | 53 |
| Median Property Value | $172,500 | $115,100 |
| Median Household Income | - | - |
| Monthly Housing Costs | $347 | $0 |
| Real Estate Taxes | $1,750 | $0 |
Property Value by Mortgage Status in Portsmouth
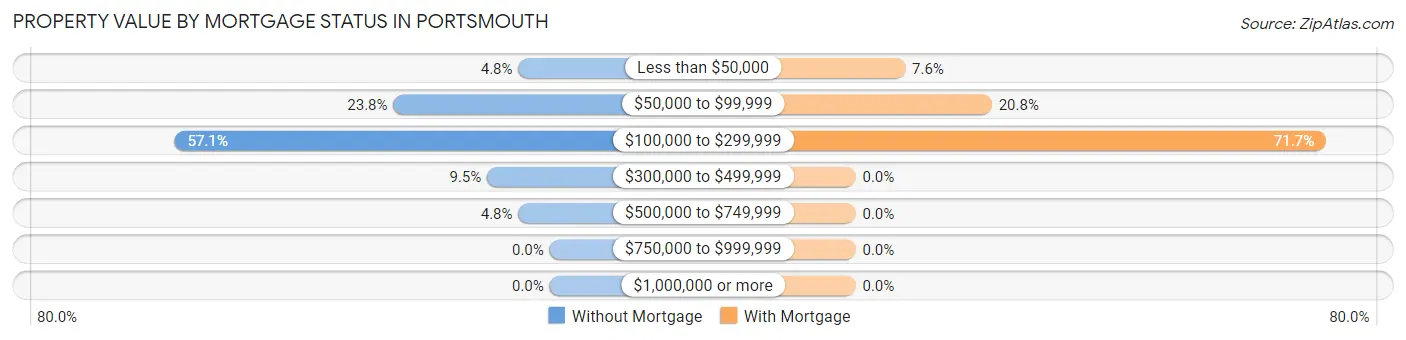
| Property Value | Without Mortgage | With Mortgage |
| Less than $50,000 | 1 (4.8%) | 4 (7.5%) |
| $50,000 to $99,999 | 5 (23.8%) | 11 (20.7%) |
| $100,000 to $299,999 | 12 (57.1%) | 38 (71.7%) |
| $300,000 to $499,999 | 2 (9.5%) | 0 (0.0%) |
| $500,000 to $749,999 | 1 (4.8%) | 0 (0.0%) |
| $750,000 to $999,999 | 0 (0.0%) | 0 (0.0%) |
| $1,000,000 or more | 0 (0.0%) | 0 (0.0%) |
| Total | 21 (100.0%) | 53 (100.0%) |
Household Income by Mortgage Status in Portsmouth
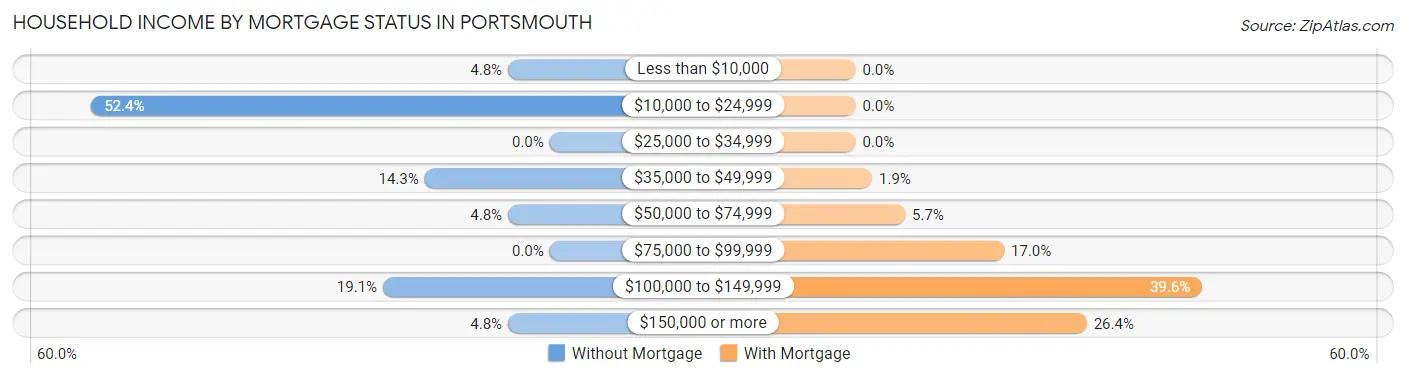
| Household Income | Without Mortgage | With Mortgage |
| Less than $10,000 | 1 (4.8%) | 0 (0.0%) |
| $10,000 to $24,999 | 11 (52.4%) | 0 (0.0%) |
| $25,000 to $34,999 | 0 (0.0%) | 0 (0.0%) |
| $35,000 to $49,999 | 3 (14.3%) | 1 (1.9%) |
| $50,000 to $74,999 | 1 (4.8%) | 3 (5.7%) |
| $75,000 to $99,999 | 0 (0.0%) | 9 (17.0%) |
| $100,000 to $149,999 | 4 (19.1%) | 21 (39.6%) |
| $150,000 or more | 1 (4.8%) | 14 (26.4%) |
| Total | 21 (100.0%) | 53 (100.0%) |
Property Value to Household Income Ratio in Portsmouth
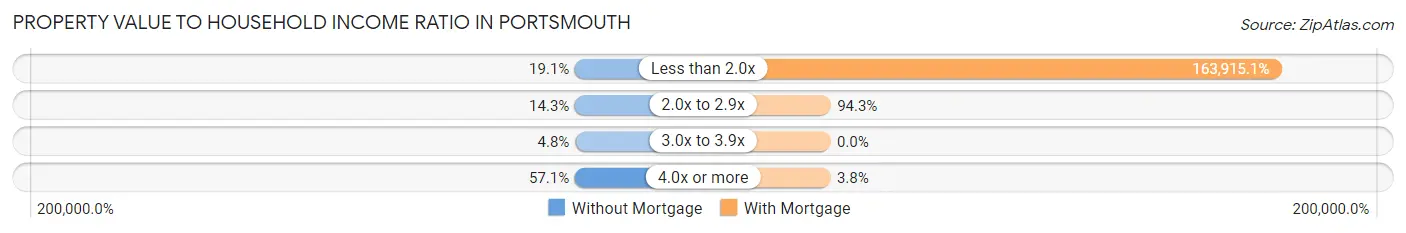
| Value-to-Income Ratio | Without Mortgage | With Mortgage |
| Less than 2.0x | 4 (19.1%) | 86,875 (163,915.1%) |
| 2.0x to 2.9x | 3 (14.3%) | 50 (94.3%) |
| 3.0x to 3.9x | 1 (4.8%) | 0 (0.0%) |
| 4.0x or more | 12 (57.1%) | 2 (3.8%) |
| Total | 21 (100.0%) | 53 (100.0%) |
Real Estate Taxes by Mortgage Status in Portsmouth
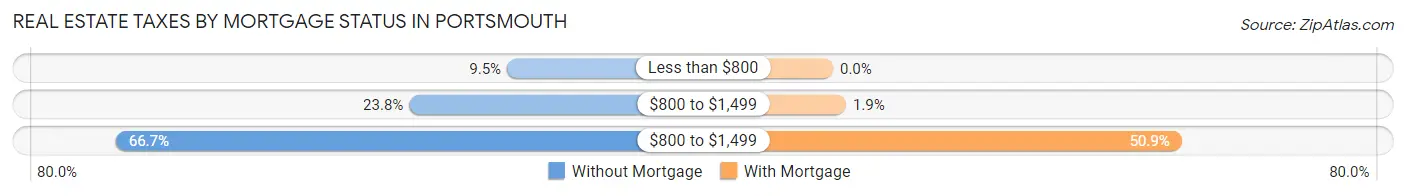
| Property Taxes | Without Mortgage | With Mortgage |
| Less than $800 | 2 (9.5%) | 0 (0.0%) |
| $800 to $1,499 | 5 (23.8%) | 1 (1.9%) |
| $800 to $1,499 | 14 (66.7%) | 27 (50.9%) |
| Total | 21 (100.0%) | 53 (100.0%) |
Health & Disability in Portsmouth
Health Insurance Coverage by Age in Portsmouth
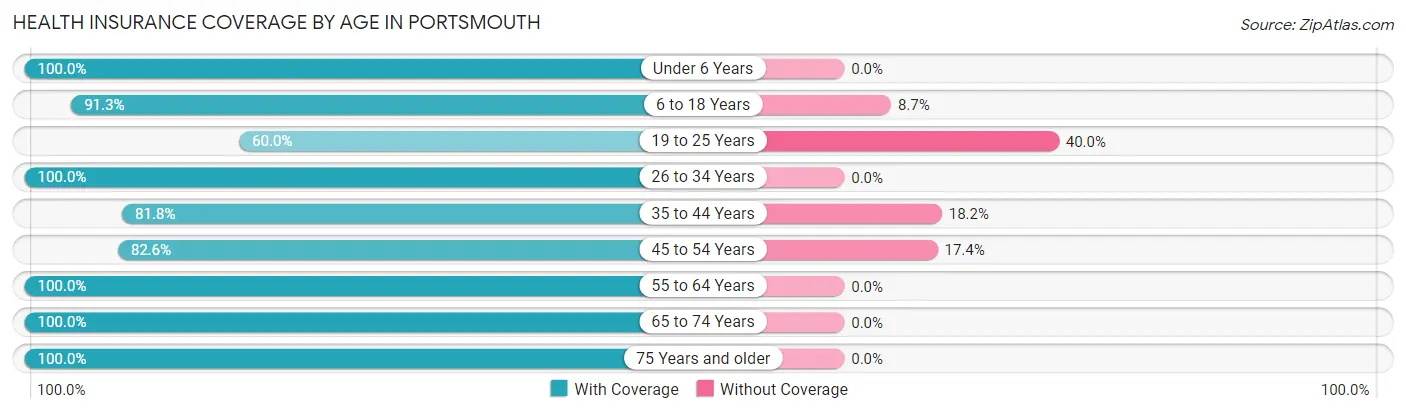
| Age Bracket | With Coverage | Without Coverage |
| Under 6 Years | 16 (100.0%) | 0 (0.0%) |
| 6 to 18 Years | 21 (91.3%) | 2 (8.7%) |
| 19 to 25 Years | 3 (60.0%) | 2 (40.0%) |
| 26 to 34 Years | 27 (100.0%) | 0 (0.0%) |
| 35 to 44 Years | 9 (81.8%) | 2 (18.2%) |
| 45 to 54 Years | 19 (82.6%) | 4 (17.4%) |
| 55 to 64 Years | 34 (100.0%) | 0 (0.0%) |
| 65 to 74 Years | 23 (100.0%) | 0 (0.0%) |
| 75 Years and older | 13 (100.0%) | 0 (0.0%) |
| Total | 165 (94.3%) | 10 (5.7%) |
Health Insurance Coverage by Citizenship Status in Portsmouth
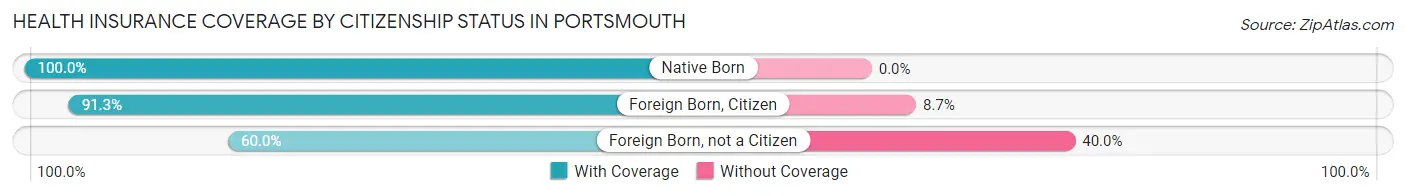
| Citizenship Status | With Coverage | Without Coverage |
| Native Born | 16 (100.0%) | 0 (0.0%) |
| Foreign Born, Citizen | 21 (91.3%) | 2 (8.7%) |
| Foreign Born, not a Citizen | 3 (60.0%) | 2 (40.0%) |
Health Insurance Coverage by Household Income in Portsmouth
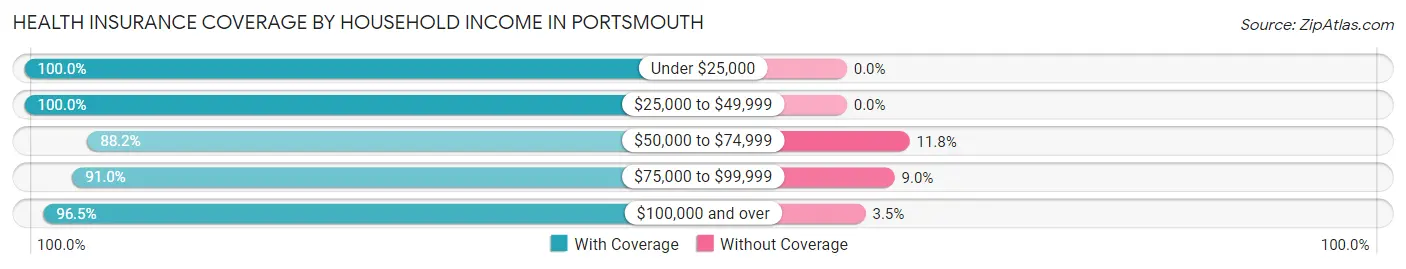
| Household Income | With Coverage | Without Coverage |
| Under $25,000 | 19 (100.0%) | 0 (0.0%) |
| $25,000 to $49,999 | 15 (100.0%) | 0 (0.0%) |
| $50,000 to $74,999 | 15 (88.2%) | 2 (11.8%) |
| $75,000 to $99,999 | 61 (91.0%) | 6 (9.0%) |
| $100,000 and over | 55 (96.5%) | 2 (3.5%) |
Public vs Private Health Insurance Coverage by Age in Portsmouth
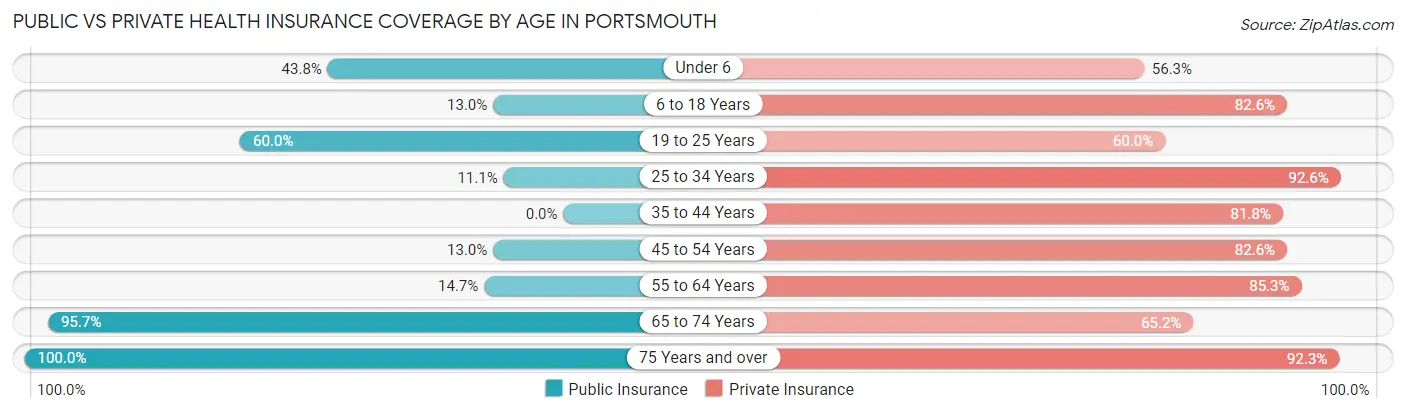
| Age Bracket | Public Insurance | Private Insurance |
| Under 6 | 7 (43.8%) | 9 (56.2%) |
| 6 to 18 Years | 3 (13.0%) | 19 (82.6%) |
| 19 to 25 Years | 3 (60.0%) | 3 (60.0%) |
| 25 to 34 Years | 3 (11.1%) | 25 (92.6%) |
| 35 to 44 Years | 0 (0.0%) | 9 (81.8%) |
| 45 to 54 Years | 3 (13.0%) | 19 (82.6%) |
| 55 to 64 Years | 5 (14.7%) | 29 (85.3%) |
| 65 to 74 Years | 22 (95.7%) | 15 (65.2%) |
| 75 Years and over | 13 (100.0%) | 12 (92.3%) |
| Total | 59 (33.7%) | 140 (80.0%) |
Disability Status by Sex by Age in Portsmouth
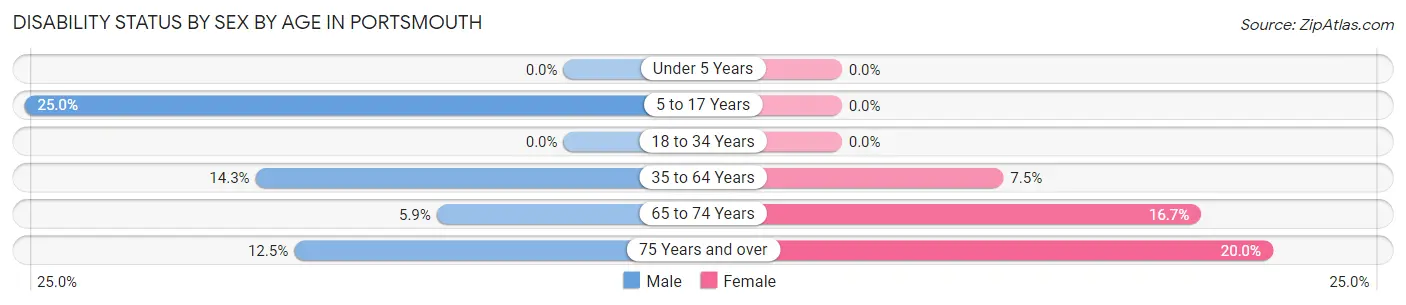
| Age Bracket | Male | Female |
| Under 5 Years | 0 (0.0%) | 0 (0.0%) |
| 5 to 17 Years | 2 (25.0%) | 0 (0.0%) |
| 18 to 34 Years | 0 (0.0%) | 0 (0.0%) |
| 35 to 64 Years | 4 (14.3%) | 3 (7.5%) |
| 65 to 74 Years | 1 (5.9%) | 1 (16.7%) |
| 75 Years and over | 1 (12.5%) | 1 (20.0%) |
Disability Class by Sex by Age in Portsmouth
Disability Class: Hearing Difficulty
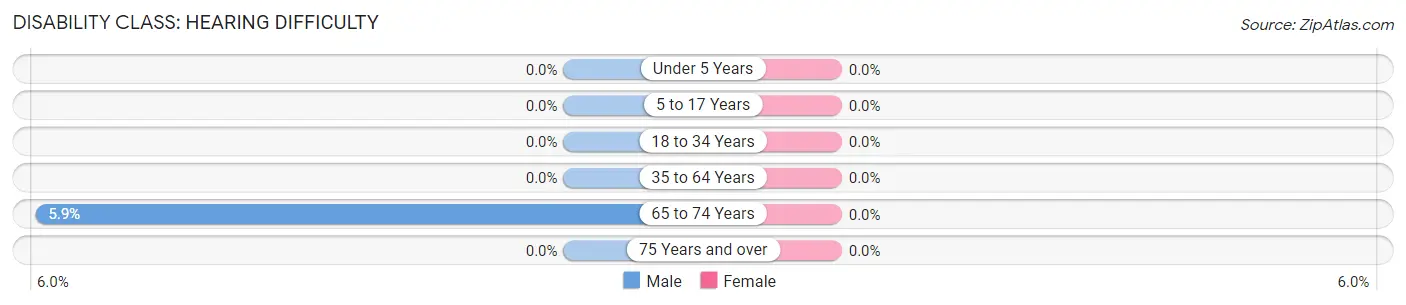
| Age Bracket | Male | Female |
| Under 5 Years | 0 (0.0%) | 0 (0.0%) |
| 5 to 17 Years | 0 (0.0%) | 0 (0.0%) |
| 18 to 34 Years | 0 (0.0%) | 0 (0.0%) |
| 35 to 64 Years | 0 (0.0%) | 0 (0.0%) |
| 65 to 74 Years | 1 (5.9%) | 0 (0.0%) |
| 75 Years and over | 0 (0.0%) | 0 (0.0%) |
Disability Class: Vision Difficulty
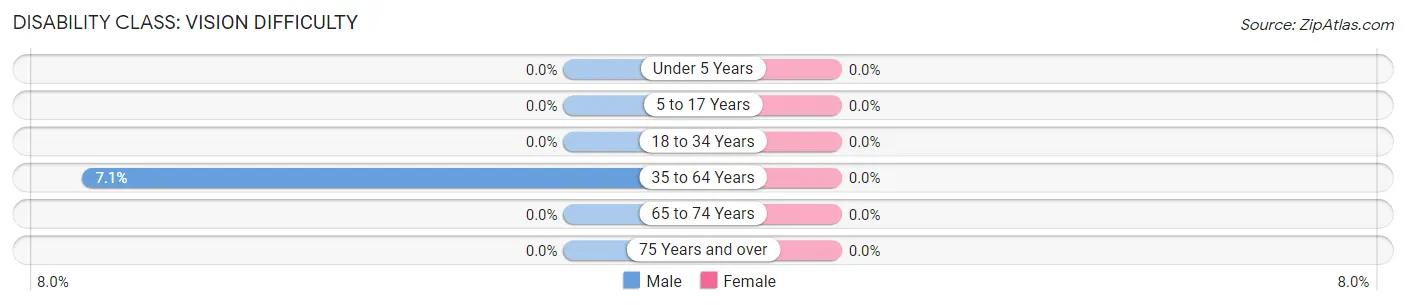
| Age Bracket | Male | Female |
| Under 5 Years | 0 (0.0%) | 0 (0.0%) |
| 5 to 17 Years | 0 (0.0%) | 0 (0.0%) |
| 18 to 34 Years | 0 (0.0%) | 0 (0.0%) |
| 35 to 64 Years | 2 (7.1%) | 0 (0.0%) |
| 65 to 74 Years | 0 (0.0%) | 0 (0.0%) |
| 75 Years and over | 0 (0.0%) | 0 (0.0%) |
Disability Class: Cognitive Difficulty
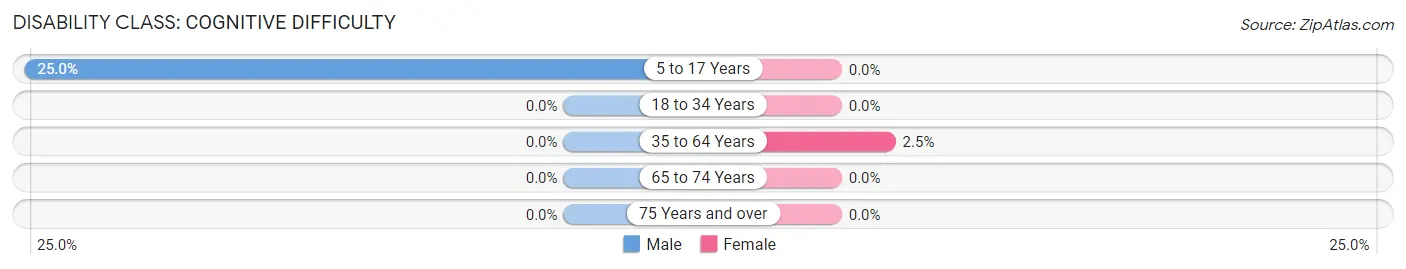
| Age Bracket | Male | Female |
| 5 to 17 Years | 2 (25.0%) | 0 (0.0%) |
| 18 to 34 Years | 0 (0.0%) | 0 (0.0%) |
| 35 to 64 Years | 0 (0.0%) | 1 (2.5%) |
| 65 to 74 Years | 0 (0.0%) | 0 (0.0%) |
| 75 Years and over | 0 (0.0%) | 0 (0.0%) |
Disability Class: Ambulatory Difficulty
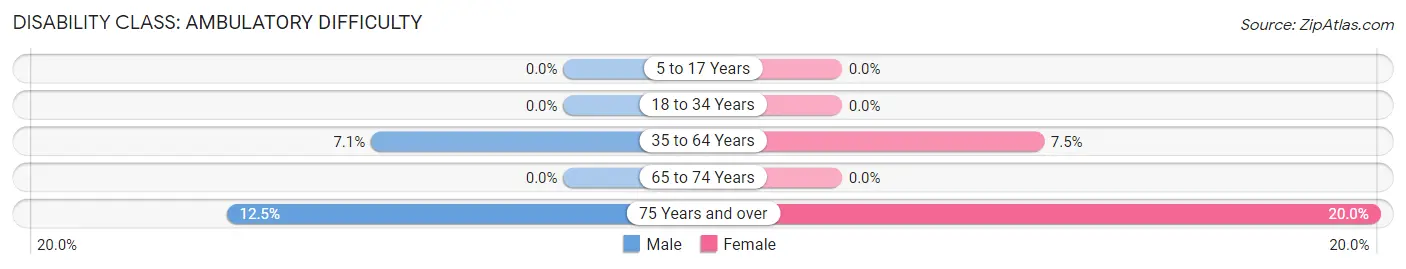
| Age Bracket | Male | Female |
| 5 to 17 Years | 0 (0.0%) | 0 (0.0%) |
| 18 to 34 Years | 0 (0.0%) | 0 (0.0%) |
| 35 to 64 Years | 2 (7.1%) | 3 (7.5%) |
| 65 to 74 Years | 0 (0.0%) | 0 (0.0%) |
| 75 Years and over | 1 (12.5%) | 1 (20.0%) |
Disability Class: Self-Care Difficulty
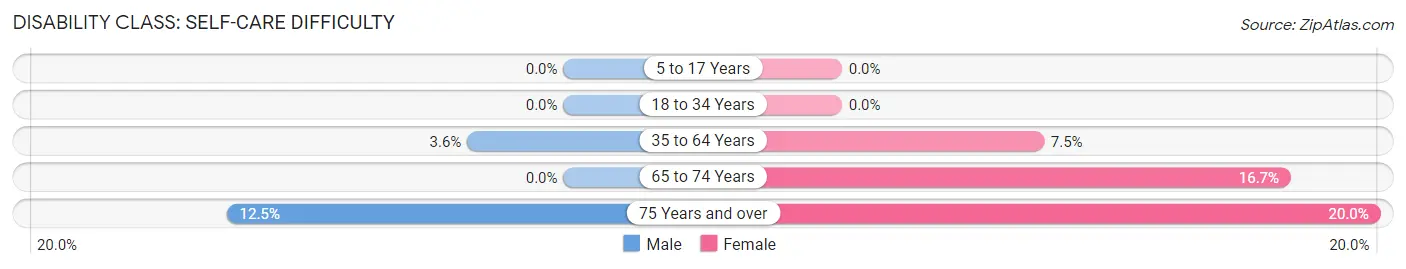
| Age Bracket | Male | Female |
| 5 to 17 Years | 0 (0.0%) | 0 (0.0%) |
| 18 to 34 Years | 0 (0.0%) | 0 (0.0%) |
| 35 to 64 Years | 1 (3.6%) | 3 (7.5%) |
| 65 to 74 Years | 0 (0.0%) | 1 (16.7%) |
| 75 Years and over | 1 (12.5%) | 1 (20.0%) |
Technology Access in Portsmouth
Computing Device Access in Portsmouth
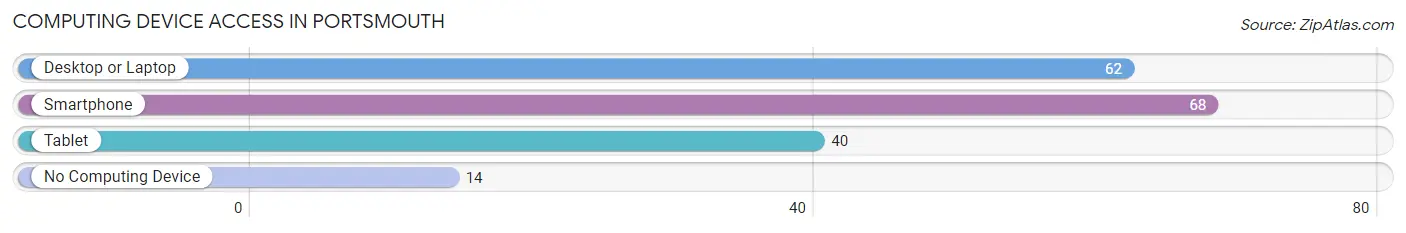
| Device Type | # Households | % Households |
| Desktop or Laptop | 62 | 71.3% |
| Smartphone | 68 | 78.2% |
| Tablet | 40 | 46.0% |
| No Computing Device | 14 | 16.1% |
| Total | 87 | 100.0% |
Internet Access in Portsmouth
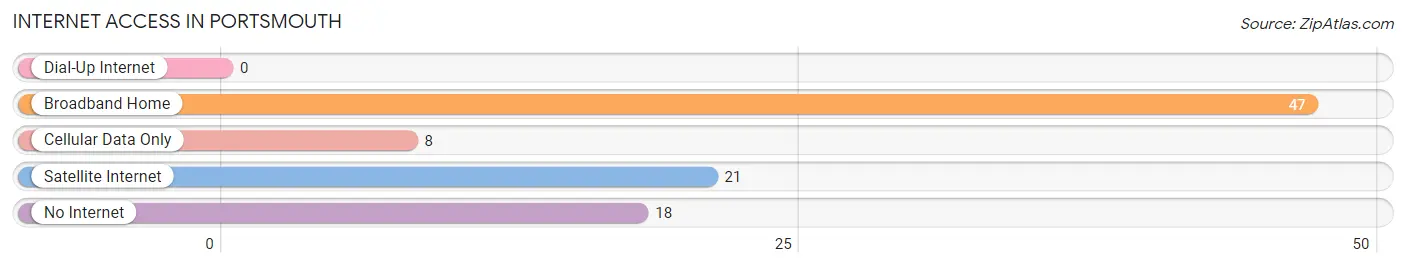
| Internet Type | # Households | % Households |
| Dial-Up Internet | 0 | 0.0% |
| Broadband Home | 47 | 54.0% |
| Cellular Data Only | 8 | 9.2% |
| Satellite Internet | 21 | 24.1% |
| No Internet | 18 | 20.7% |
| Total | 87 | 100.0% |
Portsmouth Summary
Portsmouth, Iowa is a small city located in the southwestern corner of the state, in the county of Scott. It is situated on the banks of the Mississippi River, and is part of the Quad Cities metropolitan area. The city has a population of approximately 4,000 people, and is the county seat of Scott County.
History
Portsmouth was founded in 1837 by a group of settlers from Ohio, led by William and Mary Ann Porter. The city was named after the port city of Portsmouth, England. The settlers were attracted to the area due to its proximity to the Mississippi River, which provided a means of transportation and trade.
The city was incorporated in 1839, and the first mayor was elected in 1840. In 1845, the first school was established, and in 1847, the first church was built. The city continued to grow throughout the 19th century, and by the turn of the century, it had become a thriving commercial center.
In the early 20th century, Portsmouth was a major hub for the lumber industry, and the city was home to several large sawmills. The city also had a thriving agricultural industry, and was home to several large farms.
In the 1950s, the city began to experience a decline in population, as many of its residents moved away in search of better economic opportunities. This trend continued into the 1960s and 1970s, and by the 1980s, the city had become a virtual ghost town.
In the 1990s, the city began to experience a resurgence, as new businesses and industries moved into the area. Today, Portsmouth is a vibrant and growing city, with a diverse economy and a strong sense of community.
Geography
Portsmouth is located in the southwestern corner of Iowa, in the county of Scott. It is situated on the banks of the Mississippi River, and is part of the Quad Cities metropolitan area. The city has a total area of 4.2 square miles, all of which is land.
The city is located in a hilly region, and is surrounded by rolling hills and wooded areas. The climate is humid continental, with hot summers and cold winters. The average annual temperature is around 50 degrees Fahrenheit.
Economy
Portsmouth has a diverse economy, with a variety of industries and businesses. The city is home to several manufacturing companies, including a paper mill, a plastics factory, and a metal fabrication plant. The city is also home to several retail stores, restaurants, and other businesses.
The city is also home to several educational institutions, including a community college and a technical school. The city is also home to a hospital, and several medical and dental offices.
Demographics
As of the 2010 census, the population of Portsmouth was 4,000. The racial makeup of the city was 95.3% White, 1.2% African American, 0.3% Native American, 0.7% Asian, 0.1% Pacific Islander, and 2.4% from other races. The median household income was $37,000, and the median family income was $45,000.
The city has a large number of residents who are of German, Irish, and English descent. The city also has a large number of residents who are of Hispanic or Latino origin. The city has a large number of churches, and is home to several religious denominations.
Common Questions
What is Per Capita Income in Portsmouth?
Per Capita income in Portsmouth is $37,514.
What is the Median Family Income in Portsmouth?
Median Family Income in Portsmouth is $91,000.
What is the Median Household income in Portsmouth?
Median Household Income in Portsmouth is $78,125.
What is Income or Wage Gap in Portsmouth?
Income or Wage Gap in Portsmouth is 37.9%.
Women in Portsmouth earn 62.1 cents for every dollar earned by a man.
What is Inequality or Gini Index in Portsmouth?
Inequality or Gini Index in Portsmouth is 0.33.
What is the Total Population of Portsmouth?
Total Population of Portsmouth is 175.
What is the Total Male Population of Portsmouth?
Total Male Population of Portsmouth is 82.
What is the Total Female Population of Portsmouth?
Total Female Population of Portsmouth is 93.
What is the Ratio of Males per 100 Females in Portsmouth?
There are 88.17 Males per 100 Females in Portsmouth.
What is the Ratio of Females per 100 Males in Portsmouth?
There are 113.41 Females per 100 Males in Portsmouth.
What is the Median Population Age in Portsmouth?
Median Population Age in Portsmouth is 50.5 Years.
What is the Average Family Size in Portsmouth
Average Family Size in Portsmouth is 2.6 People.
What is the Average Household Size in Portsmouth
Average Household Size in Portsmouth is 2.0 People.
How Large is the Labor Force in Portsmouth?
There are 108 People in the Labor Forcein in Portsmouth.
What is the Percentage of People in the Labor Force in Portsmouth?
78.3% of People are in the Labor Force in Portsmouth.