Holly Springs, GA Map & Demographics
Holly Springs Map
Holly Springs Overview
$39,935
PER CAPITA INCOME
$114,868
AVG FAMILY INCOME
$108,332
AVG HOUSEHOLD INCOME
22.3%
WAGE / INCOME GAP [ % ]
77.7¢/ $1
WAGE / INCOME GAP [ $ ]
0.36
INEQUALITY / GINI INDEX
16,675
TOTAL POPULATION
8,259
MALE POPULATION
8,416
FEMALE POPULATION
98.13
MALES / 100 FEMALES
101.90
FEMALES / 100 MALES
39.1
MEDIAN AGE
3.2
AVG FAMILY SIZE
2.8
AVG HOUSEHOLD SIZE
9,213
LABOR FORCE [ PEOPLE ]
72.5%
PERCENT IN LABOR FORCE
3.1%
UNEMPLOYMENT RATE
Income in Holly Springs
Income Overview in Holly Springs
Per Capita Income in Holly Springs is $39,935, while median incomes of families and households are $114,868 and $108,332 respectively.
| Characteristic | Number | Measure |
| Per Capita Income | 16,675 | $39,935 |
| Median Family Income | 4,526 | $114,868 |
| Mean Family Income | 4,526 | $127,626 |
| Median Household Income | 6,013 | $108,332 |
| Mean Household Income | 6,013 | $112,794 |
| Income Deficit | 4,526 | $0 |
| Wage / Income Gap (%) | 16,675 | 22.30% |
| Wage / Income Gap ($) | 16,675 | 77.70¢ per $1 |
| Gini / Inequality Index | 16,675 | 0.36 |
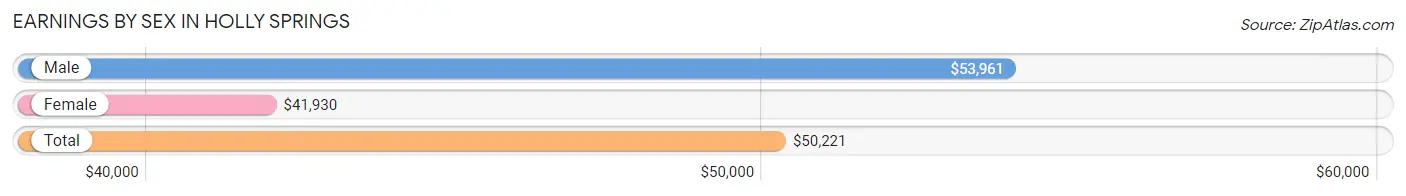
Earnings by Sex in Holly Springs
Average Earnings in Holly Springs are $50,221, $53,961 for men and $41,930 for women, a difference of 22.3%.
| Sex | Number | Average Earnings |
| Male | 5,021 (53.9%) | $53,961 |
| Female | 4,292 (46.1%) | $41,930 |
| Total | 9,313 (100.0%) | $50,221 |
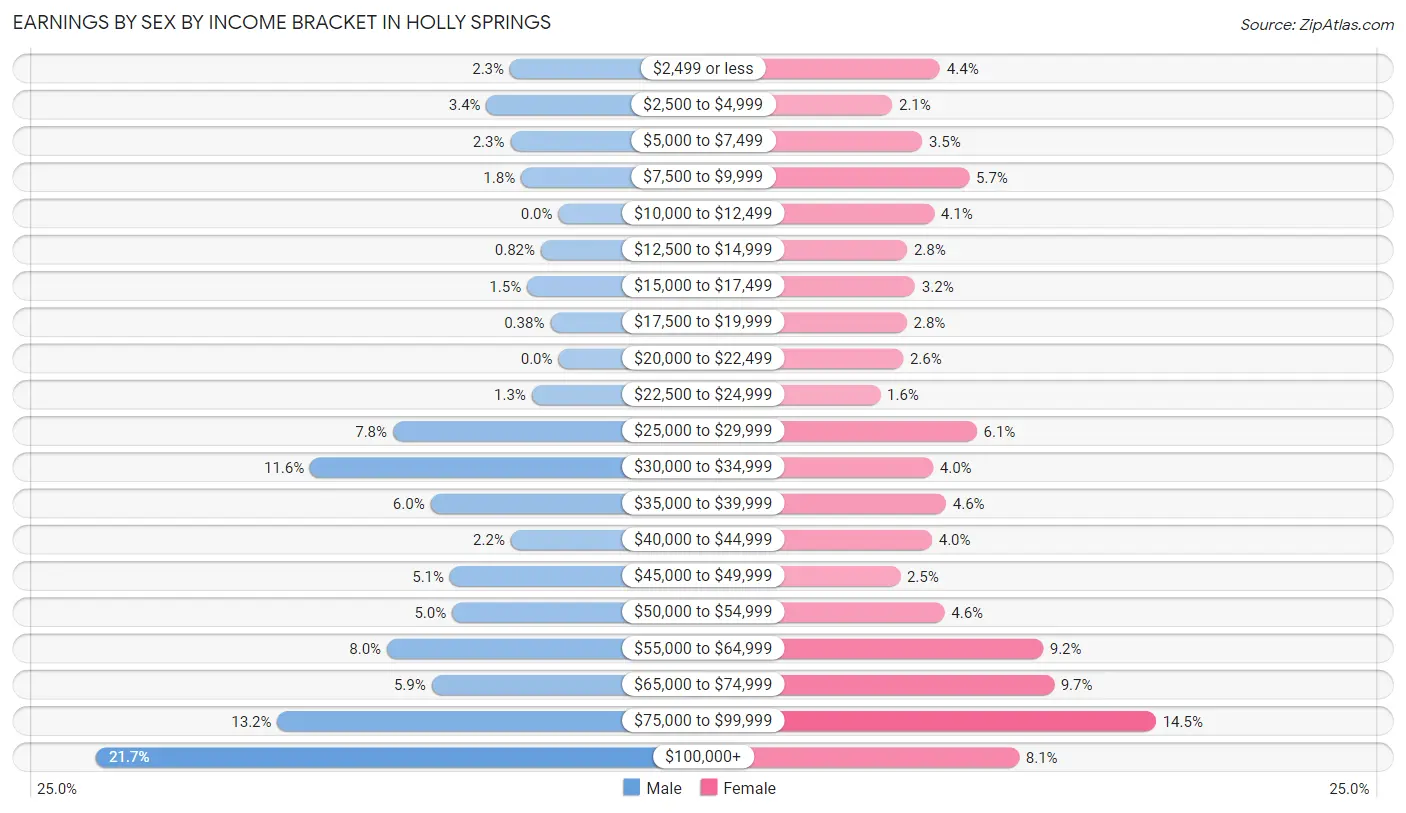
Earnings by Sex by Income Bracket in Holly Springs
The most common earnings brackets in Holly Springs are $100,000+ for men (1,087 | 21.6%) and $75,000 to $99,999 for women (621 | 14.5%).
| Income | Male | Female |
| $2,499 or less | 114 (2.3%) | 187 (4.4%) |
| $2,500 to $4,999 | 169 (3.4%) | 91 (2.1%) |
| $5,000 to $7,499 | 113 (2.2%) | 151 (3.5%) |
| $7,500 to $9,999 | 88 (1.8%) | 246 (5.7%) |
| $10,000 to $12,499 | 0 (0.0%) | 175 (4.1%) |
| $12,500 to $14,999 | 41 (0.8%) | 121 (2.8%) |
| $15,000 to $17,499 | 74 (1.5%) | 137 (3.2%) |
| $17,500 to $19,999 | 19 (0.4%) | 120 (2.8%) |
| $20,000 to $22,499 | 0 (0.0%) | 113 (2.6%) |
| $22,500 to $24,999 | 63 (1.3%) | 67 (1.6%) |
| $25,000 to $29,999 | 389 (7.7%) | 261 (6.1%) |
| $30,000 to $34,999 | 584 (11.6%) | 173 (4.0%) |
| $35,000 to $39,999 | 301 (6.0%) | 199 (4.6%) |
| $40,000 to $44,999 | 112 (2.2%) | 171 (4.0%) |
| $45,000 to $49,999 | 255 (5.1%) | 107 (2.5%) |
| $50,000 to $54,999 | 250 (5.0%) | 196 (4.6%) |
| $55,000 to $64,999 | 403 (8.0%) | 394 (9.2%) |
| $65,000 to $74,999 | 298 (5.9%) | 416 (9.7%) |
| $75,000 to $99,999 | 661 (13.2%) | 621 (14.5%) |
| $100,000+ | 1,087 (21.6%) | 346 (8.1%) |
| Total | 5,021 (100.0%) | 4,292 (100.0%) |
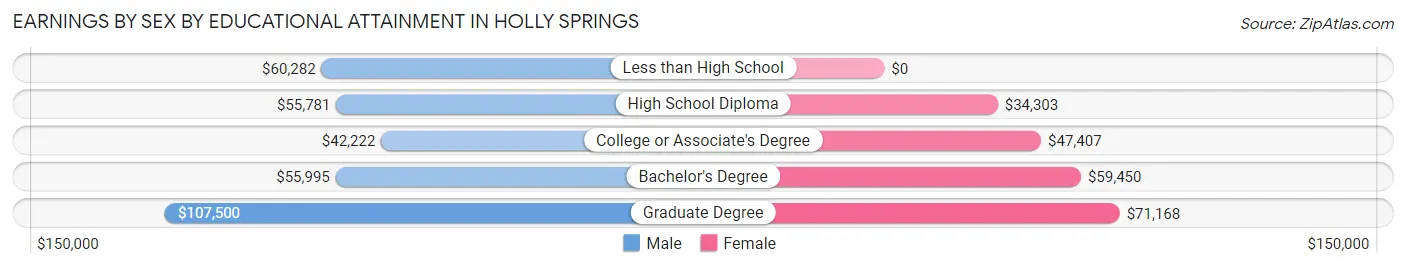
Earnings by Sex by Educational Attainment in Holly Springs
Average earnings in Holly Springs are $59,573 for men and $53,760 for women, a difference of 9.8%. Men with an educational attainment of graduate degree enjoy the highest average annual earnings of $107,500, while those with college or associate's degree education earn the least with $42,222. Women with an educational attainment of graduate degree earn the most with the average annual earnings of $71,168, while those with high school diploma education have the smallest earnings of $34,303.
| Educational Attainment | Male Income | Female Income |
| Less than High School | $60,282 | $0 |
| High School Diploma | $55,781 | $34,303 |
| College or Associate's Degree | $42,222 | $47,407 |
| Bachelor's Degree | $55,995 | $59,450 |
| Graduate Degree | $107,500 | $71,168 |
| Total | $59,573 | $53,760 |
Family Income in Holly Springs
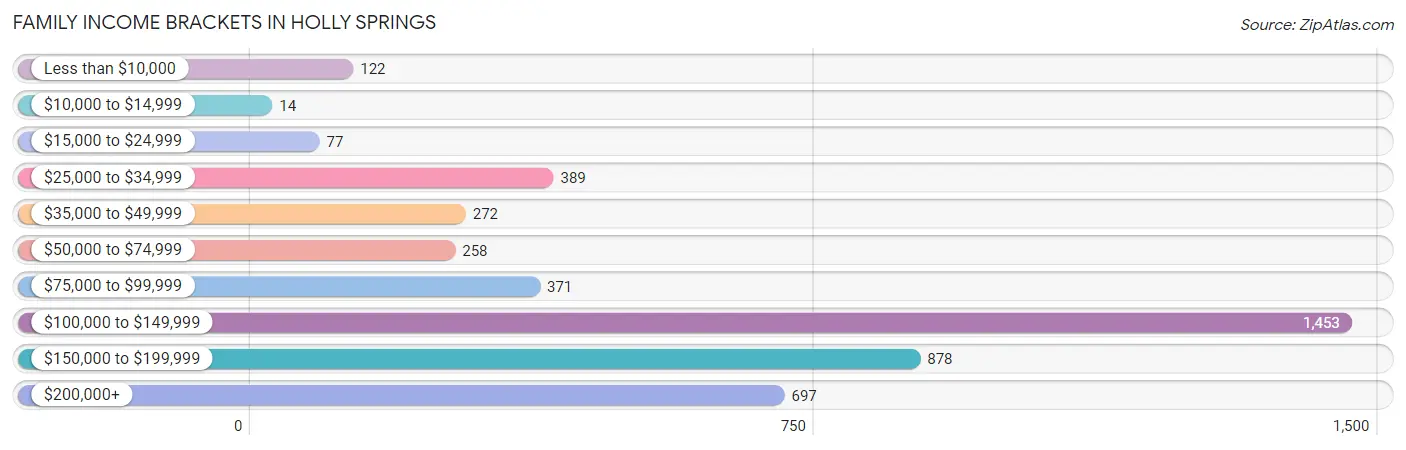
Family Income Brackets in Holly Springs
According to the Holly Springs family income data, there are 1,453 families falling into the $100,000 to $149,999 income range, which is the most common income bracket and makes up 32.1% of all families. Conversely, the $10,000 to $14,999 income bracket is the least frequent group with only 14 families (0.3%) belonging to this category.
| Income Bracket | # Families | % Families |
| Less than $10,000 | 122 | 2.7% |
| $10,000 to $14,999 | 14 | 0.3% |
| $15,000 to $24,999 | 77 | 1.7% |
| $25,000 to $34,999 | 389 | 8.6% |
| $35,000 to $49,999 | 272 | 6.0% |
| $50,000 to $74,999 | 258 | 5.7% |
| $75,000 to $99,999 | 371 | 8.2% |
| $100,000 to $149,999 | 1,453 | 32.1% |
| $150,000 to $199,999 | 878 | 19.4% |
| $200,000+ | 697 | 15.4% |
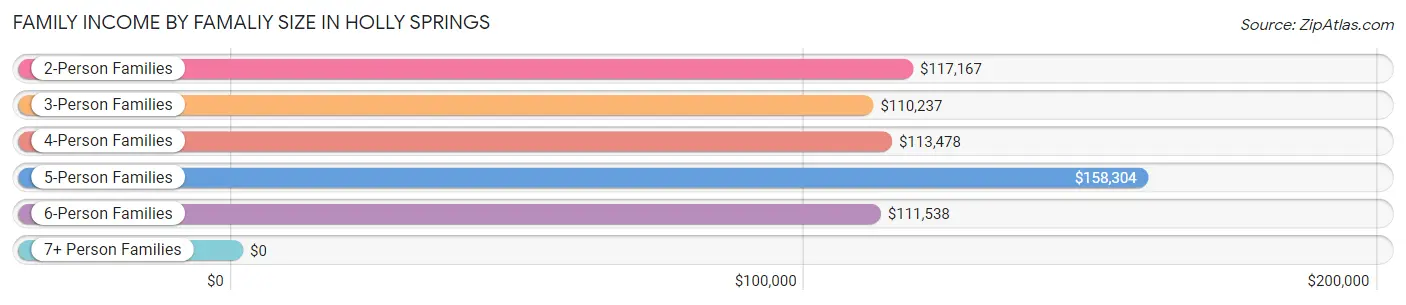
Family Income by Famaliy Size in Holly Springs
5-person families (461 | 10.2%) account for the highest median family income in Holly Springs with $158,304 per family, while 2-person families (1,552 | 34.3%) have the highest median income of $58,584 per family member.
| Income Bracket | # Families | Median Income |
| 2-Person Families | 1,552 (34.3%) | $117,167 |
| 3-Person Families | 1,125 (24.9%) | $110,237 |
| 4-Person Families | 1,052 (23.2%) | $113,478 |
| 5-Person Families | 461 (10.2%) | $158,304 |
| 6-Person Families | 238 (5.3%) | $111,538 |
| 7+ Person Families | 98 (2.2%) | $0 |
| Total | 4,526 (100.0%) | $114,868 |
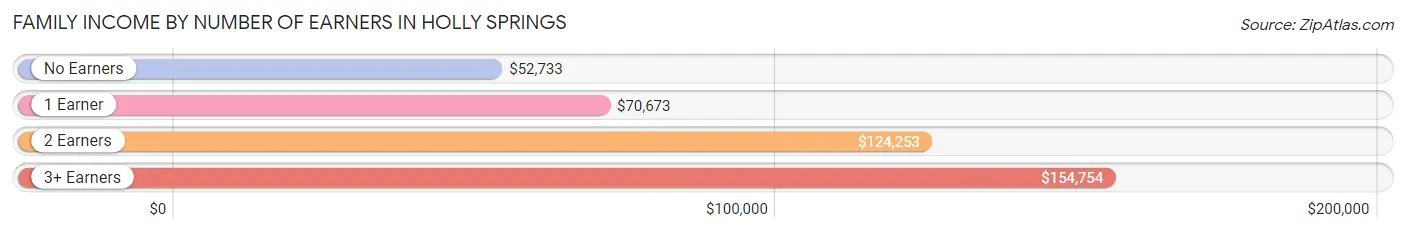
Family Income by Number of Earners in Holly Springs
The median family income in Holly Springs is $114,868, with families comprising 3+ earners (686) having the highest median family income of $154,754, while families with no earners (378) have the lowest median family income of $52,733, accounting for 15.2% and 8.4% of families, respectively.
| Number of Earners | # Families | Median Income |
| No Earners | 378 (8.4%) | $52,733 |
| 1 Earner | 1,387 (30.6%) | $70,673 |
| 2 Earners | 2,075 (45.9%) | $124,253 |
| 3+ Earners | 686 (15.2%) | $154,754 |
| Total | 4,526 (100.0%) | $114,868 |
Household Income in Holly Springs
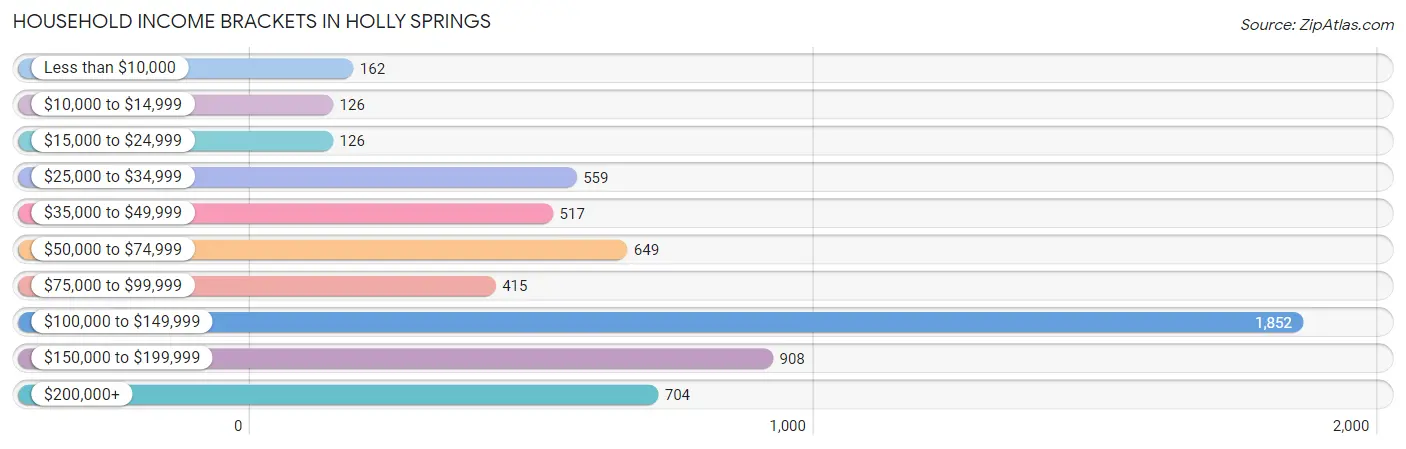
Household Income Brackets in Holly Springs
With 1,852 households falling in the category, the $100,000 to $149,999 income range is the most frequent in Holly Springs, accounting for 30.8% of all households. In contrast, only 126 households (2.1%) fall into the $10,000 to $14,999 income bracket, making it the least populous group.
| Income Bracket | # Households | % Households |
| Less than $10,000 | 162 | 2.7% |
| $10,000 to $14,999 | 126 | 2.1% |
| $15,000 to $24,999 | 126 | 2.1% |
| $25,000 to $34,999 | 559 | 9.3% |
| $35,000 to $49,999 | 517 | 8.6% |
| $50,000 to $74,999 | 649 | 10.8% |
| $75,000 to $99,999 | 415 | 6.9% |
| $100,000 to $149,999 | 1,852 | 30.8% |
| $150,000 to $199,999 | 908 | 15.1% |
| $200,000+ | 704 | 11.7% |
Household Income by Householder Age in Holly Springs
The median household income in Holly Springs is $108,332, with the highest median household income of $113,535 found in the 45 to 64 years age bracket for the primary householder. A total of 2,003 households (33.3%) fall into this category. Meanwhile, the 15 to 24 years age bracket for the primary householder has the lowest median household income of $0, with 47 households (0.8%) in this group.
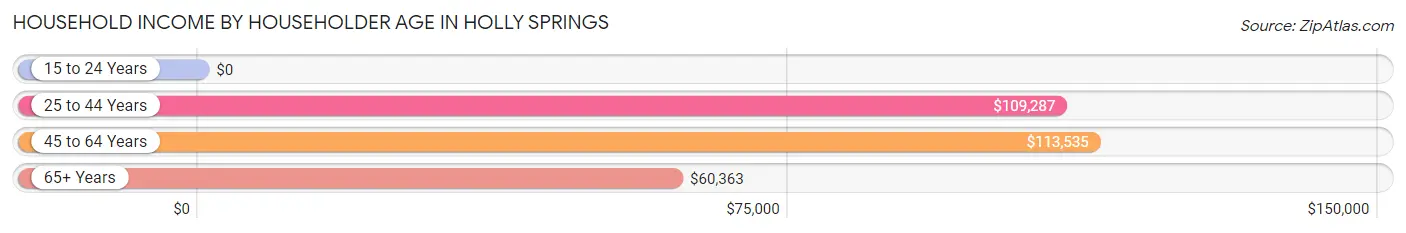
| Income Bracket | # Households | Median Income |
| 15 to 24 Years | 47 (0.8%) | $0 |
| 25 to 44 Years | 2,818 (46.9%) | $109,287 |
| 45 to 64 Years | 2,003 (33.3%) | $113,535 |
| 65+ Years | 1,145 (19.0%) | $60,363 |
| Total | 6,013 (100.0%) | $108,332 |
Poverty in Holly Springs
Income Below Poverty by Sex and Age in Holly Springs
With 3.0% poverty level for males and 5.0% for females among the residents of Holly Springs, 5 year old males and 75 year old and over females are the most vulnerable to poverty, with 10 males (14.1%) and 47 females (14.7%) in their respective age groups living below the poverty level.
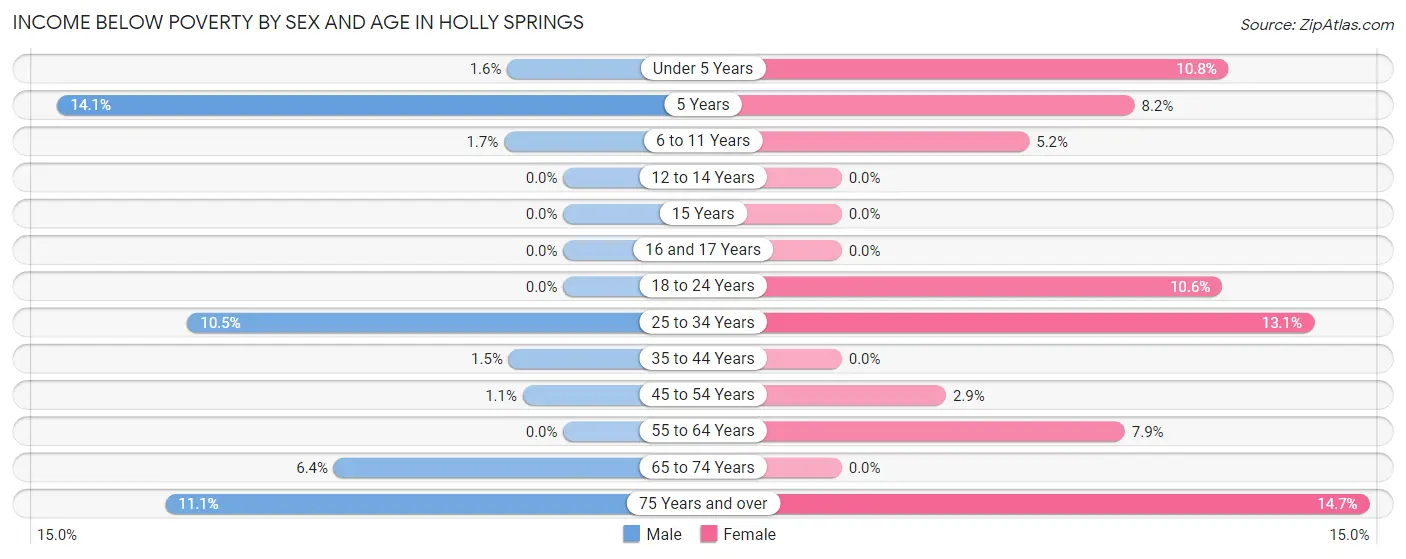
| Age Bracket | Male | Female |
| Under 5 Years | 10 (1.6%) | 46 (10.8%) |
| 5 Years | 10 (14.1%) | 11 (8.2%) |
| 6 to 11 Years | 10 (1.7%) | 42 (5.2%) |
| 12 to 14 Years | 0 (0.0%) | 0 (0.0%) |
| 15 Years | 0 (0.0%) | 0 (0.0%) |
| 16 and 17 Years | 0 (0.0%) | 0 (0.0%) |
| 18 to 24 Years | 0 (0.0%) | 66 (10.6%) |
| 25 to 34 Years | 94 (10.5%) | 124 (13.1%) |
| 35 to 44 Years | 23 (1.5%) | 0 (0.0%) |
| 45 to 54 Years | 16 (1.1%) | 32 (2.9%) |
| 55 to 64 Years | 0 (0.0%) | 55 (7.9%) |
| 65 to 74 Years | 43 (6.4%) | 0 (0.0%) |
| 75 Years and over | 40 (11.1%) | 47 (14.7%) |
| Total | 246 (3.0%) | 423 (5.0%) |
Income Above Poverty by Sex and Age in Holly Springs
According to the poverty statistics in Holly Springs, males aged 12 to 14 years and females aged 12 to 14 years are the age groups that are most secure financially, with 100.0% of males and 100.0% of females in these age groups living above the poverty line.
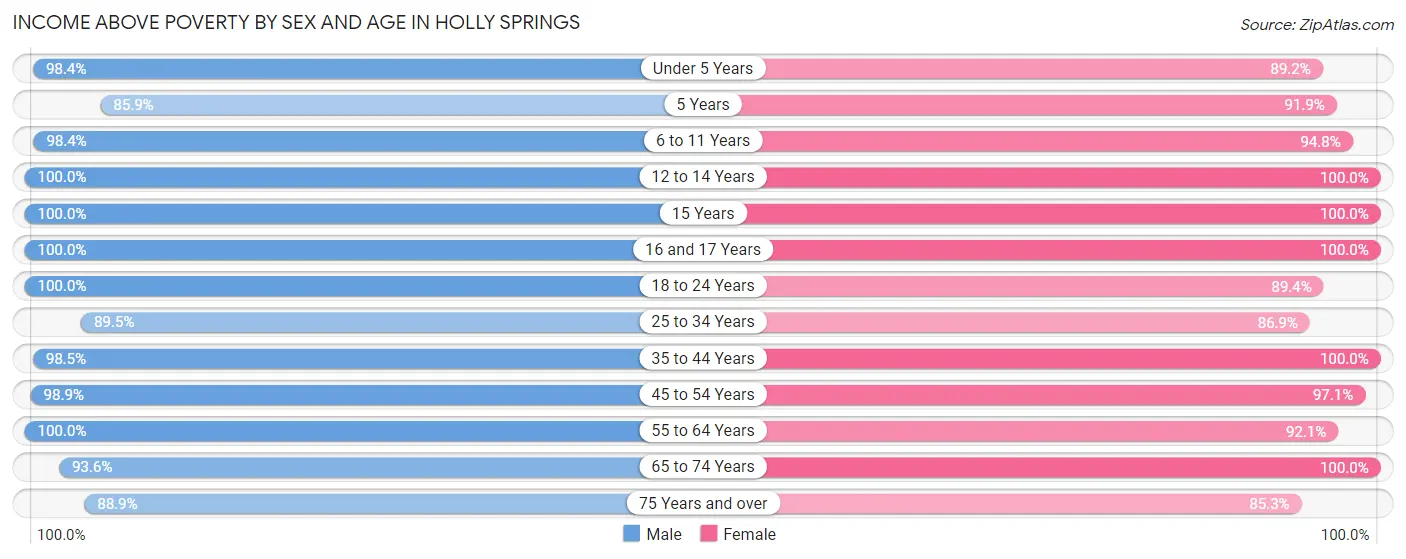
| Age Bracket | Male | Female |
| Under 5 Years | 630 (98.4%) | 381 (89.2%) |
| 5 Years | 61 (85.9%) | 124 (91.8%) |
| 6 to 11 Years | 595 (98.4%) | 763 (94.8%) |
| 12 to 14 Years | 598 (100.0%) | 356 (100.0%) |
| 15 Years | 208 (100.0%) | 123 (100.0%) |
| 16 and 17 Years | 226 (100.0%) | 239 (100.0%) |
| 18 to 24 Years | 573 (100.0%) | 557 (89.4%) |
| 25 to 34 Years | 804 (89.5%) | 820 (86.9%) |
| 35 to 44 Years | 1,491 (98.5%) | 1,824 (100.0%) |
| 45 to 54 Years | 1,398 (98.9%) | 1,070 (97.1%) |
| 55 to 64 Years | 478 (100.0%) | 643 (92.1%) |
| 65 to 74 Years | 630 (93.6%) | 820 (100.0%) |
| 75 Years and over | 321 (88.9%) | 273 (85.3%) |
| Total | 8,013 (97.0%) | 7,993 (95.0%) |
Income Below Poverty Among Married-Couple Families in Holly Springs
The poverty statistics for married-couple families in Holly Springs show that 3.4% or 131 of the total 3,910 families live below the poverty line. Families with 3 or 4 children have the highest poverty rate of 5.9%, comprising of 36 families. On the other hand, families with 1 or 2 children have the lowest poverty rate of 1.4%, which includes 23 families.
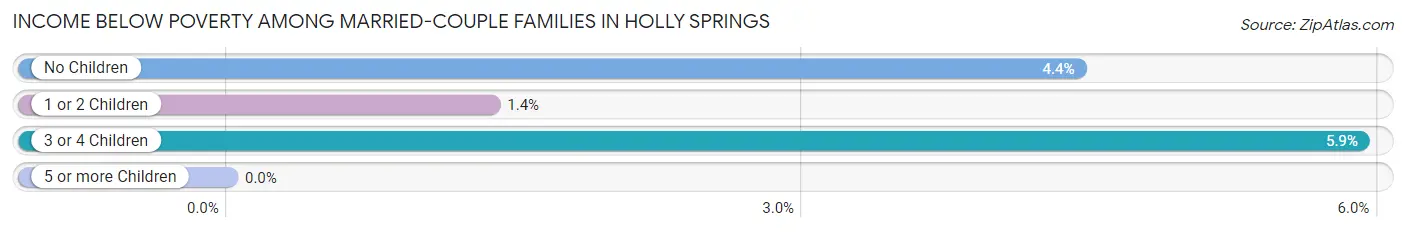
| Children | Above Poverty | Below Poverty |
| No Children | 1,555 (95.6%) | 72 (4.4%) |
| 1 or 2 Children | 1,651 (98.6%) | 23 (1.4%) |
| 3 or 4 Children | 573 (94.1%) | 36 (5.9%) |
| 5 or more Children | 0 (0.0%) | 0 (0.0%) |
| Total | 3,779 (96.7%) | 131 (3.4%) |
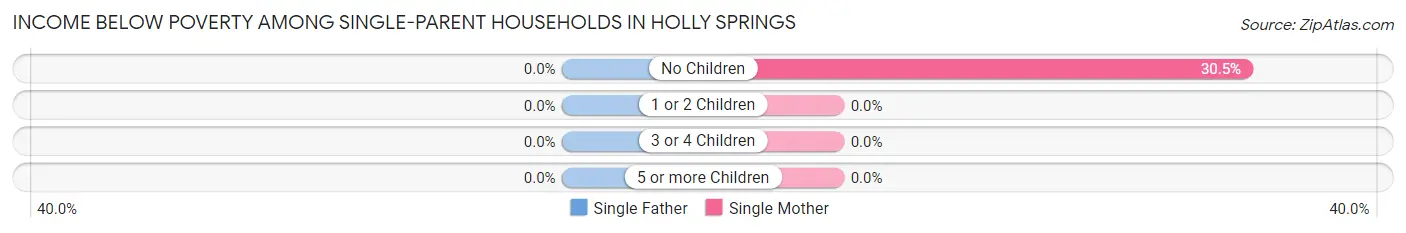
Income Below Poverty Among Single-Parent Households in Holly Springs
| Children | Single Father | Single Mother |
| No Children | 0 (0.0%) | 25 (30.5%) |
| 1 or 2 Children | 0 (0.0%) | 0 (0.0%) |
| 3 or 4 Children | 0 (0.0%) | 0 (0.0%) |
| 5 or more Children | 0 (0.0%) | 0 (0.0%) |
| Total | 0 (0.0%) | 25 (5.0%) |
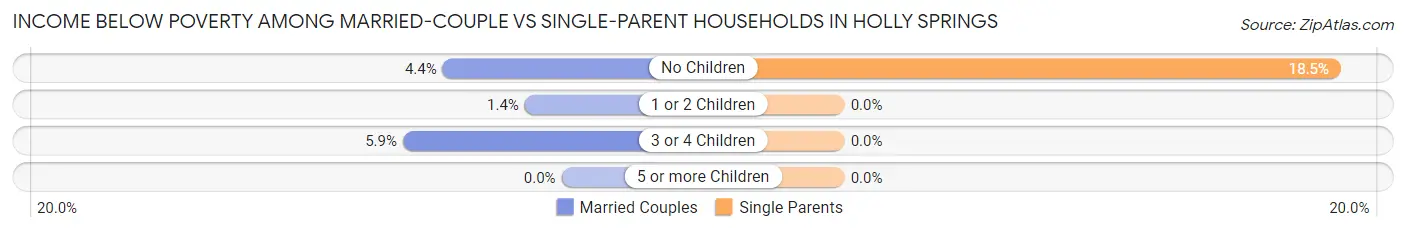
Income Below Poverty Among Married-Couple vs Single-Parent Households in Holly Springs
The poverty data for Holly Springs shows that 131 of the married-couple family households (3.4%) and 25 of the single-parent households (4.1%) are living below the poverty level. Within the married-couple family households, those with 3 or 4 children have the highest poverty rate, with 36 households (5.9%) falling below the poverty line. Among the single-parent households, those with no children have the highest poverty rate, with 25 household (18.5%) living below poverty.
| Children | Married-Couple Families | Single-Parent Households |
| No Children | 72 (4.4%) | 25 (18.5%) |
| 1 or 2 Children | 23 (1.4%) | 0 (0.0%) |
| 3 or 4 Children | 36 (5.9%) | 0 (0.0%) |
| 5 or more Children | 0 (0.0%) | 0 (0.0%) |
| Total | 131 (3.4%) | 25 (4.1%) |
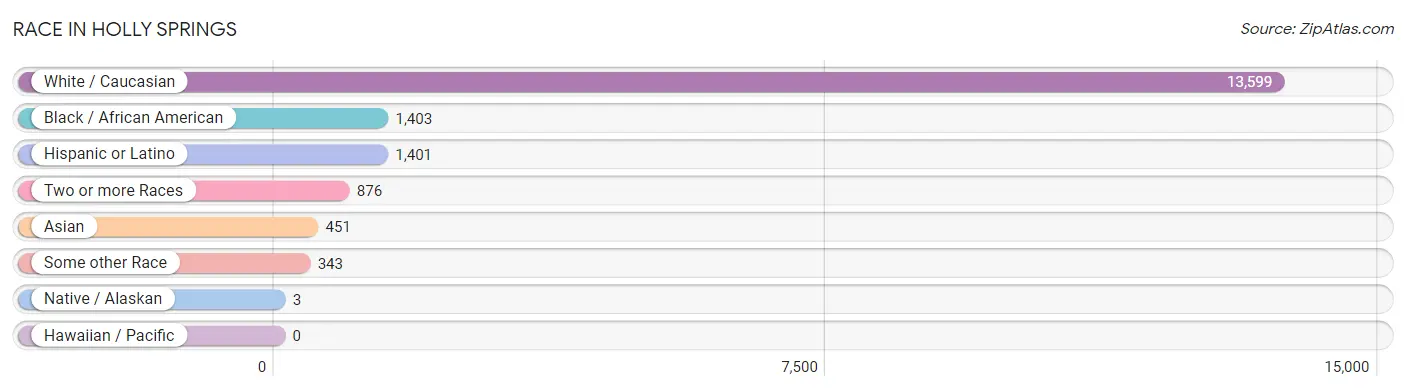
Race in Holly Springs
The most populous races in Holly Springs are White / Caucasian (13,599 | 81.6%), Black / African American (1,403 | 8.4%), and Hispanic or Latino (1,401 | 8.4%).
| Race | # Population | % Population |
| Asian | 451 | 2.7% |
| Black / African American | 1,403 | 8.4% |
| Hawaiian / Pacific | 0 | 0.0% |
| Hispanic or Latino | 1,401 | 8.4% |
| Native / Alaskan | 3 | 0.0% |
| White / Caucasian | 13,599 | 81.6% |
| Two or more Races | 876 | 5.2% |
| Some other Race | 343 | 2.1% |
| Total | 16,675 | 100.0% |
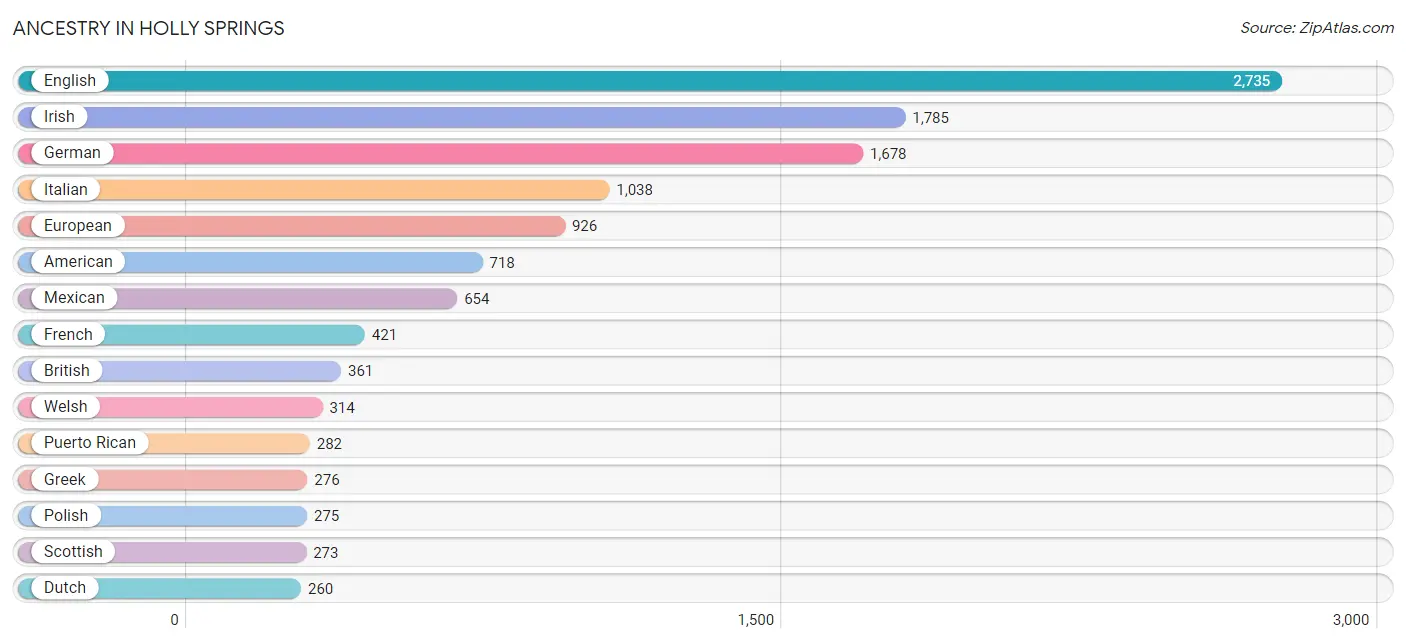
Ancestry in Holly Springs
The most populous ancestries reported in Holly Springs are English (2,735 | 16.4%), Irish (1,785 | 10.7%), German (1,678 | 10.1%), Italian (1,038 | 6.2%), and European (926 | 5.6%), together accounting for 48.9% of all Holly Springs residents.
| Ancestry | # Population | % Population |
| American | 718 | 4.3% |
| Arab | 105 | 0.6% |
| Armenian | 39 | 0.2% |
| Austrian | 52 | 0.3% |
| Bhutanese | 223 | 1.3% |
| Brazilian | 172 | 1.0% |
| British | 361 | 2.2% |
| Central American | 139 | 0.8% |
| Colombian | 70 | 0.4% |
| Cuban | 75 | 0.4% |
| Danish | 20 | 0.1% |
| Dominican | 181 | 1.1% |
| Dutch | 260 | 1.6% |
| Eastern European | 28 | 0.2% |
| Egyptian | 39 | 0.2% |
| English | 2,735 | 16.4% |
| European | 926 | 5.6% |
| Finnish | 12 | 0.1% |
| French | 421 | 2.5% |
| German | 1,678 | 10.1% |
| Greek | 276 | 1.7% |
| Guatemalan | 11 | 0.1% |
| Honduran | 32 | 0.2% |
| Hungarian | 42 | 0.3% |
| Indian (Asian) | 2 | 0.0% |
| Irish | 1,785 | 10.7% |
| Iroquois | 4 | 0.0% |
| Italian | 1,038 | 6.2% |
| Jamaican | 21 | 0.1% |
| Korean | 154 | 0.9% |
| Lebanese | 66 | 0.4% |
| Lithuanian | 44 | 0.3% |
| Malaysian | 12 | 0.1% |
| Mexican | 654 | 3.9% |
| Native Hawaiian | 108 | 0.6% |
| Northern European | 77 | 0.5% |
| Norwegian | 52 | 0.3% |
| Pakistani | 12 | 0.1% |
| Polish | 275 | 1.7% |
| Portuguese | 45 | 0.3% |
| Puerto Rican | 282 | 1.7% |
| Russian | 15 | 0.1% |
| Salvadoran | 96 | 0.6% |
| Scandinavian | 107 | 0.6% |
| Scotch-Irish | 168 | 1.0% |
| Scottish | 273 | 1.6% |
| Slovak | 29 | 0.2% |
| South African | 51 | 0.3% |
| South American | 70 | 0.4% |
| Sri Lankan | 106 | 0.6% |
| Subsaharan African | 51 | 0.3% |
| Swedish | 211 | 1.3% |
| Thai | 250 | 1.5% |
| Ukrainian | 220 | 1.3% |
| Welsh | 314 | 1.9% | View All 55 Rows |
Immigrants in Holly Springs
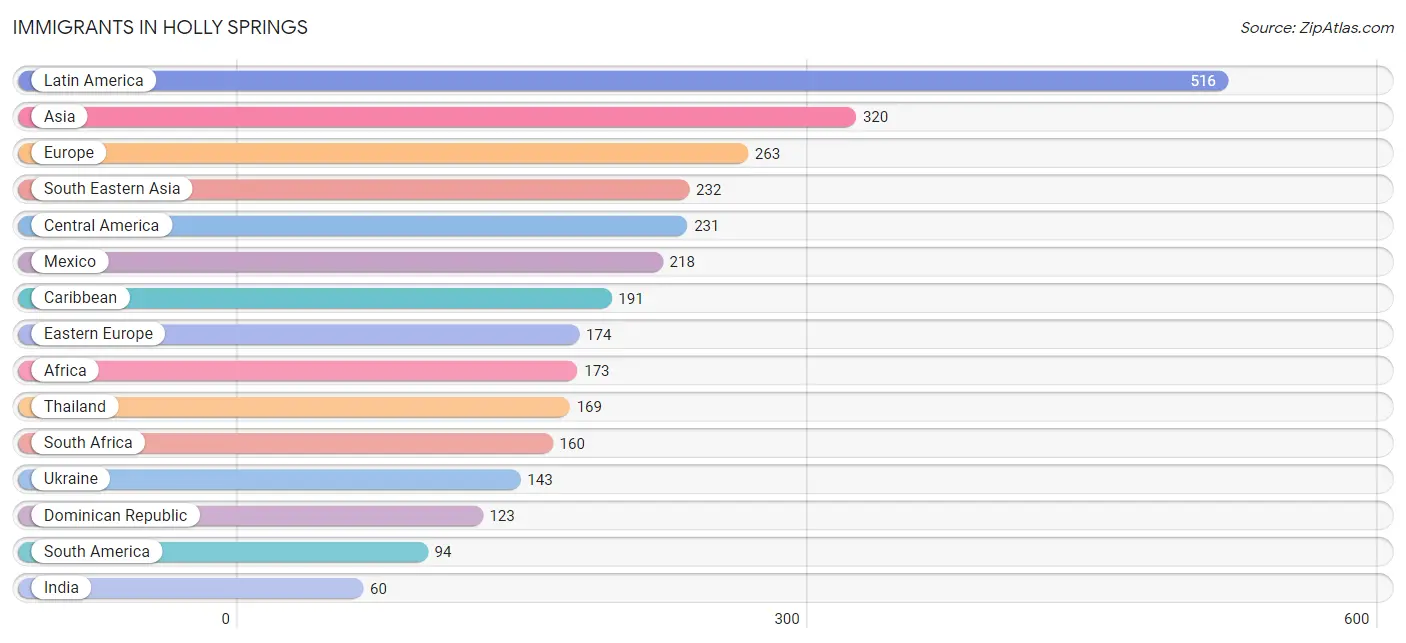
The most numerous immigrant groups reported in Holly Springs came from Latin America (516 | 3.1%), Asia (320 | 1.9%), Europe (263 | 1.6%), South Eastern Asia (232 | 1.4%), and Central America (231 | 1.4%), together accounting for 9.4% of all Holly Springs residents.
| Immigration Origin | # Population | % Population |
| Africa | 173 | 1.0% |
| Asia | 320 | 1.9% |
| Austria | 35 | 0.2% |
| Brazil | 49 | 0.3% |
| Canada | 53 | 0.3% |
| Caribbean | 191 | 1.1% |
| Central America | 231 | 1.4% |
| Colombia | 45 | 0.3% |
| Cuba | 37 | 0.2% |
| Dominican Republic | 123 | 0.7% |
| Eastern Europe | 174 | 1.0% |
| Egypt | 13 | 0.1% |
| England | 18 | 0.1% |
| Europe | 263 | 1.6% |
| Honduras | 13 | 0.1% |
| India | 60 | 0.4% |
| Jamaica | 31 | 0.2% |
| Latin America | 516 | 3.1% |
| Lebanon | 28 | 0.2% |
| Mexico | 218 | 1.3% |
| Northern Africa | 13 | 0.1% |
| Northern Europe | 34 | 0.2% |
| Philippines | 25 | 0.2% |
| Poland | 31 | 0.2% |
| Portugal | 20 | 0.1% |
| South Africa | 160 | 1.0% |
| South America | 94 | 0.6% |
| South Central Asia | 60 | 0.4% |
| South Eastern Asia | 232 | 1.4% |
| Southern Europe | 20 | 0.1% |
| Thailand | 169 | 1.0% |
| Ukraine | 143 | 0.9% |
| Western Asia | 28 | 0.2% |
| Western Europe | 35 | 0.2% | View All 34 Rows |
Sex and Age in Holly Springs
Sex and Age in Holly Springs
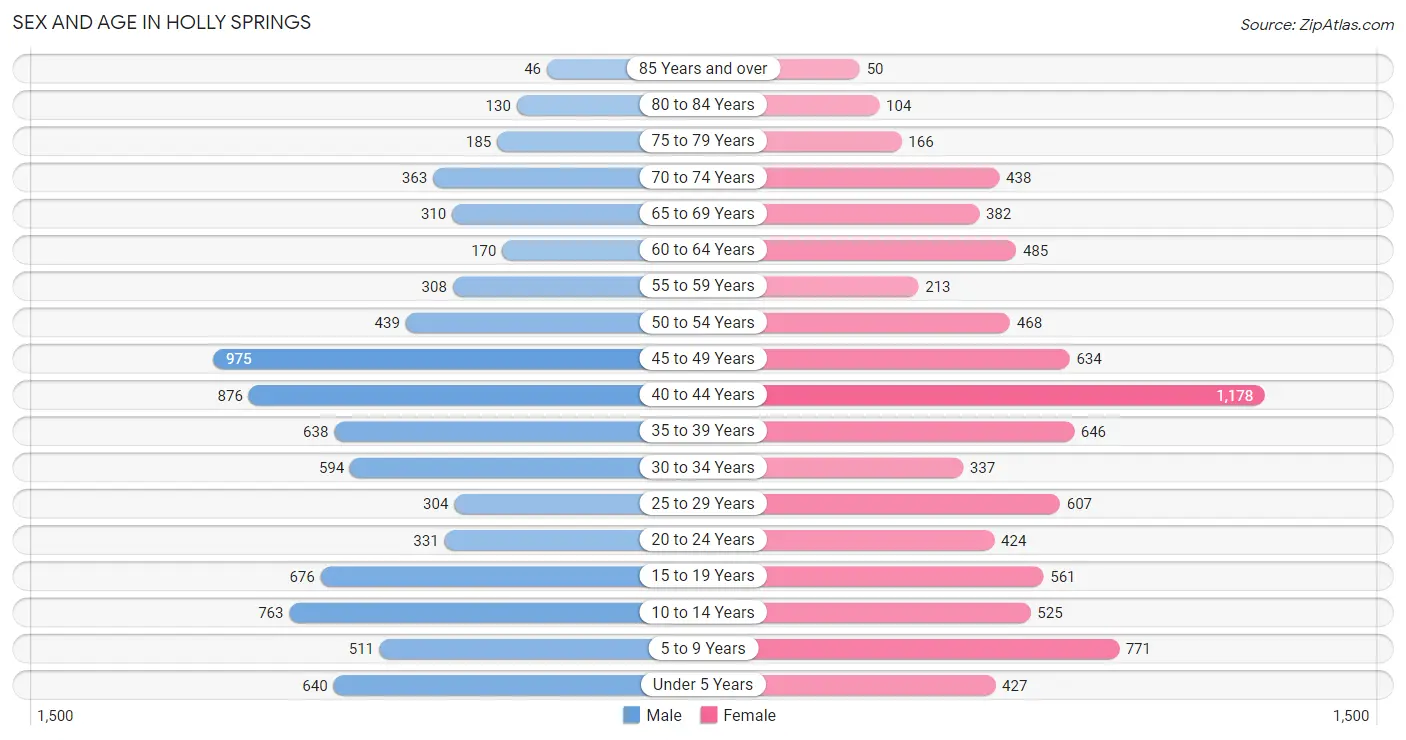
The most populous age groups in Holly Springs are 45 to 49 Years (975 | 11.8%) for men and 40 to 44 Years (1,178 | 14.0%) for women.
| Age Bracket | Male | Female |
| Under 5 Years | 640 (7.7%) | 427 (5.1%) |
| 5 to 9 Years | 511 (6.2%) | 771 (9.2%) |
| 10 to 14 Years | 763 (9.2%) | 525 (6.2%) |
| 15 to 19 Years | 676 (8.2%) | 561 (6.7%) |
| 20 to 24 Years | 331 (4.0%) | 424 (5.0%) |
| 25 to 29 Years | 304 (3.7%) | 607 (7.2%) |
| 30 to 34 Years | 594 (7.2%) | 337 (4.0%) |
| 35 to 39 Years | 638 (7.7%) | 646 (7.7%) |
| 40 to 44 Years | 876 (10.6%) | 1,178 (14.0%) |
| 45 to 49 Years | 975 (11.8%) | 634 (7.5%) |
| 50 to 54 Years | 439 (5.3%) | 468 (5.6%) |
| 55 to 59 Years | 308 (3.7%) | 213 (2.5%) |
| 60 to 64 Years | 170 (2.1%) | 485 (5.8%) |
| 65 to 69 Years | 310 (3.7%) | 382 (4.5%) |
| 70 to 74 Years | 363 (4.4%) | 438 (5.2%) |
| 75 to 79 Years | 185 (2.2%) | 166 (2.0%) |
| 80 to 84 Years | 130 (1.6%) | 104 (1.2%) |
| 85 Years and over | 46 (0.6%) | 50 (0.6%) |
| Total | 8,259 (100.0%) | 8,416 (100.0%) |
Families and Households in Holly Springs
Median Family Size in Holly Springs
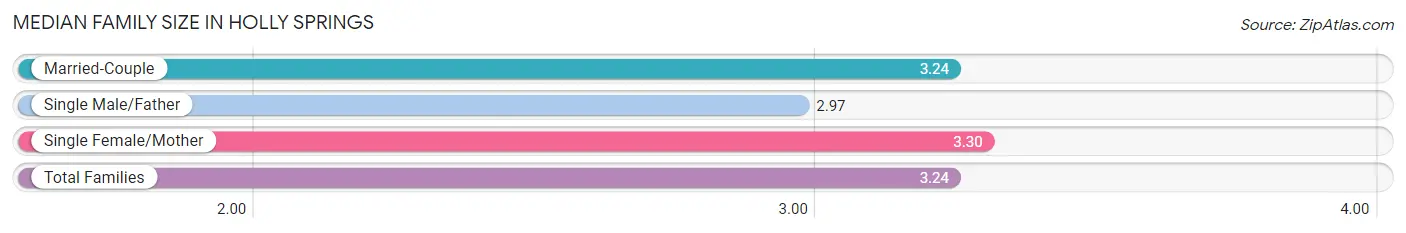
The median family size in Holly Springs is 3.24 persons per family, with single female/mother families (503 | 11.1%) accounting for the largest median family size of 3.3 persons per family. On the other hand, single male/father families (113 | 2.5%) represent the smallest median family size with 2.97 persons per family.
| Family Type | # Families | Family Size |
| Married-Couple | 3,910 (86.4%) | 3.24 |
| Single Male/Father | 113 (2.5%) | 2.97 |
| Single Female/Mother | 503 (11.1%) | 3.30 |
| Total Families | 4,526 (100.0%) | 3.24 |
Median Household Size in Holly Springs
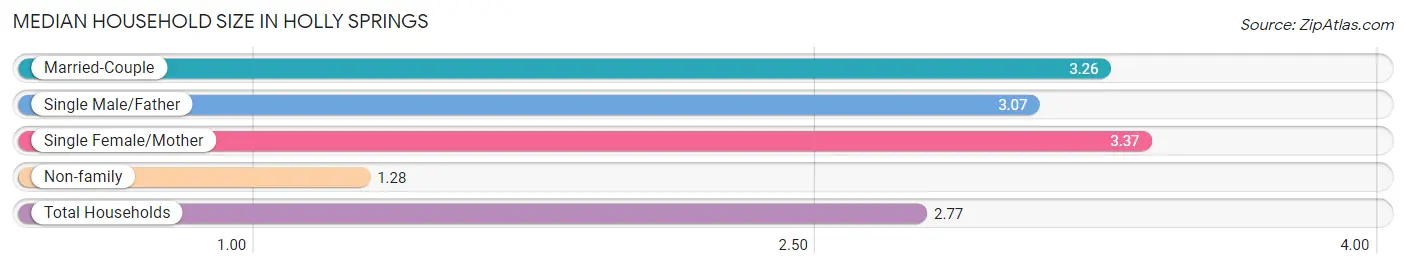
The median household size in Holly Springs is 2.77 persons per household, with single female/mother households (503 | 8.4%) accounting for the largest median household size of 3.37 persons per household. non-family households (1,487 | 24.7%) represent the smallest median household size with 1.28 persons per household.
| Household Type | # Households | Household Size |
| Married-Couple | 3,910 (65.0%) | 3.26 |
| Single Male/Father | 113 (1.9%) | 3.07 |
| Single Female/Mother | 503 (8.4%) | 3.37 |
| Non-family | 1,487 (24.7%) | 1.28 |
| Total Households | 6,013 (100.0%) | 2.77 |
Household Size by Marriage Status in Holly Springs
Out of a total of 6,013 households in Holly Springs, 4,526 (75.3%) are family households, while 1,487 (24.7%) are nonfamily households. The most numerous type of family households are 2-person households, comprising 1,524, and the most common type of nonfamily households are 1-person households, comprising 1,069.
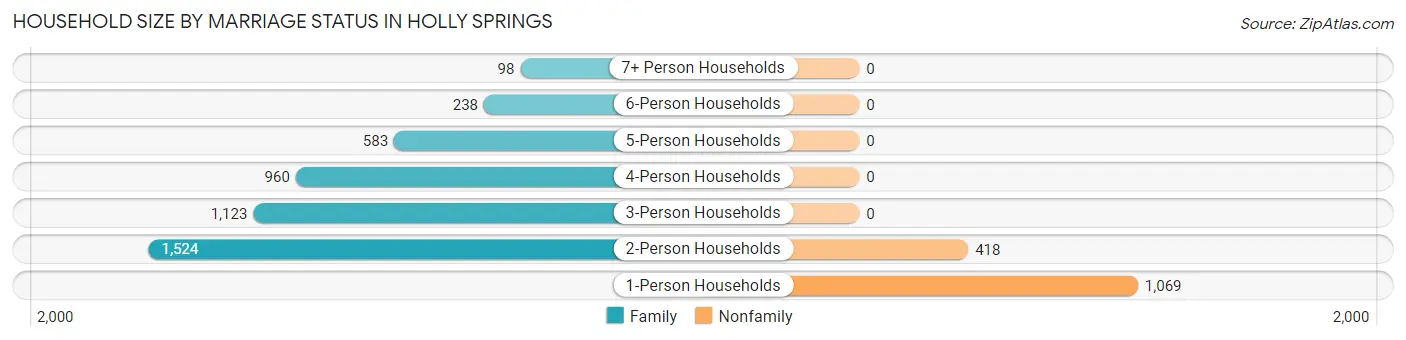
| Household Size | Family Households | Nonfamily Households |
| 1-Person Households | - | 1,069 (17.8%) |
| 2-Person Households | 1,524 (25.4%) | 418 (7.0%) |
| 3-Person Households | 1,123 (18.7%) | 0 (0.0%) |
| 4-Person Households | 960 (16.0%) | 0 (0.0%) |
| 5-Person Households | 583 (9.7%) | 0 (0.0%) |
| 6-Person Households | 238 (4.0%) | 0 (0.0%) |
| 7+ Person Households | 98 (1.6%) | 0 (0.0%) |
| Total | 4,526 (75.3%) | 1,487 (24.7%) |
Female Fertility in Holly Springs
Fertility by Age in Holly Springs
Average fertility rate in Holly Springs is 44.0 births per 1,000 women. Women in the age bracket of 20 to 34 years have the highest fertility rate with 134.0 births per 1,000 women. Women in the age bracket of 20 to 34 years acount for 90.6% of all women with births.
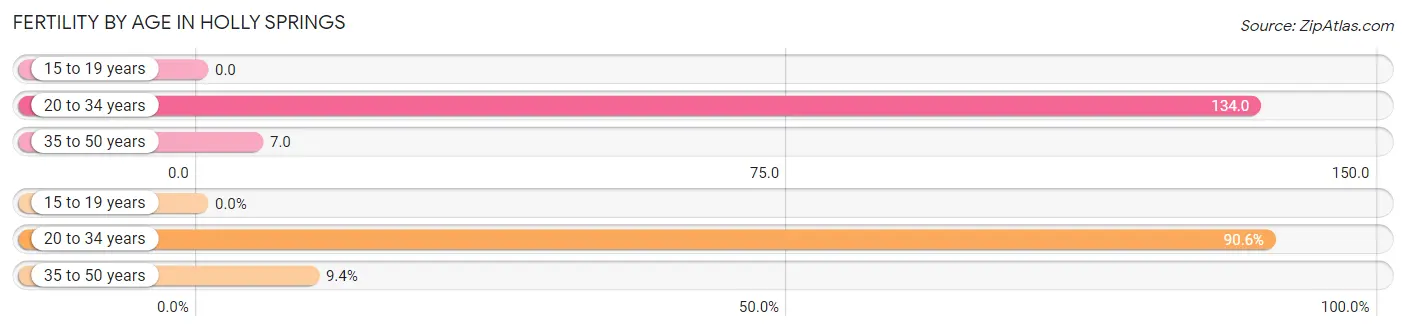
| Age Bracket | Women with Births | Births / 1,000 Women |
| 15 to 19 years | 0 (0.0%) | 0.0 |
| 20 to 34 years | 183 (90.6%) | 134.0 |
| 35 to 50 years | 19 (9.4%) | 7.0 |
| Total | 202 (100.0%) | 44.0 |
Fertility by Age by Marriage Status in Holly Springs
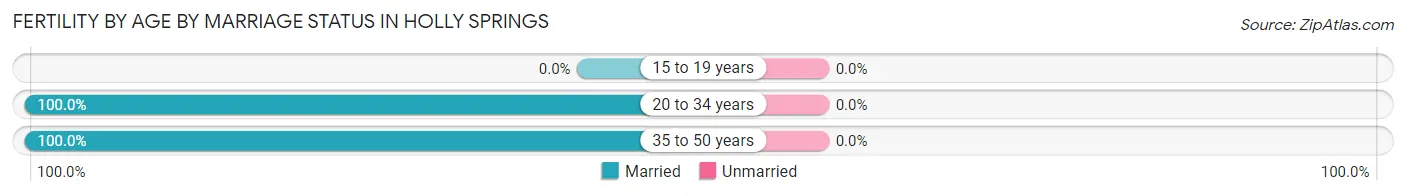
| Age Bracket | Married | Unmarried |
| 15 to 19 years | 0 (0.0%) | 0 (0.0%) |
| 20 to 34 years | 183 (100.0%) | 0 (0.0%) |
| 35 to 50 years | 19 (100.0%) | 0 (0.0%) |
| Total | 202 (100.0%) | 0 (0.0%) |
Fertility by Education in Holly Springs
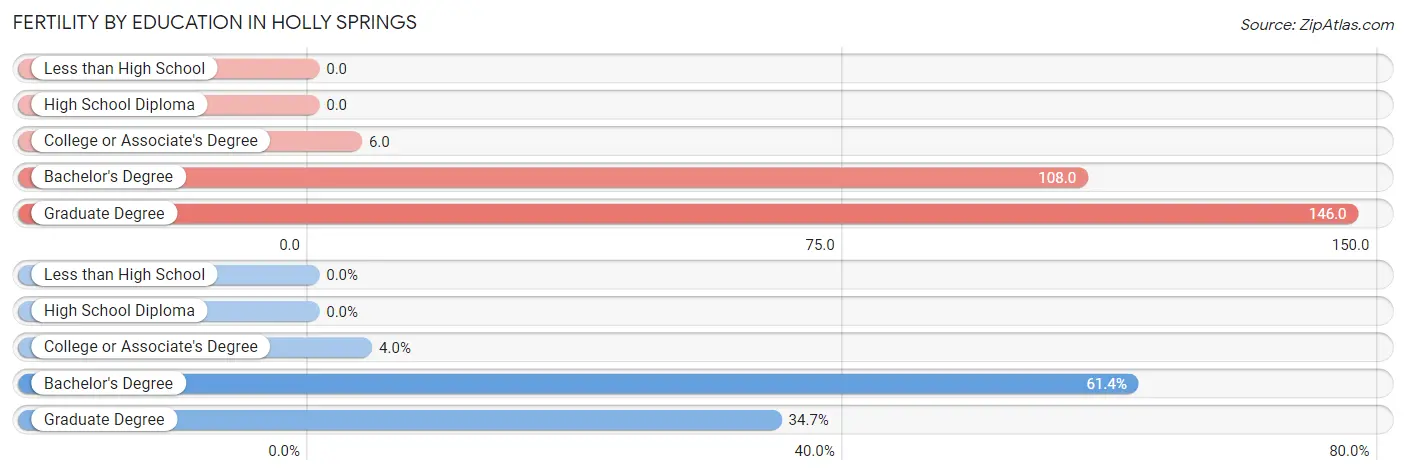
| Educational Attainment | Women with Births | Births / 1,000 Women |
| Less than High School | 0 (0.0%) | 0.0 |
| High School Diploma | 0 (0.0%) | 0.0 |
| College or Associate's Degree | 8 (4.0%) | 6.0 |
| Bachelor's Degree | 124 (61.4%) | 108.0 |
| Graduate Degree | 70 (34.6%) | 146.0 |
| Total | 202 (100.0%) | 44.0 |
Fertility by Education by Marriage Status in Holly Springs
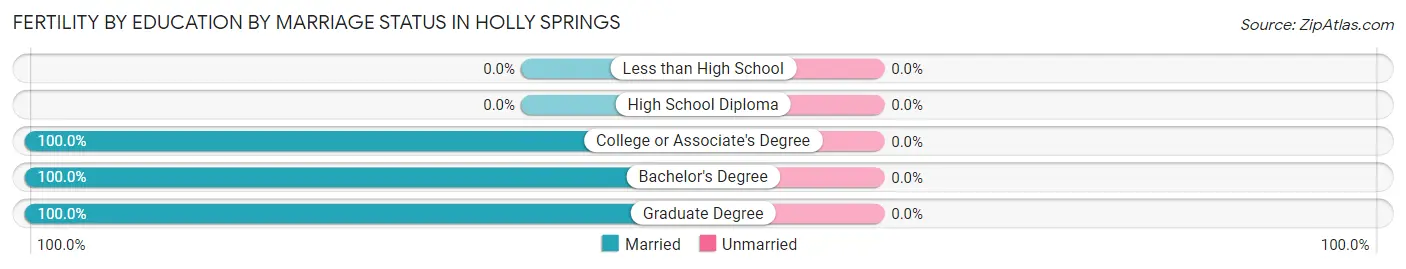
| Educational Attainment | Married | Unmarried |
| Less than High School | 0 (0.0%) | 0 (0.0%) |
| High School Diploma | 0 (0.0%) | 0 (0.0%) |
| College or Associate's Degree | 8 (100.0%) | 0 (0.0%) |
| Bachelor's Degree | 124 (100.0%) | 0 (0.0%) |
| Graduate Degree | 70 (100.0%) | 0 (0.0%) |
| Total | 202 (100.0%) | 0 (0.0%) |
Employment Characteristics in Holly Springs
Employment by Class of Employer in Holly Springs
Among the 8,736 employed individuals in Holly Springs, private company employees (6,075 | 69.5%), local government employees (749 | 8.6%), and not-for-profit organizations (678 | 7.8%) make up the most common classes of employment.
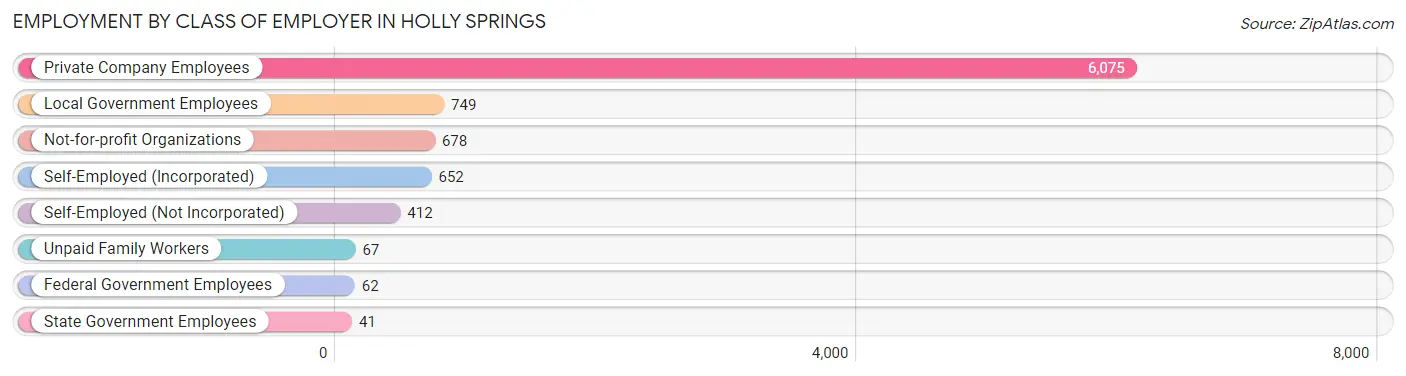
| Employer Class | # Employees | % Employees |
| Private Company Employees | 6,075 | 69.5% |
| Self-Employed (Incorporated) | 652 | 7.5% |
| Self-Employed (Not Incorporated) | 412 | 4.7% |
| Not-for-profit Organizations | 678 | 7.8% |
| Local Government Employees | 749 | 8.6% |
| State Government Employees | 41 | 0.5% |
| Federal Government Employees | 62 | 0.7% |
| Unpaid Family Workers | 67 | 0.8% |
| Total | 8,736 | 100.0% |
Employment Status by Age in Holly Springs
According to the labor force statistics for Holly Springs, out of the total population over 16 years of age (12,707), 72.5% or 9,213 individuals are in the labor force, with 3.1% or 286 of them unemployed. The age group with the highest labor force participation rate is 55 to 59 years, with 94.2% or 491 individuals in the labor force. Within the labor force, the 25 to 29 years age range has the highest percentage of unemployed individuals, with 7.7% or 59 of them being unemployed.
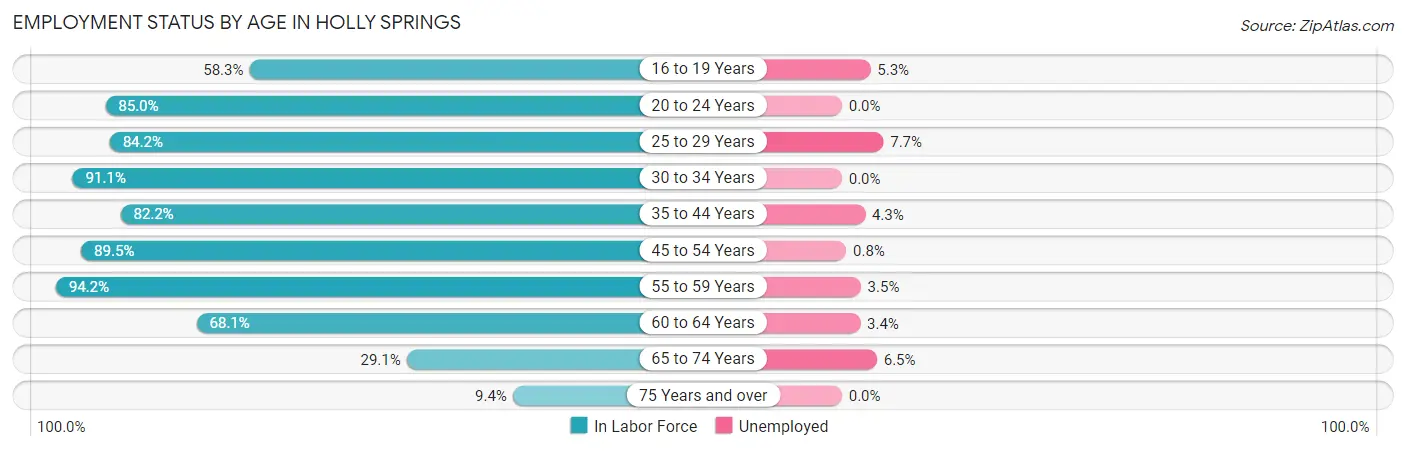
| Age Bracket | In Labor Force | Unemployed |
| 16 to 19 Years | 528 (58.3%) | 28 (5.3%) |
| 20 to 24 Years | 642 (85.0%) | 0 (0.0%) |
| 25 to 29 Years | 767 (84.2%) | 59 (7.7%) |
| 30 to 34 Years | 848 (91.1%) | 0 (0.0%) |
| 35 to 44 Years | 2,744 (82.2%) | 118 (4.3%) |
| 45 to 54 Years | 2,252 (89.5%) | 18 (0.8%) |
| 55 to 59 Years | 491 (94.2%) | 17 (3.5%) |
| 60 to 64 Years | 446 (68.1%) | 15 (3.4%) |
| 65 to 74 Years | 434 (29.1%) | 28 (6.5%) |
| 75 Years and over | 64 (9.4%) | 0 (0.0%) |
| Total | 9,213 (72.5%) | 286 (3.1%) |
Employment Status by Educational Attainment in Holly Springs
According to labor force statistics for Holly Springs, 85.1% of individuals (7,550) out of the total population between 25 and 64 years of age (8,872) are in the labor force, with 3.0% or 226 of them being unemployed. The group with the highest labor force participation rate are those with the educational attainment of bachelor's degree or higher, with 95.3% or 3,740 individuals in the labor force. Within the labor force, individuals with high school diploma education have the highest percentage of unemployment, with 4.9% or 72 of them being unemployed.
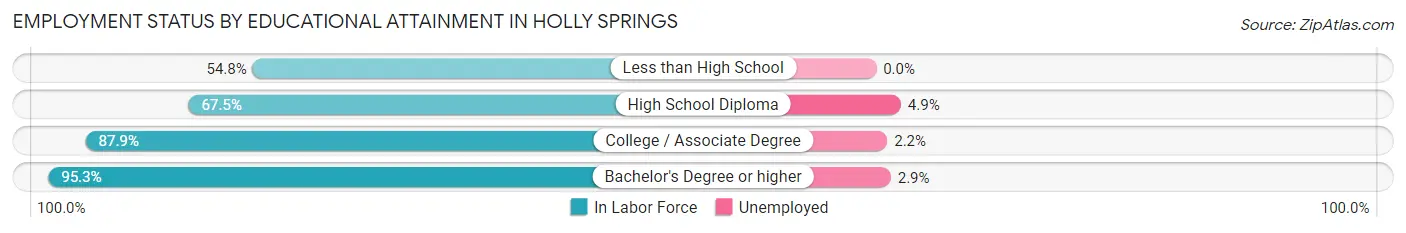
| Educational Attainment | In Labor Force | Unemployed |
| Less than High School | 161 (54.8%) | 0 (0.0%) |
| High School Diploma | 1,474 (67.5%) | 107 (4.9%) |
| College / Associate Degree | 2,171 (87.9%) | 54 (2.2%) |
| Bachelor's Degree or higher | 3,740 (95.3%) | 114 (2.9%) |
| Total | 7,550 (85.1%) | 266 (3.0%) |
Employment Occupations by Sex in Holly Springs
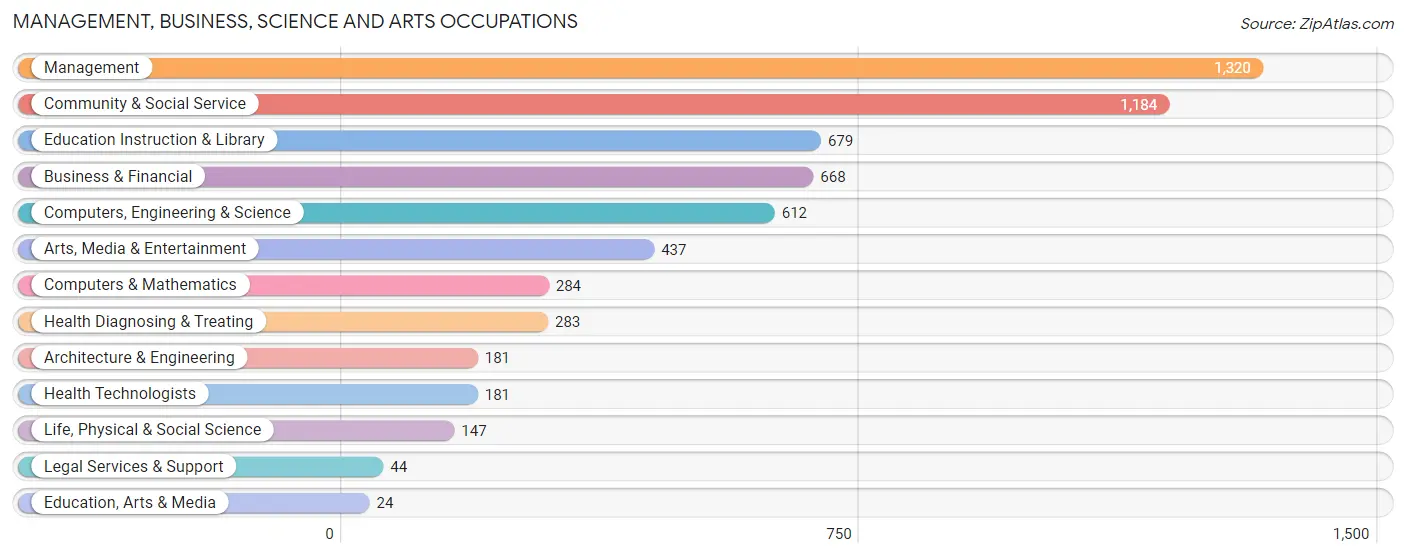
Management, Business, Science and Arts Occupations
The most common Management, Business, Science and Arts occupations in Holly Springs are Management (1,320 | 14.8%), Community & Social Service (1,184 | 13.3%), Education Instruction & Library (679 | 7.6%), Business & Financial (668 | 7.5%), and Computers, Engineering & Science (612 | 6.9%).
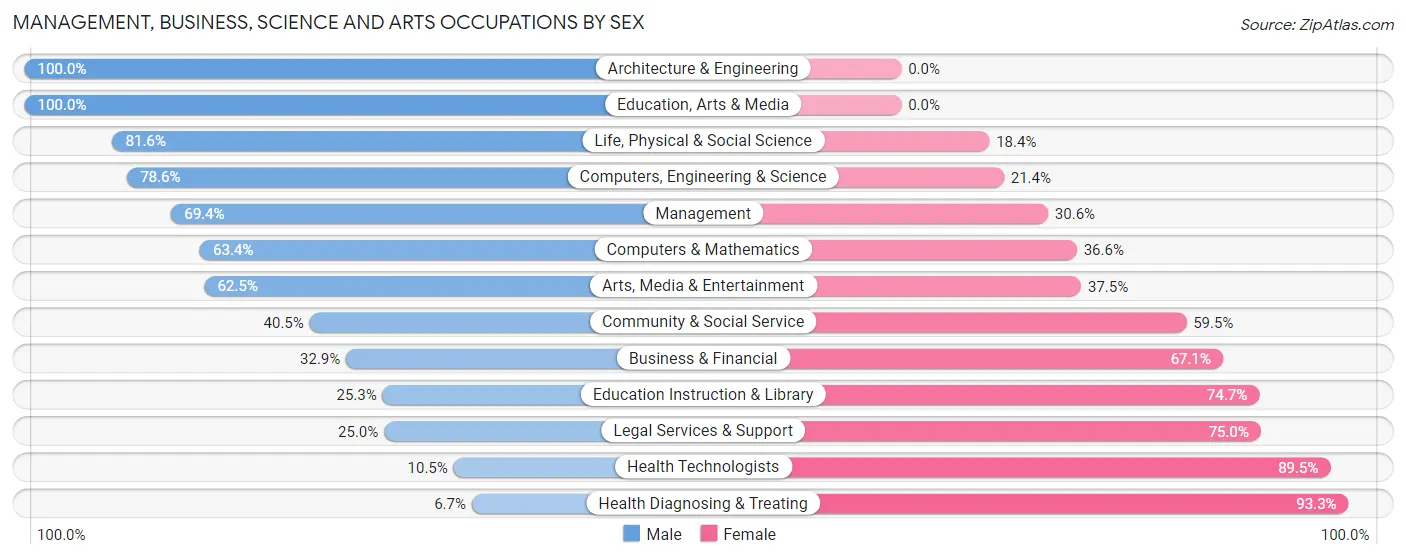
Management, Business, Science and Arts Occupations by Sex
Within the Management, Business, Science and Arts occupations in Holly Springs, the most male-oriented occupations are Architecture & Engineering (100.0%), Education, Arts & Media (100.0%), and Life, Physical & Social Science (81.6%), while the most female-oriented occupations are Health Diagnosing & Treating (93.3%), Health Technologists (89.5%), and Legal Services & Support (75.0%).
| Occupation | Male | Female |
| Management | 916 (69.4%) | 404 (30.6%) |
| Business & Financial | 220 (32.9%) | 448 (67.1%) |
| Computers, Engineering & Science | 481 (78.6%) | 131 (21.4%) |
| Computers & Mathematics | 180 (63.4%) | 104 (36.6%) |
| Architecture & Engineering | 181 (100.0%) | 0 (0.0%) |
| Life, Physical & Social Science | 120 (81.6%) | 27 (18.4%) |
| Community & Social Service | 480 (40.5%) | 704 (59.5%) |
| Education, Arts & Media | 24 (100.0%) | 0 (0.0%) |
| Legal Services & Support | 11 (25.0%) | 33 (75.0%) |
| Education Instruction & Library | 172 (25.3%) | 507 (74.7%) |
| Arts, Media & Entertainment | 273 (62.5%) | 164 (37.5%) |
| Health Diagnosing & Treating | 19 (6.7%) | 264 (93.3%) |
| Health Technologists | 19 (10.5%) | 162 (89.5%) |
| Total (Category) | 2,116 (52.0%) | 1,951 (48.0%) |
| Total (Overall) | 4,839 (54.2%) | 4,092 (45.8%) |
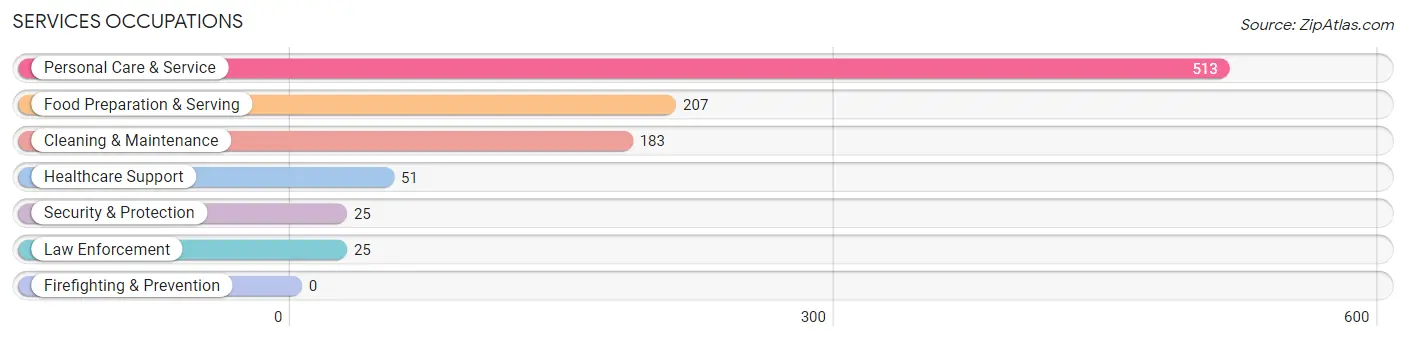
Services Occupations
The most common Services occupations in Holly Springs are Personal Care & Service (513 | 5.7%), Food Preparation & Serving (207 | 2.3%), Cleaning & Maintenance (183 | 2.1%), Healthcare Support (51 | 0.6%), and Security & Protection (25 | 0.3%).
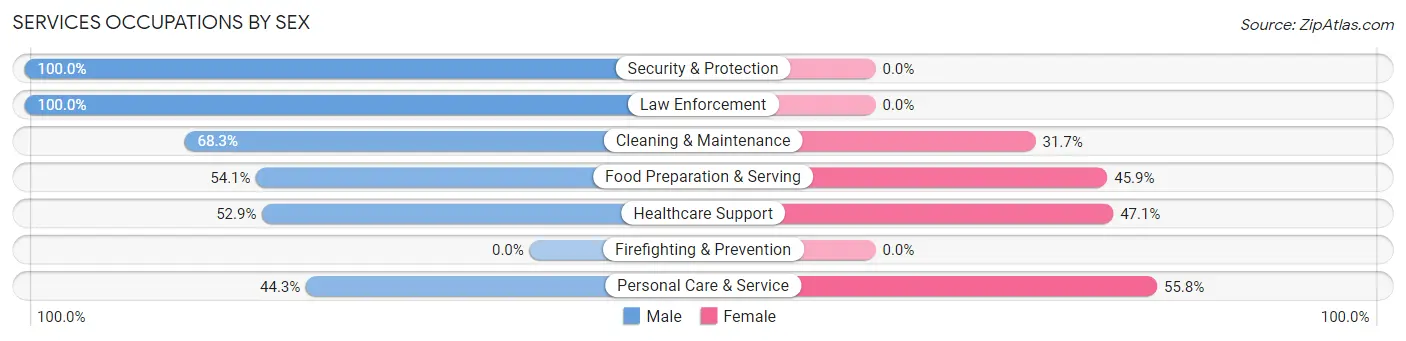
Services Occupations by Sex
Within the Services occupations in Holly Springs, the most male-oriented occupations are Security & Protection (100.0%), Law Enforcement (100.0%), and Cleaning & Maintenance (68.3%), while the most female-oriented occupations are Personal Care & Service (55.7%), Healthcare Support (47.1%), and Food Preparation & Serving (45.9%).
| Occupation | Male | Female |
| Healthcare Support | 27 (52.9%) | 24 (47.1%) |
| Security & Protection | 25 (100.0%) | 0 (0.0%) |
| Firefighting & Prevention | 0 (0.0%) | 0 (0.0%) |
| Law Enforcement | 25 (100.0%) | 0 (0.0%) |
| Food Preparation & Serving | 112 (54.1%) | 95 (45.9%) |
| Cleaning & Maintenance | 125 (68.3%) | 58 (31.7%) |
| Personal Care & Service | 227 (44.3%) | 286 (55.7%) |
| Total (Category) | 516 (52.7%) | 463 (47.3%) |
| Total (Overall) | 4,839 (54.2%) | 4,092 (45.8%) |
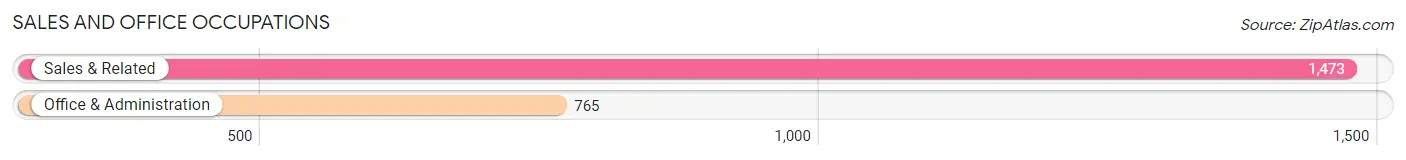
Sales and Office Occupations
The most common Sales and Office occupations in Holly Springs are Sales & Related (1,473 | 16.5%), and Office & Administration (765 | 8.6%).
Sales and Office Occupations by Sex
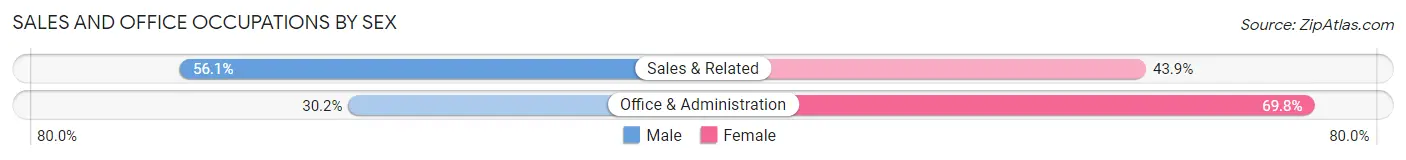
| Occupation | Male | Female |
| Sales & Related | 826 (56.1%) | 647 (43.9%) |
| Office & Administration | 231 (30.2%) | 534 (69.8%) |
| Total (Category) | 1,057 (47.2%) | 1,181 (52.8%) |
| Total (Overall) | 4,839 (54.2%) | 4,092 (45.8%) |
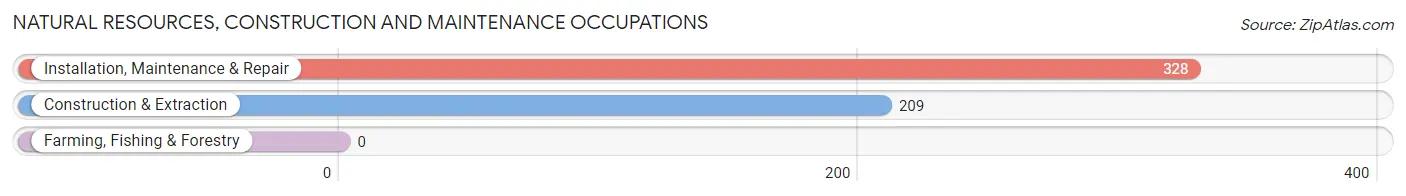
Natural Resources, Construction and Maintenance Occupations
The most common Natural Resources, Construction and Maintenance occupations in Holly Springs are Installation, Maintenance & Repair (328 | 3.7%), and Construction & Extraction (209 | 2.3%).
Natural Resources, Construction and Maintenance Occupations by Sex
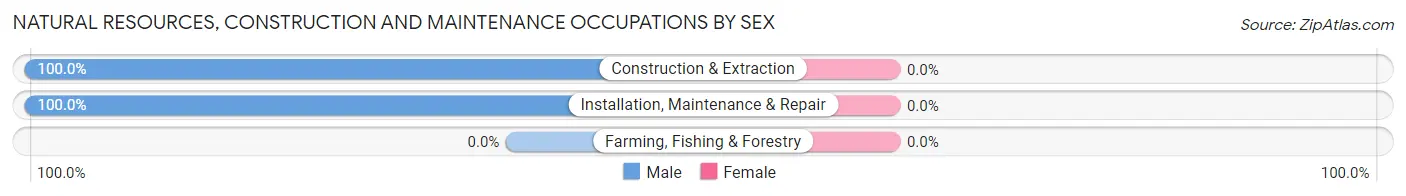
| Occupation | Male | Female |
| Farming, Fishing & Forestry | 0 (0.0%) | 0 (0.0%) |
| Construction & Extraction | 209 (100.0%) | 0 (0.0%) |
| Installation, Maintenance & Repair | 328 (100.0%) | 0 (0.0%) |
| Total (Category) | 537 (100.0%) | 0 (0.0%) |
| Total (Overall) | 4,839 (54.2%) | 4,092 (45.8%) |
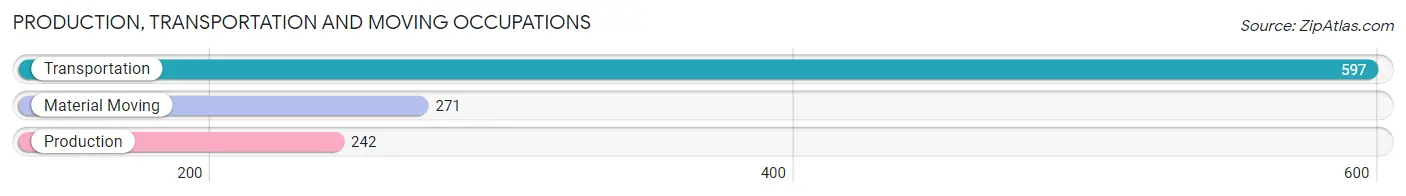
Production, Transportation and Moving Occupations
The most common Production, Transportation and Moving occupations in Holly Springs are Transportation (597 | 6.7%), Material Moving (271 | 3.0%), and Production (242 | 2.7%).
Production, Transportation and Moving Occupations by Sex
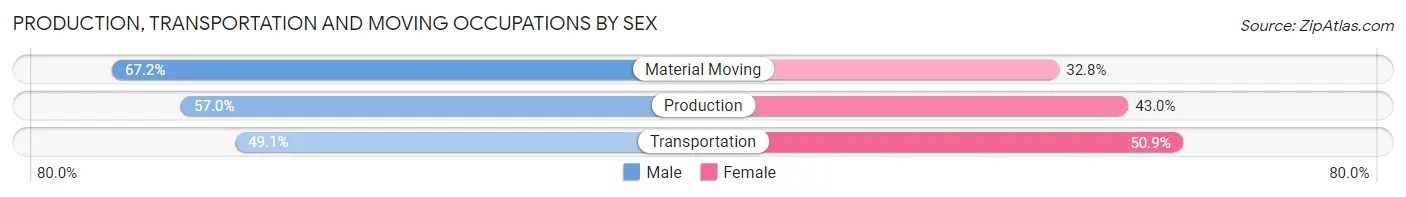
| Occupation | Male | Female |
| Production | 138 (57.0%) | 104 (43.0%) |
| Transportation | 293 (49.1%) | 304 (50.9%) |
| Material Moving | 182 (67.2%) | 89 (32.8%) |
| Total (Category) | 613 (55.2%) | 497 (44.8%) |
| Total (Overall) | 4,839 (54.2%) | 4,092 (45.8%) |
Employment Industries by Sex in Holly Springs
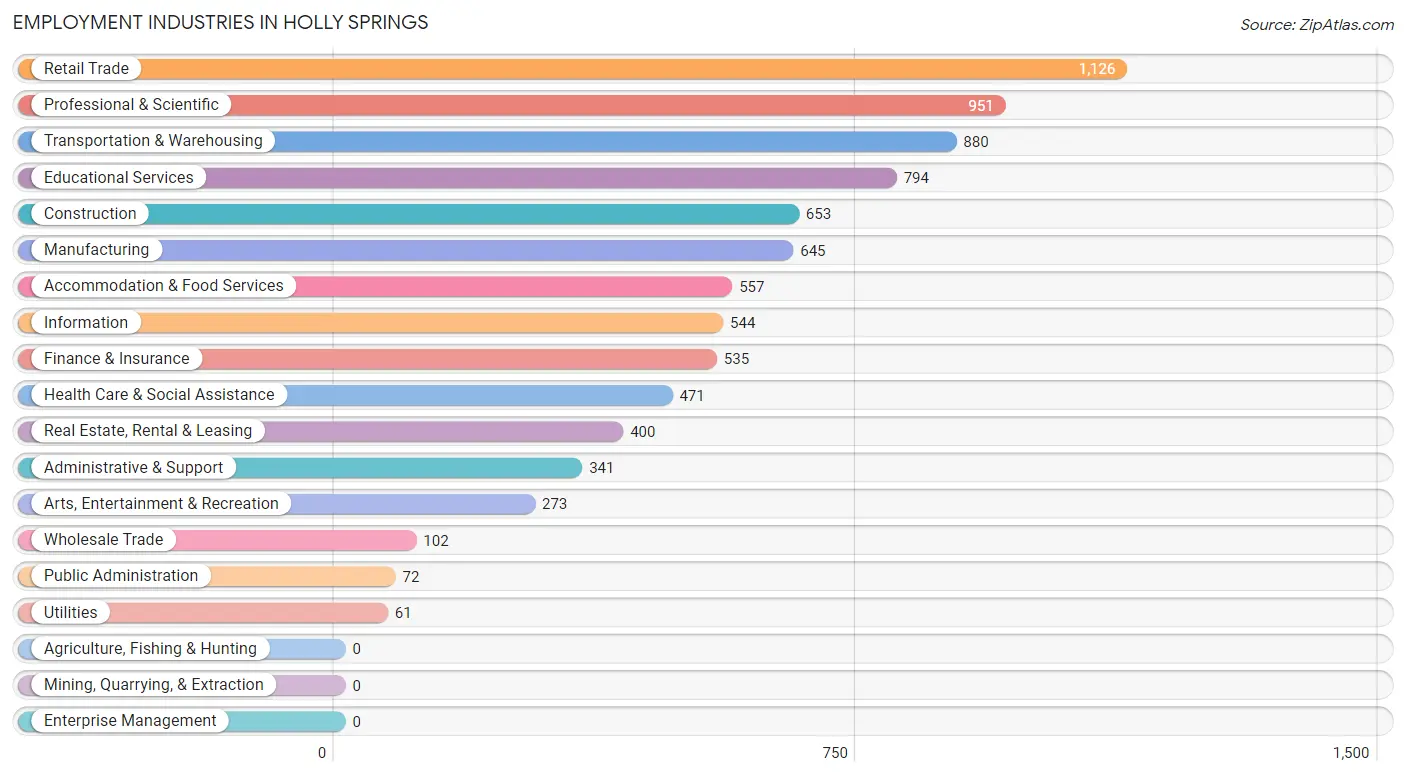
Employment Industries in Holly Springs
The major employment industries in Holly Springs include Retail Trade (1,126 | 12.6%), Professional & Scientific (951 | 10.6%), Transportation & Warehousing (880 | 9.9%), Educational Services (794 | 8.9%), and Construction (653 | 7.3%).
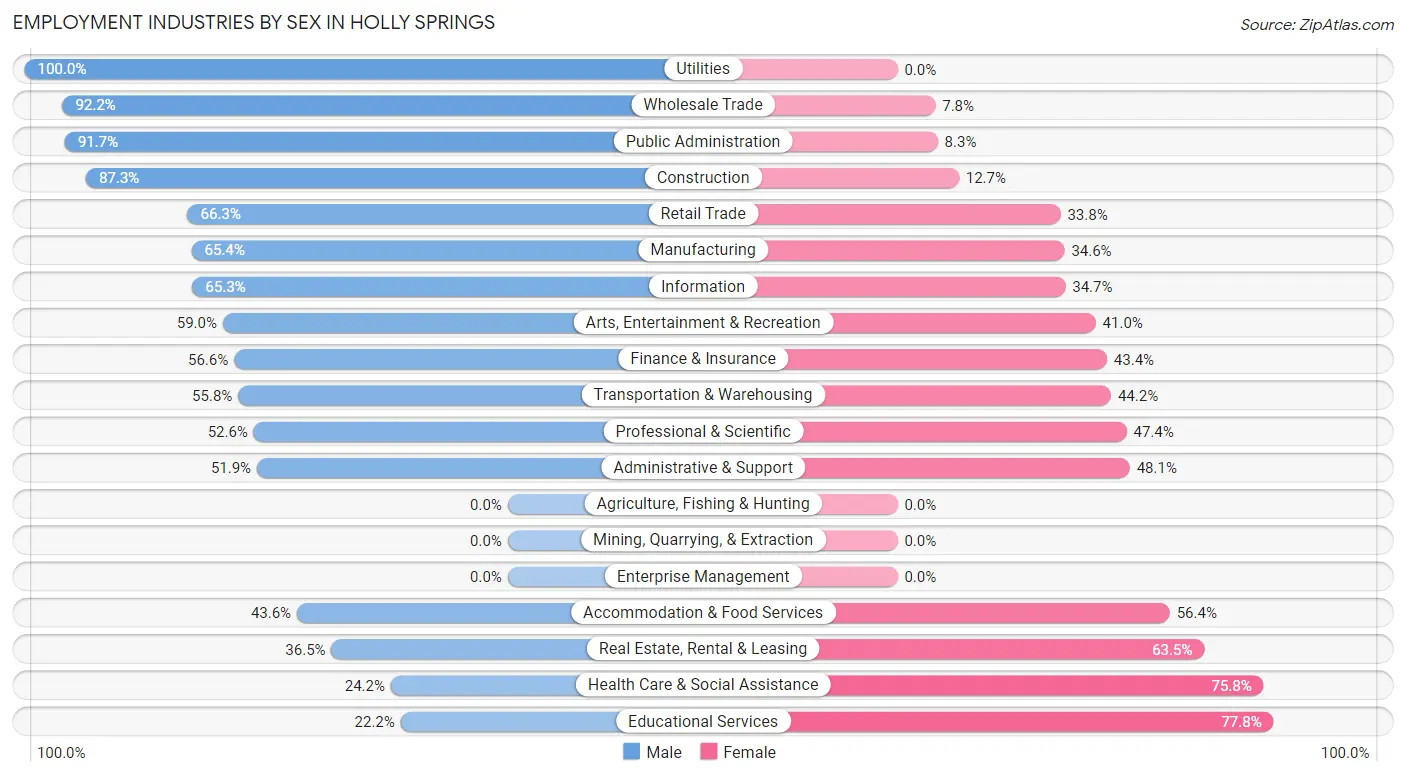
Employment Industries by Sex in Holly Springs
The Holly Springs industries that see more men than women are Utilities (100.0%), Wholesale Trade (92.2%), and Public Administration (91.7%), whereas the industries that tend to have a higher number of women are Educational Services (77.8%), Health Care & Social Assistance (75.8%), and Real Estate, Rental & Leasing (63.5%).
| Industry | Male | Female |
| Agriculture, Fishing & Hunting | 0 (0.0%) | 0 (0.0%) |
| Mining, Quarrying, & Extraction | 0 (0.0%) | 0 (0.0%) |
| Construction | 570 (87.3%) | 83 (12.7%) |
| Manufacturing | 422 (65.4%) | 223 (34.6%) |
| Wholesale Trade | 94 (92.2%) | 8 (7.8%) |
| Retail Trade | 746 (66.2%) | 380 (33.8%) |
| Transportation & Warehousing | 491 (55.8%) | 389 (44.2%) |
| Utilities | 61 (100.0%) | 0 (0.0%) |
| Information | 355 (65.3%) | 189 (34.7%) |
| Finance & Insurance | 303 (56.6%) | 232 (43.4%) |
| Real Estate, Rental & Leasing | 146 (36.5%) | 254 (63.5%) |
| Professional & Scientific | 500 (52.6%) | 451 (47.4%) |
| Enterprise Management | 0 (0.0%) | 0 (0.0%) |
| Administrative & Support | 177 (51.9%) | 164 (48.1%) |
| Educational Services | 176 (22.2%) | 618 (77.8%) |
| Health Care & Social Assistance | 114 (24.2%) | 357 (75.8%) |
| Arts, Entertainment & Recreation | 161 (59.0%) | 112 (41.0%) |
| Accommodation & Food Services | 243 (43.6%) | 314 (56.4%) |
| Public Administration | 66 (91.7%) | 6 (8.3%) |
| Total | 4,839 (54.2%) | 4,092 (45.8%) |
Education in Holly Springs
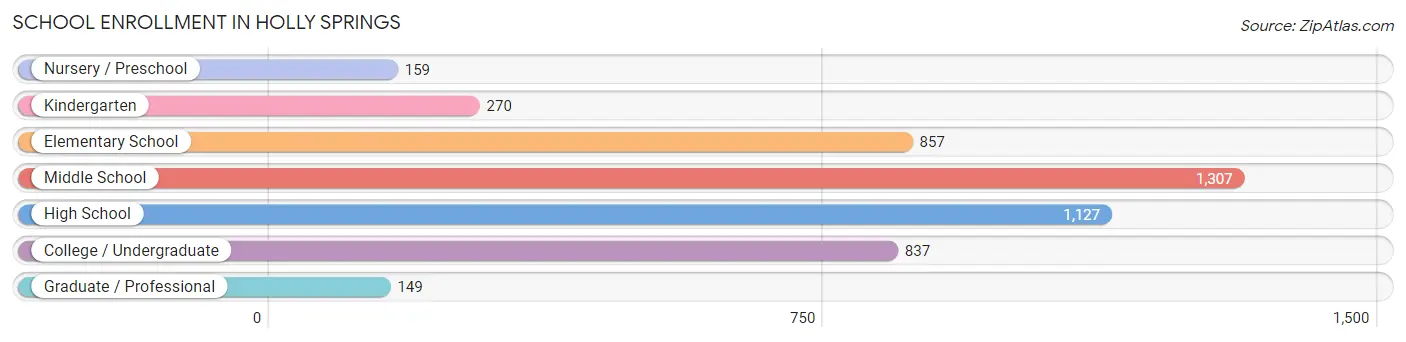
School Enrollment in Holly Springs
The most common levels of schooling among the 4,706 students in Holly Springs are middle school (1,307 | 27.8%), high school (1,127 | 23.9%), and elementary school (857 | 18.2%).
| School Level | # Students | % Students |
| Nursery / Preschool | 159 | 3.4% |
| Kindergarten | 270 | 5.7% |
| Elementary School | 857 | 18.2% |
| Middle School | 1,307 | 27.8% |
| High School | 1,127 | 23.9% |
| College / Undergraduate | 837 | 17.8% |
| Graduate / Professional | 149 | 3.2% |
| Total | 4,706 | 100.0% |
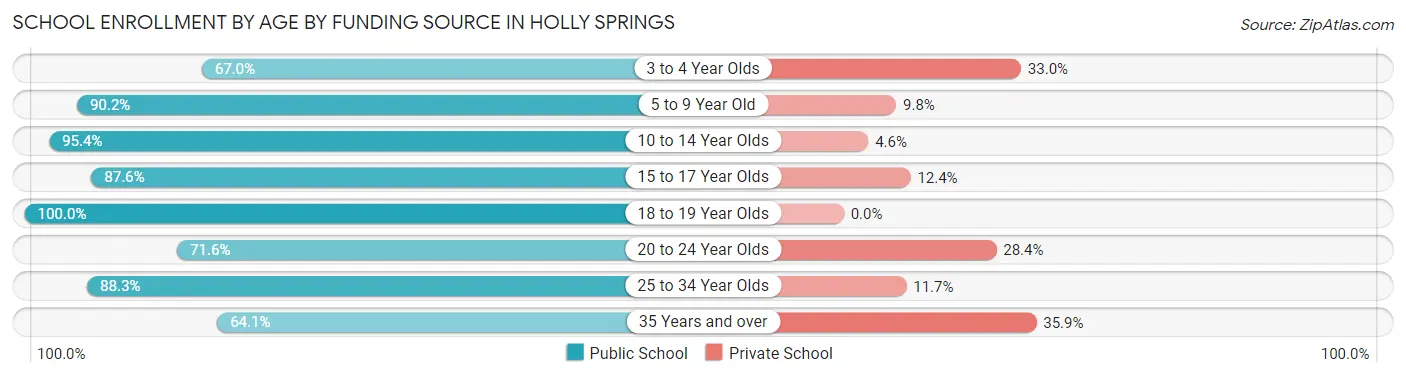
School Enrollment by Age by Funding Source in Holly Springs
Out of a total of 4,706 students who are enrolled in schools in Holly Springs, 569 (12.1%) attend a private institution, while the remaining 4,137 (87.9%) are enrolled in public schools. The age group of 35 years and over has the highest likelihood of being enrolled in private schools, with 127 (35.9% in the age bracket) enrolled. Conversely, the age group of 18 to 19 year olds has the lowest likelihood of being enrolled in a private school, with 355 (100.0% in the age bracket) attending a public institution.
| Age Bracket | Public School | Private School |
| 3 to 4 Year Olds | 69 (67.0%) | 34 (33.0%) |
| 5 to 9 Year Old | 1,137 (90.2%) | 123 (9.8%) |
| 10 to 14 Year Olds | 1,229 (95.4%) | 59 (4.6%) |
| 15 to 17 Year Olds | 697 (87.6%) | 99 (12.4%) |
| 18 to 19 Year Olds | 355 (100.0%) | 0 (0.0%) |
| 20 to 24 Year Olds | 277 (71.6%) | 110 (28.4%) |
| 25 to 34 Year Olds | 144 (88.3%) | 19 (11.7%) |
| 35 Years and over | 227 (64.1%) | 127 (35.9%) |
| Total | 4,137 (87.9%) | 569 (12.1%) |
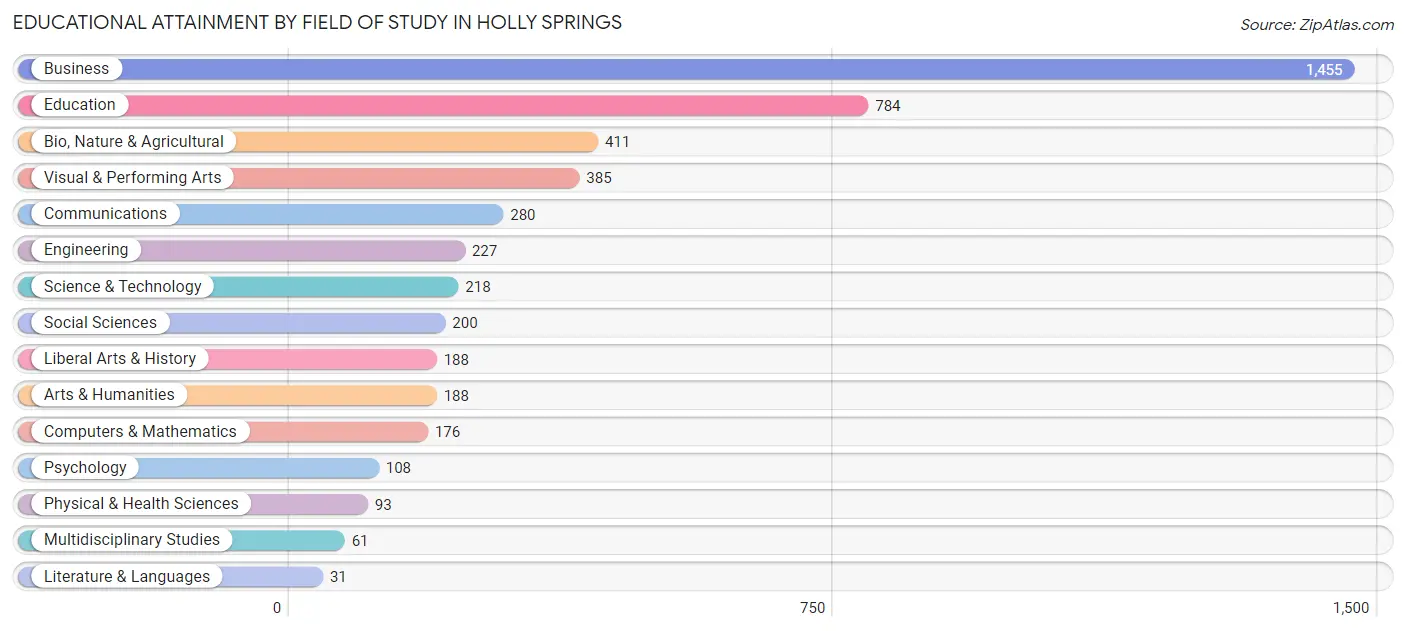
Educational Attainment by Field of Study in Holly Springs
Business (1,455 | 30.3%), education (784 | 16.3%), bio, nature & agricultural (411 | 8.6%), visual & performing arts (385 | 8.0%), and communications (280 | 5.8%) are the most common fields of study among 4,805 individuals in Holly Springs who have obtained a bachelor's degree or higher.
| Field of Study | # Graduates | % Graduates |
| Computers & Mathematics | 176 | 3.7% |
| Bio, Nature & Agricultural | 411 | 8.6% |
| Physical & Health Sciences | 93 | 1.9% |
| Psychology | 108 | 2.2% |
| Social Sciences | 200 | 4.2% |
| Engineering | 227 | 4.7% |
| Multidisciplinary Studies | 61 | 1.3% |
| Science & Technology | 218 | 4.5% |
| Business | 1,455 | 30.3% |
| Education | 784 | 16.3% |
| Literature & Languages | 31 | 0.6% |
| Liberal Arts & History | 188 | 3.9% |
| Visual & Performing Arts | 385 | 8.0% |
| Communications | 280 | 5.8% |
| Arts & Humanities | 188 | 3.9% |
| Total | 4,805 | 100.0% |
Transportation & Commute in Holly Springs
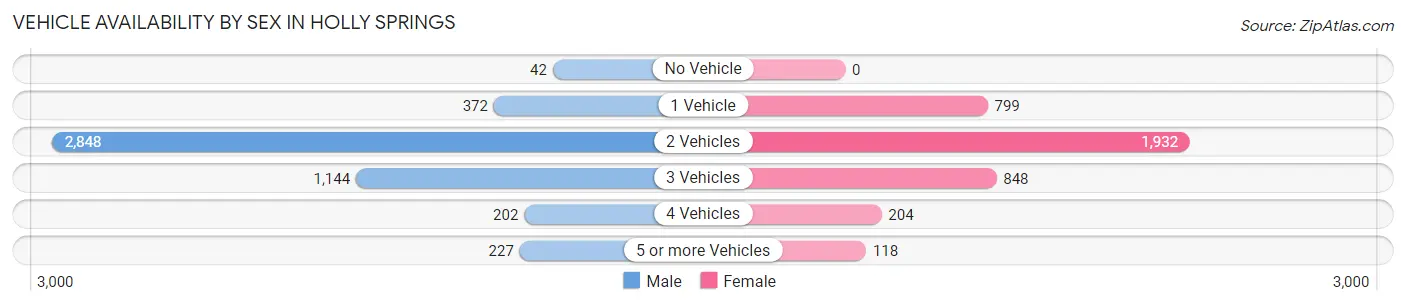
Vehicle Availability by Sex in Holly Springs
The most prevalent vehicle ownership categories in Holly Springs are males with 2 vehicles (2,848, accounting for 58.9%) and females with 2 vehicles (1,932, making up 73.0%).
| Vehicles Available | Male | Female |
| No Vehicle | 42 (0.9%) | 0 (0.0%) |
| 1 Vehicle | 372 (7.7%) | 799 (20.5%) |
| 2 Vehicles | 2,848 (58.9%) | 1,932 (49.5%) |
| 3 Vehicles | 1,144 (23.7%) | 848 (21.7%) |
| 4 Vehicles | 202 (4.2%) | 204 (5.2%) |
| 5 or more Vehicles | 227 (4.7%) | 118 (3.0%) |
| Total | 4,835 (100.0%) | 3,901 (100.0%) |
Commute Time in Holly Springs
The most frequently occuring commute durations in Holly Springs are 45 to 59 minutes (1,429 commuters, 20.6%), 30 to 34 minutes (1,090 commuters, 15.7%), and 60 to 89 minutes (936 commuters, 13.5%).
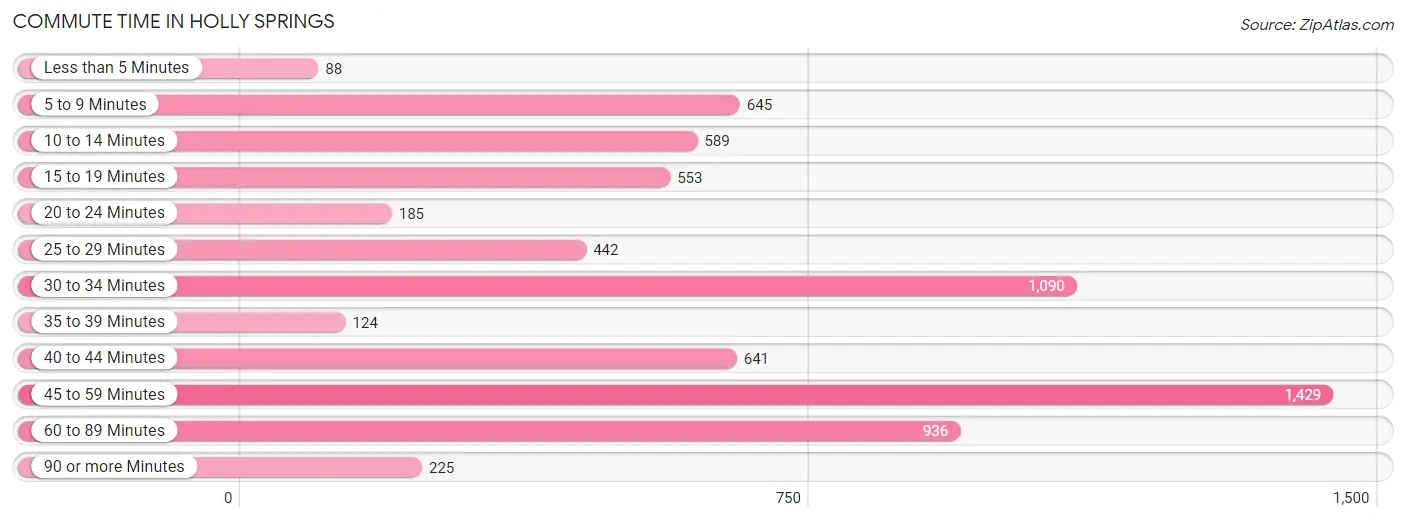
| Commute Time | # Commuters | % Commuters |
| Less than 5 Minutes | 88 | 1.3% |
| 5 to 9 Minutes | 645 | 9.3% |
| 10 to 14 Minutes | 589 | 8.5% |
| 15 to 19 Minutes | 553 | 8.0% |
| 20 to 24 Minutes | 185 | 2.7% |
| 25 to 29 Minutes | 442 | 6.4% |
| 30 to 34 Minutes | 1,090 | 15.7% |
| 35 to 39 Minutes | 124 | 1.8% |
| 40 to 44 Minutes | 641 | 9.2% |
| 45 to 59 Minutes | 1,429 | 20.6% |
| 60 to 89 Minutes | 936 | 13.5% |
| 90 or more Minutes | 225 | 3.2% |
Commute Time by Sex in Holly Springs
The most common commute times in Holly Springs are 45 to 59 minutes (801 commuters, 21.0%) for males and 45 to 59 minutes (628 commuters, 20.1%) for females.
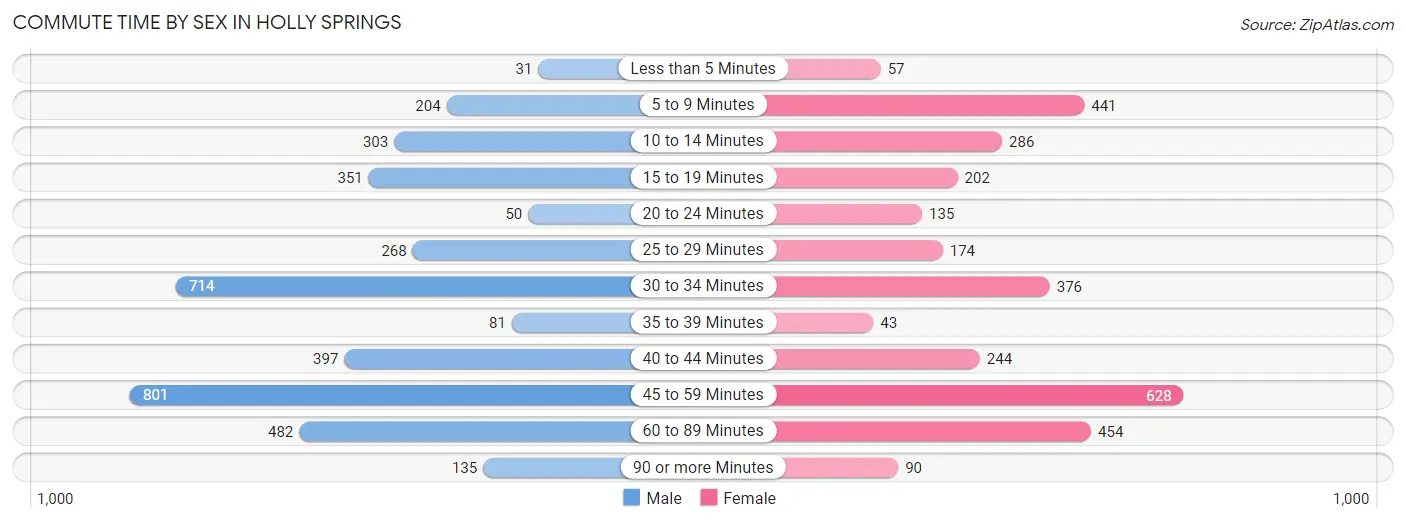
| Commute Time | Male | Female |
| Less than 5 Minutes | 31 (0.8%) | 57 (1.8%) |
| 5 to 9 Minutes | 204 (5.3%) | 441 (14.1%) |
| 10 to 14 Minutes | 303 (7.9%) | 286 (9.1%) |
| 15 to 19 Minutes | 351 (9.2%) | 202 (6.5%) |
| 20 to 24 Minutes | 50 (1.3%) | 135 (4.3%) |
| 25 to 29 Minutes | 268 (7.0%) | 174 (5.6%) |
| 30 to 34 Minutes | 714 (18.7%) | 376 (12.0%) |
| 35 to 39 Minutes | 81 (2.1%) | 43 (1.4%) |
| 40 to 44 Minutes | 397 (10.4%) | 244 (7.8%) |
| 45 to 59 Minutes | 801 (21.0%) | 628 (20.1%) |
| 60 to 89 Minutes | 482 (12.6%) | 454 (14.5%) |
| 90 or more Minutes | 135 (3.5%) | 90 (2.9%) |
Time of Departure to Work by Sex in Holly Springs
The most frequent times of departure to work in Holly Springs are 7:00 AM to 7:29 AM (741, 19.4%) for males and 6:30 AM to 6:59 AM (689, 22.0%) for females.
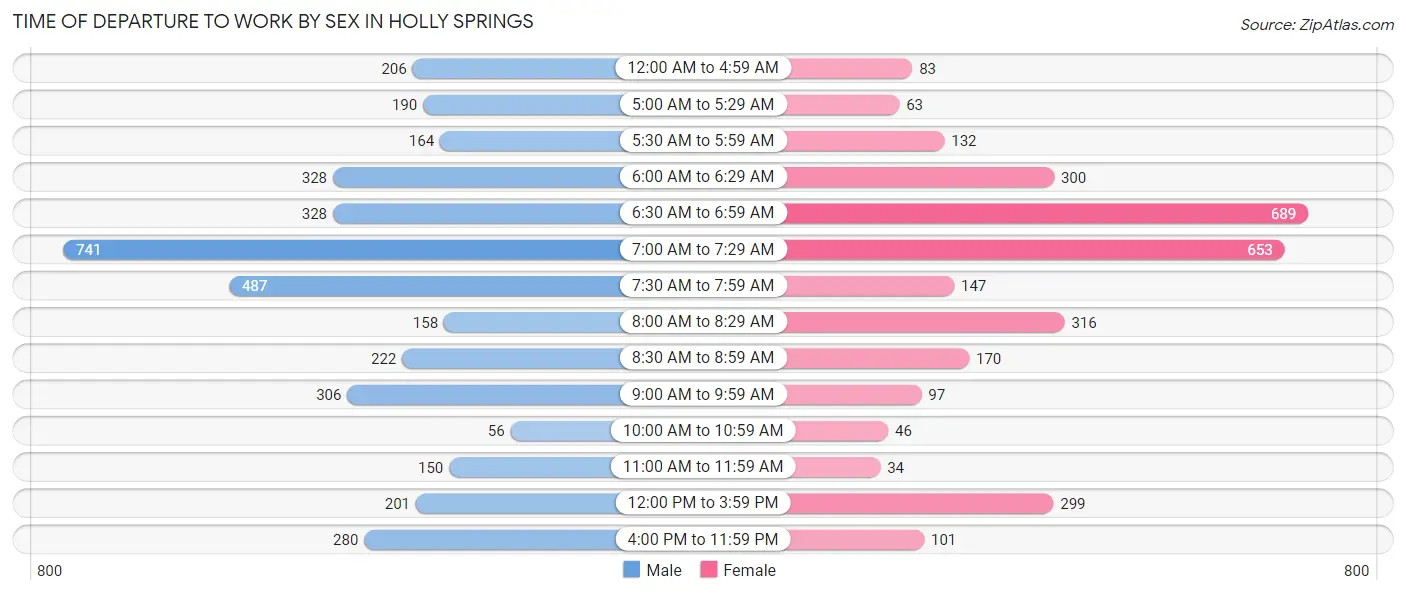
| Time of Departure | Male | Female |
| 12:00 AM to 4:59 AM | 206 (5.4%) | 83 (2.6%) |
| 5:00 AM to 5:29 AM | 190 (5.0%) | 63 (2.0%) |
| 5:30 AM to 5:59 AM | 164 (4.3%) | 132 (4.2%) |
| 6:00 AM to 6:29 AM | 328 (8.6%) | 300 (9.6%) |
| 6:30 AM to 6:59 AM | 328 (8.6%) | 689 (22.0%) |
| 7:00 AM to 7:29 AM | 741 (19.4%) | 653 (20.9%) |
| 7:30 AM to 7:59 AM | 487 (12.8%) | 147 (4.7%) |
| 8:00 AM to 8:29 AM | 158 (4.1%) | 316 (10.1%) |
| 8:30 AM to 8:59 AM | 222 (5.8%) | 170 (5.4%) |
| 9:00 AM to 9:59 AM | 306 (8.0%) | 97 (3.1%) |
| 10:00 AM to 10:59 AM | 56 (1.5%) | 46 (1.5%) |
| 11:00 AM to 11:59 AM | 150 (3.9%) | 34 (1.1%) |
| 12:00 PM to 3:59 PM | 201 (5.3%) | 299 (9.6%) |
| 4:00 PM to 11:59 PM | 280 (7.3%) | 101 (3.2%) |
| Total | 3,817 (100.0%) | 3,130 (100.0%) |
Housing Occupancy in Holly Springs
Occupancy by Ownership in Holly Springs
Of the total 6,013 dwellings in Holly Springs, owner-occupied units account for 4,564 (75.9%), while renter-occupied units make up 1,449 (24.1%).
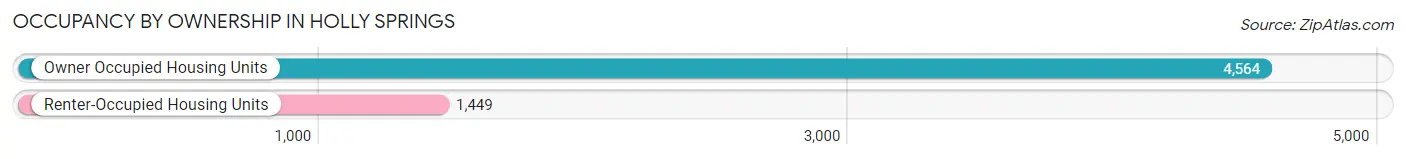
| Occupancy | # Housing Units | % Housing Units |
| Owner Occupied Housing Units | 4,564 | 75.9% |
| Renter-Occupied Housing Units | 1,449 | 24.1% |
| Total Occupied Housing Units | 6,013 | 100.0% |
Occupancy by Household Size in Holly Springs
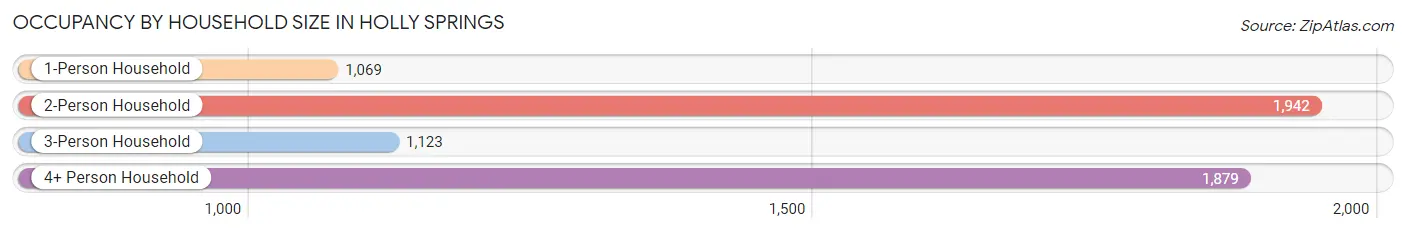
| Household Size | # Housing Units | % Housing Units |
| 1-Person Household | 1,069 | 17.8% |
| 2-Person Household | 1,942 | 32.3% |
| 3-Person Household | 1,123 | 18.7% |
| 4+ Person Household | 1,879 | 31.2% |
| Total Housing Units | 6,013 | 100.0% |
Occupancy by Ownership by Household Size in Holly Springs
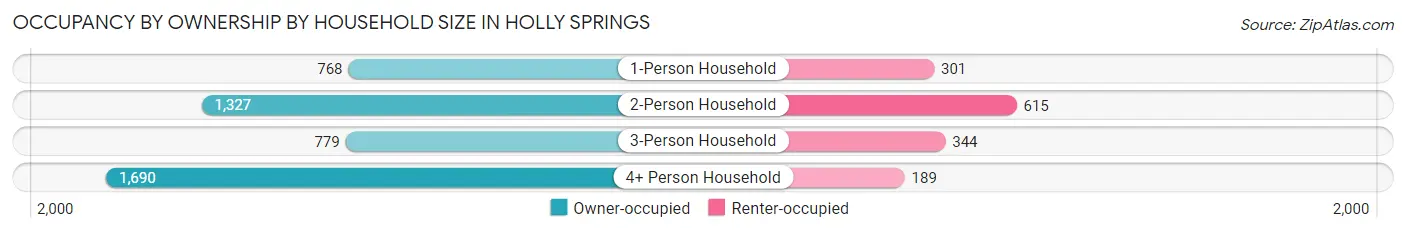
| Household Size | Owner-occupied | Renter-occupied |
| 1-Person Household | 768 (71.8%) | 301 (28.2%) |
| 2-Person Household | 1,327 (68.3%) | 615 (31.7%) |
| 3-Person Household | 779 (69.4%) | 344 (30.6%) |
| 4+ Person Household | 1,690 (89.9%) | 189 (10.1%) |
| Total Housing Units | 4,564 (75.9%) | 1,449 (24.1%) |
Occupancy by Educational Attainment in Holly Springs
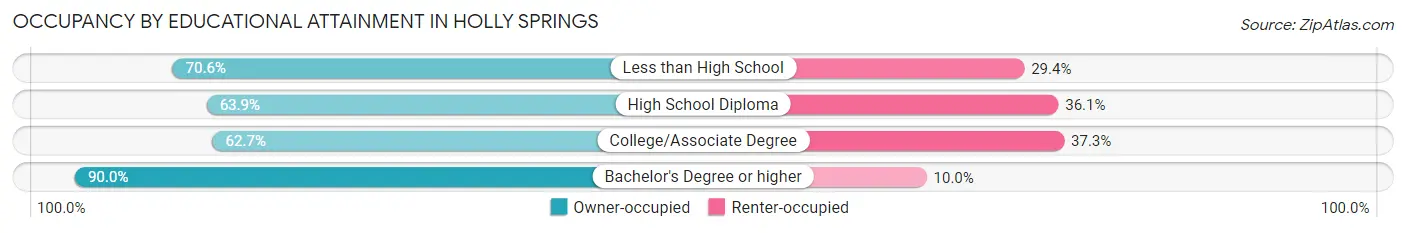
| Household Size | Owner-occupied | Renter-occupied |
| Less than High School | 154 (70.6%) | 64 (29.4%) |
| High School Diploma | 584 (63.9%) | 330 (36.1%) |
| College/Associate Degree | 1,305 (62.7%) | 775 (37.3%) |
| Bachelor's Degree or higher | 2,521 (90.0%) | 280 (10.0%) |
Occupancy by Age of Householder in Holly Springs
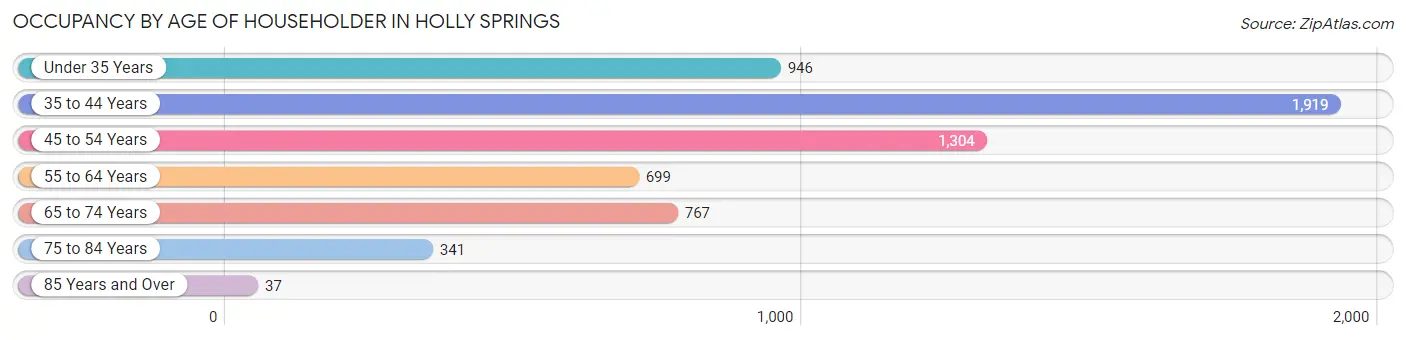
| Age Bracket | # Households | % Households |
| Under 35 Years | 946 | 15.7% |
| 35 to 44 Years | 1,919 | 31.9% |
| 45 to 54 Years | 1,304 | 21.7% |
| 55 to 64 Years | 699 | 11.6% |
| 65 to 74 Years | 767 | 12.8% |
| 75 to 84 Years | 341 | 5.7% |
| 85 Years and Over | 37 | 0.6% |
| Total | 6,013 | 100.0% |
Housing Finances in Holly Springs
Median Income by Occupancy in Holly Springs
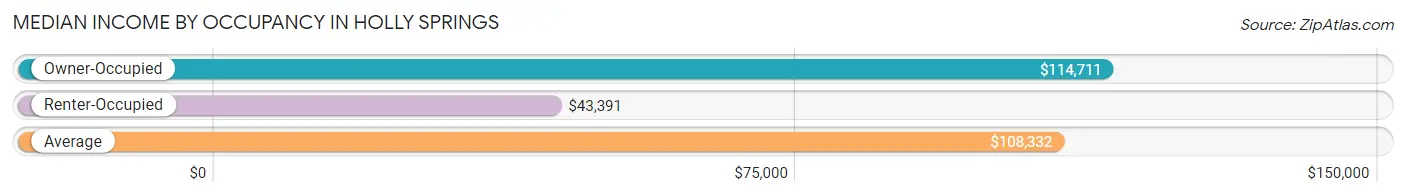
| Occupancy Type | # Households | Median Income |
| Owner-Occupied | 4,564 (75.9%) | $114,711 |
| Renter-Occupied | 1,449 (24.1%) | $43,391 |
| Average | 6,013 (100.0%) | $108,332 |
Occupancy by Householder Income Bracket in Holly Springs
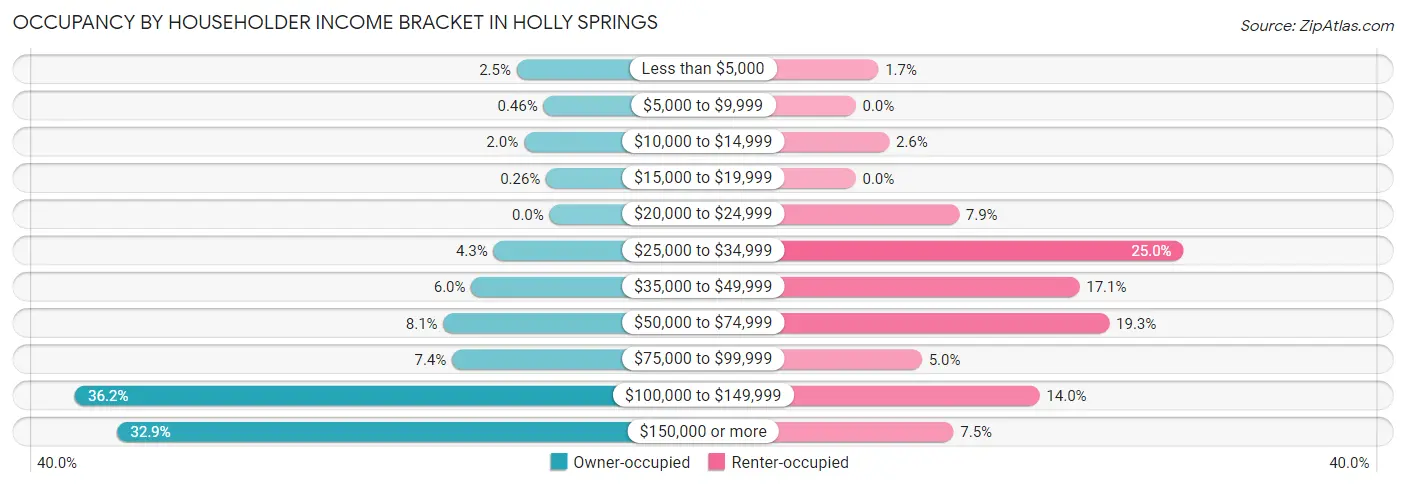
| Income Bracket | Owner-occupied | Renter-occupied |
| Less than $5,000 | 114 (2.5%) | 25 (1.7%) |
| $5,000 to $9,999 | 21 (0.5%) | 0 (0.0%) |
| $10,000 to $14,999 | 89 (1.9%) | 37 (2.5%) |
| $15,000 to $19,999 | 12 (0.3%) | 0 (0.0%) |
| $20,000 to $24,999 | 0 (0.0%) | 114 (7.9%) |
| $25,000 to $34,999 | 195 (4.3%) | 362 (25.0%) |
| $35,000 to $49,999 | 272 (6.0%) | 247 (17.1%) |
| $50,000 to $74,999 | 369 (8.1%) | 280 (19.3%) |
| $75,000 to $99,999 | 339 (7.4%) | 73 (5.0%) |
| $100,000 to $149,999 | 1,650 (36.1%) | 203 (14.0%) |
| $150,000 or more | 1,503 (32.9%) | 108 (7.4%) |
| Total | 4,564 (100.0%) | 1,449 (100.0%) |
Monthly Housing Cost Tiers in Holly Springs
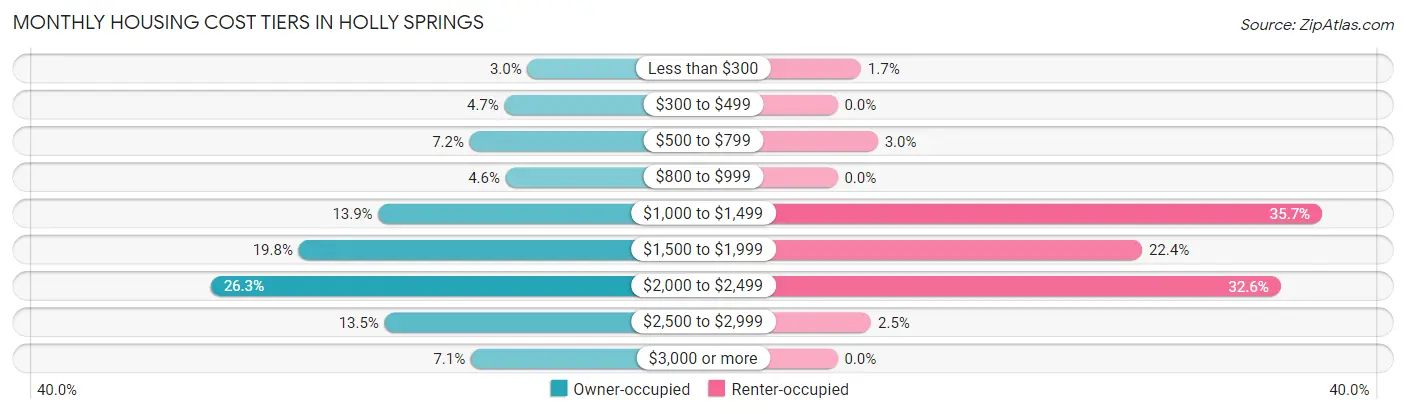
| Monthly Cost | Owner-occupied | Renter-occupied |
| Less than $300 | 135 (3.0%) | 25 (1.7%) |
| $300 to $499 | 212 (4.6%) | 0 (0.0%) |
| $500 to $799 | 329 (7.2%) | 43 (3.0%) |
| $800 to $999 | 208 (4.6%) | 0 (0.0%) |
| $1,000 to $1,499 | 636 (13.9%) | 517 (35.7%) |
| $1,500 to $1,999 | 904 (19.8%) | 325 (22.4%) |
| $2,000 to $2,499 | 1,200 (26.3%) | 473 (32.6%) |
| $2,500 to $2,999 | 615 (13.5%) | 36 (2.5%) |
| $3,000 or more | 325 (7.1%) | 0 (0.0%) |
| Total | 4,564 (100.0%) | 1,449 (100.0%) |
Physical Housing Characteristics in Holly Springs
Housing Structures in Holly Springs
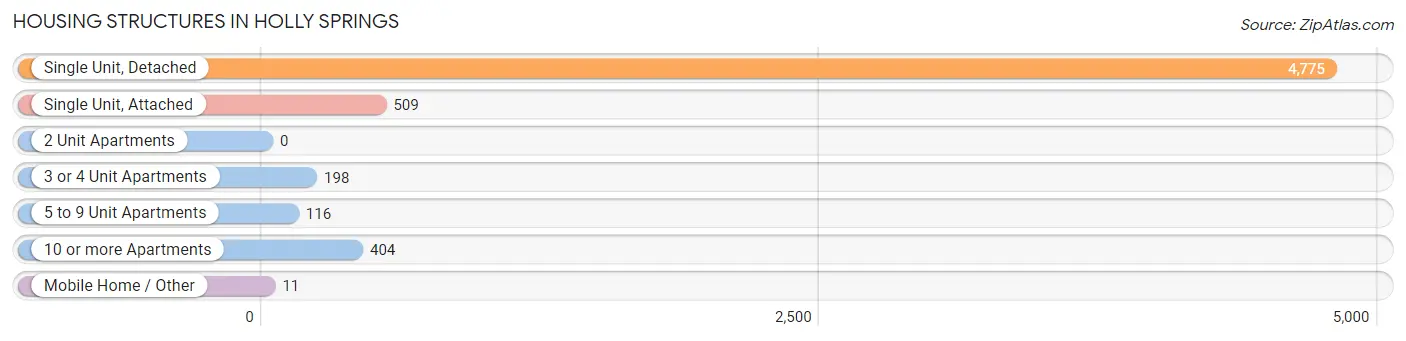
| Structure Type | # Housing Units | % Housing Units |
| Single Unit, Detached | 4,775 | 79.4% |
| Single Unit, Attached | 509 | 8.5% |
| 2 Unit Apartments | 0 | 0.0% |
| 3 or 4 Unit Apartments | 198 | 3.3% |
| 5 to 9 Unit Apartments | 116 | 1.9% |
| 10 or more Apartments | 404 | 6.7% |
| Mobile Home / Other | 11 | 0.2% |
| Total | 6,013 | 100.0% |
Housing Structures by Occupancy in Holly Springs
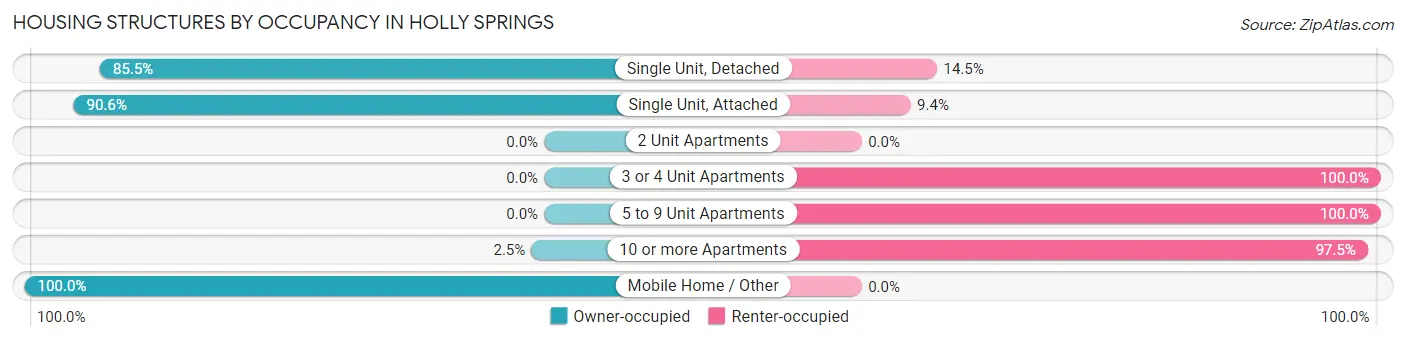
| Structure Type | Owner-occupied | Renter-occupied |
| Single Unit, Detached | 4,082 (85.5%) | 693 (14.5%) |
| Single Unit, Attached | 461 (90.6%) | 48 (9.4%) |
| 2 Unit Apartments | 0 (0.0%) | 0 (0.0%) |
| 3 or 4 Unit Apartments | 0 (0.0%) | 198 (100.0%) |
| 5 to 9 Unit Apartments | 0 (0.0%) | 116 (100.0%) |
| 10 or more Apartments | 10 (2.5%) | 394 (97.5%) |
| Mobile Home / Other | 11 (100.0%) | 0 (0.0%) |
| Total | 4,564 (75.9%) | 1,449 (24.1%) |
Housing Structures by Number of Rooms in Holly Springs
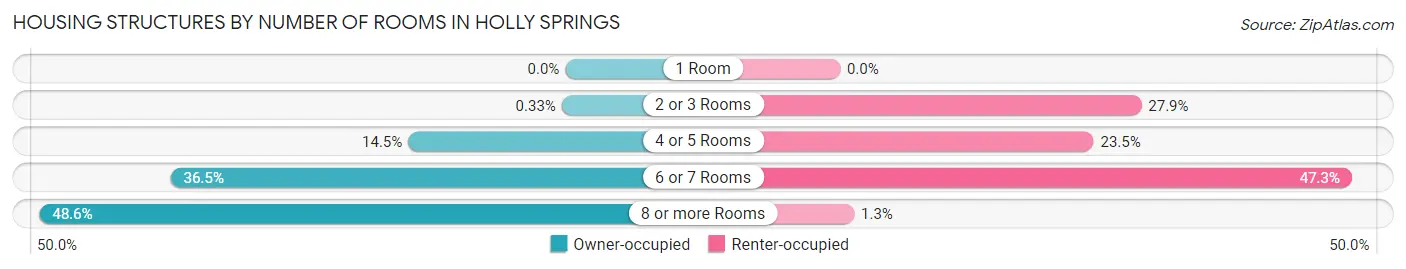
| Number of Rooms | Owner-occupied | Renter-occupied |
| 1 Room | 0 (0.0%) | 0 (0.0%) |
| 2 or 3 Rooms | 15 (0.3%) | 404 (27.9%) |
| 4 or 5 Rooms | 663 (14.5%) | 340 (23.5%) |
| 6 or 7 Rooms | 1,666 (36.5%) | 686 (47.3%) |
| 8 or more Rooms | 2,220 (48.6%) | 19 (1.3%) |
| Total | 4,564 (100.0%) | 1,449 (100.0%) |
Housing Structure by Heating Type in Holly Springs
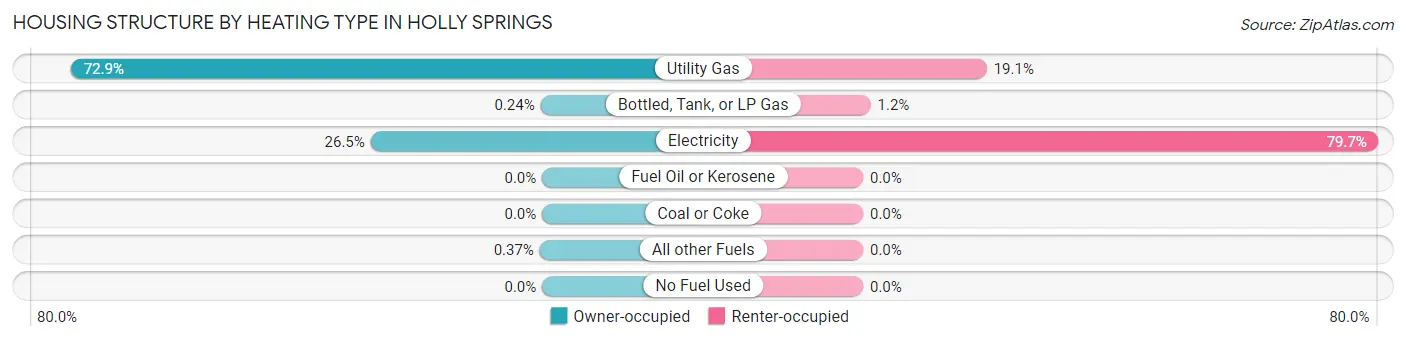
| Heating Type | Owner-occupied | Renter-occupied |
| Utility Gas | 3,326 (72.9%) | 277 (19.1%) |
| Bottled, Tank, or LP Gas | 11 (0.2%) | 17 (1.2%) |
| Electricity | 1,210 (26.5%) | 1,155 (79.7%) |
| Fuel Oil or Kerosene | 0 (0.0%) | 0 (0.0%) |
| Coal or Coke | 0 (0.0%) | 0 (0.0%) |
| All other Fuels | 17 (0.4%) | 0 (0.0%) |
| No Fuel Used | 0 (0.0%) | 0 (0.0%) |
| Total | 4,564 (100.0%) | 1,449 (100.0%) |
Household Vehicle Usage in Holly Springs
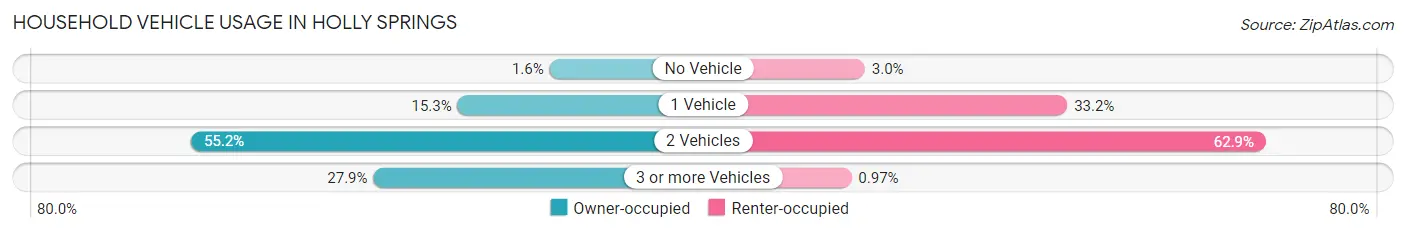
| Vehicles per Household | Owner-occupied | Renter-occupied |
| No Vehicle | 73 (1.6%) | 43 (3.0%) |
| 1 Vehicle | 700 (15.3%) | 481 (33.2%) |
| 2 Vehicles | 2,517 (55.1%) | 911 (62.9%) |
| 3 or more Vehicles | 1,274 (27.9%) | 14 (1.0%) |
| Total | 4,564 (100.0%) | 1,449 (100.0%) |
Real Estate & Mortgages in Holly Springs
Real Estate and Mortgage Overview in Holly Springs
| Characteristic | Without Mortgage | With Mortgage |
| Housing Units | 708 | 3,856 |
| Median Property Value | $294,000 | $389,400 |
| Median Household Income | $75,806 | $1,466 |
| Monthly Housing Costs | $527 | $325 |
| Real Estate Taxes | $1,664 | $83 |
Property Value by Mortgage Status in Holly Springs
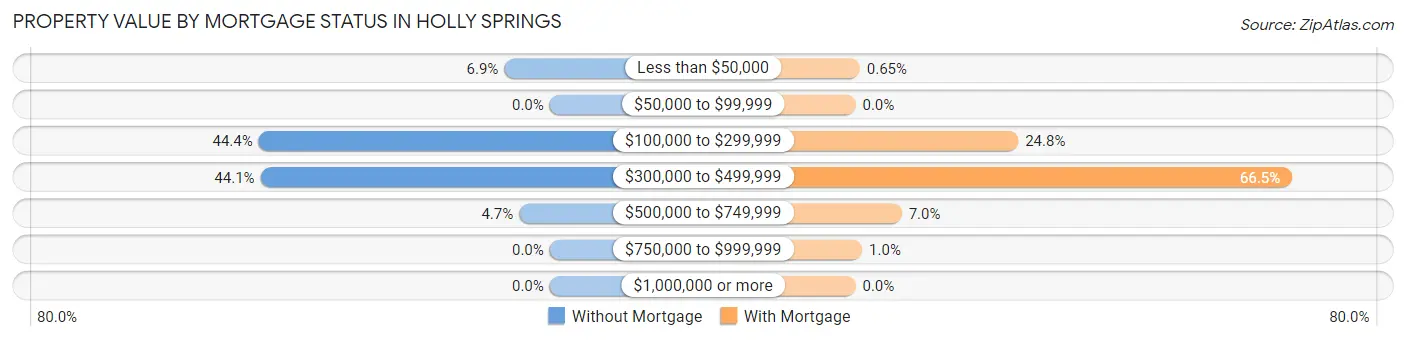
| Property Value | Without Mortgage | With Mortgage |
| Less than $50,000 | 49 (6.9%) | 25 (0.6%) |
| $50,000 to $99,999 | 0 (0.0%) | 0 (0.0%) |
| $100,000 to $299,999 | 314 (44.4%) | 956 (24.8%) |
| $300,000 to $499,999 | 312 (44.1%) | 2,565 (66.5%) |
| $500,000 to $749,999 | 33 (4.7%) | 271 (7.0%) |
| $750,000 to $999,999 | 0 (0.0%) | 39 (1.0%) |
| $1,000,000 or more | 0 (0.0%) | 0 (0.0%) |
| Total | 708 (100.0%) | 3,856 (100.0%) |
Household Income by Mortgage Status in Holly Springs
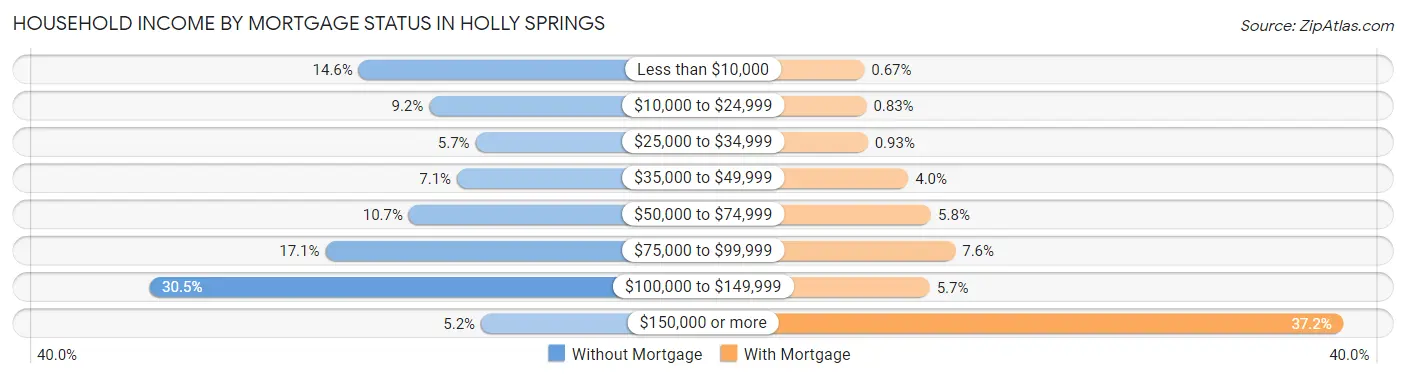
| Household Income | Without Mortgage | With Mortgage |
| Less than $10,000 | 103 (14.5%) | 26 (0.7%) |
| $10,000 to $24,999 | 65 (9.2%) | 32 (0.8%) |
| $25,000 to $34,999 | 40 (5.7%) | 36 (0.9%) |
| $35,000 to $49,999 | 50 (7.1%) | 155 (4.0%) |
| $50,000 to $74,999 | 76 (10.7%) | 222 (5.8%) |
| $75,000 to $99,999 | 121 (17.1%) | 293 (7.6%) |
| $100,000 to $149,999 | 216 (30.5%) | 218 (5.7%) |
| $150,000 or more | 37 (5.2%) | 1,434 (37.2%) |
| Total | 708 (100.0%) | 3,856 (100.0%) |
Property Value to Household Income Ratio in Holly Springs
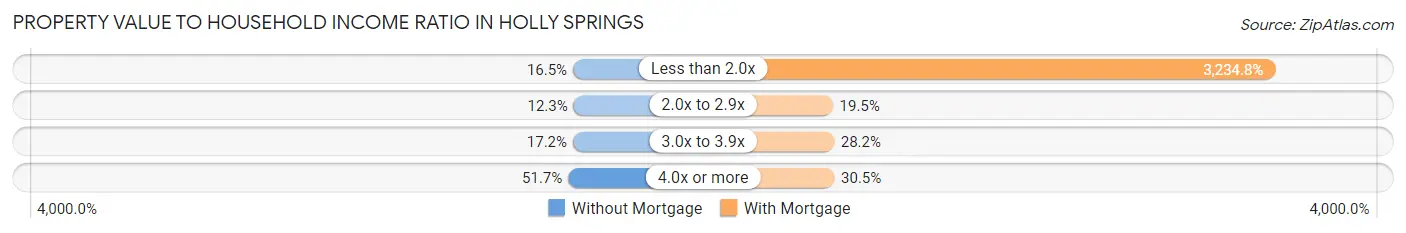
| Value-to-Income Ratio | Without Mortgage | With Mortgage |
| Less than 2.0x | 117 (16.5%) | 124,734 (3,234.8%) |
| 2.0x to 2.9x | 87 (12.3%) | 750 (19.5%) |
| 3.0x to 3.9x | 122 (17.2%) | 1,089 (28.2%) |
| 4.0x or more | 366 (51.7%) | 1,174 (30.4%) |
| Total | 708 (100.0%) | 3,856 (100.0%) |
Real Estate Taxes by Mortgage Status in Holly Springs
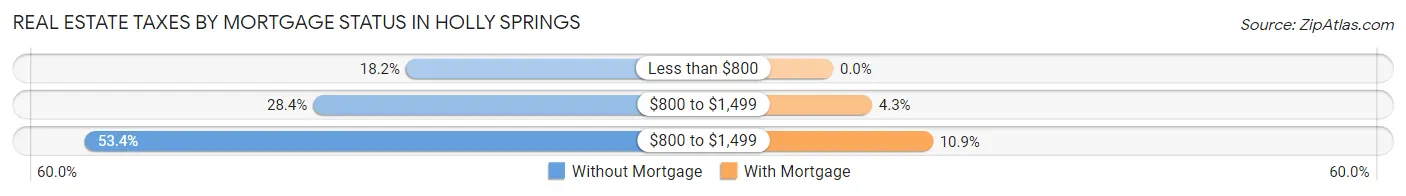
| Property Taxes | Without Mortgage | With Mortgage |
| Less than $800 | 129 (18.2%) | 0 (0.0%) |
| $800 to $1,499 | 201 (28.4%) | 164 (4.3%) |
| $800 to $1,499 | 378 (53.4%) | 421 (10.9%) |
| Total | 708 (100.0%) | 3,856 (100.0%) |
Health & Disability in Holly Springs
Health Insurance Coverage by Age in Holly Springs
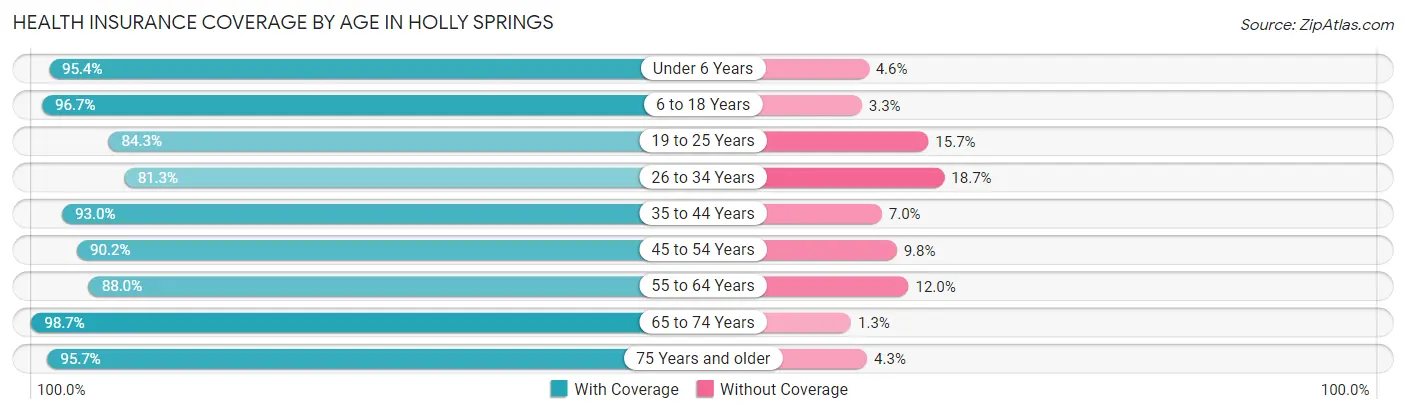
| Age Bracket | With Coverage | Without Coverage |
| Under 6 Years | 1,215 (95.4%) | 58 (4.6%) |
| 6 to 18 Years | 3,316 (96.7%) | 112 (3.3%) |
| 19 to 25 Years | 936 (84.3%) | 174 (15.7%) |
| 26 to 34 Years | 1,350 (81.3%) | 310 (18.7%) |
| 35 to 44 Years | 3,103 (93.0%) | 234 (7.0%) |
| 45 to 54 Years | 2,270 (90.2%) | 246 (9.8%) |
| 55 to 64 Years | 1,035 (88.0%) | 141 (12.0%) |
| 65 to 74 Years | 1,474 (98.7%) | 19 (1.3%) |
| 75 Years and older | 652 (95.7%) | 29 (4.3%) |
| Total | 15,351 (92.1%) | 1,323 (7.9%) |
Health Insurance Coverage by Citizenship Status in Holly Springs
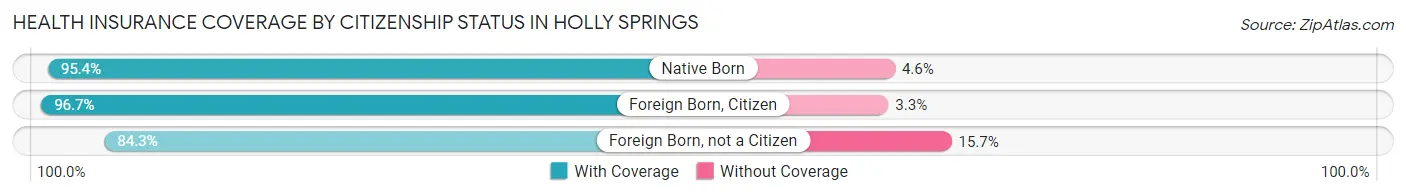
| Citizenship Status | With Coverage | Without Coverage |
| Native Born | 1,215 (95.4%) | 58 (4.6%) |
| Foreign Born, Citizen | 3,316 (96.7%) | 112 (3.3%) |
| Foreign Born, not a Citizen | 936 (84.3%) | 174 (15.7%) |
Health Insurance Coverage by Household Income in Holly Springs
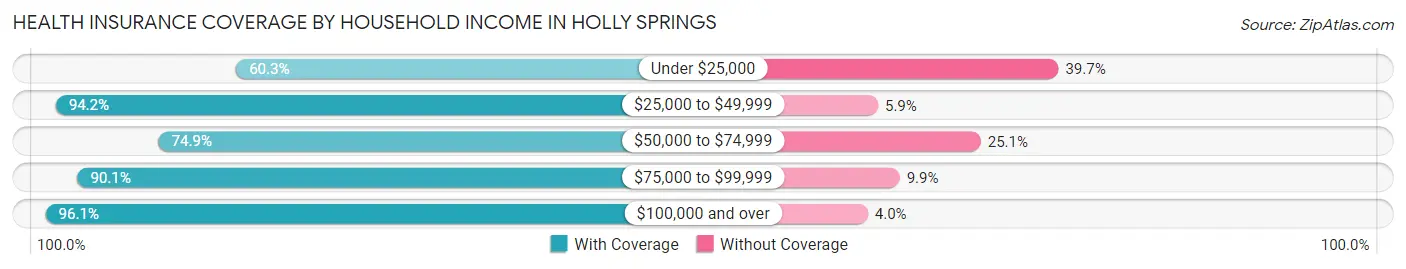
| Household Income | With Coverage | Without Coverage |
| Under $25,000 | 499 (60.3%) | 328 (39.7%) |
| $25,000 to $49,999 | 1,979 (94.2%) | 123 (5.9%) |
| $50,000 to $74,999 | 877 (74.9%) | 294 (25.1%) |
| $75,000 to $99,999 | 1,227 (90.1%) | 135 (9.9%) |
| $100,000 and over | 10,766 (96.1%) | 443 (4.0%) |
Public vs Private Health Insurance Coverage by Age in Holly Springs
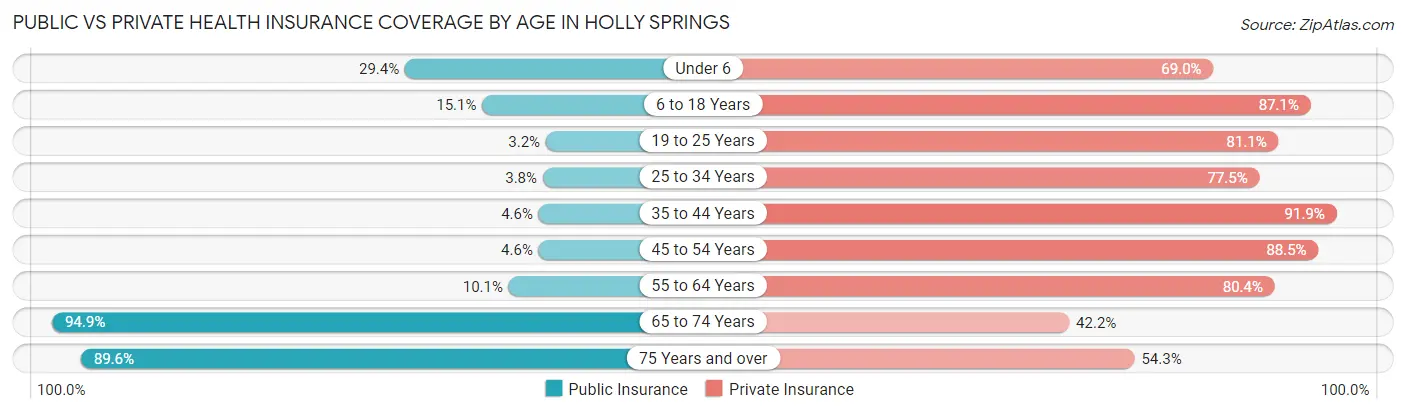
| Age Bracket | Public Insurance | Private Insurance |
| Under 6 | 374 (29.4%) | 878 (69.0%) |
| 6 to 18 Years | 516 (15.0%) | 2,984 (87.1%) |
| 19 to 25 Years | 36 (3.2%) | 900 (81.1%) |
| 25 to 34 Years | 63 (3.8%) | 1,287 (77.5%) |
| 35 to 44 Years | 152 (4.5%) | 3,065 (91.8%) |
| 45 to 54 Years | 115 (4.6%) | 2,226 (88.5%) |
| 55 to 64 Years | 119 (10.1%) | 945 (80.4%) |
| 65 to 74 Years | 1,417 (94.9%) | 630 (42.2%) |
| 75 Years and over | 610 (89.6%) | 370 (54.3%) |
| Total | 3,402 (20.4%) | 13,285 (79.7%) |
Disability Status by Sex by Age in Holly Springs
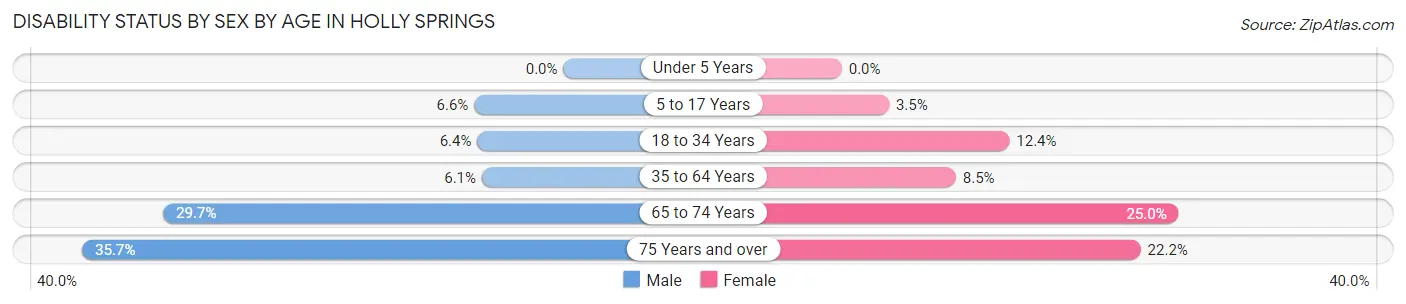
| Age Bracket | Male | Female |
| Under 5 Years | 0 (0.0%) | 0 (0.0%) |
| 5 to 17 Years | 113 (6.6%) | 58 (3.5%) |
| 18 to 34 Years | 94 (6.4%) | 195 (12.4%) |
| 35 to 64 Years | 206 (6.0%) | 307 (8.5%) |
| 65 to 74 Years | 200 (29.7%) | 205 (25.0%) |
| 75 Years and over | 129 (35.7%) | 71 (22.2%) |
Disability Class by Sex by Age in Holly Springs
Disability Class: Hearing Difficulty
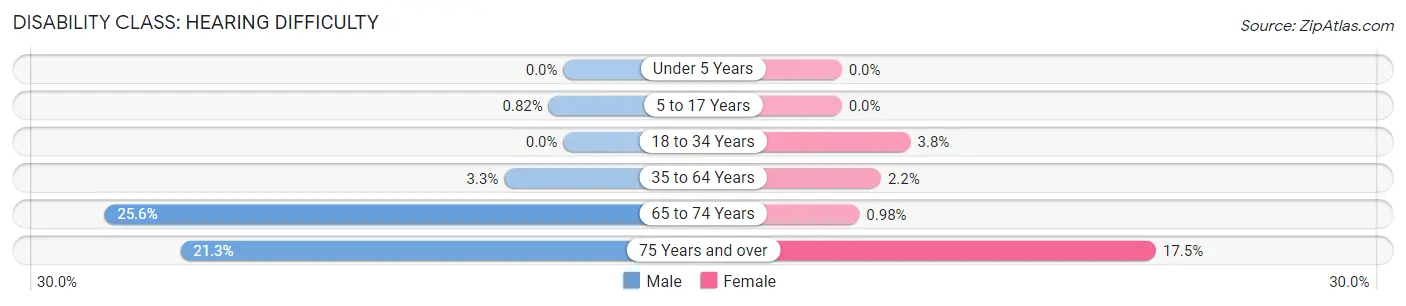
| Age Bracket | Male | Female |
| Under 5 Years | 0 (0.0%) | 0 (0.0%) |
| 5 to 17 Years | 14 (0.8%) | 0 (0.0%) |
| 18 to 34 Years | 0 (0.0%) | 60 (3.8%) |
| 35 to 64 Years | 112 (3.3%) | 79 (2.2%) |
| 65 to 74 Years | 172 (25.6%) | 8 (1.0%) |
| 75 Years and over | 77 (21.3%) | 56 (17.5%) |
Disability Class: Vision Difficulty
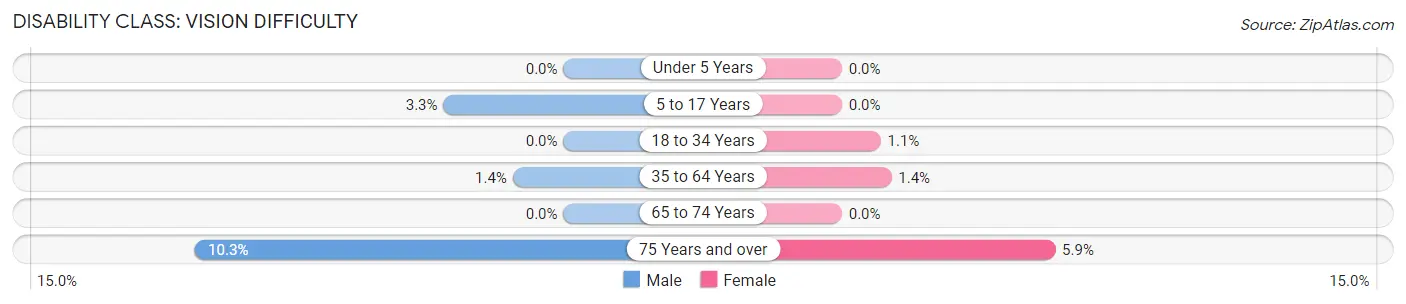
| Age Bracket | Male | Female |
| Under 5 Years | 0 (0.0%) | 0 (0.0%) |
| 5 to 17 Years | 57 (3.3%) | 0 (0.0%) |
| 18 to 34 Years | 0 (0.0%) | 17 (1.1%) |
| 35 to 64 Years | 48 (1.4%) | 50 (1.4%) |
| 65 to 74 Years | 0 (0.0%) | 0 (0.0%) |
| 75 Years and over | 37 (10.2%) | 19 (5.9%) |
Disability Class: Cognitive Difficulty
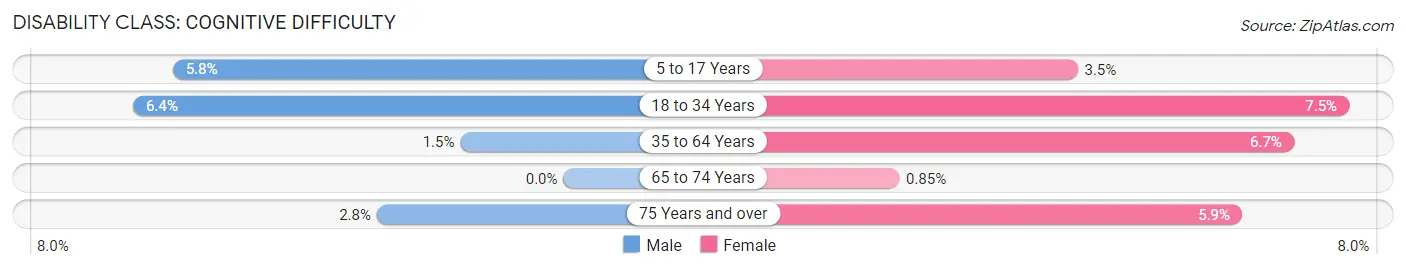
| Age Bracket | Male | Female |
| 5 to 17 Years | 99 (5.8%) | 58 (3.5%) |
| 18 to 34 Years | 94 (6.4%) | 118 (7.5%) |
| 35 to 64 Years | 52 (1.5%) | 243 (6.7%) |
| 65 to 74 Years | 0 (0.0%) | 7 (0.9%) |
| 75 Years and over | 10 (2.8%) | 19 (5.9%) |
Disability Class: Ambulatory Difficulty
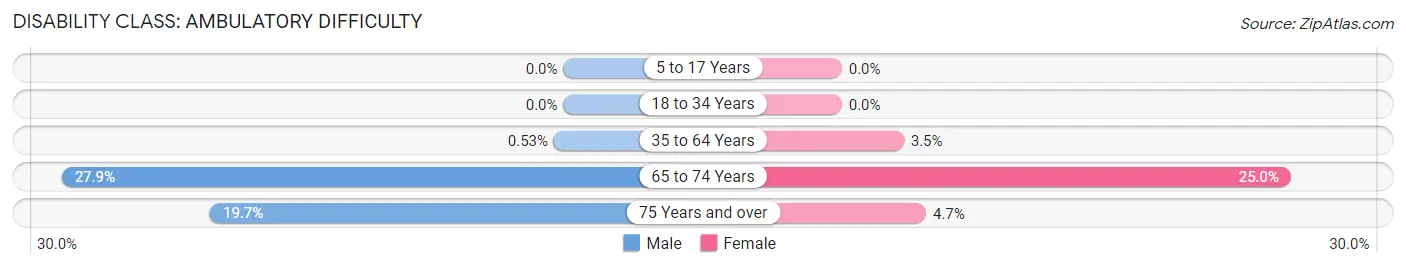
| Age Bracket | Male | Female |
| 5 to 17 Years | 0 (0.0%) | 0 (0.0%) |
| 18 to 34 Years | 0 (0.0%) | 0 (0.0%) |
| 35 to 64 Years | 18 (0.5%) | 125 (3.5%) |
| 65 to 74 Years | 188 (27.9%) | 205 (25.0%) |
| 75 Years and over | 71 (19.7%) | 15 (4.7%) |
Disability Class: Self-Care Difficulty
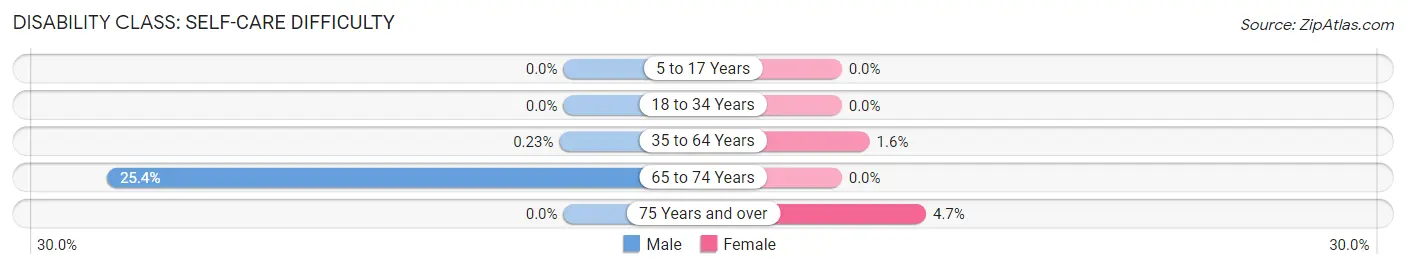
| Age Bracket | Male | Female |
| 5 to 17 Years | 0 (0.0%) | 0 (0.0%) |
| 18 to 34 Years | 0 (0.0%) | 0 (0.0%) |
| 35 to 64 Years | 8 (0.2%) | 56 (1.5%) |
| 65 to 74 Years | 171 (25.4%) | 0 (0.0%) |
| 75 Years and over | 0 (0.0%) | 15 (4.7%) |
Technology Access in Holly Springs
Computing Device Access in Holly Springs
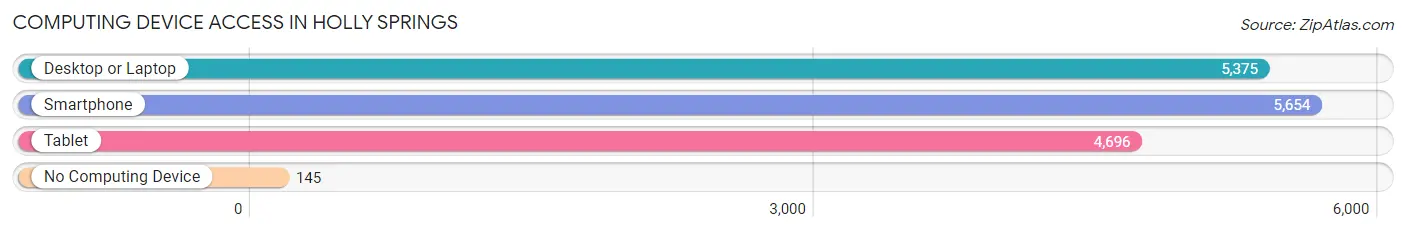
| Device Type | # Households | % Households |
| Desktop or Laptop | 5,375 | 89.4% |
| Smartphone | 5,654 | 94.0% |
| Tablet | 4,696 | 78.1% |
| No Computing Device | 145 | 2.4% |
| Total | 6,013 | 100.0% |
Internet Access in Holly Springs
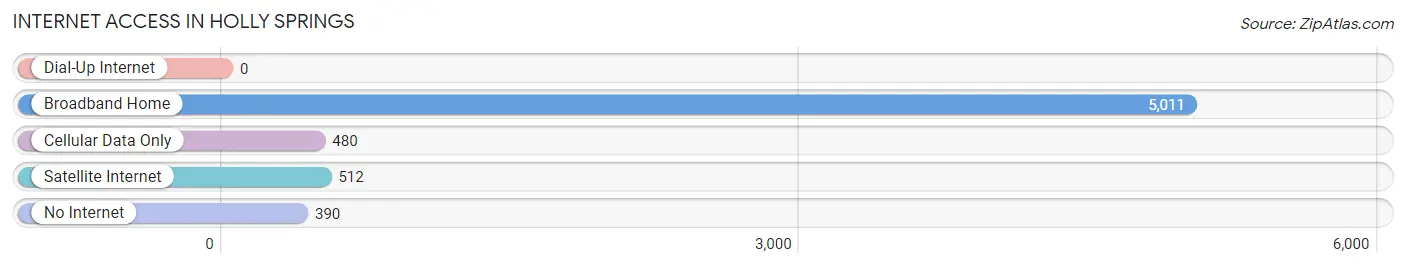
| Internet Type | # Households | % Households |
| Dial-Up Internet | 0 | 0.0% |
| Broadband Home | 5,011 | 83.3% |
| Cellular Data Only | 480 | 8.0% |
| Satellite Internet | 512 | 8.5% |
| No Internet | 390 | 6.5% |
| Total | 6,013 | 100.0% |
Holly Springs Summary
Holly Springs is a city located in Cherokee County, Georgia, United States. The population was 7,939 at the 2010 census. It is part of the Atlanta metropolitan area.
History
Holly Springs was founded in 1837 by a group of settlers from South Carolina. The town was named after the many holly trees that grew in the area. The town was incorporated in 1845 and was the county seat of Cherokee County until 1867.
In the late 1800s, Holly Springs was a popular resort town for wealthy Atlantans. The town was home to several large hotels, including the Holly Springs Hotel, which was built in 1872. The hotel was destroyed by fire in 1891.
In the early 1900s, Holly Springs was a popular destination for African Americans seeking to escape the oppressive Jim Crow laws of the South. The town was home to several African American churches, businesses, and schools.
Geography
Holly Springs is located in the foothills of the Blue Ridge Mountains in northwest Georgia. The city is situated at the intersection of Interstate 575 and Georgia State Route 140. The city is located approximately 30 miles north of Atlanta.
The city has a total area of 8.2 square miles, of which 8.1 square miles is land and 0.1 square miles is water.
Economy
Holly Springs is home to several large employers, including the Cherokee County School District, the Cherokee County Government, and the Northside Hospital Cherokee. The city is also home to several small businesses, including restaurants, retail stores, and professional services.
Demographics
As of the 2010 census, there were 7,939 people, 2,845 households, and 2,072 families residing in the city. The population density was 981.2 people per square mile. The racial makeup of the city was 79.2% White, 14.3% African American, 0.3% Native American, 1.7% Asian, 0.1% Pacific Islander, 2.2% from other races, and 2.3% from two or more races. Hispanic or Latino of any race were 5.2% of the population.
The median income for a household in the city was $50,945, and the median income for a family was $60,945. The per capita income for the city was $25,945. About 8.2% of families and 10.2% of the population were below the poverty line, including 14.2% of those under age 18 and 8.2% of those age 65 or over.
Common Questions
What is Per Capita Income in Holly Springs?
Per Capita income in Holly Springs is $39,935.
What is the Median Family Income in Holly Springs?
Median Family Income in Holly Springs is $114,868.
What is the Median Household income in Holly Springs?
Median Household Income in Holly Springs is $108,332.
What is Income or Wage Gap in Holly Springs?
Income or Wage Gap in Holly Springs is 22.3%.
Women in Holly Springs earn 77.7 cents for every dollar earned by a man.
What is Inequality or Gini Index in Holly Springs?
Inequality or Gini Index in Holly Springs is 0.36.
What is the Total Population of Holly Springs?
Total Population of Holly Springs is 16,675.
What is the Total Male Population of Holly Springs?
Total Male Population of Holly Springs is 8,259.
What is the Total Female Population of Holly Springs?
Total Female Population of Holly Springs is 8,416.
What is the Ratio of Males per 100 Females in Holly Springs?
There are 98.13 Males per 100 Females in Holly Springs.
What is the Ratio of Females per 100 Males in Holly Springs?
There are 101.90 Females per 100 Males in Holly Springs.
What is the Median Population Age in Holly Springs?
Median Population Age in Holly Springs is 39.1 Years.
What is the Average Family Size in Holly Springs
Average Family Size in Holly Springs is 3.2 People.
What is the Average Household Size in Holly Springs
Average Household Size in Holly Springs is 2.8 People.
How Large is the Labor Force in Holly Springs?
There are 9,213 People in the Labor Forcein in Holly Springs.
What is the Percentage of People in the Labor Force in Holly Springs?
72.5% of People are in the Labor Force in Holly Springs.
What is the Unemployment Rate in Holly Springs?
Unemployment Rate in Holly Springs is 3.1%.