Mineral Bluff, GA Map & Demographics
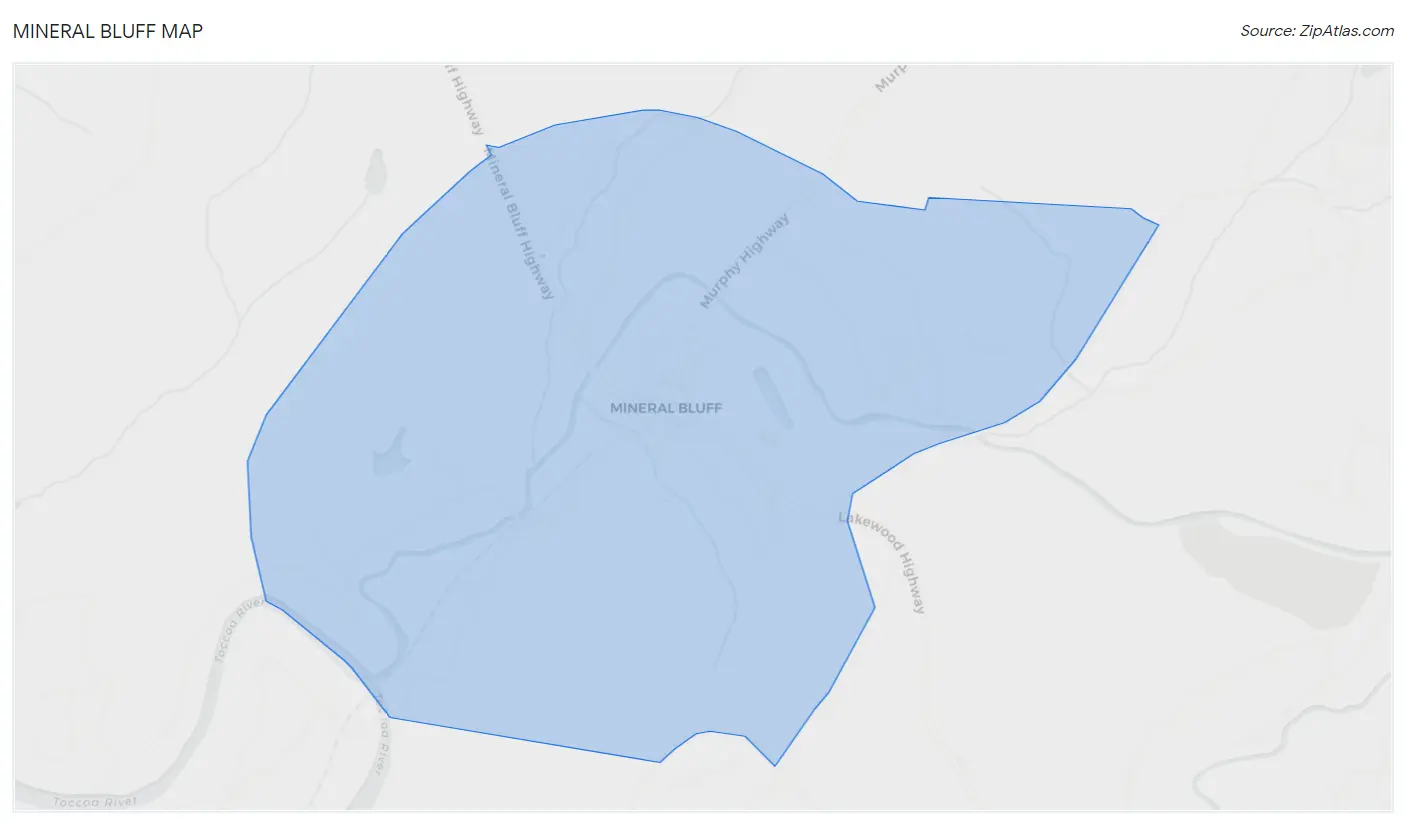
Mineral Bluff Map
Mineral Bluff Overview
$41,408
PER CAPITA INCOME
$175,000
AVG FAMILY INCOME
0.37
INEQUALITY / GINI INDEX
370
TOTAL POPULATION
187
MALE POPULATION
183
FEMALE POPULATION
102.19
MALES / 100 FEMALES
97.86
FEMALES / 100 MALES
24.6
MEDIAN AGE
2.6
AVG FAMILY SIZE
3.0
AVG HOUSEHOLD SIZE
242
LABOR FORCE [ PEOPLE ]
81.2%
PERCENT IN LABOR FORCE
6.6%
UNEMPLOYMENT RATE
Mineral Bluff Zip Codes
Mineral Bluff Area Codes
Income in Mineral Bluff
Income Overview in Mineral Bluff
| Characteristic | Number | Measure |
| Per Capita Income | 370 | $41,408 |
| Median Family Income | 106 | $175,000 |
| Mean Family Income | 106 | $128,130 |
| Median Household Income | 124 | $0 |
| Mean Household Income | 124 | $119,893 |
| Income Deficit | 106 | $0 |
| Wage / Income Gap (%) | 370 | 0.00% |
| Wage / Income Gap ($) | 370 | 100.00¢ per $1 |
| Gini / Inequality Index | 370 | 0.37 |
Earnings by Sex in Mineral Bluff
| Sex | Number | Average Earnings |
| Male | 139 (57.4%) | $0 |
| Female | 103 (42.6%) | $0 |
| Total | 242 (100.0%) | $0 |
Earnings by Sex by Income Bracket in Mineral Bluff
The most common earnings brackets in Mineral Bluff are $100,000+ for men (52 | 37.4%) and $55,000 to $64,999 for women (42 | 40.8%).
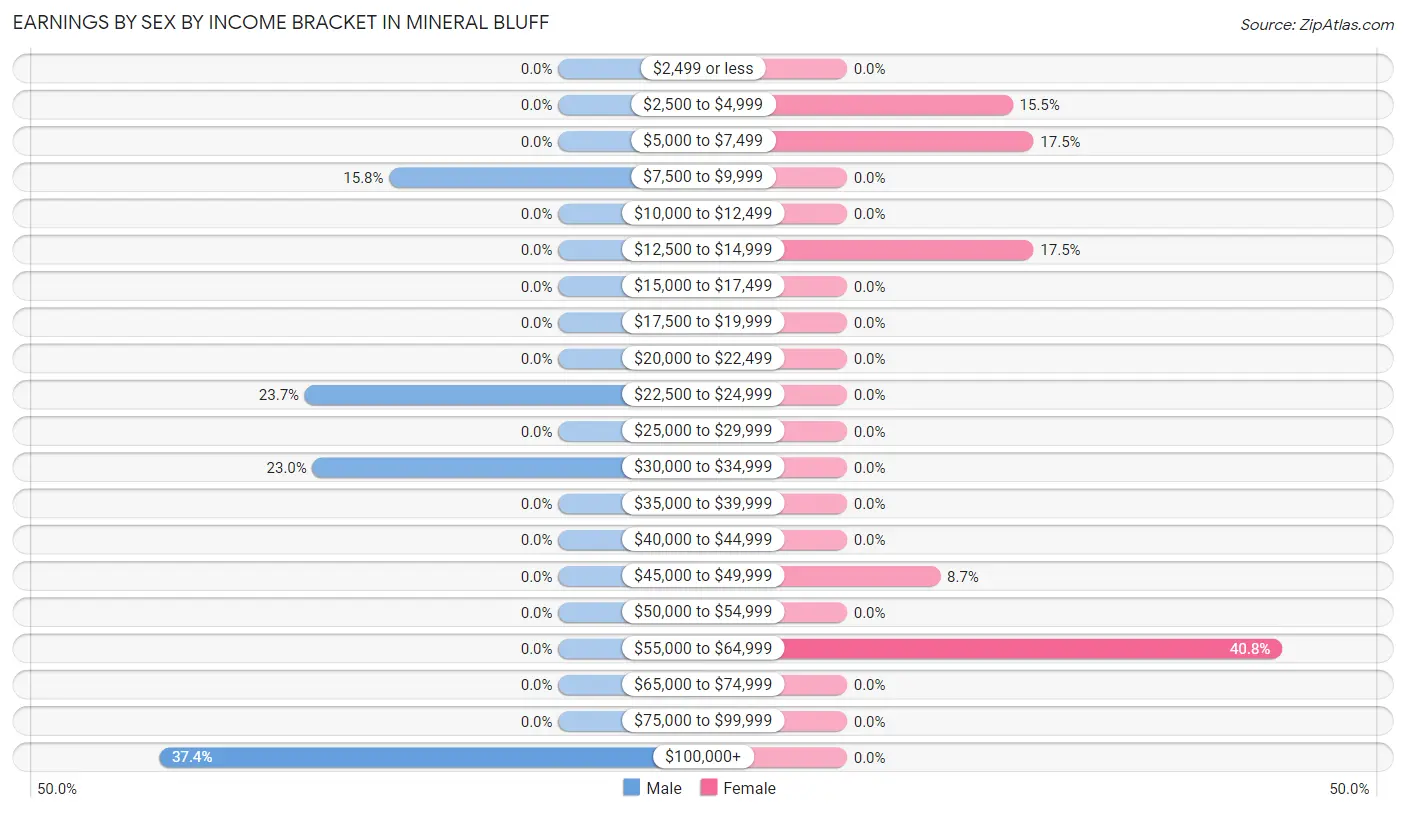
| Income | Male | Female |
| $2,499 or less | 0 (0.0%) | 0 (0.0%) |
| $2,500 to $4,999 | 0 (0.0%) | 16 (15.5%) |
| $5,000 to $7,499 | 0 (0.0%) | 18 (17.5%) |
| $7,500 to $9,999 | 22 (15.8%) | 0 (0.0%) |
| $10,000 to $12,499 | 0 (0.0%) | 0 (0.0%) |
| $12,500 to $14,999 | 0 (0.0%) | 18 (17.5%) |
| $15,000 to $17,499 | 0 (0.0%) | 0 (0.0%) |
| $17,500 to $19,999 | 0 (0.0%) | 0 (0.0%) |
| $20,000 to $22,499 | 0 (0.0%) | 0 (0.0%) |
| $22,500 to $24,999 | 33 (23.7%) | 0 (0.0%) |
| $25,000 to $29,999 | 0 (0.0%) | 0 (0.0%) |
| $30,000 to $34,999 | 32 (23.0%) | 0 (0.0%) |
| $35,000 to $39,999 | 0 (0.0%) | 0 (0.0%) |
| $40,000 to $44,999 | 0 (0.0%) | 0 (0.0%) |
| $45,000 to $49,999 | 0 (0.0%) | 9 (8.7%) |
| $50,000 to $54,999 | 0 (0.0%) | 0 (0.0%) |
| $55,000 to $64,999 | 0 (0.0%) | 42 (40.8%) |
| $65,000 to $74,999 | 0 (0.0%) | 0 (0.0%) |
| $75,000 to $99,999 | 0 (0.0%) | 0 (0.0%) |
| $100,000+ | 52 (37.4%) | 0 (0.0%) |
| Total | 139 (100.0%) | 103 (100.0%) |
Earnings by Sex by Educational Attainment in Mineral Bluff
| Educational Attainment | Male Income | Female Income |
| Less than High School | - | - |
| High School Diploma | - | - |
| College or Associate's Degree | - | - |
| Bachelor's Degree | - | - |
| Graduate Degree | - | - |
| Total | - | - |
Family Income in Mineral Bluff
Family Income Brackets in Mineral Bluff
According to the Mineral Bluff family income data, there are 59 families falling into the $150,000 to $199,999 income range, which is the most common income bracket and makes up 55.7% of all families.
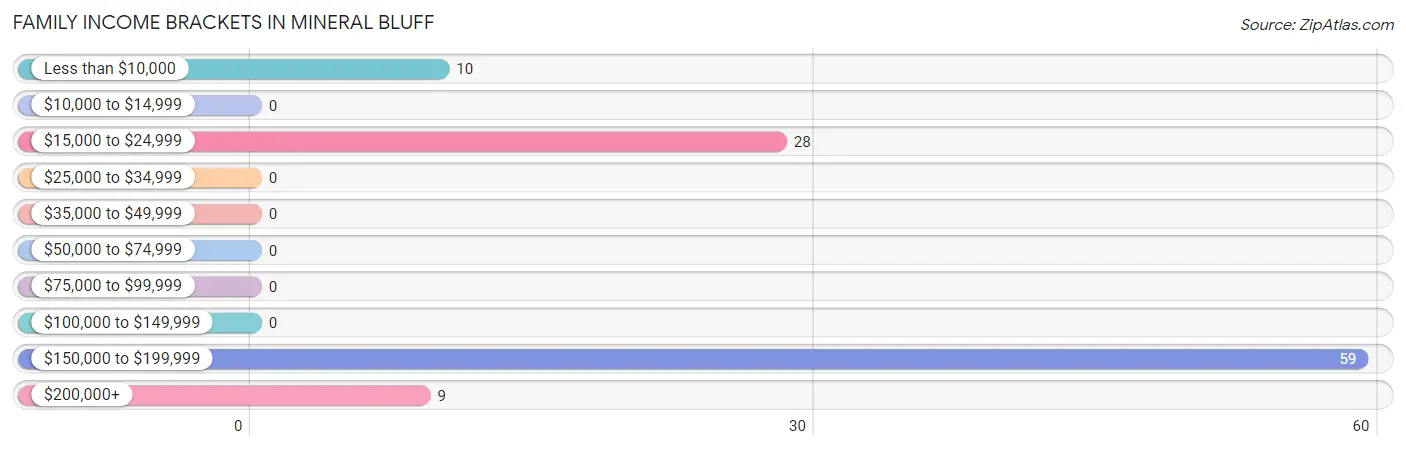
| Income Bracket | # Families | % Families |
| Less than $10,000 | 10 | 9.4% |
| $10,000 to $14,999 | 0 | 0.0% |
| $15,000 to $24,999 | 28 | 26.4% |
| $25,000 to $34,999 | 0 | 0.0% |
| $35,000 to $49,999 | 0 | 0.0% |
| $50,000 to $74,999 | 0 | 0.0% |
| $75,000 to $99,999 | 0 | 0.0% |
| $100,000 to $149,999 | 0 | 0.0% |
| $150,000 to $199,999 | 59 | 55.7% |
| $200,000+ | 9 | 8.5% |
Family Income by Famaliy Size in Mineral Bluff
| Income Bracket | # Families | Median Income |
| 2-Person Families | 52 (49.1%) | $0 |
| 3-Person Families | 54 (50.9%) | $0 |
| 4-Person Families | 0 (0.0%) | $0 |
| 5-Person Families | 0 (0.0%) | $0 |
| 6-Person Families | 0 (0.0%) | $0 |
| 7+ Person Families | 0 (0.0%) | $0 |
| Total | 106 (100.0%) | $175,000 |
Family Income by Number of Earners in Mineral Bluff
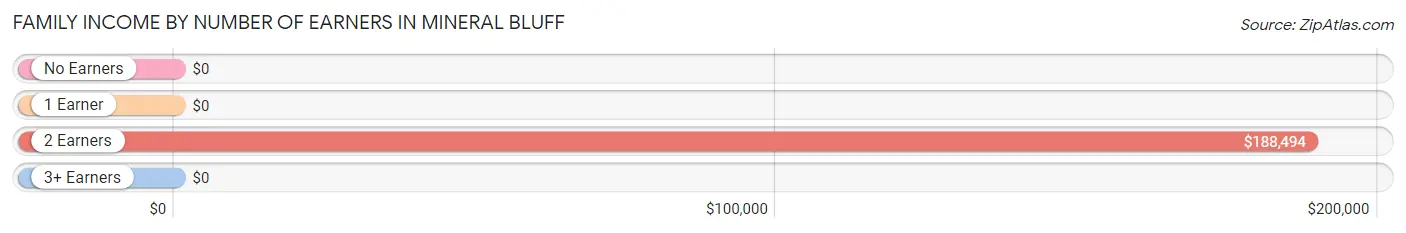
| Number of Earners | # Families | Median Income |
| No Earners | 35 (33.0%) | $0 |
| 1 Earner | 0 (0.0%) | $0 |
| 2 Earners | 71 (67.0%) | $188,494 |
| 3+ Earners | 0 (0.0%) | $0 |
| Total | 106 (100.0%) | $175,000 |
Household Income in Mineral Bluff
Household Income Brackets in Mineral Bluff
With 59 households falling in the category, the $150,000 to $199,999 income range is the most frequent in Mineral Bluff, accounting for 47.6% of all households.
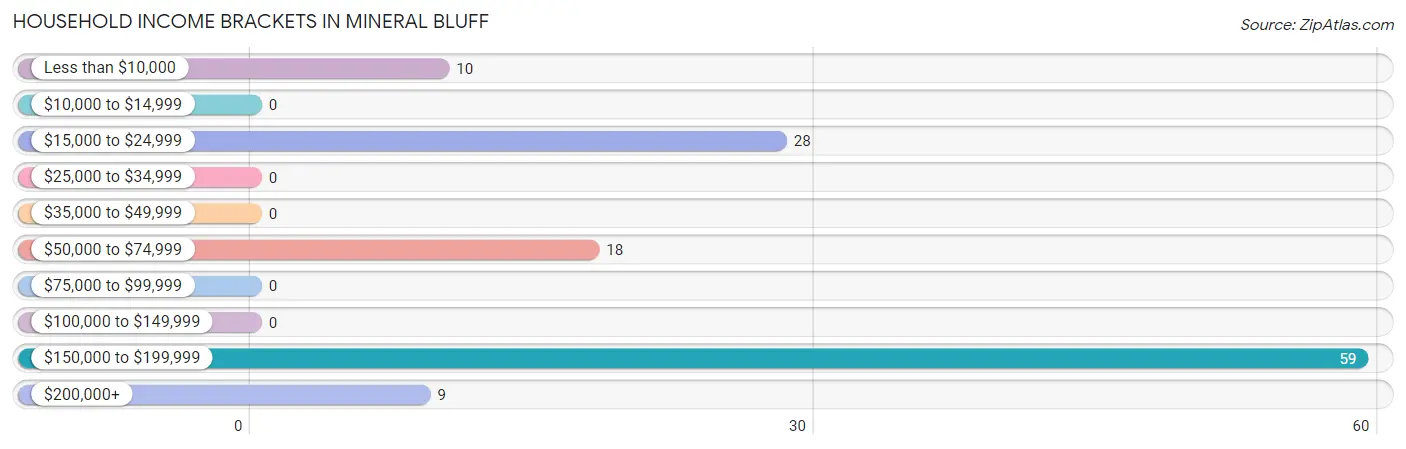
| Income Bracket | # Households | % Households |
| Less than $10,000 | 10 | 8.1% |
| $10,000 to $14,999 | 0 | 0.0% |
| $15,000 to $24,999 | 28 | 22.6% |
| $25,000 to $34,999 | 0 | 0.0% |
| $35,000 to $49,999 | 0 | 0.0% |
| $50,000 to $74,999 | 18 | 14.5% |
| $75,000 to $99,999 | 0 | 0.0% |
| $100,000 to $149,999 | 0 | 0.0% |
| $150,000 to $199,999 | 59 | 47.6% |
| $200,000+ | 9 | 7.3% |
Household Income by Householder Age in Mineral Bluff
| Income Bracket | # Households | Median Income |
| 15 to 24 Years | 18 (14.5%) | $0 |
| 25 to 44 Years | 54 (43.5%) | $0 |
| 45 to 64 Years | 19 (15.3%) | $0 |
| 65+ Years | 33 (26.6%) | $0 |
| Total | 124 (100.0%) | $0 |
Poverty in Mineral Bluff
Income Below Poverty by Sex and Age in Mineral Bluff
With 13.9% poverty level for males and 24.0% for females among the residents of Mineral Bluff, under 5 year old males and 18 to 24 year old females are the most vulnerable to poverty, with 17 males (100.0%) and 34 females (100.0%) in their respective age groups living below the poverty level.
| Age Bracket | Male | Female |
| Under 5 Years | 17 (100.0%) | 0 (0.0%) |
| 5 Years | 9 (100.0%) | 0 (0.0%) |
| 6 to 11 Years | 0 (0.0%) | 0 (0.0%) |
| 12 to 14 Years | 0 (0.0%) | 0 (0.0%) |
| 15 Years | 0 (0.0%) | 0 (0.0%) |
| 16 and 17 Years | 0 (0.0%) | 0 (0.0%) |
| 18 to 24 Years | 0 (0.0%) | 34 (100.0%) |
| 25 to 34 Years | 0 (0.0%) | 10 (100.0%) |
| 35 to 44 Years | 0 (0.0%) | 0 (0.0%) |
| 45 to 54 Years | 0 (0.0%) | 0 (0.0%) |
| 55 to 64 Years | 0 (0.0%) | 0 (0.0%) |
| 65 to 74 Years | 0 (0.0%) | 0 (0.0%) |
| 75 Years and over | 0 (0.0%) | 0 (0.0%) |
| Total | 26 (13.9%) | 44 (24.0%) |
Income Above Poverty by Sex and Age in Mineral Bluff
According to the poverty statistics in Mineral Bluff, males aged 18 to 24 years and females aged 5 years are the age groups that are most secure financially, with 100.0% of males and 100.0% of females in these age groups living above the poverty line.
| Age Bracket | Male | Female |
| Under 5 Years | 0 (0.0%) | 0 (0.0%) |
| 5 Years | 0 (0.0%) | 46 (100.0%) |
| 6 to 11 Years | 0 (0.0%) | 0 (0.0%) |
| 12 to 14 Years | 0 (0.0%) | 0 (0.0%) |
| 15 Years | 0 (0.0%) | 0 (0.0%) |
| 16 and 17 Years | 0 (0.0%) | 0 (0.0%) |
| 18 to 24 Years | 87 (100.0%) | 0 (0.0%) |
| 25 to 34 Years | 0 (0.0%) | 0 (0.0%) |
| 35 to 44 Years | 44 (100.0%) | 42 (100.0%) |
| 45 to 54 Years | 12 (100.0%) | 0 (0.0%) |
| 55 to 64 Years | 10 (100.0%) | 9 (100.0%) |
| 65 to 74 Years | 8 (100.0%) | 27 (100.0%) |
| 75 Years and over | 0 (0.0%) | 15 (100.0%) |
| Total | 161 (86.1%) | 139 (76.0%) |
Income Below Poverty Among Married-Couple Families in Mineral Bluff
| Children | Above Poverty | Below Poverty |
| No Children | 19 (100.0%) | 0 (0.0%) |
| 1 or 2 Children | 44 (100.0%) | 0 (0.0%) |
| 3 or 4 Children | 0 (0.0%) | 0 (0.0%) |
| 5 or more Children | 0 (0.0%) | 0 (0.0%) |
| Total | 63 (100.0%) | 0 (0.0%) |
Income Below Poverty Among Single-Parent Households in Mineral Bluff
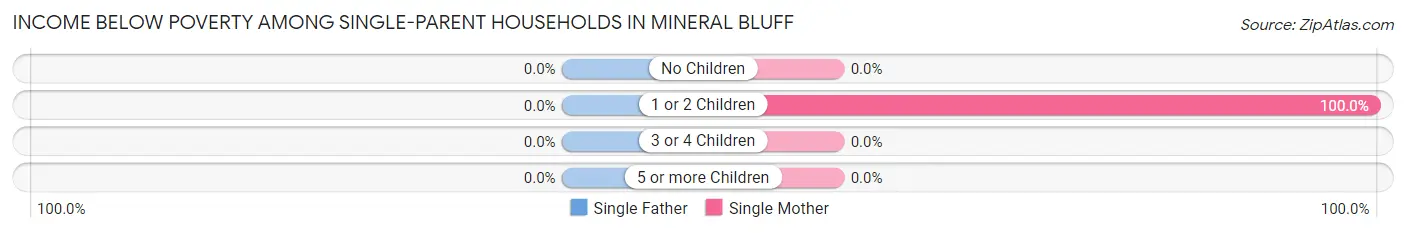
| Children | Single Father | Single Mother |
| No Children | 0 (0.0%) | 0 (0.0%) |
| 1 or 2 Children | 0 (0.0%) | 10 (100.0%) |
| 3 or 4 Children | 0 (0.0%) | 0 (0.0%) |
| 5 or more Children | 0 (0.0%) | 0 (0.0%) |
| Total | 0 (0.0%) | 10 (23.3%) |
Income Below Poverty Among Married-Couple vs Single-Parent Households in Mineral Bluff
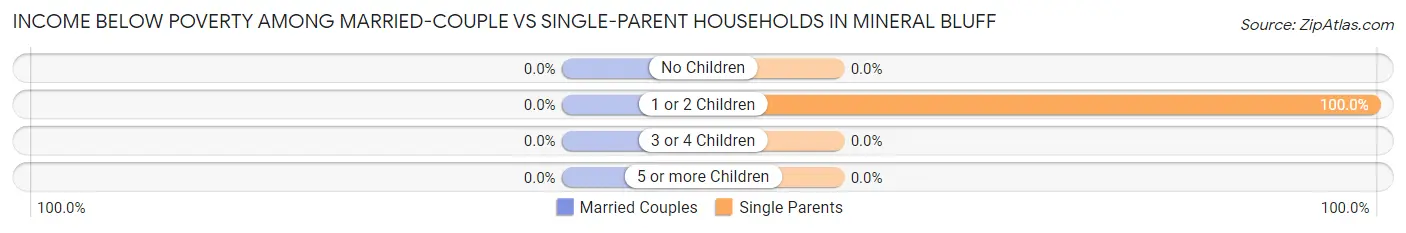
| Children | Married-Couple Families | Single-Parent Households |
| No Children | 0 (0.0%) | 0 (0.0%) |
| 1 or 2 Children | 0 (0.0%) | 10 (100.0%) |
| 3 or 4 Children | 0 (0.0%) | 0 (0.0%) |
| 5 or more Children | 0 (0.0%) | 0 (0.0%) |
| Total | 0 (0.0%) | 10 (23.3%) |
Race in Mineral Bluff
The most populous races in Mineral Bluff are White / Caucasian (354 | 95.7%), and Two or more Races (16 | 4.3%).
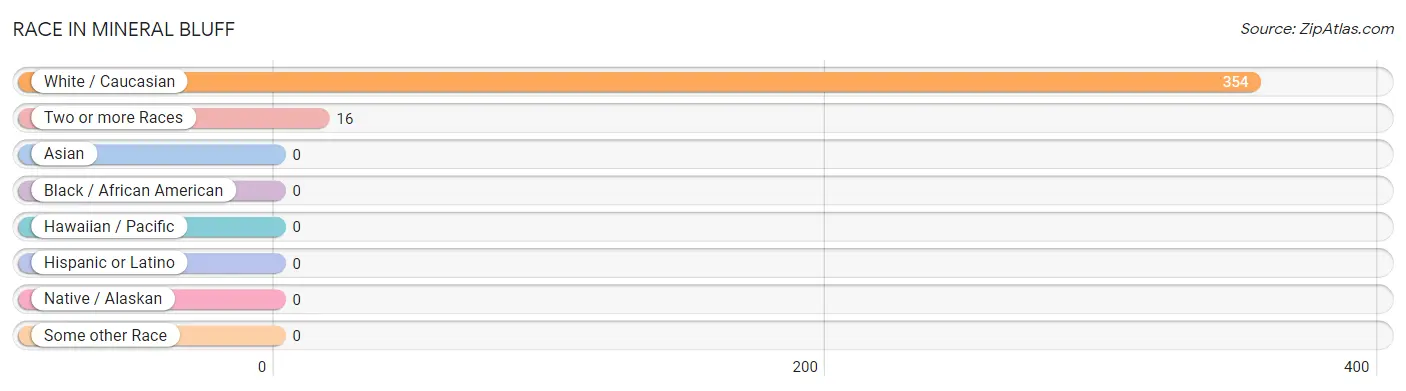
| Race | # Population | % Population |
| Asian | 0 | 0.0% |
| Black / African American | 0 | 0.0% |
| Hawaiian / Pacific | 0 | 0.0% |
| Hispanic or Latino | 0 | 0.0% |
| Native / Alaskan | 0 | 0.0% |
| White / Caucasian | 354 | 95.7% |
| Two or more Races | 16 | 4.3% |
| Some other Race | 0 | 0.0% |
| Total | 370 | 100.0% |
Ancestry in Mineral Bluff
The most populous ancestries reported in Mineral Bluff are Italian (36 | 9.7%), English (17 | 4.6%), and Cherokee (16 | 4.3%), together accounting for 18.6% of all Mineral Bluff residents.
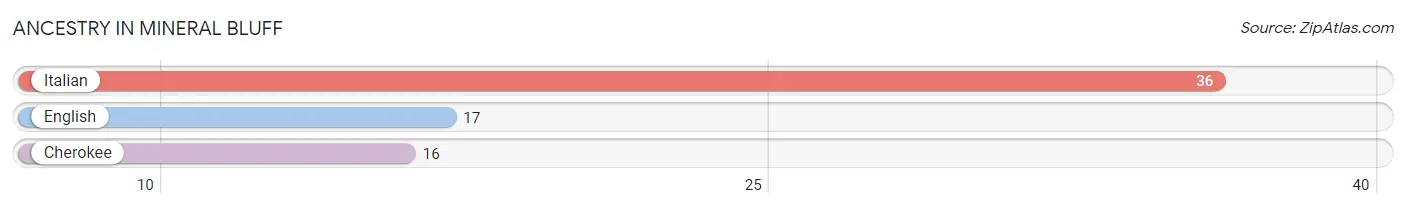
| Ancestry | # Population | % Population |
| Cherokee | 16 | 4.3% |
| English | 17 | 4.6% |
| Italian | 36 | 9.7% | View All 3 Rows |
Immigrants in Mineral Bluff
The most numerous immigrant groups reported in Mineral Bluff came from Eastern Europe (33 | 8.9%), Europe (33 | 8.9%), and Russia (33 | 8.9%), together accounting for 26.8% of all Mineral Bluff residents.
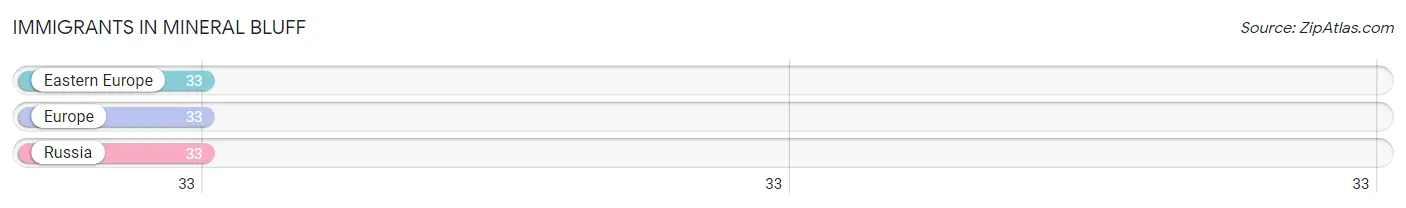
| Immigration Origin | # Population | % Population |
| Eastern Europe | 33 | 8.9% |
| Europe | 33 | 8.9% |
| Russia | 33 | 8.9% | View All 3 Rows |
Sex and Age in Mineral Bluff
Sex and Age in Mineral Bluff
The most populous age groups in Mineral Bluff are 20 to 24 Years (87 | 46.5%) for men and 5 to 9 Years (46 | 25.1%) for women.
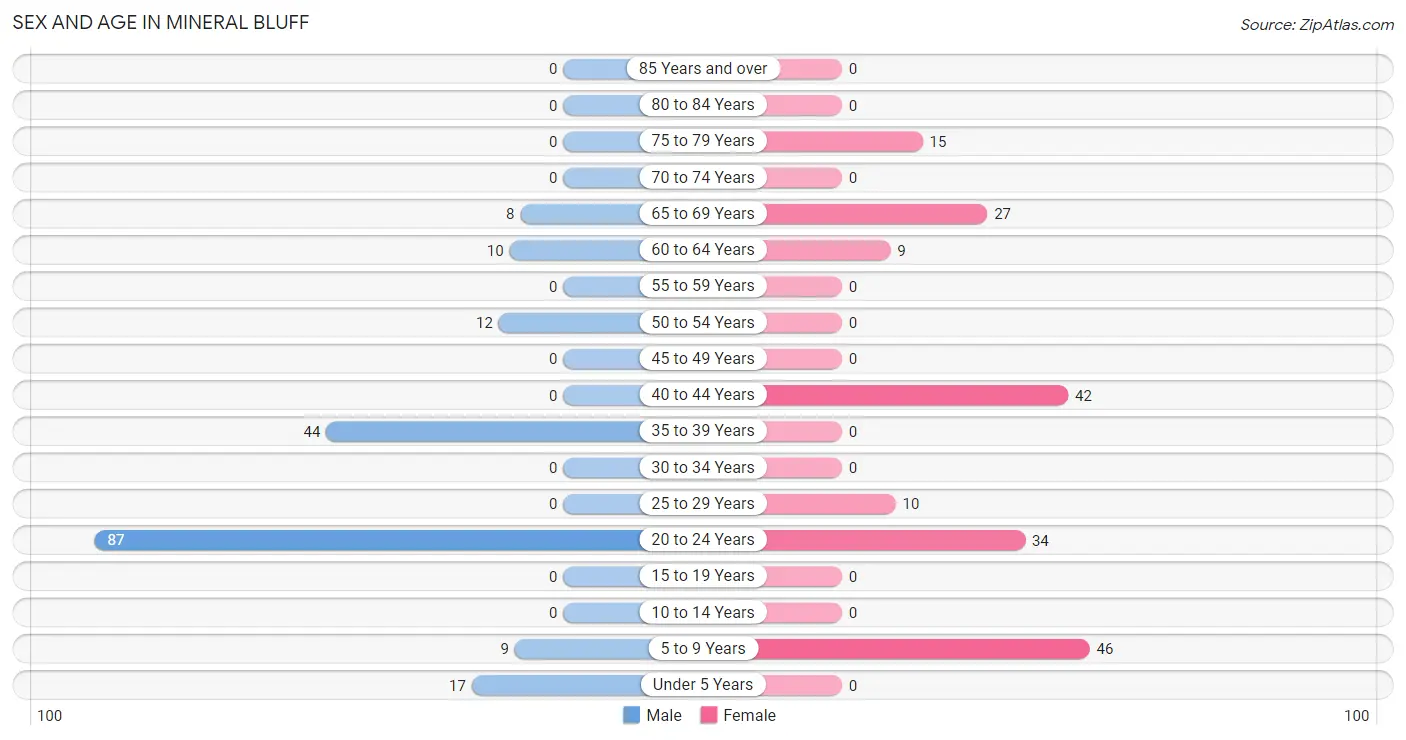
| Age Bracket | Male | Female |
| Under 5 Years | 17 (9.1%) | 0 (0.0%) |
| 5 to 9 Years | 9 (4.8%) | 46 (25.1%) |
| 10 to 14 Years | 0 (0.0%) | 0 (0.0%) |
| 15 to 19 Years | 0 (0.0%) | 0 (0.0%) |
| 20 to 24 Years | 87 (46.5%) | 34 (18.6%) |
| 25 to 29 Years | 0 (0.0%) | 10 (5.5%) |
| 30 to 34 Years | 0 (0.0%) | 0 (0.0%) |
| 35 to 39 Years | 44 (23.5%) | 0 (0.0%) |
| 40 to 44 Years | 0 (0.0%) | 42 (23.0%) |
| 45 to 49 Years | 0 (0.0%) | 0 (0.0%) |
| 50 to 54 Years | 12 (6.4%) | 0 (0.0%) |
| 55 to 59 Years | 0 (0.0%) | 0 (0.0%) |
| 60 to 64 Years | 10 (5.3%) | 9 (4.9%) |
| 65 to 69 Years | 8 (4.3%) | 27 (14.7%) |
| 70 to 74 Years | 0 (0.0%) | 0 (0.0%) |
| 75 to 79 Years | 0 (0.0%) | 15 (8.2%) |
| 80 to 84 Years | 0 (0.0%) | 0 (0.0%) |
| 85 Years and over | 0 (0.0%) | 0 (0.0%) |
| Total | 187 (100.0%) | 183 (100.0%) |
Families and Households in Mineral Bluff
Median Family Size in Mineral Bluff
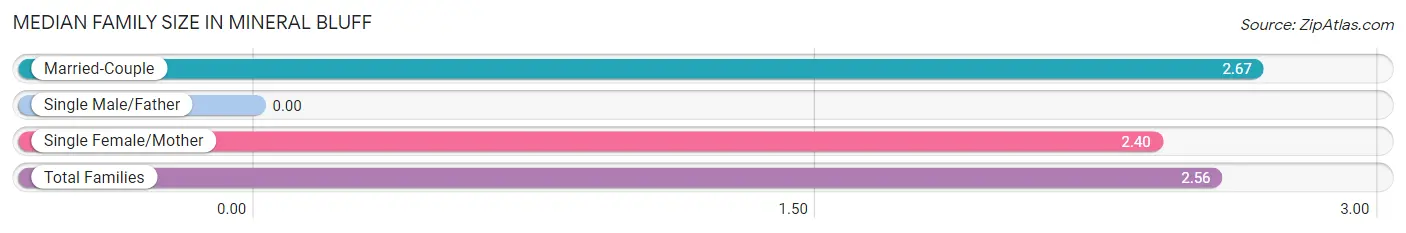
| Family Type | # Families | Family Size |
| Married-Couple | 63 (59.4%) | 2.67 |
| Single Male/Father | 0 (0.0%) | - |
| Single Female/Mother | 43 (40.6%) | 2.40 |
| Total Families | 106 (100.0%) | 2.56 |
Median Household Size in Mineral Bluff
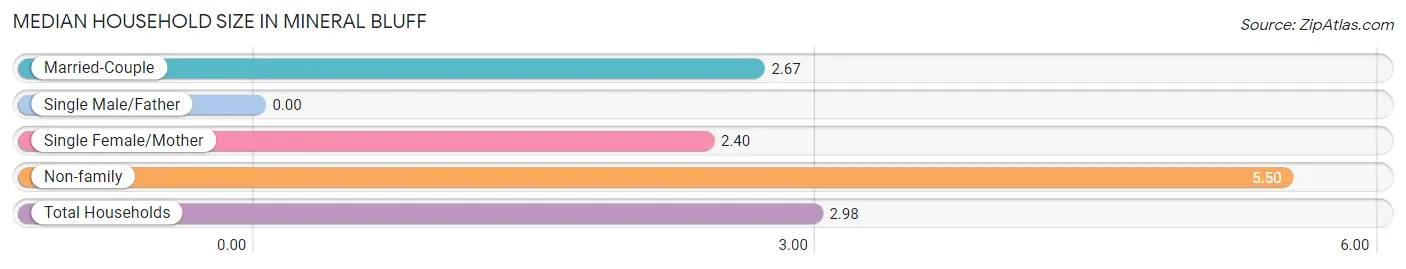
| Household Type | # Households | Household Size |
| Married-Couple | 63 (50.8%) | 2.67 |
| Single Male/Father | 0 (0.0%) | - |
| Single Female/Mother | 43 (34.7%) | 2.40 |
| Non-family | 18 (14.5%) | 5.50 |
| Total Households | 124 (100.0%) | 2.98 |
Household Size by Marriage Status in Mineral Bluff
Out of a total of 124 households in Mineral Bluff, 106 (85.5%) are family households, while 18 (14.5%) are nonfamily households. The most numerous type of family households are 3-person households, comprising 54, and the most common type of nonfamily households are 4-person households, comprising 18.
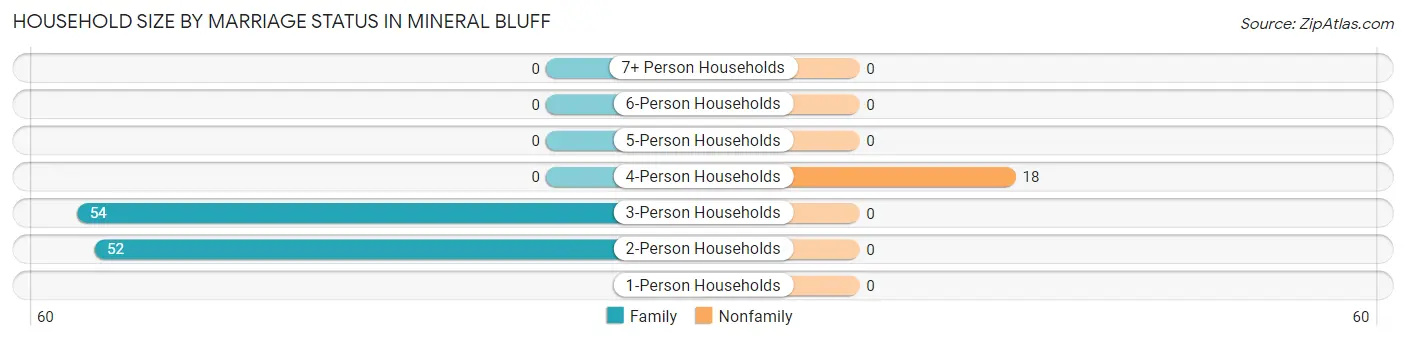
| Household Size | Family Households | Nonfamily Households |
| 1-Person Households | - | 0 (0.0%) |
| 2-Person Households | 52 (41.9%) | 0 (0.0%) |
| 3-Person Households | 54 (43.5%) | 0 (0.0%) |
| 4-Person Households | 0 (0.0%) | 18 (14.5%) |
| 5-Person Households | 0 (0.0%) | 0 (0.0%) |
| 6-Person Households | 0 (0.0%) | 0 (0.0%) |
| 7+ Person Households | 0 (0.0%) | 0 (0.0%) |
| Total | 106 (85.5%) | 18 (14.5%) |
Female Fertility in Mineral Bluff
Fertility by Age in Mineral Bluff
Average fertility rate in Mineral Bluff is 116.0 births per 1,000 women. Women in the age bracket of 20 to 34 years have the highest fertility rate with 227.0 births per 1,000 women. Women in the age bracket of 20 to 34 years acount for 100.0% of all women with births.
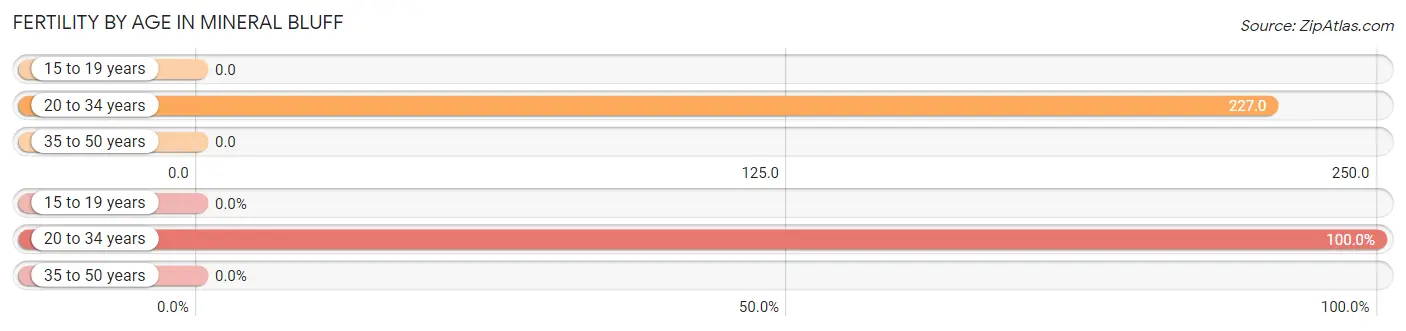
| Age Bracket | Women with Births | Births / 1,000 Women |
| 15 to 19 years | 0 (0.0%) | 0.0 |
| 20 to 34 years | 10 (100.0%) | 227.0 |
| 35 to 50 years | 0 (0.0%) | 0.0 |
| Total | 10 (100.0%) | 116.0 |
Fertility by Age by Marriage Status in Mineral Bluff
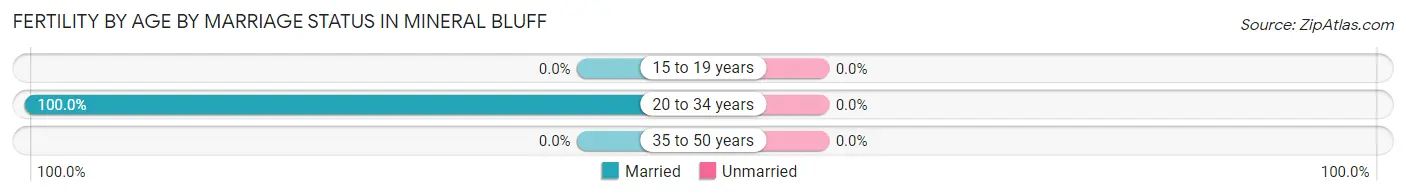
| Age Bracket | Married | Unmarried |
| 15 to 19 years | 0 (0.0%) | 0 (0.0%) |
| 20 to 34 years | 10 (100.0%) | 0 (0.0%) |
| 35 to 50 years | 0 (0.0%) | 0 (0.0%) |
| Total | 10 (100.0%) | 0 (0.0%) |
Fertility by Education in Mineral Bluff
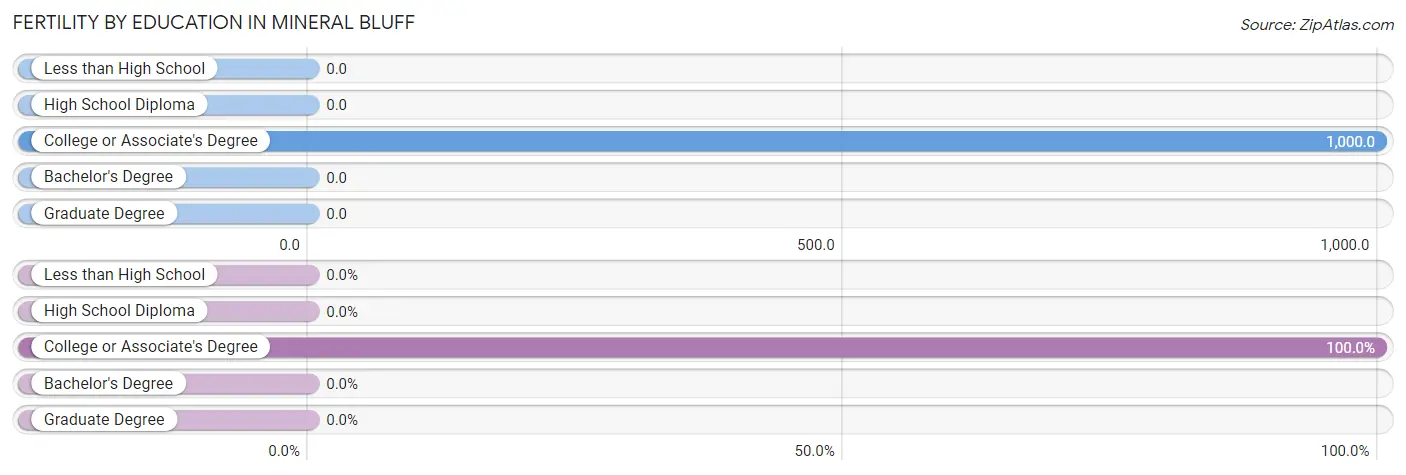
| Educational Attainment | Women with Births | Births / 1,000 Women |
| Less than High School | 0 (0.0%) | 0.0 |
| High School Diploma | 0 (0.0%) | 0.0 |
| College or Associate's Degree | 10 (100.0%) | 1,000.0 |
| Bachelor's Degree | 0 (0.0%) | 0.0 |
| Graduate Degree | 0 (0.0%) | 0.0 |
| Total | 10 (100.0%) | 116.0 |
Fertility by Education by Marriage Status in Mineral Bluff
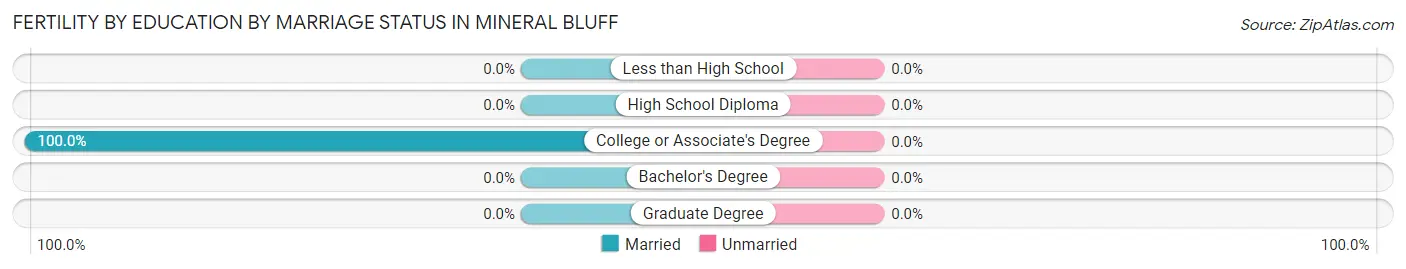
| Educational Attainment | Married | Unmarried |
| Less than High School | 0 (0.0%) | 0 (0.0%) |
| High School Diploma | 0 (0.0%) | 0 (0.0%) |
| College or Associate's Degree | 10 (100.0%) | 0 (0.0%) |
| Bachelor's Degree | 0 (0.0%) | 0 (0.0%) |
| Graduate Degree | 0 (0.0%) | 0 (0.0%) |
| Total | 10 (100.0%) | 0 (0.0%) |
Employment Characteristics in Mineral Bluff
Employment by Class of Employer in Mineral Bluff
Among the 226 employed individuals in Mineral Bluff, private company employees (191 | 84.5%), and not-for-profit organizations (35 | 15.5%) make up the most common classes of employment.
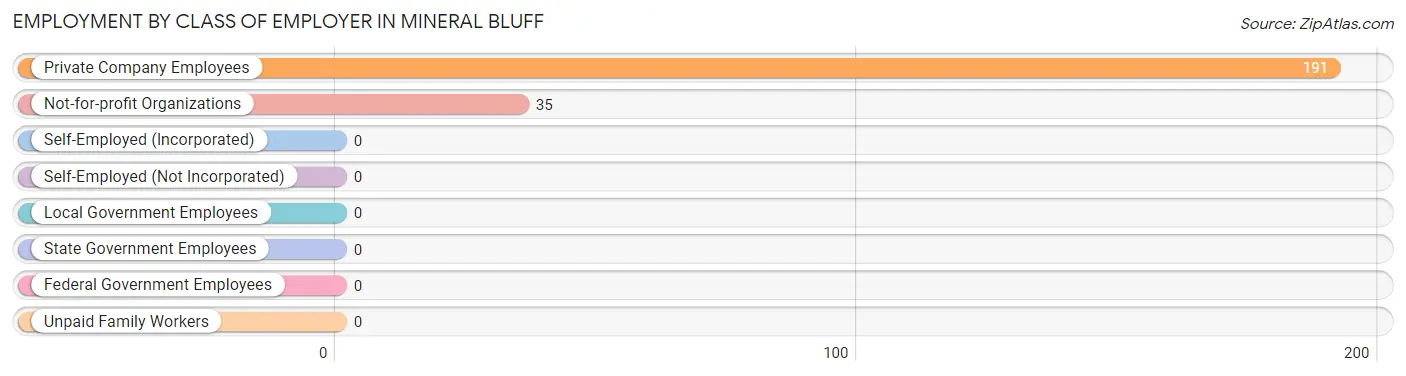
| Employer Class | # Employees | % Employees |
| Private Company Employees | 191 | 84.5% |
| Self-Employed (Incorporated) | 0 | 0.0% |
| Self-Employed (Not Incorporated) | 0 | 0.0% |
| Not-for-profit Organizations | 35 | 15.5% |
| Local Government Employees | 0 | 0.0% |
| State Government Employees | 0 | 0.0% |
| Federal Government Employees | 0 | 0.0% |
| Unpaid Family Workers | 0 | 0.0% |
| Total | 226 | 100.0% |
Employment Status by Age in Mineral Bluff
According to the labor force statistics for Mineral Bluff, out of the total population over 16 years of age (298), 81.2% or 242 individuals are in the labor force, with 6.6% or 16 of them unemployed. The age group with the highest labor force participation rate is 20 to 24 years, with 100.0% or 121 individuals in the labor force. Within the labor force, the 20 to 24 years age range has the highest percentage of unemployed individuals, with 13.2% or 16 of them being unemployed.
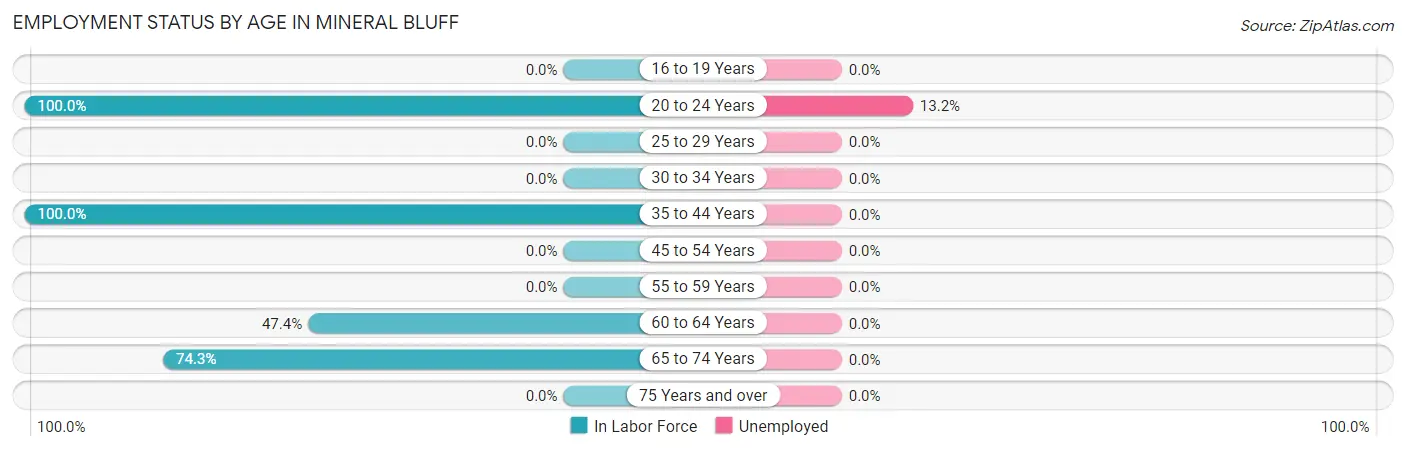
| Age Bracket | In Labor Force | Unemployed |
| 16 to 19 Years | 0 (0.0%) | 0 (0.0%) |
| 20 to 24 Years | 121 (100.0%) | 16 (13.2%) |
| 25 to 29 Years | 0 (0.0%) | 0 (0.0%) |
| 30 to 34 Years | 0 (0.0%) | 0 (0.0%) |
| 35 to 44 Years | 86 (100.0%) | 0 (0.0%) |
| 45 to 54 Years | 0 (0.0%) | 0 (0.0%) |
| 55 to 59 Years | 0 (0.0%) | 0 (0.0%) |
| 60 to 64 Years | 9 (47.4%) | 0 (0.0%) |
| 65 to 74 Years | 26 (74.3%) | 0 (0.0%) |
| 75 Years and over | 0 (0.0%) | 0 (0.0%) |
| Total | 242 (81.2%) | 16 (6.6%) |
Employment Status by Educational Attainment in Mineral Bluff
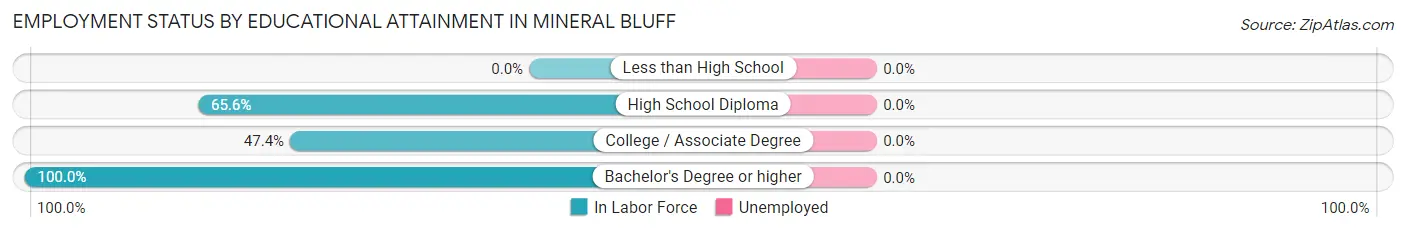
| Educational Attainment | In Labor Force | Unemployed |
| Less than High School | 0 (0.0%) | 0 (0.0%) |
| High School Diploma | 42 (65.6%) | 0 (0.0%) |
| College / Associate Degree | 9 (47.4%) | 0 (0.0%) |
| Bachelor's Degree or higher | 44 (100.0%) | 0 (0.0%) |
| Total | 95 (74.8%) | 0 (0.0%) |
Employment Occupations by Sex in Mineral Bluff
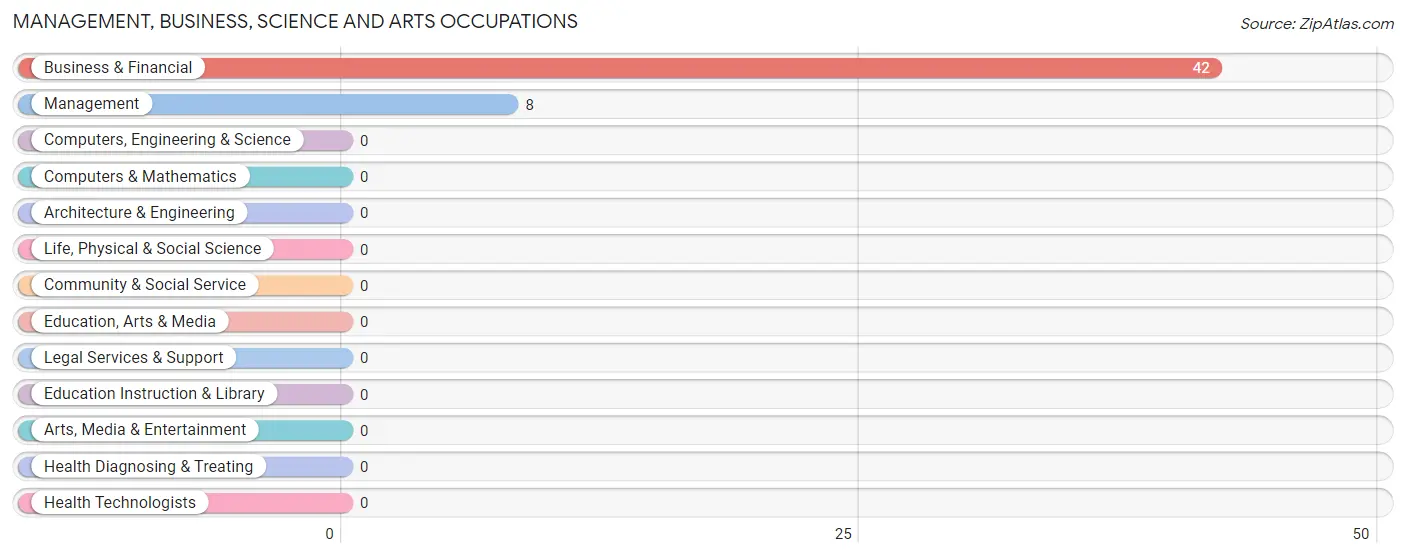
Management, Business, Science and Arts Occupations
The most common Management, Business, Science and Arts occupations in Mineral Bluff are Business & Financial (42 | 18.6%), and Management (8 | 3.5%).
Management, Business, Science and Arts Occupations by Sex
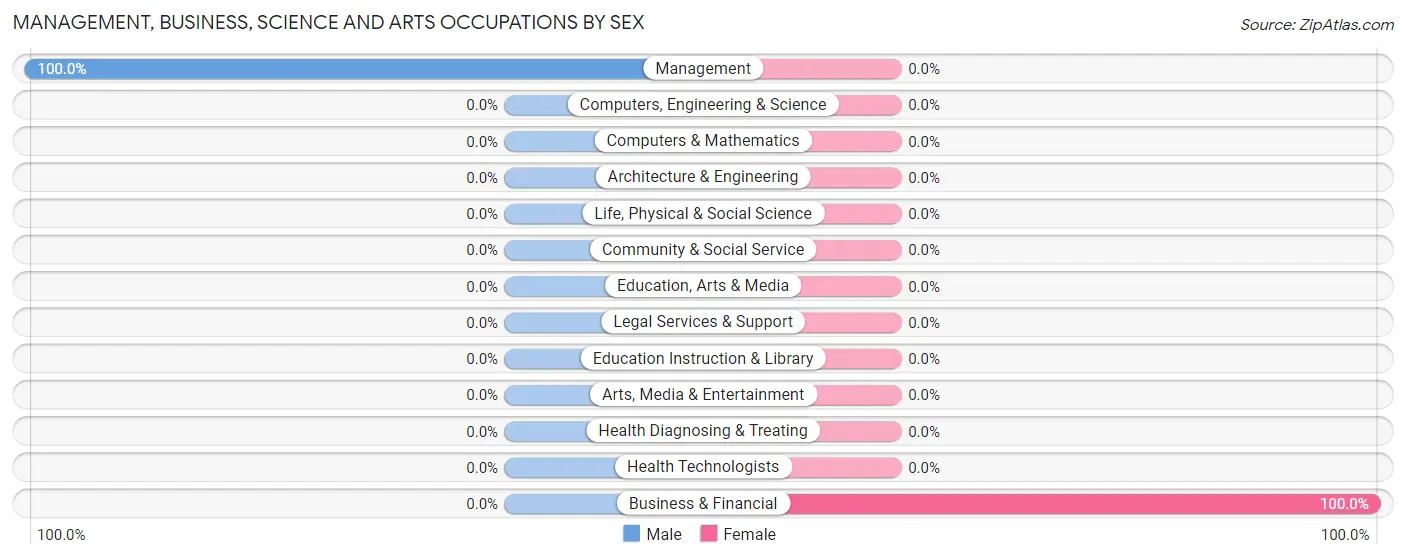
| Occupation | Male | Female |
| Management | 8 (100.0%) | 0 (0.0%) |
| Business & Financial | 0 (0.0%) | 42 (100.0%) |
| Computers, Engineering & Science | 0 (0.0%) | 0 (0.0%) |
| Computers & Mathematics | 0 (0.0%) | 0 (0.0%) |
| Architecture & Engineering | 0 (0.0%) | 0 (0.0%) |
| Life, Physical & Social Science | 0 (0.0%) | 0 (0.0%) |
| Community & Social Service | 0 (0.0%) | 0 (0.0%) |
| Education, Arts & Media | 0 (0.0%) | 0 (0.0%) |
| Legal Services & Support | 0 (0.0%) | 0 (0.0%) |
| Education Instruction & Library | 0 (0.0%) | 0 (0.0%) |
| Arts, Media & Entertainment | 0 (0.0%) | 0 (0.0%) |
| Health Diagnosing & Treating | 0 (0.0%) | 0 (0.0%) |
| Health Technologists | 0 (0.0%) | 0 (0.0%) |
| Total (Category) | 8 (16.0%) | 42 (84.0%) |
| Total (Overall) | 139 (61.5%) | 87 (38.5%) |
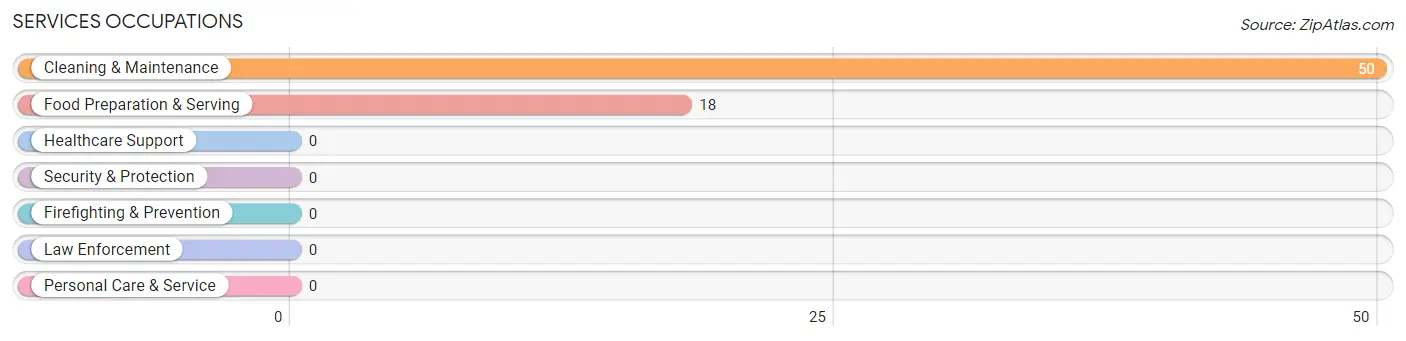
Services Occupations
The most common Services occupations in Mineral Bluff are Cleaning & Maintenance (50 | 22.1%), and Food Preparation & Serving (18 | 8.0%).
Services Occupations by Sex
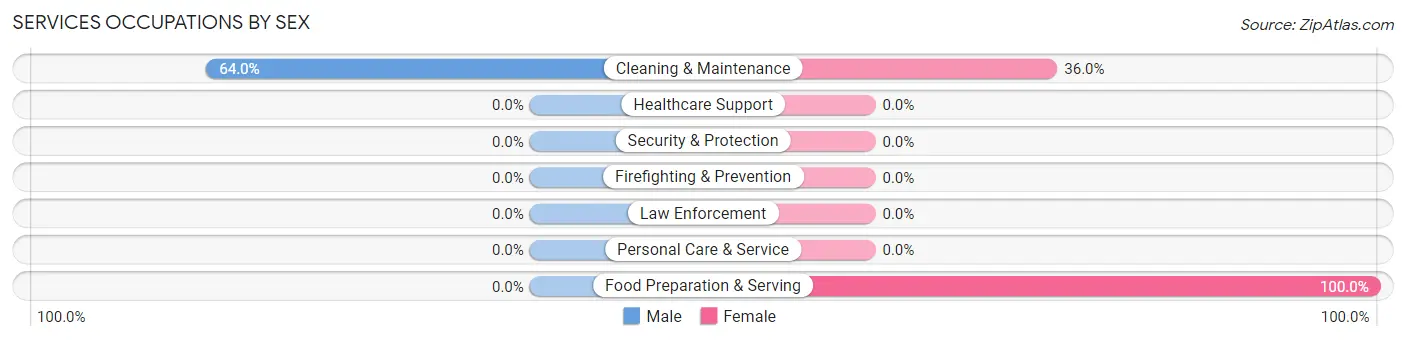
| Occupation | Male | Female |
| Healthcare Support | 0 (0.0%) | 0 (0.0%) |
| Security & Protection | 0 (0.0%) | 0 (0.0%) |
| Firefighting & Prevention | 0 (0.0%) | 0 (0.0%) |
| Law Enforcement | 0 (0.0%) | 0 (0.0%) |
| Food Preparation & Serving | 0 (0.0%) | 18 (100.0%) |
| Cleaning & Maintenance | 32 (64.0%) | 18 (36.0%) |
| Personal Care & Service | 0 (0.0%) | 0 (0.0%) |
| Total (Category) | 32 (47.1%) | 36 (52.9%) |
| Total (Overall) | 139 (61.5%) | 87 (38.5%) |
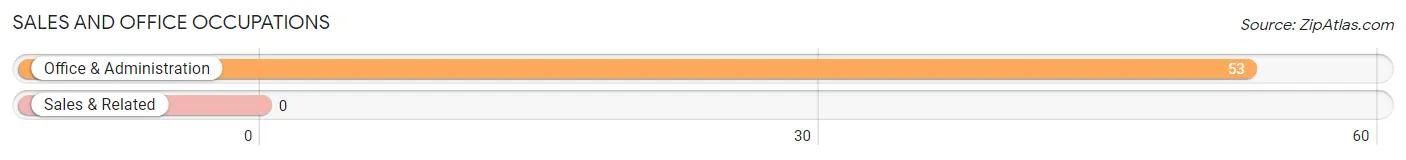
Sales and Office Occupations
The most common Sales and Office occupations in Mineral Bluff are , and Office & Administration (53 | 23.4%).
Sales and Office Occupations by Sex
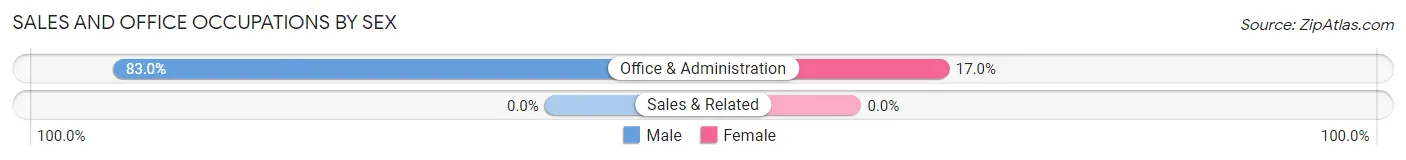
| Occupation | Male | Female |
| Sales & Related | 0 (0.0%) | 0 (0.0%) |
| Office & Administration | 44 (83.0%) | 9 (17.0%) |
| Total (Category) | 44 (83.0%) | 9 (17.0%) |
| Total (Overall) | 139 (61.5%) | 87 (38.5%) |
Natural Resources, Construction and Maintenance Occupations
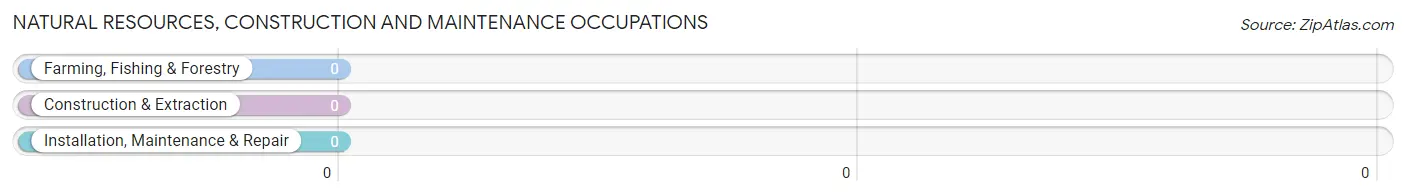
Natural Resources, Construction and Maintenance Occupations by Sex
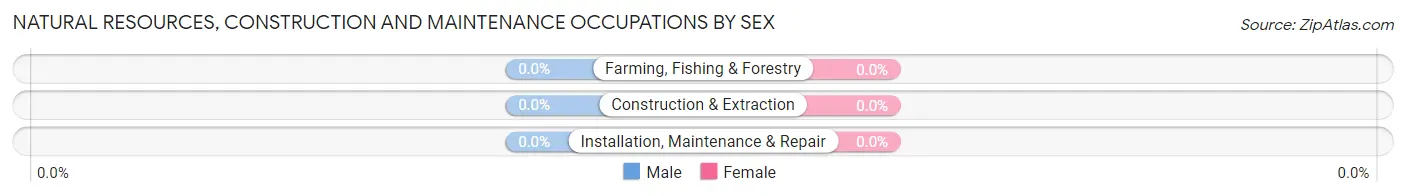
| Occupation | Male | Female |
| Farming, Fishing & Forestry | 0 (0.0%) | 0 (0.0%) |
| Construction & Extraction | 0 (0.0%) | 0 (0.0%) |
| Installation, Maintenance & Repair | 0 (0.0%) | 0 (0.0%) |
| Total (Category) | 0 (0.0%) | 0 (0.0%) |
| Total (Overall) | 139 (61.5%) | 87 (38.5%) |
Production, Transportation and Moving Occupations
The most common Production, Transportation and Moving occupations in Mineral Bluff are , and Material Moving (55 | 24.3%).
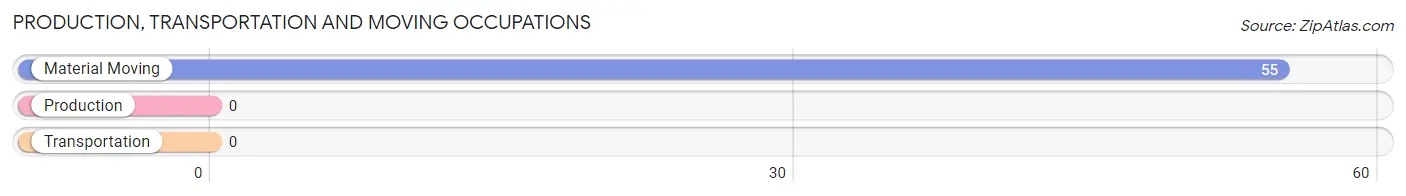
Production, Transportation and Moving Occupations by Sex
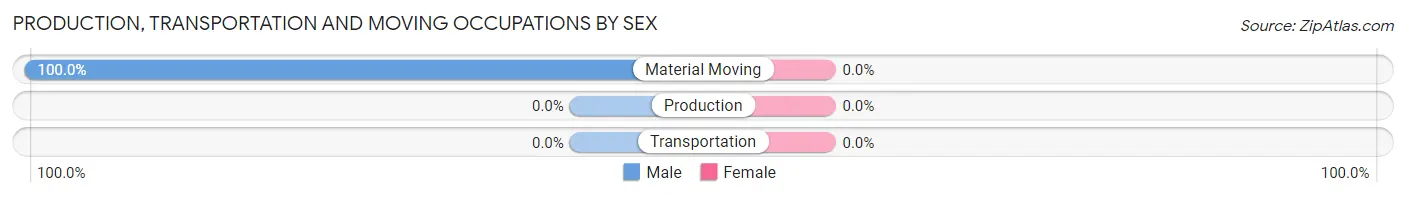
| Occupation | Male | Female |
| Production | 0 (0.0%) | 0 (0.0%) |
| Transportation | 0 (0.0%) | 0 (0.0%) |
| Material Moving | 55 (100.0%) | 0 (0.0%) |
| Total (Category) | 55 (100.0%) | 0 (0.0%) |
| Total (Overall) | 139 (61.5%) | 87 (38.5%) |
Employment Industries by Sex in Mineral Bluff
Employment Industries in Mineral Bluff
The major employment industries in Mineral Bluff include Manufacturing (44 | 19.5%), Finance & Insurance (42 | 18.6%), Agriculture, Fishing & Hunting (33 | 14.6%), Administrative & Support (32 | 14.2%), and Transportation & Warehousing (22 | 9.7%).
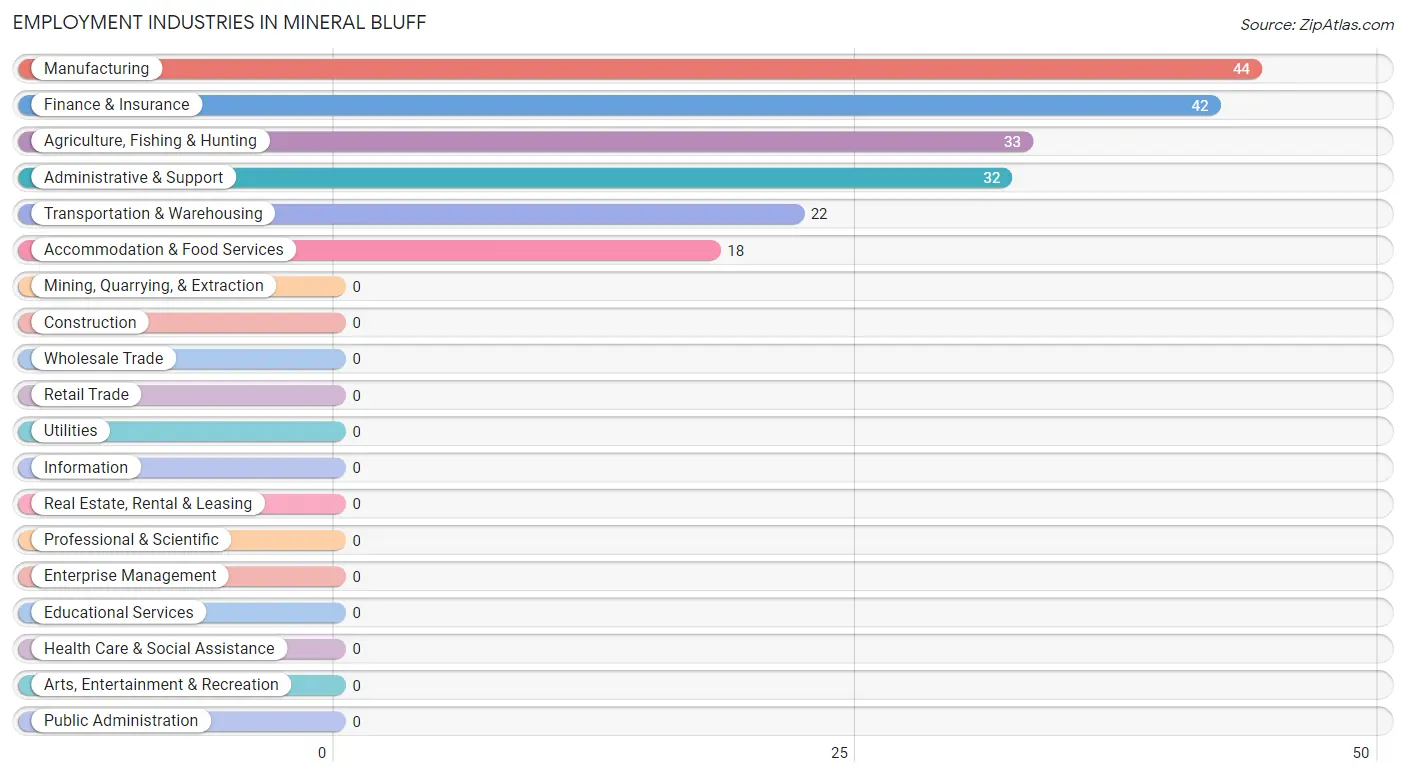
Employment Industries by Sex in Mineral Bluff
The Mineral Bluff industries that see more men than women are Agriculture, Fishing & Hunting (100.0%), Manufacturing (100.0%), and Transportation & Warehousing (100.0%), whereas the industries that tend to have a higher number of women are Finance & Insurance (100.0%), and Accommodation & Food Services (100.0%).
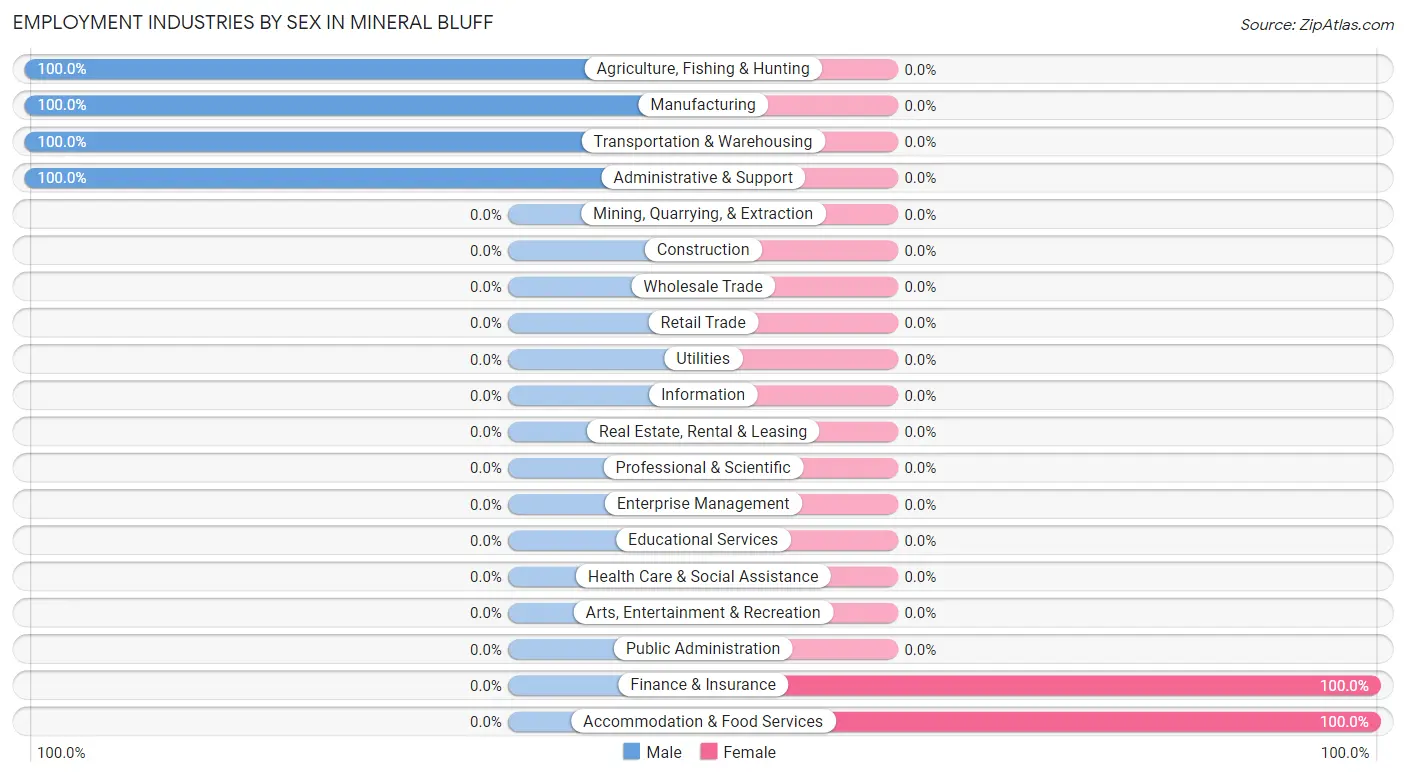
| Industry | Male | Female |
| Agriculture, Fishing & Hunting | 33 (100.0%) | 0 (0.0%) |
| Mining, Quarrying, & Extraction | 0 (0.0%) | 0 (0.0%) |
| Construction | 0 (0.0%) | 0 (0.0%) |
| Manufacturing | 44 (100.0%) | 0 (0.0%) |
| Wholesale Trade | 0 (0.0%) | 0 (0.0%) |
| Retail Trade | 0 (0.0%) | 0 (0.0%) |
| Transportation & Warehousing | 22 (100.0%) | 0 (0.0%) |
| Utilities | 0 (0.0%) | 0 (0.0%) |
| Information | 0 (0.0%) | 0 (0.0%) |
| Finance & Insurance | 0 (0.0%) | 42 (100.0%) |
| Real Estate, Rental & Leasing | 0 (0.0%) | 0 (0.0%) |
| Professional & Scientific | 0 (0.0%) | 0 (0.0%) |
| Enterprise Management | 0 (0.0%) | 0 (0.0%) |
| Administrative & Support | 32 (100.0%) | 0 (0.0%) |
| Educational Services | 0 (0.0%) | 0 (0.0%) |
| Health Care & Social Assistance | 0 (0.0%) | 0 (0.0%) |
| Arts, Entertainment & Recreation | 0 (0.0%) | 0 (0.0%) |
| Accommodation & Food Services | 0 (0.0%) | 18 (100.0%) |
| Public Administration | 0 (0.0%) | 0 (0.0%) |
| Total | 139 (61.5%) | 87 (38.5%) |
Education in Mineral Bluff
School Enrollment in Mineral Bluff
The most common levels of schooling among the 55 students in Mineral Bluff are kindergarten (46 | 83.6%), and nursery / preschool (9 | 16.4%).
| School Level | # Students | % Students |
| Nursery / Preschool | 9 | 16.4% |
| Kindergarten | 46 | 83.6% |
| Elementary School | 0 | 0.0% |
| Middle School | 0 | 0.0% |
| High School | 0 | 0.0% |
| College / Undergraduate | 0 | 0.0% |
| Graduate / Professional | 0 | 0.0% |
| Total | 55 | 100.0% |
School Enrollment by Age by Funding Source in Mineral Bluff
| Age Bracket | Public School | Private School |
| 3 to 4 Year Olds | 0 (0.0%) | 0 (0.0%) |
| 5 to 9 Year Old | 55 (100.0%) | 0 (0.0%) |
| 10 to 14 Year Olds | 0 (0.0%) | 0 (0.0%) |
| 15 to 17 Year Olds | 0 (0.0%) | 0 (0.0%) |
| 18 to 19 Year Olds | 0 (0.0%) | 0 (0.0%) |
| 20 to 24 Year Olds | 0 (0.0%) | 0 (0.0%) |
| 25 to 34 Year Olds | 0 (0.0%) | 0 (0.0%) |
| 35 Years and over | 0 (0.0%) | 0 (0.0%) |
| Total | 55 (100.0%) | 0 (0.0%) |
Educational Attainment by Field of Study in Mineral Bluff
Science & technology (44 | 84.6%), and arts & humanities (8 | 15.4%) are the most common fields of study among 52 individuals in Mineral Bluff who have obtained a bachelor's degree or higher.
| Field of Study | # Graduates | % Graduates |
| Computers & Mathematics | 0 | 0.0% |
| Bio, Nature & Agricultural | 0 | 0.0% |
| Physical & Health Sciences | 0 | 0.0% |
| Psychology | 0 | 0.0% |
| Social Sciences | 0 | 0.0% |
| Engineering | 0 | 0.0% |
| Multidisciplinary Studies | 0 | 0.0% |
| Science & Technology | 44 | 84.6% |
| Business | 0 | 0.0% |
| Education | 0 | 0.0% |
| Literature & Languages | 0 | 0.0% |
| Liberal Arts & History | 0 | 0.0% |
| Visual & Performing Arts | 0 | 0.0% |
| Communications | 0 | 0.0% |
| Arts & Humanities | 8 | 15.4% |
| Total | 52 | 100.0% |
Transportation & Commute in Mineral Bluff
Vehicle Availability by Sex in Mineral Bluff
The most prevalent vehicle ownership categories in Mineral Bluff are males with 4 vehicles (73, accounting for 52.5%) and females with 4 vehicles (27, making up 83.9%).
| Vehicles Available | Male | Female |
| No Vehicle | 0 (0.0%) | 0 (0.0%) |
| 1 Vehicle | 0 (0.0%) | 0 (0.0%) |
| 2 Vehicles | 66 (47.5%) | 60 (69.0%) |
| 3 Vehicles | 0 (0.0%) | 0 (0.0%) |
| 4 Vehicles | 73 (52.5%) | 27 (31.0%) |
| 5 or more Vehicles | 0 (0.0%) | 0 (0.0%) |
| Total | 139 (100.0%) | 87 (100.0%) |
Commute Time in Mineral Bluff
The most frequently occuring commute durations in Mineral Bluff are 15 to 19 minutes (69 commuters, 33.0%), 5 to 9 minutes (44 commuters, 21.0%), and 10 to 14 minutes (42 commuters, 20.1%).
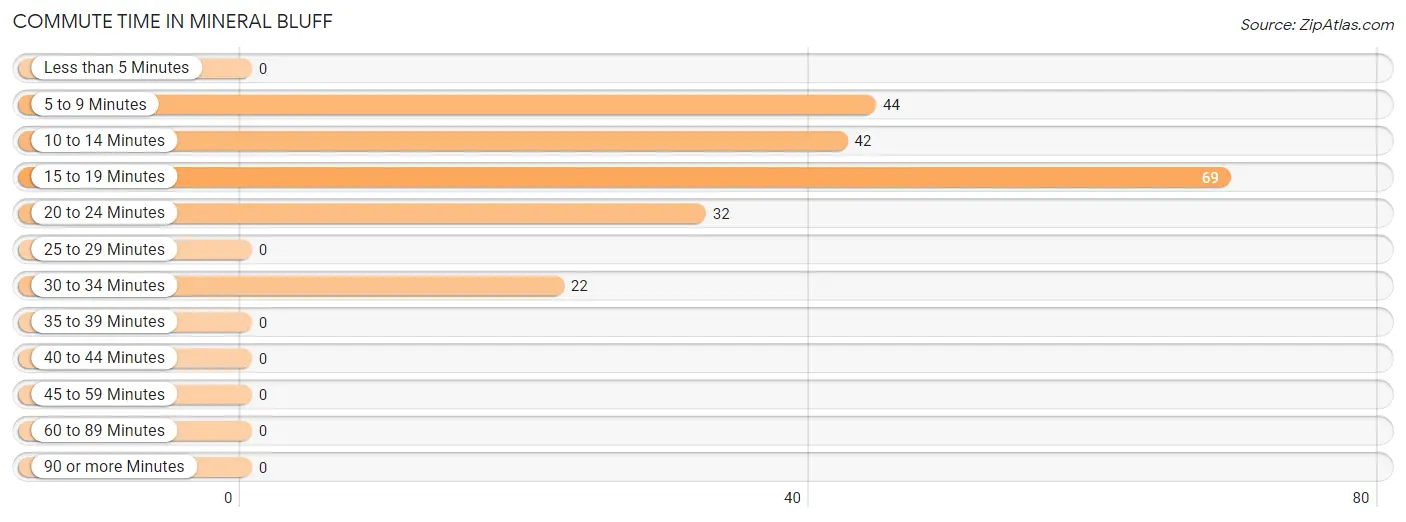
| Commute Time | # Commuters | % Commuters |
| Less than 5 Minutes | 0 | 0.0% |
| 5 to 9 Minutes | 44 | 21.0% |
| 10 to 14 Minutes | 42 | 20.1% |
| 15 to 19 Minutes | 69 | 33.0% |
| 20 to 24 Minutes | 32 | 15.3% |
| 25 to 29 Minutes | 0 | 0.0% |
| 30 to 34 Minutes | 22 | 10.5% |
| 35 to 39 Minutes | 0 | 0.0% |
| 40 to 44 Minutes | 0 | 0.0% |
| 45 to 59 Minutes | 0 | 0.0% |
| 60 to 89 Minutes | 0 | 0.0% |
| 90 or more Minutes | 0 | 0.0% |
Commute Time by Sex in Mineral Bluff
The most common commute times in Mineral Bluff are 5 to 9 minutes (44 commuters, 33.6%) for males and 10 to 14 minutes (42 commuters, 53.8%) for females.
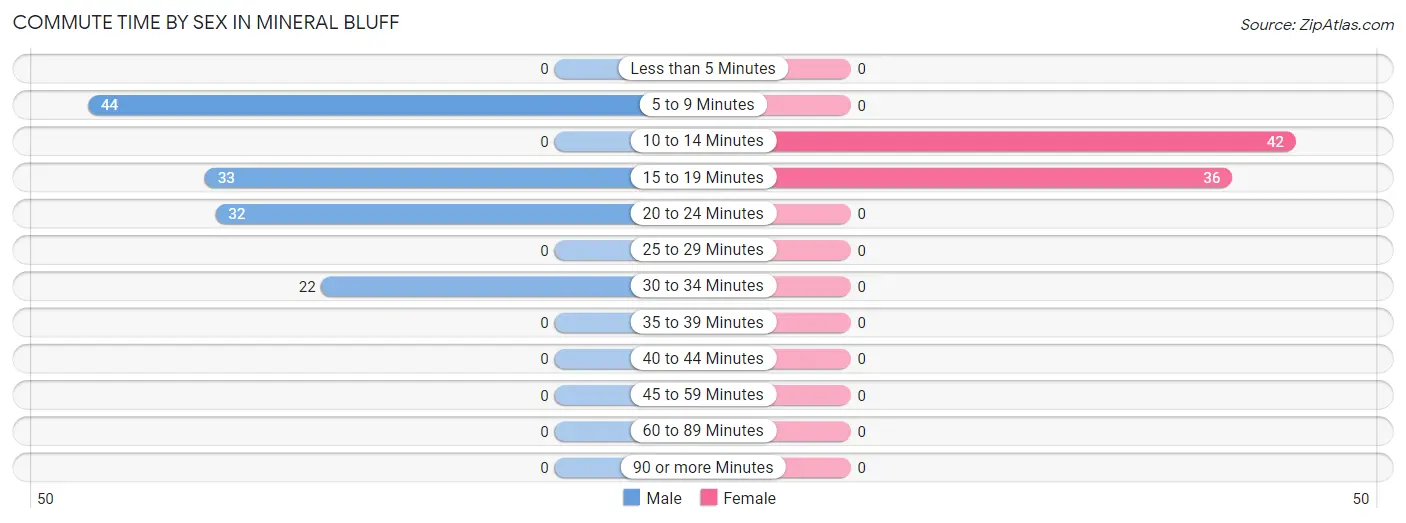
| Commute Time | Male | Female |
| Less than 5 Minutes | 0 (0.0%) | 0 (0.0%) |
| 5 to 9 Minutes | 44 (33.6%) | 0 (0.0%) |
| 10 to 14 Minutes | 0 (0.0%) | 42 (53.8%) |
| 15 to 19 Minutes | 33 (25.2%) | 36 (46.2%) |
| 20 to 24 Minutes | 32 (24.4%) | 0 (0.0%) |
| 25 to 29 Minutes | 0 (0.0%) | 0 (0.0%) |
| 30 to 34 Minutes | 22 (16.8%) | 0 (0.0%) |
| 35 to 39 Minutes | 0 (0.0%) | 0 (0.0%) |
| 40 to 44 Minutes | 0 (0.0%) | 0 (0.0%) |
| 45 to 59 Minutes | 0 (0.0%) | 0 (0.0%) |
| 60 to 89 Minutes | 0 (0.0%) | 0 (0.0%) |
| 90 or more Minutes | 0 (0.0%) | 0 (0.0%) |
Time of Departure to Work by Sex in Mineral Bluff
The most frequent times of departure to work in Mineral Bluff are 7:00 AM to 7:29 AM (65, 49.6%) for males and 7:00 AM to 7:29 AM (42, 53.8%) for females.
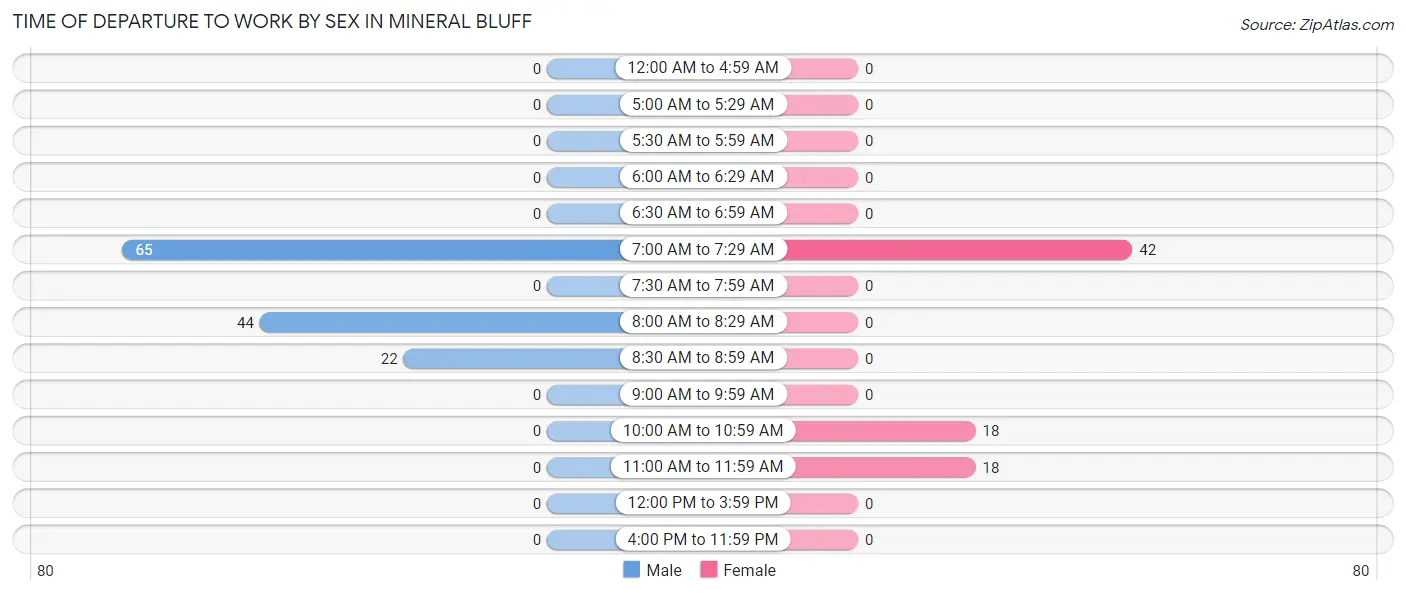
| Time of Departure | Male | Female |
| 12:00 AM to 4:59 AM | 0 (0.0%) | 0 (0.0%) |
| 5:00 AM to 5:29 AM | 0 (0.0%) | 0 (0.0%) |
| 5:30 AM to 5:59 AM | 0 (0.0%) | 0 (0.0%) |
| 6:00 AM to 6:29 AM | 0 (0.0%) | 0 (0.0%) |
| 6:30 AM to 6:59 AM | 0 (0.0%) | 0 (0.0%) |
| 7:00 AM to 7:29 AM | 65 (49.6%) | 42 (53.8%) |
| 7:30 AM to 7:59 AM | 0 (0.0%) | 0 (0.0%) |
| 8:00 AM to 8:29 AM | 44 (33.6%) | 0 (0.0%) |
| 8:30 AM to 8:59 AM | 22 (16.8%) | 0 (0.0%) |
| 9:00 AM to 9:59 AM | 0 (0.0%) | 0 (0.0%) |
| 10:00 AM to 10:59 AM | 0 (0.0%) | 18 (23.1%) |
| 11:00 AM to 11:59 AM | 0 (0.0%) | 18 (23.1%) |
| 12:00 PM to 3:59 PM | 0 (0.0%) | 0 (0.0%) |
| 4:00 PM to 11:59 PM | 0 (0.0%) | 0 (0.0%) |
| Total | 131 (100.0%) | 78 (100.0%) |
Housing Occupancy in Mineral Bluff
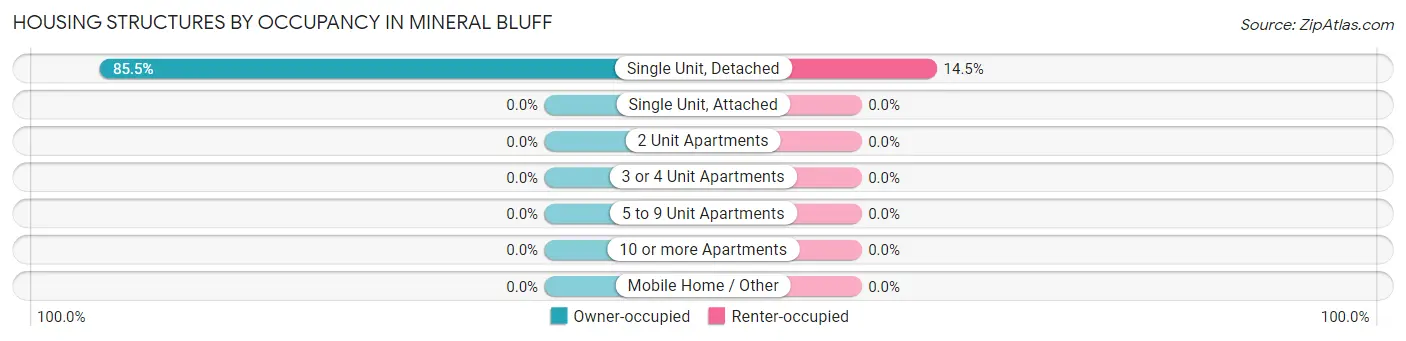
Occupancy by Ownership in Mineral Bluff
Of the total 124 dwellings in Mineral Bluff, owner-occupied units account for 106 (85.5%), while renter-occupied units make up 18 (14.5%).
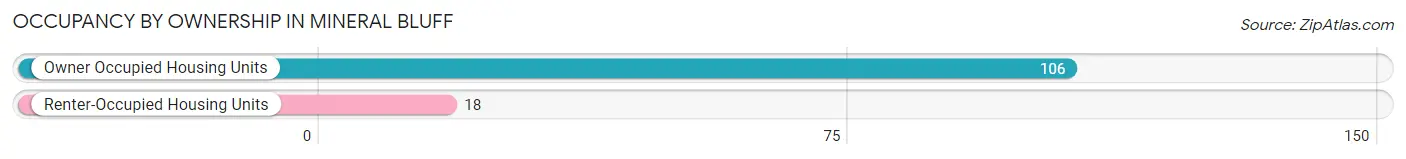
| Occupancy | # Housing Units | % Housing Units |
| Owner Occupied Housing Units | 106 | 85.5% |
| Renter-Occupied Housing Units | 18 | 14.5% |
| Total Occupied Housing Units | 124 | 100.0% |
Occupancy by Household Size in Mineral Bluff
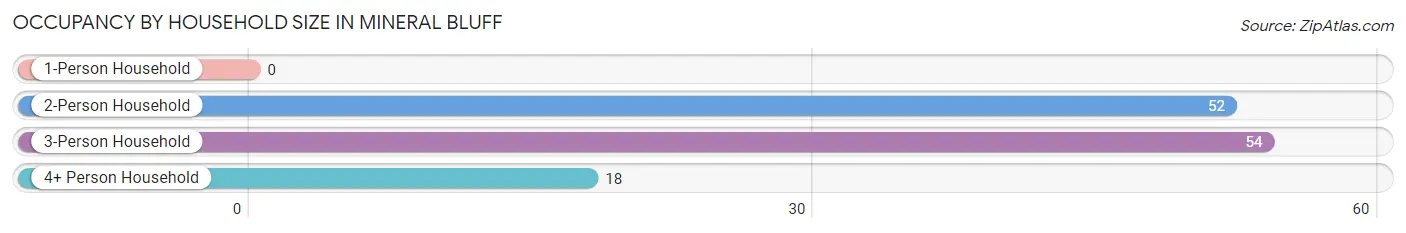
| Household Size | # Housing Units | % Housing Units |
| 1-Person Household | 0 | 0.0% |
| 2-Person Household | 52 | 41.9% |
| 3-Person Household | 54 | 43.5% |
| 4+ Person Household | 18 | 14.5% |
| Total Housing Units | 124 | 100.0% |
Occupancy by Ownership by Household Size in Mineral Bluff
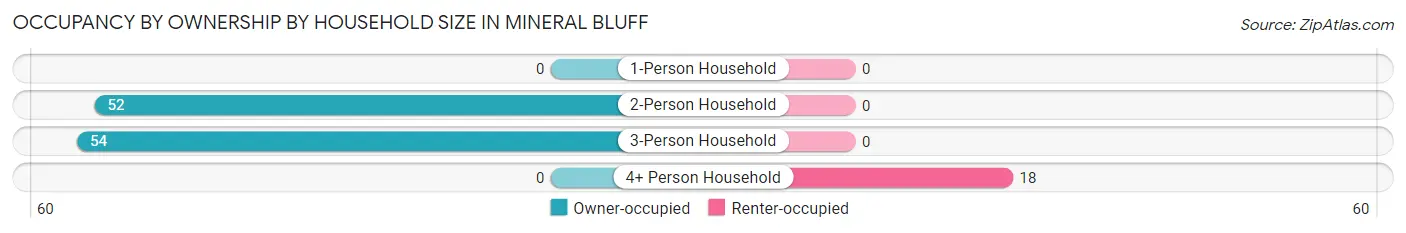
| Household Size | Owner-occupied | Renter-occupied |
| 1-Person Household | 0 (0.0%) | 0 (0.0%) |
| 2-Person Household | 52 (100.0%) | 0 (0.0%) |
| 3-Person Household | 54 (100.0%) | 0 (0.0%) |
| 4+ Person Household | 0 (0.0%) | 18 (100.0%) |
| Total Housing Units | 106 (85.5%) | 18 (14.5%) |
Occupancy by Educational Attainment in Mineral Bluff
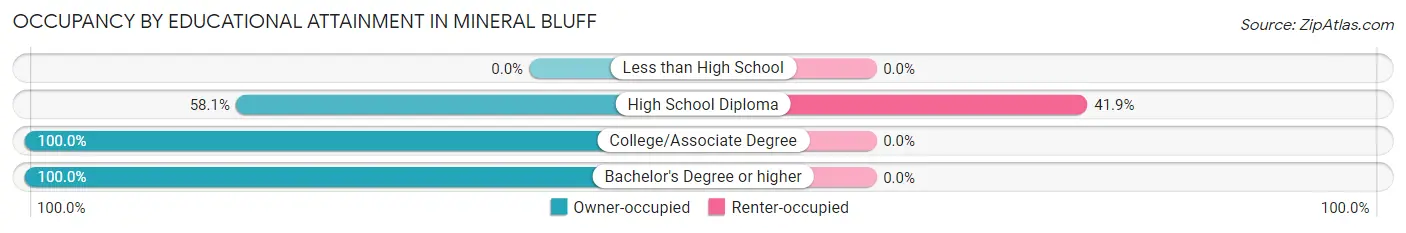
| Household Size | Owner-occupied | Renter-occupied |
| Less than High School | 0 (0.0%) | 0 (0.0%) |
| High School Diploma | 25 (58.1%) | 18 (41.9%) |
| College/Associate Degree | 37 (100.0%) | 0 (0.0%) |
| Bachelor's Degree or higher | 44 (100.0%) | 0 (0.0%) |
Occupancy by Age of Householder in Mineral Bluff
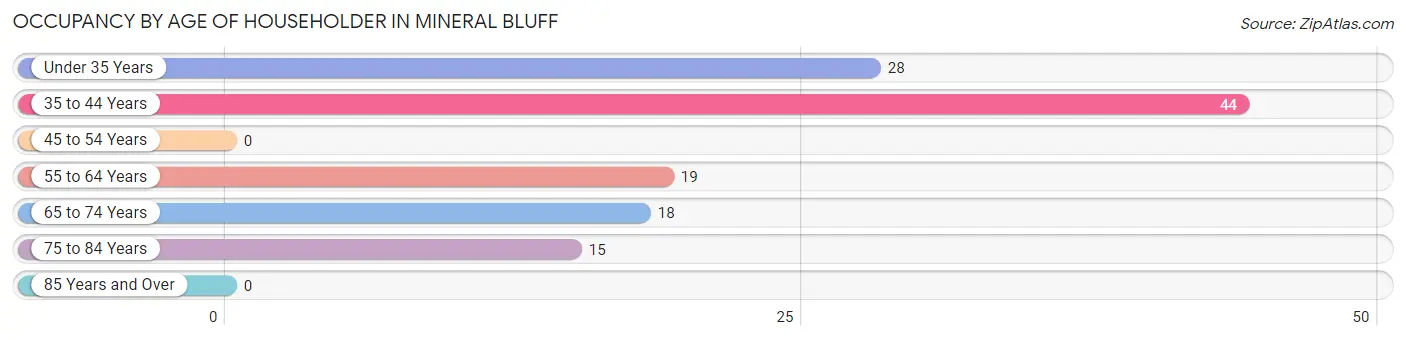
| Age Bracket | # Households | % Households |
| Under 35 Years | 28 | 22.6% |
| 35 to 44 Years | 44 | 35.5% |
| 45 to 54 Years | 0 | 0.0% |
| 55 to 64 Years | 19 | 15.3% |
| 65 to 74 Years | 18 | 14.5% |
| 75 to 84 Years | 15 | 12.1% |
| 85 Years and Over | 0 | 0.0% |
| Total | 124 | 100.0% |
Housing Finances in Mineral Bluff
Median Income by Occupancy in Mineral Bluff
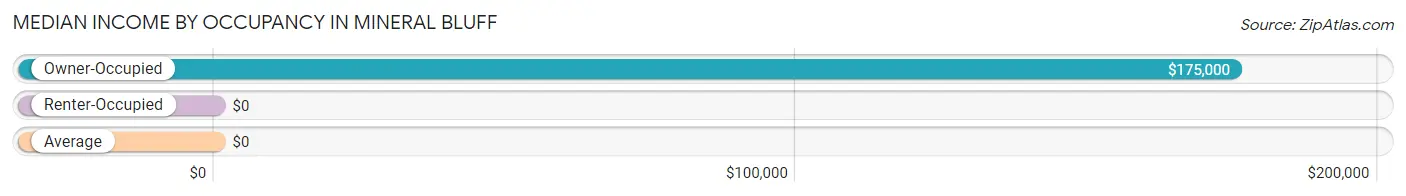
| Occupancy Type | # Households | Median Income |
| Owner-Occupied | 106 (85.5%) | $175,000 |
| Renter-Occupied | 18 (14.5%) | $0 |
| Average | 124 (100.0%) | $0 |
Occupancy by Householder Income Bracket in Mineral Bluff
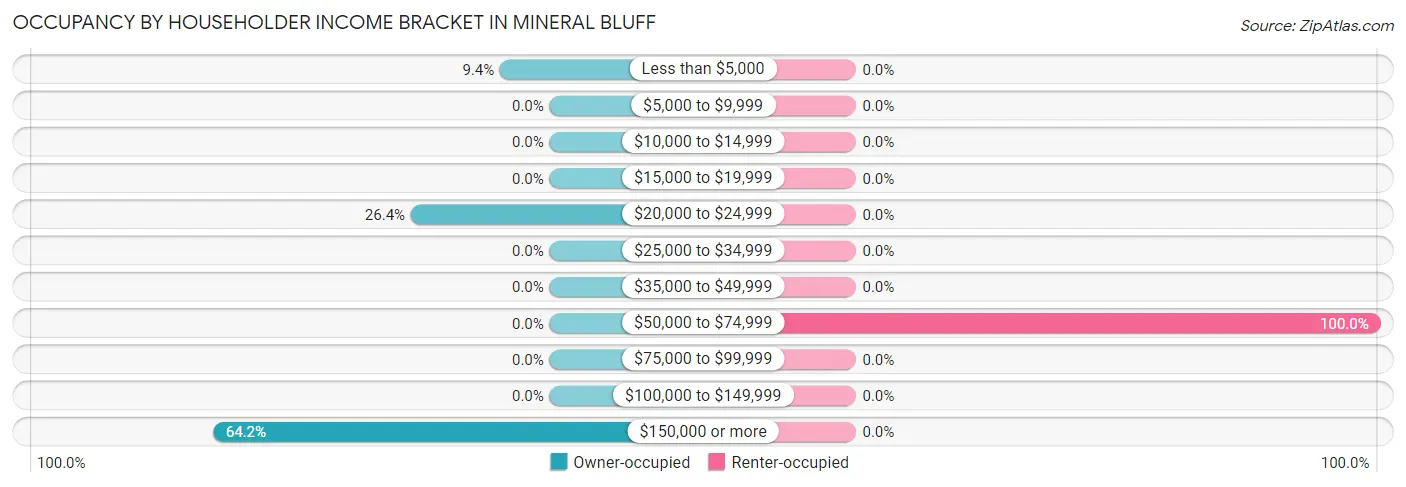
| Income Bracket | Owner-occupied | Renter-occupied |
| Less than $5,000 | 10 (9.4%) | 0 (0.0%) |
| $5,000 to $9,999 | 0 (0.0%) | 0 (0.0%) |
| $10,000 to $14,999 | 0 (0.0%) | 0 (0.0%) |
| $15,000 to $19,999 | 0 (0.0%) | 0 (0.0%) |
| $20,000 to $24,999 | 28 (26.4%) | 0 (0.0%) |
| $25,000 to $34,999 | 0 (0.0%) | 0 (0.0%) |
| $35,000 to $49,999 | 0 (0.0%) | 0 (0.0%) |
| $50,000 to $74,999 | 0 (0.0%) | 18 (100.0%) |
| $75,000 to $99,999 | 0 (0.0%) | 0 (0.0%) |
| $100,000 to $149,999 | 0 (0.0%) | 0 (0.0%) |
| $150,000 or more | 68 (64.1%) | 0 (0.0%) |
| Total | 106 (100.0%) | 18 (100.0%) |
Monthly Housing Cost Tiers in Mineral Bluff
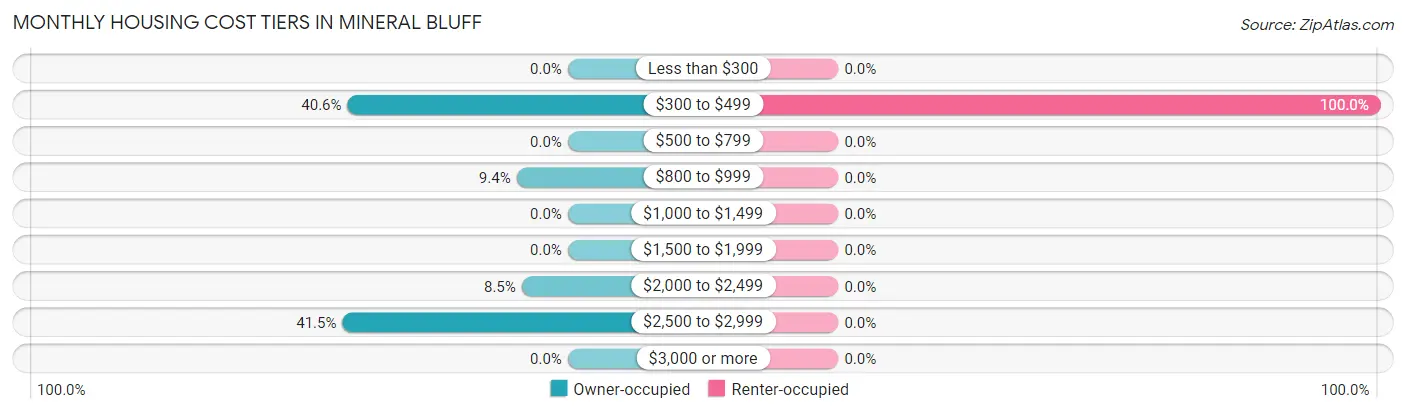
| Monthly Cost | Owner-occupied | Renter-occupied |
| Less than $300 | 0 (0.0%) | 0 (0.0%) |
| $300 to $499 | 43 (40.6%) | 18 (100.0%) |
| $500 to $799 | 0 (0.0%) | 0 (0.0%) |
| $800 to $999 | 10 (9.4%) | 0 (0.0%) |
| $1,000 to $1,499 | 0 (0.0%) | 0 (0.0%) |
| $1,500 to $1,999 | 0 (0.0%) | 0 (0.0%) |
| $2,000 to $2,499 | 9 (8.5%) | 0 (0.0%) |
| $2,500 to $2,999 | 44 (41.5%) | 0 (0.0%) |
| $3,000 or more | 0 (0.0%) | 0 (0.0%) |
| Total | 106 (100.0%) | 18 (100.0%) |
Physical Housing Characteristics in Mineral Bluff
Housing Structures in Mineral Bluff
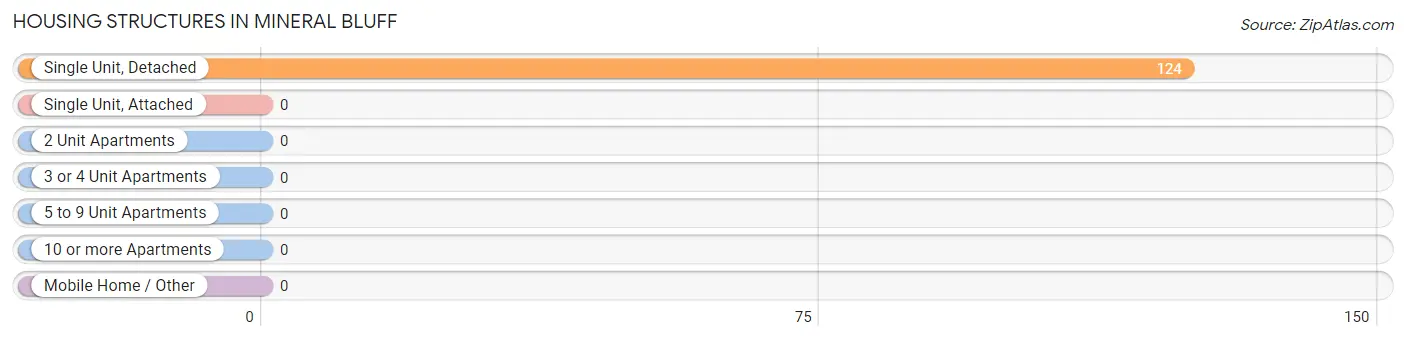
| Structure Type | # Housing Units | % Housing Units |
| Single Unit, Detached | 124 | 100.0% |
| Single Unit, Attached | 0 | 0.0% |
| 2 Unit Apartments | 0 | 0.0% |
| 3 or 4 Unit Apartments | 0 | 0.0% |
| 5 to 9 Unit Apartments | 0 | 0.0% |
| 10 or more Apartments | 0 | 0.0% |
| Mobile Home / Other | 0 | 0.0% |
| Total | 124 | 100.0% |
Housing Structures by Occupancy in Mineral Bluff
| Structure Type | Owner-occupied | Renter-occupied |
| Single Unit, Detached | 106 (85.5%) | 18 (14.5%) |
| Single Unit, Attached | 0 (0.0%) | 0 (0.0%) |
| 2 Unit Apartments | 0 (0.0%) | 0 (0.0%) |
| 3 or 4 Unit Apartments | 0 (0.0%) | 0 (0.0%) |
| 5 to 9 Unit Apartments | 0 (0.0%) | 0 (0.0%) |
| 10 or more Apartments | 0 (0.0%) | 0 (0.0%) |
| Mobile Home / Other | 0 (0.0%) | 0 (0.0%) |
| Total | 106 (85.5%) | 18 (14.5%) |
Housing Structures by Number of Rooms in Mineral Bluff
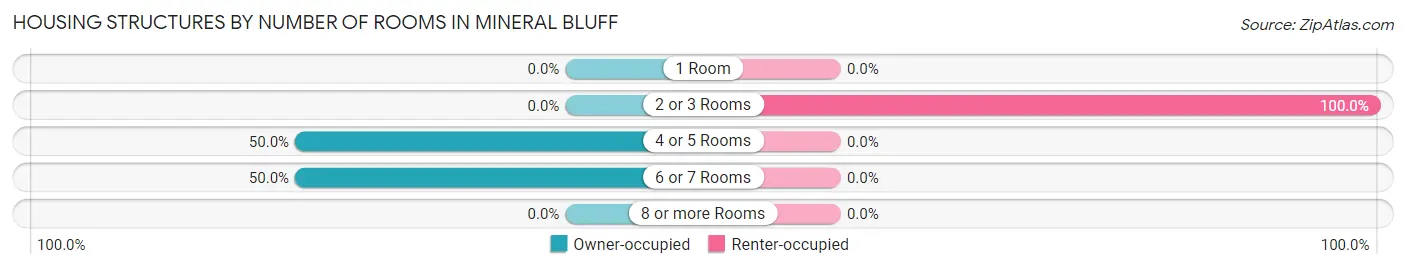
| Number of Rooms | Owner-occupied | Renter-occupied |
| 1 Room | 0 (0.0%) | 0 (0.0%) |
| 2 or 3 Rooms | 0 (0.0%) | 18 (100.0%) |
| 4 or 5 Rooms | 53 (50.0%) | 0 (0.0%) |
| 6 or 7 Rooms | 53 (50.0%) | 0 (0.0%) |
| 8 or more Rooms | 0 (0.0%) | 0 (0.0%) |
| Total | 106 (100.0%) | 18 (100.0%) |
Housing Structure by Heating Type in Mineral Bluff
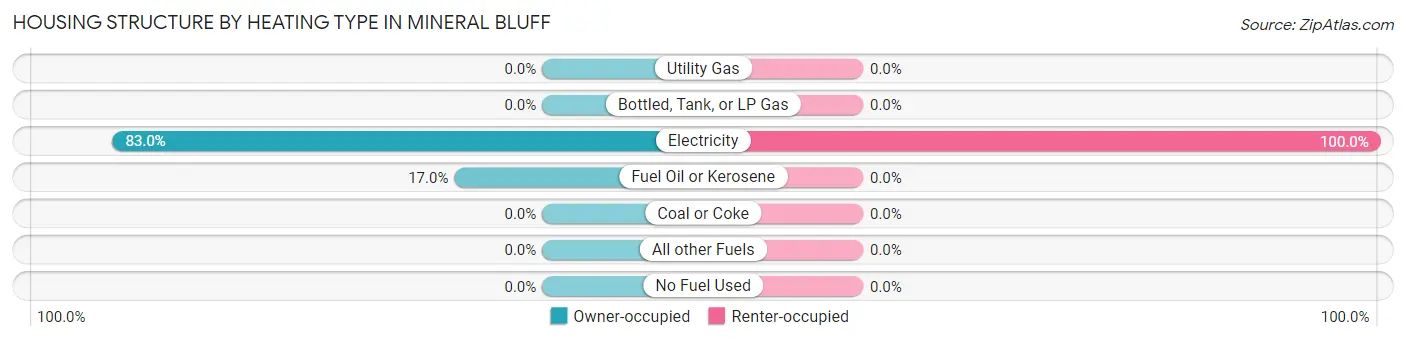
| Heating Type | Owner-occupied | Renter-occupied |
| Utility Gas | 0 (0.0%) | 0 (0.0%) |
| Bottled, Tank, or LP Gas | 0 (0.0%) | 0 (0.0%) |
| Electricity | 88 (83.0%) | 18 (100.0%) |
| Fuel Oil or Kerosene | 18 (17.0%) | 0 (0.0%) |
| Coal or Coke | 0 (0.0%) | 0 (0.0%) |
| All other Fuels | 0 (0.0%) | 0 (0.0%) |
| No Fuel Used | 0 (0.0%) | 0 (0.0%) |
| Total | 106 (100.0%) | 18 (100.0%) |
Household Vehicle Usage in Mineral Bluff
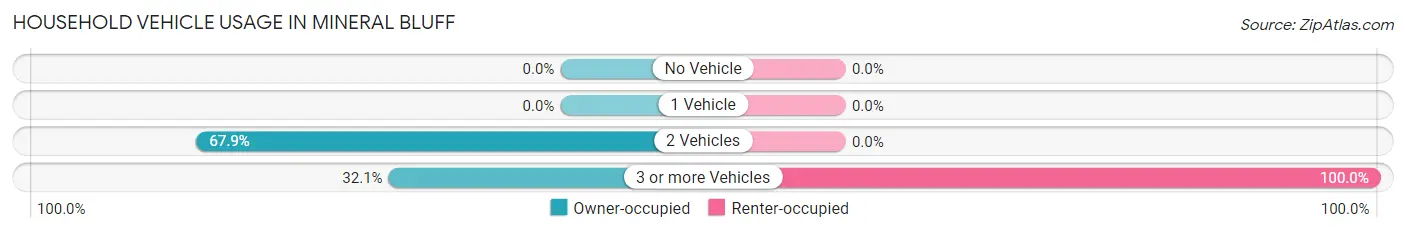
| Vehicles per Household | Owner-occupied | Renter-occupied |
| No Vehicle | 0 (0.0%) | 0 (0.0%) |
| 1 Vehicle | 0 (0.0%) | 0 (0.0%) |
| 2 Vehicles | 72 (67.9%) | 0 (0.0%) |
| 3 or more Vehicles | 34 (32.1%) | 18 (100.0%) |
| Total | 106 (100.0%) | 18 (100.0%) |
Real Estate & Mortgages in Mineral Bluff
Real Estate and Mortgage Overview in Mineral Bluff
| Characteristic | Without Mortgage | With Mortgage |
| Housing Units | 43 | 63 |
| Median Property Value | $96,400 | $428,400 |
| Median Household Income | - | - |
| Monthly Housing Costs | $368 | $0 |
| Real Estate Taxes | $728 | $0 |
Property Value by Mortgage Status in Mineral Bluff
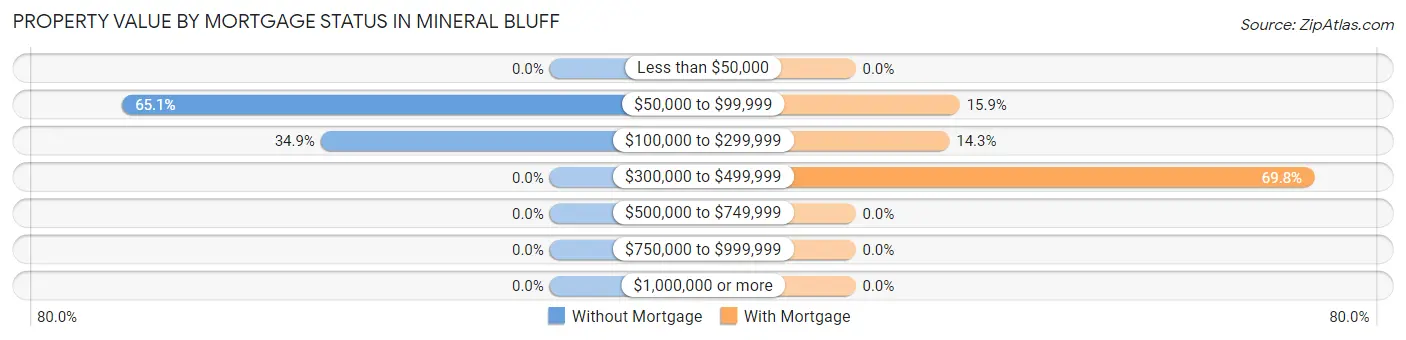
| Property Value | Without Mortgage | With Mortgage |
| Less than $50,000 | 0 (0.0%) | 0 (0.0%) |
| $50,000 to $99,999 | 28 (65.1%) | 10 (15.9%) |
| $100,000 to $299,999 | 15 (34.9%) | 9 (14.3%) |
| $300,000 to $499,999 | 0 (0.0%) | 44 (69.8%) |
| $500,000 to $749,999 | 0 (0.0%) | 0 (0.0%) |
| $750,000 to $999,999 | 0 (0.0%) | 0 (0.0%) |
| $1,000,000 or more | 0 (0.0%) | 0 (0.0%) |
| Total | 43 (100.0%) | 63 (100.0%) |
Household Income by Mortgage Status in Mineral Bluff
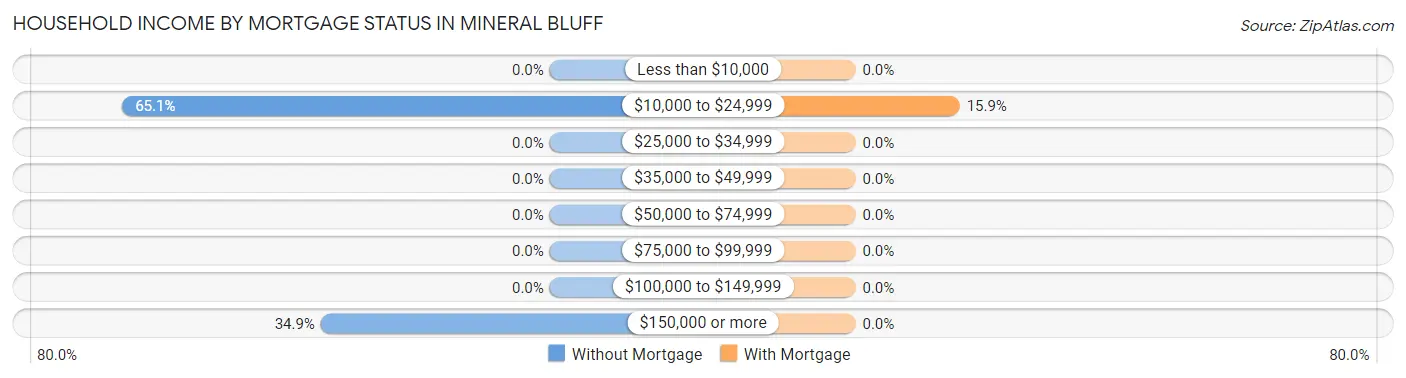
| Household Income | Without Mortgage | With Mortgage |
| Less than $10,000 | 0 (0.0%) | 0 (0.0%) |
| $10,000 to $24,999 | 28 (65.1%) | 10 (15.9%) |
| $25,000 to $34,999 | 0 (0.0%) | 0 (0.0%) |
| $35,000 to $49,999 | 0 (0.0%) | 0 (0.0%) |
| $50,000 to $74,999 | 0 (0.0%) | 0 (0.0%) |
| $75,000 to $99,999 | 0 (0.0%) | 0 (0.0%) |
| $100,000 to $149,999 | 0 (0.0%) | 0 (0.0%) |
| $150,000 or more | 15 (34.9%) | 0 (0.0%) |
| Total | 43 (100.0%) | 63 (100.0%) |
Property Value to Household Income Ratio in Mineral Bluff
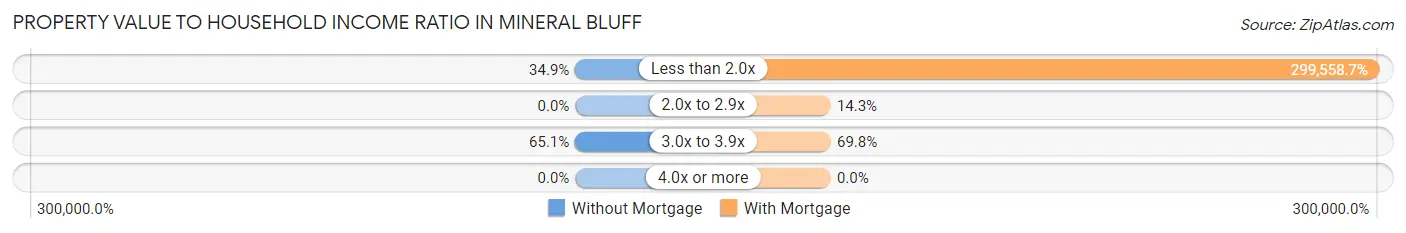
| Value-to-Income Ratio | Without Mortgage | With Mortgage |
| Less than 2.0x | 15 (34.9%) | 188,722 (299,558.7%) |
| 2.0x to 2.9x | 0 (0.0%) | 9 (14.3%) |
| 3.0x to 3.9x | 28 (65.1%) | 44 (69.8%) |
| 4.0x or more | 0 (0.0%) | 0 (0.0%) |
| Total | 43 (100.0%) | 63 (100.0%) |
Real Estate Taxes by Mortgage Status in Mineral Bluff
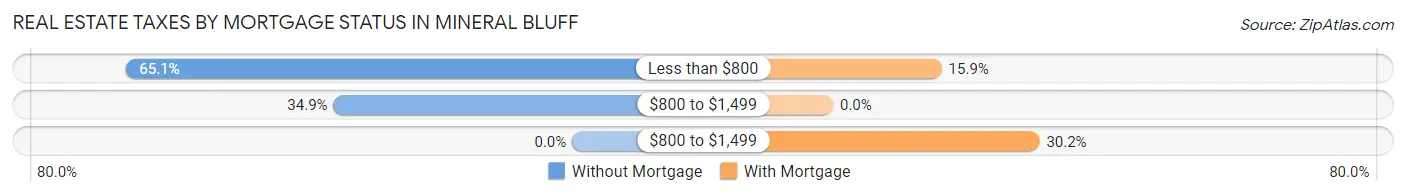
| Property Taxes | Without Mortgage | With Mortgage |
| Less than $800 | 28 (65.1%) | 10 (15.9%) |
| $800 to $1,499 | 15 (34.9%) | 0 (0.0%) |
| $800 to $1,499 | 0 (0.0%) | 19 (30.2%) |
| Total | 43 (100.0%) | 63 (100.0%) |
Health & Disability in Mineral Bluff
Health Insurance Coverage by Age in Mineral Bluff
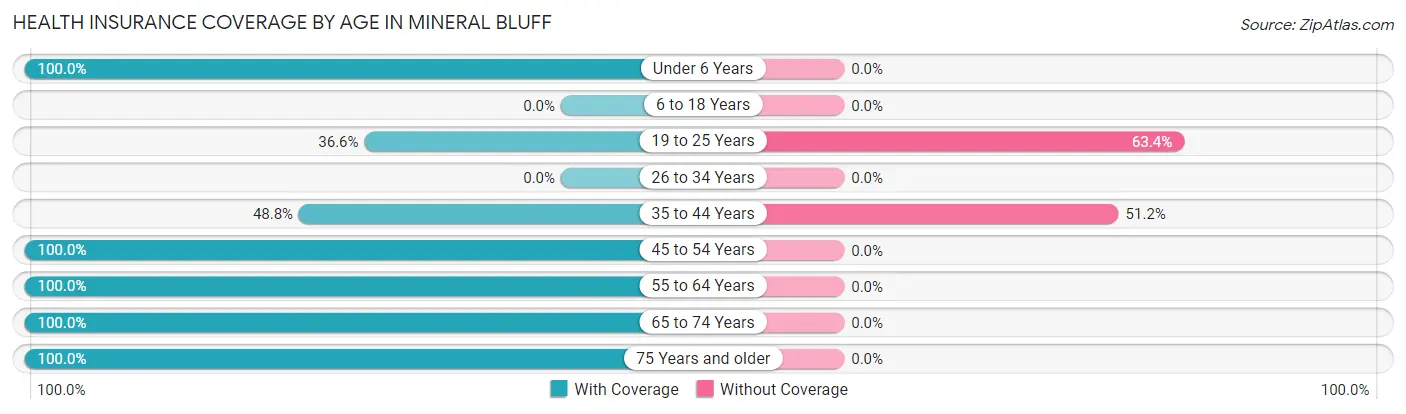
| Age Bracket | With Coverage | Without Coverage |
| Under 6 Years | 72 (100.0%) | 0 (0.0%) |
| 6 to 18 Years | 0 (0.0%) | 0 (0.0%) |
| 19 to 25 Years | 48 (36.6%) | 83 (63.4%) |
| 26 to 34 Years | 0 (0.0%) | 0 (0.0%) |
| 35 to 44 Years | 42 (48.8%) | 44 (51.2%) |
| 45 to 54 Years | 12 (100.0%) | 0 (0.0%) |
| 55 to 64 Years | 19 (100.0%) | 0 (0.0%) |
| 65 to 74 Years | 35 (100.0%) | 0 (0.0%) |
| 75 Years and older | 15 (100.0%) | 0 (0.0%) |
| Total | 243 (65.7%) | 127 (34.3%) |
Health Insurance Coverage by Citizenship Status in Mineral Bluff
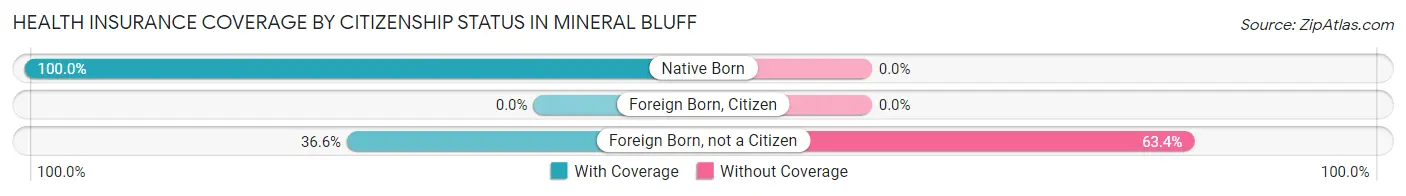
| Citizenship Status | With Coverage | Without Coverage |
| Native Born | 72 (100.0%) | 0 (0.0%) |
| Foreign Born, Citizen | 0 (0.0%) | 0 (0.0%) |
| Foreign Born, not a Citizen | 48 (36.6%) | 83 (63.4%) |
Health Insurance Coverage by Household Income in Mineral Bluff
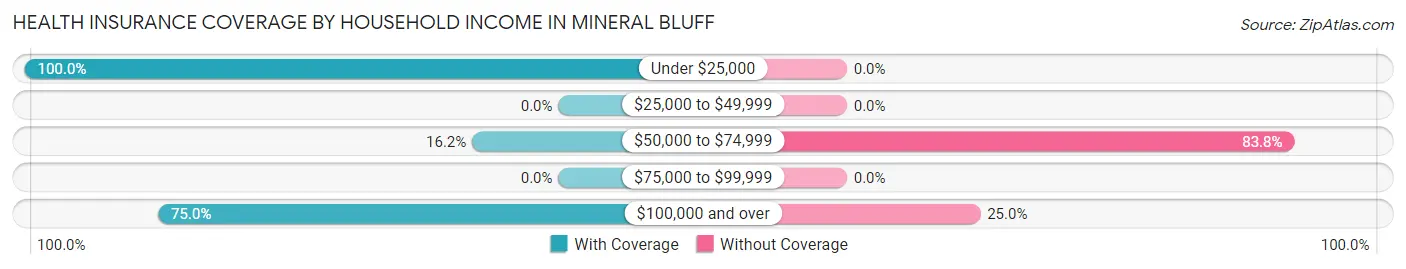
| Household Income | With Coverage | Without Coverage |
| Under $25,000 | 95 (100.0%) | 0 (0.0%) |
| $25,000 to $49,999 | 0 (0.0%) | 0 (0.0%) |
| $50,000 to $74,999 | 16 (16.2%) | 83 (83.8%) |
| $75,000 to $99,999 | 0 (0.0%) | 0 (0.0%) |
| $100,000 and over | 132 (75.0%) | 44 (25.0%) |
Public vs Private Health Insurance Coverage by Age in Mineral Bluff
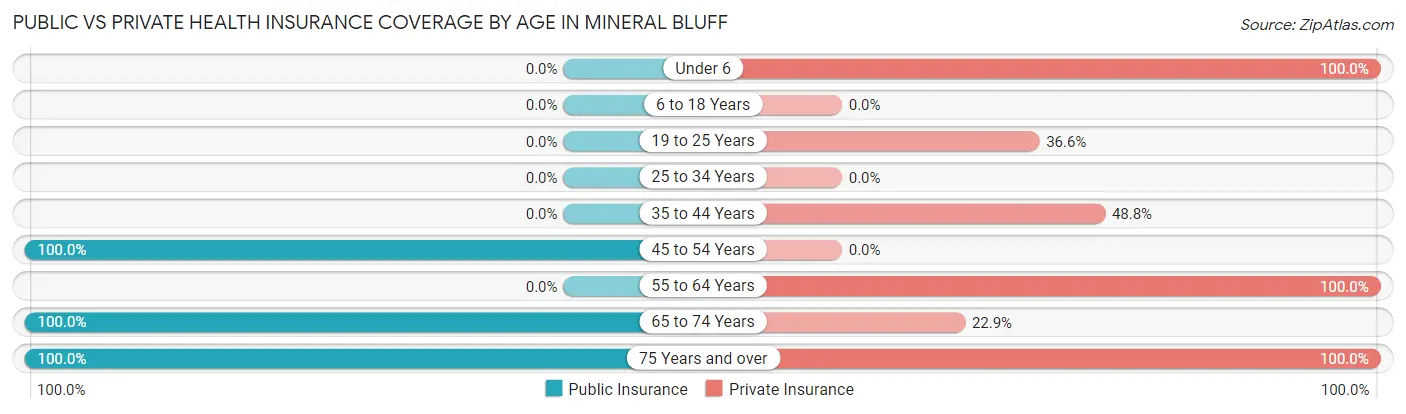
| Age Bracket | Public Insurance | Private Insurance |
| Under 6 | 0 (0.0%) | 72 (100.0%) |
| 6 to 18 Years | 0 (0.0%) | 0 (0.0%) |
| 19 to 25 Years | 0 (0.0%) | 48 (36.6%) |
| 25 to 34 Years | 0 (0.0%) | 0 (0.0%) |
| 35 to 44 Years | 0 (0.0%) | 42 (48.8%) |
| 45 to 54 Years | 12 (100.0%) | 0 (0.0%) |
| 55 to 64 Years | 0 (0.0%) | 19 (100.0%) |
| 65 to 74 Years | 35 (100.0%) | 8 (22.9%) |
| 75 Years and over | 15 (100.0%) | 15 (100.0%) |
| Total | 62 (16.8%) | 204 (55.1%) |
Disability Status by Sex by Age in Mineral Bluff
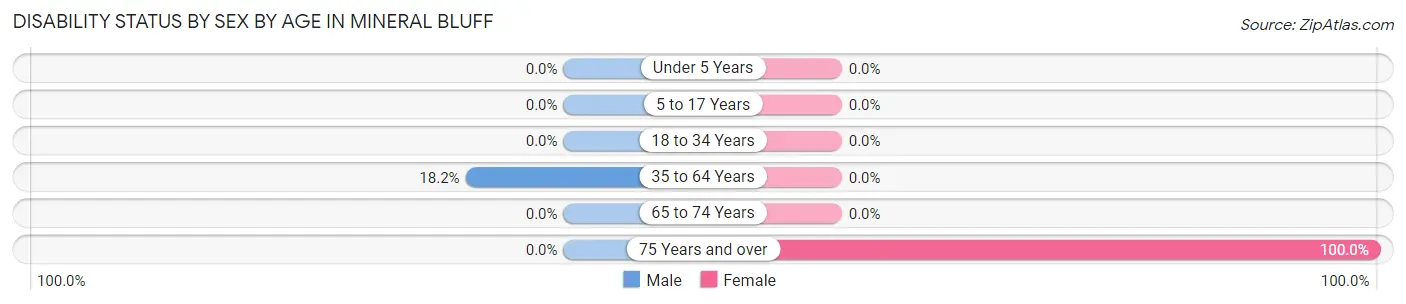
| Age Bracket | Male | Female |
| Under 5 Years | 0 (0.0%) | 0 (0.0%) |
| 5 to 17 Years | 0 (0.0%) | 0 (0.0%) |
| 18 to 34 Years | 0 (0.0%) | 0 (0.0%) |
| 35 to 64 Years | 12 (18.2%) | 0 (0.0%) |
| 65 to 74 Years | 0 (0.0%) | 0 (0.0%) |
| 75 Years and over | 0 (0.0%) | 15 (100.0%) |
Disability Class by Sex by Age in Mineral Bluff
Disability Class: Hearing Difficulty
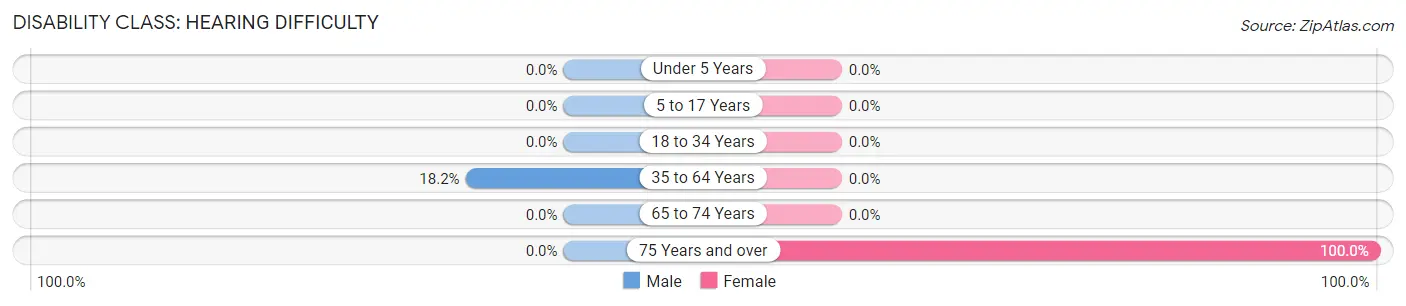
| Age Bracket | Male | Female |
| Under 5 Years | 0 (0.0%) | 0 (0.0%) |
| 5 to 17 Years | 0 (0.0%) | 0 (0.0%) |
| 18 to 34 Years | 0 (0.0%) | 0 (0.0%) |
| 35 to 64 Years | 12 (18.2%) | 0 (0.0%) |
| 65 to 74 Years | 0 (0.0%) | 0 (0.0%) |
| 75 Years and over | 0 (0.0%) | 15 (100.0%) |
Disability Class: Vision Difficulty
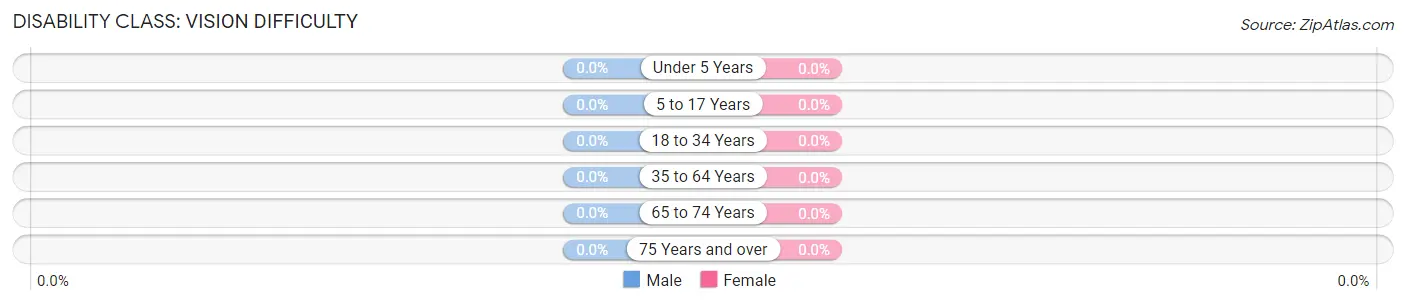
| Age Bracket | Male | Female |
| Under 5 Years | 0 (0.0%) | 0 (0.0%) |
| 5 to 17 Years | 0 (0.0%) | 0 (0.0%) |
| 18 to 34 Years | 0 (0.0%) | 0 (0.0%) |
| 35 to 64 Years | 0 (0.0%) | 0 (0.0%) |
| 65 to 74 Years | 0 (0.0%) | 0 (0.0%) |
| 75 Years and over | 0 (0.0%) | 0 (0.0%) |
Disability Class: Cognitive Difficulty
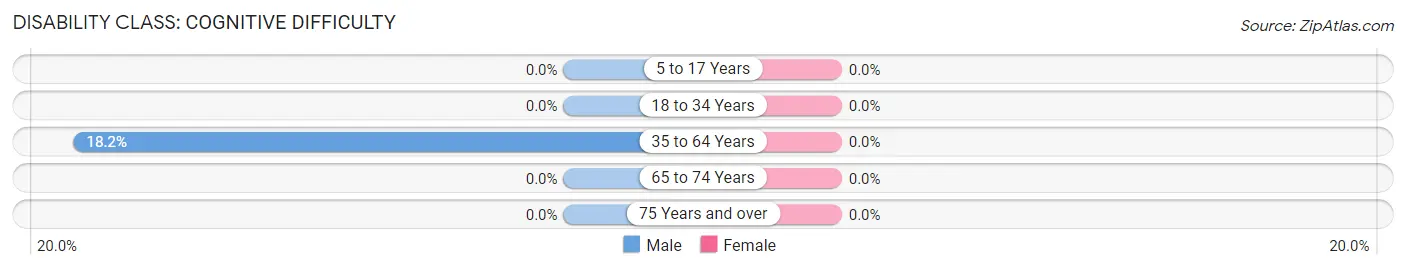
| Age Bracket | Male | Female |
| 5 to 17 Years | 0 (0.0%) | 0 (0.0%) |
| 18 to 34 Years | 0 (0.0%) | 0 (0.0%) |
| 35 to 64 Years | 12 (18.2%) | 0 (0.0%) |
| 65 to 74 Years | 0 (0.0%) | 0 (0.0%) |
| 75 Years and over | 0 (0.0%) | 0 (0.0%) |
Disability Class: Ambulatory Difficulty
| Age Bracket | Male | Female |
| 5 to 17 Years | 0 (0.0%) | 0 (0.0%) |
| 18 to 34 Years | 0 (0.0%) | 0 (0.0%) |
| 35 to 64 Years | 0 (0.0%) | 0 (0.0%) |
| 65 to 74 Years | 0 (0.0%) | 0 (0.0%) |
| 75 Years and over | 0 (0.0%) | 0 (0.0%) |
Disability Class: Self-Care Difficulty
| Age Bracket | Male | Female |
| 5 to 17 Years | 0 (0.0%) | 0 (0.0%) |
| 18 to 34 Years | 0 (0.0%) | 0 (0.0%) |
| 35 to 64 Years | 0 (0.0%) | 0 (0.0%) |
| 65 to 74 Years | 0 (0.0%) | 0 (0.0%) |
| 75 Years and over | 0 (0.0%) | 0 (0.0%) |
Technology Access in Mineral Bluff
Computing Device Access in Mineral Bluff
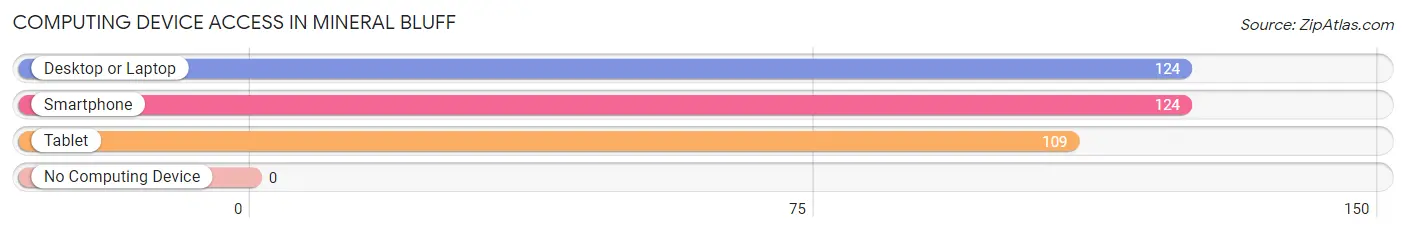
| Device Type | # Households | % Households |
| Desktop or Laptop | 124 | 100.0% |
| Smartphone | 124 | 100.0% |
| Tablet | 109 | 87.9% |
| No Computing Device | 0 | 0.0% |
| Total | 124 | 100.0% |
Internet Access in Mineral Bluff
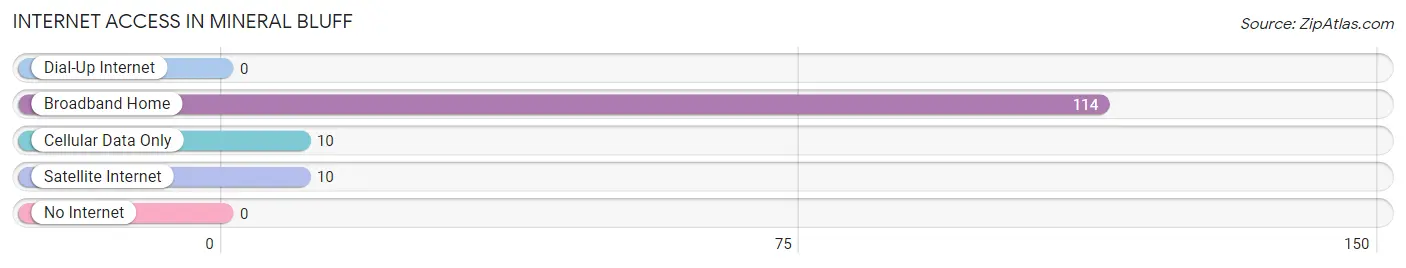
| Internet Type | # Households | % Households |
| Dial-Up Internet | 0 | 0.0% |
| Broadband Home | 114 | 91.9% |
| Cellular Data Only | 10 | 8.1% |
| Satellite Internet | 10 | 8.1% |
| No Internet | 0 | 0.0% |
| Total | 124 | 100.0% |
Mineral Bluff Summary
Mineral Bluff is a small town located in Fannin County, Georgia, United States. It is situated in the foothills of the Blue Ridge Mountains, near the Tennessee border. The town was founded in 1838 and is named after the mineral deposits found in the area. As of the 2010 census, the population of Mineral Bluff was 545.
Geography
Mineral Bluff is located at 34°59'25" North, 84°14'45" West (34.990278, -84.245833). It is situated in the foothills of the Blue Ridge Mountains, near the Tennessee border. The town is located in the Chattahoochee National Forest and is surrounded by the Cohutta Wilderness. The town is situated along the Toccoa River, which is a tributary of the Ocoee River.
The town has a total area of 0.7 square miles, all of which is land. The elevation of Mineral Bluff is 1,845 feet above sea level.
History
Mineral Bluff was founded in 1838 and is named after the mineral deposits found in the area. The town was originally known as Mineral Hill, but the name was changed to Mineral Bluff in 1845. The town was incorporated in 1887.
The town was a popular destination for tourists in the late 19th and early 20th centuries. The town was home to several resorts, including the Mineral Bluff Hotel, which was built in 1887. The hotel was destroyed by fire in 1921.
Economy
The economy of Mineral Bluff is largely based on tourism. The town is home to several tourist attractions, including the Blue Ridge Scenic Railway, which offers scenic train rides through the mountains. The town is also home to several wineries, including the Fannin County Winery.
The town is also home to several small businesses, including restaurants, antique stores, and gift shops. The town is also home to several bed and breakfasts.
Demographics
As of the 2010 census, the population of Mineral Bluff was 545. The racial makeup of the town was 97.3% White, 0.2% African American, 0.2% Native American, 0.2% Asian, 0.4% from other races, and 1.7% from two or more races. Hispanic or Latino of any race were 1.3% of the population.
The median income for a household in Mineral Bluff was $37,500, and the median income for a family was $41,250. The per capita income for the town was $19,945. About 11.2% of families and 13.2% of the population were below the poverty line, including 16.7% of those under age 18 and 8.3% of those age 65 or over.
Common Questions
What is Per Capita Income in Mineral Bluff?
Per Capita income in Mineral Bluff is $41,408.
What is the Median Family Income in Mineral Bluff?
Median Family Income in Mineral Bluff is $175,000.
What is Inequality or Gini Index in Mineral Bluff?
Inequality or Gini Index in Mineral Bluff is 0.37.
What is the Total Population of Mineral Bluff?
Total Population of Mineral Bluff is 370.
What is the Total Male Population of Mineral Bluff?
Total Male Population of Mineral Bluff is 187.
What is the Total Female Population of Mineral Bluff?
Total Female Population of Mineral Bluff is 183.
What is the Ratio of Males per 100 Females in Mineral Bluff?
There are 102.19 Males per 100 Females in Mineral Bluff.
What is the Ratio of Females per 100 Males in Mineral Bluff?
There are 97.86 Females per 100 Males in Mineral Bluff.
What is the Median Population Age in Mineral Bluff?
Median Population Age in Mineral Bluff is 24.6 Years.
What is the Average Family Size in Mineral Bluff
Average Family Size in Mineral Bluff is 2.6 People.
What is the Average Household Size in Mineral Bluff
Average Household Size in Mineral Bluff is 3.0 People.
How Large is the Labor Force in Mineral Bluff?
There are 242 People in the Labor Forcein in Mineral Bluff.
What is the Percentage of People in the Labor Force in Mineral Bluff?
81.2% of People are in the Labor Force in Mineral Bluff.
What is the Unemployment Rate in Mineral Bluff?
Unemployment Rate in Mineral Bluff is 6.6%.