Zip Codes with the Highest Percentage of Families with Income Above $100,000 in Tifton, GA
RELATED REPORTS & OPTIONS
Family Income | $100k+
Tifton
Compare Zip Codes
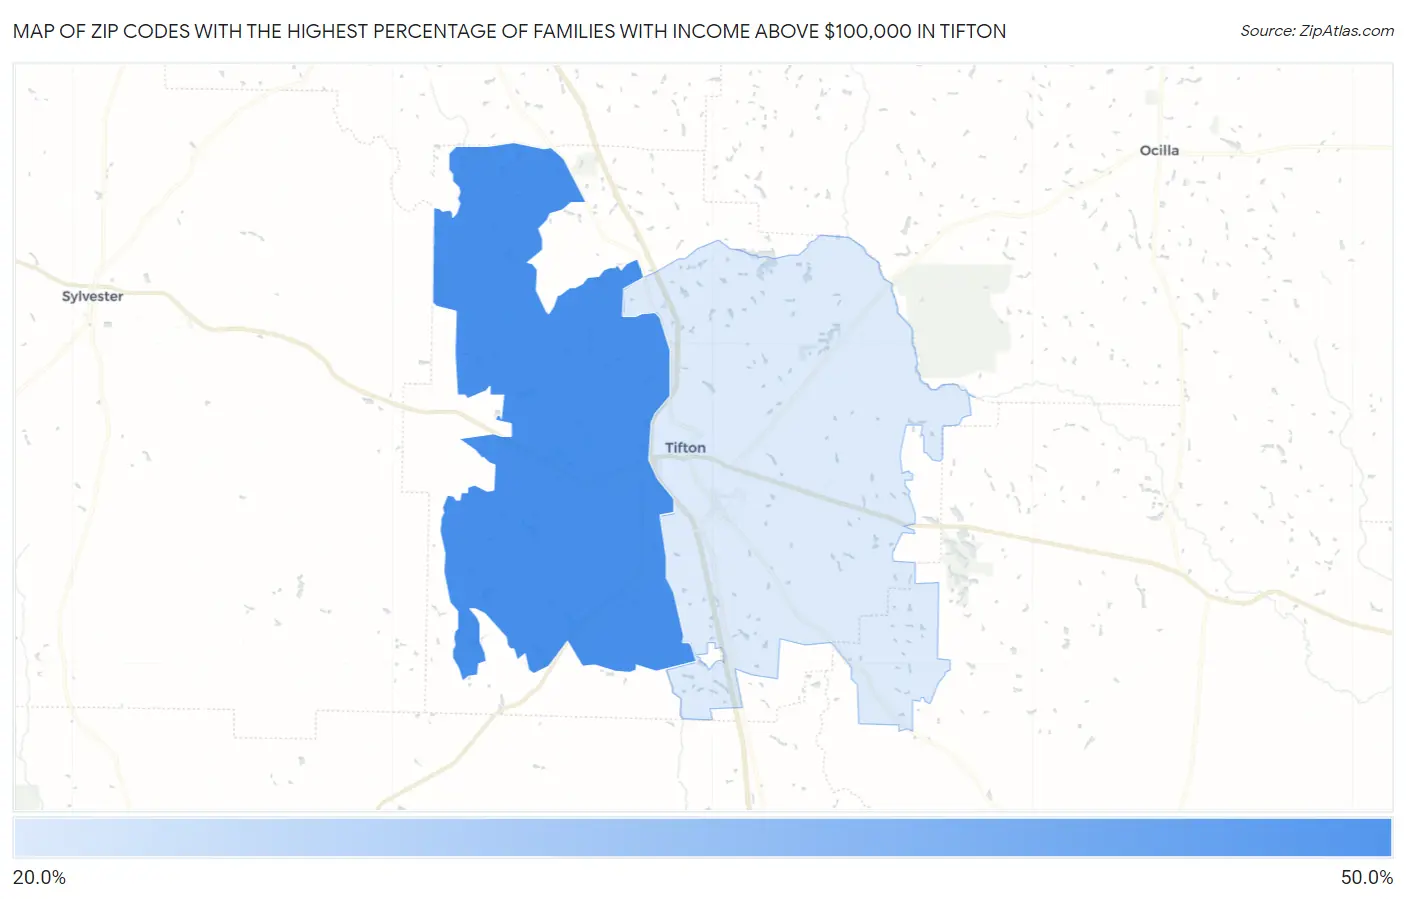
Map of Zip Codes with the Highest Percentage of Families with Income Above $100,000 in Tifton
26.3%
41.2%
Zip Codes with the Highest Percentage of Families with Income Above $100,000 in Tifton, GA
| Zip Code | Families with Income > $100k | vs State | vs National | |
| 1. | 31793 | 41.2% | 42.7%(-1.50)#197 | 46.1%(-4.90)#13,605 |
| 2. | 31794 | 26.3% | 42.7%(-16.4)#477 | 46.1%(-19.8)#23,868 |
1
Common Questions
What are the Top Zip Codes with the Highest Percentage of Families with Income Above $100,000 in Tifton, GA?
Top Zip Codes with the Highest Percentage of Families with Income Above $100,000 in Tifton, GA are:
What zip code has the Highest Percentage of Families with Income Above $100,000 in Tifton, GA?
31793 has the Highest Percentage of Families with Income Above $100,000 in Tifton, GA with 41.2%.
What is the Percentage of Families with Income Above $100,000 in Tifton, GA?
Percentage of Families with Income Above $100,000 in Tifton is 25.9%.
What is the Percentage of Families with Income Above $100,000 in Georgia?
Percentage of Families with Income Above $100,000 in Georgia is 42.7%.
What is the Percentage of Families with Income Above $100,000 in the United States?
Percentage of Families with Income Above $100,000 in the United States is 46.1%.