Appling, GA Map & Demographics
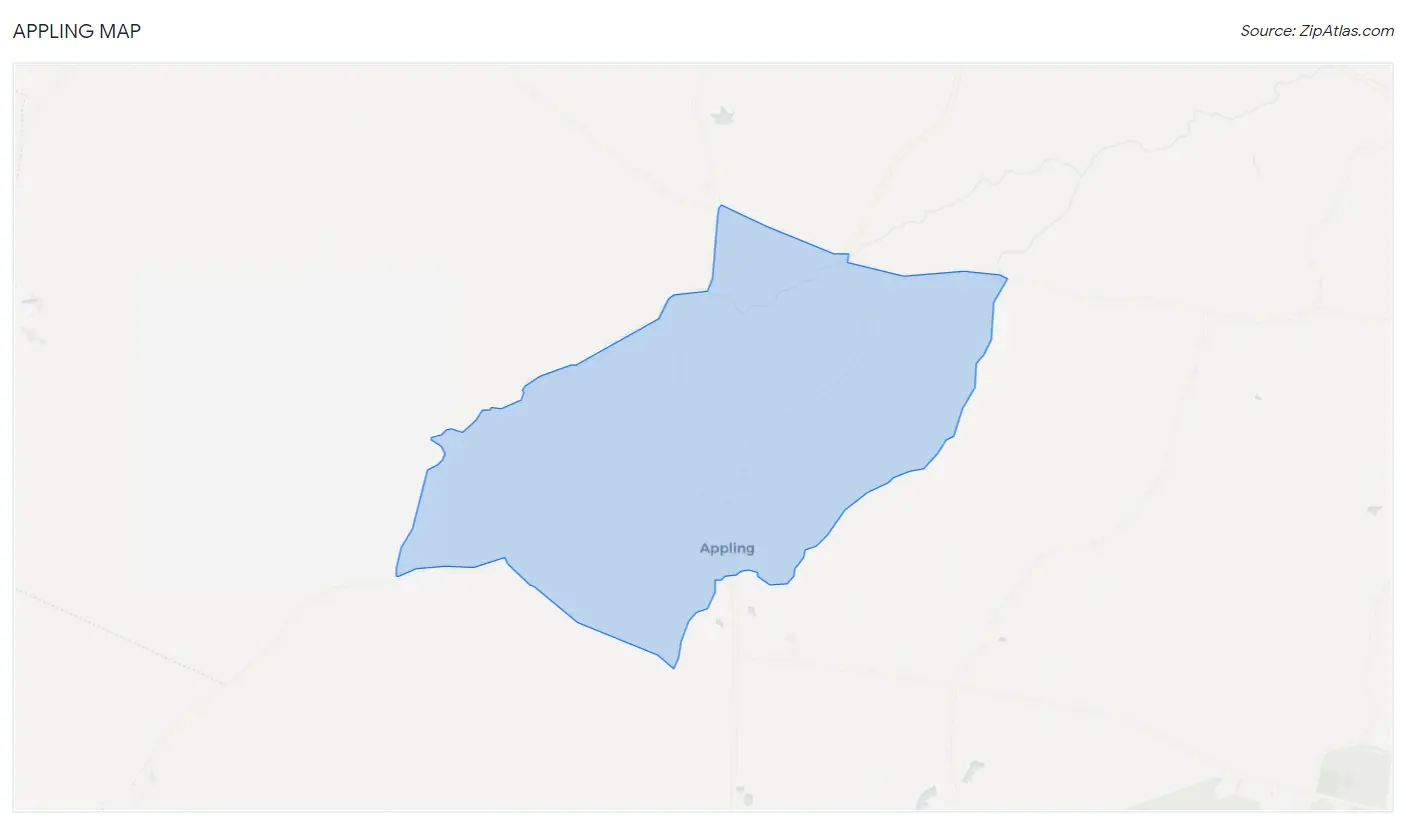
Appling Map
Appling Overview
$37,799
PER CAPITA INCOME
19.1%
WAGE / INCOME GAP [ % ]
80.9¢/ $1
WAGE / INCOME GAP [ $ ]
0.58
INEQUALITY / GINI INDEX
701
TOTAL POPULATION
513
MALE POPULATION
188
FEMALE POPULATION
272.87
MALES / 100 FEMALES
36.65
FEMALES / 100 MALES
38.0
MEDIAN AGE
3.5
AVG FAMILY SIZE
2.2
AVG HOUSEHOLD SIZE
272
LABOR FORCE [ PEOPLE ]
51.6%
PERCENT IN LABOR FORCE
15.4%
UNEMPLOYMENT RATE
Appling Zip Codes
Income in Appling
Income Overview in Appling
| Characteristic | Number | Measure |
| Per Capita Income | 701 | $37,799 |
| Median Family Income | 148 | $0 |
| Mean Family Income | 148 | $166,421 |
| Median Household Income | 323 | $0 |
| Mean Household Income | 323 | $86,248 |
| Income Deficit | 148 | $0 |
| Wage / Income Gap (%) | 701 | 19.10% |
| Wage / Income Gap ($) | 701 | 80.90¢ per $1 |
| Gini / Inequality Index | 701 | 0.58 |
Earnings by Sex in Appling
Average Earnings in Appling are $120,417, $109,595 for men and $135,467 for women, a difference of 19.1%.
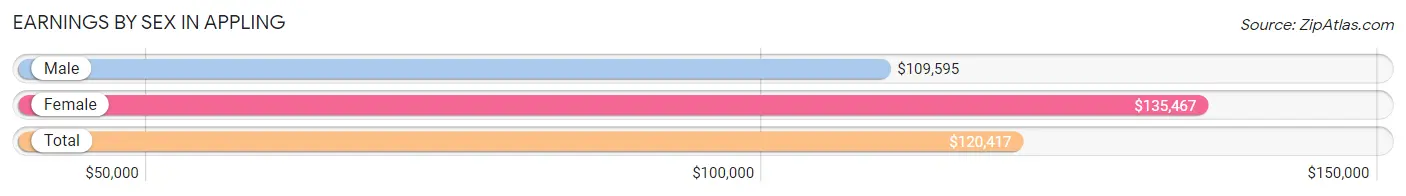
| Sex | Number | Average Earnings |
| Male | 108 (47.0%) | $109,595 |
| Female | 122 (53.0%) | $135,467 |
| Total | 230 (100.0%) | $120,417 |
Earnings by Sex by Income Bracket in Appling
The most common earnings brackets in Appling are $100,000+ for men (85 | 78.7%) and $100,000+ for women (75 | 61.5%).
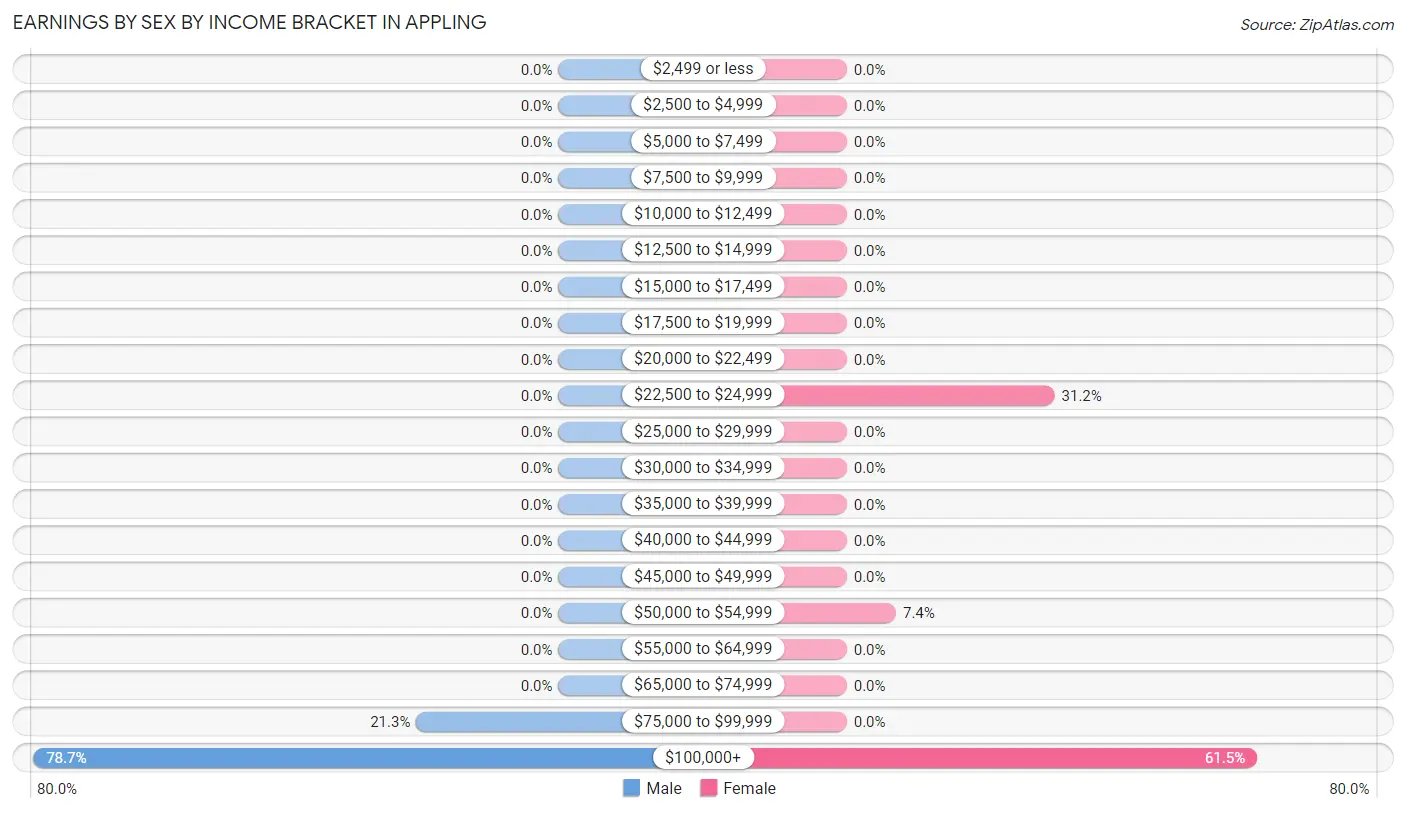
| Income | Male | Female |
| $2,499 or less | 0 (0.0%) | 0 (0.0%) |
| $2,500 to $4,999 | 0 (0.0%) | 0 (0.0%) |
| $5,000 to $7,499 | 0 (0.0%) | 0 (0.0%) |
| $7,500 to $9,999 | 0 (0.0%) | 0 (0.0%) |
| $10,000 to $12,499 | 0 (0.0%) | 0 (0.0%) |
| $12,500 to $14,999 | 0 (0.0%) | 0 (0.0%) |
| $15,000 to $17,499 | 0 (0.0%) | 0 (0.0%) |
| $17,500 to $19,999 | 0 (0.0%) | 0 (0.0%) |
| $20,000 to $22,499 | 0 (0.0%) | 0 (0.0%) |
| $22,500 to $24,999 | 0 (0.0%) | 38 (31.1%) |
| $25,000 to $29,999 | 0 (0.0%) | 0 (0.0%) |
| $30,000 to $34,999 | 0 (0.0%) | 0 (0.0%) |
| $35,000 to $39,999 | 0 (0.0%) | 0 (0.0%) |
| $40,000 to $44,999 | 0 (0.0%) | 0 (0.0%) |
| $45,000 to $49,999 | 0 (0.0%) | 0 (0.0%) |
| $50,000 to $54,999 | 0 (0.0%) | 9 (7.4%) |
| $55,000 to $64,999 | 0 (0.0%) | 0 (0.0%) |
| $65,000 to $74,999 | 0 (0.0%) | 0 (0.0%) |
| $75,000 to $99,999 | 23 (21.3%) | 0 (0.0%) |
| $100,000+ | 85 (78.7%) | 75 (61.5%) |
| Total | 108 (100.0%) | 122 (100.0%) |
Earnings by Sex by Educational Attainment in Appling
| Educational Attainment | Male Income | Female Income |
| Less than High School | - | - |
| High School Diploma | - | - |
| College or Associate's Degree | - | - |
| Bachelor's Degree | - | - |
| Graduate Degree | - | - |
| Total | $109,595 | $135,467 |
Family Income in Appling
Family Income Brackets in Appling
According to the Appling family income data, there are 85 families falling into the $200,000+ income range, which is the most common income bracket and makes up 57.4% of all families.
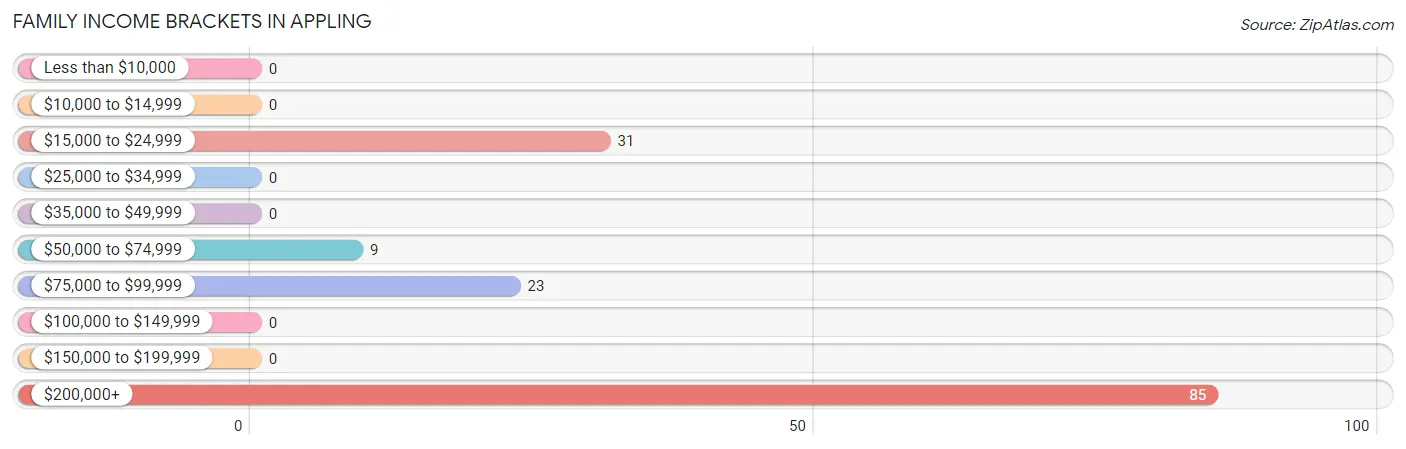
| Income Bracket | # Families | % Families |
| Less than $10,000 | 0 | 0.0% |
| $10,000 to $14,999 | 0 | 0.0% |
| $15,000 to $24,999 | 31 | 20.9% |
| $25,000 to $34,999 | 0 | 0.0% |
| $35,000 to $49,999 | 0 | 0.0% |
| $50,000 to $74,999 | 9 | 6.1% |
| $75,000 to $99,999 | 23 | 15.5% |
| $100,000 to $149,999 | 0 | 0.0% |
| $150,000 to $199,999 | 0 | 0.0% |
| $200,000+ | 85 | 57.4% |
Family Income by Famaliy Size in Appling
| Income Bracket | # Families | Median Income |
| 2-Person Families | 9 (6.1%) | $0 |
| 3-Person Families | 79 (53.4%) | $0 |
| 4-Person Families | 60 (40.5%) | $0 |
| 5-Person Families | 0 (0.0%) | $0 |
| 6-Person Families | 0 (0.0%) | $0 |
| 7+ Person Families | 0 (0.0%) | $0 |
| Total | 148 (100.0%) | $0 |
Family Income by Number of Earners in Appling
| Number of Earners | # Families | Median Income |
| No Earners | 0 (0.0%) | $0 |
| 1 Earner | 63 (42.6%) | $0 |
| 2 Earners | 85 (57.4%) | $0 |
| 3+ Earners | 0 (0.0%) | $0 |
| Total | 148 (100.0%) | $0 |
Household Income in Appling
Household Income Brackets in Appling
With 104 households falling in the category, the $10,000 to $14,999 income range is the most frequent in Appling, accounting for 32.2% of all households.
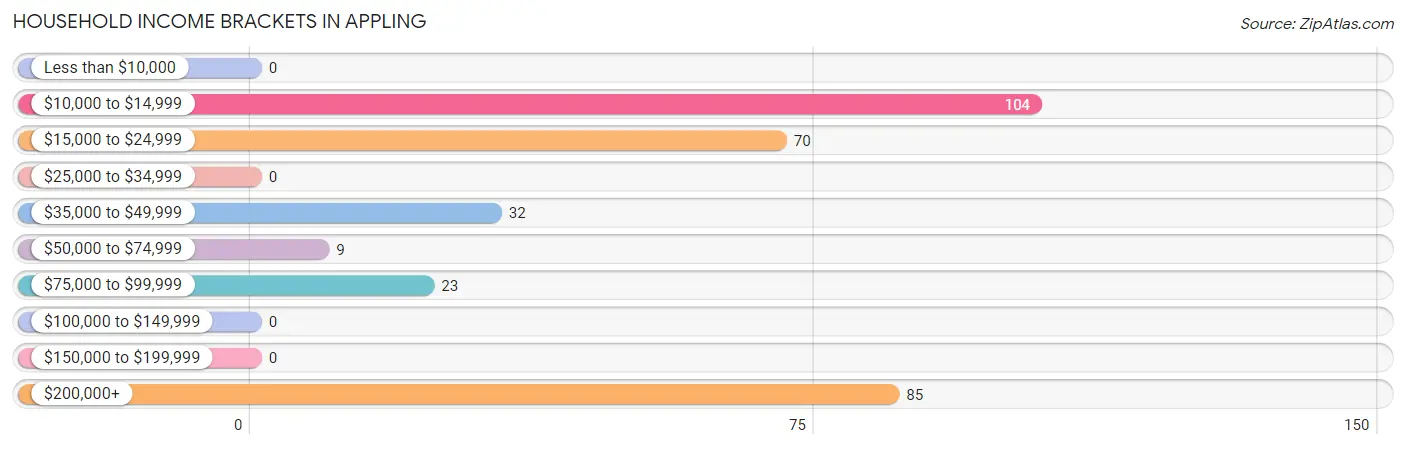
| Income Bracket | # Households | % Households |
| Less than $10,000 | 0 | 0.0% |
| $10,000 to $14,999 | 104 | 32.2% |
| $15,000 to $24,999 | 70 | 21.7% |
| $25,000 to $34,999 | 0 | 0.0% |
| $35,000 to $49,999 | 32 | 9.9% |
| $50,000 to $74,999 | 9 | 2.8% |
| $75,000 to $99,999 | 23 | 7.1% |
| $100,000 to $149,999 | 0 | 0.0% |
| $150,000 to $199,999 | 0 | 0.0% |
| $200,000+ | 85 | 26.3% |
Household Income by Householder Age in Appling
| Income Bracket | # Households | Median Income |
| 15 to 24 Years | 0 (0.0%) | $0 |
| 25 to 44 Years | 91 (28.2%) | $0 |
| 45 to 64 Years | 55 (17.0%) | $0 |
| 65+ Years | 177 (54.8%) | $0 |
| Total | 323 (100.0%) | $0 |
Poverty in Appling
Income Below Poverty by Sex and Age in Appling
With 37.6% poverty level for males and 16.5% for females among the residents of Appling, 55 to 64 year old males and 35 to 44 year old females are the most vulnerable to poverty, with 7 males (100.0%) and 31 females (37.3%) in their respective age groups living below the poverty level.
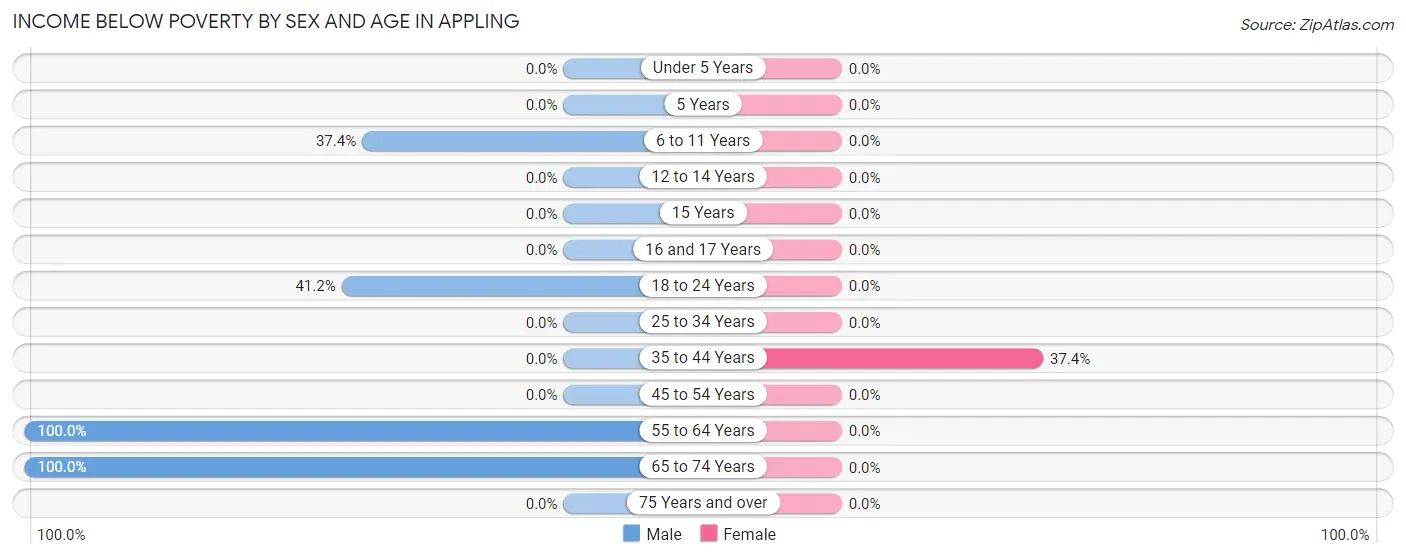
| Age Bracket | Male | Female |
| Under 5 Years | 0 (0.0%) | 0 (0.0%) |
| 5 Years | 0 (0.0%) | 0 (0.0%) |
| 6 to 11 Years | 40 (37.4%) | 0 (0.0%) |
| 12 to 14 Years | 0 (0.0%) | 0 (0.0%) |
| 15 Years | 0 (0.0%) | 0 (0.0%) |
| 16 and 17 Years | 0 (0.0%) | 0 (0.0%) |
| 18 to 24 Years | 42 (41.2%) | 0 (0.0%) |
| 25 to 34 Years | 0 (0.0%) | 0 (0.0%) |
| 35 to 44 Years | 0 (0.0%) | 31 (37.3%) |
| 45 to 54 Years | 0 (0.0%) | 0 (0.0%) |
| 55 to 64 Years | 7 (100.0%) | 0 (0.0%) |
| 65 to 74 Years | 104 (100.0%) | 0 (0.0%) |
| 75 Years and over | 0 (0.0%) | 0 (0.0%) |
| Total | 193 (37.6%) | 31 (16.5%) |
Income Above Poverty by Sex and Age in Appling
According to the poverty statistics in Appling, males aged under 5 years and females aged under 5 years are the age groups that are most secure financially, with 100.0% of males and 100.0% of females in these age groups living above the poverty line.
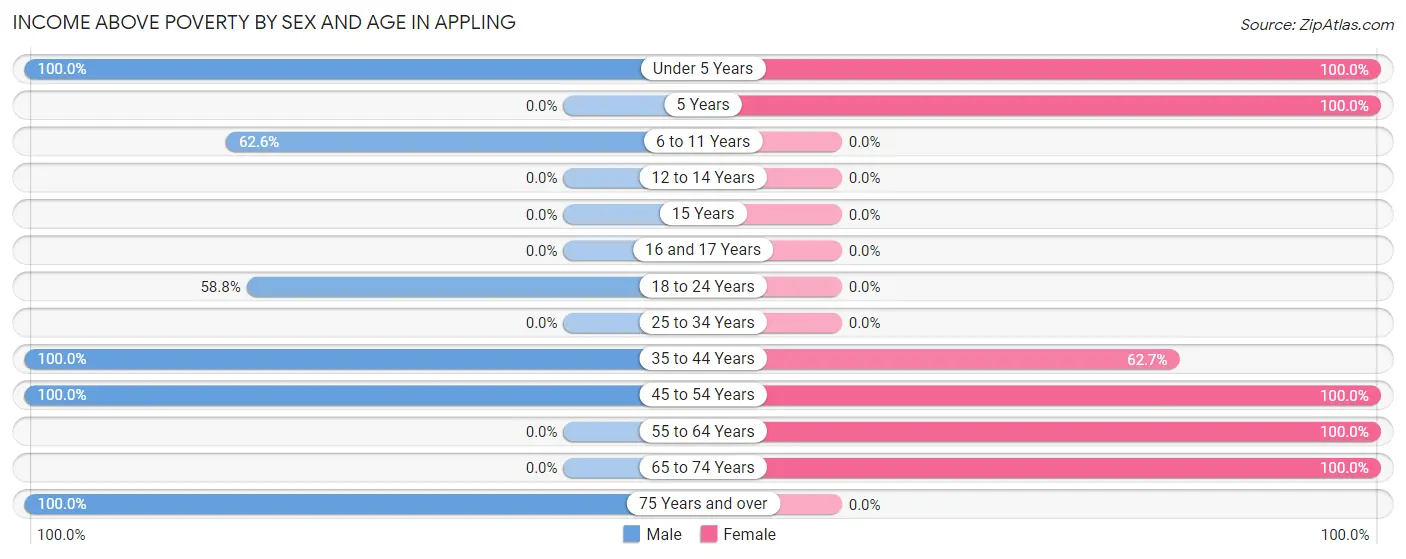
| Age Bracket | Male | Female |
| Under 5 Years | 21 (100.0%) | 12 (100.0%) |
| 5 Years | 0 (0.0%) | 34 (100.0%) |
| 6 to 11 Years | 67 (62.6%) | 0 (0.0%) |
| 12 to 14 Years | 0 (0.0%) | 0 (0.0%) |
| 15 Years | 0 (0.0%) | 0 (0.0%) |
| 16 and 17 Years | 0 (0.0%) | 0 (0.0%) |
| 18 to 24 Years | 60 (58.8%) | 0 (0.0%) |
| 25 to 34 Years | 0 (0.0%) | 0 (0.0%) |
| 35 to 44 Years | 60 (100.0%) | 52 (62.6%) |
| 45 to 54 Years | 48 (100.0%) | 43 (100.0%) |
| 55 to 64 Years | 0 (0.0%) | 7 (100.0%) |
| 65 to 74 Years | 0 (0.0%) | 9 (100.0%) |
| 75 Years and over | 64 (100.0%) | 0 (0.0%) |
| Total | 320 (62.4%) | 157 (83.5%) |
Income Below Poverty Among Married-Couple Families in Appling
| Children | Above Poverty | Below Poverty |
| No Children | 48 (100.0%) | 0 (0.0%) |
| 1 or 2 Children | 60 (100.0%) | 0 (0.0%) |
| 3 or 4 Children | 0 (0.0%) | 0 (0.0%) |
| 5 or more Children | 0 (0.0%) | 0 (0.0%) |
| Total | 108 (100.0%) | 0 (0.0%) |
Income Below Poverty Among Single-Parent Households in Appling
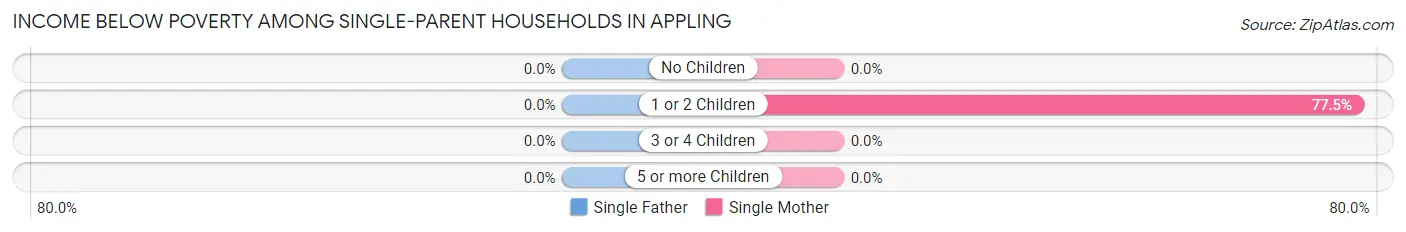
| Children | Single Father | Single Mother |
| No Children | 0 (0.0%) | 0 (0.0%) |
| 1 or 2 Children | 0 (0.0%) | 31 (77.5%) |
| 3 or 4 Children | 0 (0.0%) | 0 (0.0%) |
| 5 or more Children | 0 (0.0%) | 0 (0.0%) |
| Total | 0 (0.0%) | 31 (77.5%) |
Income Below Poverty Among Married-Couple vs Single-Parent Households in Appling
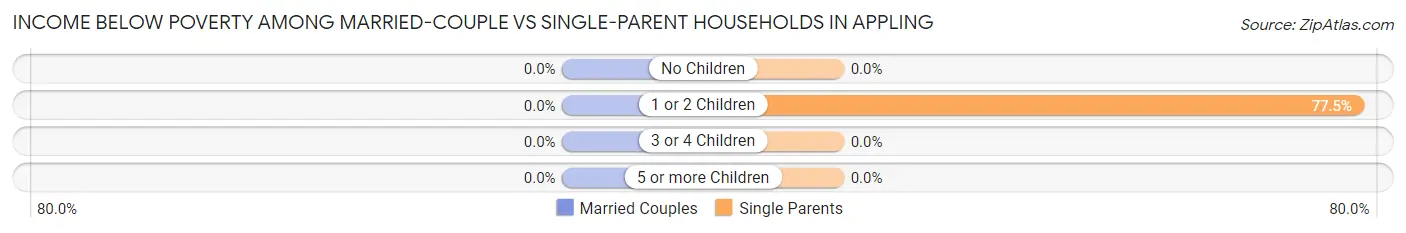
| Children | Married-Couple Families | Single-Parent Households |
| No Children | 0 (0.0%) | 0 (0.0%) |
| 1 or 2 Children | 0 (0.0%) | 31 (77.5%) |
| 3 or 4 Children | 0 (0.0%) | 0 (0.0%) |
| 5 or more Children | 0 (0.0%) | 0 (0.0%) |
| Total | 0 (0.0%) | 31 (77.5%) |
Race in Appling
The most populous races in Appling are White / Caucasian (557 | 79.5%), Black / African American (104 | 14.8%), and Two or more Races (40 | 5.7%).
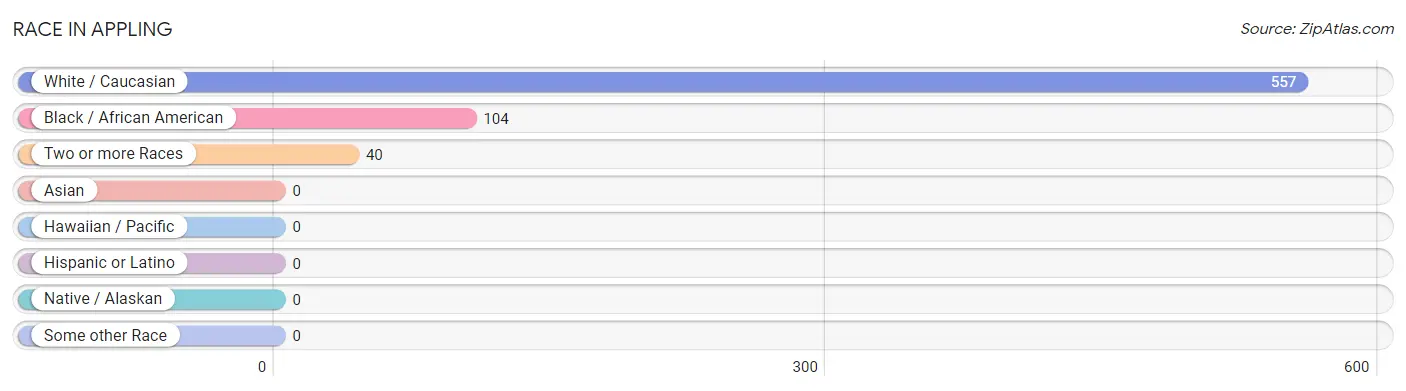
| Race | # Population | % Population |
| Asian | 0 | 0.0% |
| Black / African American | 104 | 14.8% |
| Hawaiian / Pacific | 0 | 0.0% |
| Hispanic or Latino | 0 | 0.0% |
| Native / Alaskan | 0 | 0.0% |
| White / Caucasian | 557 | 79.5% |
| Two or more Races | 40 | 5.7% |
| Some other Race | 0 | 0.0% |
| Total | 701 | 100.0% |
Ancestry in Appling
The most populous ancestries reported in Appling are European (107 | 15.3%), American (76 | 10.8%), and English (25 | 3.6%), together accounting for 29.7% of all Appling residents.
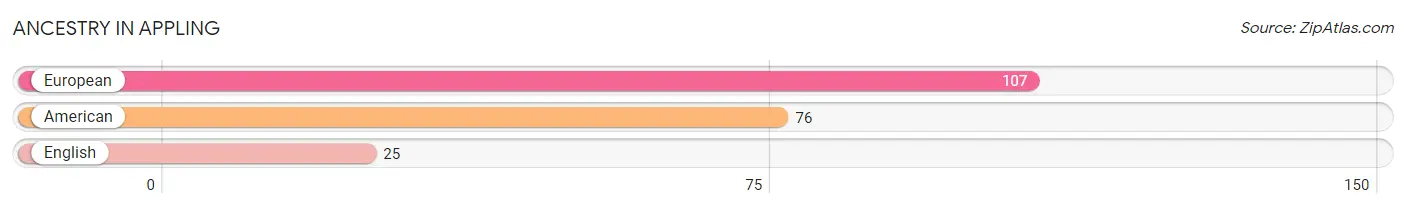
| Ancestry | # Population | % Population |
| American | 76 | 10.8% |
| English | 25 | 3.6% |
| European | 107 | 15.3% | View All 3 Rows |
Immigrants in Appling

| Immigration Origin | # Population | % Population | View All 0 Rows |
Sex and Age in Appling
Sex and Age in Appling
The most populous age groups in Appling are 5 to 9 Years (107 | 20.9%) for men and 35 to 39 Years (83 | 44.2%) for women.
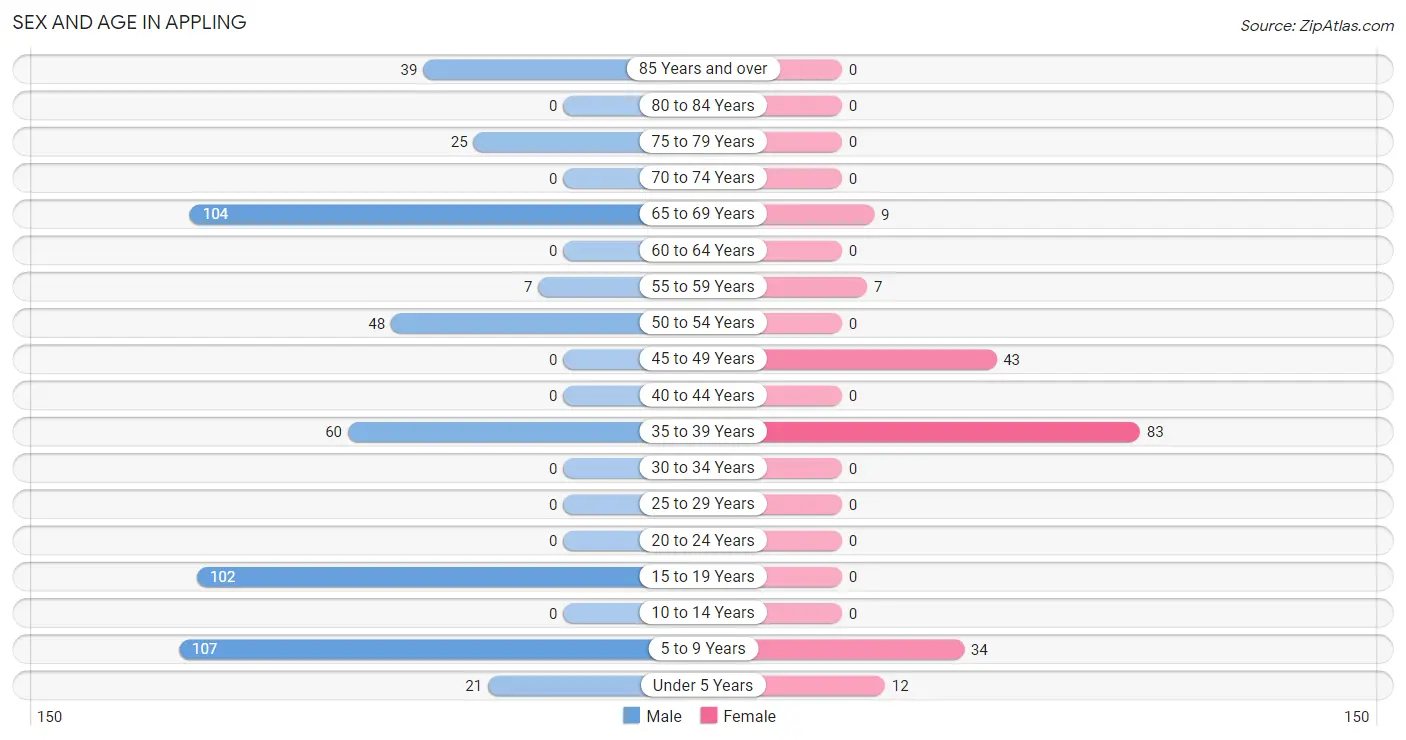
| Age Bracket | Male | Female |
| Under 5 Years | 21 (4.1%) | 12 (6.4%) |
| 5 to 9 Years | 107 (20.9%) | 34 (18.1%) |
| 10 to 14 Years | 0 (0.0%) | 0 (0.0%) |
| 15 to 19 Years | 102 (19.9%) | 0 (0.0%) |
| 20 to 24 Years | 0 (0.0%) | 0 (0.0%) |
| 25 to 29 Years | 0 (0.0%) | 0 (0.0%) |
| 30 to 34 Years | 0 (0.0%) | 0 (0.0%) |
| 35 to 39 Years | 60 (11.7%) | 83 (44.2%) |
| 40 to 44 Years | 0 (0.0%) | 0 (0.0%) |
| 45 to 49 Years | 0 (0.0%) | 43 (22.9%) |
| 50 to 54 Years | 48 (9.4%) | 0 (0.0%) |
| 55 to 59 Years | 7 (1.4%) | 7 (3.7%) |
| 60 to 64 Years | 0 (0.0%) | 0 (0.0%) |
| 65 to 69 Years | 104 (20.3%) | 9 (4.8%) |
| 70 to 74 Years | 0 (0.0%) | 0 (0.0%) |
| 75 to 79 Years | 25 (4.9%) | 0 (0.0%) |
| 80 to 84 Years | 0 (0.0%) | 0 (0.0%) |
| 85 Years and over | 39 (7.6%) | 0 (0.0%) |
| Total | 513 (100.0%) | 188 (100.0%) |
Families and Households in Appling
Median Family Size in Appling
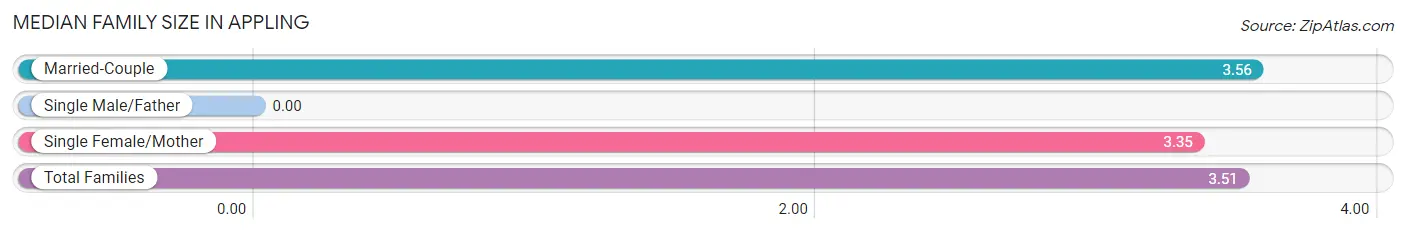
| Family Type | # Families | Family Size |
| Married-Couple | 108 (73.0%) | 3.56 |
| Single Male/Father | 0 (0.0%) | - |
| Single Female/Mother | 40 (27.0%) | 3.35 |
| Total Families | 148 (100.0%) | 3.51 |
Median Household Size in Appling
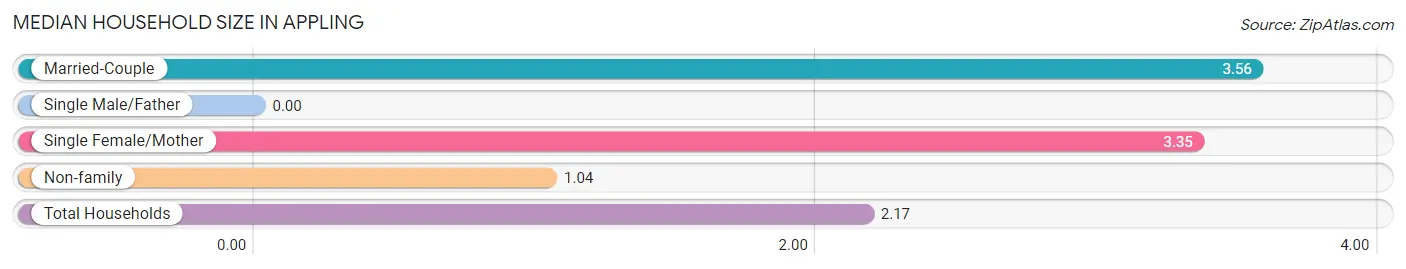
| Household Type | # Households | Household Size |
| Married-Couple | 108 (33.4%) | 3.56 |
| Single Male/Father | 0 (0.0%) | - |
| Single Female/Mother | 40 (12.4%) | 3.35 |
| Non-family | 175 (54.2%) | 1.04 |
| Total Households | 323 (100.0%) | 2.17 |
Household Size by Marriage Status in Appling
Out of a total of 323 households in Appling, 148 (45.8%) are family households, while 175 (54.2%) are nonfamily households. The most numerous type of family households are 3-person households, comprising 79, and the most common type of nonfamily households are 1-person households, comprising 168.
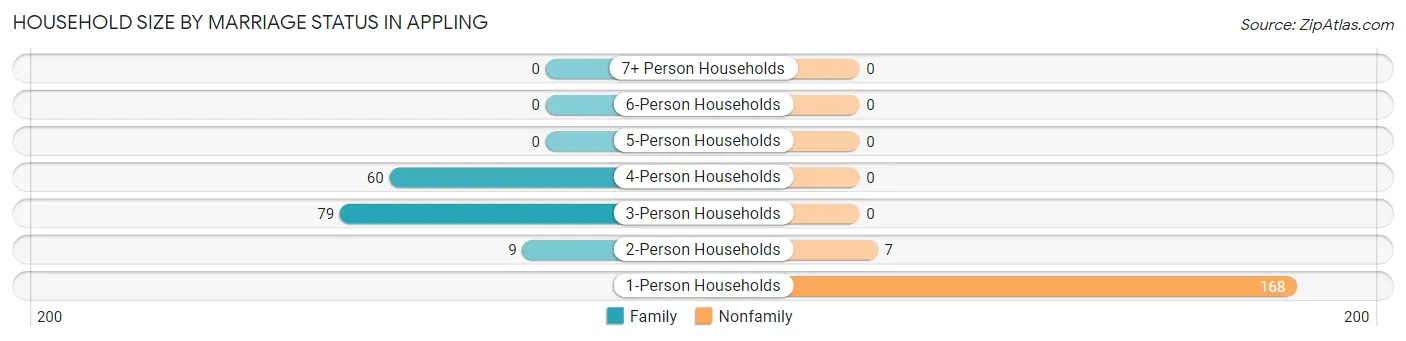
| Household Size | Family Households | Nonfamily Households |
| 1-Person Households | - | 168 (52.0%) |
| 2-Person Households | 9 (2.8%) | 7 (2.2%) |
| 3-Person Households | 79 (24.5%) | 0 (0.0%) |
| 4-Person Households | 60 (18.6%) | 0 (0.0%) |
| 5-Person Households | 0 (0.0%) | 0 (0.0%) |
| 6-Person Households | 0 (0.0%) | 0 (0.0%) |
| 7+ Person Households | 0 (0.0%) | 0 (0.0%) |
| Total | 148 (45.8%) | 175 (54.2%) |
Female Fertility in Appling
Fertility by Age in Appling
| Age Bracket | Women with Births | Births / 1,000 Women |
| 15 to 19 years | 0 (0.0%) | 0.0 |
| 20 to 34 years | 0 (0.0%) | 0.0 |
| 35 to 50 years | 0 (0.0%) | 0.0 |
| Total | 0 (0.0%) | 0.0 |
Fertility by Age by Marriage Status in Appling
| Age Bracket | Married | Unmarried |
| 15 to 19 years | 0 (0.0%) | 0 (0.0%) |
| 20 to 34 years | 0 (0.0%) | 0 (0.0%) |
| 35 to 50 years | 0 (0.0%) | 0 (0.0%) |
| Total | 0 (0.0%) | 0 (0.0%) |
Fertility by Education in Appling
| Educational Attainment | Women with Births | Births / 1,000 Women |
| Less than High School | 0 (0.0%) | 0.0 |
| High School Diploma | 0 (0.0%) | 0.0 |
| College or Associate's Degree | 0 (0.0%) | 0.0 |
| Bachelor's Degree | 0 (0.0%) | 0.0 |
| Graduate Degree | 0 (0.0%) | 0.0 |
| Total | 0 (0.0%) | 0.0 |
Fertility by Education by Marriage Status in Appling
| Educational Attainment | Married | Unmarried |
| Less than High School | 0 (0.0%) | 0 (0.0%) |
| High School Diploma | 0 (0.0%) | 0 (0.0%) |
| College or Associate's Degree | 0 (0.0%) | 0 (0.0%) |
| Bachelor's Degree | 0 (0.0%) | 0 (0.0%) |
| Graduate Degree | 0 (0.0%) | 0 (0.0%) |
| Total | 0 (0.0%) | 0 (0.0%) |
Employment Characteristics in Appling
Employment by Class of Employer in Appling
Among the 230 employed individuals in Appling, private company employees (170 | 73.9%), local government employees (37 | 16.1%), and self-employed (incorporated) (23 | 10.0%) make up the most common classes of employment.
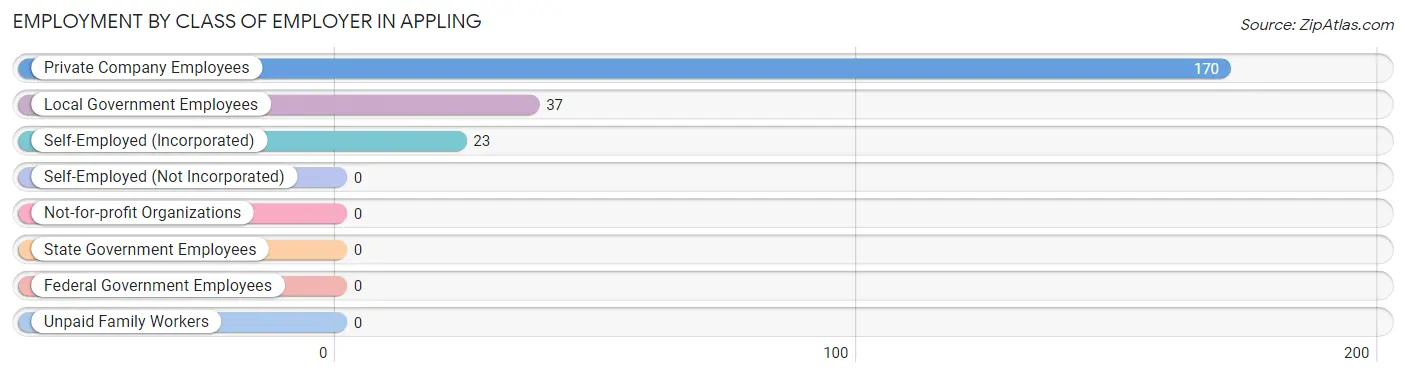
| Employer Class | # Employees | % Employees |
| Private Company Employees | 170 | 73.9% |
| Self-Employed (Incorporated) | 23 | 10.0% |
| Self-Employed (Not Incorporated) | 0 | 0.0% |
| Not-for-profit Organizations | 0 | 0.0% |
| Local Government Employees | 37 | 16.1% |
| State Government Employees | 0 | 0.0% |
| Federal Government Employees | 0 | 0.0% |
| Unpaid Family Workers | 0 | 0.0% |
| Total | 230 | 100.0% |
Employment Status by Age in Appling
According to the labor force statistics for Appling, out of the total population over 16 years of age (527), 51.6% or 272 individuals are in the labor force, with 15.4% or 42 of them unemployed. The age group with the highest labor force participation rate is 45 to 54 years, with 100.0% or 91 individuals in the labor force. Within the labor force, the 16 to 19 years age range has the highest percentage of unemployed individuals, with 100.0% or 42 of them being unemployed.
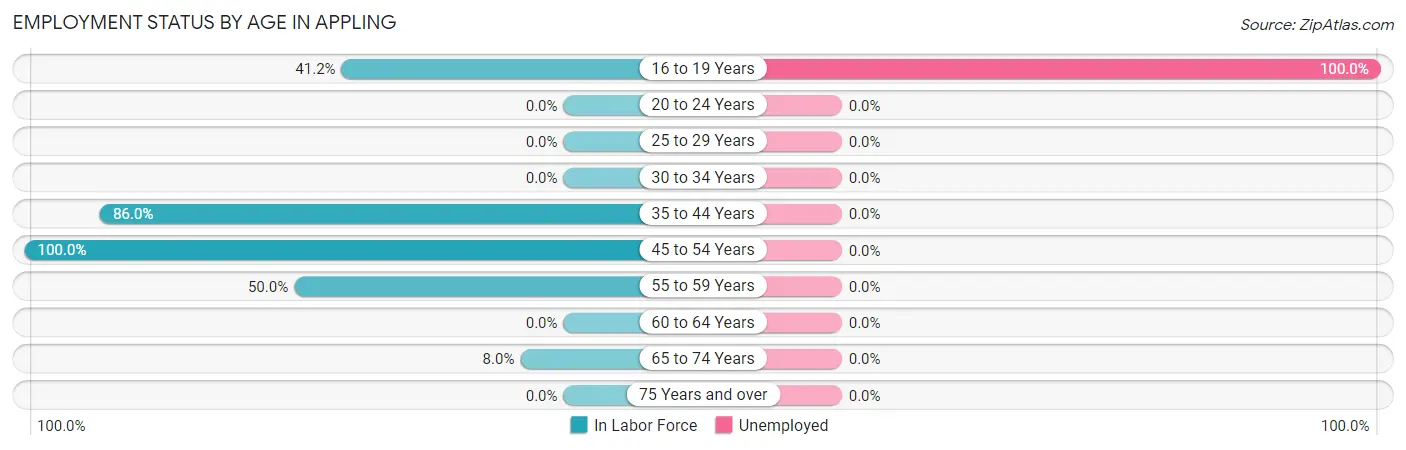
| Age Bracket | In Labor Force | Unemployed |
| 16 to 19 Years | 42 (41.2%) | 42 (100.0%) |
| 20 to 24 Years | 0 (0.0%) | 0 (0.0%) |
| 25 to 29 Years | 0 (0.0%) | 0 (0.0%) |
| 30 to 34 Years | 0 (0.0%) | 0 (0.0%) |
| 35 to 44 Years | 123 (86.0%) | 0 (0.0%) |
| 45 to 54 Years | 91 (100.0%) | 0 (0.0%) |
| 55 to 59 Years | 7 (50.0%) | 0 (0.0%) |
| 60 to 64 Years | 0 (0.0%) | 0 (0.0%) |
| 65 to 74 Years | 9 (8.0%) | 0 (0.0%) |
| 75 Years and over | 0 (0.0%) | 0 (0.0%) |
| Total | 272 (51.6%) | 42 (15.4%) |
Employment Status by Educational Attainment in Appling
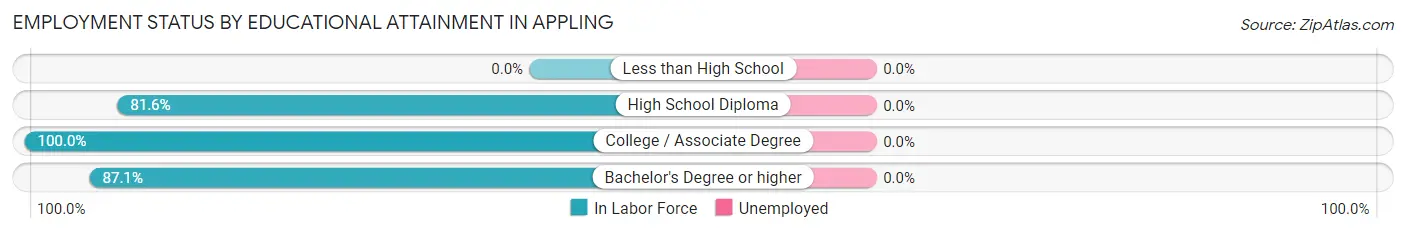
| Educational Attainment | In Labor Force | Unemployed |
| Less than High School | 0 (0.0%) | 0 (0.0%) |
| High School Diploma | 31 (81.6%) | 0 (0.0%) |
| College / Associate Degree | 55 (100.0%) | 0 (0.0%) |
| Bachelor's Degree or higher | 135 (87.1%) | 0 (0.0%) |
| Total | 221 (89.1%) | 0 (0.0%) |
Employment Occupations by Sex in Appling
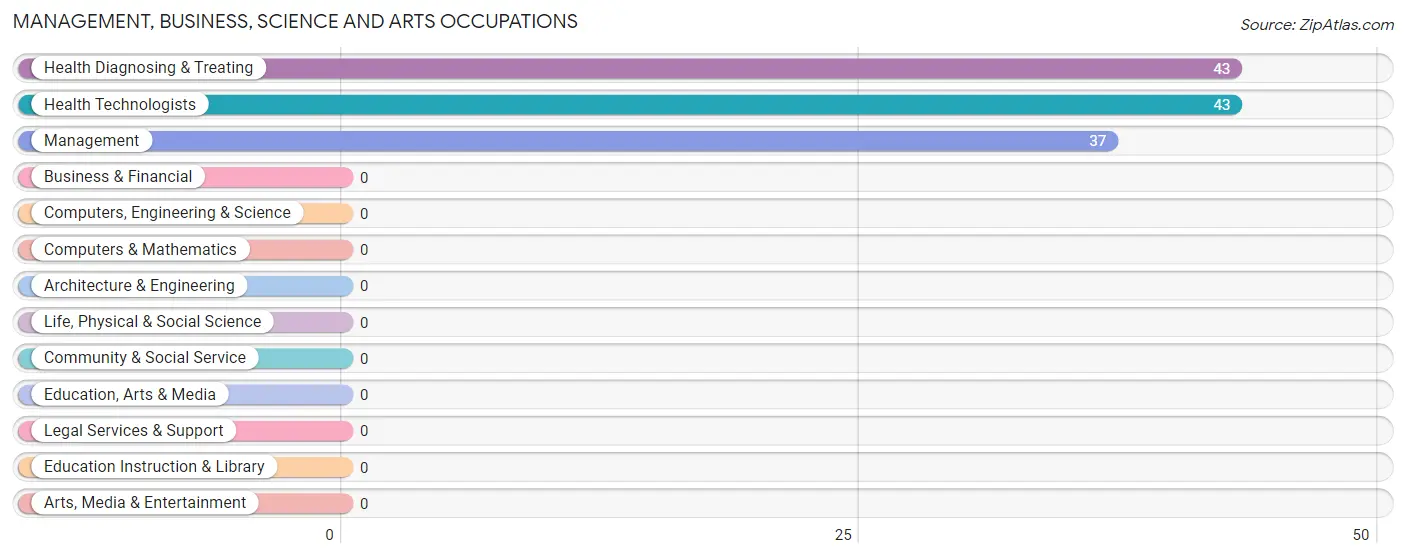
Management, Business, Science and Arts Occupations
The most common Management, Business, Science and Arts occupations in Appling are Health Diagnosing & Treating (43 | 18.7%), Health Technologists (43 | 18.7%), and Management (37 | 16.1%).
Management, Business, Science and Arts Occupations by Sex
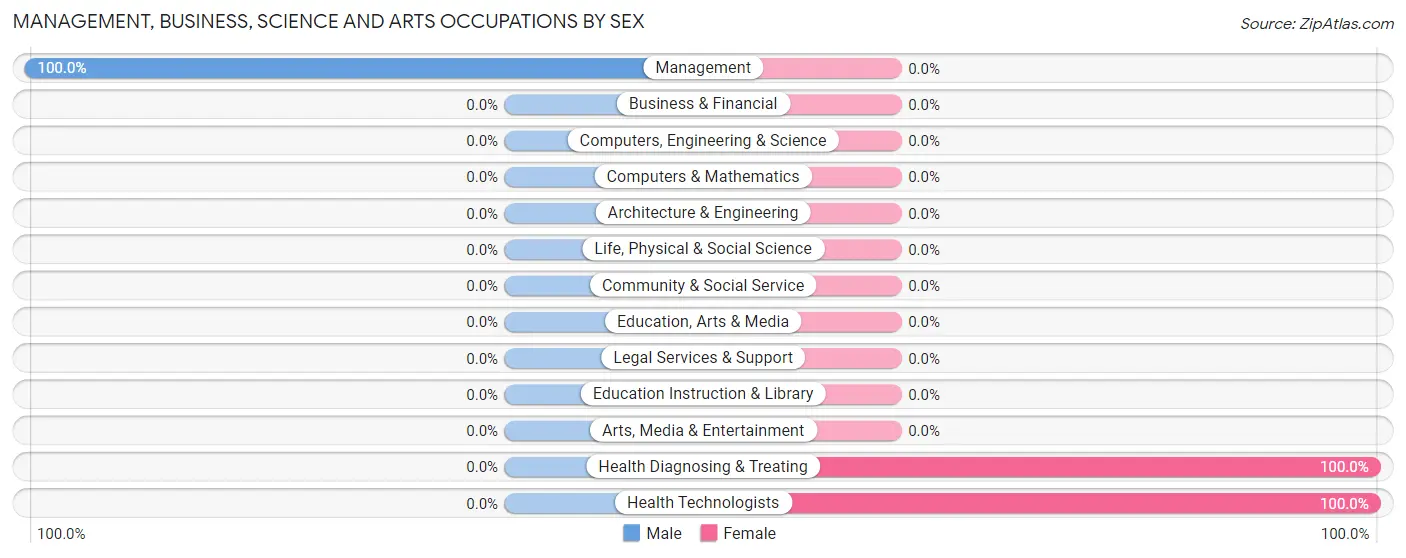
| Occupation | Male | Female |
| Management | 37 (100.0%) | 0 (0.0%) |
| Business & Financial | 0 (0.0%) | 0 (0.0%) |
| Computers, Engineering & Science | 0 (0.0%) | 0 (0.0%) |
| Computers & Mathematics | 0 (0.0%) | 0 (0.0%) |
| Architecture & Engineering | 0 (0.0%) | 0 (0.0%) |
| Life, Physical & Social Science | 0 (0.0%) | 0 (0.0%) |
| Community & Social Service | 0 (0.0%) | 0 (0.0%) |
| Education, Arts & Media | 0 (0.0%) | 0 (0.0%) |
| Legal Services & Support | 0 (0.0%) | 0 (0.0%) |
| Education Instruction & Library | 0 (0.0%) | 0 (0.0%) |
| Arts, Media & Entertainment | 0 (0.0%) | 0 (0.0%) |
| Health Diagnosing & Treating | 0 (0.0%) | 43 (100.0%) |
| Health Technologists | 0 (0.0%) | 43 (100.0%) |
| Total (Category) | 37 (46.3%) | 43 (53.7%) |
| Total (Overall) | 108 (47.0%) | 122 (53.0%) |
Services Occupations
Services Occupations by Sex
| Occupation | Male | Female |
| Healthcare Support | 0 (0.0%) | 0 (0.0%) |
| Security & Protection | 0 (0.0%) | 0 (0.0%) |
| Firefighting & Prevention | 0 (0.0%) | 0 (0.0%) |
| Law Enforcement | 0 (0.0%) | 0 (0.0%) |
| Food Preparation & Serving | 0 (0.0%) | 0 (0.0%) |
| Cleaning & Maintenance | 0 (0.0%) | 0 (0.0%) |
| Personal Care & Service | 0 (0.0%) | 0 (0.0%) |
| Total (Category) | 0 (0.0%) | 0 (0.0%) |
| Total (Overall) | 108 (47.0%) | 122 (53.0%) |
Sales and Office Occupations
The most common Sales and Office occupations in Appling are Office & Administration (40 | 17.4%), and Sales & Related (32 | 13.9%).
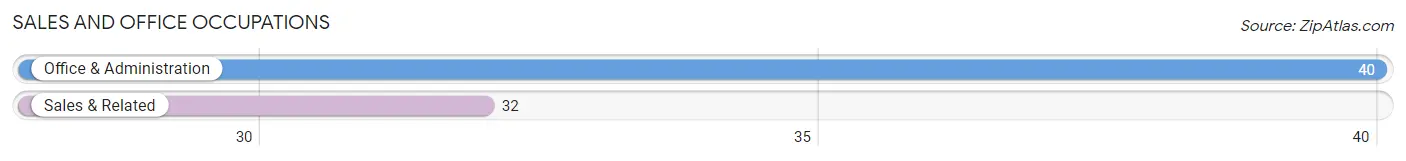
Sales and Office Occupations by Sex
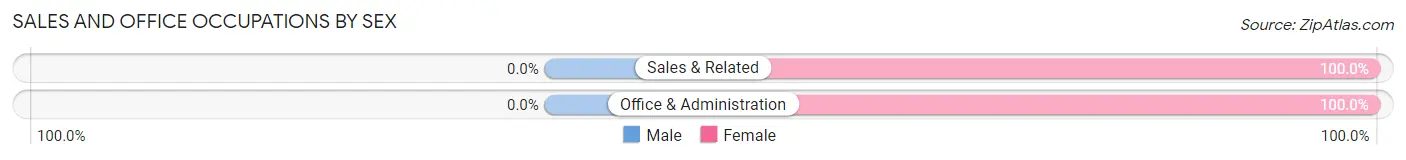
| Occupation | Male | Female |
| Sales & Related | 0 (0.0%) | 32 (100.0%) |
| Office & Administration | 0 (0.0%) | 40 (100.0%) |
| Total (Category) | 0 (0.0%) | 72 (100.0%) |
| Total (Overall) | 108 (47.0%) | 122 (53.0%) |
Natural Resources, Construction and Maintenance Occupations
The most common Natural Resources, Construction and Maintenance occupations in Appling are , and Construction & Extraction (23 | 10.0%).
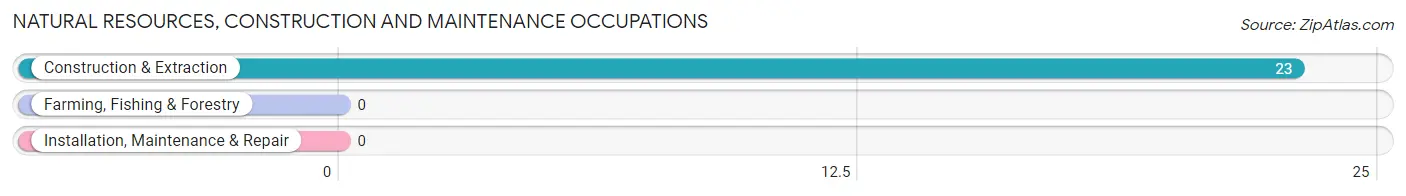
Natural Resources, Construction and Maintenance Occupations by Sex
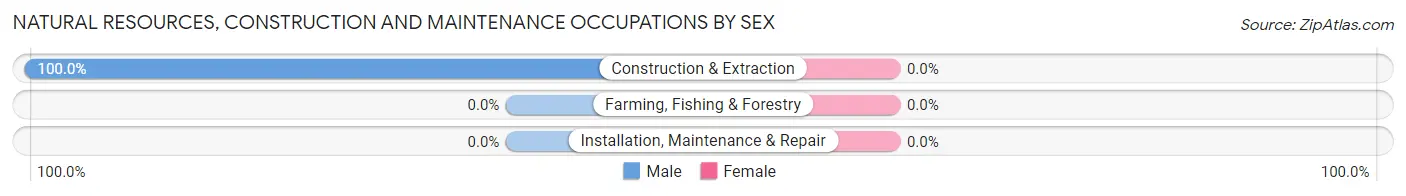
| Occupation | Male | Female |
| Farming, Fishing & Forestry | 0 (0.0%) | 0 (0.0%) |
| Construction & Extraction | 23 (100.0%) | 0 (0.0%) |
| Installation, Maintenance & Repair | 0 (0.0%) | 0 (0.0%) |
| Total (Category) | 23 (100.0%) | 0 (0.0%) |
| Total (Overall) | 108 (47.0%) | 122 (53.0%) |
Production, Transportation and Moving Occupations
The most common Production, Transportation and Moving occupations in Appling are Production (48 | 20.9%), and Material Moving (7 | 3.0%).
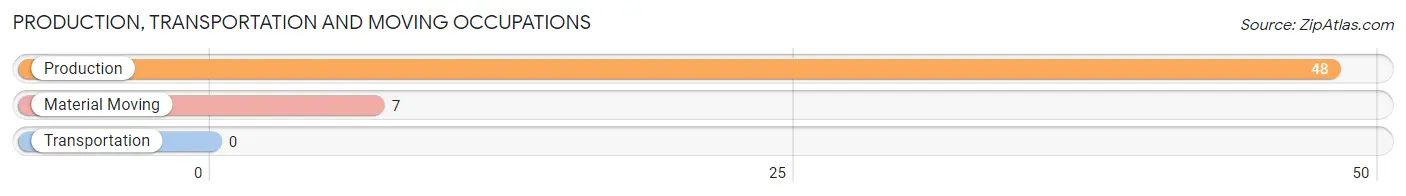
Production, Transportation and Moving Occupations by Sex
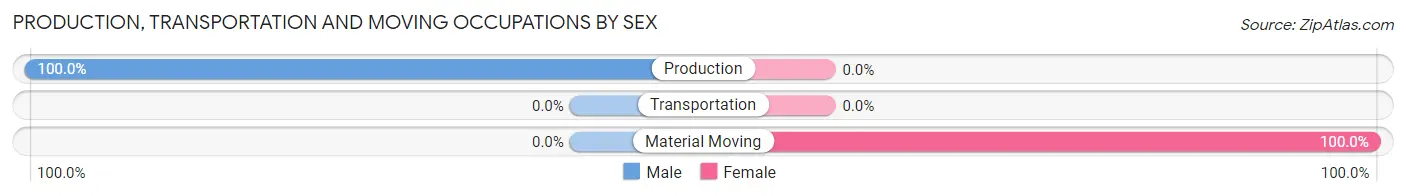
| Occupation | Male | Female |
| Production | 48 (100.0%) | 0 (0.0%) |
| Transportation | 0 (0.0%) | 0 (0.0%) |
| Material Moving | 0 (0.0%) | 7 (100.0%) |
| Total (Category) | 48 (87.3%) | 7 (12.7%) |
| Total (Overall) | 108 (47.0%) | 122 (53.0%) |
Employment Industries by Sex in Appling
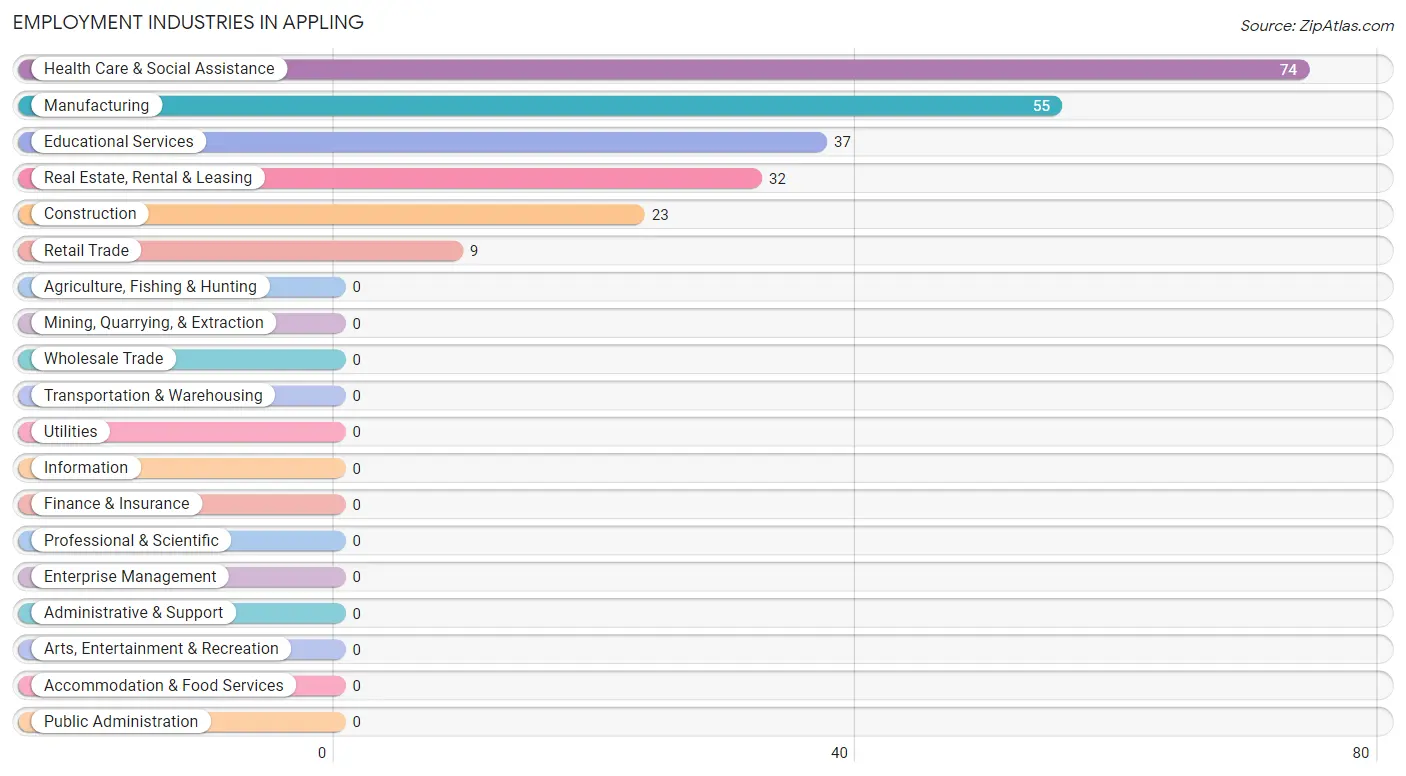
Employment Industries in Appling
The major employment industries in Appling include Health Care & Social Assistance (74 | 32.2%), Manufacturing (55 | 23.9%), Educational Services (37 | 16.1%), Real Estate, Rental & Leasing (32 | 13.9%), and Construction (23 | 10.0%).
Employment Industries by Sex in Appling
The Appling industries that see more men than women are Construction (100.0%), Educational Services (100.0%), and Manufacturing (87.3%), whereas the industries that tend to have a higher number of women are Retail Trade (100.0%), Real Estate, Rental & Leasing (100.0%), and Health Care & Social Assistance (100.0%).
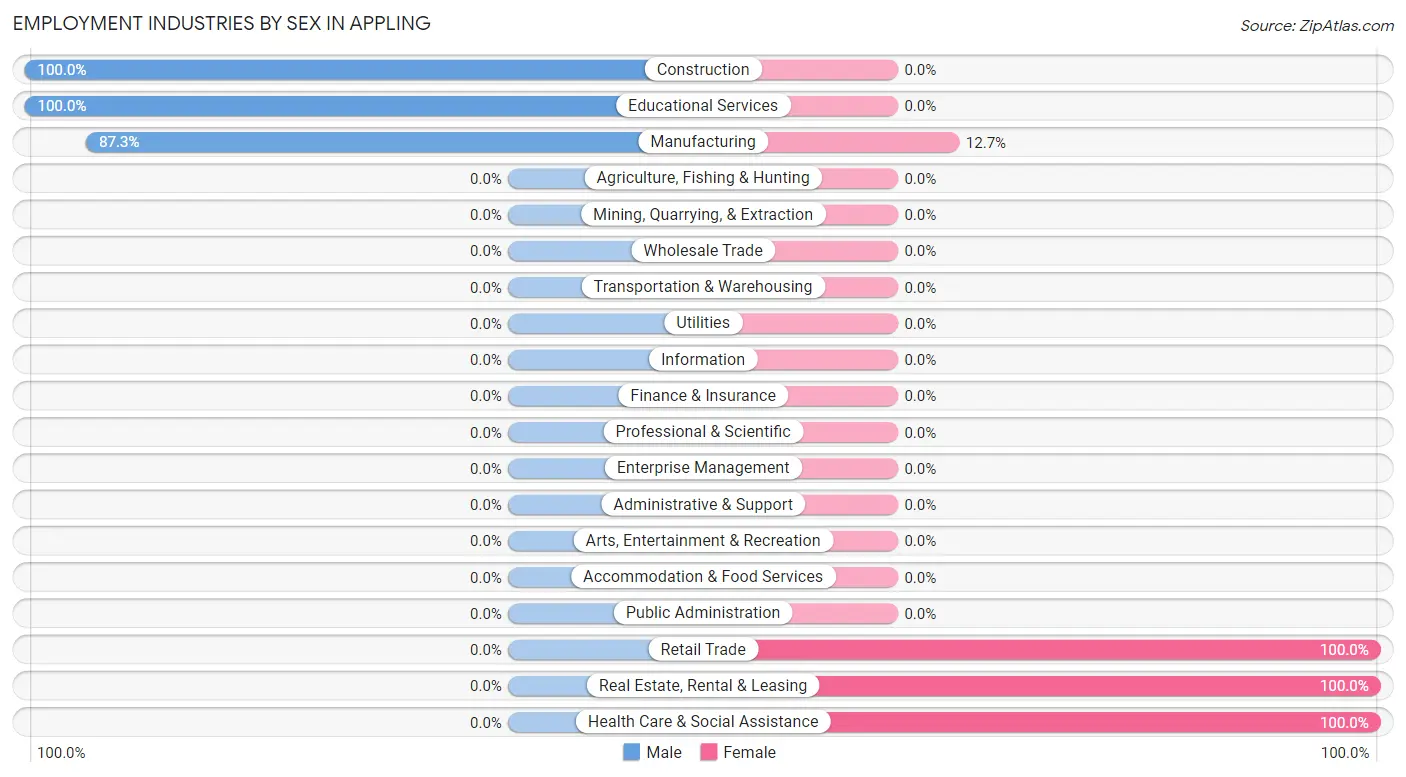
| Industry | Male | Female |
| Agriculture, Fishing & Hunting | 0 (0.0%) | 0 (0.0%) |
| Mining, Quarrying, & Extraction | 0 (0.0%) | 0 (0.0%) |
| Construction | 23 (100.0%) | 0 (0.0%) |
| Manufacturing | 48 (87.3%) | 7 (12.7%) |
| Wholesale Trade | 0 (0.0%) | 0 (0.0%) |
| Retail Trade | 0 (0.0%) | 9 (100.0%) |
| Transportation & Warehousing | 0 (0.0%) | 0 (0.0%) |
| Utilities | 0 (0.0%) | 0 (0.0%) |
| Information | 0 (0.0%) | 0 (0.0%) |
| Finance & Insurance | 0 (0.0%) | 0 (0.0%) |
| Real Estate, Rental & Leasing | 0 (0.0%) | 32 (100.0%) |
| Professional & Scientific | 0 (0.0%) | 0 (0.0%) |
| Enterprise Management | 0 (0.0%) | 0 (0.0%) |
| Administrative & Support | 0 (0.0%) | 0 (0.0%) |
| Educational Services | 37 (100.0%) | 0 (0.0%) |
| Health Care & Social Assistance | 0 (0.0%) | 74 (100.0%) |
| Arts, Entertainment & Recreation | 0 (0.0%) | 0 (0.0%) |
| Accommodation & Food Services | 0 (0.0%) | 0 (0.0%) |
| Public Administration | 0 (0.0%) | 0 (0.0%) |
| Total | 108 (47.0%) | 122 (53.0%) |
Education in Appling
School Enrollment in Appling
The most common levels of schooling among the 241 students in Appling are elementary school (107 | 44.4%), high school (67 | 27.8%), and kindergarten (34 | 14.1%).
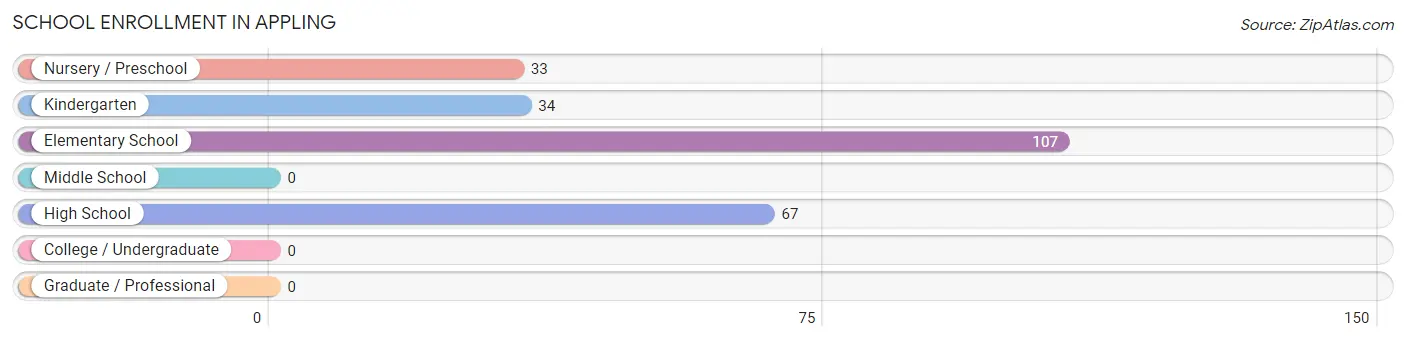
| School Level | # Students | % Students |
| Nursery / Preschool | 33 | 13.7% |
| Kindergarten | 34 | 14.1% |
| Elementary School | 107 | 44.4% |
| Middle School | 0 | 0.0% |
| High School | 67 | 27.8% |
| College / Undergraduate | 0 | 0.0% |
| Graduate / Professional | 0 | 0.0% |
| Total | 241 | 100.0% |
School Enrollment by Age by Funding Source in Appling
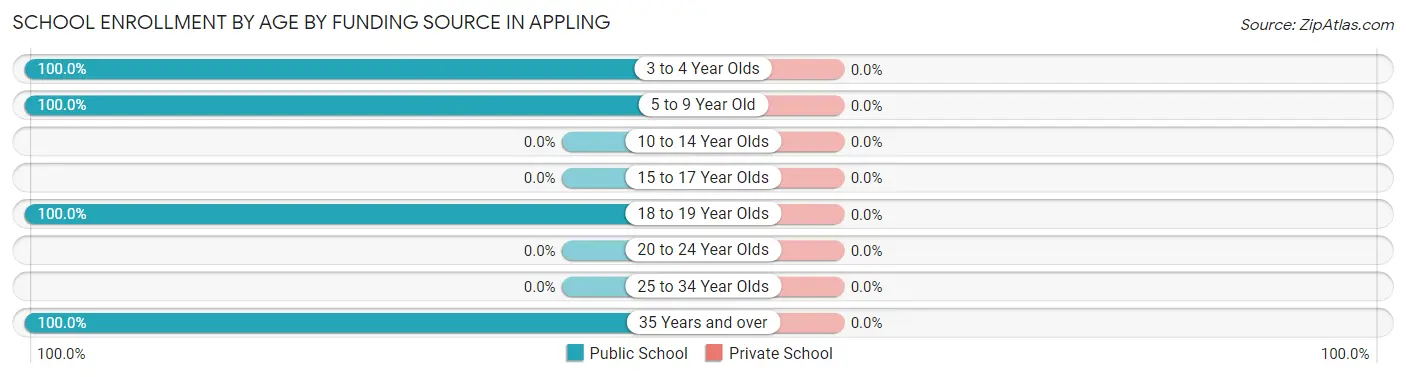
| Age Bracket | Public School | Private School |
| 3 to 4 Year Olds | 33 (100.0%) | 0 (0.0%) |
| 5 to 9 Year Old | 141 (100.0%) | 0 (0.0%) |
| 10 to 14 Year Olds | 0 (0.0%) | 0 (0.0%) |
| 15 to 17 Year Olds | 0 (0.0%) | 0 (0.0%) |
| 18 to 19 Year Olds | 60 (100.0%) | 0 (0.0%) |
| 20 to 24 Year Olds | 0 (0.0%) | 0 (0.0%) |
| 25 to 34 Year Olds | 0 (0.0%) | 0 (0.0%) |
| 35 Years and over | 7 (100.0%) | 0 (0.0%) |
| Total | 241 (100.0%) | 0 (0.0%) |
Educational Attainment by Field of Study in Appling
Science & technology (43 | 27.7%), business (43 | 27.7%), education (37 | 23.9%), and arts & humanities (32 | 20.6%) are the most common fields of study among 155 individuals in Appling who have obtained a bachelor's degree or higher.
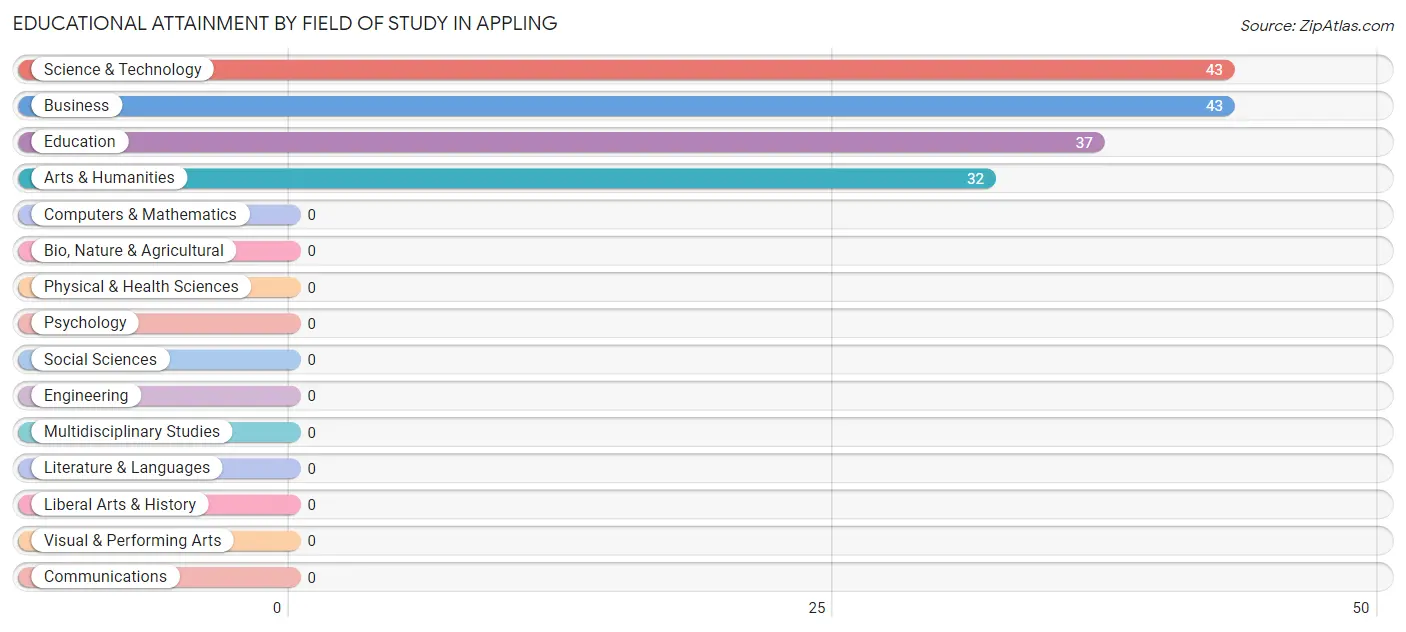
| Field of Study | # Graduates | % Graduates |
| Computers & Mathematics | 0 | 0.0% |
| Bio, Nature & Agricultural | 0 | 0.0% |
| Physical & Health Sciences | 0 | 0.0% |
| Psychology | 0 | 0.0% |
| Social Sciences | 0 | 0.0% |
| Engineering | 0 | 0.0% |
| Multidisciplinary Studies | 0 | 0.0% |
| Science & Technology | 43 | 27.7% |
| Business | 43 | 27.7% |
| Education | 37 | 23.9% |
| Literature & Languages | 0 | 0.0% |
| Liberal Arts & History | 0 | 0.0% |
| Visual & Performing Arts | 0 | 0.0% |
| Communications | 0 | 0.0% |
| Arts & Humanities | 32 | 20.6% |
| Total | 155 | 100.0% |
Transportation & Commute in Appling
Vehicle Availability by Sex in Appling
The most prevalent vehicle ownership categories in Appling are males with 2 vehicles (60, accounting for 55.6%) and females with 2 vehicles (63, making up 49.2%).
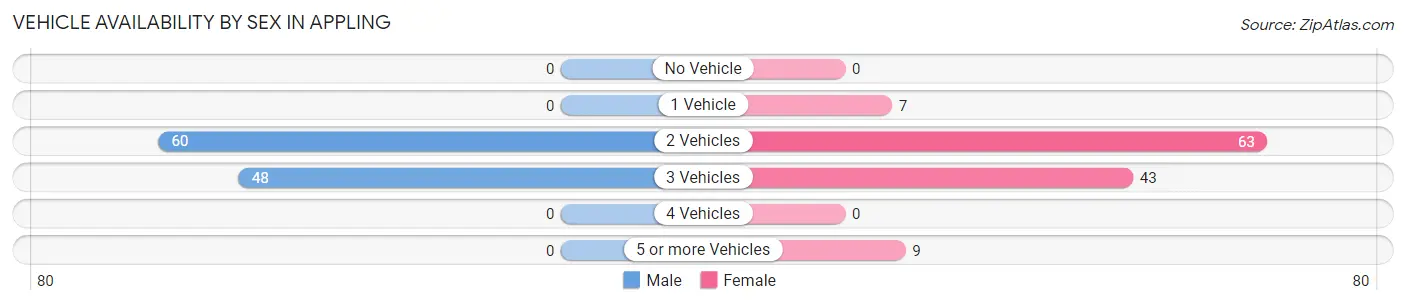
| Vehicles Available | Male | Female |
| No Vehicle | 0 (0.0%) | 0 (0.0%) |
| 1 Vehicle | 0 (0.0%) | 7 (5.7%) |
| 2 Vehicles | 60 (55.6%) | 63 (51.6%) |
| 3 Vehicles | 48 (44.4%) | 43 (35.2%) |
| 4 Vehicles | 0 (0.0%) | 0 (0.0%) |
| 5 or more Vehicles | 0 (0.0%) | 9 (7.4%) |
| Total | 108 (100.0%) | 122 (100.0%) |
Commute Time in Appling
The most frequently occuring commute durations in Appling are 20 to 24 minutes (74 commuters, 32.2%), 15 to 19 minutes (69 commuters, 30.0%), and 45 to 59 minutes (48 commuters, 20.9%).
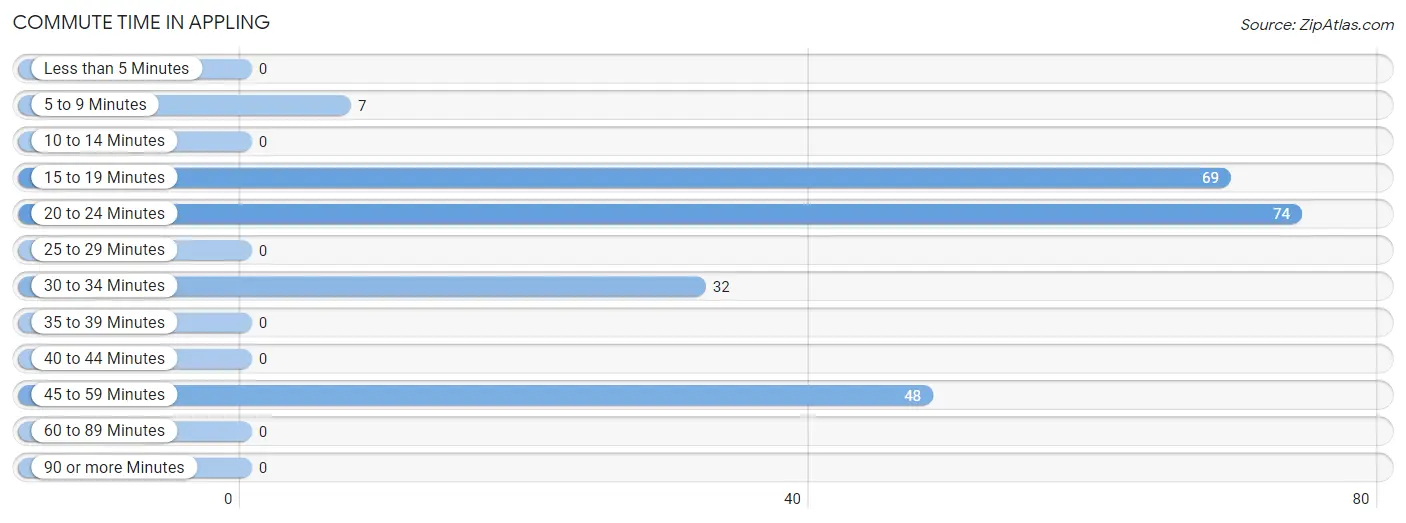
| Commute Time | # Commuters | % Commuters |
| Less than 5 Minutes | 0 | 0.0% |
| 5 to 9 Minutes | 7 | 3.0% |
| 10 to 14 Minutes | 0 | 0.0% |
| 15 to 19 Minutes | 69 | 30.0% |
| 20 to 24 Minutes | 74 | 32.2% |
| 25 to 29 Minutes | 0 | 0.0% |
| 30 to 34 Minutes | 32 | 13.9% |
| 35 to 39 Minutes | 0 | 0.0% |
| 40 to 44 Minutes | 0 | 0.0% |
| 45 to 59 Minutes | 48 | 20.9% |
| 60 to 89 Minutes | 0 | 0.0% |
| 90 or more Minutes | 0 | 0.0% |
Commute Time by Sex in Appling
The most common commute times in Appling are 45 to 59 minutes (48 commuters, 44.4%) for males and 20 to 24 minutes (74 commuters, 60.7%) for females.
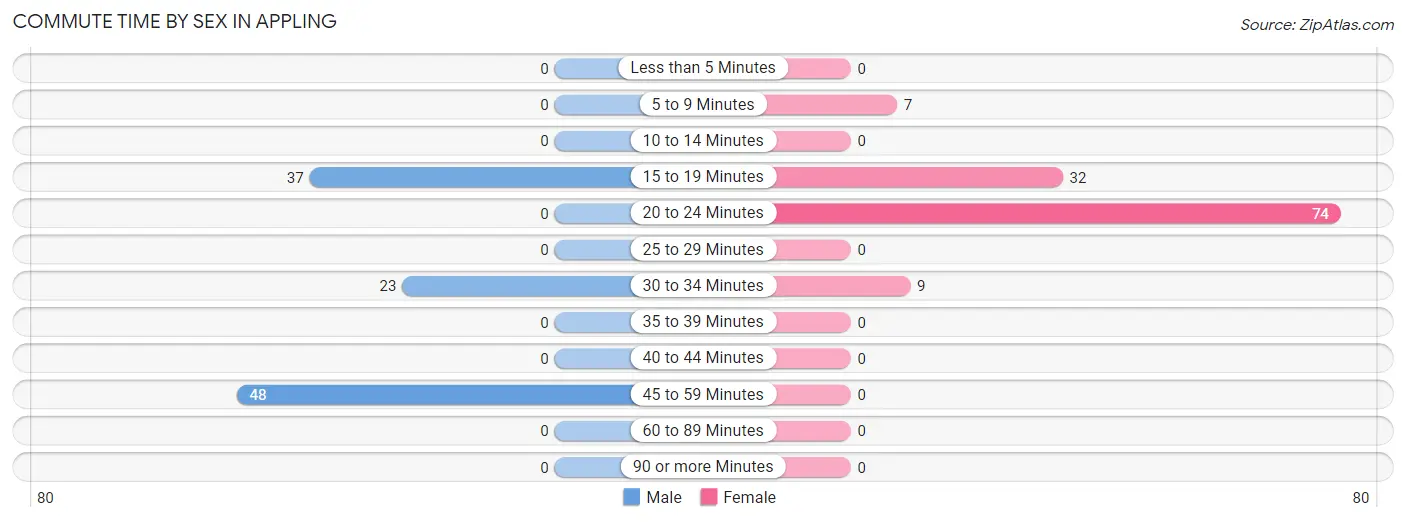
| Commute Time | Male | Female |
| Less than 5 Minutes | 0 (0.0%) | 0 (0.0%) |
| 5 to 9 Minutes | 0 (0.0%) | 7 (5.7%) |
| 10 to 14 Minutes | 0 (0.0%) | 0 (0.0%) |
| 15 to 19 Minutes | 37 (34.3%) | 32 (26.2%) |
| 20 to 24 Minutes | 0 (0.0%) | 74 (60.7%) |
| 25 to 29 Minutes | 0 (0.0%) | 0 (0.0%) |
| 30 to 34 Minutes | 23 (21.3%) | 9 (7.4%) |
| 35 to 39 Minutes | 0 (0.0%) | 0 (0.0%) |
| 40 to 44 Minutes | 0 (0.0%) | 0 (0.0%) |
| 45 to 59 Minutes | 48 (44.4%) | 0 (0.0%) |
| 60 to 89 Minutes | 0 (0.0%) | 0 (0.0%) |
| 90 or more Minutes | 0 (0.0%) | 0 (0.0%) |
Time of Departure to Work by Sex in Appling
The most frequent times of departure to work in Appling are 7:00 AM to 7:29 AM (48, 44.4%) for males and 7:30 AM to 7:59 AM (74, 60.7%) for females.
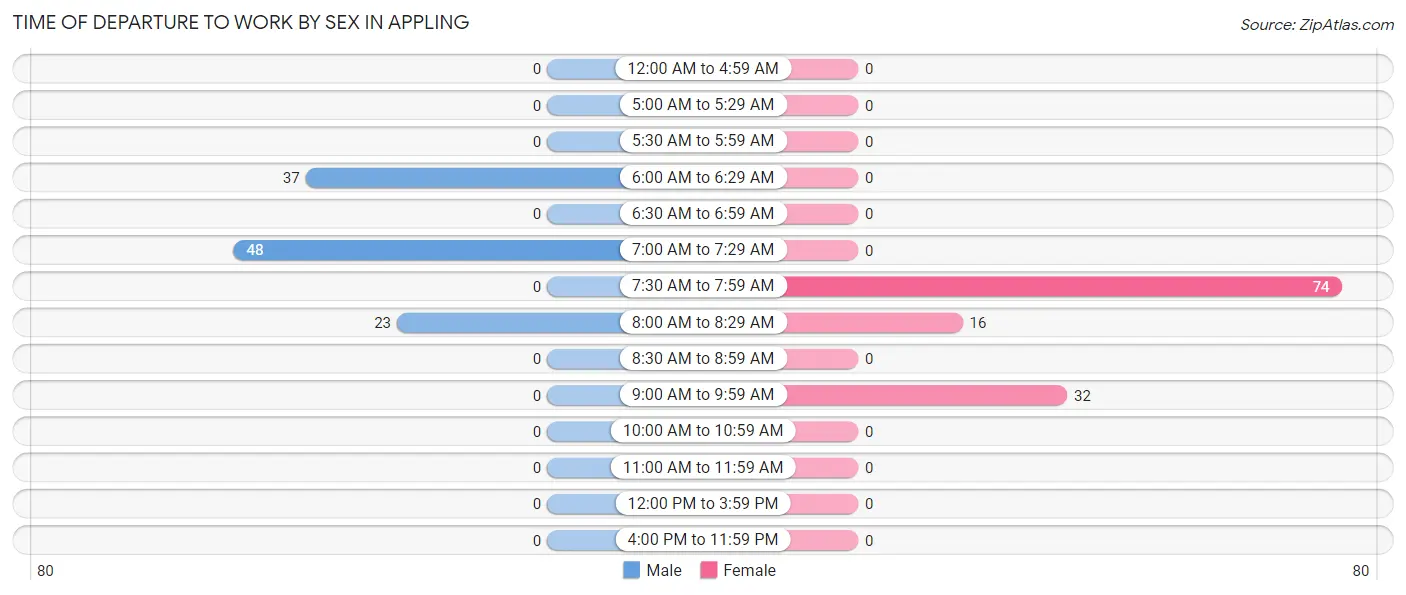
| Time of Departure | Male | Female |
| 12:00 AM to 4:59 AM | 0 (0.0%) | 0 (0.0%) |
| 5:00 AM to 5:29 AM | 0 (0.0%) | 0 (0.0%) |
| 5:30 AM to 5:59 AM | 0 (0.0%) | 0 (0.0%) |
| 6:00 AM to 6:29 AM | 37 (34.3%) | 0 (0.0%) |
| 6:30 AM to 6:59 AM | 0 (0.0%) | 0 (0.0%) |
| 7:00 AM to 7:29 AM | 48 (44.4%) | 0 (0.0%) |
| 7:30 AM to 7:59 AM | 0 (0.0%) | 74 (60.7%) |
| 8:00 AM to 8:29 AM | 23 (21.3%) | 16 (13.1%) |
| 8:30 AM to 8:59 AM | 0 (0.0%) | 0 (0.0%) |
| 9:00 AM to 9:59 AM | 0 (0.0%) | 32 (26.2%) |
| 10:00 AM to 10:59 AM | 0 (0.0%) | 0 (0.0%) |
| 11:00 AM to 11:59 AM | 0 (0.0%) | 0 (0.0%) |
| 12:00 PM to 3:59 PM | 0 (0.0%) | 0 (0.0%) |
| 4:00 PM to 11:59 PM | 0 (0.0%) | 0 (0.0%) |
| Total | 108 (100.0%) | 122 (100.0%) |
Housing Occupancy in Appling
Occupancy by Ownership in Appling
Of the total 323 dwellings in Appling, owner-occupied units account for 158 (48.9%), while renter-occupied units make up 165 (51.1%).
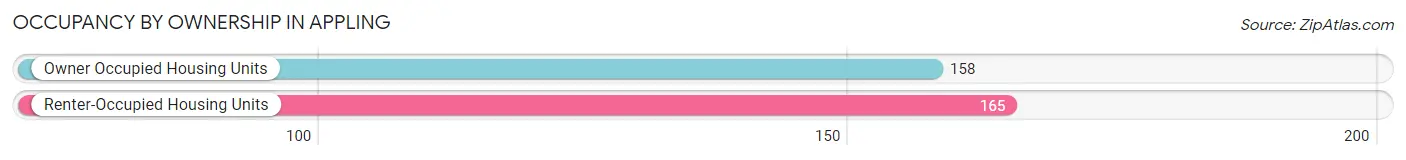
| Occupancy | # Housing Units | % Housing Units |
| Owner Occupied Housing Units | 158 | 48.9% |
| Renter-Occupied Housing Units | 165 | 51.1% |
| Total Occupied Housing Units | 323 | 100.0% |
Occupancy by Household Size in Appling
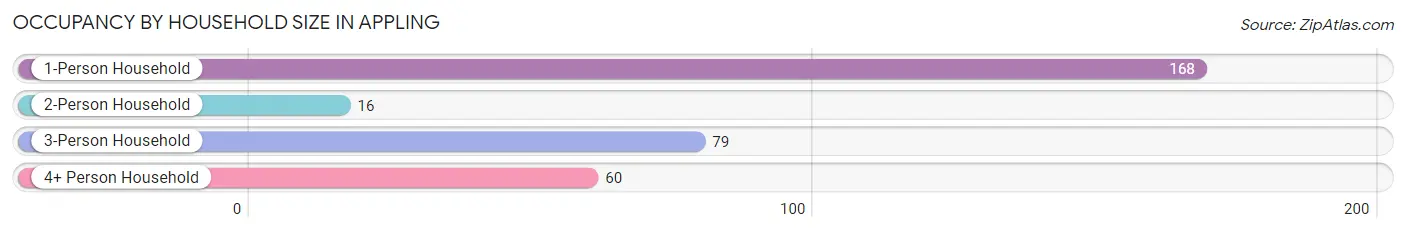
| Household Size | # Housing Units | % Housing Units |
| 1-Person Household | 168 | 52.0% |
| 2-Person Household | 16 | 5.0% |
| 3-Person Household | 79 | 24.5% |
| 4+ Person Household | 60 | 18.6% |
| Total Housing Units | 323 | 100.0% |
Occupancy by Ownership by Household Size in Appling
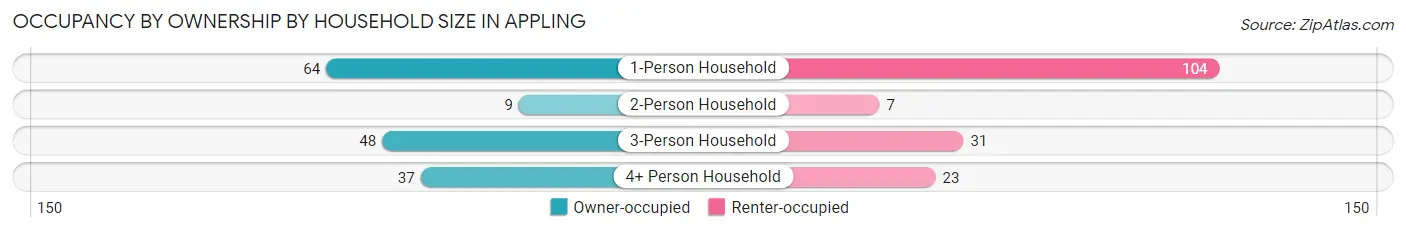
| Household Size | Owner-occupied | Renter-occupied |
| 1-Person Household | 64 (38.1%) | 104 (61.9%) |
| 2-Person Household | 9 (56.2%) | 7 (43.8%) |
| 3-Person Household | 48 (60.8%) | 31 (39.2%) |
| 4+ Person Household | 37 (61.7%) | 23 (38.3%) |
| Total Housing Units | 158 (48.9%) | 165 (51.1%) |
Occupancy by Educational Attainment in Appling
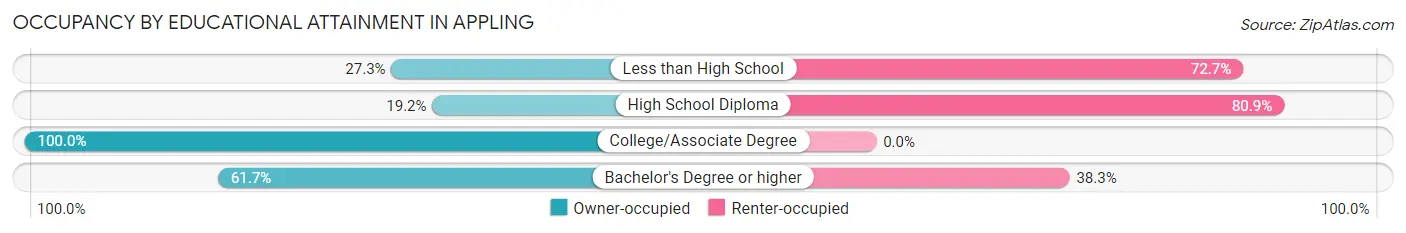
| Household Size | Owner-occupied | Renter-occupied |
| Less than High School | 39 (27.3%) | 104 (72.7%) |
| High School Diploma | 9 (19.2%) | 38 (80.8%) |
| College/Associate Degree | 73 (100.0%) | 0 (0.0%) |
| Bachelor's Degree or higher | 37 (61.7%) | 23 (38.3%) |
Occupancy by Age of Householder in Appling
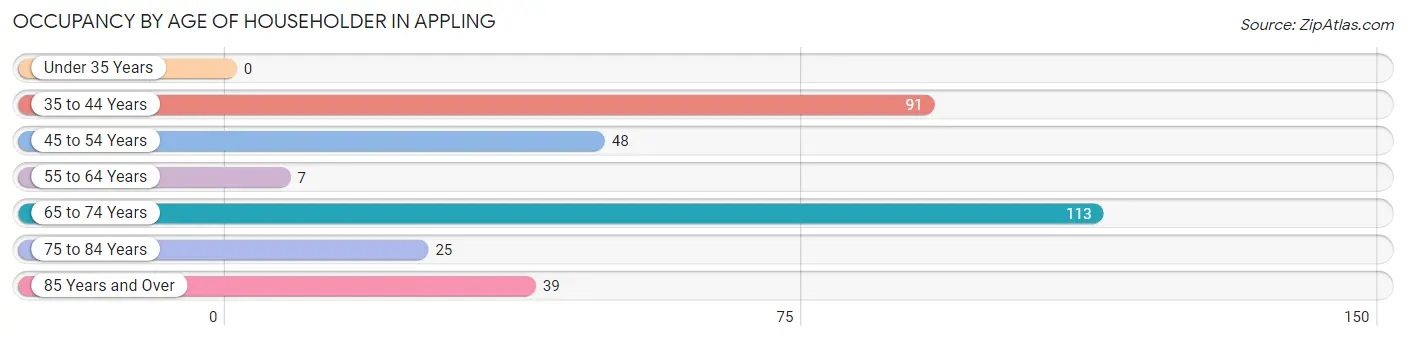
| Age Bracket | # Households | % Households |
| Under 35 Years | 0 | 0.0% |
| 35 to 44 Years | 91 | 28.2% |
| 45 to 54 Years | 48 | 14.9% |
| 55 to 64 Years | 7 | 2.2% |
| 65 to 74 Years | 113 | 35.0% |
| 75 to 84 Years | 25 | 7.7% |
| 85 Years and Over | 39 | 12.1% |
| Total | 323 | 100.0% |
Housing Finances in Appling
Median Income by Occupancy in Appling
| Occupancy Type | # Households | Median Income |
| Owner-Occupied | 158 (48.9%) | $0 |
| Renter-Occupied | 165 (51.1%) | $0 |
| Average | 323 (100.0%) | $0 |
Occupancy by Householder Income Bracket in Appling
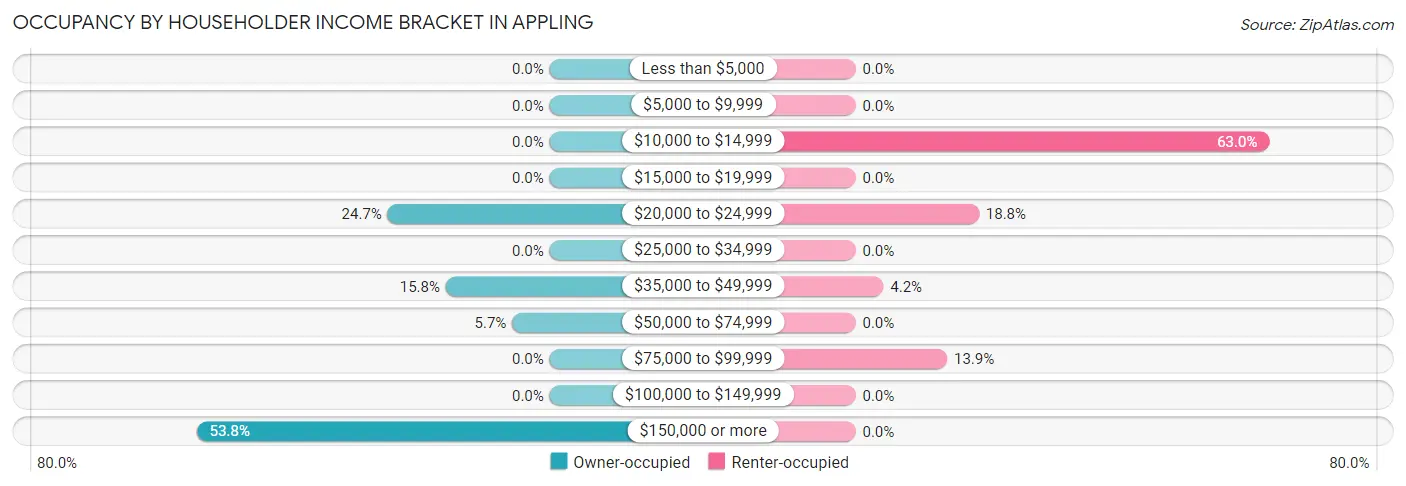
| Income Bracket | Owner-occupied | Renter-occupied |
| Less than $5,000 | 0 (0.0%) | 0 (0.0%) |
| $5,000 to $9,999 | 0 (0.0%) | 0 (0.0%) |
| $10,000 to $14,999 | 0 (0.0%) | 104 (63.0%) |
| $15,000 to $19,999 | 0 (0.0%) | 0 (0.0%) |
| $20,000 to $24,999 | 39 (24.7%) | 31 (18.8%) |
| $25,000 to $34,999 | 0 (0.0%) | 0 (0.0%) |
| $35,000 to $49,999 | 25 (15.8%) | 7 (4.2%) |
| $50,000 to $74,999 | 9 (5.7%) | 0 (0.0%) |
| $75,000 to $99,999 | 0 (0.0%) | 23 (13.9%) |
| $100,000 to $149,999 | 0 (0.0%) | 0 (0.0%) |
| $150,000 or more | 85 (53.8%) | 0 (0.0%) |
| Total | 158 (100.0%) | 165 (100.0%) |
Monthly Housing Cost Tiers in Appling
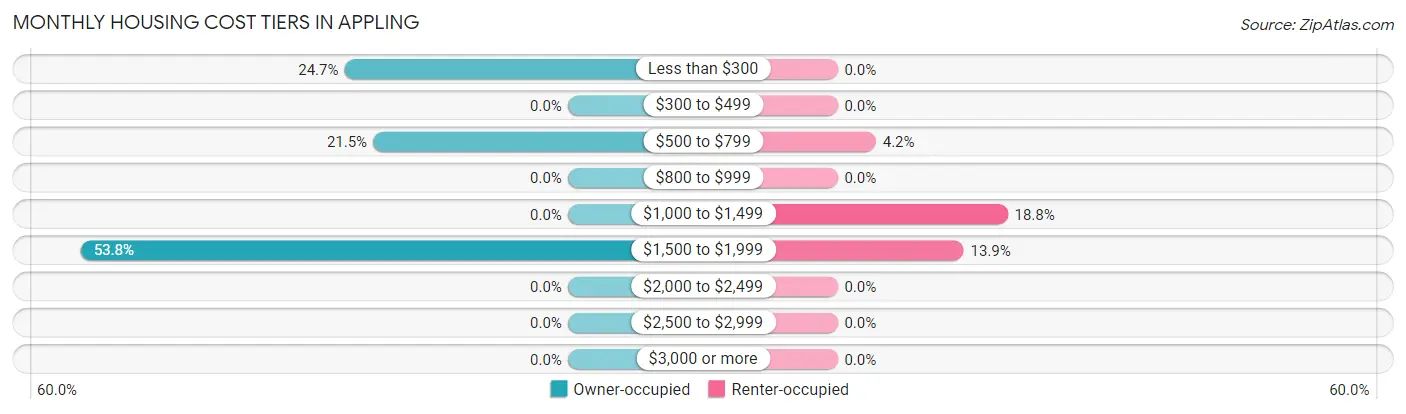
| Monthly Cost | Owner-occupied | Renter-occupied |
| Less than $300 | 39 (24.7%) | 0 (0.0%) |
| $300 to $499 | 0 (0.0%) | 0 (0.0%) |
| $500 to $799 | 34 (21.5%) | 7 (4.2%) |
| $800 to $999 | 0 (0.0%) | 0 (0.0%) |
| $1,000 to $1,499 | 0 (0.0%) | 31 (18.8%) |
| $1,500 to $1,999 | 85 (53.8%) | 23 (13.9%) |
| $2,000 to $2,499 | 0 (0.0%) | 0 (0.0%) |
| $2,500 to $2,999 | 0 (0.0%) | 0 (0.0%) |
| $3,000 or more | 0 (0.0%) | 0 (0.0%) |
| Total | 158 (100.0%) | 165 (100.0%) |
Physical Housing Characteristics in Appling
Housing Structures in Appling
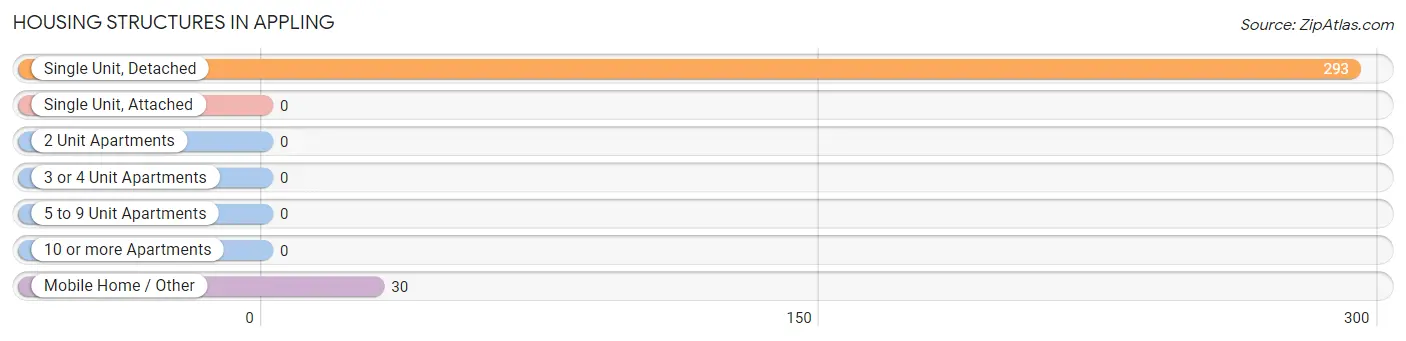
| Structure Type | # Housing Units | % Housing Units |
| Single Unit, Detached | 293 | 90.7% |
| Single Unit, Attached | 0 | 0.0% |
| 2 Unit Apartments | 0 | 0.0% |
| 3 or 4 Unit Apartments | 0 | 0.0% |
| 5 to 9 Unit Apartments | 0 | 0.0% |
| 10 or more Apartments | 0 | 0.0% |
| Mobile Home / Other | 30 | 9.3% |
| Total | 323 | 100.0% |
Housing Structures by Occupancy in Appling
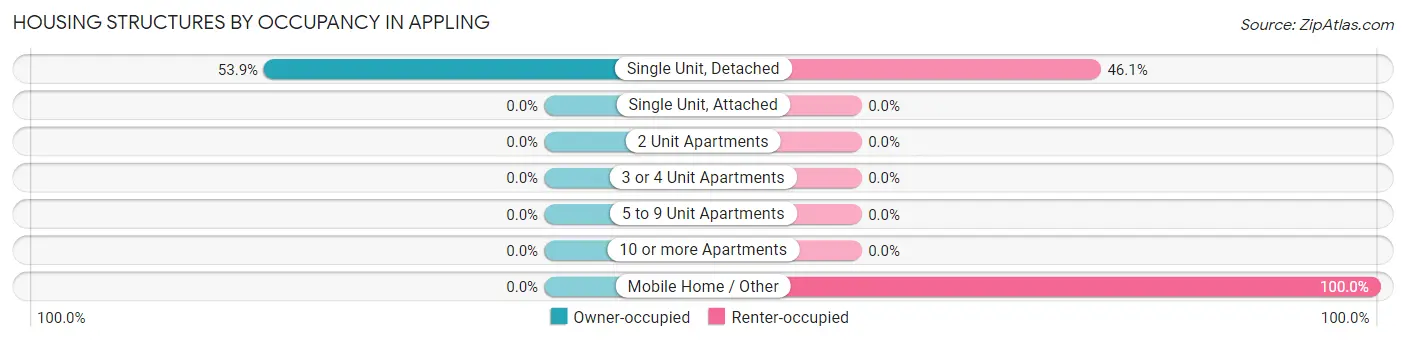
| Structure Type | Owner-occupied | Renter-occupied |
| Single Unit, Detached | 158 (53.9%) | 135 (46.1%) |
| Single Unit, Attached | 0 (0.0%) | 0 (0.0%) |
| 2 Unit Apartments | 0 (0.0%) | 0 (0.0%) |
| 3 or 4 Unit Apartments | 0 (0.0%) | 0 (0.0%) |
| 5 to 9 Unit Apartments | 0 (0.0%) | 0 (0.0%) |
| 10 or more Apartments | 0 (0.0%) | 0 (0.0%) |
| Mobile Home / Other | 0 (0.0%) | 30 (100.0%) |
| Total | 158 (48.9%) | 165 (51.1%) |
Housing Structures by Number of Rooms in Appling
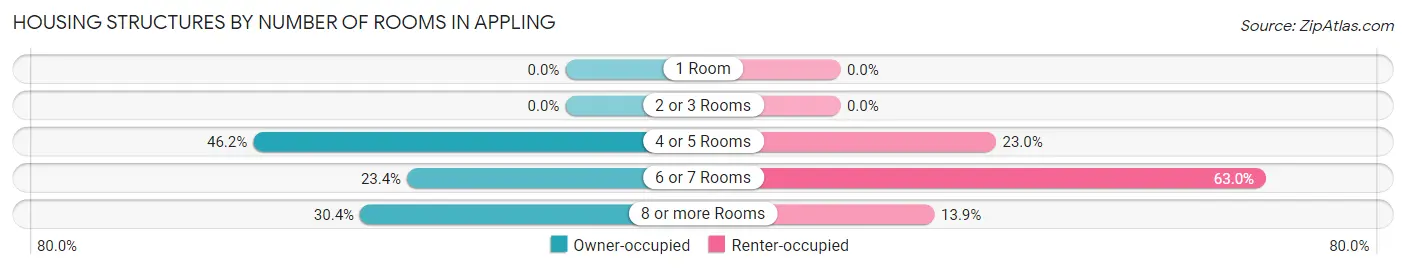
| Number of Rooms | Owner-occupied | Renter-occupied |
| 1 Room | 0 (0.0%) | 0 (0.0%) |
| 2 or 3 Rooms | 0 (0.0%) | 0 (0.0%) |
| 4 or 5 Rooms | 73 (46.2%) | 38 (23.0%) |
| 6 or 7 Rooms | 37 (23.4%) | 104 (63.0%) |
| 8 or more Rooms | 48 (30.4%) | 23 (13.9%) |
| Total | 158 (100.0%) | 165 (100.0%) |
Housing Structure by Heating Type in Appling
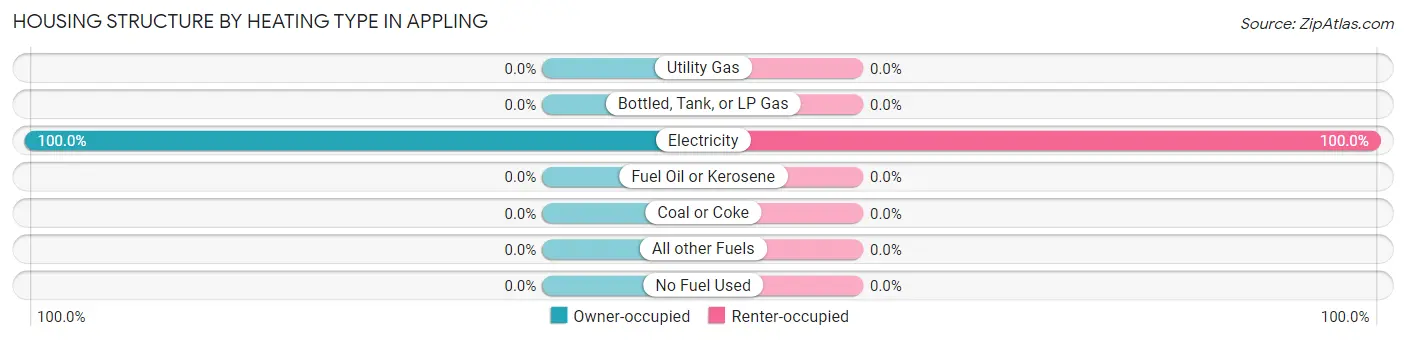
| Heating Type | Owner-occupied | Renter-occupied |
| Utility Gas | 0 (0.0%) | 0 (0.0%) |
| Bottled, Tank, or LP Gas | 0 (0.0%) | 0 (0.0%) |
| Electricity | 158 (100.0%) | 165 (100.0%) |
| Fuel Oil or Kerosene | 0 (0.0%) | 0 (0.0%) |
| Coal or Coke | 0 (0.0%) | 0 (0.0%) |
| All other Fuels | 0 (0.0%) | 0 (0.0%) |
| No Fuel Used | 0 (0.0%) | 0 (0.0%) |
| Total | 158 (100.0%) | 165 (100.0%) |
Household Vehicle Usage in Appling
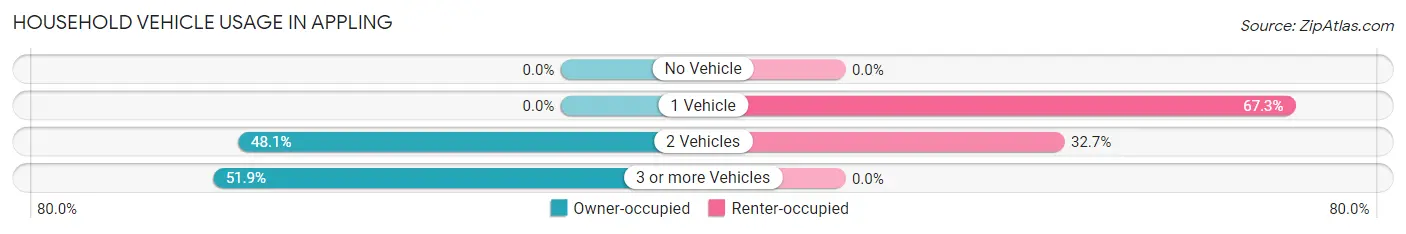
| Vehicles per Household | Owner-occupied | Renter-occupied |
| No Vehicle | 0 (0.0%) | 0 (0.0%) |
| 1 Vehicle | 0 (0.0%) | 111 (67.3%) |
| 2 Vehicles | 76 (48.1%) | 54 (32.7%) |
| 3 or more Vehicles | 82 (51.9%) | 0 (0.0%) |
| Total | 158 (100.0%) | 165 (100.0%) |
Real Estate & Mortgages in Appling
Real Estate and Mortgage Overview in Appling
| Characteristic | Without Mortgage | With Mortgage |
| Housing Units | 73 | 85 |
| Median Property Value | - | - |
| Median Household Income | - | - |
| Monthly Housing Costs | - | - |
| Real Estate Taxes | - | - |
Property Value by Mortgage Status in Appling
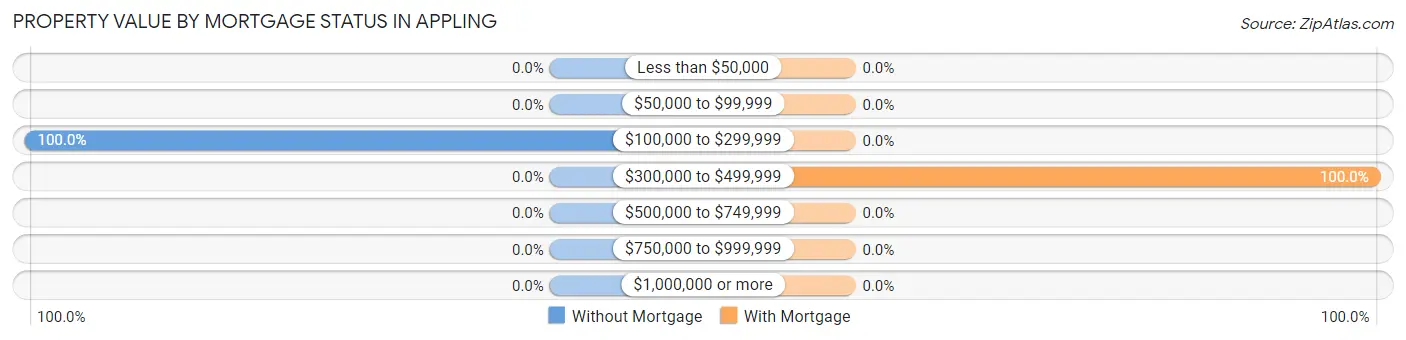
| Property Value | Without Mortgage | With Mortgage |
| Less than $50,000 | 0 (0.0%) | 0 (0.0%) |
| $50,000 to $99,999 | 0 (0.0%) | 0 (0.0%) |
| $100,000 to $299,999 | 73 (100.0%) | 0 (0.0%) |
| $300,000 to $499,999 | 0 (0.0%) | 85 (100.0%) |
| $500,000 to $749,999 | 0 (0.0%) | 0 (0.0%) |
| $750,000 to $999,999 | 0 (0.0%) | 0 (0.0%) |
| $1,000,000 or more | 0 (0.0%) | 0 (0.0%) |
| Total | 73 (100.0%) | 85 (100.0%) |
Household Income by Mortgage Status in Appling
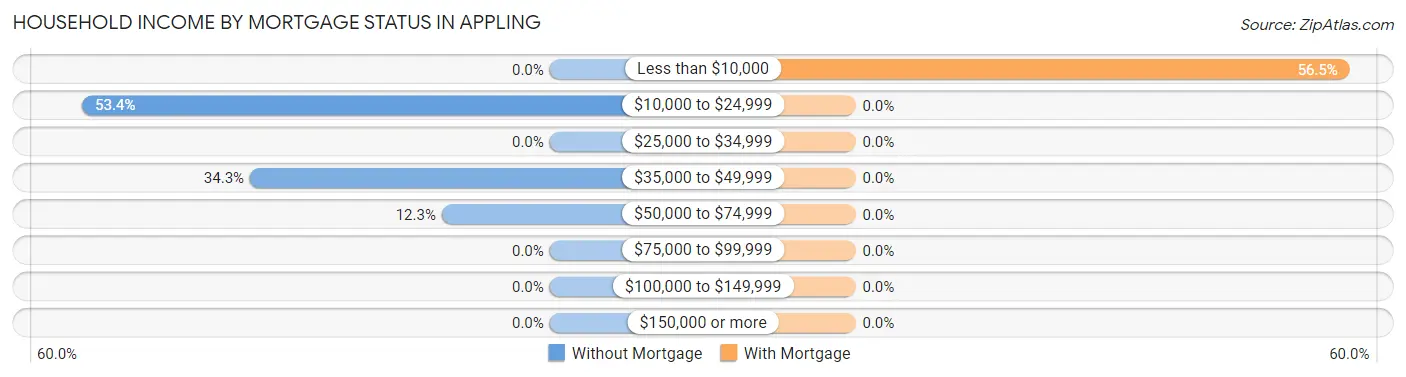
| Household Income | Without Mortgage | With Mortgage |
| Less than $10,000 | 0 (0.0%) | 48 (56.5%) |
| $10,000 to $24,999 | 39 (53.4%) | 0 (0.0%) |
| $25,000 to $34,999 | 0 (0.0%) | 0 (0.0%) |
| $35,000 to $49,999 | 25 (34.3%) | 0 (0.0%) |
| $50,000 to $74,999 | 9 (12.3%) | 0 (0.0%) |
| $75,000 to $99,999 | 0 (0.0%) | 0 (0.0%) |
| $100,000 to $149,999 | 0 (0.0%) | 0 (0.0%) |
| $150,000 or more | 0 (0.0%) | 0 (0.0%) |
| Total | 73 (100.0%) | 85 (100.0%) |
Property Value to Household Income Ratio in Appling
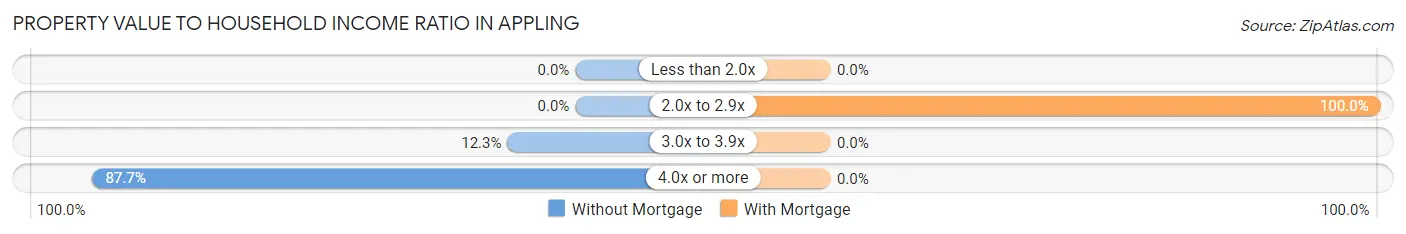
| Value-to-Income Ratio | Without Mortgage | With Mortgage |
| Less than 2.0x | 0 (0.0%) | 0 (0.0%) |
| 2.0x to 2.9x | 0 (0.0%) | 85 (100.0%) |
| 3.0x to 3.9x | 9 (12.3%) | 0 (0.0%) |
| 4.0x or more | 64 (87.7%) | 0 (0.0%) |
| Total | 73 (100.0%) | 85 (100.0%) |
Real Estate Taxes by Mortgage Status in Appling
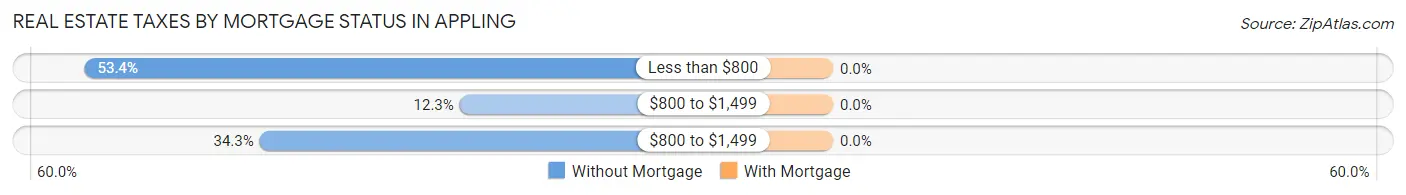
| Property Taxes | Without Mortgage | With Mortgage |
| Less than $800 | 39 (53.4%) | 0 (0.0%) |
| $800 to $1,499 | 9 (12.3%) | 0 (0.0%) |
| $800 to $1,499 | 25 (34.3%) | 0 (0.0%) |
| Total | 73 (100.0%) | 85 (100.0%) |
Health & Disability in Appling
Health Insurance Coverage by Age in Appling
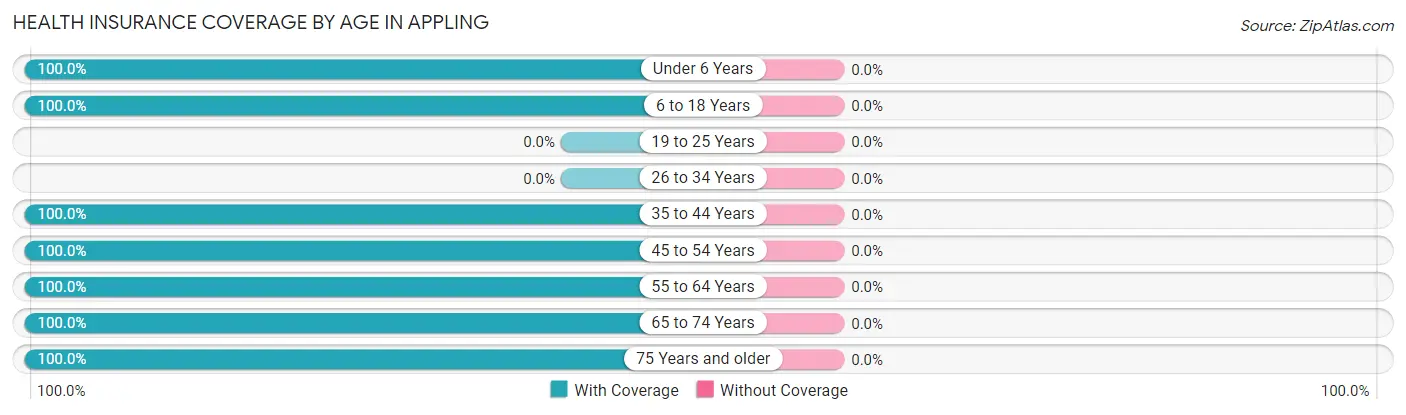
| Age Bracket | With Coverage | Without Coverage |
| Under 6 Years | 67 (100.0%) | 0 (0.0%) |
| 6 to 18 Years | 209 (100.0%) | 0 (0.0%) |
| 19 to 25 Years | 0 (0.0%) | 0 (0.0%) |
| 26 to 34 Years | 0 (0.0%) | 0 (0.0%) |
| 35 to 44 Years | 143 (100.0%) | 0 (0.0%) |
| 45 to 54 Years | 91 (100.0%) | 0 (0.0%) |
| 55 to 64 Years | 14 (100.0%) | 0 (0.0%) |
| 65 to 74 Years | 113 (100.0%) | 0 (0.0%) |
| 75 Years and older | 64 (100.0%) | 0 (0.0%) |
| Total | 701 (100.0%) | 0 (0.0%) |
Health Insurance Coverage by Citizenship Status in Appling
| Citizenship Status | With Coverage | Without Coverage |
| Native Born | 67 (100.0%) | 0 (0.0%) |
| Foreign Born, Citizen | 209 (100.0%) | 0 (0.0%) |
| Foreign Born, not a Citizen | 0 (0.0%) | 0 (0.0%) |
Health Insurance Coverage by Household Income in Appling
| Household Income | With Coverage | Without Coverage |
| Under $25,000 | 256 (100.0%) | 0 (0.0%) |
| $25,000 to $49,999 | 39 (100.0%) | 0 (0.0%) |
| $50,000 to $74,999 | 21 (100.0%) | 0 (0.0%) |
| $75,000 to $99,999 | 90 (100.0%) | 0 (0.0%) |
| $100,000 and over | 295 (100.0%) | 0 (0.0%) |
Public vs Private Health Insurance Coverage by Age in Appling
| Age Bracket | Public Insurance | Private Insurance |
| Under 6 | 12 (17.9%) | 55 (82.1%) |
| 6 to 18 Years | 82 (39.2%) | 167 (79.9%) |
| 19 to 25 Years | 0 (0.0%) | 0 (0.0%) |
| 25 to 34 Years | 0 (0.0%) | 0 (0.0%) |
| 35 to 44 Years | 0 (0.0%) | 143 (100.0%) |
| 45 to 54 Years | 0 (0.0%) | 91 (100.0%) |
| 55 to 64 Years | 0 (0.0%) | 14 (100.0%) |
| 65 to 74 Years | 113 (100.0%) | 0 (0.0%) |
| 75 Years and over | 64 (100.0%) | 25 (39.1%) |
| Total | 271 (38.7%) | 495 (70.6%) |
Disability Status by Sex by Age in Appling
| Age Bracket | Male | Female |
| Under 5 Years | 0 (0.0%) | 0 (0.0%) |
| 5 to 17 Years | 0 (0.0%) | 0 (0.0%) |
| 18 to 34 Years | 60 (58.8%) | 0 (0.0%) |
| 35 to 64 Years | 7 (6.1%) | 0 (0.0%) |
| 65 to 74 Years | 104 (100.0%) | 0 (0.0%) |
| 75 Years and over | 64 (100.0%) | 0 (0.0%) |
Disability Class by Sex by Age in Appling
Disability Class: Hearing Difficulty
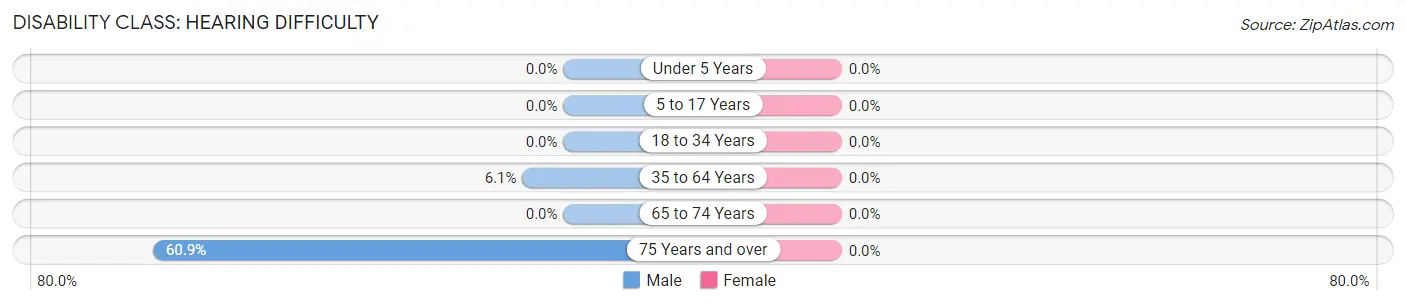
| Age Bracket | Male | Female |
| Under 5 Years | 0 (0.0%) | 0 (0.0%) |
| 5 to 17 Years | 0 (0.0%) | 0 (0.0%) |
| 18 to 34 Years | 0 (0.0%) | 0 (0.0%) |
| 35 to 64 Years | 7 (6.1%) | 0 (0.0%) |
| 65 to 74 Years | 0 (0.0%) | 0 (0.0%) |
| 75 Years and over | 39 (60.9%) | 0 (0.0%) |
Disability Class: Vision Difficulty
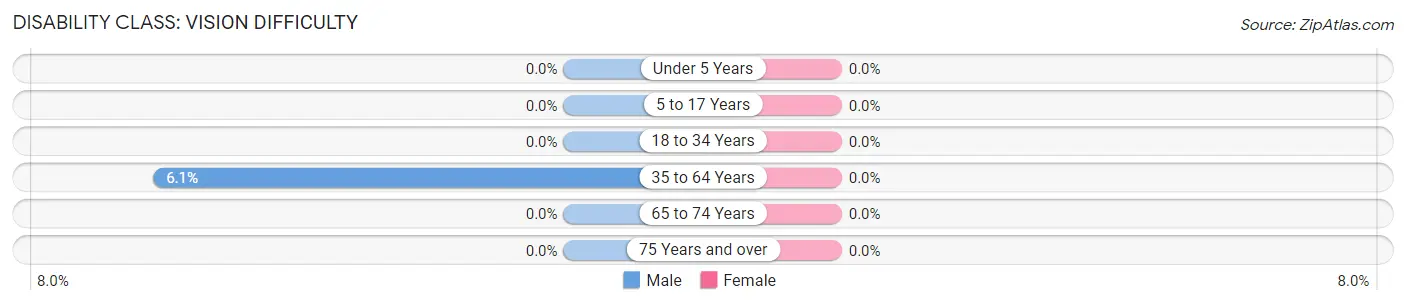
| Age Bracket | Male | Female |
| Under 5 Years | 0 (0.0%) | 0 (0.0%) |
| 5 to 17 Years | 0 (0.0%) | 0 (0.0%) |
| 18 to 34 Years | 0 (0.0%) | 0 (0.0%) |
| 35 to 64 Years | 7 (6.1%) | 0 (0.0%) |
| 65 to 74 Years | 0 (0.0%) | 0 (0.0%) |
| 75 Years and over | 0 (0.0%) | 0 (0.0%) |
Disability Class: Cognitive Difficulty
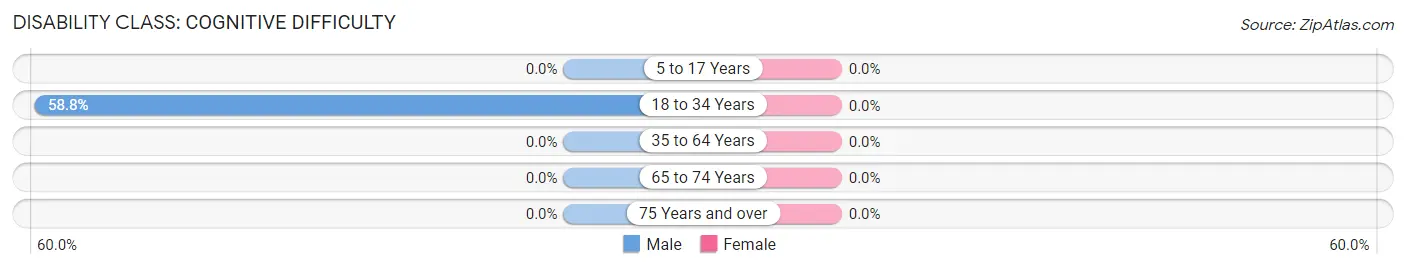
| Age Bracket | Male | Female |
| 5 to 17 Years | 0 (0.0%) | 0 (0.0%) |
| 18 to 34 Years | 60 (58.8%) | 0 (0.0%) |
| 35 to 64 Years | 0 (0.0%) | 0 (0.0%) |
| 65 to 74 Years | 0 (0.0%) | 0 (0.0%) |
| 75 Years and over | 0 (0.0%) | 0 (0.0%) |
Disability Class: Ambulatory Difficulty
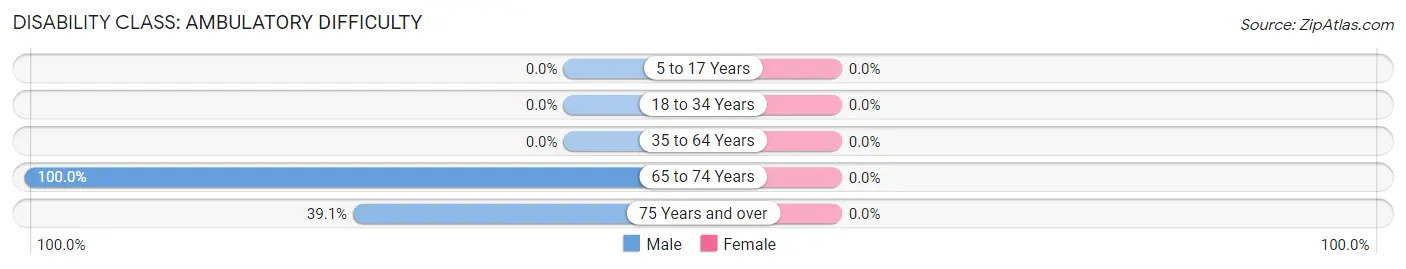
| Age Bracket | Male | Female |
| 5 to 17 Years | 0 (0.0%) | 0 (0.0%) |
| 18 to 34 Years | 0 (0.0%) | 0 (0.0%) |
| 35 to 64 Years | 0 (0.0%) | 0 (0.0%) |
| 65 to 74 Years | 104 (100.0%) | 0 (0.0%) |
| 75 Years and over | 25 (39.1%) | 0 (0.0%) |
Disability Class: Self-Care Difficulty
| Age Bracket | Male | Female |
| 5 to 17 Years | 0 (0.0%) | 0 (0.0%) |
| 18 to 34 Years | 0 (0.0%) | 0 (0.0%) |
| 35 to 64 Years | 0 (0.0%) | 0 (0.0%) |
| 65 to 74 Years | 0 (0.0%) | 0 (0.0%) |
| 75 Years and over | 0 (0.0%) | 0 (0.0%) |
Technology Access in Appling
Computing Device Access in Appling
| Device Type | # Households | % Households |
| Desktop or Laptop | 148 | 45.8% |
| Smartphone | 164 | 50.8% |
| Tablet | 164 | 50.8% |
| No Computing Device | 150 | 46.4% |
| Total | 323 | 100.0% |
Internet Access in Appling
| Internet Type | # Households | % Households |
| Dial-Up Internet | 0 | 0.0% |
| Broadband Home | 116 | 35.9% |
| Cellular Data Only | 0 | 0.0% |
| Satellite Internet | 71 | 22.0% |
| No Internet | 159 | 49.2% |
| Total | 323 | 100.0% |
Appling Summary
Appling, Georgia is a small town located in Columbia County, Georgia. It is situated on the banks of the Savannah River, about 25 miles west of Augusta. The town was founded in 1820 and named after Daniel Appling, a Revolutionary War hero. The population of Appling was 1,845 in the 2010 census.
History
Appling was founded in 1820 by Daniel Appling, a Revolutionary War hero. The town was originally called Appling’s Crossroads, and was a popular stop for travelers on the stagecoach route between Augusta and Athens. In 1821, the town was officially incorporated as Appling.
In the early 1900s, Appling was a thriving agricultural community. The town was home to several cotton gins, a grist mill, and a sawmill. The town also had a hotel, a bank, and several stores.
In the 1950s, Appling began to experience a decline in population as people moved away to larger cities. The town’s economy shifted from agriculture to tourism, as the town became a popular destination for fishing and hunting.
Geography
Appling is located in Columbia County, Georgia, on the banks of the Savannah River. The town is situated about 25 miles west of Augusta. The town is surrounded by forests and rolling hills, and is home to several lakes and rivers.
The climate in Appling is humid subtropical, with hot summers and mild winters. The average annual temperature is around 70 degrees Fahrenheit.
Economy
The economy of Appling is largely based on tourism. The town is a popular destination for fishing and hunting, and is home to several campgrounds and RV parks. The town also has several restaurants, antique stores, and gift shops.
Appling is also home to several small businesses, including a lumber mill, a sawmill, and a grist mill. The town is also home to several farms, which produce a variety of crops, including cotton, corn, and soybeans.
Demographics
As of the 2010 census, the population of Appling was 1,845. The racial makeup of the town was 79.3% White, 17.2% African American, 0.7% Native American, 0.3% Asian, and 2.5% from other races.
The median household income in Appling was $37,917, and the median family income was $45,938. The per capita income was $19,945. The town had a poverty rate of 17.3%.
Appling is served by the Columbia County School District. The town is home to Appling Elementary School, Appling Middle School, and Appling High School. The town also has several private schools, including Appling Christian Academy and Appling Academy.
Common Questions
What is Per Capita Income in Appling?
Per Capita income in Appling is $37,799.
What is Income or Wage Gap in Appling?
Income or Wage Gap in Appling is 19.1%.
Women in Appling earn 80.9 cents for every dollar earned by a man.
What is Inequality or Gini Index in Appling?
Inequality or Gini Index in Appling is 0.58.
What is the Total Population of Appling?
Total Population of Appling is 701.
What is the Total Male Population of Appling?
Total Male Population of Appling is 513.
What is the Total Female Population of Appling?
Total Female Population of Appling is 188.
What is the Ratio of Males per 100 Females in Appling?
There are 272.87 Males per 100 Females in Appling.
What is the Ratio of Females per 100 Males in Appling?
There are 36.65 Females per 100 Males in Appling.
What is the Median Population Age in Appling?
Median Population Age in Appling is 38.0 Years.
What is the Average Family Size in Appling
Average Family Size in Appling is 3.5 People.
What is the Average Household Size in Appling
Average Household Size in Appling is 2.2 People.
How Large is the Labor Force in Appling?
There are 272 People in the Labor Forcein in Appling.
What is the Percentage of People in the Labor Force in Appling?
51.6% of People are in the Labor Force in Appling.
What is the Unemployment Rate in Appling?
Unemployment Rate in Appling is 15.4%.