Roopville, GA Map & Demographics
Roopville Map
Roopville Overview
$24,384
PER CAPITA INCOME
$100,833
AVG FAMILY INCOME
$73,594
AVG HOUSEHOLD INCOME
17.8%
WAGE / INCOME GAP [ % ]
82.2¢/ $1
WAGE / INCOME GAP [ $ ]
0.47
INEQUALITY / GINI INDEX
423
TOTAL POPULATION
203
MALE POPULATION
220
FEMALE POPULATION
92.27
MALES / 100 FEMALES
108.37
FEMALES / 100 MALES
29.2
MEDIAN AGE
4.4
AVG FAMILY SIZE
3.7
AVG HOUSEHOLD SIZE
140
LABOR FORCE [ PEOPLE ]
46.7%
PERCENT IN LABOR FORCE
Roopville Zip Codes
Income in Roopville
Income Overview in Roopville
Per Capita Income in Roopville is $24,384, while median incomes of families and households are $100,833 and $73,594 respectively.
| Characteristic | Number | Measure |
| Per Capita Income | 423 | $24,384 |
| Median Family Income | 86 | $100,833 |
| Mean Family Income | 86 | $114,113 |
| Median Household Income | 113 | $73,594 |
| Mean Household Income | 113 | $97,450 |
| Income Deficit | 86 | $0 |
| Wage / Income Gap (%) | 423 | 17.81% |
| Wage / Income Gap ($) | 423 | 82.19¢ per $1 |
| Gini / Inequality Index | 423 | 0.47 |
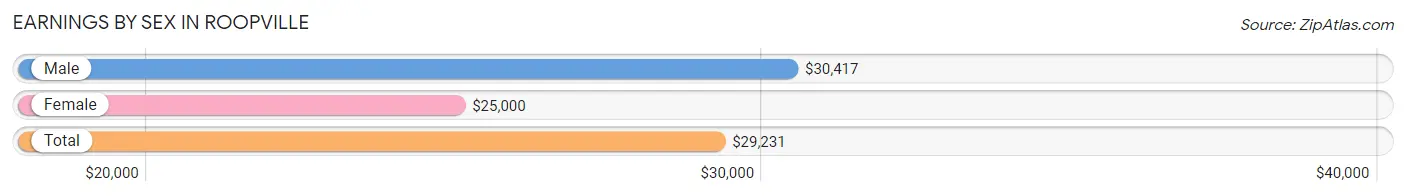
Earnings by Sex in Roopville
Average Earnings in Roopville are $29,231, $30,417 for men and $25,000 for women, a difference of 17.8%.
| Sex | Number | Average Earnings |
| Male | 102 (53.7%) | $30,417 |
| Female | 88 (46.3%) | $25,000 |
| Total | 190 (100.0%) | $29,231 |
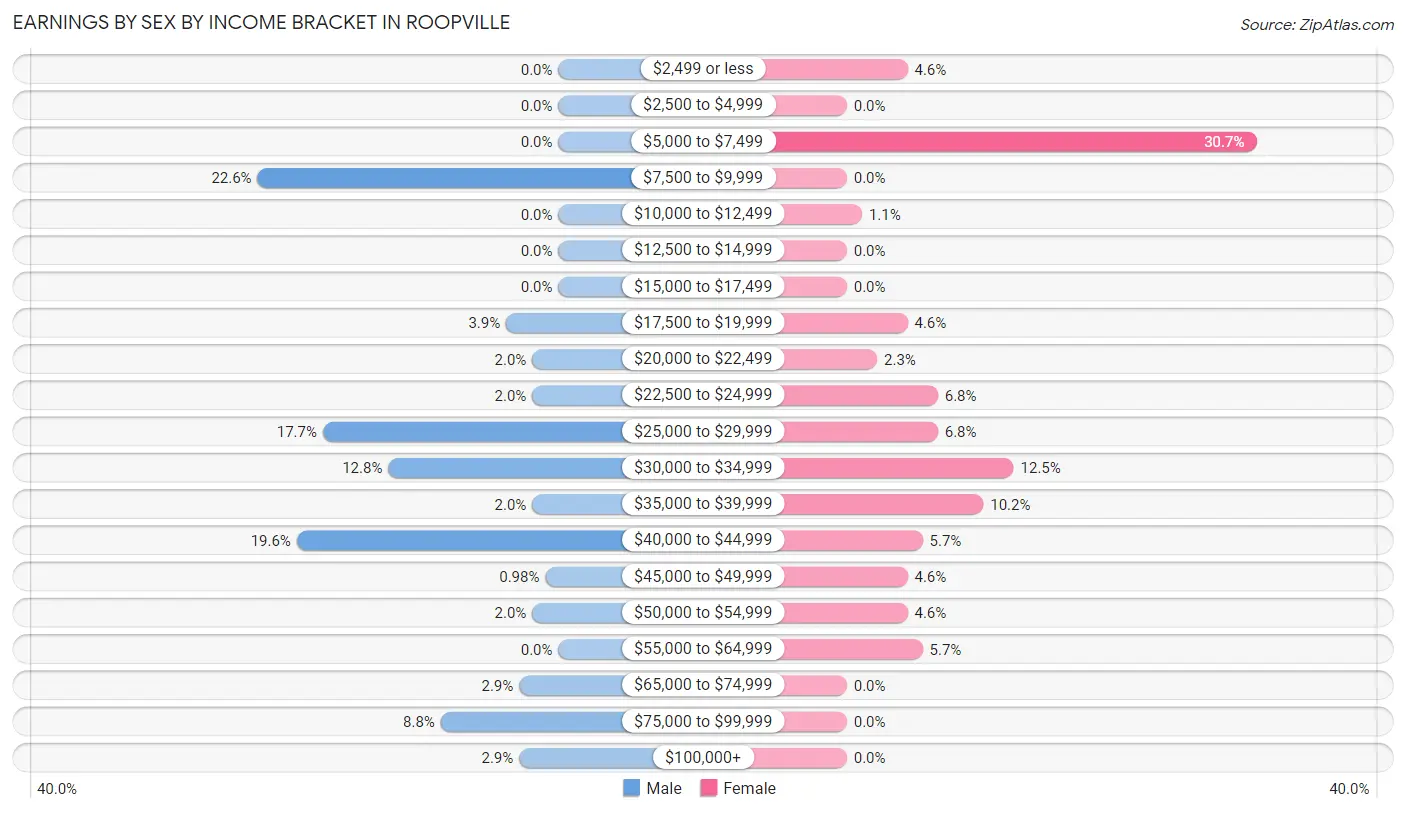
Earnings by Sex by Income Bracket in Roopville
The most common earnings brackets in Roopville are $7,500 to $9,999 for men (23 | 22.6%) and $5,000 to $7,499 for women (27 | 30.7%).
| Income | Male | Female |
| $2,499 or less | 0 (0.0%) | 4 (4.5%) |
| $2,500 to $4,999 | 0 (0.0%) | 0 (0.0%) |
| $5,000 to $7,499 | 0 (0.0%) | 27 (30.7%) |
| $7,500 to $9,999 | 23 (22.6%) | 0 (0.0%) |
| $10,000 to $12,499 | 0 (0.0%) | 1 (1.1%) |
| $12,500 to $14,999 | 0 (0.0%) | 0 (0.0%) |
| $15,000 to $17,499 | 0 (0.0%) | 0 (0.0%) |
| $17,500 to $19,999 | 4 (3.9%) | 4 (4.5%) |
| $20,000 to $22,499 | 2 (2.0%) | 2 (2.3%) |
| $22,500 to $24,999 | 2 (2.0%) | 6 (6.8%) |
| $25,000 to $29,999 | 18 (17.6%) | 6 (6.8%) |
| $30,000 to $34,999 | 13 (12.8%) | 11 (12.5%) |
| $35,000 to $39,999 | 2 (2.0%) | 9 (10.2%) |
| $40,000 to $44,999 | 20 (19.6%) | 5 (5.7%) |
| $45,000 to $49,999 | 1 (1.0%) | 4 (4.5%) |
| $50,000 to $54,999 | 2 (2.0%) | 4 (4.5%) |
| $55,000 to $64,999 | 0 (0.0%) | 5 (5.7%) |
| $65,000 to $74,999 | 3 (2.9%) | 0 (0.0%) |
| $75,000 to $99,999 | 9 (8.8%) | 0 (0.0%) |
| $100,000+ | 3 (2.9%) | 0 (0.0%) |
| Total | 102 (100.0%) | 88 (100.0%) |
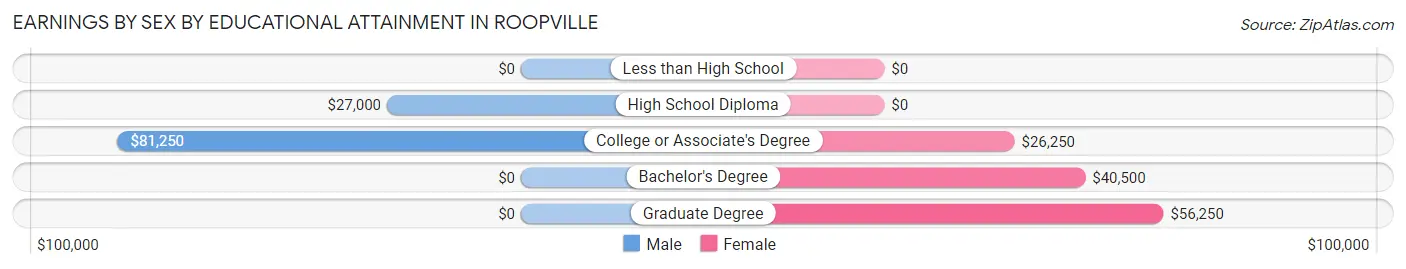
Earnings by Sex by Educational Attainment in Roopville
Average earnings in Roopville are $30,417 for men and $24,583 for women, a difference of 19.2%. Men with an educational attainment of college or associate's degree enjoy the highest average annual earnings of $81,250, while those with high school diploma education earn the least with $27,000. Women with an educational attainment of graduate degree earn the most with the average annual earnings of $56,250, while those with college or associate's degree education have the smallest earnings of $26,250.
| Educational Attainment | Male Income | Female Income |
| Less than High School | - | - |
| High School Diploma | $27,000 | $0 |
| College or Associate's Degree | $81,250 | $26,250 |
| Bachelor's Degree | - | - |
| Graduate Degree | - | - |
| Total | $30,417 | $24,583 |
Family Income in Roopville
Family Income Brackets in Roopville
According to the Roopville family income data, there are 38 families falling into the $100,000 to $149,999 income range, which is the most common income bracket and makes up 44.2% of all families.
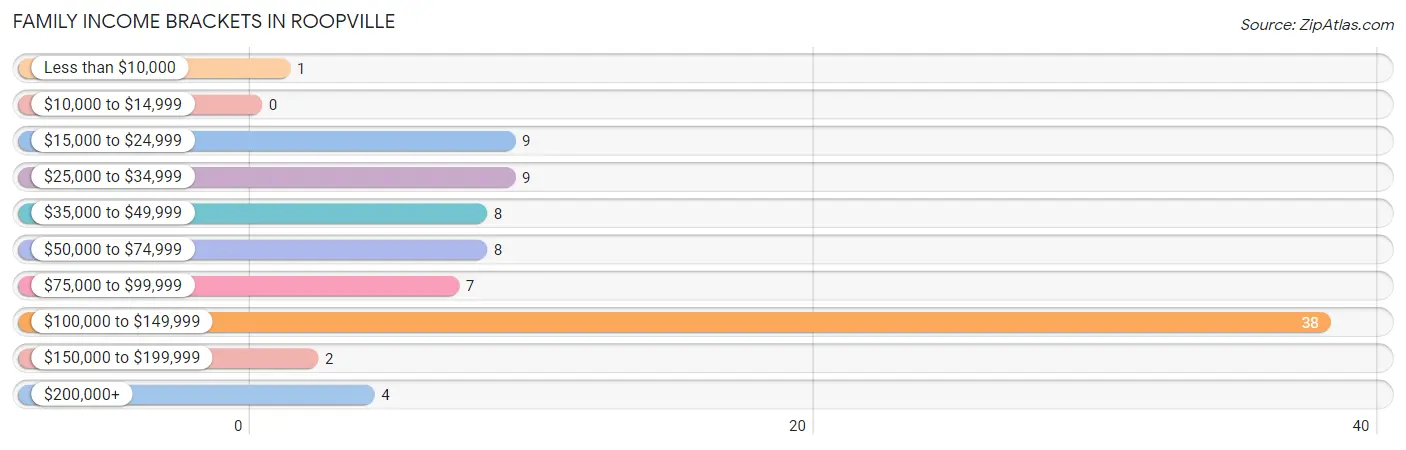
| Income Bracket | # Families | % Families |
| Less than $10,000 | 1 | 1.2% |
| $10,000 to $14,999 | 0 | 0.0% |
| $15,000 to $24,999 | 9 | 10.5% |
| $25,000 to $34,999 | 9 | 10.5% |
| $35,000 to $49,999 | 8 | 9.3% |
| $50,000 to $74,999 | 8 | 9.3% |
| $75,000 to $99,999 | 7 | 8.1% |
| $100,000 to $149,999 | 38 | 44.2% |
| $150,000 to $199,999 | 2 | 2.3% |
| $200,000+ | 4 | 4.7% |
Family Income by Famaliy Size in Roopville
4-person families (16 | 18.6%) account for the highest median family income in Roopville with $96,250 per family, while 4-person families (16 | 18.6%) have the highest median income of $24,062 per family member.
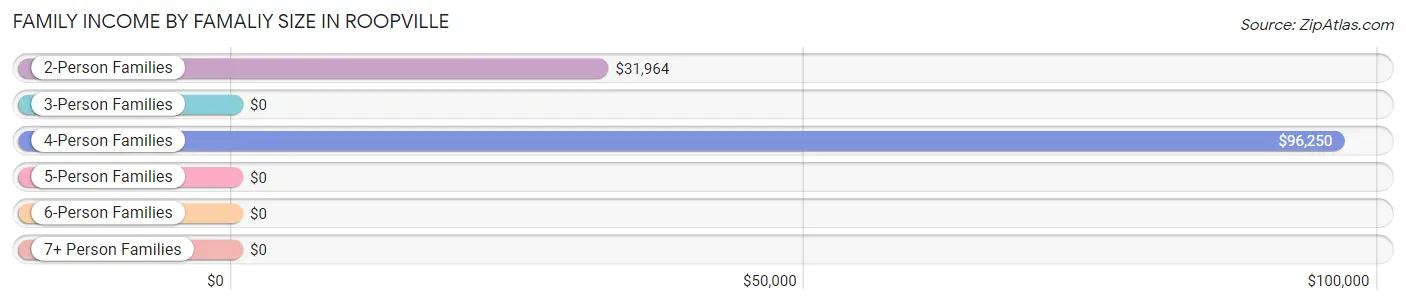
| Income Bracket | # Families | Median Income |
| 2-Person Families | 29 (33.7%) | $31,964 |
| 3-Person Families | 12 (14.0%) | $0 |
| 4-Person Families | 16 (18.6%) | $96,250 |
| 5-Person Families | 7 (8.1%) | $0 |
| 6-Person Families | 0 (0.0%) | $0 |
| 7+ Person Families | 22 (25.6%) | $0 |
| Total | 86 (100.0%) | $100,833 |
Family Income by Number of Earners in Roopville
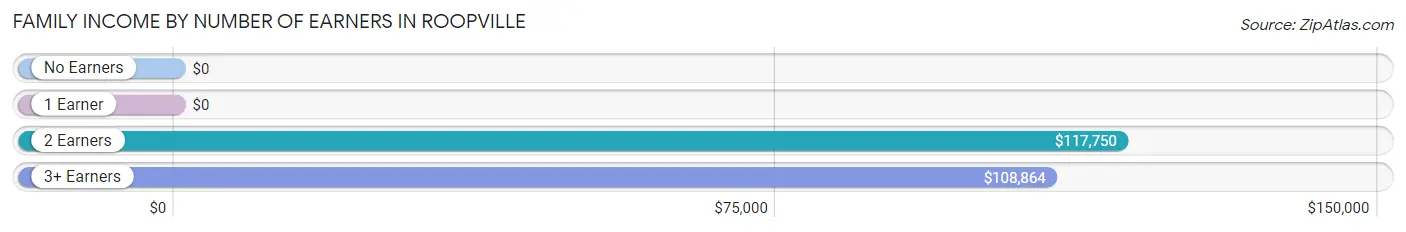
| Number of Earners | # Families | Median Income |
| No Earners | 14 (16.3%) | $0 |
| 1 Earner | 23 (26.7%) | $0 |
| 2 Earners | 21 (24.4%) | $117,750 |
| 3+ Earners | 28 (32.6%) | $108,864 |
| Total | 86 (100.0%) | $100,833 |
Household Income in Roopville
Household Income Brackets in Roopville
With 38 households falling in the category, the $100,000 to $149,999 income range is the most frequent in Roopville, accounting for 33.6% of all households. In contrast, only 2 households (1.8%) fall into the $10,000 to $14,999 income bracket, making it the least populous group.
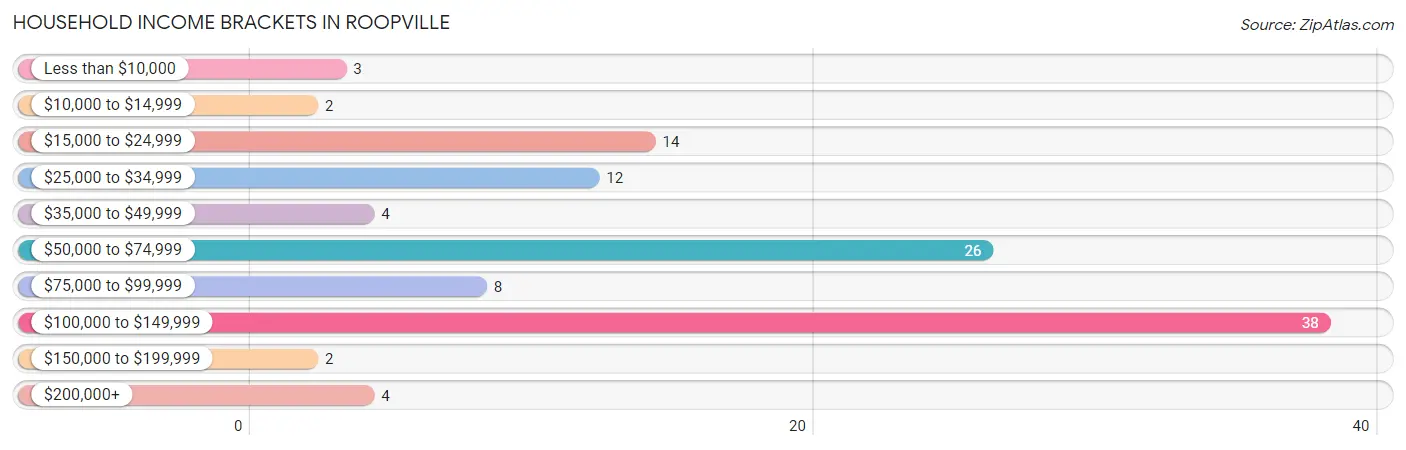
| Income Bracket | # Households | % Households |
| Less than $10,000 | 3 | 2.7% |
| $10,000 to $14,999 | 2 | 1.8% |
| $15,000 to $24,999 | 14 | 12.4% |
| $25,000 to $34,999 | 12 | 10.6% |
| $35,000 to $49,999 | 4 | 3.5% |
| $50,000 to $74,999 | 26 | 23.0% |
| $75,000 to $99,999 | 8 | 7.1% |
| $100,000 to $149,999 | 38 | 33.6% |
| $150,000 to $199,999 | 2 | 1.8% |
| $200,000+ | 4 | 3.5% |
Household Income by Householder Age in Roopville
The median household income in Roopville is $73,594, with the highest median household income of $107,727 found in the 25 to 44 years age bracket for the primary householder. A total of 54 households (47.8%) fall into this category.
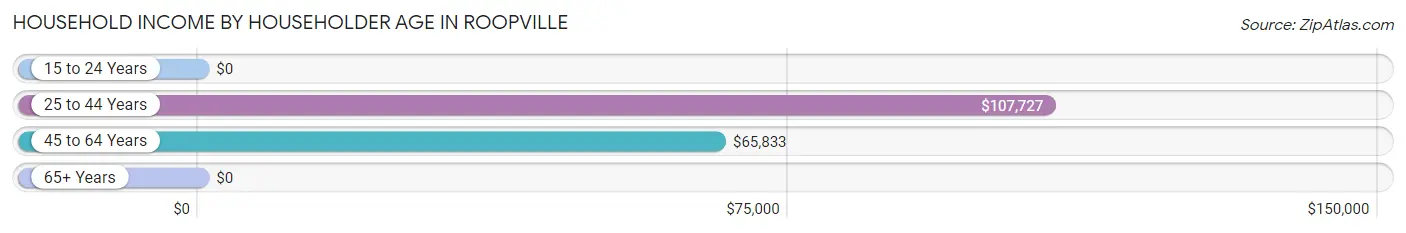
| Income Bracket | # Households | Median Income |
| 15 to 24 Years | 0 (0.0%) | $0 |
| 25 to 44 Years | 54 (47.8%) | $107,727 |
| 45 to 64 Years | 26 (23.0%) | $65,833 |
| 65+ Years | 33 (29.2%) | $0 |
| Total | 113 (100.0%) | $73,594 |
Poverty in Roopville
Income Below Poverty by Sex and Age in Roopville
With 4.0% poverty level for males and 5.4% for females among the residents of Roopville, 18 to 24 year old males and 75 year old and over females are the most vulnerable to poverty, with 2 males (100.0%) and 5 females (35.7%) in their respective age groups living below the poverty level.
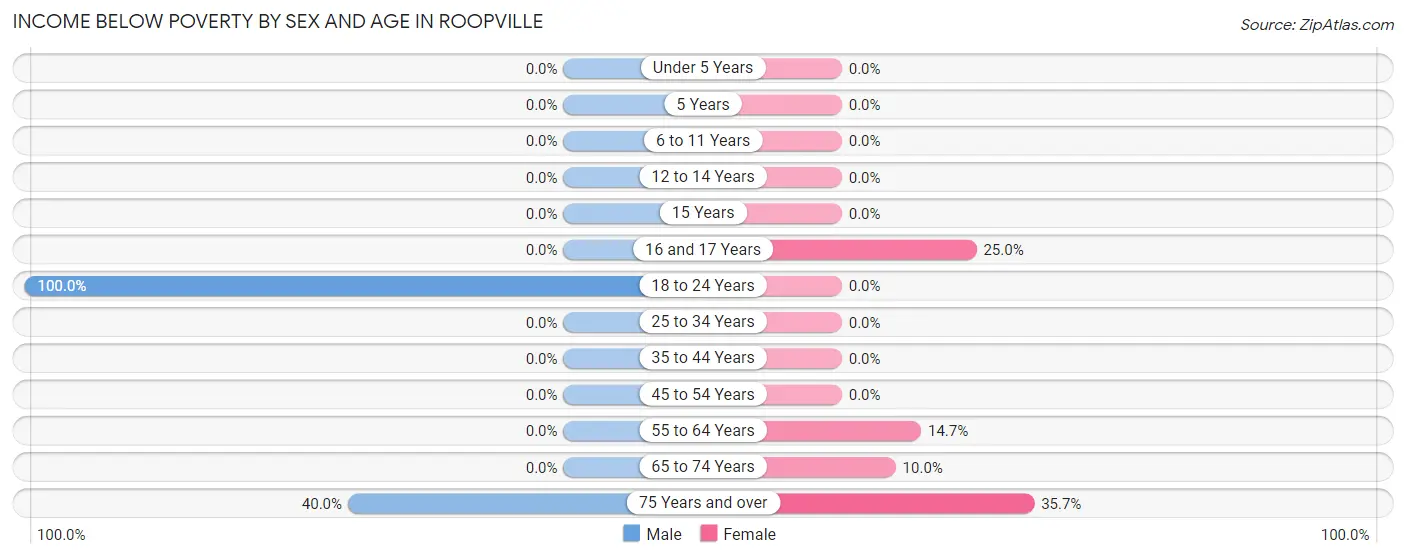
| Age Bracket | Male | Female |
| Under 5 Years | 0 (0.0%) | 0 (0.0%) |
| 5 Years | 0 (0.0%) | 0 (0.0%) |
| 6 to 11 Years | 0 (0.0%) | 0 (0.0%) |
| 12 to 14 Years | 0 (0.0%) | 0 (0.0%) |
| 15 Years | 0 (0.0%) | 0 (0.0%) |
| 16 and 17 Years | 0 (0.0%) | 1 (25.0%) |
| 18 to 24 Years | 2 (100.0%) | 0 (0.0%) |
| 25 to 34 Years | 0 (0.0%) | 0 (0.0%) |
| 35 to 44 Years | 0 (0.0%) | 0 (0.0%) |
| 45 to 54 Years | 0 (0.0%) | 0 (0.0%) |
| 55 to 64 Years | 0 (0.0%) | 5 (14.7%) |
| 65 to 74 Years | 0 (0.0%) | 1 (10.0%) |
| 75 Years and over | 6 (40.0%) | 5 (35.7%) |
| Total | 8 (4.0%) | 12 (5.4%) |
Income Above Poverty by Sex and Age in Roopville
According to the poverty statistics in Roopville, males aged under 5 years and females aged under 5 years are the age groups that are most secure financially, with 100.0% of males and 100.0% of females in these age groups living above the poverty line.
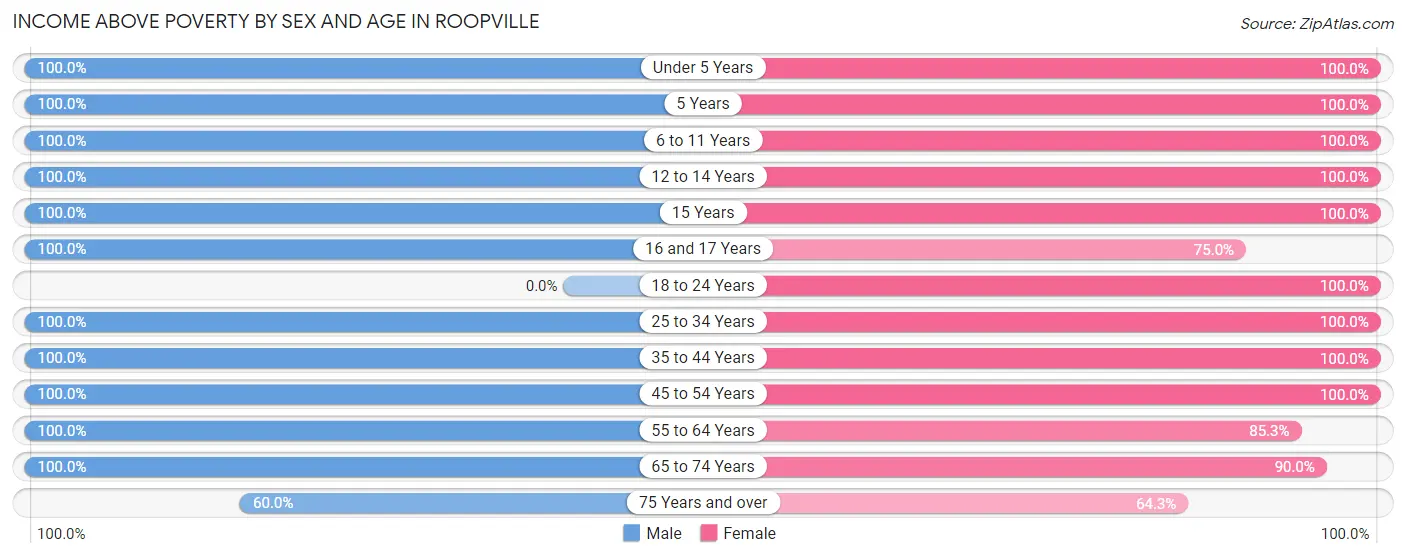
| Age Bracket | Male | Female |
| Under 5 Years | 5 (100.0%) | 2 (100.0%) |
| 5 Years | 2 (100.0%) | 16 (100.0%) |
| 6 to 11 Years | 39 (100.0%) | 38 (100.0%) |
| 12 to 14 Years | 2 (100.0%) | 5 (100.0%) |
| 15 Years | 9 (100.0%) | 3 (100.0%) |
| 16 and 17 Years | 13 (100.0%) | 3 (75.0%) |
| 18 to 24 Years | 0 (0.0%) | 3 (100.0%) |
| 25 to 34 Years | 66 (100.0%) | 64 (100.0%) |
| 35 to 44 Years | 23 (100.0%) | 20 (100.0%) |
| 45 to 54 Years | 2 (100.0%) | 7 (100.0%) |
| 55 to 64 Years | 20 (100.0%) | 29 (85.3%) |
| 65 to 74 Years | 3 (100.0%) | 9 (90.0%) |
| 75 Years and over | 9 (60.0%) | 9 (64.3%) |
| Total | 193 (96.0%) | 208 (94.6%) |
Income Below Poverty Among Married-Couple Families in Roopville
The poverty statistics for married-couple families in Roopville show that 7.5% or 5 of the total 67 families live below the poverty line. Families with no children have the highest poverty rate of 19.2%, comprising of 5 families. On the other hand, families with 1 or 2 children have the lowest poverty rate of 0.0%, which includes 0 families.
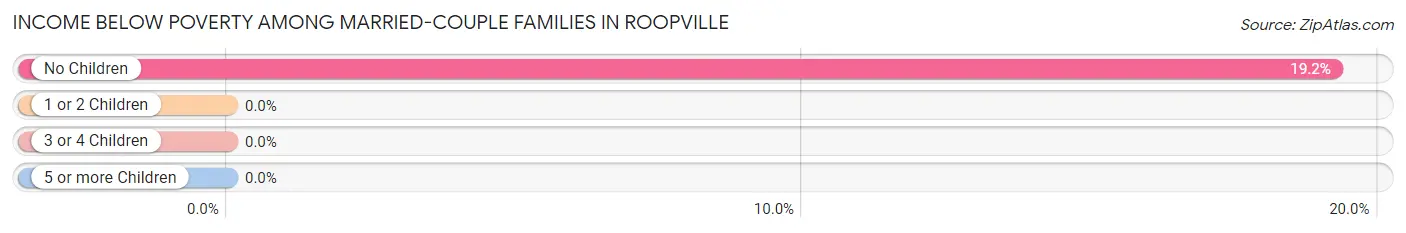
| Children | Above Poverty | Below Poverty |
| No Children | 21 (80.8%) | 5 (19.2%) |
| 1 or 2 Children | 14 (100.0%) | 0 (0.0%) |
| 3 or 4 Children | 27 (100.0%) | 0 (0.0%) |
| 5 or more Children | 0 (0.0%) | 0 (0.0%) |
| Total | 62 (92.5%) | 5 (7.5%) |
Income Below Poverty Among Single-Parent Households in Roopville
| Children | Single Father | Single Mother |
| No Children | 0 (0.0%) | 0 (0.0%) |
| 1 or 2 Children | 0 (0.0%) | 0 (0.0%) |
| 3 or 4 Children | 0 (0.0%) | 0 (0.0%) |
| 5 or more Children | 0 (0.0%) | 0 (0.0%) |
| Total | 0 (0.0%) | 0 (0.0%) |
Income Below Poverty Among Married-Couple vs Single-Parent Households in Roopville
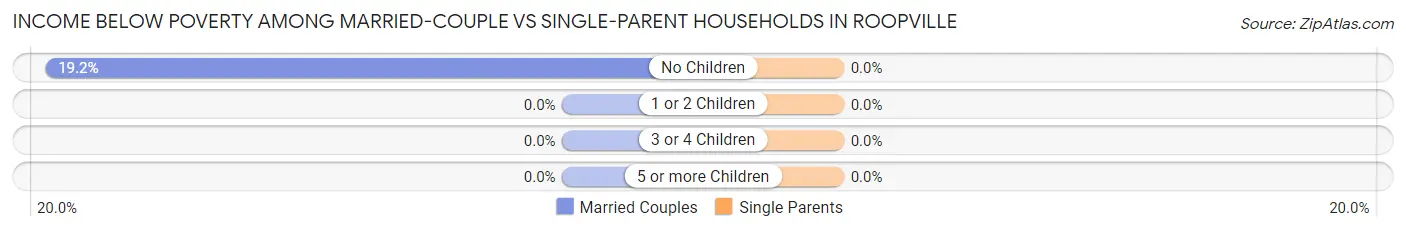
| Children | Married-Couple Families | Single-Parent Households |
| No Children | 5 (19.2%) | 0 (0.0%) |
| 1 or 2 Children | 0 (0.0%) | 0 (0.0%) |
| 3 or 4 Children | 0 (0.0%) | 0 (0.0%) |
| 5 or more Children | 0 (0.0%) | 0 (0.0%) |
| Total | 5 (7.5%) | 0 (0.0%) |
Race in Roopville
The most populous races in Roopville are White / Caucasian (367 | 86.8%), Black / African American (51 | 12.1%), and Hispanic or Latino (13 | 3.1%).
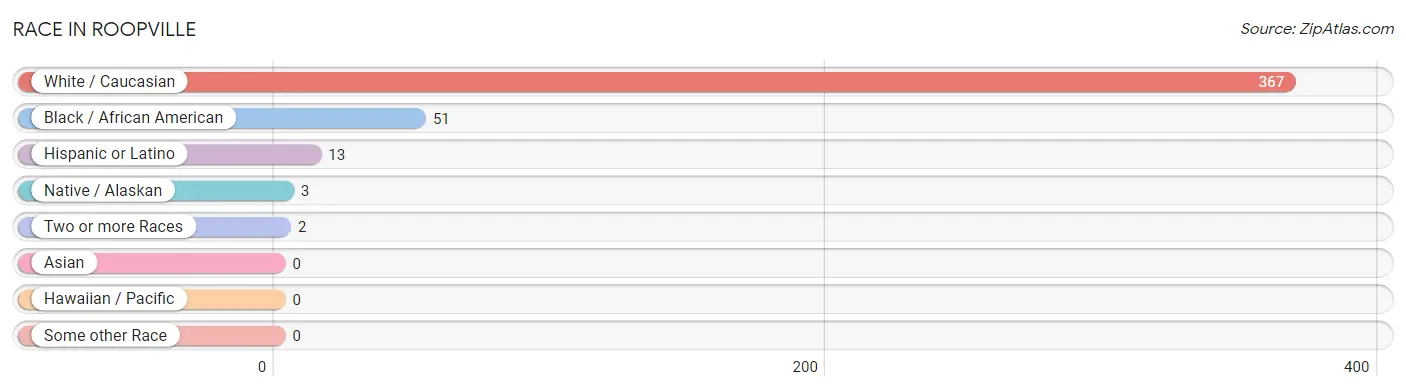
| Race | # Population | % Population |
| Asian | 0 | 0.0% |
| Black / African American | 51 | 12.1% |
| Hawaiian / Pacific | 0 | 0.0% |
| Hispanic or Latino | 13 | 3.1% |
| Native / Alaskan | 3 | 0.7% |
| White / Caucasian | 367 | 86.8% |
| Two or more Races | 2 | 0.5% |
| Some other Race | 0 | 0.0% |
| Total | 423 | 100.0% |
Ancestry in Roopville
The most populous ancestries reported in Roopville are American (187 | 44.2%), English (22 | 5.2%), Irish (12 | 2.8%), Mexican (12 | 2.8%), and Scottish (12 | 2.8%), together accounting for 57.9% of all Roopville residents.
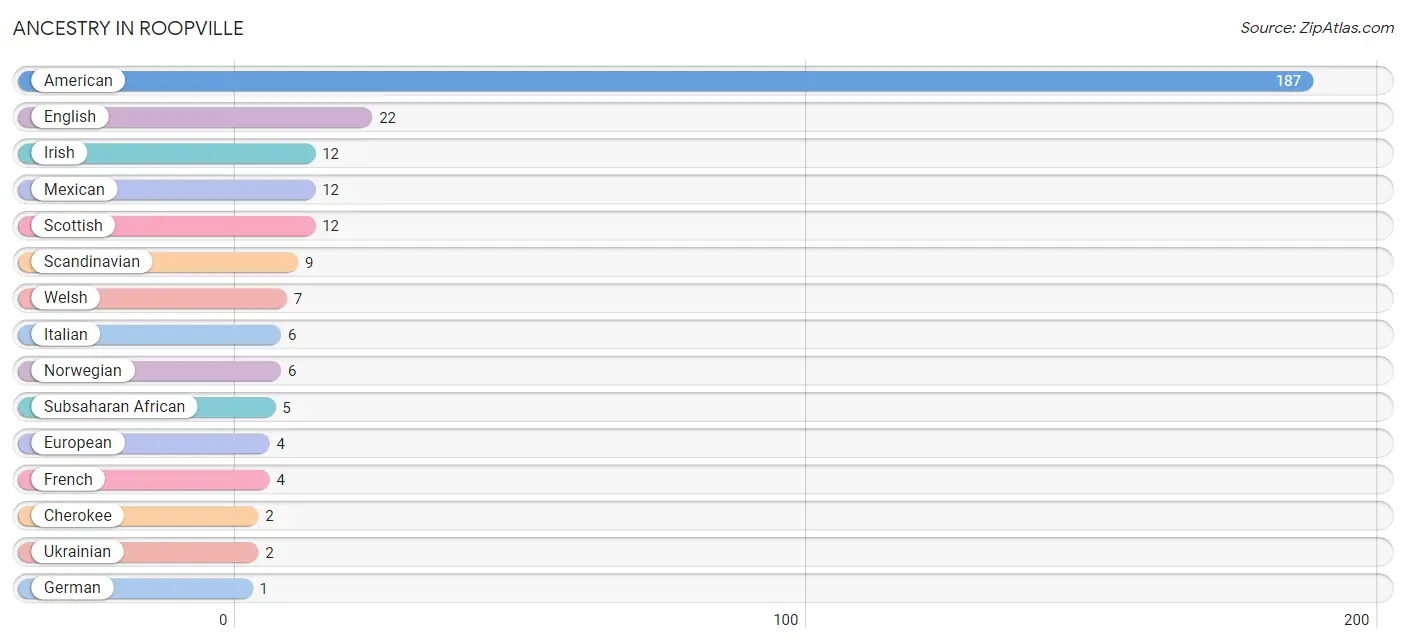
| Ancestry | # Population | % Population |
| American | 187 | 44.2% |
| Cherokee | 2 | 0.5% |
| English | 22 | 5.2% |
| European | 4 | 0.9% |
| French | 4 | 0.9% |
| German | 1 | 0.2% |
| Irish | 12 | 2.8% |
| Italian | 6 | 1.4% |
| Mexican | 12 | 2.8% |
| Nigerian | 1 | 0.2% |
| Norwegian | 6 | 1.4% |
| Puerto Rican | 1 | 0.2% |
| Russian | 1 | 0.2% |
| Scandinavian | 9 | 2.1% |
| Scotch-Irish | 1 | 0.2% |
| Scottish | 12 | 2.8% |
| Subsaharan African | 5 | 1.2% |
| Ukrainian | 2 | 0.5% |
| Welsh | 7 | 1.7% | View All 19 Rows |
Immigrants in Roopville

| Immigration Origin | # Population | % Population | View All 0 Rows |
Sex and Age in Roopville
Sex and Age in Roopville
The most populous age groups in Roopville are 25 to 29 Years (57 | 28.1%) for men and 5 to 9 Years (52 | 23.6%) for women.
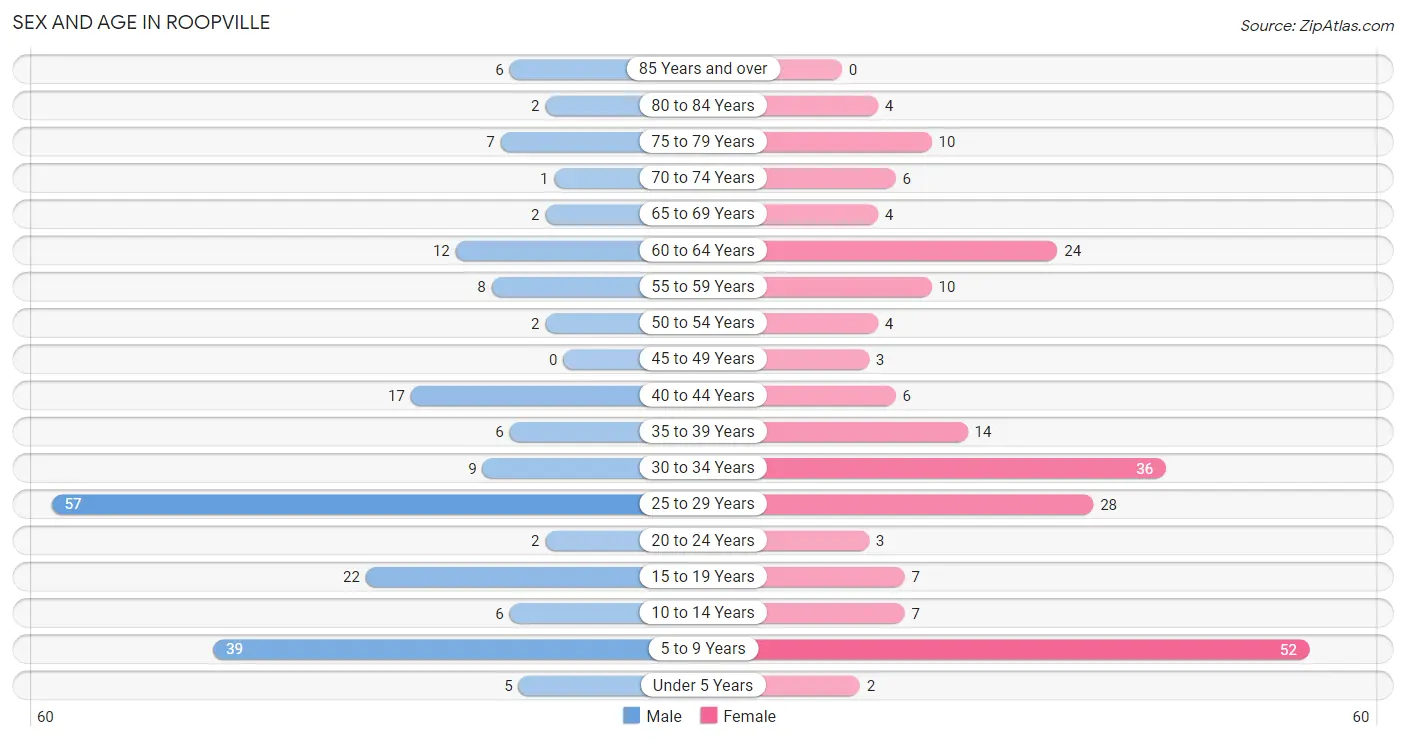
| Age Bracket | Male | Female |
| Under 5 Years | 5 (2.5%) | 2 (0.9%) |
| 5 to 9 Years | 39 (19.2%) | 52 (23.6%) |
| 10 to 14 Years | 6 (3.0%) | 7 (3.2%) |
| 15 to 19 Years | 22 (10.8%) | 7 (3.2%) |
| 20 to 24 Years | 2 (1.0%) | 3 (1.4%) |
| 25 to 29 Years | 57 (28.1%) | 28 (12.7%) |
| 30 to 34 Years | 9 (4.4%) | 36 (16.4%) |
| 35 to 39 Years | 6 (3.0%) | 14 (6.4%) |
| 40 to 44 Years | 17 (8.4%) | 6 (2.7%) |
| 45 to 49 Years | 0 (0.0%) | 3 (1.4%) |
| 50 to 54 Years | 2 (1.0%) | 4 (1.8%) |
| 55 to 59 Years | 8 (3.9%) | 10 (4.5%) |
| 60 to 64 Years | 12 (5.9%) | 24 (10.9%) |
| 65 to 69 Years | 2 (1.0%) | 4 (1.8%) |
| 70 to 74 Years | 1 (0.5%) | 6 (2.7%) |
| 75 to 79 Years | 7 (3.5%) | 10 (4.5%) |
| 80 to 84 Years | 2 (1.0%) | 4 (1.8%) |
| 85 Years and over | 6 (3.0%) | 0 (0.0%) |
| Total | 203 (100.0%) | 220 (100.0%) |
Families and Households in Roopville
Median Family Size in Roopville
The median family size in Roopville is 4.36 persons per family, with married-couple families (67 | 77.9%) accounting for the largest median family size of 4.9 persons per family. On the other hand, single female/mother families (17 | 19.8%) represent the smallest median family size with 2.41 persons per family.
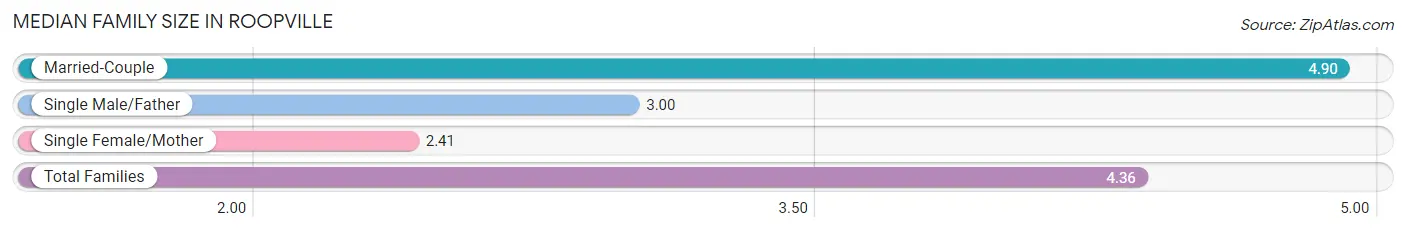
| Family Type | # Families | Family Size |
| Married-Couple | 67 (77.9%) | 4.90 |
| Single Male/Father | 2 (2.3%) | 3.00 |
| Single Female/Mother | 17 (19.8%) | 2.41 |
| Total Families | 86 (100.0%) | 4.36 |
Median Household Size in Roopville
The median household size in Roopville is 3.74 persons per household, with married-couple households (67 | 59.3%) accounting for the largest median household size of 5 persons per household. non-family households (27 | 23.9%) represent the smallest median household size with 1.37 persons per household.
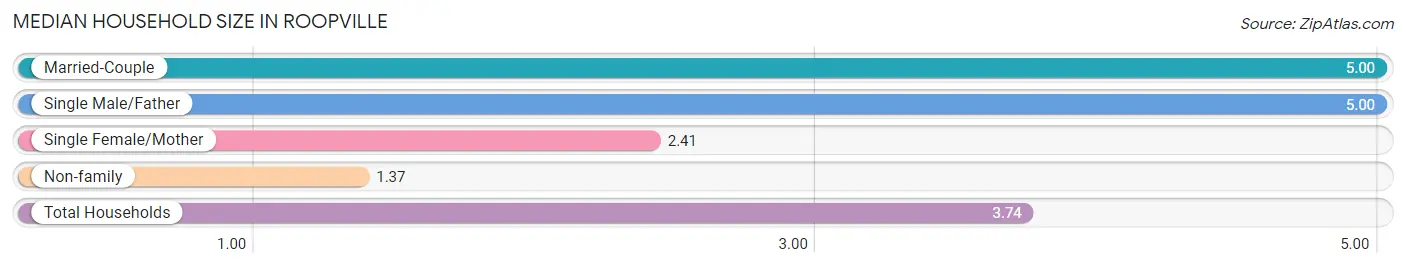
| Household Type | # Households | Household Size |
| Married-Couple | 67 (59.3%) | 5.00 |
| Single Male/Father | 2 (1.8%) | 5.00 |
| Single Female/Mother | 17 (15.0%) | 2.41 |
| Non-family | 27 (23.9%) | 1.37 |
| Total Households | 113 (100.0%) | 3.74 |
Household Size by Marriage Status in Roopville
Out of a total of 113 households in Roopville, 86 (76.1%) are family households, while 27 (23.9%) are nonfamily households. The most numerous type of family households are 2-person households, comprising 23, and the most common type of nonfamily households are 1-person households, comprising 17.
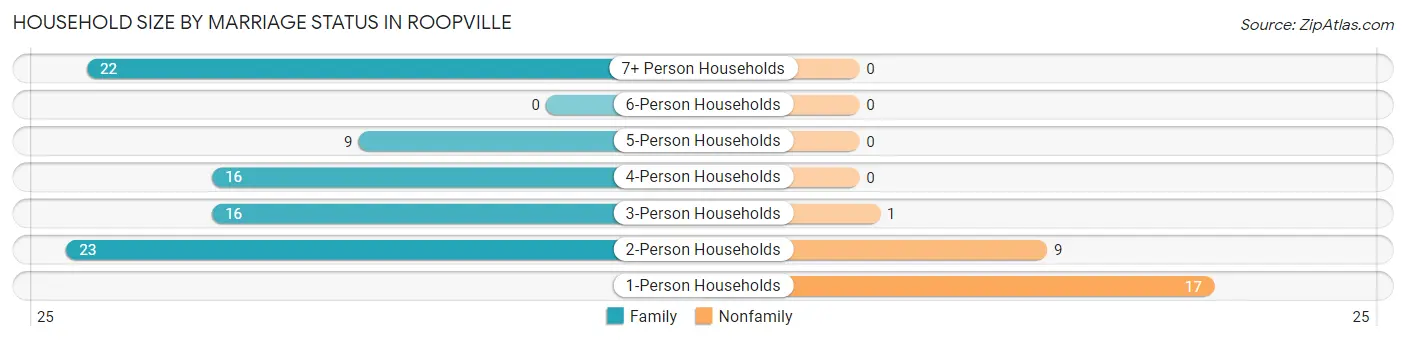
| Household Size | Family Households | Nonfamily Households |
| 1-Person Households | - | 17 (15.0%) |
| 2-Person Households | 23 (20.3%) | 9 (8.0%) |
| 3-Person Households | 16 (14.2%) | 1 (0.9%) |
| 4-Person Households | 16 (14.2%) | 0 (0.0%) |
| 5-Person Households | 9 (8.0%) | 0 (0.0%) |
| 6-Person Households | 0 (0.0%) | 0 (0.0%) |
| 7+ Person Households | 22 (19.5%) | 0 (0.0%) |
| Total | 86 (76.1%) | 27 (23.9%) |
Female Fertility in Roopville
Fertility by Age in Roopville
Average fertility rate in Roopville is 21.0 births per 1,000 women. Women in the age bracket of 20 to 34 years have the highest fertility rate with 30.0 births per 1,000 women. Women in the age bracket of 20 to 34 years acount for 100.0% of all women with births.
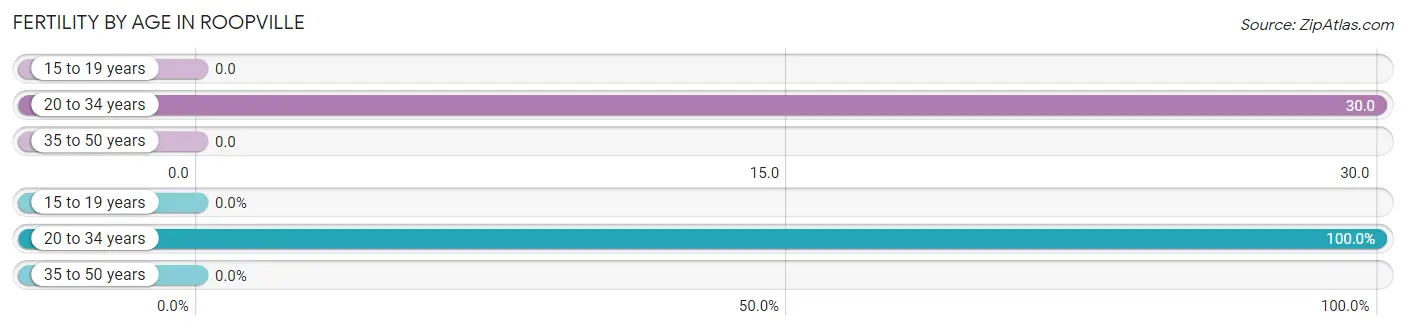
| Age Bracket | Women with Births | Births / 1,000 Women |
| 15 to 19 years | 0 (0.0%) | 0.0 |
| 20 to 34 years | 2 (100.0%) | 30.0 |
| 35 to 50 years | 0 (0.0%) | 0.0 |
| Total | 2 (100.0%) | 21.0 |
Fertility by Age by Marriage Status in Roopville
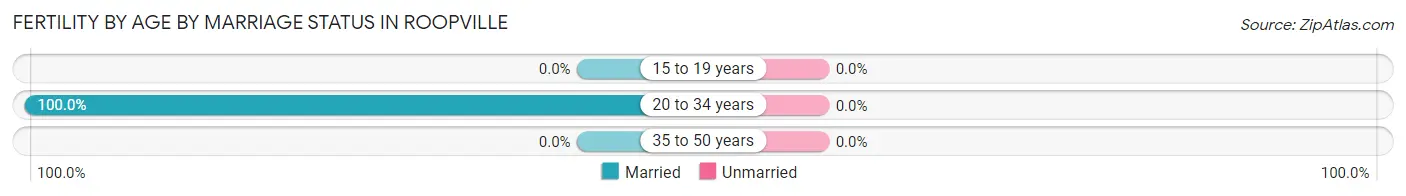
| Age Bracket | Married | Unmarried |
| 15 to 19 years | 0 (0.0%) | 0 (0.0%) |
| 20 to 34 years | 2 (100.0%) | 0 (0.0%) |
| 35 to 50 years | 0 (0.0%) | 0 (0.0%) |
| Total | 2 (100.0%) | 0 (0.0%) |
Fertility by Education in Roopville
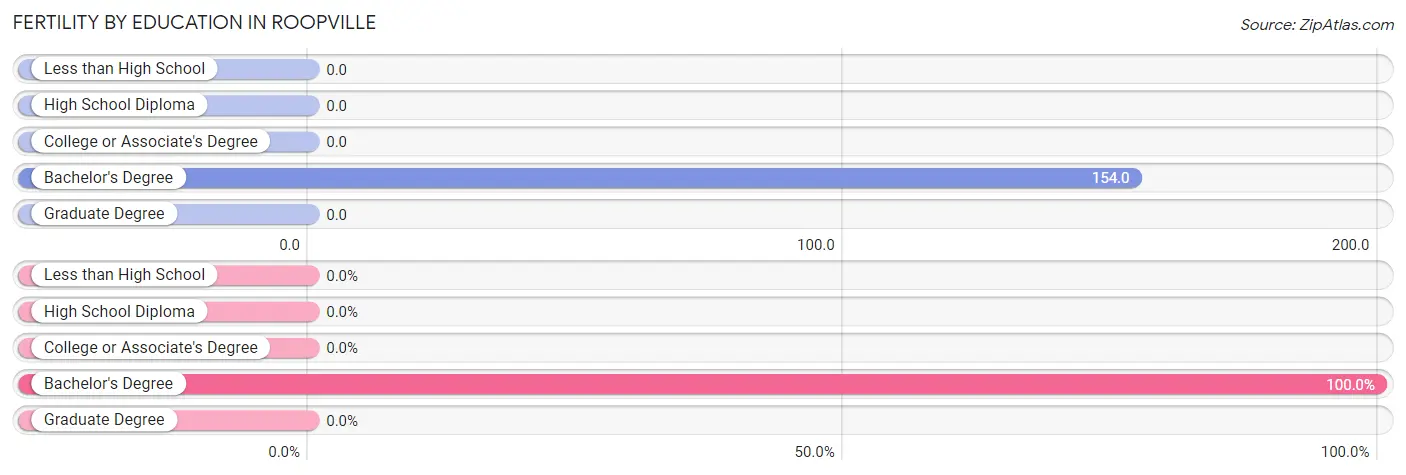
| Educational Attainment | Women with Births | Births / 1,000 Women |
| Less than High School | 0 (0.0%) | 0.0 |
| High School Diploma | 0 (0.0%) | 0.0 |
| College or Associate's Degree | 0 (0.0%) | 0.0 |
| Bachelor's Degree | 2 (100.0%) | 154.0 |
| Graduate Degree | 0 (0.0%) | 0.0 |
| Total | 2 (100.0%) | 21.0 |
Fertility by Education by Marriage Status in Roopville
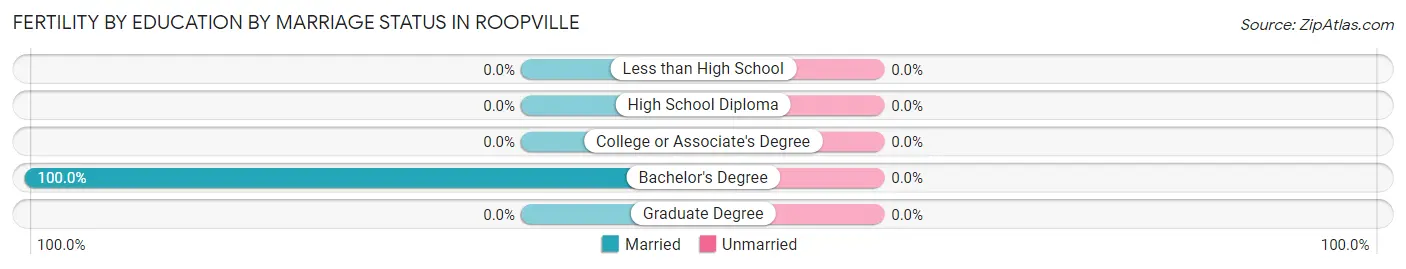
| Educational Attainment | Married | Unmarried |
| Less than High School | 0 (0.0%) | 0 (0.0%) |
| High School Diploma | 0 (0.0%) | 0 (0.0%) |
| College or Associate's Degree | 0 (0.0%) | 0 (0.0%) |
| Bachelor's Degree | 2 (100.0%) | 0 (0.0%) |
| Graduate Degree | 0 (0.0%) | 0 (0.0%) |
| Total | 2 (100.0%) | 0 (0.0%) |
Employment Characteristics in Roopville
Employment by Class of Employer in Roopville
Among the 139 employed individuals in Roopville, private company employees (98 | 70.5%), state government employees (13 | 9.3%), and not-for-profit organizations (12 | 8.6%) make up the most common classes of employment.
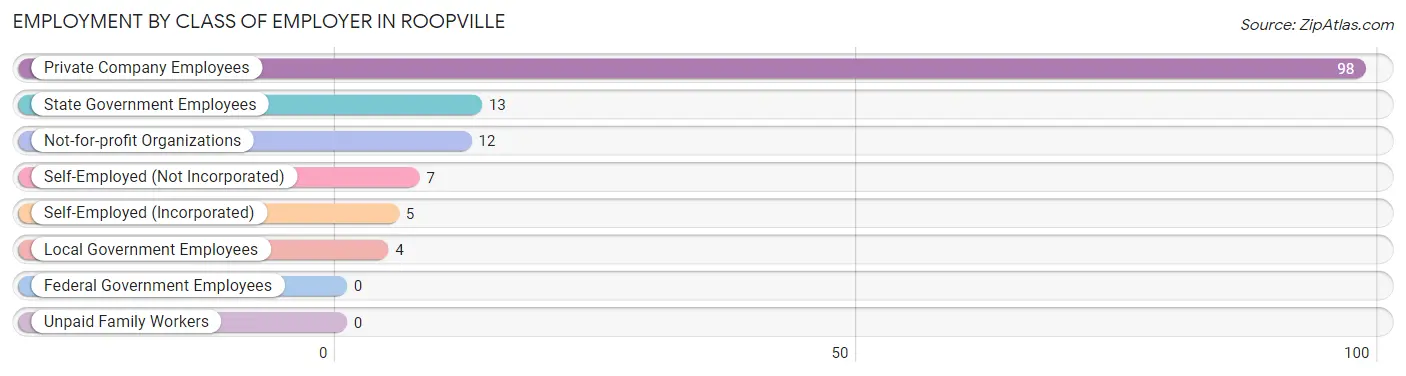
| Employer Class | # Employees | % Employees |
| Private Company Employees | 98 | 70.5% |
| Self-Employed (Incorporated) | 5 | 3.6% |
| Self-Employed (Not Incorporated) | 7 | 5.0% |
| Not-for-profit Organizations | 12 | 8.6% |
| Local Government Employees | 4 | 2.9% |
| State Government Employees | 13 | 9.3% |
| Federal Government Employees | 0 | 0.0% |
| Unpaid Family Workers | 0 | 0.0% |
| Total | 139 | 100.0% |
Employment Status by Age in Roopville
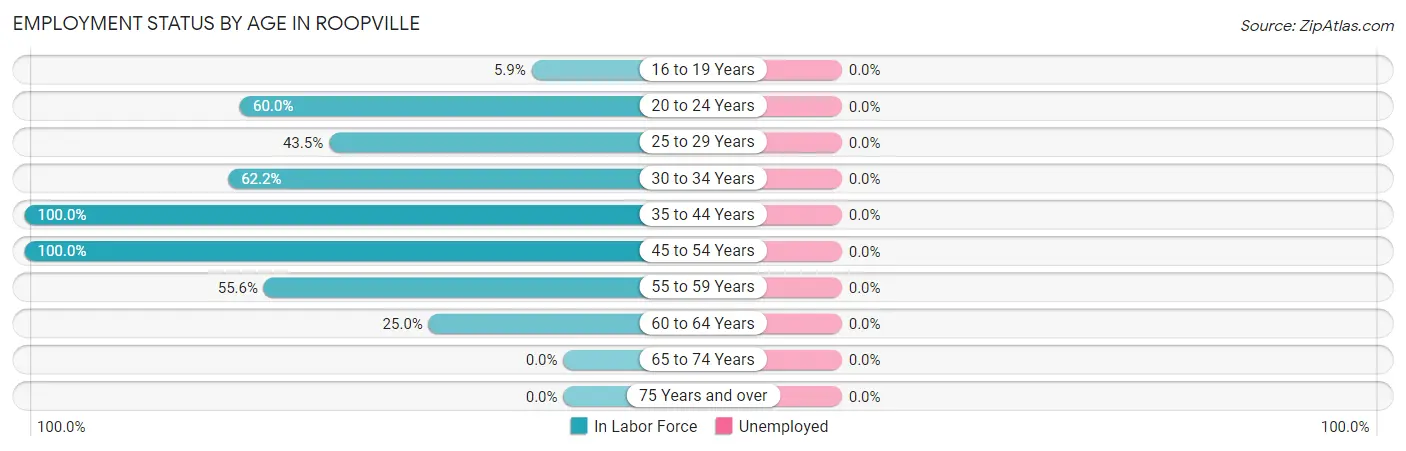
| Age Bracket | In Labor Force | Unemployed |
| 16 to 19 Years | 1 (5.9%) | 0 (0.0%) |
| 20 to 24 Years | 3 (60.0%) | 0 (0.0%) |
| 25 to 29 Years | 37 (43.5%) | 0 (0.0%) |
| 30 to 34 Years | 28 (62.2%) | 0 (0.0%) |
| 35 to 44 Years | 43 (100.0%) | 0 (0.0%) |
| 45 to 54 Years | 9 (100.0%) | 0 (0.0%) |
| 55 to 59 Years | 10 (55.6%) | 0 (0.0%) |
| 60 to 64 Years | 9 (25.0%) | 0 (0.0%) |
| 65 to 74 Years | 0 (0.0%) | 0 (0.0%) |
| 75 Years and over | 0 (0.0%) | 0 (0.0%) |
| Total | 140 (46.7%) | 0 (0.0%) |
Employment Status by Educational Attainment in Roopville
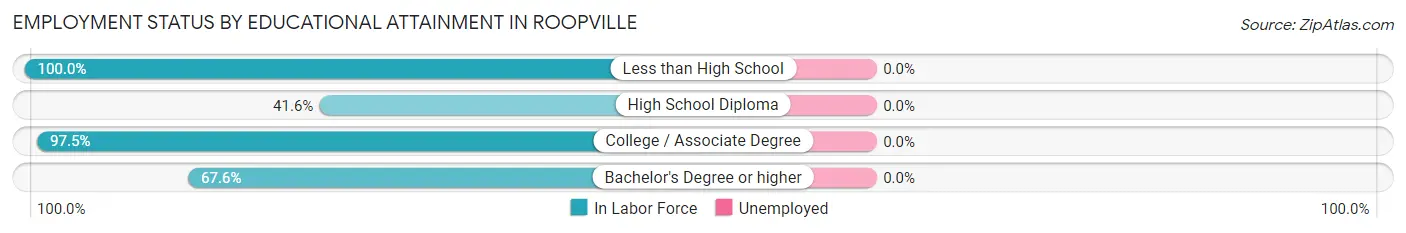
| Educational Attainment | In Labor Force | Unemployed |
| Less than High School | 10 (100.0%) | 0 (0.0%) |
| High School Diploma | 62 (41.6%) | 0 (0.0%) |
| College / Associate Degree | 39 (97.5%) | 0 (0.0%) |
| Bachelor's Degree or higher | 25 (67.6%) | 0 (0.0%) |
| Total | 136 (57.6%) | 0 (0.0%) |
Employment Occupations by Sex in Roopville
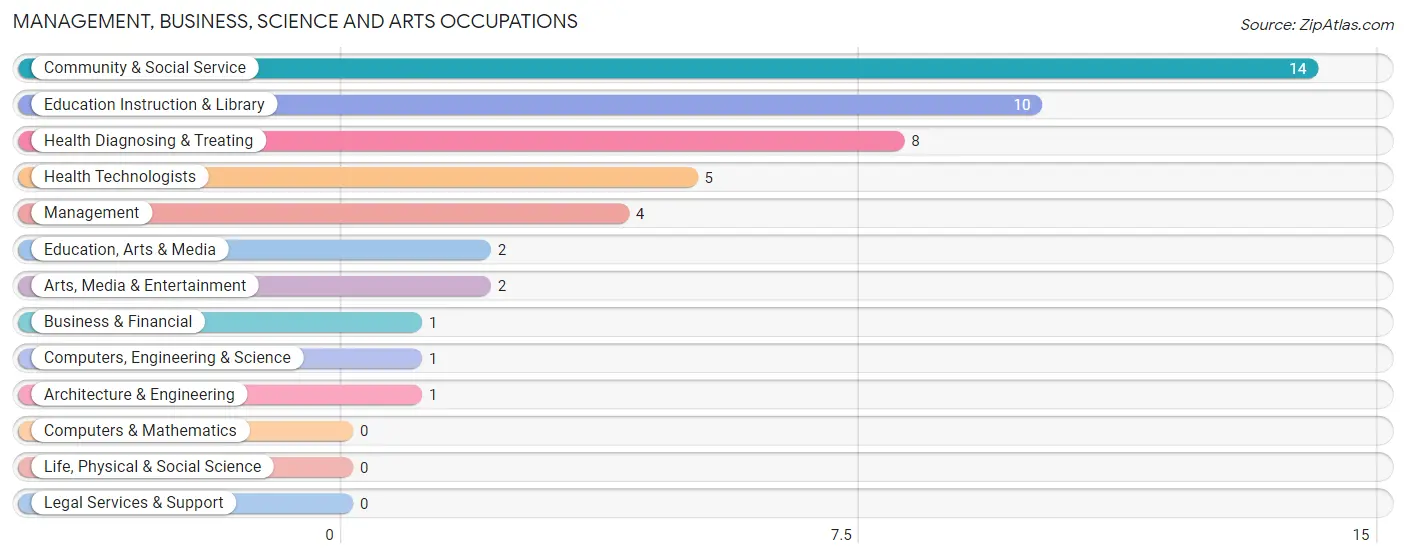
Management, Business, Science and Arts Occupations
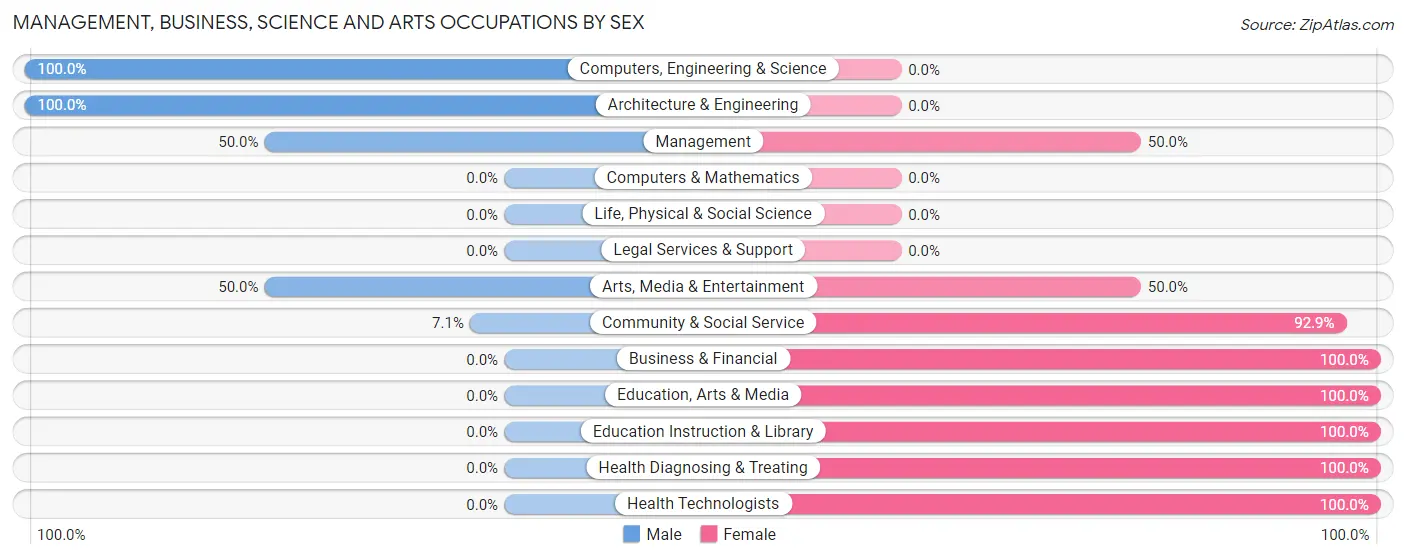
The most common Management, Business, Science and Arts occupations in Roopville are Community & Social Service (14 | 10.0%), Education Instruction & Library (10 | 7.1%), Health Diagnosing & Treating (8 | 5.7%), Health Technologists (5 | 3.6%), and Management (4 | 2.9%).
Management, Business, Science and Arts Occupations by Sex
Within the Management, Business, Science and Arts occupations in Roopville, the most male-oriented occupations are Computers, Engineering & Science (100.0%), Architecture & Engineering (100.0%), and Management (50.0%), while the most female-oriented occupations are Business & Financial (100.0%), Education, Arts & Media (100.0%), and Education Instruction & Library (100.0%).
| Occupation | Male | Female |
| Management | 2 (50.0%) | 2 (50.0%) |
| Business & Financial | 0 (0.0%) | 1 (100.0%) |
| Computers, Engineering & Science | 1 (100.0%) | 0 (0.0%) |
| Computers & Mathematics | 0 (0.0%) | 0 (0.0%) |
| Architecture & Engineering | 1 (100.0%) | 0 (0.0%) |
| Life, Physical & Social Science | 0 (0.0%) | 0 (0.0%) |
| Community & Social Service | 1 (7.1%) | 13 (92.9%) |
| Education, Arts & Media | 0 (0.0%) | 2 (100.0%) |
| Legal Services & Support | 0 (0.0%) | 0 (0.0%) |
| Education Instruction & Library | 0 (0.0%) | 10 (100.0%) |
| Arts, Media & Entertainment | 1 (50.0%) | 1 (50.0%) |
| Health Diagnosing & Treating | 0 (0.0%) | 8 (100.0%) |
| Health Technologists | 0 (0.0%) | 5 (100.0%) |
| Total (Category) | 4 (14.3%) | 24 (85.7%) |
| Total (Overall) | 78 (55.7%) | 62 (44.3%) |
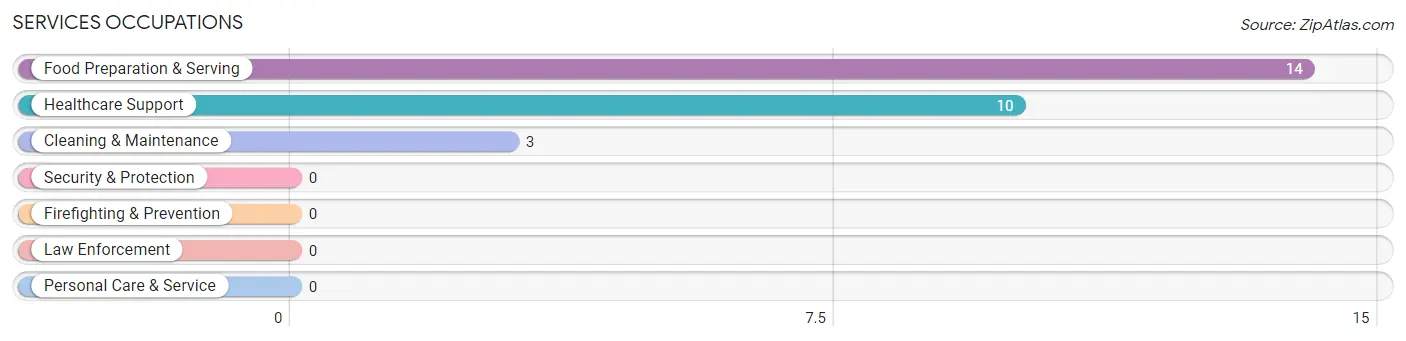
Services Occupations
The most common Services occupations in Roopville are Food Preparation & Serving (14 | 10.0%), Healthcare Support (10 | 7.1%), and Cleaning & Maintenance (3 | 2.1%).
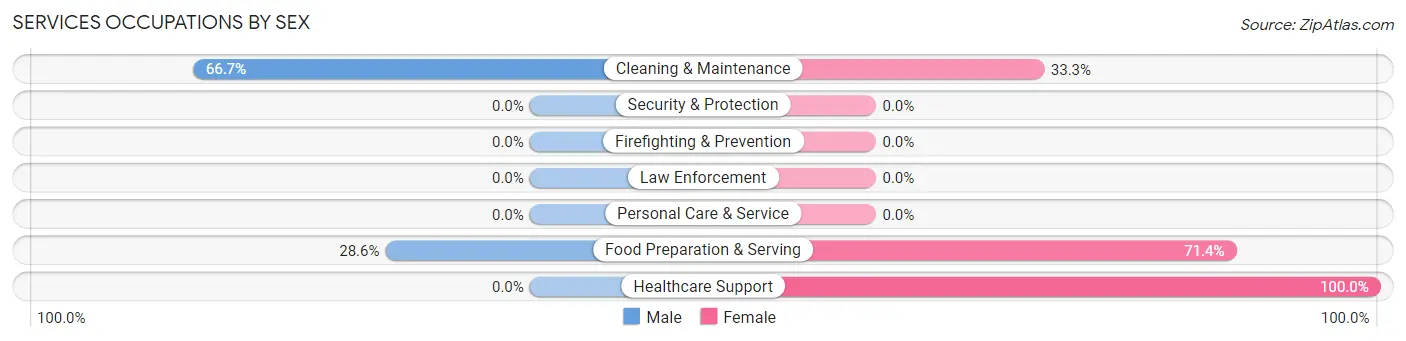
Services Occupations by Sex
Within the Services occupations in Roopville, the most male-oriented occupations are Cleaning & Maintenance (66.7%), and Food Preparation & Serving (28.6%), while the most female-oriented occupations are Healthcare Support (100.0%), Food Preparation & Serving (71.4%), and Cleaning & Maintenance (33.3%).
| Occupation | Male | Female |
| Healthcare Support | 0 (0.0%) | 10 (100.0%) |
| Security & Protection | 0 (0.0%) | 0 (0.0%) |
| Firefighting & Prevention | 0 (0.0%) | 0 (0.0%) |
| Law Enforcement | 0 (0.0%) | 0 (0.0%) |
| Food Preparation & Serving | 4 (28.6%) | 10 (71.4%) |
| Cleaning & Maintenance | 2 (66.7%) | 1 (33.3%) |
| Personal Care & Service | 0 (0.0%) | 0 (0.0%) |
| Total (Category) | 6 (22.2%) | 21 (77.8%) |
| Total (Overall) | 78 (55.7%) | 62 (44.3%) |
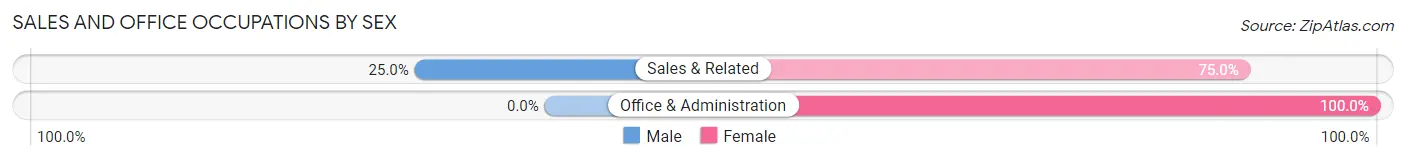
Sales and Office Occupations
The most common Sales and Office occupations in Roopville are Sales & Related (8 | 5.7%), and Office & Administration (8 | 5.7%).

Sales and Office Occupations by Sex
| Occupation | Male | Female |
| Sales & Related | 2 (25.0%) | 6 (75.0%) |
| Office & Administration | 0 (0.0%) | 8 (100.0%) |
| Total (Category) | 2 (12.5%) | 14 (87.5%) |
| Total (Overall) | 78 (55.7%) | 62 (44.3%) |
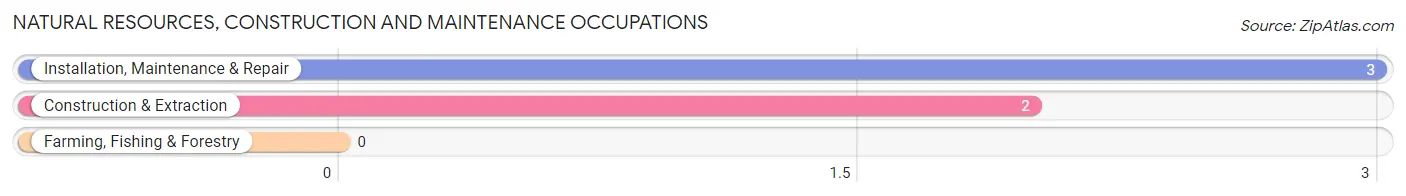
Natural Resources, Construction and Maintenance Occupations
The most common Natural Resources, Construction and Maintenance occupations in Roopville are Installation, Maintenance & Repair (3 | 2.1%), and Construction & Extraction (2 | 1.4%).
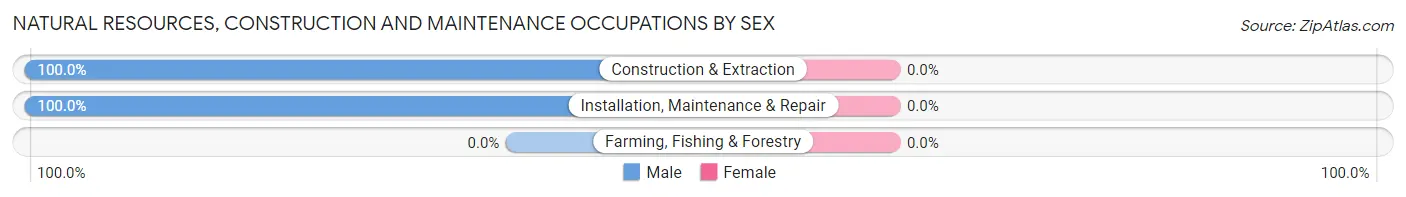
Natural Resources, Construction and Maintenance Occupations by Sex
| Occupation | Male | Female |
| Farming, Fishing & Forestry | 0 (0.0%) | 0 (0.0%) |
| Construction & Extraction | 2 (100.0%) | 0 (0.0%) |
| Installation, Maintenance & Repair | 3 (100.0%) | 0 (0.0%) |
| Total (Category) | 5 (100.0%) | 0 (0.0%) |
| Total (Overall) | 78 (55.7%) | 62 (44.3%) |
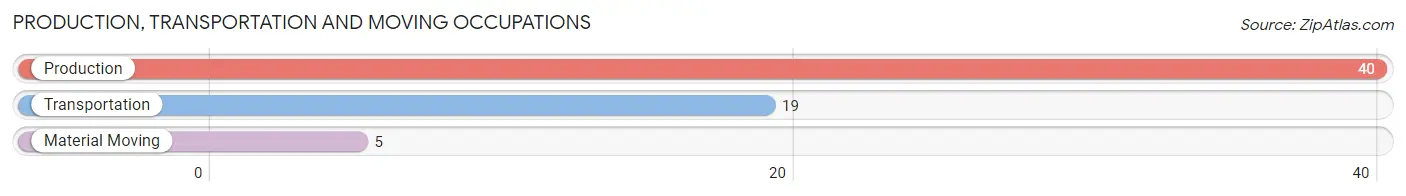
Production, Transportation and Moving Occupations
The most common Production, Transportation and Moving occupations in Roopville are Production (40 | 28.6%), Transportation (19 | 13.6%), and Material Moving (5 | 3.6%).
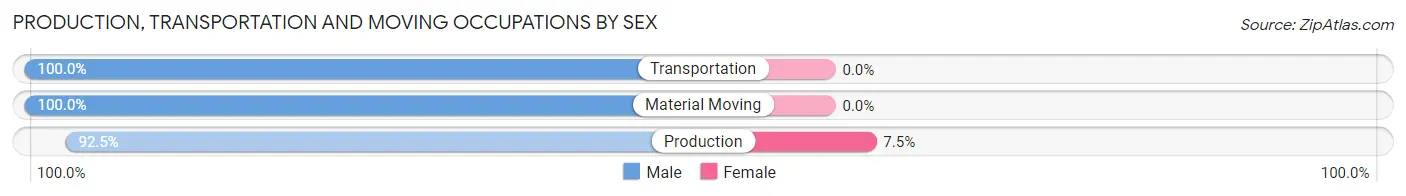
Production, Transportation and Moving Occupations by Sex
| Occupation | Male | Female |
| Production | 37 (92.5%) | 3 (7.5%) |
| Transportation | 19 (100.0%) | 0 (0.0%) |
| Material Moving | 5 (100.0%) | 0 (0.0%) |
| Total (Category) | 61 (95.3%) | 3 (4.7%) |
| Total (Overall) | 78 (55.7%) | 62 (44.3%) |
Employment Industries by Sex in Roopville
Employment Industries in Roopville
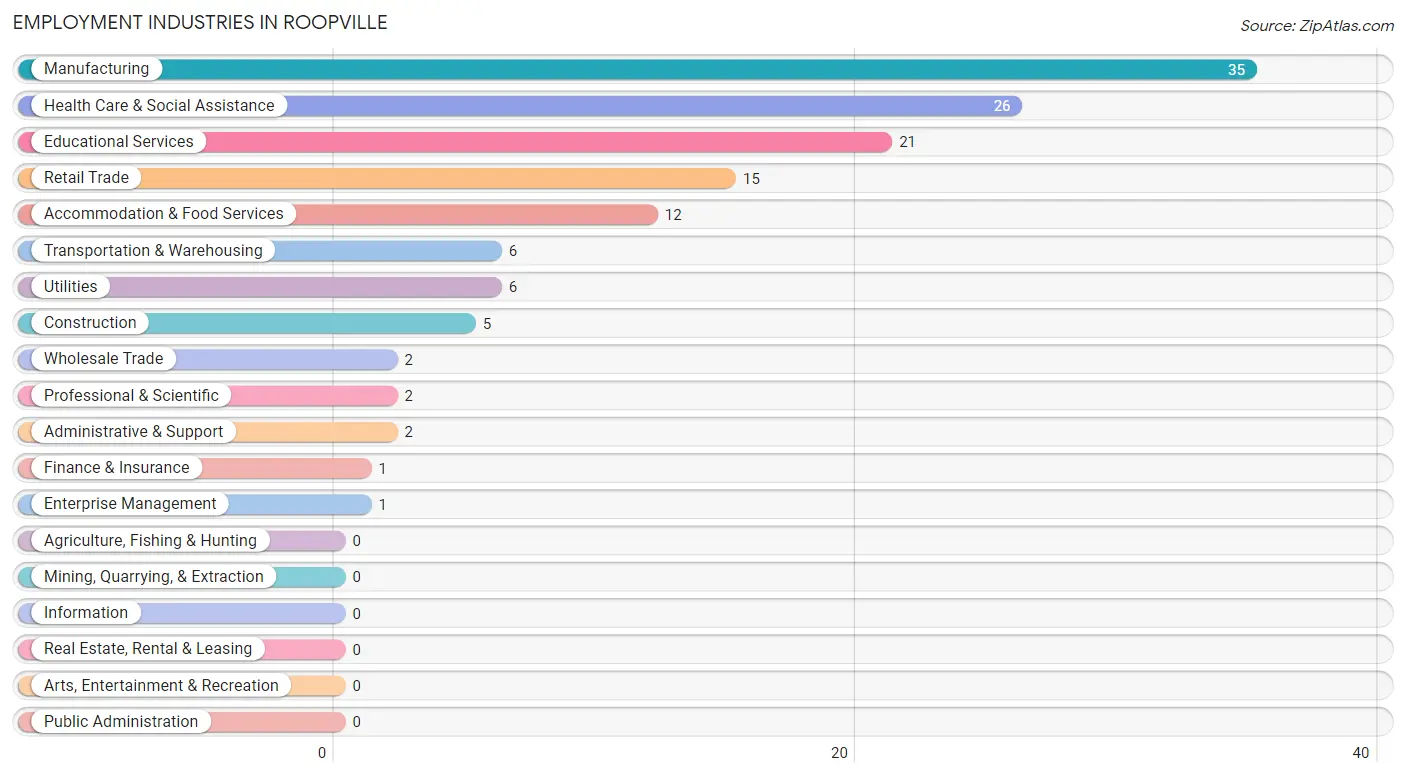
The major employment industries in Roopville include Manufacturing (35 | 25.0%), Health Care & Social Assistance (26 | 18.6%), Educational Services (21 | 15.0%), Retail Trade (15 | 10.7%), and Accommodation & Food Services (12 | 8.6%).
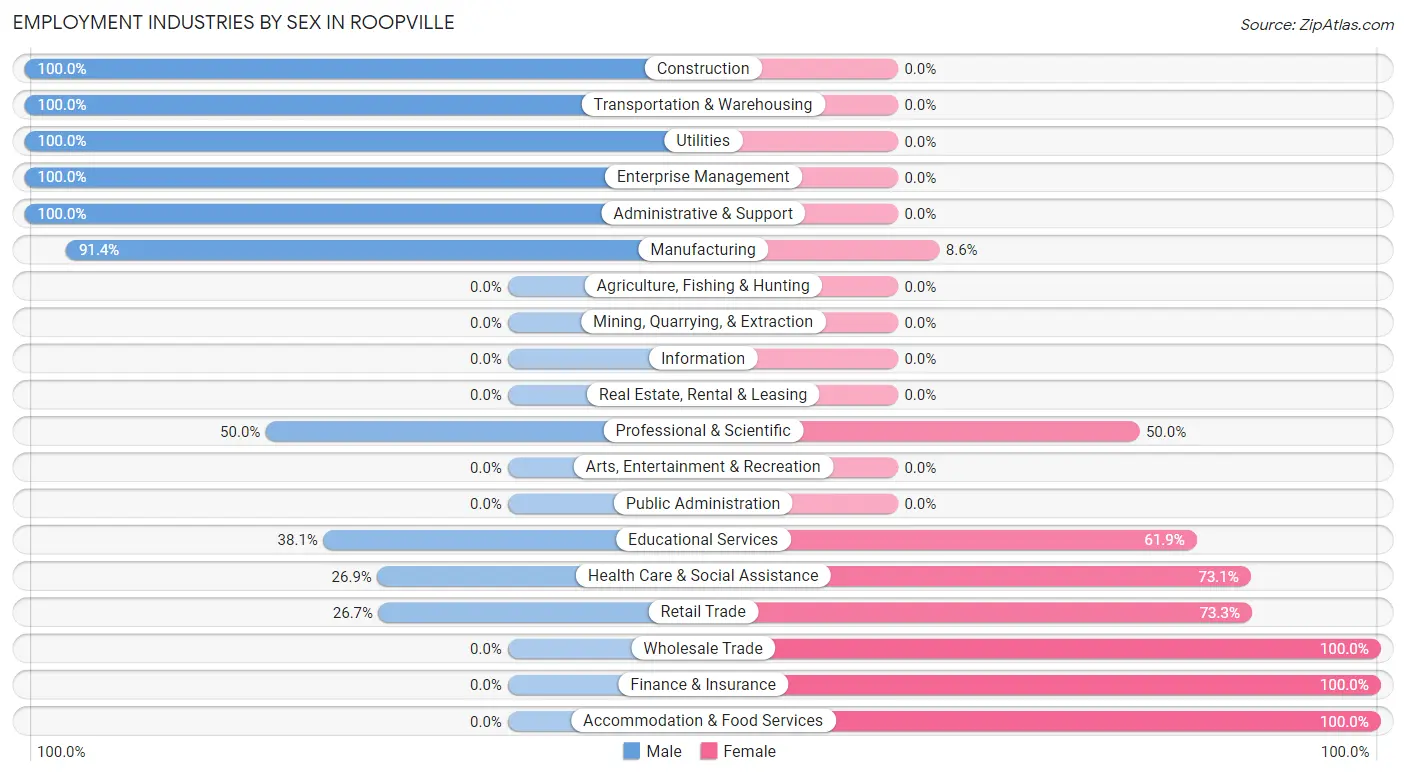
Employment Industries by Sex in Roopville
The Roopville industries that see more men than women are Construction (100.0%), Transportation & Warehousing (100.0%), and Utilities (100.0%), whereas the industries that tend to have a higher number of women are Wholesale Trade (100.0%), Finance & Insurance (100.0%), and Accommodation & Food Services (100.0%).
| Industry | Male | Female |
| Agriculture, Fishing & Hunting | 0 (0.0%) | 0 (0.0%) |
| Mining, Quarrying, & Extraction | 0 (0.0%) | 0 (0.0%) |
| Construction | 5 (100.0%) | 0 (0.0%) |
| Manufacturing | 32 (91.4%) | 3 (8.6%) |
| Wholesale Trade | 0 (0.0%) | 2 (100.0%) |
| Retail Trade | 4 (26.7%) | 11 (73.3%) |
| Transportation & Warehousing | 6 (100.0%) | 0 (0.0%) |
| Utilities | 6 (100.0%) | 0 (0.0%) |
| Information | 0 (0.0%) | 0 (0.0%) |
| Finance & Insurance | 0 (0.0%) | 1 (100.0%) |
| Real Estate, Rental & Leasing | 0 (0.0%) | 0 (0.0%) |
| Professional & Scientific | 1 (50.0%) | 1 (50.0%) |
| Enterprise Management | 1 (100.0%) | 0 (0.0%) |
| Administrative & Support | 2 (100.0%) | 0 (0.0%) |
| Educational Services | 8 (38.1%) | 13 (61.9%) |
| Health Care & Social Assistance | 7 (26.9%) | 19 (73.1%) |
| Arts, Entertainment & Recreation | 0 (0.0%) | 0 (0.0%) |
| Accommodation & Food Services | 0 (0.0%) | 12 (100.0%) |
| Public Administration | 0 (0.0%) | 0 (0.0%) |
| Total | 78 (55.7%) | 62 (44.3%) |
Education in Roopville
School Enrollment in Roopville
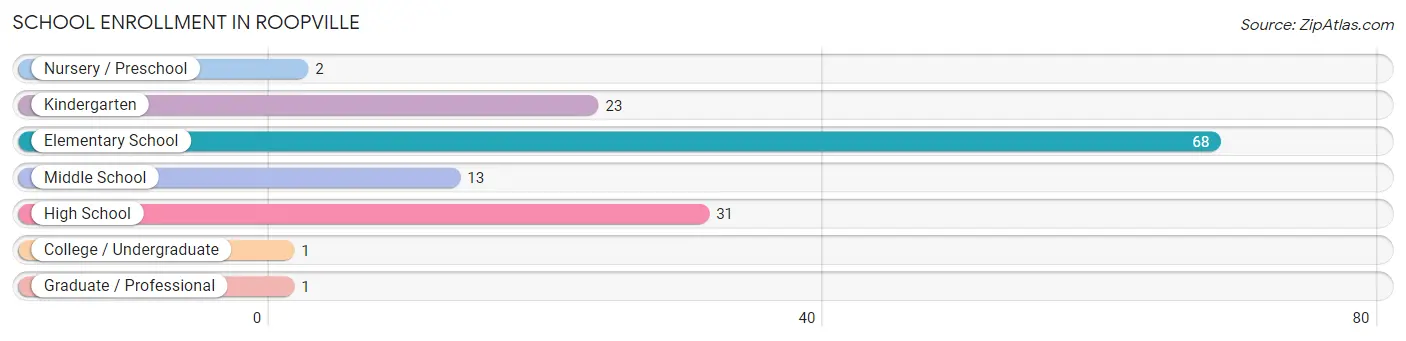
The most common levels of schooling among the 139 students in Roopville are elementary school (68 | 48.9%), high school (31 | 22.3%), and kindergarten (23 | 16.6%).
| School Level | # Students | % Students |
| Nursery / Preschool | 2 | 1.4% |
| Kindergarten | 23 | 16.6% |
| Elementary School | 68 | 48.9% |
| Middle School | 13 | 9.3% |
| High School | 31 | 22.3% |
| College / Undergraduate | 1 | 0.7% |
| Graduate / Professional | 1 | 0.7% |
| Total | 139 | 100.0% |
School Enrollment by Age by Funding Source in Roopville
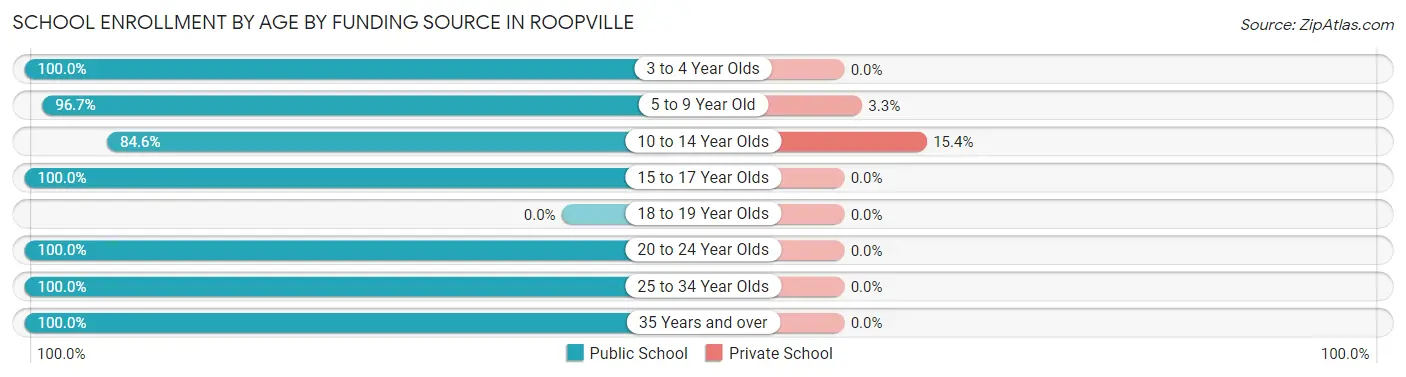
Out of a total of 139 students who are enrolled in schools in Roopville, 5 (3.6%) attend a private institution, while the remaining 134 (96.4%) are enrolled in public schools. The age group of 10 to 14 year olds has the highest likelihood of being enrolled in private schools, with 2 (15.4% in the age bracket) enrolled. Conversely, the age group of 3 to 4 year olds has the lowest likelihood of being enrolled in a private school, with 2 (100.0% in the age bracket) attending a public institution.
| Age Bracket | Public School | Private School |
| 3 to 4 Year Olds | 2 (100.0%) | 0 (0.0%) |
| 5 to 9 Year Old | 88 (96.7%) | 3 (3.3%) |
| 10 to 14 Year Olds | 11 (84.6%) | 2 (15.4%) |
| 15 to 17 Year Olds | 29 (100.0%) | 0 (0.0%) |
| 18 to 19 Year Olds | 0 (0.0%) | 0 (0.0%) |
| 20 to 24 Year Olds | 2 (100.0%) | 0 (0.0%) |
| 25 to 34 Year Olds | 1 (100.0%) | 0 (0.0%) |
| 35 Years and over | 1 (100.0%) | 0 (0.0%) |
| Total | 134 (96.4%) | 5 (3.6%) |
Educational Attainment by Field of Study in Roopville
Bio, nature & agricultural (10 | 22.2%), education (8 | 17.8%), physical & health sciences (5 | 11.1%), engineering (5 | 11.1%), and business (5 | 11.1%) are the most common fields of study among 45 individuals in Roopville who have obtained a bachelor's degree or higher.
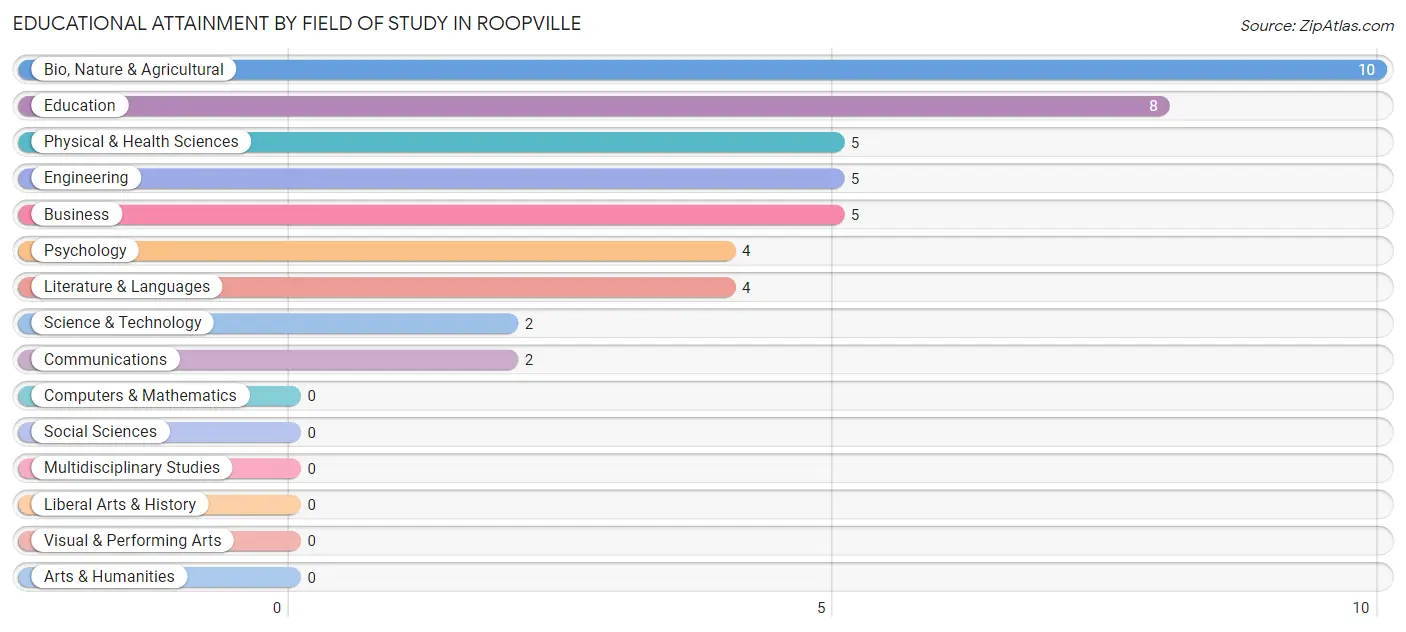
| Field of Study | # Graduates | % Graduates |
| Computers & Mathematics | 0 | 0.0% |
| Bio, Nature & Agricultural | 10 | 22.2% |
| Physical & Health Sciences | 5 | 11.1% |
| Psychology | 4 | 8.9% |
| Social Sciences | 0 | 0.0% |
| Engineering | 5 | 11.1% |
| Multidisciplinary Studies | 0 | 0.0% |
| Science & Technology | 2 | 4.4% |
| Business | 5 | 11.1% |
| Education | 8 | 17.8% |
| Literature & Languages | 4 | 8.9% |
| Liberal Arts & History | 0 | 0.0% |
| Visual & Performing Arts | 0 | 0.0% |
| Communications | 2 | 4.4% |
| Arts & Humanities | 0 | 0.0% |
| Total | 45 | 100.0% |
Transportation & Commute in Roopville
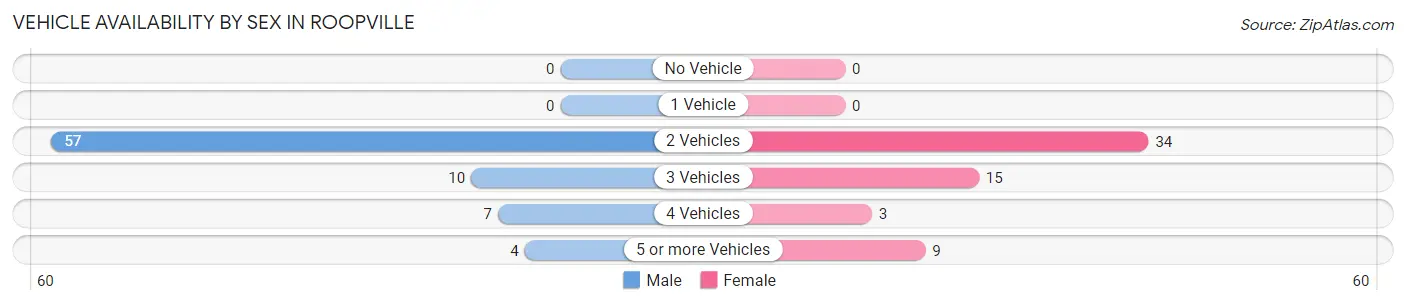
Vehicle Availability by Sex in Roopville
The most prevalent vehicle ownership categories in Roopville are males with 2 vehicles (57, accounting for 73.1%) and females with 2 vehicles (34, making up 93.4%).
| Vehicles Available | Male | Female |
| No Vehicle | 0 (0.0%) | 0 (0.0%) |
| 1 Vehicle | 0 (0.0%) | 0 (0.0%) |
| 2 Vehicles | 57 (73.1%) | 34 (55.7%) |
| 3 Vehicles | 10 (12.8%) | 15 (24.6%) |
| 4 Vehicles | 7 (9.0%) | 3 (4.9%) |
| 5 or more Vehicles | 4 (5.1%) | 9 (14.7%) |
| Total | 78 (100.0%) | 61 (100.0%) |
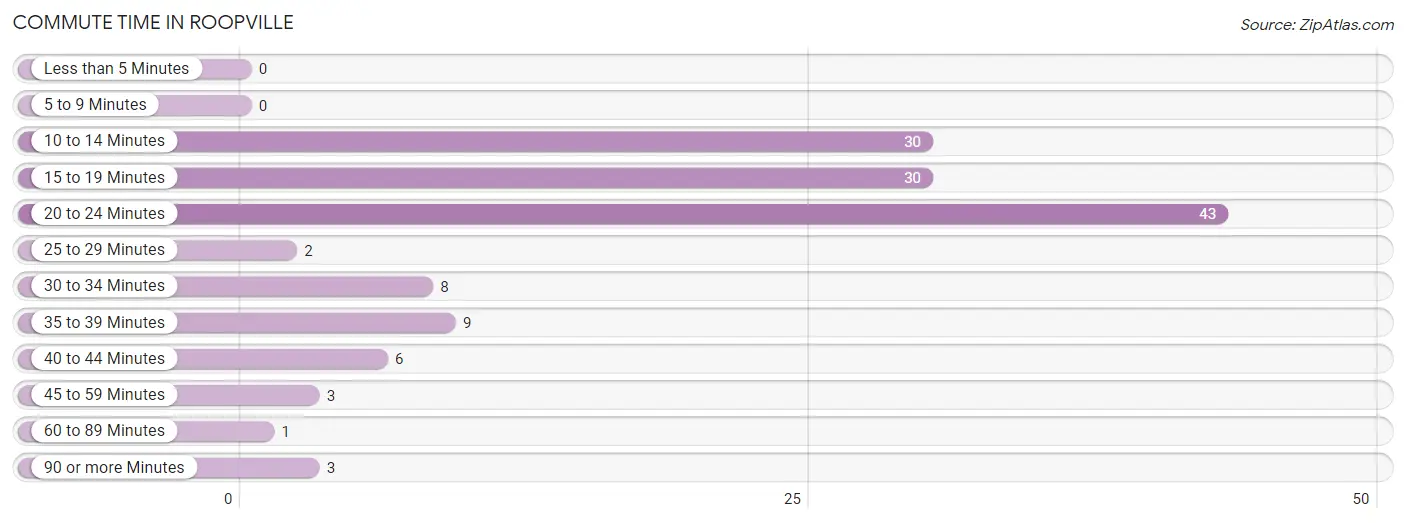
Commute Time in Roopville
The most frequently occuring commute durations in Roopville are 20 to 24 minutes (43 commuters, 31.9%), 10 to 14 minutes (30 commuters, 22.2%), and 15 to 19 minutes (30 commuters, 22.2%).
| Commute Time | # Commuters | % Commuters |
| Less than 5 Minutes | 0 | 0.0% |
| 5 to 9 Minutes | 0 | 0.0% |
| 10 to 14 Minutes | 30 | 22.2% |
| 15 to 19 Minutes | 30 | 22.2% |
| 20 to 24 Minutes | 43 | 31.9% |
| 25 to 29 Minutes | 2 | 1.5% |
| 30 to 34 Minutes | 8 | 5.9% |
| 35 to 39 Minutes | 9 | 6.7% |
| 40 to 44 Minutes | 6 | 4.4% |
| 45 to 59 Minutes | 3 | 2.2% |
| 60 to 89 Minutes | 1 | 0.7% |
| 90 or more Minutes | 3 | 2.2% |
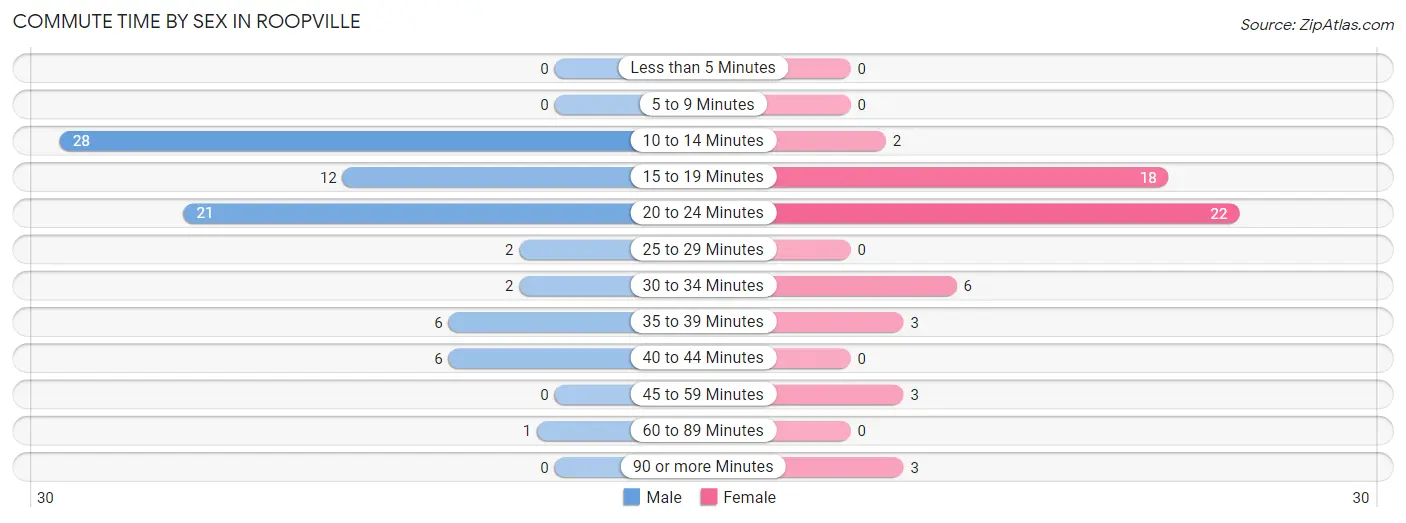
Commute Time by Sex in Roopville
The most common commute times in Roopville are 10 to 14 minutes (28 commuters, 35.9%) for males and 20 to 24 minutes (22 commuters, 38.6%) for females.
| Commute Time | Male | Female |
| Less than 5 Minutes | 0 (0.0%) | 0 (0.0%) |
| 5 to 9 Minutes | 0 (0.0%) | 0 (0.0%) |
| 10 to 14 Minutes | 28 (35.9%) | 2 (3.5%) |
| 15 to 19 Minutes | 12 (15.4%) | 18 (31.6%) |
| 20 to 24 Minutes | 21 (26.9%) | 22 (38.6%) |
| 25 to 29 Minutes | 2 (2.6%) | 0 (0.0%) |
| 30 to 34 Minutes | 2 (2.6%) | 6 (10.5%) |
| 35 to 39 Minutes | 6 (7.7%) | 3 (5.3%) |
| 40 to 44 Minutes | 6 (7.7%) | 0 (0.0%) |
| 45 to 59 Minutes | 0 (0.0%) | 3 (5.3%) |
| 60 to 89 Minutes | 1 (1.3%) | 0 (0.0%) |
| 90 or more Minutes | 0 (0.0%) | 3 (5.3%) |
Time of Departure to Work by Sex in Roopville
The most frequent times of departure to work in Roopville are 12:00 PM to 3:59 PM (22, 28.2%) for males and 8:00 AM to 8:29 AM (20, 35.1%) for females.
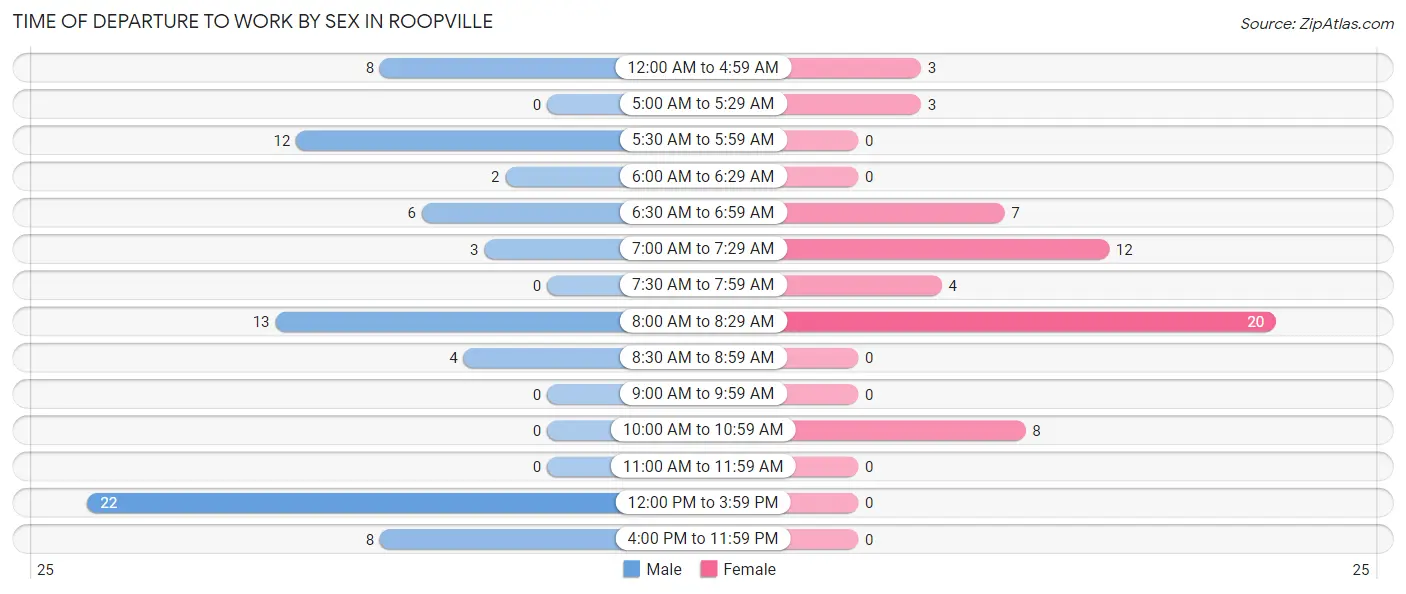
| Time of Departure | Male | Female |
| 12:00 AM to 4:59 AM | 8 (10.3%) | 3 (5.3%) |
| 5:00 AM to 5:29 AM | 0 (0.0%) | 3 (5.3%) |
| 5:30 AM to 5:59 AM | 12 (15.4%) | 0 (0.0%) |
| 6:00 AM to 6:29 AM | 2 (2.6%) | 0 (0.0%) |
| 6:30 AM to 6:59 AM | 6 (7.7%) | 7 (12.3%) |
| 7:00 AM to 7:29 AM | 3 (3.8%) | 12 (21.0%) |
| 7:30 AM to 7:59 AM | 0 (0.0%) | 4 (7.0%) |
| 8:00 AM to 8:29 AM | 13 (16.7%) | 20 (35.1%) |
| 8:30 AM to 8:59 AM | 4 (5.1%) | 0 (0.0%) |
| 9:00 AM to 9:59 AM | 0 (0.0%) | 0 (0.0%) |
| 10:00 AM to 10:59 AM | 0 (0.0%) | 8 (14.0%) |
| 11:00 AM to 11:59 AM | 0 (0.0%) | 0 (0.0%) |
| 12:00 PM to 3:59 PM | 22 (28.2%) | 0 (0.0%) |
| 4:00 PM to 11:59 PM | 8 (10.3%) | 0 (0.0%) |
| Total | 78 (100.0%) | 57 (100.0%) |
Housing Occupancy in Roopville
Occupancy by Ownership in Roopville
Of the total 113 dwellings in Roopville, owner-occupied units account for 61 (54.0%), while renter-occupied units make up 52 (46.0%).
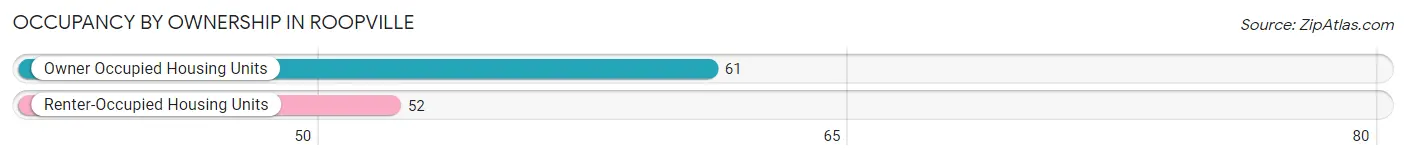
| Occupancy | # Housing Units | % Housing Units |
| Owner Occupied Housing Units | 61 | 54.0% |
| Renter-Occupied Housing Units | 52 | 46.0% |
| Total Occupied Housing Units | 113 | 100.0% |
Occupancy by Household Size in Roopville
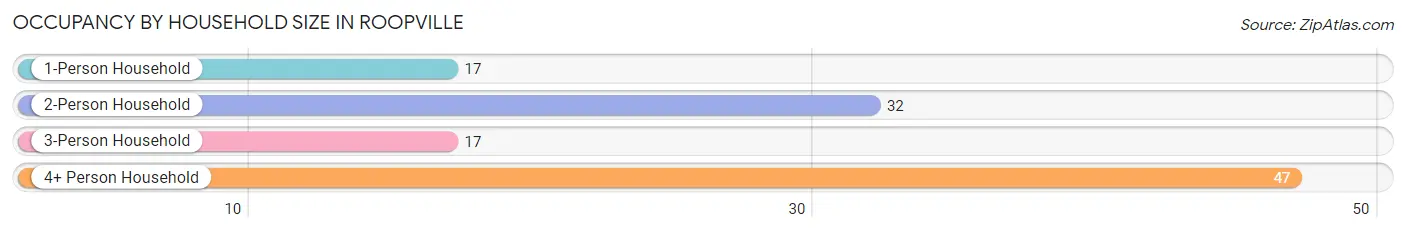
| Household Size | # Housing Units | % Housing Units |
| 1-Person Household | 17 | 15.0% |
| 2-Person Household | 32 | 28.3% |
| 3-Person Household | 17 | 15.0% |
| 4+ Person Household | 47 | 41.6% |
| Total Housing Units | 113 | 100.0% |
Occupancy by Ownership by Household Size in Roopville
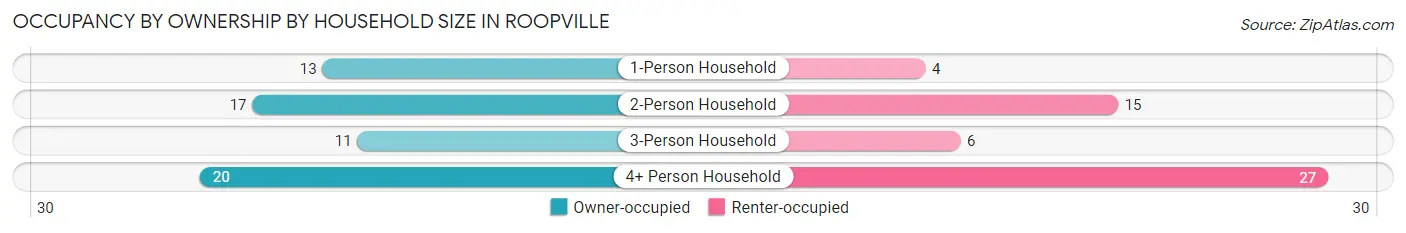
| Household Size | Owner-occupied | Renter-occupied |
| 1-Person Household | 13 (76.5%) | 4 (23.5%) |
| 2-Person Household | 17 (53.1%) | 15 (46.9%) |
| 3-Person Household | 11 (64.7%) | 6 (35.3%) |
| 4+ Person Household | 20 (42.5%) | 27 (57.5%) |
| Total Housing Units | 61 (54.0%) | 52 (46.0%) |
Occupancy by Educational Attainment in Roopville
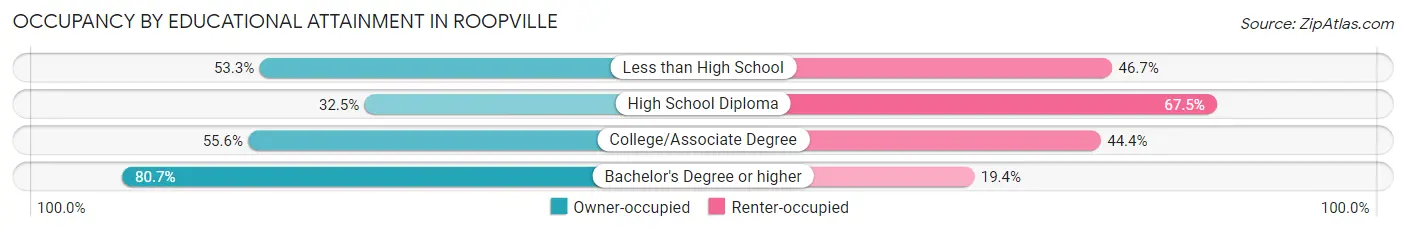
| Household Size | Owner-occupied | Renter-occupied |
| Less than High School | 8 (53.3%) | 7 (46.7%) |
| High School Diploma | 13 (32.5%) | 27 (67.5%) |
| College/Associate Degree | 15 (55.6%) | 12 (44.4%) |
| Bachelor's Degree or higher | 25 (80.6%) | 6 (19.4%) |
Occupancy by Age of Householder in Roopville
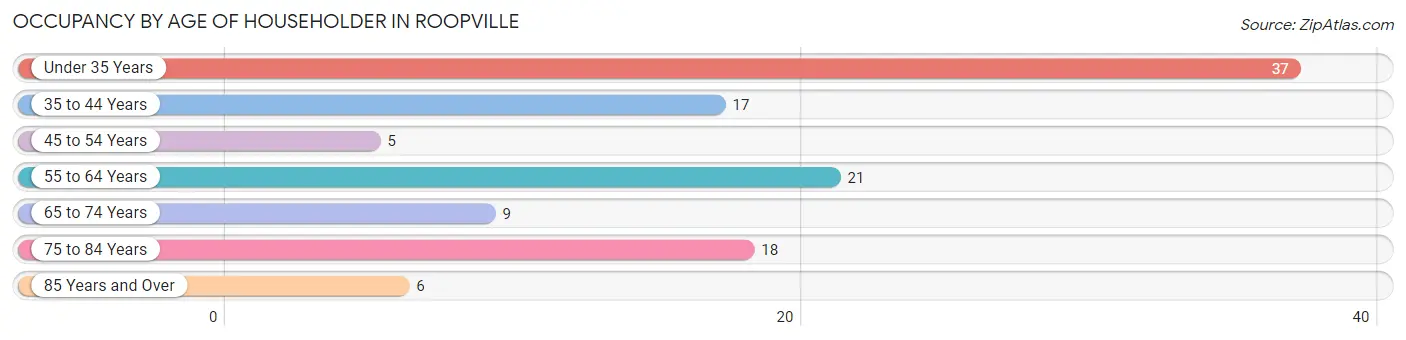
| Age Bracket | # Households | % Households |
| Under 35 Years | 37 | 32.7% |
| 35 to 44 Years | 17 | 15.0% |
| 45 to 54 Years | 5 | 4.4% |
| 55 to 64 Years | 21 | 18.6% |
| 65 to 74 Years | 9 | 8.0% |
| 75 to 84 Years | 18 | 15.9% |
| 85 Years and Over | 6 | 5.3% |
| Total | 113 | 100.0% |
Housing Finances in Roopville
Median Income by Occupancy in Roopville
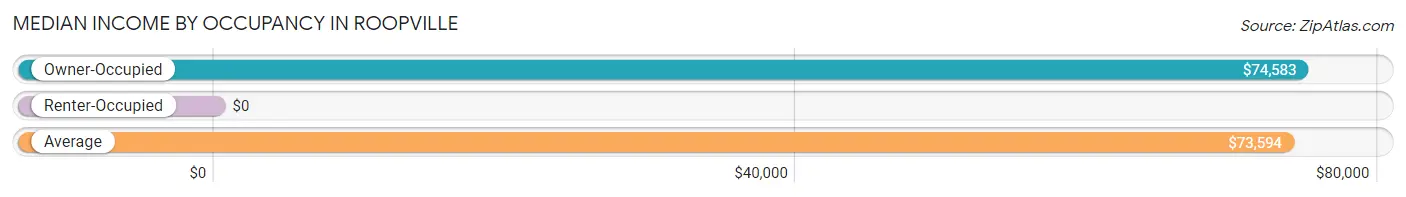
| Occupancy Type | # Households | Median Income |
| Owner-Occupied | 61 (54.0%) | $74,583 |
| Renter-Occupied | 52 (46.0%) | $0 |
| Average | 113 (100.0%) | $73,594 |
Occupancy by Householder Income Bracket in Roopville
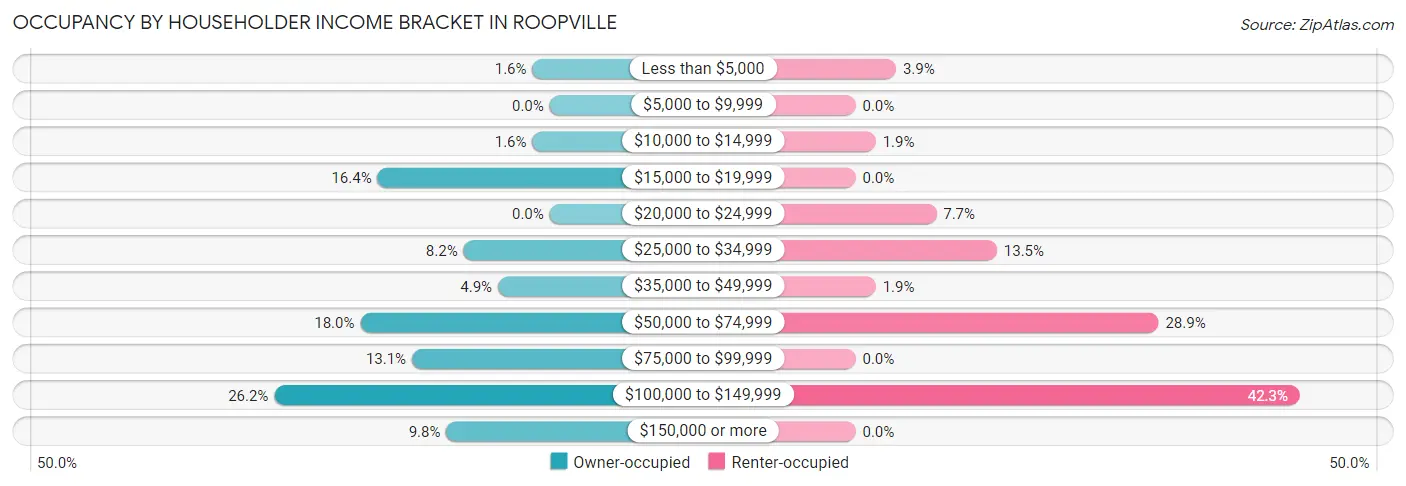
| Income Bracket | Owner-occupied | Renter-occupied |
| Less than $5,000 | 1 (1.6%) | 2 (3.8%) |
| $5,000 to $9,999 | 0 (0.0%) | 0 (0.0%) |
| $10,000 to $14,999 | 1 (1.6%) | 1 (1.9%) |
| $15,000 to $19,999 | 10 (16.4%) | 0 (0.0%) |
| $20,000 to $24,999 | 0 (0.0%) | 4 (7.7%) |
| $25,000 to $34,999 | 5 (8.2%) | 7 (13.5%) |
| $35,000 to $49,999 | 3 (4.9%) | 1 (1.9%) |
| $50,000 to $74,999 | 11 (18.0%) | 15 (28.8%) |
| $75,000 to $99,999 | 8 (13.1%) | 0 (0.0%) |
| $100,000 to $149,999 | 16 (26.2%) | 22 (42.3%) |
| $150,000 or more | 6 (9.8%) | 0 (0.0%) |
| Total | 61 (100.0%) | 52 (100.0%) |
Monthly Housing Cost Tiers in Roopville
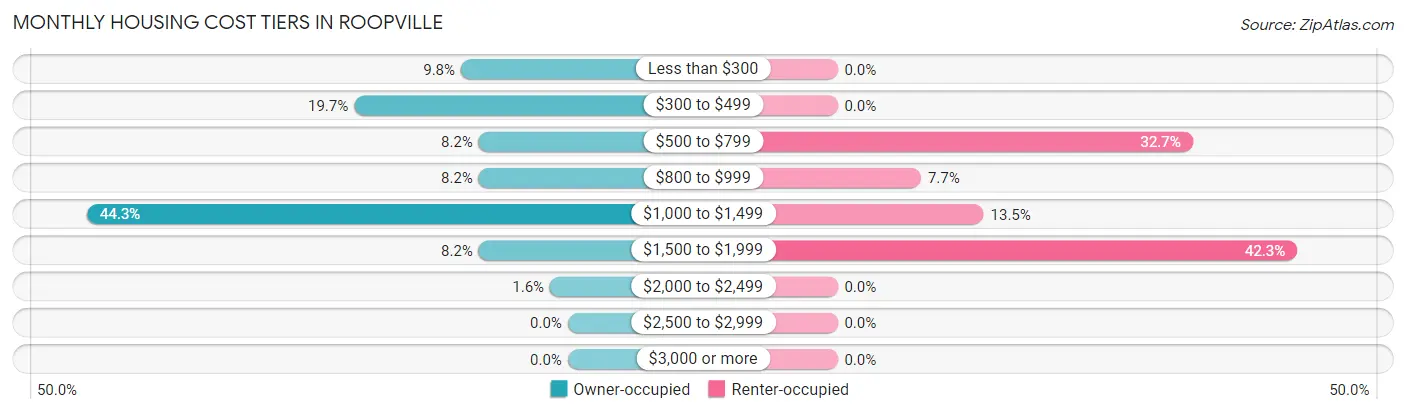
| Monthly Cost | Owner-occupied | Renter-occupied |
| Less than $300 | 6 (9.8%) | 0 (0.0%) |
| $300 to $499 | 12 (19.7%) | 0 (0.0%) |
| $500 to $799 | 5 (8.2%) | 17 (32.7%) |
| $800 to $999 | 5 (8.2%) | 4 (7.7%) |
| $1,000 to $1,499 | 27 (44.3%) | 7 (13.5%) |
| $1,500 to $1,999 | 5 (8.2%) | 22 (42.3%) |
| $2,000 to $2,499 | 1 (1.6%) | 0 (0.0%) |
| $2,500 to $2,999 | 0 (0.0%) | 0 (0.0%) |
| $3,000 or more | 0 (0.0%) | 0 (0.0%) |
| Total | 61 (100.0%) | 52 (100.0%) |
Physical Housing Characteristics in Roopville
Housing Structures in Roopville
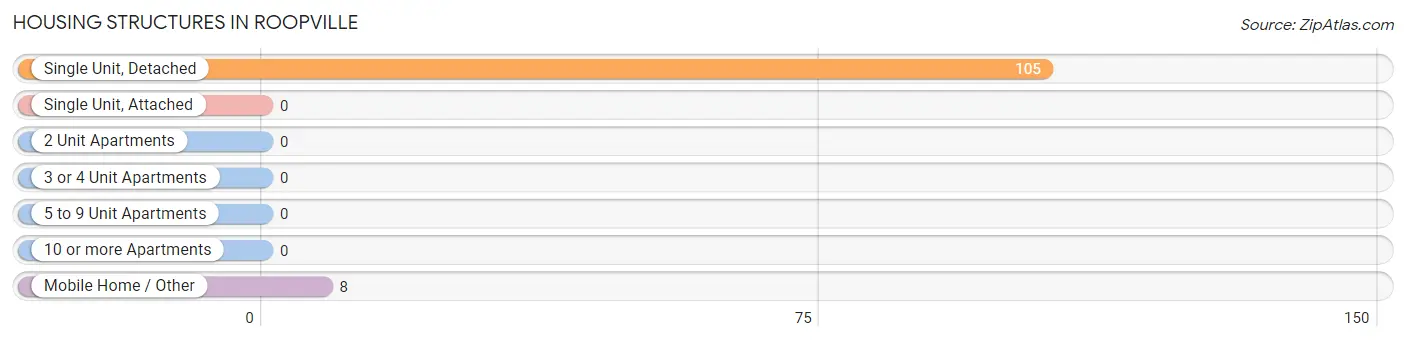
| Structure Type | # Housing Units | % Housing Units |
| Single Unit, Detached | 105 | 92.9% |
| Single Unit, Attached | 0 | 0.0% |
| 2 Unit Apartments | 0 | 0.0% |
| 3 or 4 Unit Apartments | 0 | 0.0% |
| 5 to 9 Unit Apartments | 0 | 0.0% |
| 10 or more Apartments | 0 | 0.0% |
| Mobile Home / Other | 8 | 7.1% |
| Total | 113 | 100.0% |
Housing Structures by Occupancy in Roopville
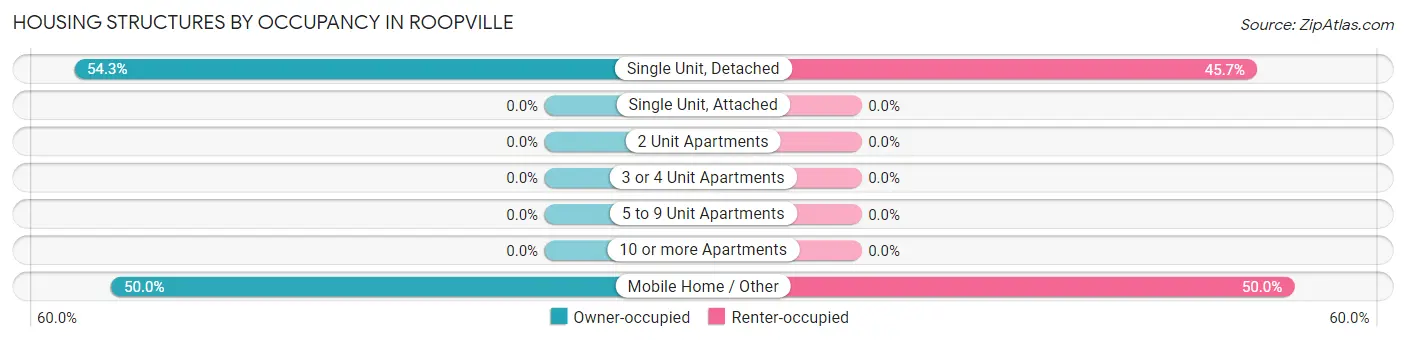
| Structure Type | Owner-occupied | Renter-occupied |
| Single Unit, Detached | 57 (54.3%) | 48 (45.7%) |
| Single Unit, Attached | 0 (0.0%) | 0 (0.0%) |
| 2 Unit Apartments | 0 (0.0%) | 0 (0.0%) |
| 3 or 4 Unit Apartments | 0 (0.0%) | 0 (0.0%) |
| 5 to 9 Unit Apartments | 0 (0.0%) | 0 (0.0%) |
| 10 or more Apartments | 0 (0.0%) | 0 (0.0%) |
| Mobile Home / Other | 4 (50.0%) | 4 (50.0%) |
| Total | 61 (54.0%) | 52 (46.0%) |
Housing Structures by Number of Rooms in Roopville
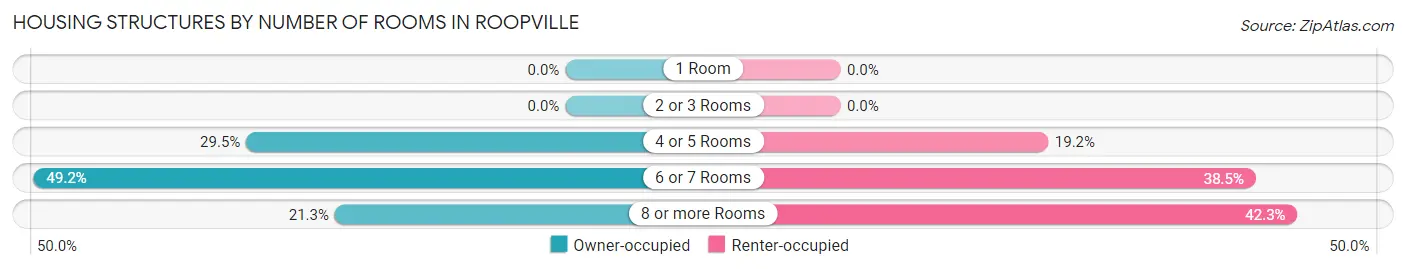
| Number of Rooms | Owner-occupied | Renter-occupied |
| 1 Room | 0 (0.0%) | 0 (0.0%) |
| 2 or 3 Rooms | 0 (0.0%) | 0 (0.0%) |
| 4 or 5 Rooms | 18 (29.5%) | 10 (19.2%) |
| 6 or 7 Rooms | 30 (49.2%) | 20 (38.5%) |
| 8 or more Rooms | 13 (21.3%) | 22 (42.3%) |
| Total | 61 (100.0%) | 52 (100.0%) |
Housing Structure by Heating Type in Roopville
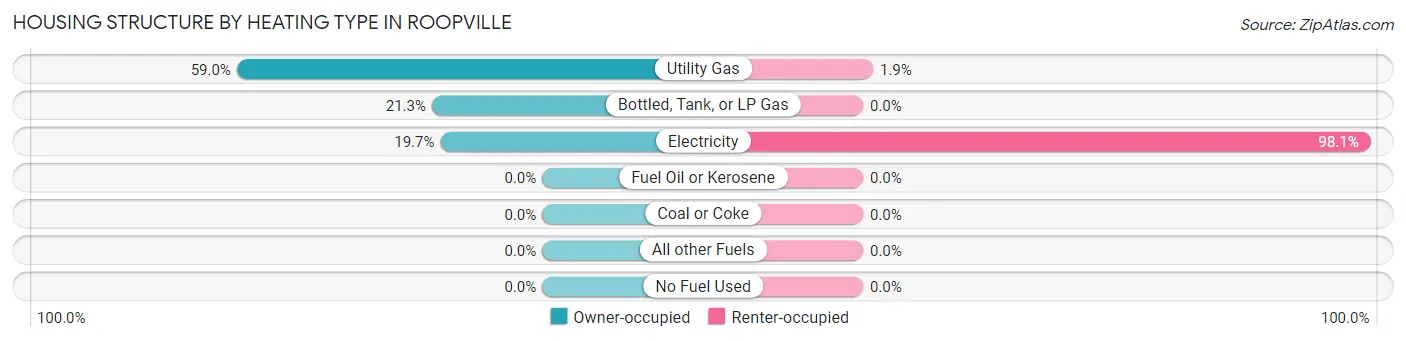
| Heating Type | Owner-occupied | Renter-occupied |
| Utility Gas | 36 (59.0%) | 1 (1.9%) |
| Bottled, Tank, or LP Gas | 13 (21.3%) | 0 (0.0%) |
| Electricity | 12 (19.7%) | 51 (98.1%) |
| Fuel Oil or Kerosene | 0 (0.0%) | 0 (0.0%) |
| Coal or Coke | 0 (0.0%) | 0 (0.0%) |
| All other Fuels | 0 (0.0%) | 0 (0.0%) |
| No Fuel Used | 0 (0.0%) | 0 (0.0%) |
| Total | 61 (100.0%) | 52 (100.0%) |
Household Vehicle Usage in Roopville
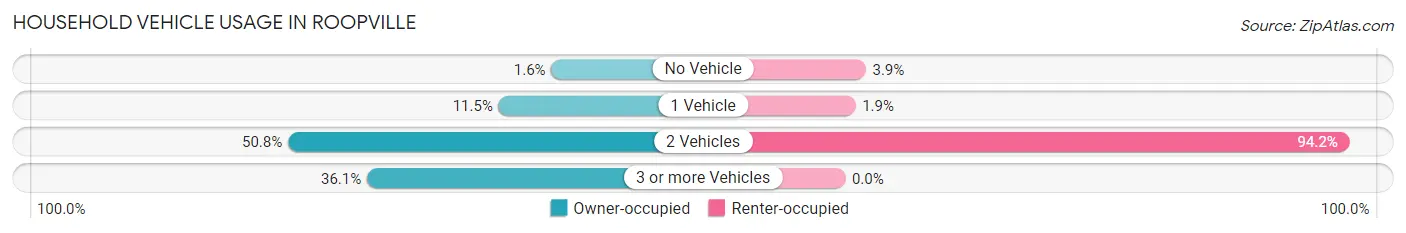
| Vehicles per Household | Owner-occupied | Renter-occupied |
| No Vehicle | 1 (1.6%) | 2 (3.8%) |
| 1 Vehicle | 7 (11.5%) | 1 (1.9%) |
| 2 Vehicles | 31 (50.8%) | 49 (94.2%) |
| 3 or more Vehicles | 22 (36.1%) | 0 (0.0%) |
| Total | 61 (100.0%) | 52 (100.0%) |
Real Estate & Mortgages in Roopville
Real Estate and Mortgage Overview in Roopville
| Characteristic | Without Mortgage | With Mortgage |
| Housing Units | 22 | 39 |
| Median Property Value | $137,500 | $148,400 |
| Median Household Income | $53,750 | $3 |
| Monthly Housing Costs | $400 | $0 |
| Real Estate Taxes | $267 | $2 |
Property Value by Mortgage Status in Roopville
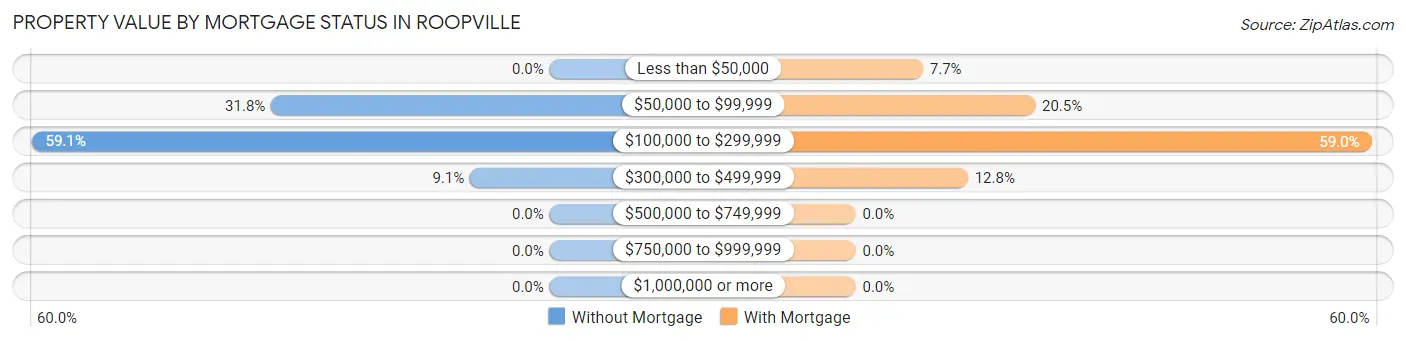
| Property Value | Without Mortgage | With Mortgage |
| Less than $50,000 | 0 (0.0%) | 3 (7.7%) |
| $50,000 to $99,999 | 7 (31.8%) | 8 (20.5%) |
| $100,000 to $299,999 | 13 (59.1%) | 23 (59.0%) |
| $300,000 to $499,999 | 2 (9.1%) | 5 (12.8%) |
| $500,000 to $749,999 | 0 (0.0%) | 0 (0.0%) |
| $750,000 to $999,999 | 0 (0.0%) | 0 (0.0%) |
| $1,000,000 or more | 0 (0.0%) | 0 (0.0%) |
| Total | 22 (100.0%) | 39 (100.0%) |
Household Income by Mortgage Status in Roopville
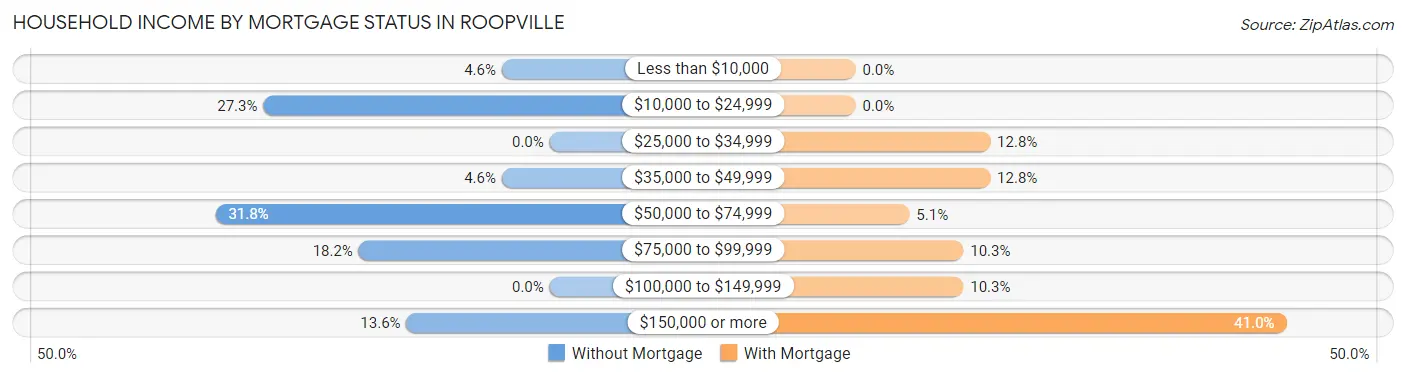
| Household Income | Without Mortgage | With Mortgage |
| Less than $10,000 | 1 (4.5%) | 0 (0.0%) |
| $10,000 to $24,999 | 6 (27.3%) | 0 (0.0%) |
| $25,000 to $34,999 | 0 (0.0%) | 5 (12.8%) |
| $35,000 to $49,999 | 1 (4.5%) | 5 (12.8%) |
| $50,000 to $74,999 | 7 (31.8%) | 2 (5.1%) |
| $75,000 to $99,999 | 4 (18.2%) | 4 (10.3%) |
| $100,000 to $149,999 | 0 (0.0%) | 4 (10.3%) |
| $150,000 or more | 3 (13.6%) | 16 (41.0%) |
| Total | 22 (100.0%) | 39 (100.0%) |
Property Value to Household Income Ratio in Roopville
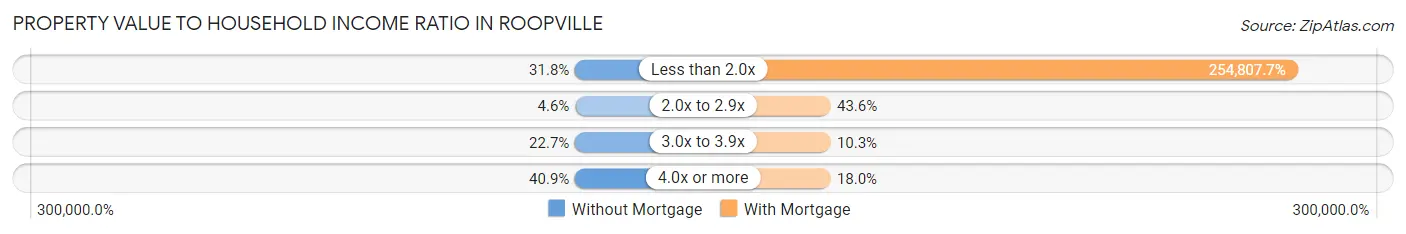
| Value-to-Income Ratio | Without Mortgage | With Mortgage |
| Less than 2.0x | 7 (31.8%) | 99,375 (254,807.7%) |
| 2.0x to 2.9x | 1 (4.5%) | 17 (43.6%) |
| 3.0x to 3.9x | 5 (22.7%) | 4 (10.3%) |
| 4.0x or more | 9 (40.9%) | 7 (17.9%) |
| Total | 22 (100.0%) | 39 (100.0%) |
Real Estate Taxes by Mortgage Status in Roopville
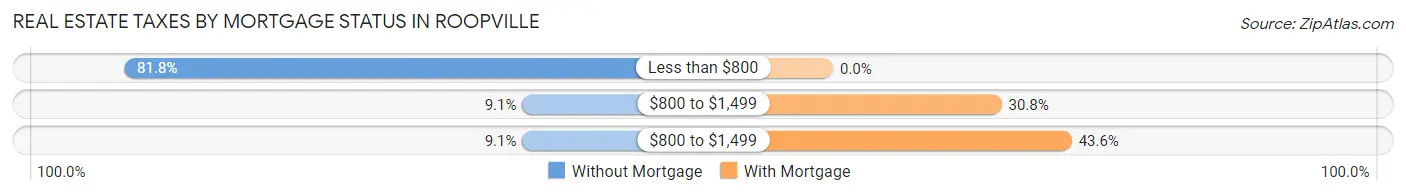
| Property Taxes | Without Mortgage | With Mortgage |
| Less than $800 | 18 (81.8%) | 0 (0.0%) |
| $800 to $1,499 | 2 (9.1%) | 12 (30.8%) |
| $800 to $1,499 | 2 (9.1%) | 17 (43.6%) |
| Total | 22 (100.0%) | 39 (100.0%) |
Health & Disability in Roopville
Health Insurance Coverage by Age in Roopville
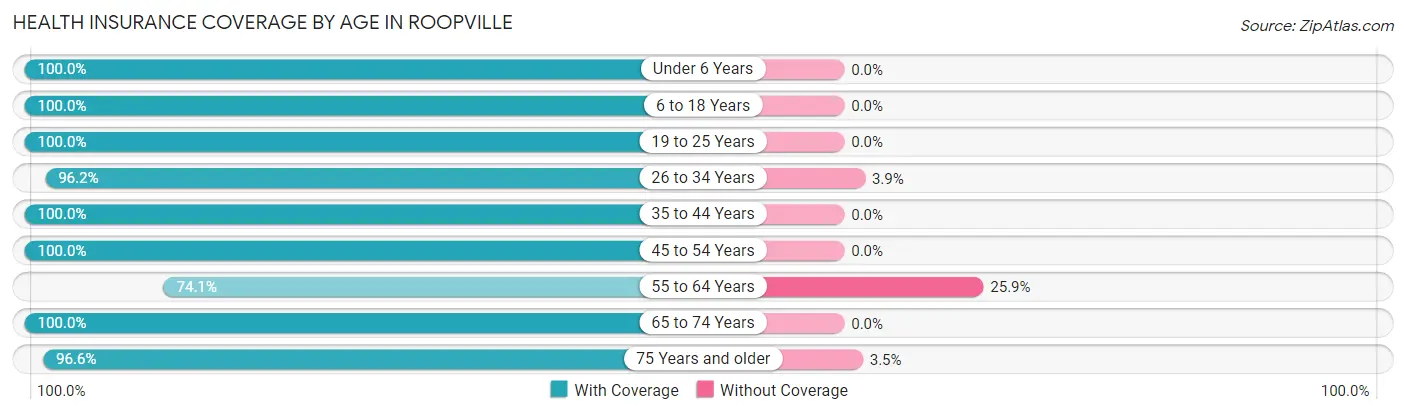
| Age Bracket | With Coverage | Without Coverage |
| Under 6 Years | 25 (100.0%) | 0 (0.0%) |
| 6 to 18 Years | 115 (100.0%) | 0 (0.0%) |
| 19 to 25 Years | 5 (100.0%) | 0 (0.0%) |
| 26 to 34 Years | 125 (96.2%) | 5 (3.8%) |
| 35 to 44 Years | 43 (100.0%) | 0 (0.0%) |
| 45 to 54 Years | 9 (100.0%) | 0 (0.0%) |
| 55 to 64 Years | 40 (74.1%) | 14 (25.9%) |
| 65 to 74 Years | 13 (100.0%) | 0 (0.0%) |
| 75 Years and older | 28 (96.6%) | 1 (3.5%) |
| Total | 403 (95.3%) | 20 (4.7%) |
Health Insurance Coverage by Citizenship Status in Roopville
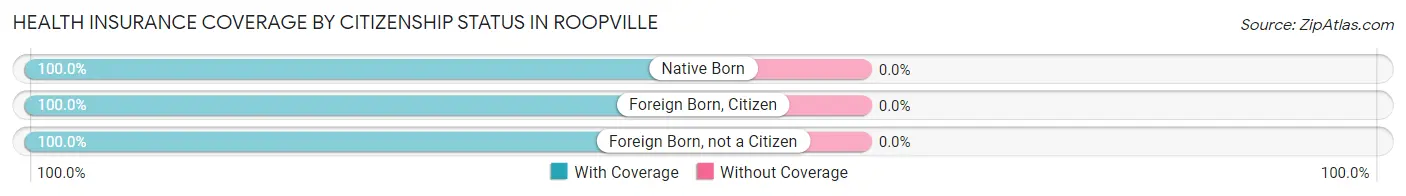
| Citizenship Status | With Coverage | Without Coverage |
| Native Born | 25 (100.0%) | 0 (0.0%) |
| Foreign Born, Citizen | 115 (100.0%) | 0 (0.0%) |
| Foreign Born, not a Citizen | 5 (100.0%) | 0 (0.0%) |
Health Insurance Coverage by Household Income in Roopville
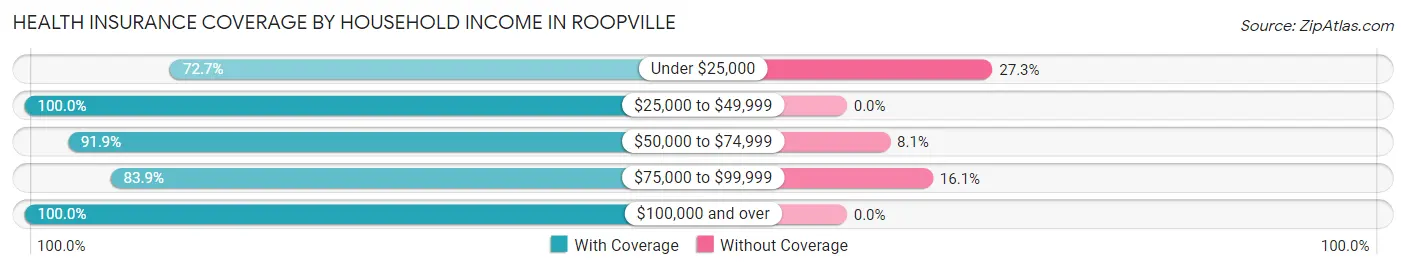
| Household Income | With Coverage | Without Coverage |
| Under $25,000 | 24 (72.7%) | 9 (27.3%) |
| $25,000 to $49,999 | 24 (100.0%) | 0 (0.0%) |
| $50,000 to $74,999 | 68 (91.9%) | 6 (8.1%) |
| $75,000 to $99,999 | 26 (83.9%) | 5 (16.1%) |
| $100,000 and over | 261 (100.0%) | 0 (0.0%) |
Public vs Private Health Insurance Coverage by Age in Roopville
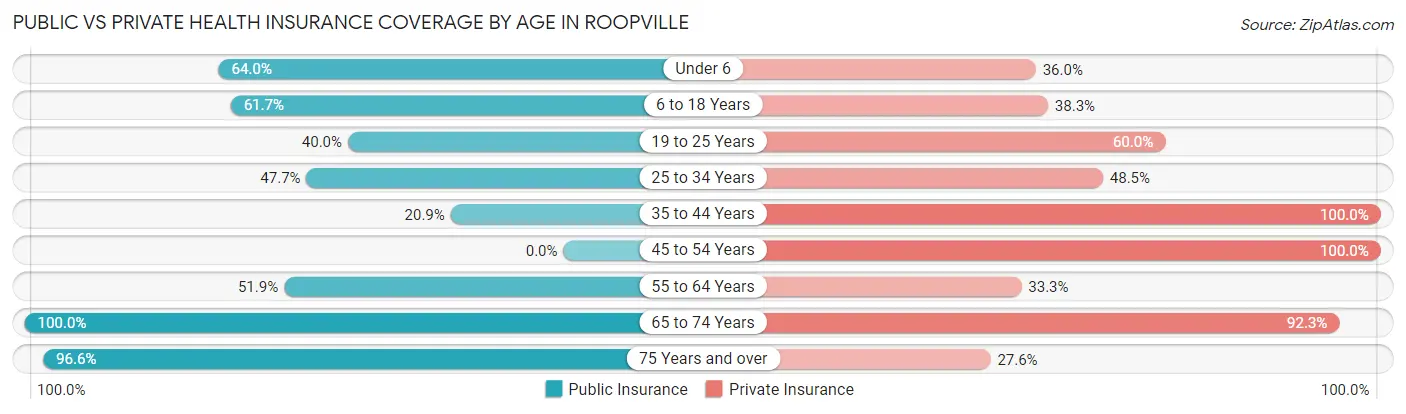
| Age Bracket | Public Insurance | Private Insurance |
| Under 6 | 16 (64.0%) | 9 (36.0%) |
| 6 to 18 Years | 71 (61.7%) | 44 (38.3%) |
| 19 to 25 Years | 2 (40.0%) | 3 (60.0%) |
| 25 to 34 Years | 62 (47.7%) | 63 (48.5%) |
| 35 to 44 Years | 9 (20.9%) | 43 (100.0%) |
| 45 to 54 Years | 0 (0.0%) | 9 (100.0%) |
| 55 to 64 Years | 28 (51.8%) | 18 (33.3%) |
| 65 to 74 Years | 13 (100.0%) | 12 (92.3%) |
| 75 Years and over | 28 (96.6%) | 8 (27.6%) |
| Total | 229 (54.1%) | 209 (49.4%) |
Disability Status by Sex by Age in Roopville
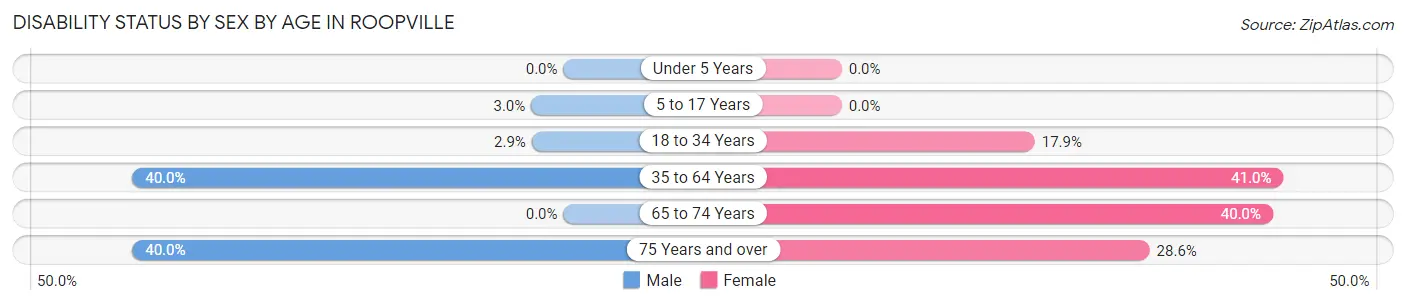
| Age Bracket | Male | Female |
| Under 5 Years | 0 (0.0%) | 0 (0.0%) |
| 5 to 17 Years | 2 (3.0%) | 0 (0.0%) |
| 18 to 34 Years | 2 (2.9%) | 12 (17.9%) |
| 35 to 64 Years | 18 (40.0%) | 25 (41.0%) |
| 65 to 74 Years | 0 (0.0%) | 4 (40.0%) |
| 75 Years and over | 6 (40.0%) | 4 (28.6%) |
Disability Class by Sex by Age in Roopville
Disability Class: Hearing Difficulty
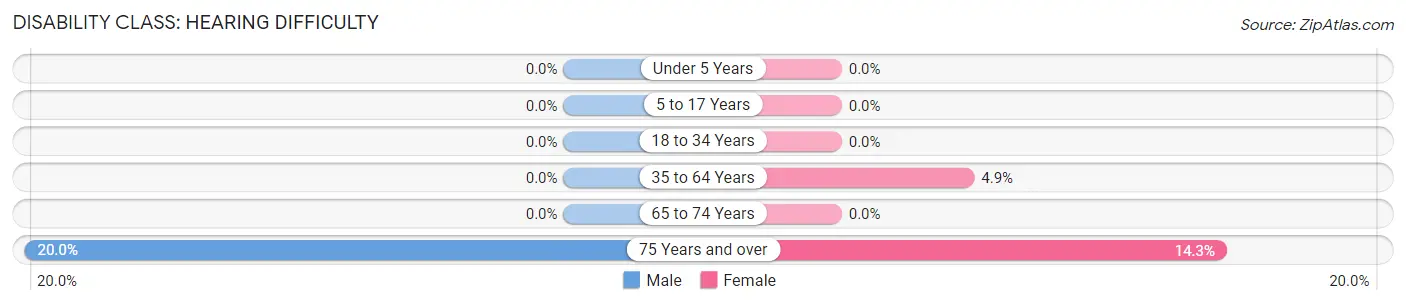
| Age Bracket | Male | Female |
| Under 5 Years | 0 (0.0%) | 0 (0.0%) |
| 5 to 17 Years | 0 (0.0%) | 0 (0.0%) |
| 18 to 34 Years | 0 (0.0%) | 0 (0.0%) |
| 35 to 64 Years | 0 (0.0%) | 3 (4.9%) |
| 65 to 74 Years | 0 (0.0%) | 0 (0.0%) |
| 75 Years and over | 3 (20.0%) | 2 (14.3%) |
Disability Class: Vision Difficulty
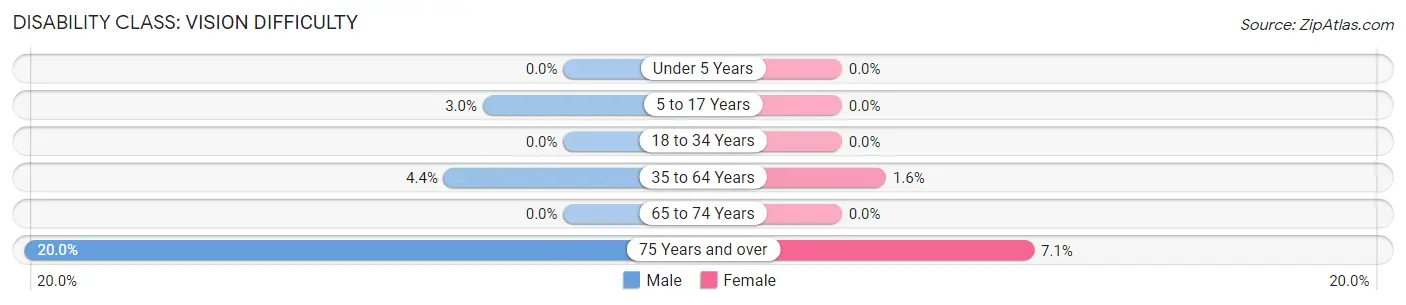
| Age Bracket | Male | Female |
| Under 5 Years | 0 (0.0%) | 0 (0.0%) |
| 5 to 17 Years | 2 (3.0%) | 0 (0.0%) |
| 18 to 34 Years | 0 (0.0%) | 0 (0.0%) |
| 35 to 64 Years | 2 (4.4%) | 1 (1.6%) |
| 65 to 74 Years | 0 (0.0%) | 0 (0.0%) |
| 75 Years and over | 3 (20.0%) | 1 (7.1%) |
Disability Class: Cognitive Difficulty
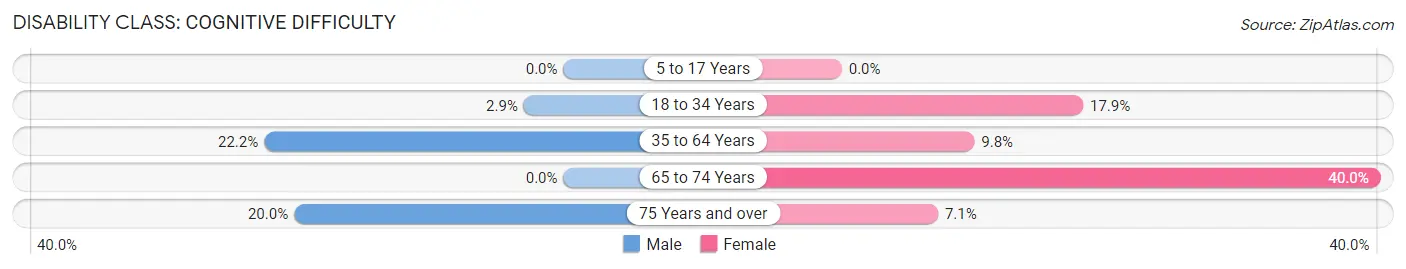
| Age Bracket | Male | Female |
| 5 to 17 Years | 0 (0.0%) | 0 (0.0%) |
| 18 to 34 Years | 2 (2.9%) | 12 (17.9%) |
| 35 to 64 Years | 10 (22.2%) | 6 (9.8%) |
| 65 to 74 Years | 0 (0.0%) | 4 (40.0%) |
| 75 Years and over | 3 (20.0%) | 1 (7.1%) |
Disability Class: Ambulatory Difficulty
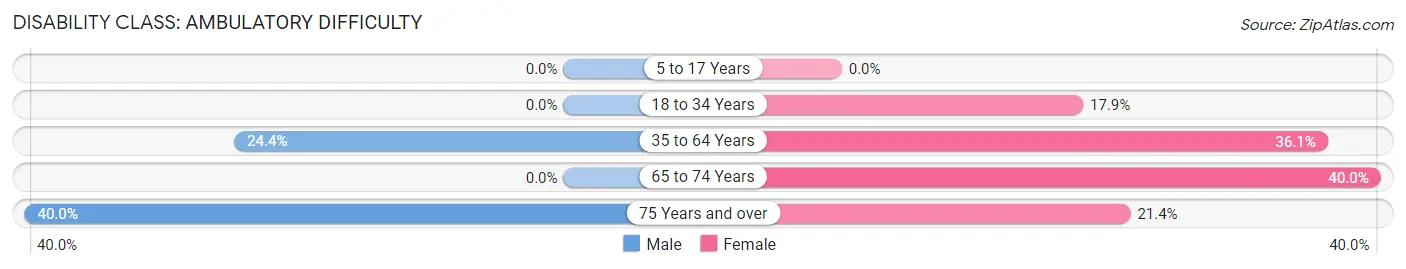
| Age Bracket | Male | Female |
| 5 to 17 Years | 0 (0.0%) | 0 (0.0%) |
| 18 to 34 Years | 0 (0.0%) | 12 (17.9%) |
| 35 to 64 Years | 11 (24.4%) | 22 (36.1%) |
| 65 to 74 Years | 0 (0.0%) | 4 (40.0%) |
| 75 Years and over | 6 (40.0%) | 3 (21.4%) |
Disability Class: Self-Care Difficulty
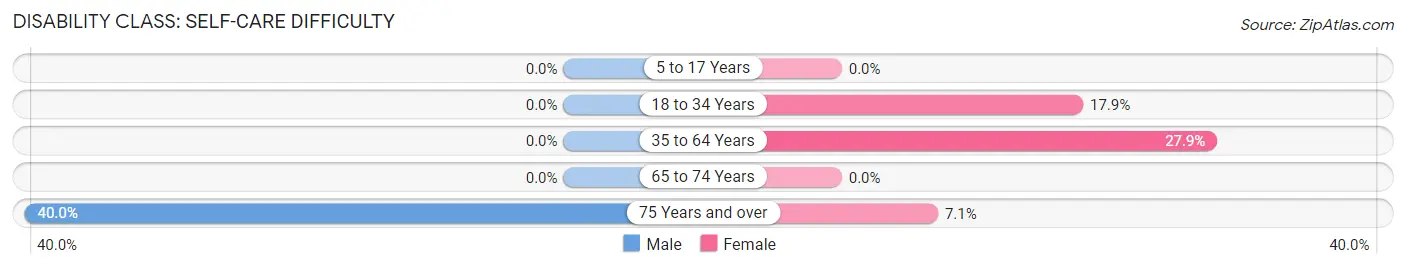
| Age Bracket | Male | Female |
| 5 to 17 Years | 0 (0.0%) | 0 (0.0%) |
| 18 to 34 Years | 0 (0.0%) | 12 (17.9%) |
| 35 to 64 Years | 0 (0.0%) | 17 (27.9%) |
| 65 to 74 Years | 0 (0.0%) | 0 (0.0%) |
| 75 Years and over | 6 (40.0%) | 1 (7.1%) |
Technology Access in Roopville
Computing Device Access in Roopville
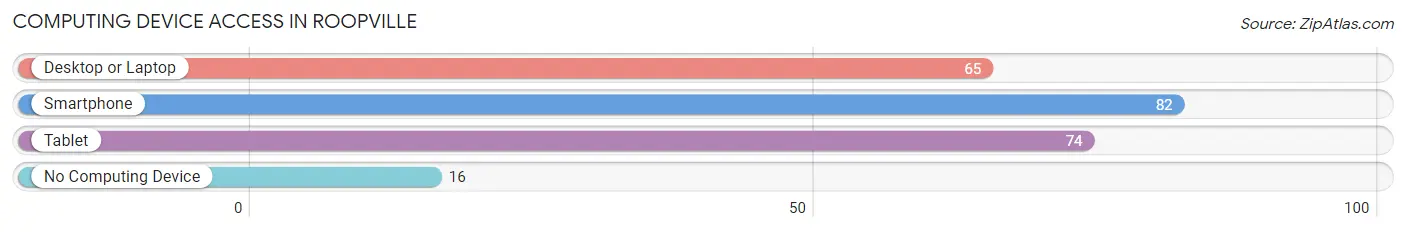
| Device Type | # Households | % Households |
| Desktop or Laptop | 65 | 57.5% |
| Smartphone | 82 | 72.6% |
| Tablet | 74 | 65.5% |
| No Computing Device | 16 | 14.2% |
| Total | 113 | 100.0% |
Internet Access in Roopville
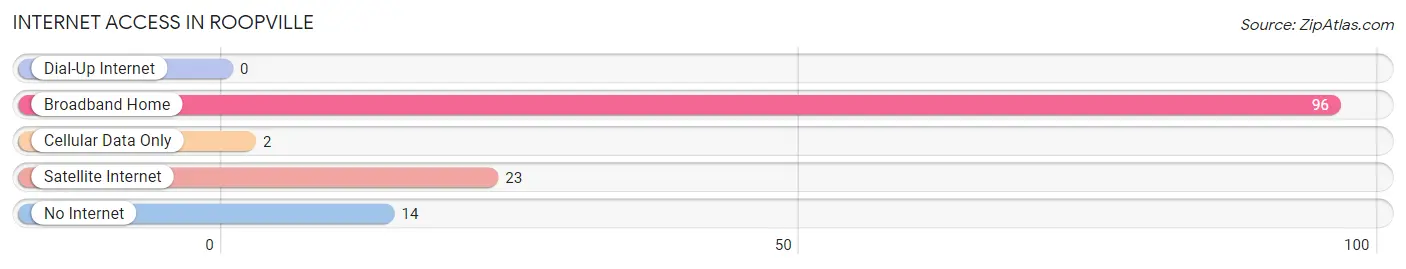
| Internet Type | # Households | % Households |
| Dial-Up Internet | 0 | 0.0% |
| Broadband Home | 96 | 85.0% |
| Cellular Data Only | 2 | 1.8% |
| Satellite Internet | 23 | 20.3% |
| No Internet | 14 | 12.4% |
| Total | 113 | 100.0% |
Roopville Summary
Roopville is a small town located in Carroll County, Georgia, United States. It is situated about 45 miles west of Atlanta and is part of the Atlanta metropolitan area. The population of Roopville was estimated to be 1,093 in 2019.
History
Roopville was founded in 1854 by William Roop, a farmer from South Carolina. He purchased land in the area and built a home, which he named Roopville. The town was incorporated in 1887 and was named after William Roop.
Roopville was a small farming community until the early 1900s when the railroad came through the area. This allowed the town to become a shipping center for the surrounding farms. The town also had a cotton gin, a grist mill, and a sawmill.
Geography
Roopville is located in the foothills of the Appalachian Mountains in northwest Georgia. The town is situated on the banks of the Chattahoochee River, which forms the border between Georgia and Alabama. The town is located at an elevation of 845 feet above sea level.
The climate in Roopville is humid subtropical, with hot summers and mild winters. The average annual temperature is 64°F, and the average annual precipitation is 51 inches.
Economy
Roopville’s economy is largely based on agriculture. The town is home to several farms, which produce a variety of crops, including corn, soybeans, cotton, and peanuts. The town also has a few small businesses, including a grocery store, a hardware store, and a few restaurants.
Demographics
As of the 2010 census, the population of Roopville was 1,093. The racial makeup of the town was 94.3% White, 3.2% African American, 0.7% Native American, 0.2% Asian, and 1.6% from other races. The median household income was $37,917, and the median family income was $45,625.
Roopville is a small, rural town with a close-knit community. The town is home to several churches, a library, and a few parks. The town also hosts several annual events, including a Fourth of July parade and a Christmas parade. Roopville is a great place to live and raise a family.
Common Questions
What is Per Capita Income in Roopville?
Per Capita income in Roopville is $24,384.
What is the Median Family Income in Roopville?
Median Family Income in Roopville is $100,833.
What is the Median Household income in Roopville?
Median Household Income in Roopville is $73,594.
What is Income or Wage Gap in Roopville?
Income or Wage Gap in Roopville is 17.8%.
Women in Roopville earn 82.2 cents for every dollar earned by a man.
What is Inequality or Gini Index in Roopville?
Inequality or Gini Index in Roopville is 0.47.
What is the Total Population of Roopville?
Total Population of Roopville is 423.
What is the Total Male Population of Roopville?
Total Male Population of Roopville is 203.
What is the Total Female Population of Roopville?
Total Female Population of Roopville is 220.
What is the Ratio of Males per 100 Females in Roopville?
There are 92.27 Males per 100 Females in Roopville.
What is the Ratio of Females per 100 Males in Roopville?
There are 108.37 Females per 100 Males in Roopville.
What is the Median Population Age in Roopville?
Median Population Age in Roopville is 29.2 Years.
What is the Average Family Size in Roopville
Average Family Size in Roopville is 4.4 People.
What is the Average Household Size in Roopville
Average Household Size in Roopville is 3.7 People.
How Large is the Labor Force in Roopville?
There are 140 People in the Labor Forcein in Roopville.
What is the Percentage of People in the Labor Force in Roopville?
46.7% of People are in the Labor Force in Roopville.