Hamilton, GA Map & Demographics
Hamilton Map
Hamilton Overview
$27,301
PER CAPITA INCOME
$98,750
AVG FAMILY INCOME
$86,607
AVG HOUSEHOLD INCOME
19.8%
WAGE / INCOME GAP [ % ]
80.2¢/ $1
WAGE / INCOME GAP [ $ ]
0.35
INEQUALITY / GINI INDEX
1,946
TOTAL POPULATION
1,077
MALE POPULATION
869
FEMALE POPULATION
123.94
MALES / 100 FEMALES
80.69
FEMALES / 100 MALES
32.7
MEDIAN AGE
3.3
AVG FAMILY SIZE
3.0
AVG HOUSEHOLD SIZE
787
LABOR FORCE [ PEOPLE ]
57.7%
PERCENT IN LABOR FORCE
7.7%
UNEMPLOYMENT RATE
Hamilton Zip Codes
Hamilton Area Codes
Income in Hamilton
Income Overview in Hamilton
Per Capita Income in Hamilton is $27,301, while median incomes of families and households are $98,750 and $86,607 respectively.
| Characteristic | Number | Measure |
| Per Capita Income | 1,946 | $27,301 |
| Median Family Income | 494 | $98,750 |
| Mean Family Income | 494 | $96,095 |
| Median Household Income | 577 | $86,607 |
| Mean Household Income | 577 | $89,576 |
| Income Deficit | 494 | $0 |
| Wage / Income Gap (%) | 1,946 | 19.83% |
| Wage / Income Gap ($) | 1,946 | 80.17¢ per $1 |
| Gini / Inequality Index | 1,946 | 0.35 |
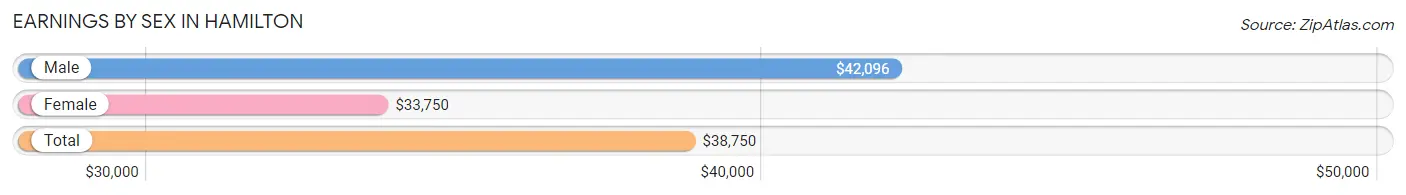
Earnings by Sex in Hamilton
Average Earnings in Hamilton are $38,750, $42,096 for men and $33,750 for women, a difference of 19.8%.
| Sex | Number | Average Earnings |
| Male | 537 (59.1%) | $42,096 |
| Female | 371 (40.9%) | $33,750 |
| Total | 908 (100.0%) | $38,750 |
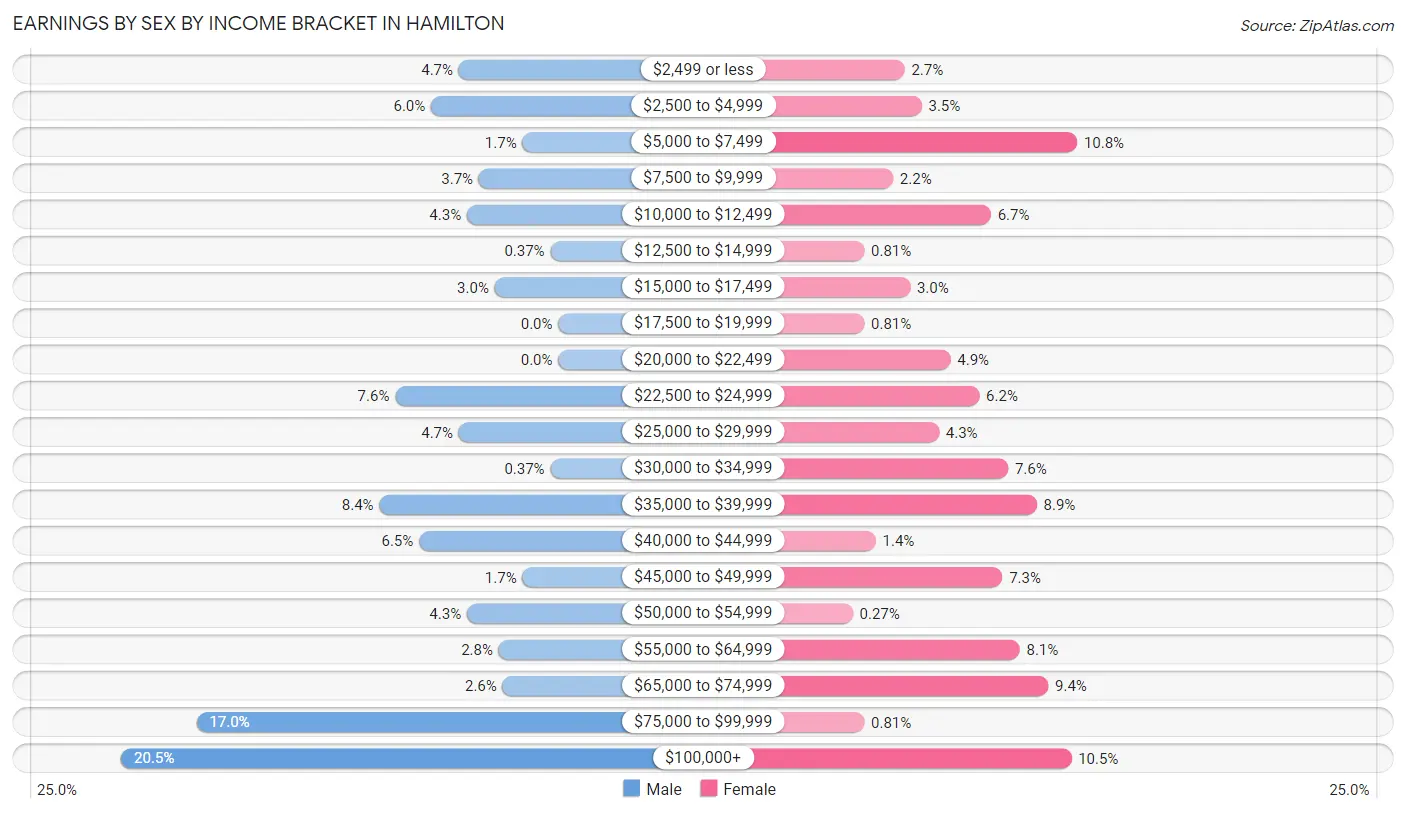
Earnings by Sex by Income Bracket in Hamilton
The most common earnings brackets in Hamilton are $100,000+ for men (110 | 20.5%) and $5,000 to $7,499 for women (40 | 10.8%).
| Income | Male | Female |
| $2,499 or less | 25 (4.7%) | 10 (2.7%) |
| $2,500 to $4,999 | 32 (6.0%) | 13 (3.5%) |
| $5,000 to $7,499 | 9 (1.7%) | 40 (10.8%) |
| $7,500 to $9,999 | 20 (3.7%) | 8 (2.2%) |
| $10,000 to $12,499 | 23 (4.3%) | 25 (6.7%) |
| $12,500 to $14,999 | 2 (0.4%) | 3 (0.8%) |
| $15,000 to $17,499 | 16 (3.0%) | 11 (3.0%) |
| $17,500 to $19,999 | 0 (0.0%) | 3 (0.8%) |
| $20,000 to $22,499 | 0 (0.0%) | 18 (4.9%) |
| $22,500 to $24,999 | 41 (7.6%) | 23 (6.2%) |
| $25,000 to $29,999 | 25 (4.7%) | 16 (4.3%) |
| $30,000 to $34,999 | 2 (0.4%) | 28 (7.5%) |
| $35,000 to $39,999 | 45 (8.4%) | 33 (8.9%) |
| $40,000 to $44,999 | 35 (6.5%) | 5 (1.3%) |
| $45,000 to $49,999 | 9 (1.7%) | 27 (7.3%) |
| $50,000 to $54,999 | 23 (4.3%) | 1 (0.3%) |
| $55,000 to $64,999 | 15 (2.8%) | 30 (8.1%) |
| $65,000 to $74,999 | 14 (2.6%) | 35 (9.4%) |
| $75,000 to $99,999 | 91 (17.0%) | 3 (0.8%) |
| $100,000+ | 110 (20.5%) | 39 (10.5%) |
| Total | 537 (100.0%) | 371 (100.0%) |
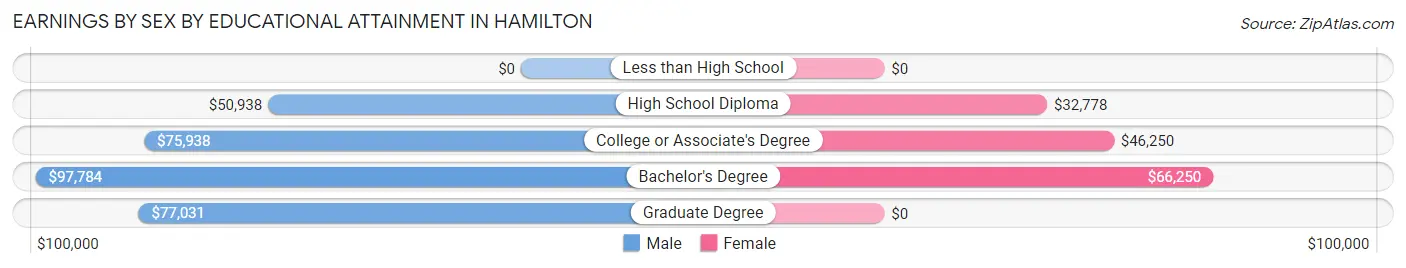
Earnings by Sex by Educational Attainment in Hamilton
Average earnings in Hamilton are $53,958 for men and $39,531 for women, a difference of 26.7%. Men with an educational attainment of bachelor's degree enjoy the highest average annual earnings of $97,784, while those with high school diploma education earn the least with $50,938. Women with an educational attainment of bachelor's degree earn the most with the average annual earnings of $66,250, while those with high school diploma education have the smallest earnings of $32,778.
| Educational Attainment | Male Income | Female Income |
| Less than High School | - | - |
| High School Diploma | $50,938 | $32,778 |
| College or Associate's Degree | $75,938 | $46,250 |
| Bachelor's Degree | $97,784 | $66,250 |
| Graduate Degree | $77,031 | $0 |
| Total | $53,958 | $39,531 |
Family Income in Hamilton
Family Income Brackets in Hamilton
According to the Hamilton family income data, there are 194 families falling into the $100,000 to $149,999 income range, which is the most common income bracket and makes up 39.3% of all families. Conversely, the $15,000 to $24,999 income bracket is the least frequent group with only 5 families (1.0%) belonging to this category.
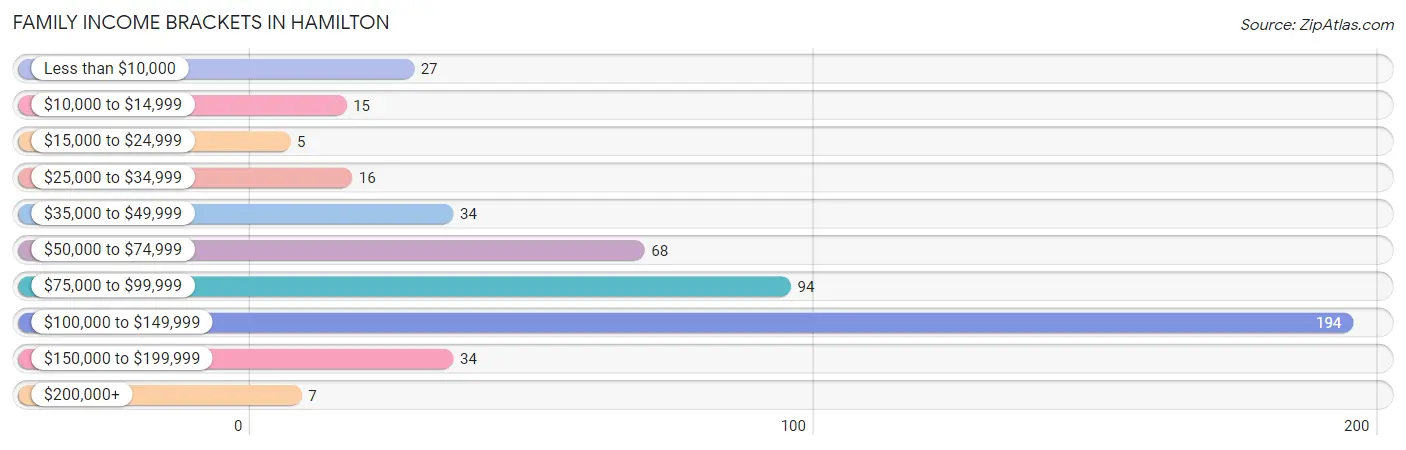
| Income Bracket | # Families | % Families |
| Less than $10,000 | 27 | 5.5% |
| $10,000 to $14,999 | 15 | 3.0% |
| $15,000 to $24,999 | 5 | 1.0% |
| $25,000 to $34,999 | 16 | 3.2% |
| $35,000 to $49,999 | 34 | 6.9% |
| $50,000 to $74,999 | 68 | 13.8% |
| $75,000 to $99,999 | 94 | 19.0% |
| $100,000 to $149,999 | 194 | 39.3% |
| $150,000 to $199,999 | 34 | 6.9% |
| $200,000+ | 7 | 1.4% |
Family Income by Famaliy Size in Hamilton
4-person families (132 | 26.7%) account for the highest median family income in Hamilton with $142,734 per family, while 4-person families (132 | 26.7%) have the highest median income of $35,684 per family member.
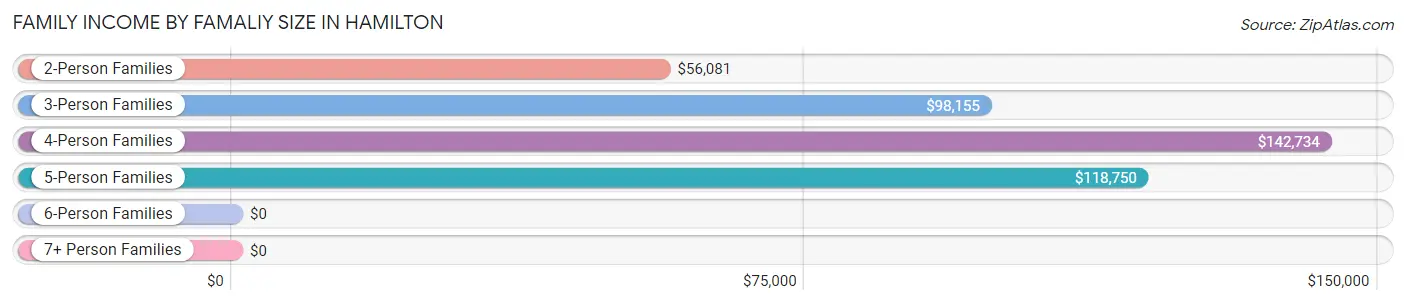
| Income Bracket | # Families | Median Income |
| 2-Person Families | 138 (27.9%) | $56,081 |
| 3-Person Families | 161 (32.6%) | $98,155 |
| 4-Person Families | 132 (26.7%) | $142,734 |
| 5-Person Families | 59 (11.9%) | $118,750 |
| 6-Person Families | 4 (0.8%) | $0 |
| 7+ Person Families | 0 (0.0%) | $0 |
| Total | 494 (100.0%) | $98,750 |
Family Income by Number of Earners in Hamilton
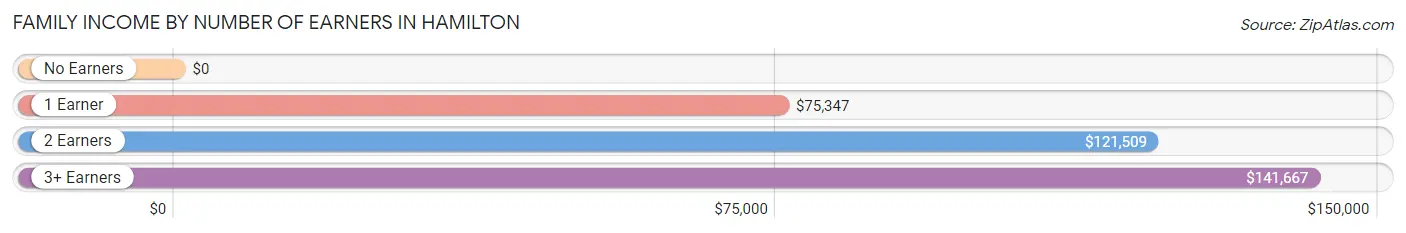
| Number of Earners | # Families | Median Income |
| No Earners | 58 (11.7%) | $0 |
| 1 Earner | 161 (32.6%) | $75,347 |
| 2 Earners | 227 (46.0%) | $121,509 |
| 3+ Earners | 48 (9.7%) | $141,667 |
| Total | 494 (100.0%) | $98,750 |
Household Income in Hamilton
Household Income Brackets in Hamilton
With 197 households falling in the category, the $100,000 to $149,999 income range is the most frequent in Hamilton, accounting for 34.1% of all households. In contrast, only 7 households (1.2%) fall into the $200,000+ income bracket, making it the least populous group.
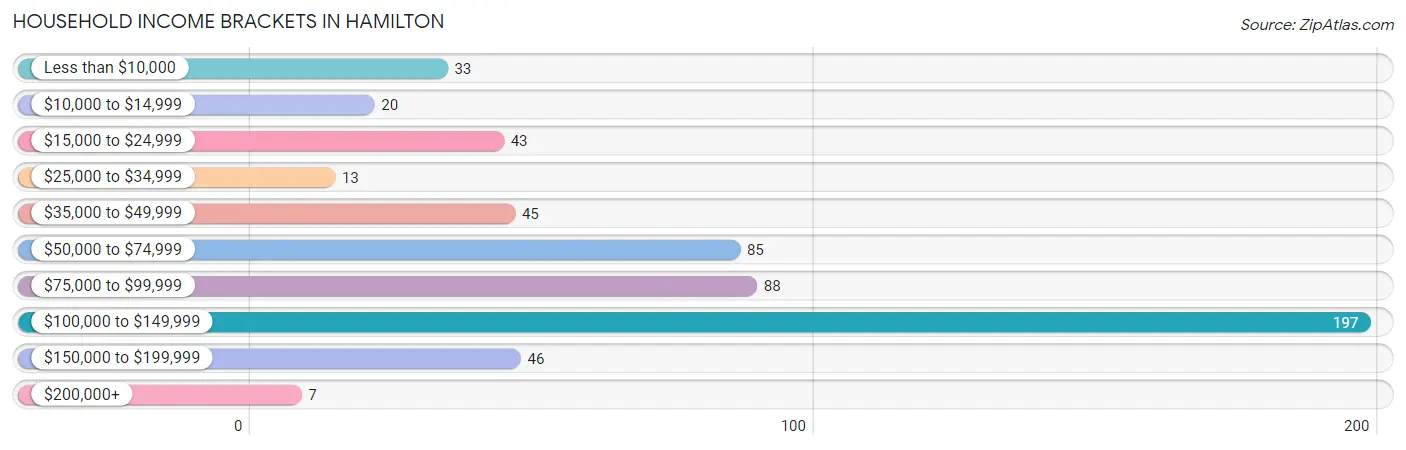
| Income Bracket | # Households | % Households |
| Less than $10,000 | 33 | 5.7% |
| $10,000 to $14,999 | 20 | 3.5% |
| $15,000 to $24,999 | 43 | 7.5% |
| $25,000 to $34,999 | 13 | 2.3% |
| $35,000 to $49,999 | 45 | 7.8% |
| $50,000 to $74,999 | 85 | 14.7% |
| $75,000 to $99,999 | 88 | 15.3% |
| $100,000 to $149,999 | 197 | 34.1% |
| $150,000 to $199,999 | 46 | 8.0% |
| $200,000+ | 7 | 1.2% |
Household Income by Householder Age in Hamilton
The median household income in Hamilton is $86,607, with the highest median household income of $106,118 found in the 25 to 44 years age bracket for the primary householder. A total of 315 households (54.6%) fall into this category. Meanwhile, the 15 to 24 years age bracket for the primary householder has the lowest median household income of $0, with 5 households (0.9%) in this group.
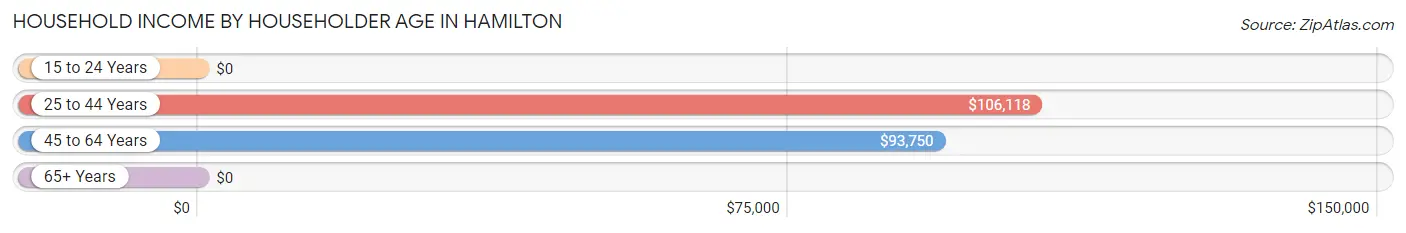
| Income Bracket | # Households | Median Income |
| 15 to 24 Years | 5 (0.9%) | $0 |
| 25 to 44 Years | 315 (54.6%) | $106,118 |
| 45 to 64 Years | 148 (25.7%) | $93,750 |
| 65+ Years | 109 (18.9%) | $0 |
| Total | 577 (100.0%) | $86,607 |
Poverty in Hamilton
Income Below Poverty by Sex and Age in Hamilton
With 4.3% poverty level for males and 9.3% for females among the residents of Hamilton, 16 and 17 year old males and 15 year old females are the most vulnerable to poverty, with 6 males (28.6%) and 5 females (71.4%) in their respective age groups living below the poverty level.
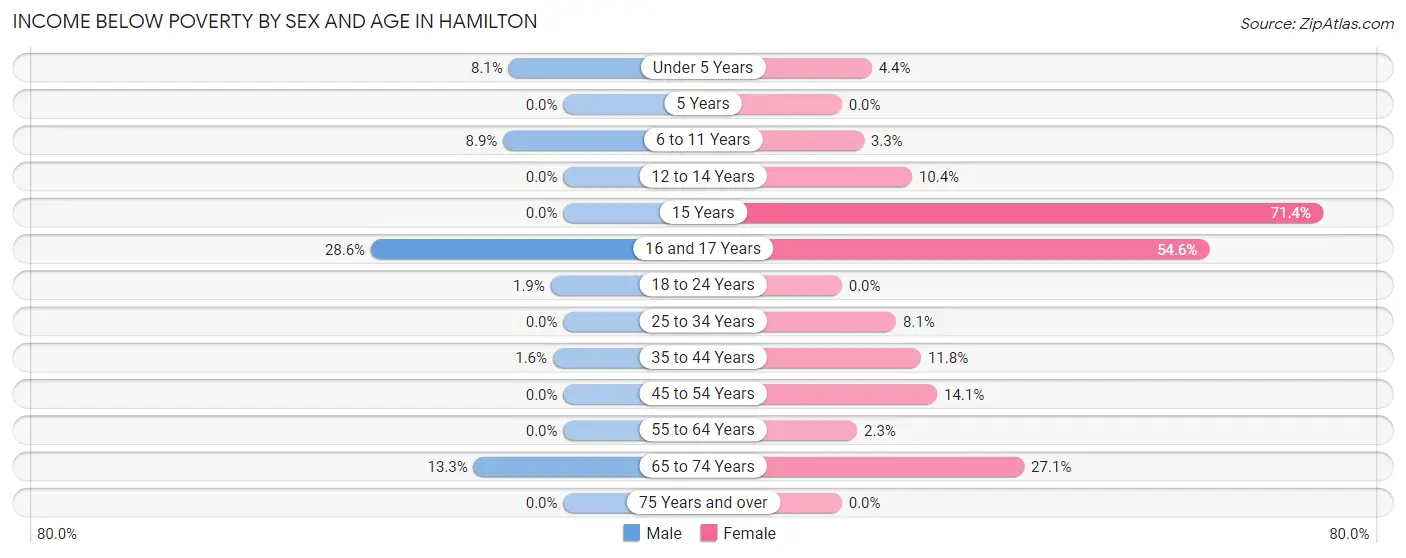
| Age Bracket | Male | Female |
| Under 5 Years | 10 (8.1%) | 2 (4.4%) |
| 5 Years | 0 (0.0%) | 0 (0.0%) |
| 6 to 11 Years | 10 (8.9%) | 4 (3.3%) |
| 12 to 14 Years | 0 (0.0%) | 10 (10.4%) |
| 15 Years | 0 (0.0%) | 5 (71.4%) |
| 16 and 17 Years | 6 (28.6%) | 6 (54.5%) |
| 18 to 24 Years | 1 (1.9%) | 0 (0.0%) |
| 25 to 34 Years | 0 (0.0%) | 10 (8.1%) |
| 35 to 44 Years | 3 (1.6%) | 16 (11.8%) |
| 45 to 54 Years | 0 (0.0%) | 14 (14.1%) |
| 55 to 64 Years | 0 (0.0%) | 1 (2.3%) |
| 65 to 74 Years | 8 (13.3%) | 13 (27.1%) |
| 75 Years and over | 0 (0.0%) | 0 (0.0%) |
| Total | 38 (4.3%) | 81 (9.3%) |
Income Above Poverty by Sex and Age in Hamilton
According to the poverty statistics in Hamilton, males aged 5 years and females aged 5 years are the age groups that are most secure financially, with 100.0% of males and 100.0% of females in these age groups living above the poverty line.
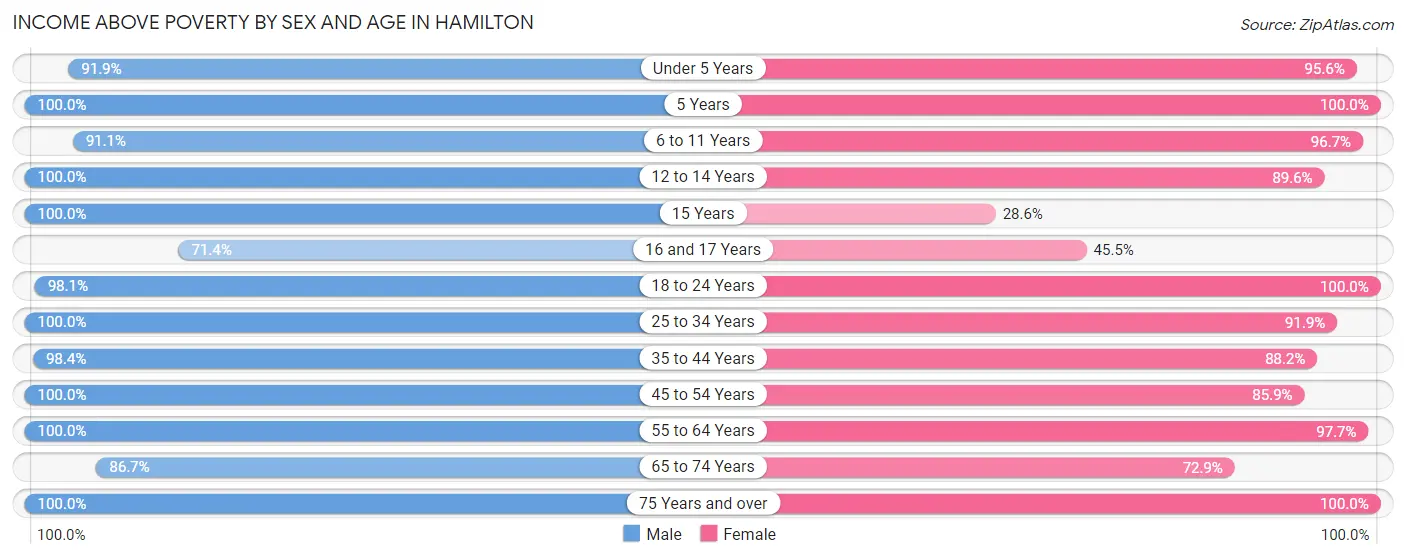
| Age Bracket | Male | Female |
| Under 5 Years | 113 (91.9%) | 43 (95.6%) |
| 5 Years | 5 (100.0%) | 4 (100.0%) |
| 6 to 11 Years | 102 (91.1%) | 118 (96.7%) |
| 12 to 14 Years | 60 (100.0%) | 86 (89.6%) |
| 15 Years | 5 (100.0%) | 2 (28.6%) |
| 16 and 17 Years | 15 (71.4%) | 5 (45.5%) |
| 18 to 24 Years | 52 (98.1%) | 90 (100.0%) |
| 25 to 34 Years | 99 (100.0%) | 114 (91.9%) |
| 35 to 44 Years | 189 (98.4%) | 120 (88.2%) |
| 45 to 54 Years | 78 (100.0%) | 85 (85.9%) |
| 55 to 64 Years | 45 (100.0%) | 43 (97.7%) |
| 65 to 74 Years | 52 (86.7%) | 35 (72.9%) |
| 75 Years and over | 29 (100.0%) | 40 (100.0%) |
| Total | 844 (95.7%) | 785 (90.6%) |
Income Below Poverty Among Married-Couple Families in Hamilton
The poverty statistics for married-couple families in Hamilton show that 2.1% or 8 of the total 388 families live below the poverty line. Families with no children have the highest poverty rate of 7.4%, comprising of 8 families. On the other hand, families with 1 or 2 children have the lowest poverty rate of 0.0%, which includes 0 families.
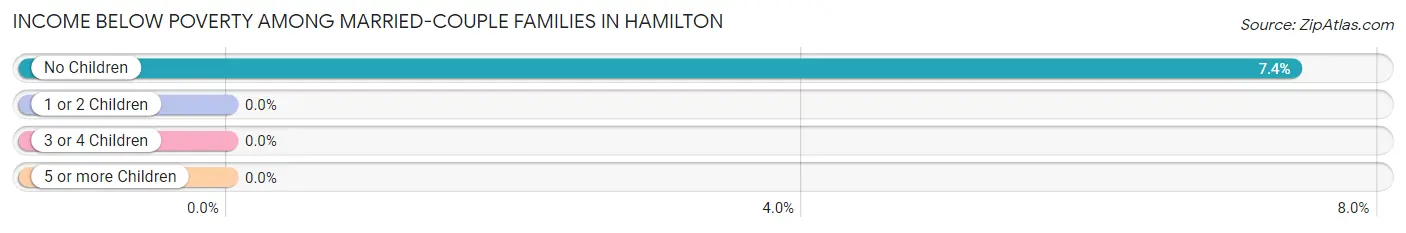
| Children | Above Poverty | Below Poverty |
| No Children | 100 (92.6%) | 8 (7.4%) |
| 1 or 2 Children | 257 (100.0%) | 0 (0.0%) |
| 3 or 4 Children | 23 (100.0%) | 0 (0.0%) |
| 5 or more Children | 0 (0.0%) | 0 (0.0%) |
| Total | 380 (97.9%) | 8 (2.1%) |
Income Below Poverty Among Single-Parent Households in Hamilton
According to the poverty data in Hamilton, 16.7% or 1 single-father households and 34.0% or 34 single-mother households are living below the poverty line. Among single-father households, those with 1 or 2 children have the highest poverty rate, with 1 households (33.3%) experiencing poverty. Likewise, among single-mother households, those with 3 or 4 children have the highest poverty rate, with 7 households (100.0%) falling below the poverty line.
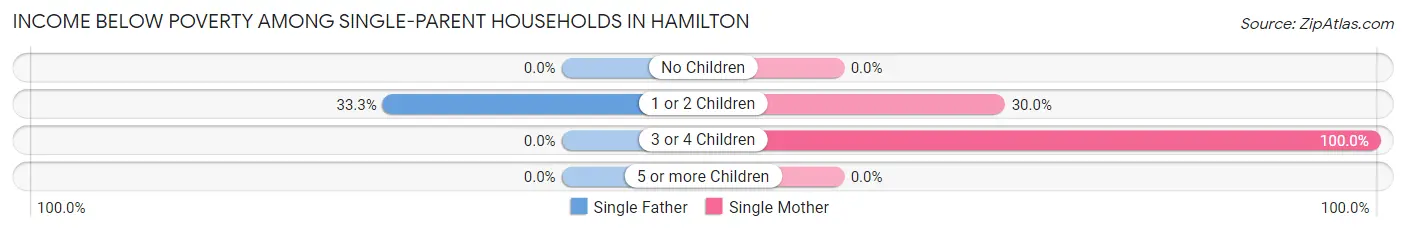
| Children | Single Father | Single Mother |
| No Children | 0 (0.0%) | 0 (0.0%) |
| 1 or 2 Children | 1 (33.3%) | 27 (30.0%) |
| 3 or 4 Children | 0 (0.0%) | 7 (100.0%) |
| 5 or more Children | 0 (0.0%) | 0 (0.0%) |
| Total | 1 (16.7%) | 34 (34.0%) |
Income Below Poverty Among Married-Couple vs Single-Parent Households in Hamilton
The poverty data for Hamilton shows that 8 of the married-couple family households (2.1%) and 35 of the single-parent households (33.0%) are living below the poverty level. Within the married-couple family households, those with no children have the highest poverty rate, with 8 households (7.4%) falling below the poverty line. Among the single-parent households, those with 3 or 4 children have the highest poverty rate, with 7 household (100.0%) living below poverty.
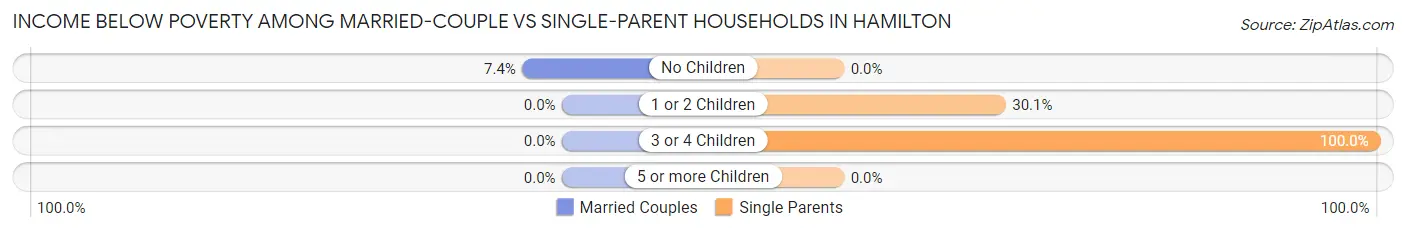
| Children | Married-Couple Families | Single-Parent Households |
| No Children | 8 (7.4%) | 0 (0.0%) |
| 1 or 2 Children | 0 (0.0%) | 28 (30.1%) |
| 3 or 4 Children | 0 (0.0%) | 7 (100.0%) |
| 5 or more Children | 0 (0.0%) | 0 (0.0%) |
| Total | 8 (2.1%) | 35 (33.0%) |
Race in Hamilton
The most populous races in Hamilton are White / Caucasian (1,304 | 67.0%), Black / African American (423 | 21.7%), and Hispanic or Latino (158 | 8.1%).
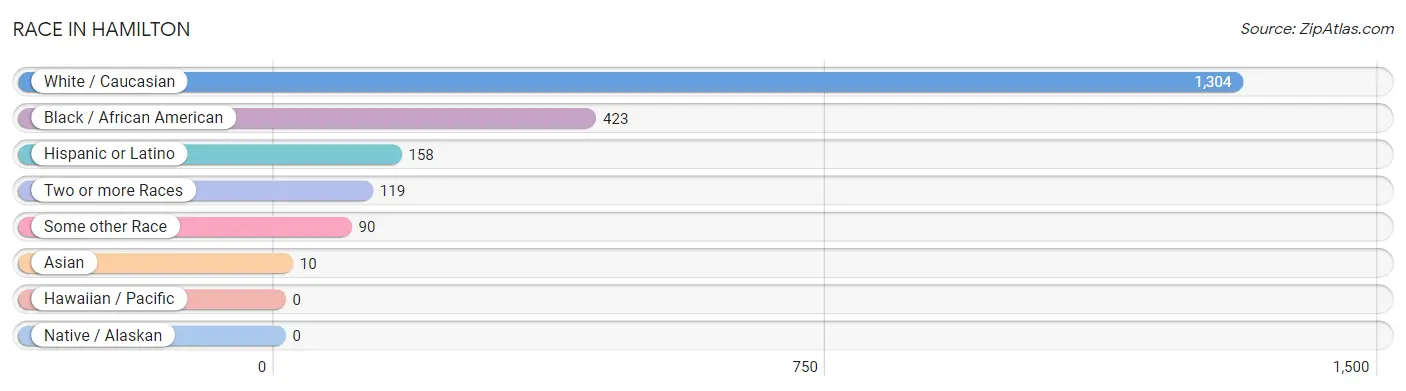
| Race | # Population | % Population |
| Asian | 10 | 0.5% |
| Black / African American | 423 | 21.7% |
| Hawaiian / Pacific | 0 | 0.0% |
| Hispanic or Latino | 158 | 8.1% |
| Native / Alaskan | 0 | 0.0% |
| White / Caucasian | 1,304 | 67.0% |
| Two or more Races | 119 | 6.1% |
| Some other Race | 90 | 4.6% |
| Total | 1,946 | 100.0% |
Ancestry in Hamilton
The most populous ancestries reported in Hamilton are Irish (504 | 25.9%), English (364 | 18.7%), American (169 | 8.7%), German (149 | 7.7%), and Mexican (81 | 4.2%), together accounting for 65.1% of all Hamilton residents.
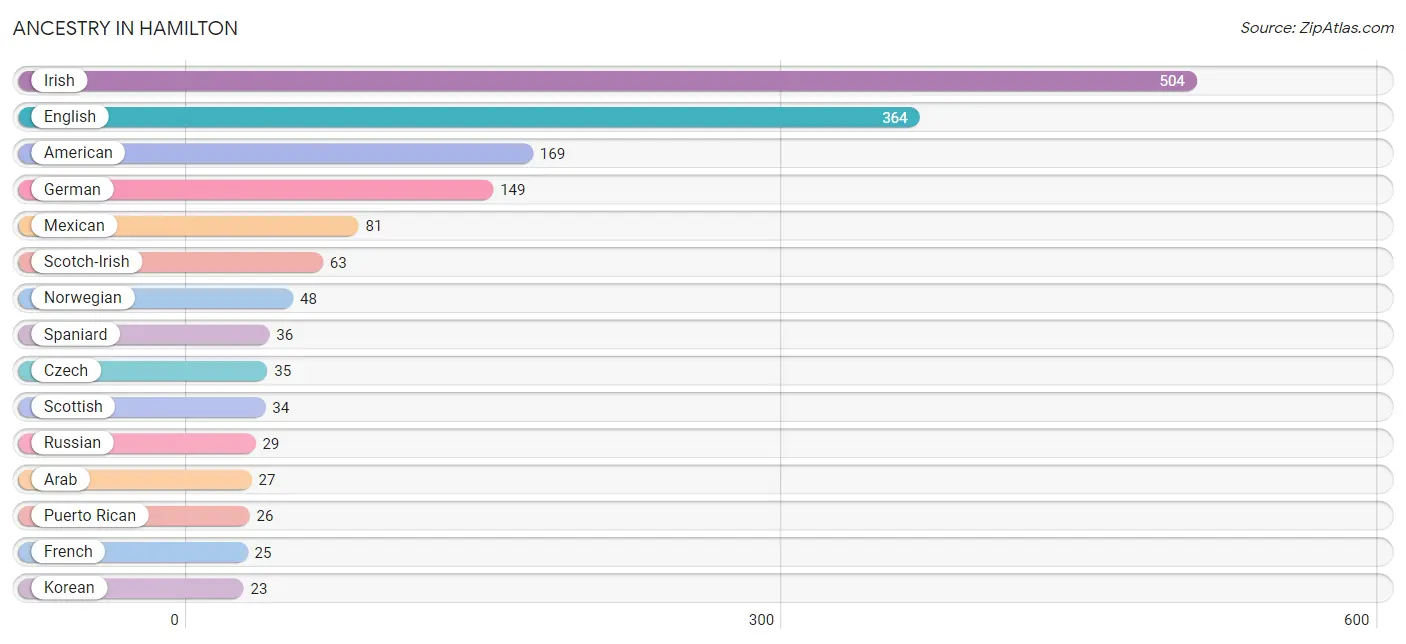
| Ancestry | # Population | % Population |
| African | 10 | 0.5% |
| American | 169 | 8.7% |
| Arab | 27 | 1.4% |
| Bhutanese | 5 | 0.3% |
| Creek | 13 | 0.7% |
| Cuban | 5 | 0.3% |
| Czech | 35 | 1.8% |
| Danish | 2 | 0.1% |
| Dutch | 4 | 0.2% |
| English | 364 | 18.7% |
| Finnish | 5 | 0.3% |
| French | 25 | 1.3% |
| German | 149 | 7.7% |
| Indian (Asian) | 1 | 0.1% |
| Irish | 504 | 25.9% |
| Italian | 22 | 1.1% |
| Korean | 23 | 1.2% |
| Lebanese | 20 | 1.0% |
| Maltese | 3 | 0.2% |
| Mexican | 81 | 4.2% |
| Norwegian | 48 | 2.5% |
| Peruvian | 5 | 0.3% |
| Polish | 6 | 0.3% |
| Portuguese | 4 | 0.2% |
| Puerto Rican | 26 | 1.3% |
| Russian | 29 | 1.5% |
| Scandinavian | 8 | 0.4% |
| Scotch-Irish | 63 | 3.2% |
| Scottish | 34 | 1.8% |
| Slovak | 12 | 0.6% |
| South American | 5 | 0.3% |
| Spaniard | 36 | 1.8% |
| Sri Lankan | 12 | 0.6% |
| Subsaharan African | 10 | 0.5% |
| Syrian | 7 | 0.4% |
| Welsh | 10 | 0.5% |
| West Indian | 1 | 0.1% | View All 37 Rows |
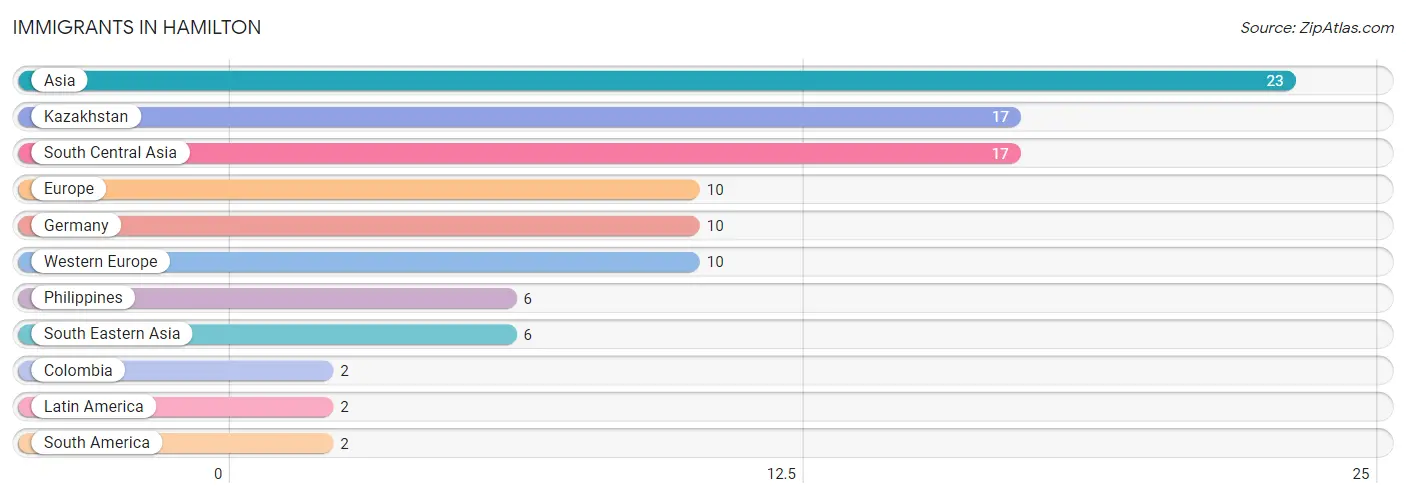
Immigrants in Hamilton
The most numerous immigrant groups reported in Hamilton came from Asia (23 | 1.2%), Kazakhstan (17 | 0.9%), South Central Asia (17 | 0.9%), Europe (10 | 0.5%), and Germany (10 | 0.5%), together accounting for 3.9% of all Hamilton residents.
| Immigration Origin | # Population | % Population |
| Asia | 23 | 1.2% |
| Colombia | 2 | 0.1% |
| Europe | 10 | 0.5% |
| Germany | 10 | 0.5% |
| Kazakhstan | 17 | 0.9% |
| Latin America | 2 | 0.1% |
| Philippines | 6 | 0.3% |
| South America | 2 | 0.1% |
| South Central Asia | 17 | 0.9% |
| South Eastern Asia | 6 | 0.3% |
| Western Europe | 10 | 0.5% | View All 11 Rows |
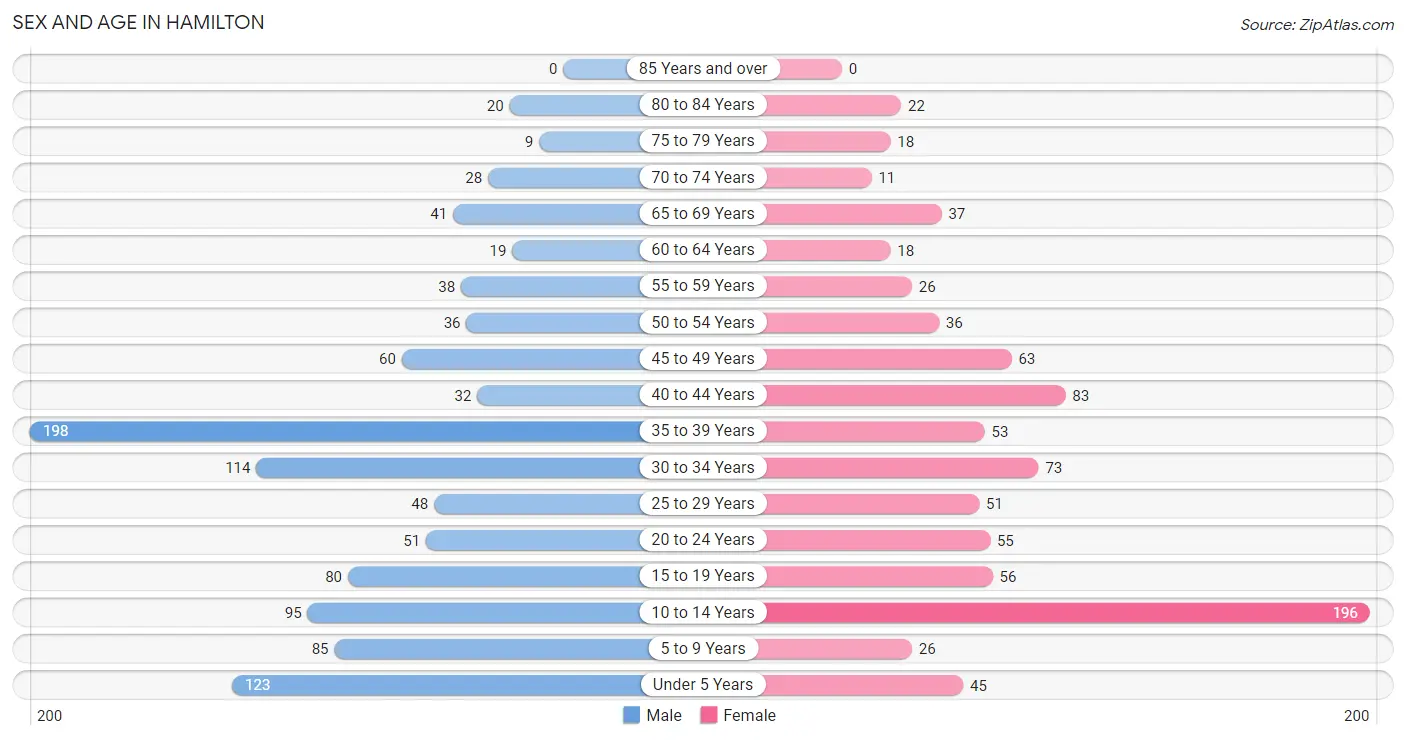
Sex and Age in Hamilton
Sex and Age in Hamilton
The most populous age groups in Hamilton are 35 to 39 Years (198 | 18.4%) for men and 10 to 14 Years (196 | 22.6%) for women.
| Age Bracket | Male | Female |
| Under 5 Years | 123 (11.4%) | 45 (5.2%) |
| 5 to 9 Years | 85 (7.9%) | 26 (3.0%) |
| 10 to 14 Years | 95 (8.8%) | 196 (22.6%) |
| 15 to 19 Years | 80 (7.4%) | 56 (6.4%) |
| 20 to 24 Years | 51 (4.7%) | 55 (6.3%) |
| 25 to 29 Years | 48 (4.5%) | 51 (5.9%) |
| 30 to 34 Years | 114 (10.6%) | 73 (8.4%) |
| 35 to 39 Years | 198 (18.4%) | 53 (6.1%) |
| 40 to 44 Years | 32 (3.0%) | 83 (9.6%) |
| 45 to 49 Years | 60 (5.6%) | 63 (7.2%) |
| 50 to 54 Years | 36 (3.3%) | 36 (4.1%) |
| 55 to 59 Years | 38 (3.5%) | 26 (3.0%) |
| 60 to 64 Years | 19 (1.8%) | 18 (2.1%) |
| 65 to 69 Years | 41 (3.8%) | 37 (4.3%) |
| 70 to 74 Years | 28 (2.6%) | 11 (1.3%) |
| 75 to 79 Years | 9 (0.8%) | 18 (2.1%) |
| 80 to 84 Years | 20 (1.9%) | 22 (2.5%) |
| 85 Years and over | 0 (0.0%) | 0 (0.0%) |
| Total | 1,077 (100.0%) | 869 (100.0%) |
Families and Households in Hamilton
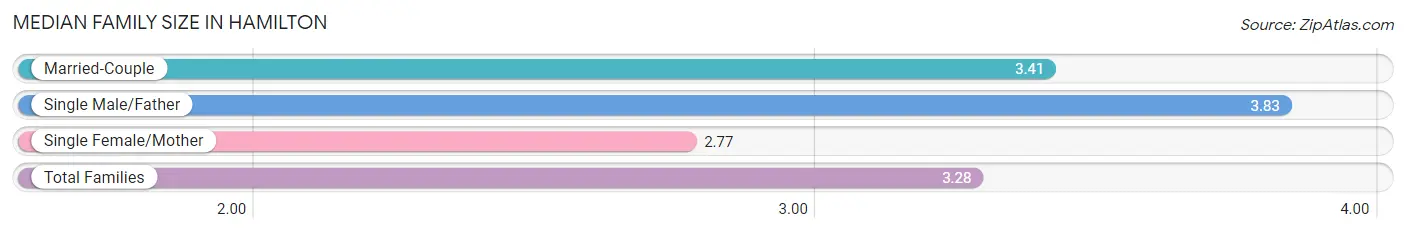
Median Family Size in Hamilton
The median family size in Hamilton is 3.28 persons per family, with single male/father families (6 | 1.2%) accounting for the largest median family size of 3.83 persons per family. On the other hand, single female/mother families (100 | 20.2%) represent the smallest median family size with 2.77 persons per family.
| Family Type | # Families | Family Size |
| Married-Couple | 388 (78.5%) | 3.41 |
| Single Male/Father | 6 (1.2%) | 3.83 |
| Single Female/Mother | 100 (20.2%) | 2.77 |
| Total Families | 494 (100.0%) | 3.28 |
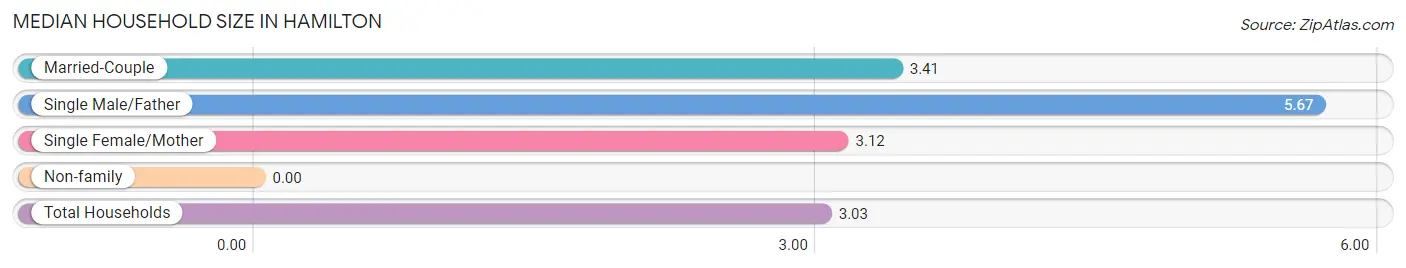
Median Household Size in Hamilton
| Household Type | # Households | Household Size |
| Married-Couple | 388 (67.2%) | 3.41 |
| Single Male/Father | 6 (1.0%) | 5.67 |
| Single Female/Mother | 100 (17.3%) | 3.12 |
| Non-family | 83 (14.4%) | - |
| Total Households | 577 (100.0%) | 3.03 |
Household Size by Marriage Status in Hamilton
Out of a total of 577 households in Hamilton, 494 (85.6%) are family households, while 83 (14.4%) are nonfamily households. The most numerous type of family households are 3-person households, comprising 165, and the most common type of nonfamily households are 1-person households, comprising 83.
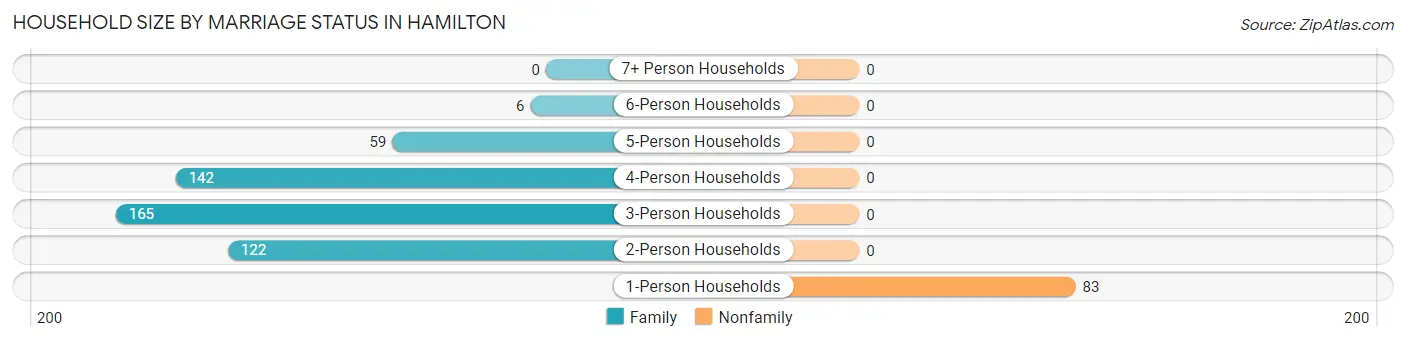
| Household Size | Family Households | Nonfamily Households |
| 1-Person Households | - | 83 (14.4%) |
| 2-Person Households | 122 (21.1%) | 0 (0.0%) |
| 3-Person Households | 165 (28.6%) | 0 (0.0%) |
| 4-Person Households | 142 (24.6%) | 0 (0.0%) |
| 5-Person Households | 59 (10.2%) | 0 (0.0%) |
| 6-Person Households | 6 (1.0%) | 0 (0.0%) |
| 7+ Person Households | 0 (0.0%) | 0 (0.0%) |
| Total | 494 (85.6%) | 83 (14.4%) |
Female Fertility in Hamilton
Fertility by Age in Hamilton
| Age Bracket | Women with Births | Births / 1,000 Women |
| 15 to 19 years | 0 (0.0%) | 0.0 |
| 20 to 34 years | 0 (0.0%) | 0.0 |
| 35 to 50 years | 0 (0.0%) | 0.0 |
| Total | 0 (0.0%) | 0.0 |
Fertility by Age by Marriage Status in Hamilton
| Age Bracket | Married | Unmarried |
| 15 to 19 years | 0 (0.0%) | 0 (0.0%) |
| 20 to 34 years | 0 (0.0%) | 0 (0.0%) |
| 35 to 50 years | 0 (0.0%) | 0 (0.0%) |
| Total | 0 (0.0%) | 0 (0.0%) |
Fertility by Education in Hamilton
| Educational Attainment | Women with Births | Births / 1,000 Women |
| Less than High School | 0 (0.0%) | 0.0 |
| High School Diploma | 0 (0.0%) | 0.0 |
| College or Associate's Degree | 0 (0.0%) | 0.0 |
| Bachelor's Degree | 0 (0.0%) | 0.0 |
| Graduate Degree | 0 (0.0%) | 0.0 |
| Total | 0 (0.0%) | 0.0 |
Fertility by Education by Marriage Status in Hamilton
| Educational Attainment | Married | Unmarried |
| Less than High School | 0 (0.0%) | 0 (0.0%) |
| High School Diploma | 0 (0.0%) | 0 (0.0%) |
| College or Associate's Degree | 0 (0.0%) | 0 (0.0%) |
| Bachelor's Degree | 0 (0.0%) | 0 (0.0%) |
| Graduate Degree | 0 (0.0%) | 0 (0.0%) |
| Total | 0 (0.0%) | 0 (0.0%) |
Employment Characteristics in Hamilton
Employment by Class of Employer in Hamilton
Among the 722 employed individuals in Hamilton, private company employees (476 | 65.9%), federal government employees (85 | 11.8%), and local government employees (77 | 10.7%) make up the most common classes of employment.
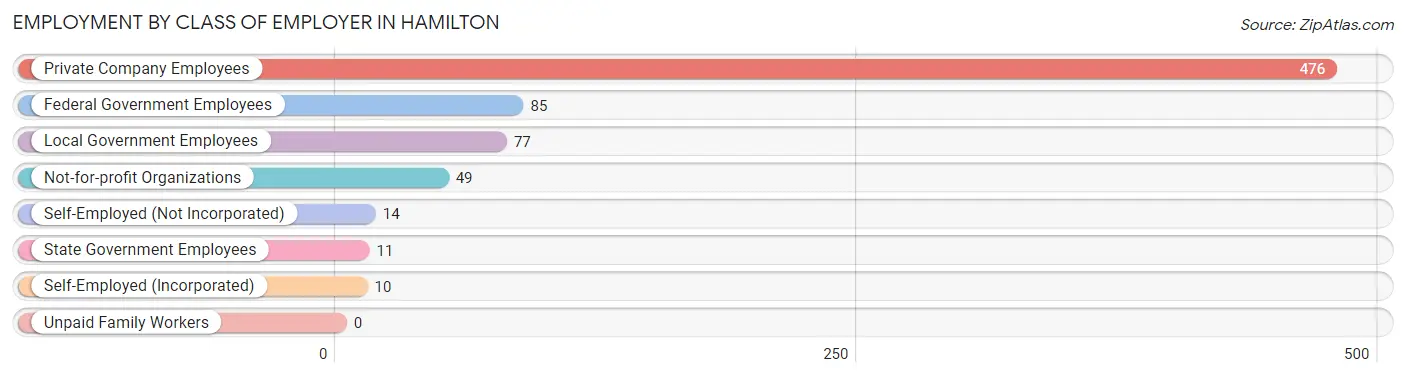
| Employer Class | # Employees | % Employees |
| Private Company Employees | 476 | 65.9% |
| Self-Employed (Incorporated) | 10 | 1.4% |
| Self-Employed (Not Incorporated) | 14 | 1.9% |
| Not-for-profit Organizations | 49 | 6.8% |
| Local Government Employees | 77 | 10.7% |
| State Government Employees | 11 | 1.5% |
| Federal Government Employees | 85 | 11.8% |
| Unpaid Family Workers | 0 | 0.0% |
| Total | 722 | 100.0% |
Employment Status by Age in Hamilton
According to the labor force statistics for Hamilton, out of the total population over 16 years of age (1,364), 57.7% or 787 individuals are in the labor force, with 7.7% or 61 of them unemployed. The age group with the highest labor force participation rate is 35 to 44 years, with 80.1% or 293 individuals in the labor force. Within the labor force, the 55 to 59 years age range has the highest percentage of unemployed individuals, with 38.9% or 7 of them being unemployed.
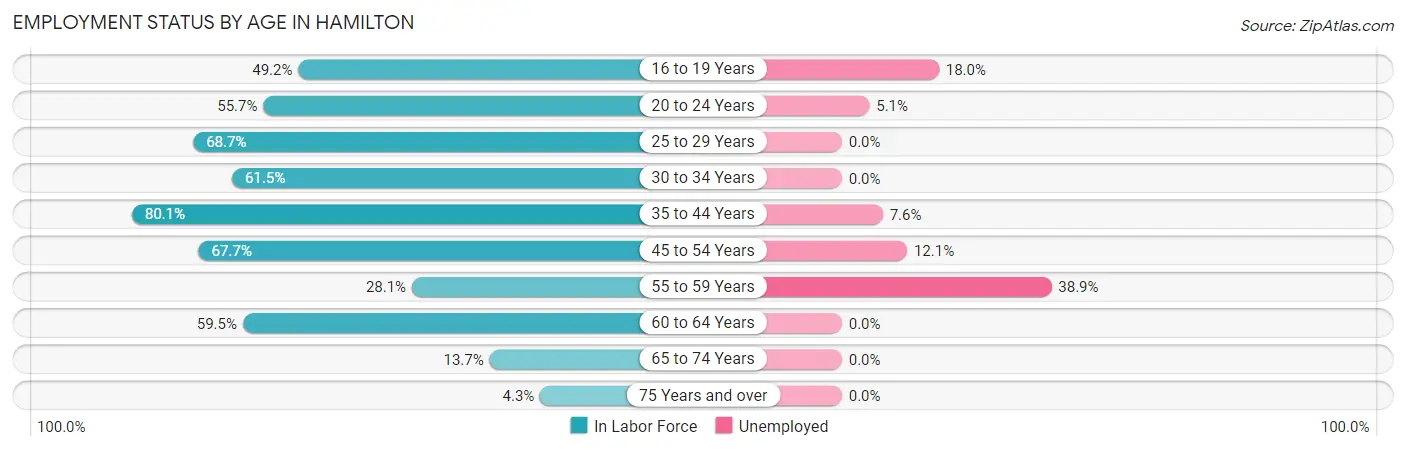
| Age Bracket | In Labor Force | Unemployed |
| 16 to 19 Years | 61 (49.2%) | 11 (18.0%) |
| 20 to 24 Years | 59 (55.7%) | 3 (5.1%) |
| 25 to 29 Years | 68 (68.7%) | 0 (0.0%) |
| 30 to 34 Years | 115 (61.5%) | 0 (0.0%) |
| 35 to 44 Years | 293 (80.1%) | 22 (7.6%) |
| 45 to 54 Years | 132 (67.7%) | 16 (12.1%) |
| 55 to 59 Years | 18 (28.1%) | 7 (38.9%) |
| 60 to 64 Years | 22 (59.5%) | 0 (0.0%) |
| 65 to 74 Years | 16 (13.7%) | 0 (0.0%) |
| 75 Years and over | 3 (4.3%) | 0 (0.0%) |
| Total | 787 (57.7%) | 61 (7.7%) |
Employment Status by Educational Attainment in Hamilton
According to labor force statistics for Hamilton, 68.4% of individuals (648) out of the total population between 25 and 64 years of age (948) are in the labor force, with 7.1% or 46 of them being unemployed. The group with the highest labor force participation rate are those with the educational attainment of bachelor's degree or higher, with 81.7% or 178 individuals in the labor force. Within the labor force, individuals with college / associate degree education have the highest percentage of unemployment, with 9.8% or 32 of them being unemployed.
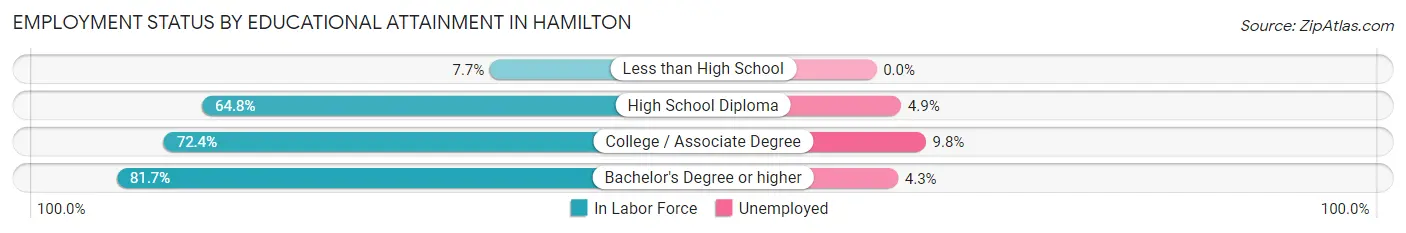
| Educational Attainment | In Labor Force | Unemployed |
| Less than High School | 5 (7.7%) | 0 (0.0%) |
| High School Diploma | 142 (64.8%) | 11 (4.9%) |
| College / Associate Degree | 323 (72.4%) | 44 (9.8%) |
| Bachelor's Degree or higher | 178 (81.7%) | 9 (4.3%) |
| Total | 648 (68.4%) | 67 (7.1%) |
Employment Occupations by Sex in Hamilton
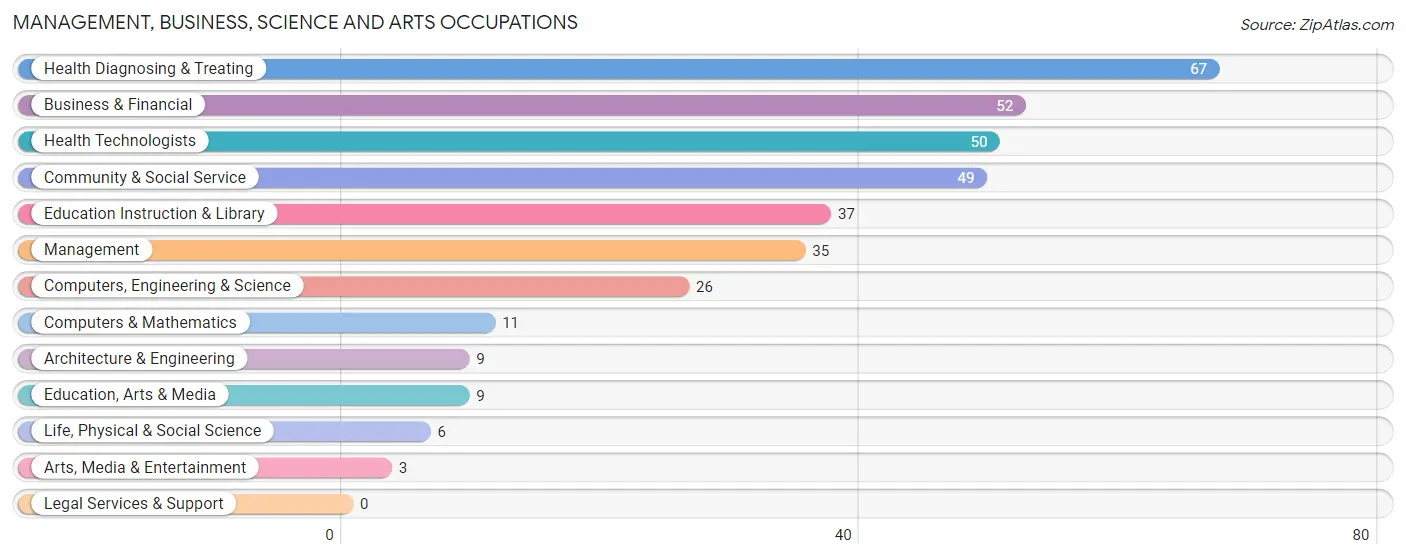
Management, Business, Science and Arts Occupations
The most common Management, Business, Science and Arts occupations in Hamilton are Health Diagnosing & Treating (67 | 9.6%), Business & Financial (52 | 7.5%), Health Technologists (50 | 7.2%), Community & Social Service (49 | 7.0%), and Education Instruction & Library (37 | 5.3%).
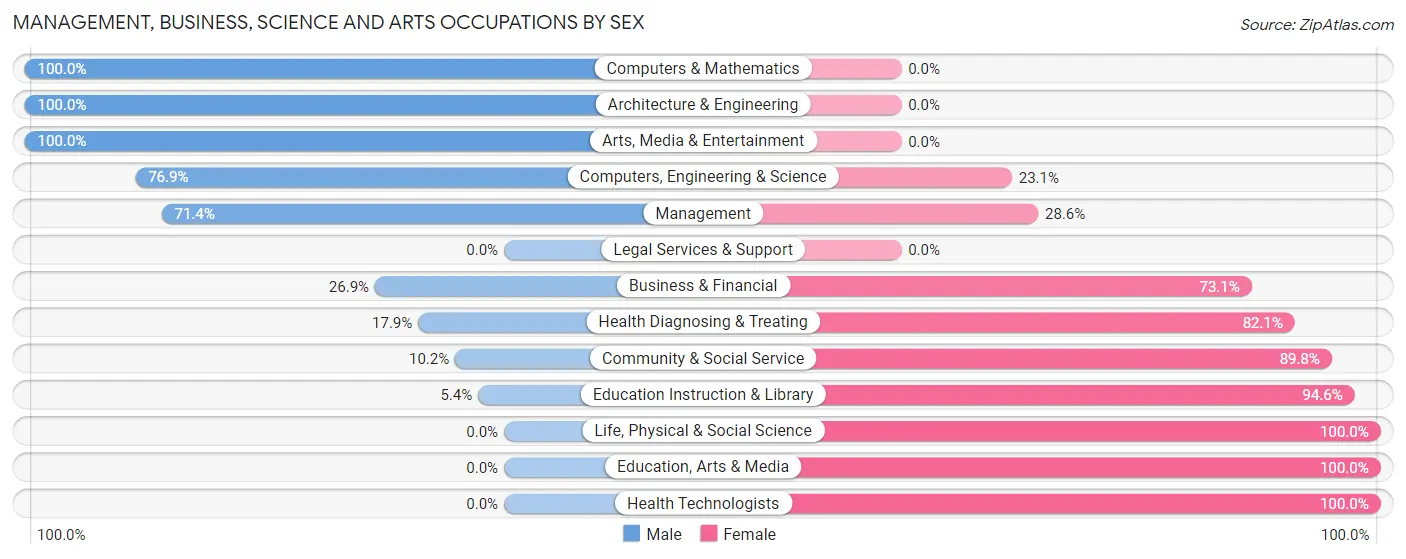
Management, Business, Science and Arts Occupations by Sex
Within the Management, Business, Science and Arts occupations in Hamilton, the most male-oriented occupations are Computers & Mathematics (100.0%), Architecture & Engineering (100.0%), and Arts, Media & Entertainment (100.0%), while the most female-oriented occupations are Life, Physical & Social Science (100.0%), Education, Arts & Media (100.0%), and Health Technologists (100.0%).
| Occupation | Male | Female |
| Management | 25 (71.4%) | 10 (28.6%) |
| Business & Financial | 14 (26.9%) | 38 (73.1%) |
| Computers, Engineering & Science | 20 (76.9%) | 6 (23.1%) |
| Computers & Mathematics | 11 (100.0%) | 0 (0.0%) |
| Architecture & Engineering | 9 (100.0%) | 0 (0.0%) |
| Life, Physical & Social Science | 0 (0.0%) | 6 (100.0%) |
| Community & Social Service | 5 (10.2%) | 44 (89.8%) |
| Education, Arts & Media | 0 (0.0%) | 9 (100.0%) |
| Legal Services & Support | 0 (0.0%) | 0 (0.0%) |
| Education Instruction & Library | 2 (5.4%) | 35 (94.6%) |
| Arts, Media & Entertainment | 3 (100.0%) | 0 (0.0%) |
| Health Diagnosing & Treating | 12 (17.9%) | 55 (82.1%) |
| Health Technologists | 0 (0.0%) | 50 (100.0%) |
| Total (Category) | 76 (33.2%) | 153 (66.8%) |
| Total (Overall) | 391 (56.1%) | 306 (43.9%) |
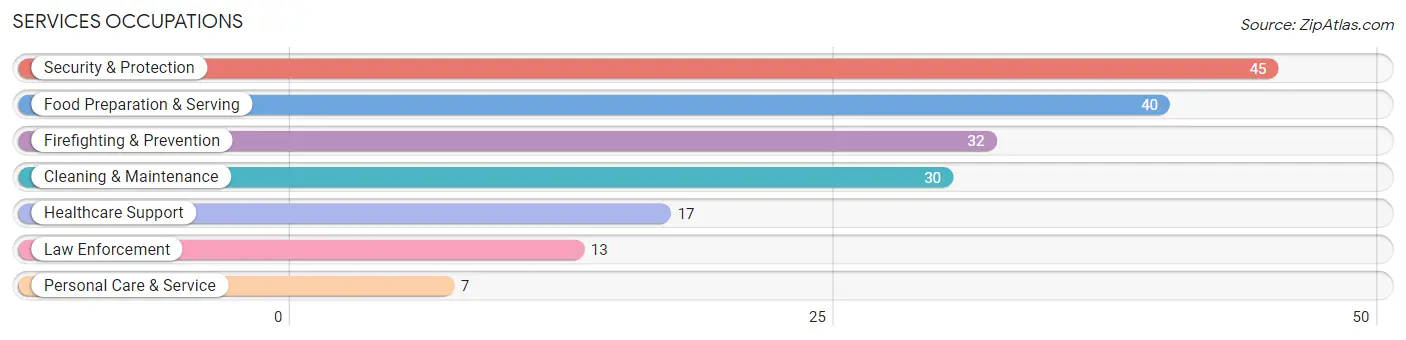
Services Occupations
The most common Services occupations in Hamilton are Security & Protection (45 | 6.5%), Food Preparation & Serving (40 | 5.7%), Firefighting & Prevention (32 | 4.6%), Cleaning & Maintenance (30 | 4.3%), and Healthcare Support (17 | 2.4%).
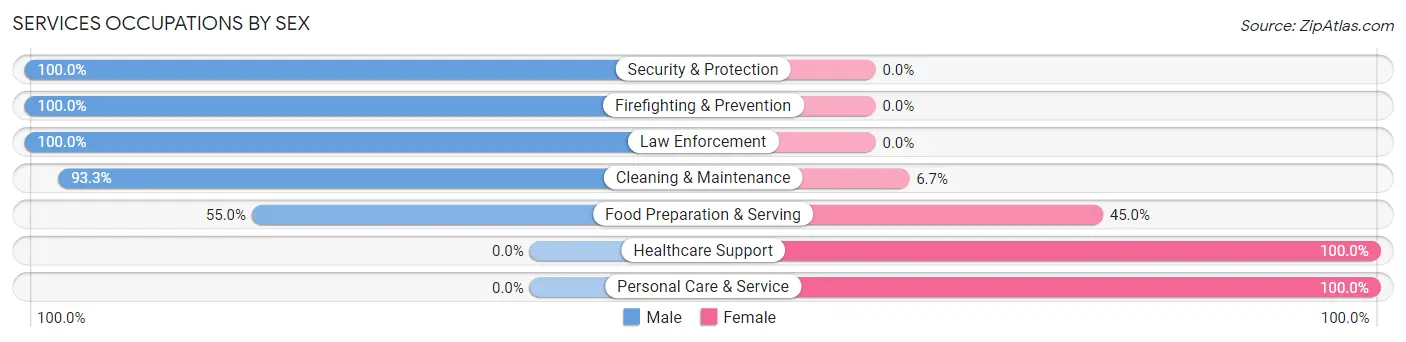
Services Occupations by Sex
Within the Services occupations in Hamilton, the most male-oriented occupations are Security & Protection (100.0%), Firefighting & Prevention (100.0%), and Law Enforcement (100.0%), while the most female-oriented occupations are Healthcare Support (100.0%), Personal Care & Service (100.0%), and Food Preparation & Serving (45.0%).
| Occupation | Male | Female |
| Healthcare Support | 0 (0.0%) | 17 (100.0%) |
| Security & Protection | 45 (100.0%) | 0 (0.0%) |
| Firefighting & Prevention | 32 (100.0%) | 0 (0.0%) |
| Law Enforcement | 13 (100.0%) | 0 (0.0%) |
| Food Preparation & Serving | 22 (55.0%) | 18 (45.0%) |
| Cleaning & Maintenance | 28 (93.3%) | 2 (6.7%) |
| Personal Care & Service | 0 (0.0%) | 7 (100.0%) |
| Total (Category) | 95 (68.3%) | 44 (31.7%) |
| Total (Overall) | 391 (56.1%) | 306 (43.9%) |
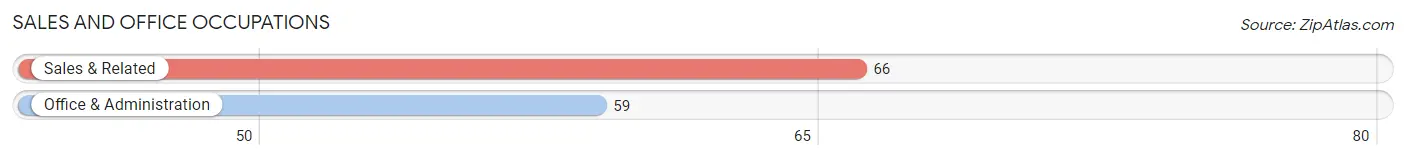
Sales and Office Occupations
The most common Sales and Office occupations in Hamilton are Sales & Related (66 | 9.5%), and Office & Administration (59 | 8.5%).
Sales and Office Occupations by Sex
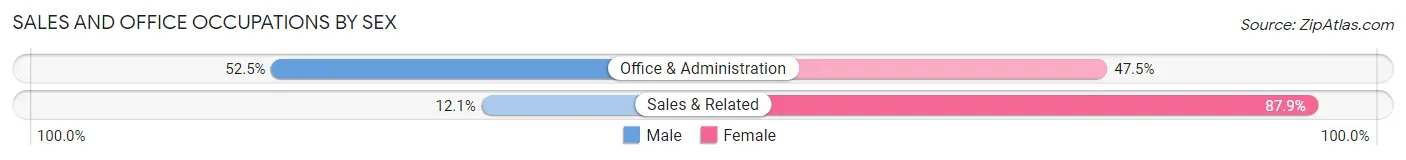
| Occupation | Male | Female |
| Sales & Related | 8 (12.1%) | 58 (87.9%) |
| Office & Administration | 31 (52.5%) | 28 (47.5%) |
| Total (Category) | 39 (31.2%) | 86 (68.8%) |
| Total (Overall) | 391 (56.1%) | 306 (43.9%) |
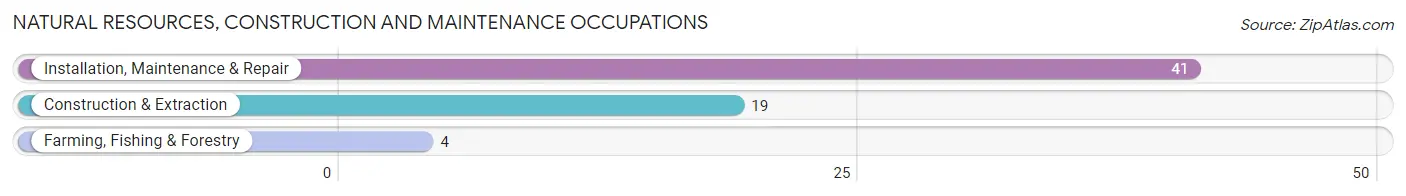
Natural Resources, Construction and Maintenance Occupations
The most common Natural Resources, Construction and Maintenance occupations in Hamilton are Installation, Maintenance & Repair (41 | 5.9%), Construction & Extraction (19 | 2.7%), and Farming, Fishing & Forestry (4 | 0.6%).
Natural Resources, Construction and Maintenance Occupations by Sex
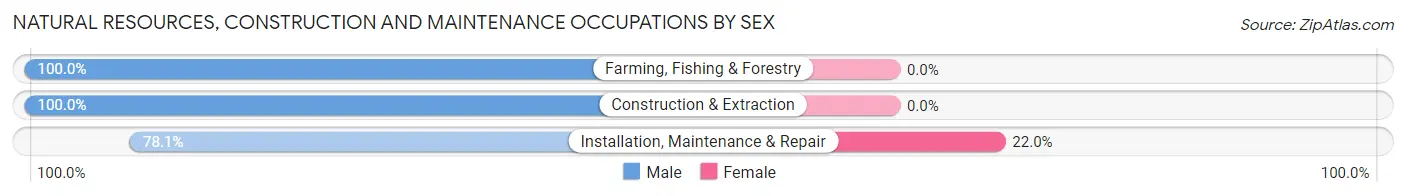
| Occupation | Male | Female |
| Farming, Fishing & Forestry | 4 (100.0%) | 0 (0.0%) |
| Construction & Extraction | 19 (100.0%) | 0 (0.0%) |
| Installation, Maintenance & Repair | 32 (78.0%) | 9 (22.0%) |
| Total (Category) | 55 (85.9%) | 9 (14.1%) |
| Total (Overall) | 391 (56.1%) | 306 (43.9%) |
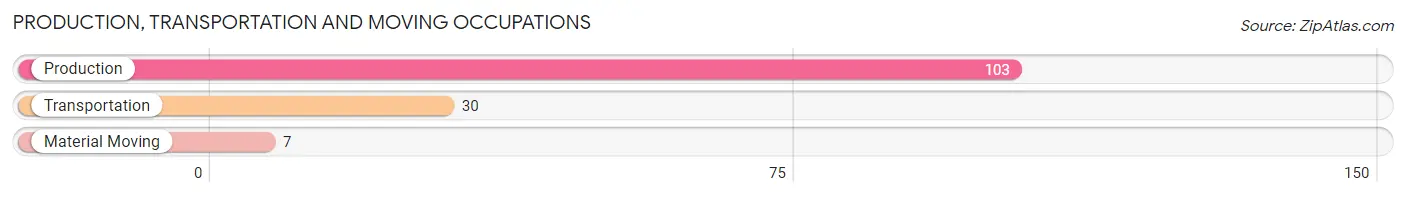
Production, Transportation and Moving Occupations
The most common Production, Transportation and Moving occupations in Hamilton are Production (103 | 14.8%), Transportation (30 | 4.3%), and Material Moving (7 | 1.0%).
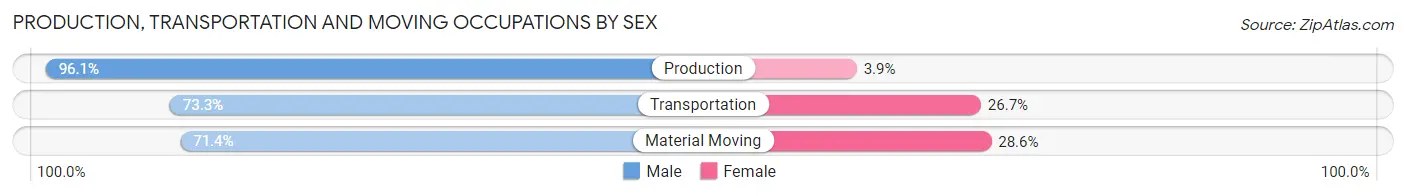
Production, Transportation and Moving Occupations by Sex
| Occupation | Male | Female |
| Production | 99 (96.1%) | 4 (3.9%) |
| Transportation | 22 (73.3%) | 8 (26.7%) |
| Material Moving | 5 (71.4%) | 2 (28.6%) |
| Total (Category) | 126 (90.0%) | 14 (10.0%) |
| Total (Overall) | 391 (56.1%) | 306 (43.9%) |
Employment Industries by Sex in Hamilton
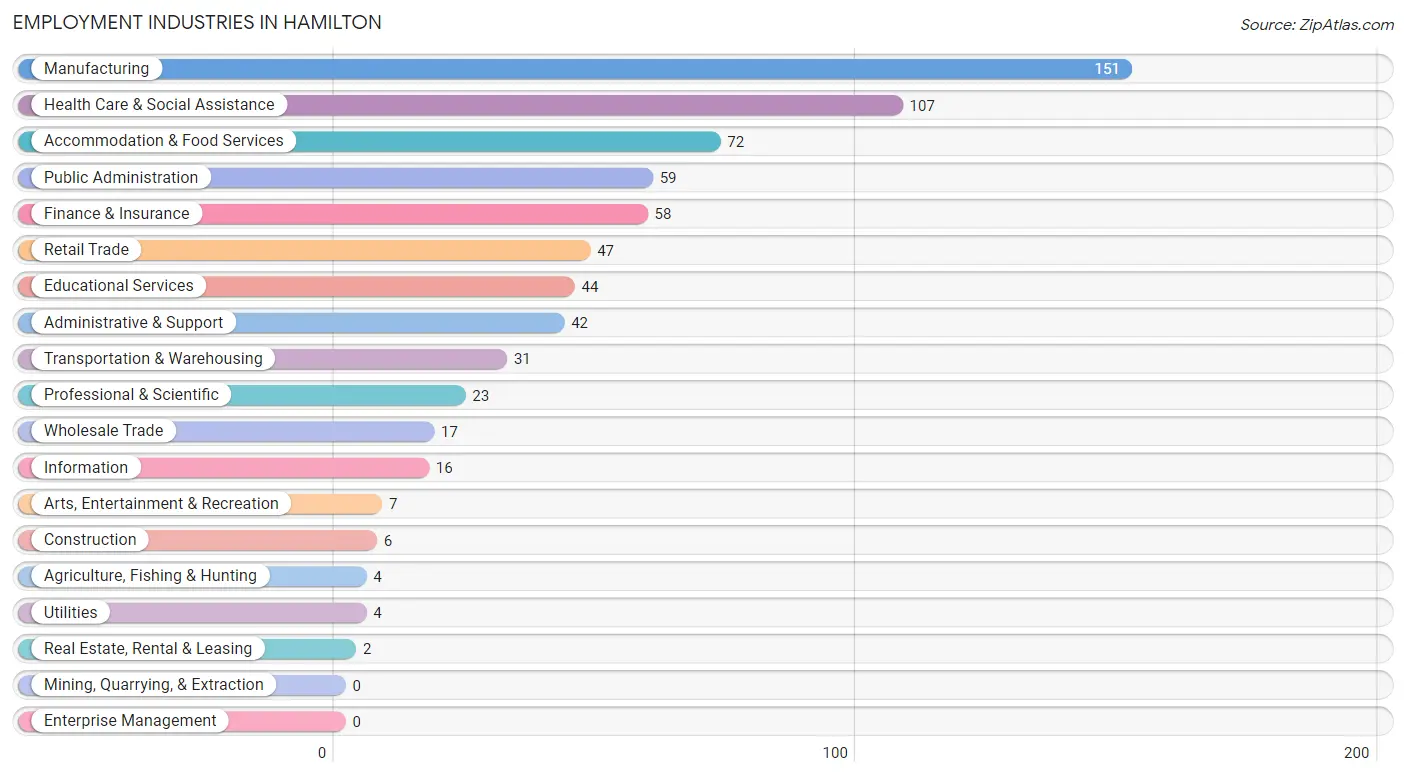
Employment Industries in Hamilton
The major employment industries in Hamilton include Manufacturing (151 | 21.7%), Health Care & Social Assistance (107 | 15.3%), Accommodation & Food Services (72 | 10.3%), Public Administration (59 | 8.5%), and Finance & Insurance (58 | 8.3%).
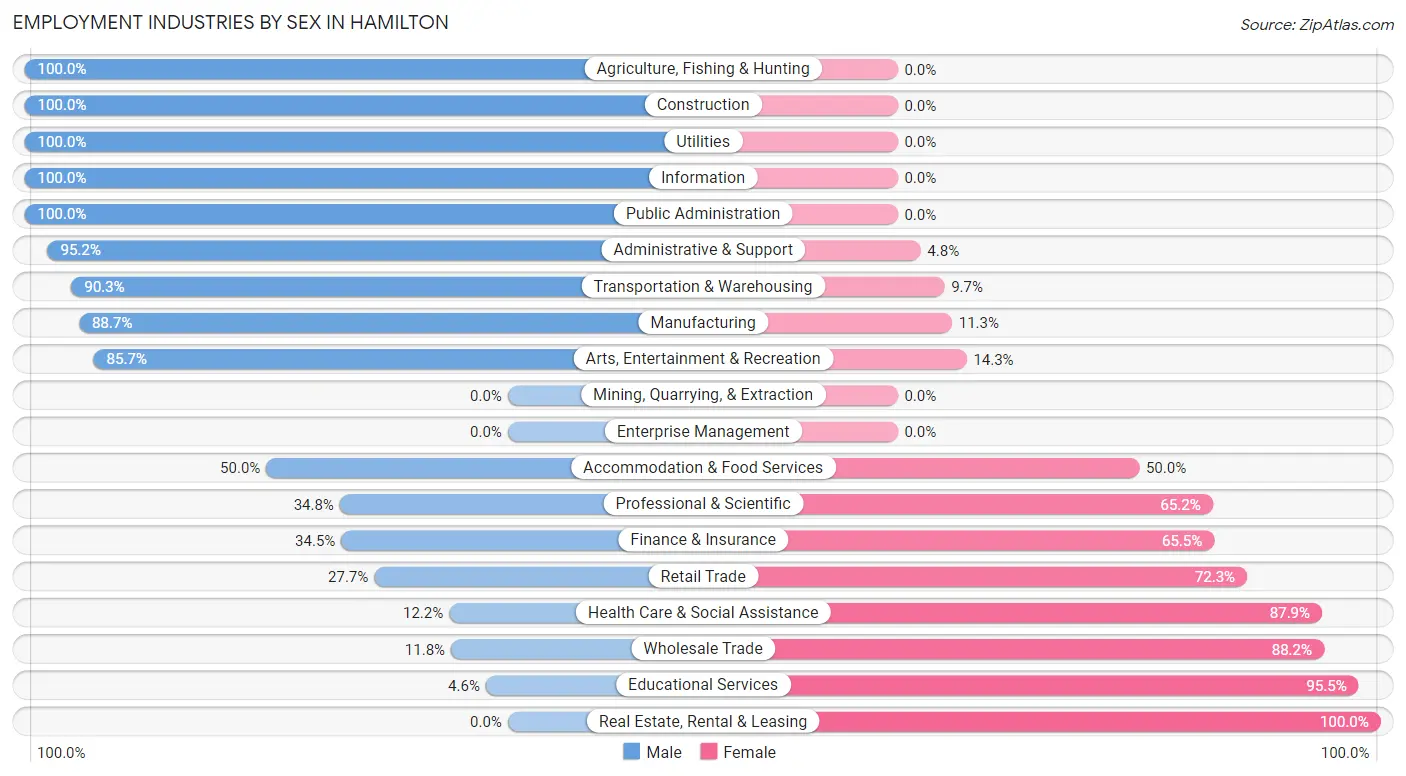
Employment Industries by Sex in Hamilton
The Hamilton industries that see more men than women are Agriculture, Fishing & Hunting (100.0%), Construction (100.0%), and Utilities (100.0%), whereas the industries that tend to have a higher number of women are Real Estate, Rental & Leasing (100.0%), Educational Services (95.5%), and Wholesale Trade (88.2%).
| Industry | Male | Female |
| Agriculture, Fishing & Hunting | 4 (100.0%) | 0 (0.0%) |
| Mining, Quarrying, & Extraction | 0 (0.0%) | 0 (0.0%) |
| Construction | 6 (100.0%) | 0 (0.0%) |
| Manufacturing | 134 (88.7%) | 17 (11.3%) |
| Wholesale Trade | 2 (11.8%) | 15 (88.2%) |
| Retail Trade | 13 (27.7%) | 34 (72.3%) |
| Transportation & Warehousing | 28 (90.3%) | 3 (9.7%) |
| Utilities | 4 (100.0%) | 0 (0.0%) |
| Information | 16 (100.0%) | 0 (0.0%) |
| Finance & Insurance | 20 (34.5%) | 38 (65.5%) |
| Real Estate, Rental & Leasing | 0 (0.0%) | 2 (100.0%) |
| Professional & Scientific | 8 (34.8%) | 15 (65.2%) |
| Enterprise Management | 0 (0.0%) | 0 (0.0%) |
| Administrative & Support | 40 (95.2%) | 2 (4.8%) |
| Educational Services | 2 (4.5%) | 42 (95.5%) |
| Health Care & Social Assistance | 13 (12.1%) | 94 (87.8%) |
| Arts, Entertainment & Recreation | 6 (85.7%) | 1 (14.3%) |
| Accommodation & Food Services | 36 (50.0%) | 36 (50.0%) |
| Public Administration | 59 (100.0%) | 0 (0.0%) |
| Total | 391 (56.1%) | 306 (43.9%) |
Education in Hamilton
School Enrollment in Hamilton
The most common levels of schooling among the 676 students in Hamilton are middle school (251 | 37.1%), nursery / preschool (110 | 16.3%), and college / undergraduate (107 | 15.8%).
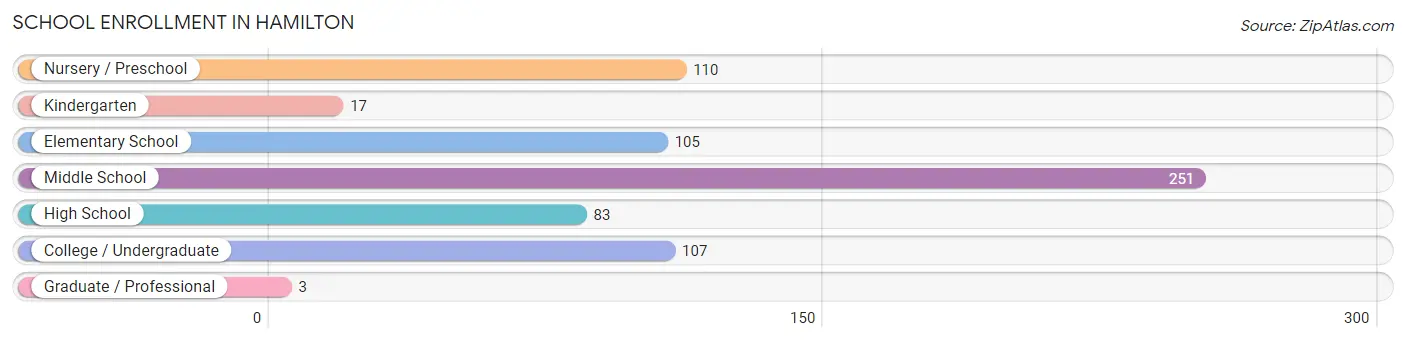
| School Level | # Students | % Students |
| Nursery / Preschool | 110 | 16.3% |
| Kindergarten | 17 | 2.5% |
| Elementary School | 105 | 15.5% |
| Middle School | 251 | 37.1% |
| High School | 83 | 12.3% |
| College / Undergraduate | 107 | 15.8% |
| Graduate / Professional | 3 | 0.4% |
| Total | 676 | 100.0% |
School Enrollment by Age by Funding Source in Hamilton
Out of a total of 676 students who are enrolled in schools in Hamilton, 66 (9.8%) attend a private institution, while the remaining 610 (90.2%) are enrolled in public schools. The age group of 20 to 24 year olds has the highest likelihood of being enrolled in private schools, with 18 (54.5% in the age bracket) enrolled. Conversely, the age group of 5 to 9 year old has the lowest likelihood of being enrolled in a private school, with 111 (100.0% in the age bracket) attending a public institution.
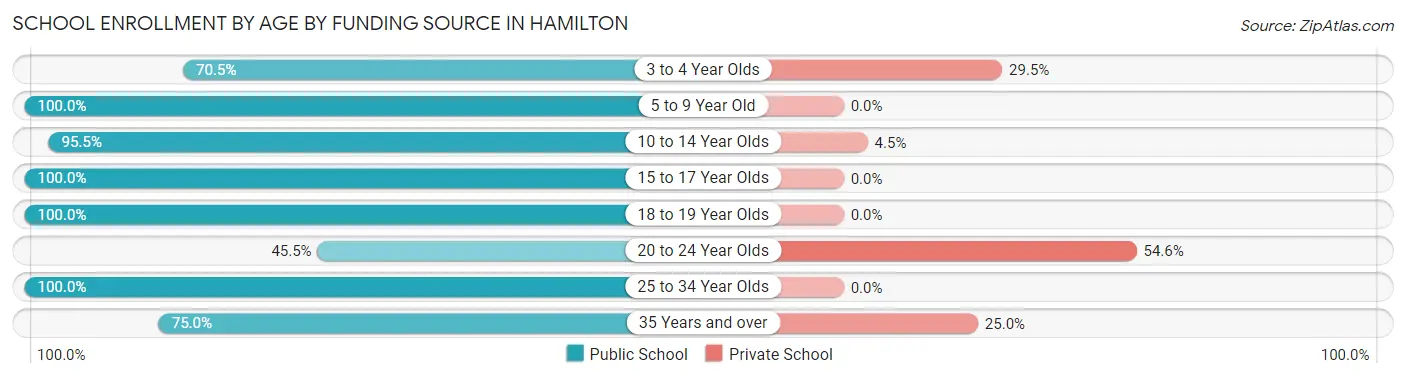
| Age Bracket | Public School | Private School |
| 3 to 4 Year Olds | 74 (70.5%) | 31 (29.5%) |
| 5 to 9 Year Old | 111 (100.0%) | 0 (0.0%) |
| 10 to 14 Year Olds | 278 (95.5%) | 13 (4.5%) |
| 15 to 17 Year Olds | 47 (100.0%) | 0 (0.0%) |
| 18 to 19 Year Olds | 49 (100.0%) | 0 (0.0%) |
| 20 to 24 Year Olds | 15 (45.5%) | 18 (54.5%) |
| 25 to 34 Year Olds | 24 (100.0%) | 0 (0.0%) |
| 35 Years and over | 12 (75.0%) | 4 (25.0%) |
| Total | 610 (90.2%) | 66 (9.8%) |
Educational Attainment by Field of Study in Hamilton
Business (66 | 22.7%), education (53 | 18.2%), social sciences (26 | 8.9%), science & technology (26 | 8.9%), and bio, nature & agricultural (25 | 8.6%) are the most common fields of study among 291 individuals in Hamilton who have obtained a bachelor's degree or higher.
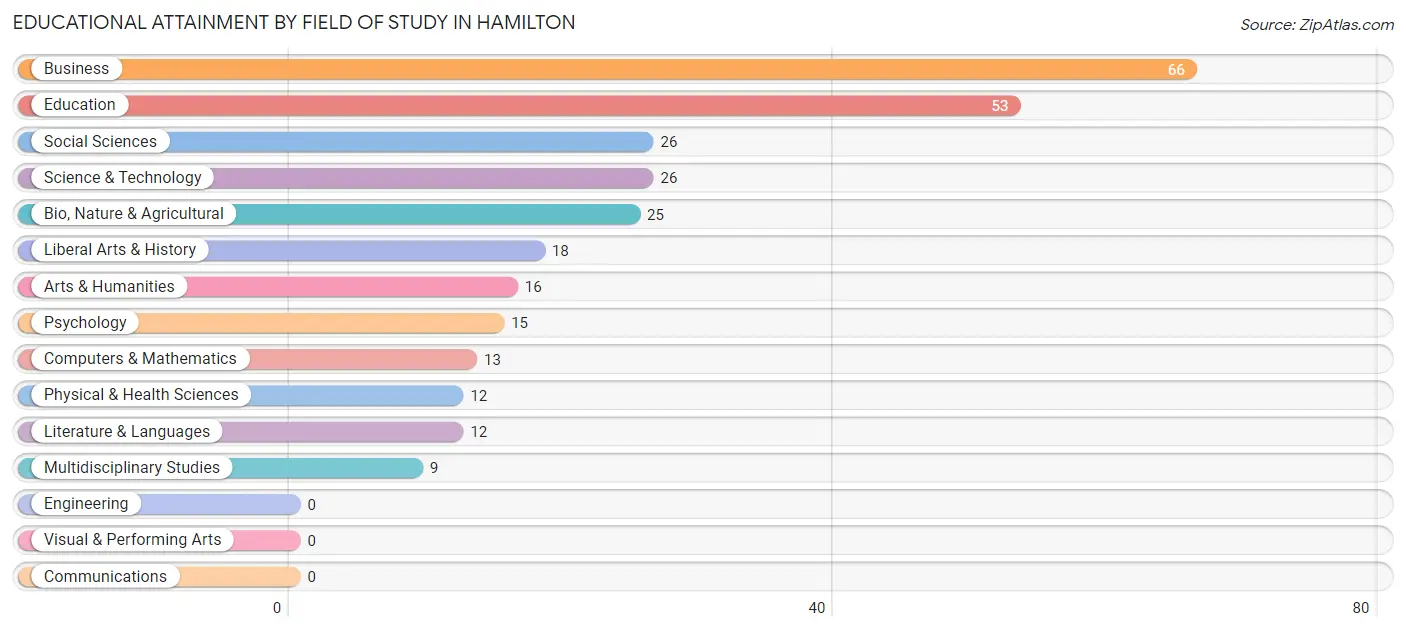
| Field of Study | # Graduates | % Graduates |
| Computers & Mathematics | 13 | 4.5% |
| Bio, Nature & Agricultural | 25 | 8.6% |
| Physical & Health Sciences | 12 | 4.1% |
| Psychology | 15 | 5.1% |
| Social Sciences | 26 | 8.9% |
| Engineering | 0 | 0.0% |
| Multidisciplinary Studies | 9 | 3.1% |
| Science & Technology | 26 | 8.9% |
| Business | 66 | 22.7% |
| Education | 53 | 18.2% |
| Literature & Languages | 12 | 4.1% |
| Liberal Arts & History | 18 | 6.2% |
| Visual & Performing Arts | 0 | 0.0% |
| Communications | 0 | 0.0% |
| Arts & Humanities | 16 | 5.5% |
| Total | 291 | 100.0% |
Transportation & Commute in Hamilton
Vehicle Availability by Sex in Hamilton
The most prevalent vehicle ownership categories in Hamilton are males with 3 vehicles (193, accounting for 46.1%) and females with 3 vehicles (106, making up 63.7%).
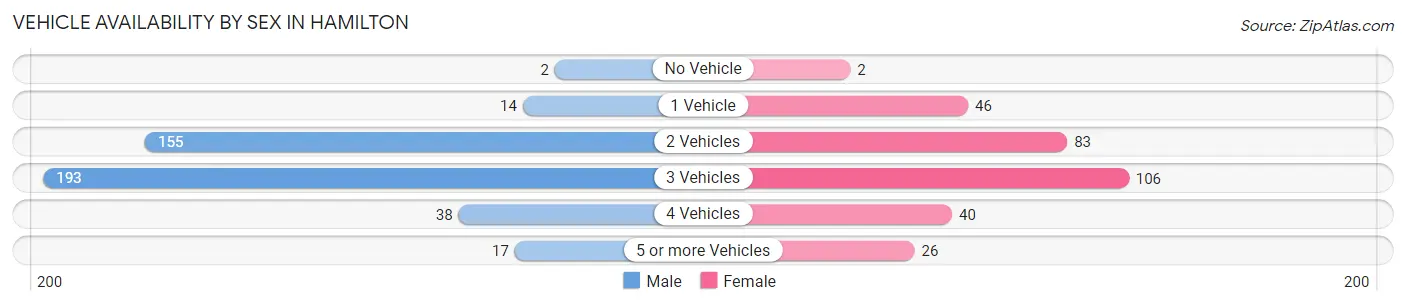
| Vehicles Available | Male | Female |
| No Vehicle | 2 (0.5%) | 2 (0.7%) |
| 1 Vehicle | 14 (3.3%) | 46 (15.2%) |
| 2 Vehicles | 155 (37.0%) | 83 (27.4%) |
| 3 Vehicles | 193 (46.1%) | 106 (35.0%) |
| 4 Vehicles | 38 (9.1%) | 40 (13.2%) |
| 5 or more Vehicles | 17 (4.1%) | 26 (8.6%) |
| Total | 419 (100.0%) | 303 (100.0%) |
Commute Time in Hamilton
The most frequently occuring commute durations in Hamilton are 30 to 34 minutes (242 commuters, 35.4%), 45 to 59 minutes (82 commuters, 12.0%), and 15 to 19 minutes (71 commuters, 10.4%).
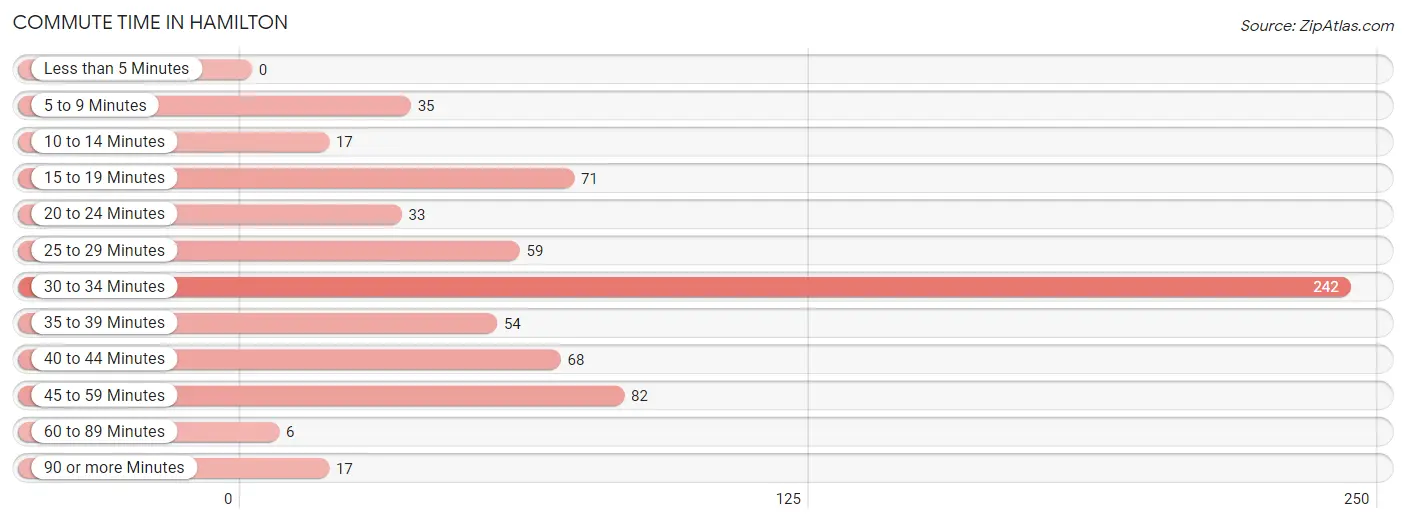
| Commute Time | # Commuters | % Commuters |
| Less than 5 Minutes | 0 | 0.0% |
| 5 to 9 Minutes | 35 | 5.1% |
| 10 to 14 Minutes | 17 | 2.5% |
| 15 to 19 Minutes | 71 | 10.4% |
| 20 to 24 Minutes | 33 | 4.8% |
| 25 to 29 Minutes | 59 | 8.6% |
| 30 to 34 Minutes | 242 | 35.4% |
| 35 to 39 Minutes | 54 | 7.9% |
| 40 to 44 Minutes | 68 | 9.9% |
| 45 to 59 Minutes | 82 | 12.0% |
| 60 to 89 Minutes | 6 | 0.9% |
| 90 or more Minutes | 17 | 2.5% |
Commute Time by Sex in Hamilton
The most common commute times in Hamilton are 30 to 34 minutes (150 commuters, 36.7%) for males and 30 to 34 minutes (92 commuters, 33.5%) for females.
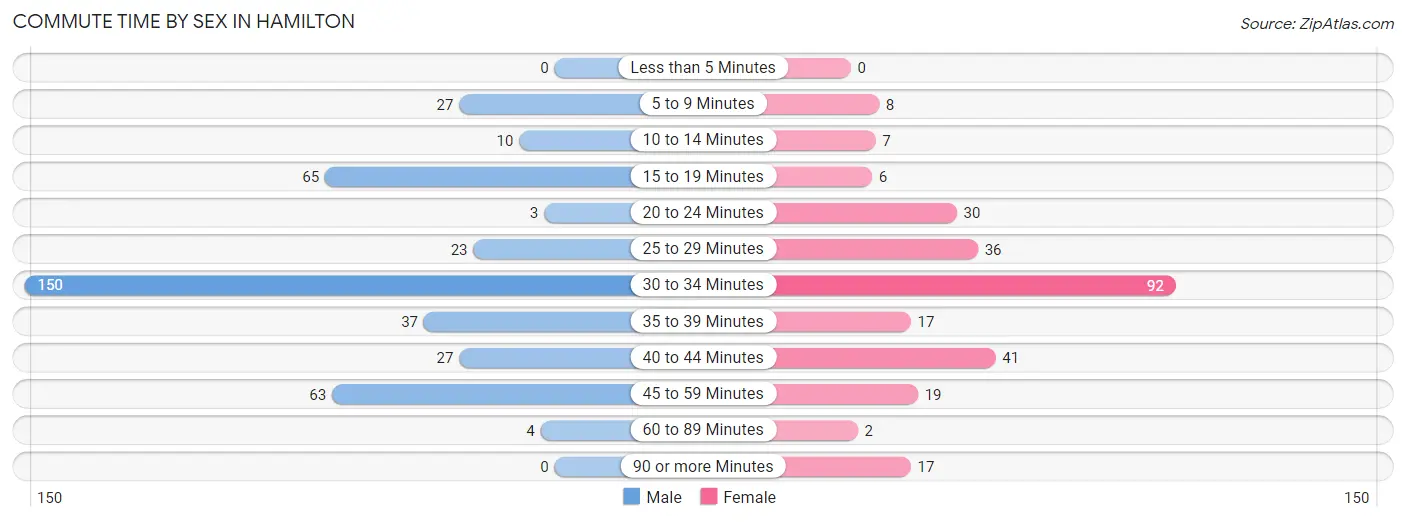
| Commute Time | Male | Female |
| Less than 5 Minutes | 0 (0.0%) | 0 (0.0%) |
| 5 to 9 Minutes | 27 (6.6%) | 8 (2.9%) |
| 10 to 14 Minutes | 10 (2.4%) | 7 (2.5%) |
| 15 to 19 Minutes | 65 (15.9%) | 6 (2.2%) |
| 20 to 24 Minutes | 3 (0.7%) | 30 (10.9%) |
| 25 to 29 Minutes | 23 (5.6%) | 36 (13.1%) |
| 30 to 34 Minutes | 150 (36.7%) | 92 (33.5%) |
| 35 to 39 Minutes | 37 (9.0%) | 17 (6.2%) |
| 40 to 44 Minutes | 27 (6.6%) | 41 (14.9%) |
| 45 to 59 Minutes | 63 (15.4%) | 19 (6.9%) |
| 60 to 89 Minutes | 4 (1.0%) | 2 (0.7%) |
| 90 or more Minutes | 0 (0.0%) | 17 (6.2%) |
Time of Departure to Work by Sex in Hamilton
The most frequent times of departure to work in Hamilton are 5:30 AM to 5:59 AM (105, 25.7%) for males and 7:30 AM to 7:59 AM (43, 15.6%) for females.
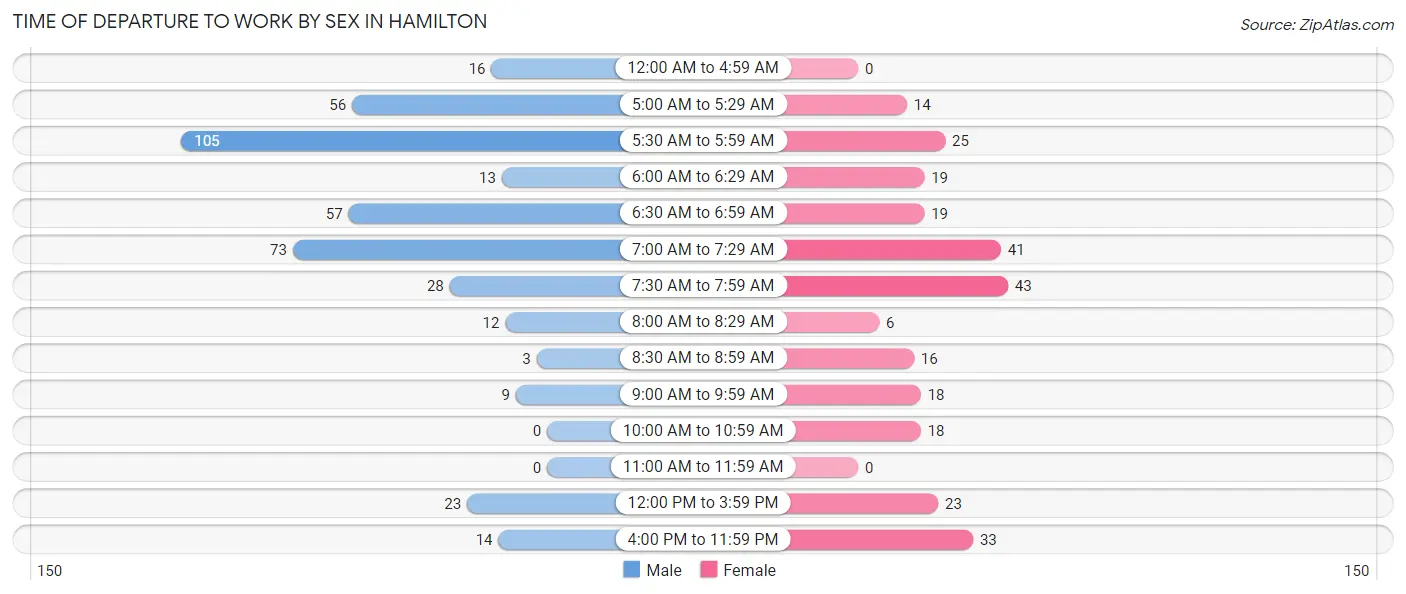
| Time of Departure | Male | Female |
| 12:00 AM to 4:59 AM | 16 (3.9%) | 0 (0.0%) |
| 5:00 AM to 5:29 AM | 56 (13.7%) | 14 (5.1%) |
| 5:30 AM to 5:59 AM | 105 (25.7%) | 25 (9.1%) |
| 6:00 AM to 6:29 AM | 13 (3.2%) | 19 (6.9%) |
| 6:30 AM to 6:59 AM | 57 (13.9%) | 19 (6.9%) |
| 7:00 AM to 7:29 AM | 73 (17.8%) | 41 (14.9%) |
| 7:30 AM to 7:59 AM | 28 (6.9%) | 43 (15.6%) |
| 8:00 AM to 8:29 AM | 12 (2.9%) | 6 (2.2%) |
| 8:30 AM to 8:59 AM | 3 (0.7%) | 16 (5.8%) |
| 9:00 AM to 9:59 AM | 9 (2.2%) | 18 (6.6%) |
| 10:00 AM to 10:59 AM | 0 (0.0%) | 18 (6.6%) |
| 11:00 AM to 11:59 AM | 0 (0.0%) | 0 (0.0%) |
| 12:00 PM to 3:59 PM | 23 (5.6%) | 23 (8.4%) |
| 4:00 PM to 11:59 PM | 14 (3.4%) | 33 (12.0%) |
| Total | 409 (100.0%) | 275 (100.0%) |
Housing Occupancy in Hamilton
Occupancy by Ownership in Hamilton
Of the total 577 dwellings in Hamilton, owner-occupied units account for 440 (76.3%), while renter-occupied units make up 137 (23.7%).
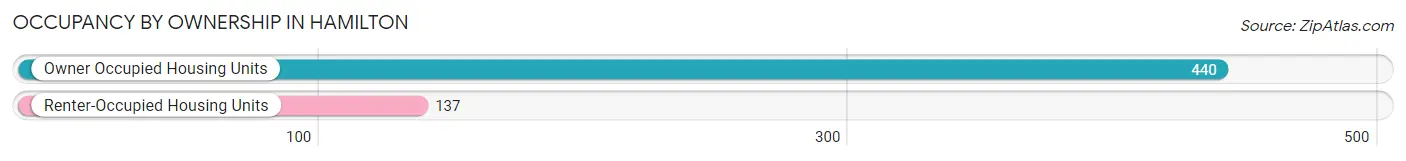
| Occupancy | # Housing Units | % Housing Units |
| Owner Occupied Housing Units | 440 | 76.3% |
| Renter-Occupied Housing Units | 137 | 23.7% |
| Total Occupied Housing Units | 577 | 100.0% |
Occupancy by Household Size in Hamilton
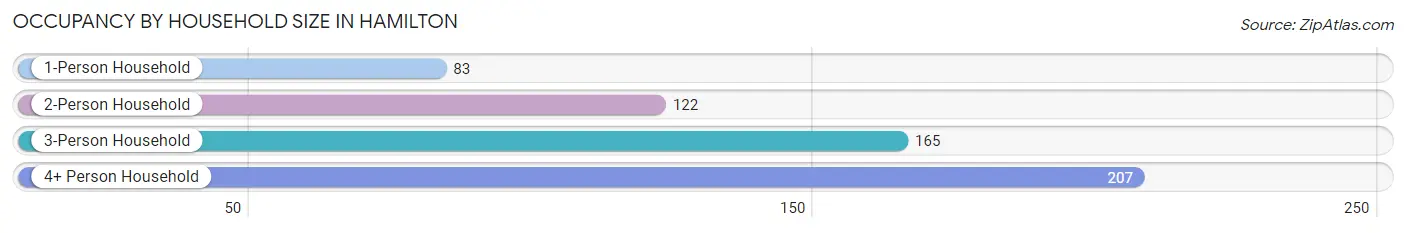
| Household Size | # Housing Units | % Housing Units |
| 1-Person Household | 83 | 14.4% |
| 2-Person Household | 122 | 21.1% |
| 3-Person Household | 165 | 28.6% |
| 4+ Person Household | 207 | 35.9% |
| Total Housing Units | 577 | 100.0% |
Occupancy by Ownership by Household Size in Hamilton
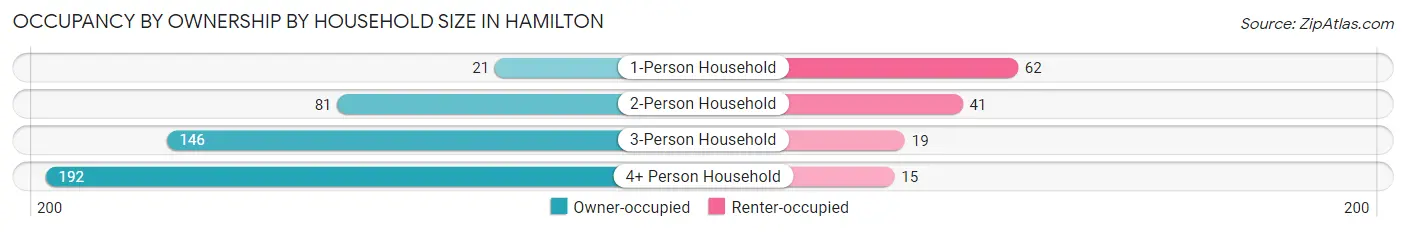
| Household Size | Owner-occupied | Renter-occupied |
| 1-Person Household | 21 (25.3%) | 62 (74.7%) |
| 2-Person Household | 81 (66.4%) | 41 (33.6%) |
| 3-Person Household | 146 (88.5%) | 19 (11.5%) |
| 4+ Person Household | 192 (92.7%) | 15 (7.2%) |
| Total Housing Units | 440 (76.3%) | 137 (23.7%) |
Occupancy by Educational Attainment in Hamilton
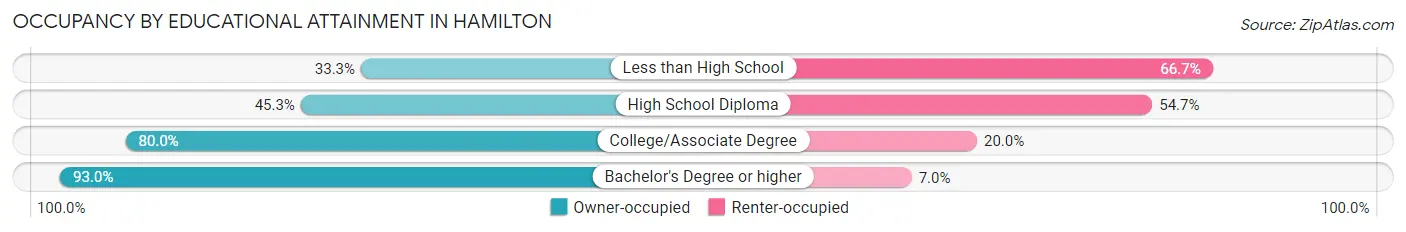
| Household Size | Owner-occupied | Renter-occupied |
| Less than High School | 5 (33.3%) | 10 (66.7%) |
| High School Diploma | 43 (45.3%) | 52 (54.7%) |
| College/Associate Degree | 260 (80.0%) | 65 (20.0%) |
| Bachelor's Degree or higher | 132 (93.0%) | 10 (7.0%) |
Occupancy by Age of Householder in Hamilton
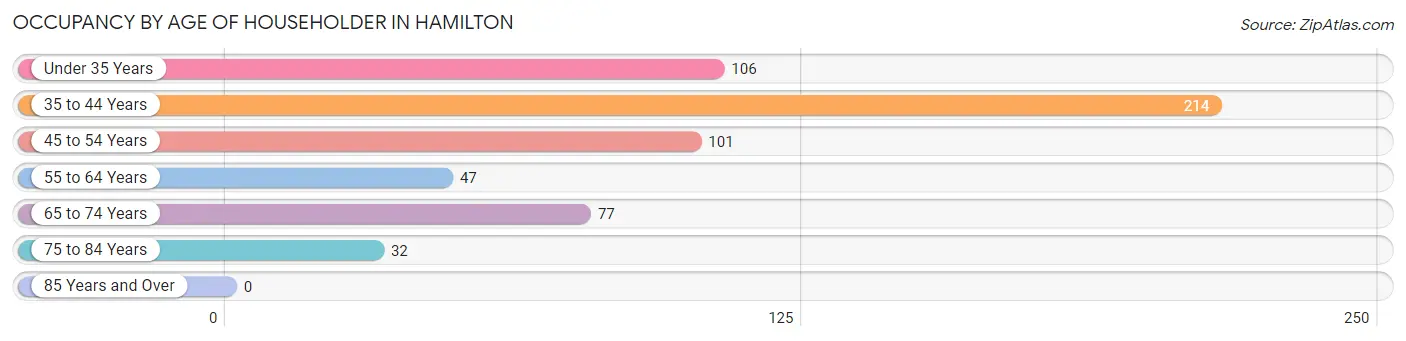
| Age Bracket | # Households | % Households |
| Under 35 Years | 106 | 18.4% |
| 35 to 44 Years | 214 | 37.1% |
| 45 to 54 Years | 101 | 17.5% |
| 55 to 64 Years | 47 | 8.2% |
| 65 to 74 Years | 77 | 13.3% |
| 75 to 84 Years | 32 | 5.6% |
| 85 Years and Over | 0 | 0.0% |
| Total | 577 | 100.0% |
Housing Finances in Hamilton
Median Income by Occupancy in Hamilton
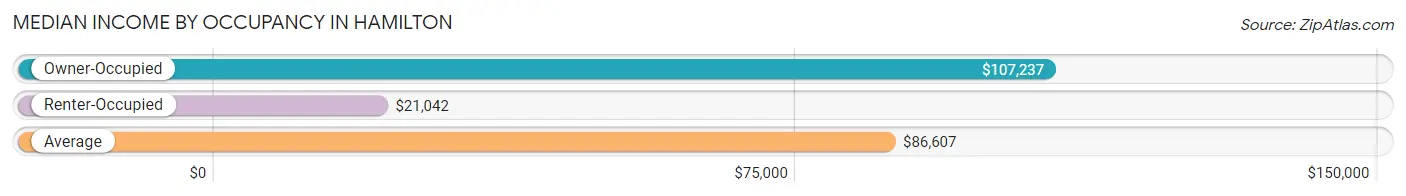
| Occupancy Type | # Households | Median Income |
| Owner-Occupied | 440 (76.3%) | $107,237 |
| Renter-Occupied | 137 (23.7%) | $21,042 |
| Average | 577 (100.0%) | $86,607 |
Occupancy by Householder Income Bracket in Hamilton
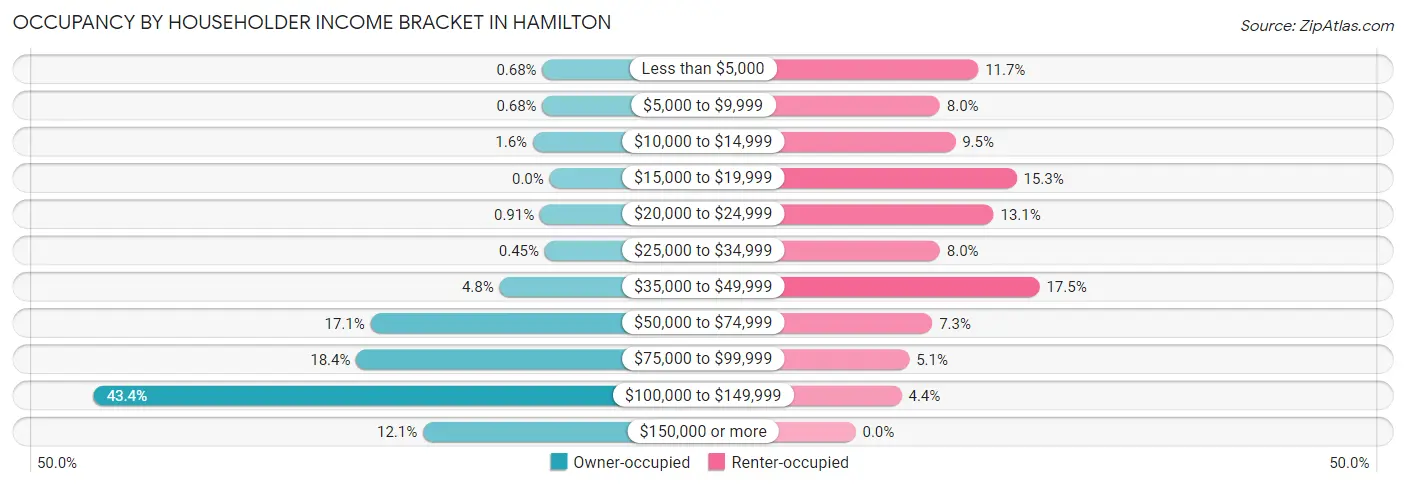
| Income Bracket | Owner-occupied | Renter-occupied |
| Less than $5,000 | 3 (0.7%) | 16 (11.7%) |
| $5,000 to $9,999 | 3 (0.7%) | 11 (8.0%) |
| $10,000 to $14,999 | 7 (1.6%) | 13 (9.5%) |
| $15,000 to $19,999 | 0 (0.0%) | 21 (15.3%) |
| $20,000 to $24,999 | 4 (0.9%) | 18 (13.1%) |
| $25,000 to $34,999 | 2 (0.4%) | 11 (8.0%) |
| $35,000 to $49,999 | 21 (4.8%) | 24 (17.5%) |
| $50,000 to $74,999 | 75 (17.1%) | 10 (7.3%) |
| $75,000 to $99,999 | 81 (18.4%) | 7 (5.1%) |
| $100,000 to $149,999 | 191 (43.4%) | 6 (4.4%) |
| $150,000 or more | 53 (12.0%) | 0 (0.0%) |
| Total | 440 (100.0%) | 137 (100.0%) |
Monthly Housing Cost Tiers in Hamilton
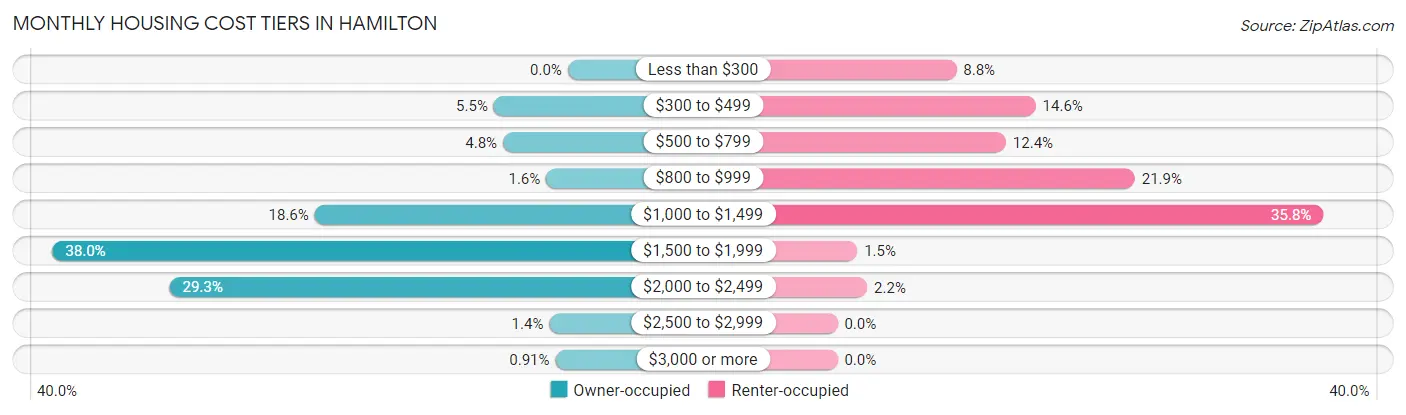
| Monthly Cost | Owner-occupied | Renter-occupied |
| Less than $300 | 0 (0.0%) | 12 (8.8%) |
| $300 to $499 | 24 (5.4%) | 20 (14.6%) |
| $500 to $799 | 21 (4.8%) | 17 (12.4%) |
| $800 to $999 | 7 (1.6%) | 30 (21.9%) |
| $1,000 to $1,499 | 82 (18.6%) | 49 (35.8%) |
| $1,500 to $1,999 | 167 (38.0%) | 2 (1.5%) |
| $2,000 to $2,499 | 129 (29.3%) | 3 (2.2%) |
| $2,500 to $2,999 | 6 (1.4%) | 0 (0.0%) |
| $3,000 or more | 4 (0.9%) | 0 (0.0%) |
| Total | 440 (100.0%) | 137 (100.0%) |
Physical Housing Characteristics in Hamilton
Housing Structures in Hamilton
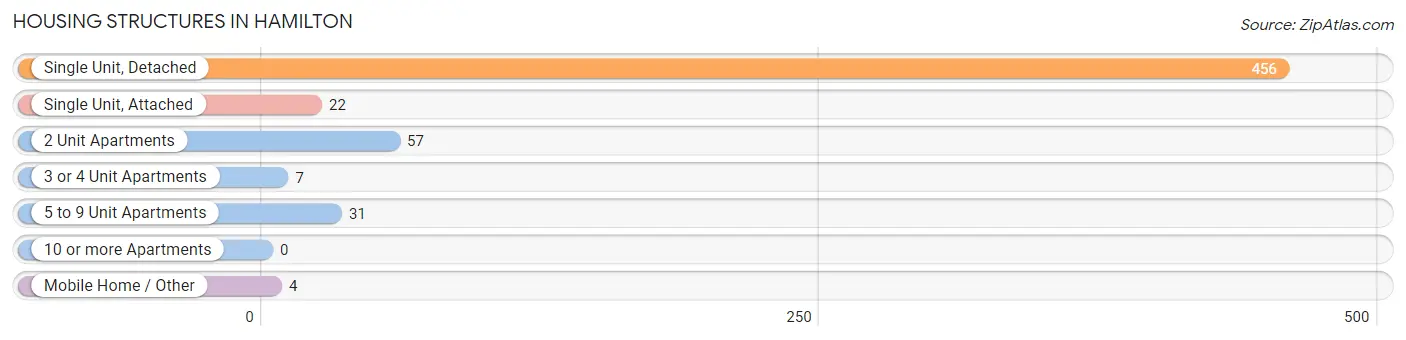
| Structure Type | # Housing Units | % Housing Units |
| Single Unit, Detached | 456 | 79.0% |
| Single Unit, Attached | 22 | 3.8% |
| 2 Unit Apartments | 57 | 9.9% |
| 3 or 4 Unit Apartments | 7 | 1.2% |
| 5 to 9 Unit Apartments | 31 | 5.4% |
| 10 or more Apartments | 0 | 0.0% |
| Mobile Home / Other | 4 | 0.7% |
| Total | 577 | 100.0% |
Housing Structures by Occupancy in Hamilton
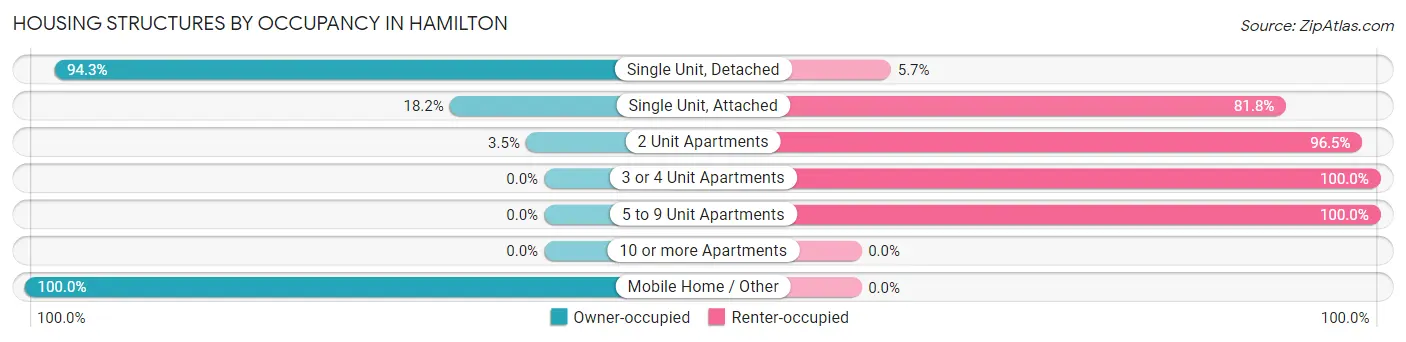
| Structure Type | Owner-occupied | Renter-occupied |
| Single Unit, Detached | 430 (94.3%) | 26 (5.7%) |
| Single Unit, Attached | 4 (18.2%) | 18 (81.8%) |
| 2 Unit Apartments | 2 (3.5%) | 55 (96.5%) |
| 3 or 4 Unit Apartments | 0 (0.0%) | 7 (100.0%) |
| 5 to 9 Unit Apartments | 0 (0.0%) | 31 (100.0%) |
| 10 or more Apartments | 0 (0.0%) | 0 (0.0%) |
| Mobile Home / Other | 4 (100.0%) | 0 (0.0%) |
| Total | 440 (76.3%) | 137 (23.7%) |
Housing Structures by Number of Rooms in Hamilton
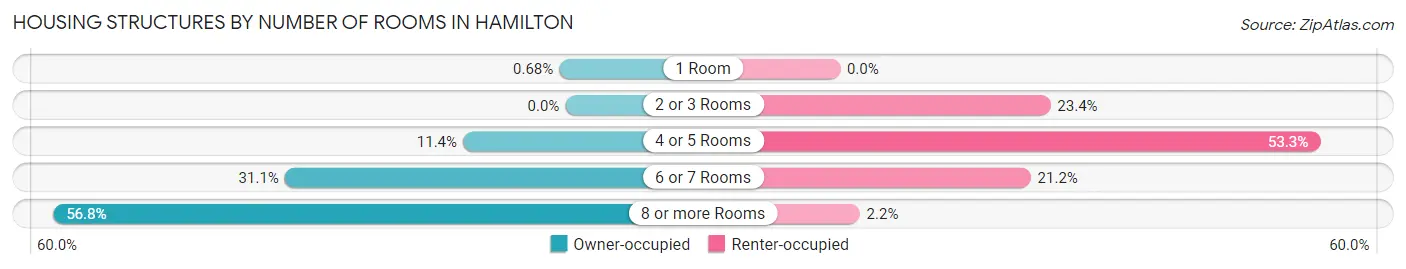
| Number of Rooms | Owner-occupied | Renter-occupied |
| 1 Room | 3 (0.7%) | 0 (0.0%) |
| 2 or 3 Rooms | 0 (0.0%) | 32 (23.4%) |
| 4 or 5 Rooms | 50 (11.4%) | 73 (53.3%) |
| 6 or 7 Rooms | 137 (31.1%) | 29 (21.2%) |
| 8 or more Rooms | 250 (56.8%) | 3 (2.2%) |
| Total | 440 (100.0%) | 137 (100.0%) |
Housing Structure by Heating Type in Hamilton
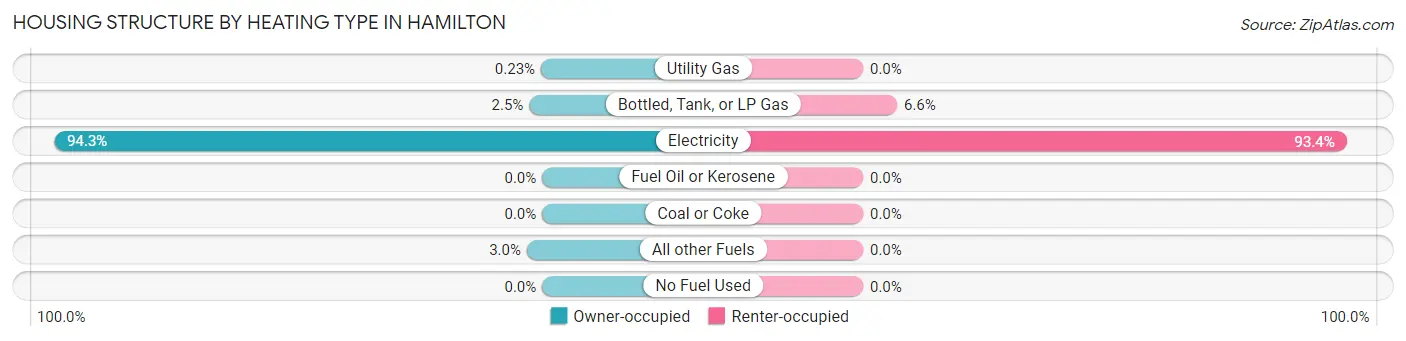
| Heating Type | Owner-occupied | Renter-occupied |
| Utility Gas | 1 (0.2%) | 0 (0.0%) |
| Bottled, Tank, or LP Gas | 11 (2.5%) | 9 (6.6%) |
| Electricity | 415 (94.3%) | 128 (93.4%) |
| Fuel Oil or Kerosene | 0 (0.0%) | 0 (0.0%) |
| Coal or Coke | 0 (0.0%) | 0 (0.0%) |
| All other Fuels | 13 (2.9%) | 0 (0.0%) |
| No Fuel Used | 0 (0.0%) | 0 (0.0%) |
| Total | 440 (100.0%) | 137 (100.0%) |
Household Vehicle Usage in Hamilton
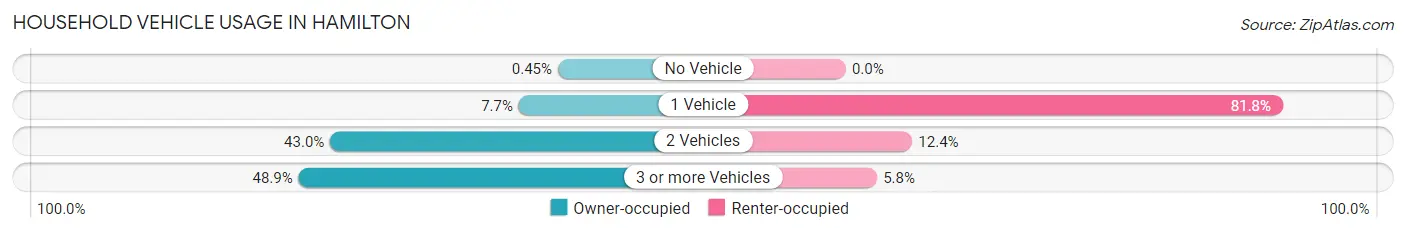
| Vehicles per Household | Owner-occupied | Renter-occupied |
| No Vehicle | 2 (0.4%) | 0 (0.0%) |
| 1 Vehicle | 34 (7.7%) | 112 (81.8%) |
| 2 Vehicles | 189 (42.9%) | 17 (12.4%) |
| 3 or more Vehicles | 215 (48.9%) | 8 (5.8%) |
| Total | 440 (100.0%) | 137 (100.0%) |
Real Estate & Mortgages in Hamilton
Real Estate and Mortgage Overview in Hamilton
| Characteristic | Without Mortgage | With Mortgage |
| Housing Units | 49 | 391 |
| Median Property Value | $181,900 | $263,200 |
| Median Household Income | $60,938 | $51 |
| Monthly Housing Costs | $507 | $4 |
| Real Estate Taxes | $2,271 | $7 |
Property Value by Mortgage Status in Hamilton
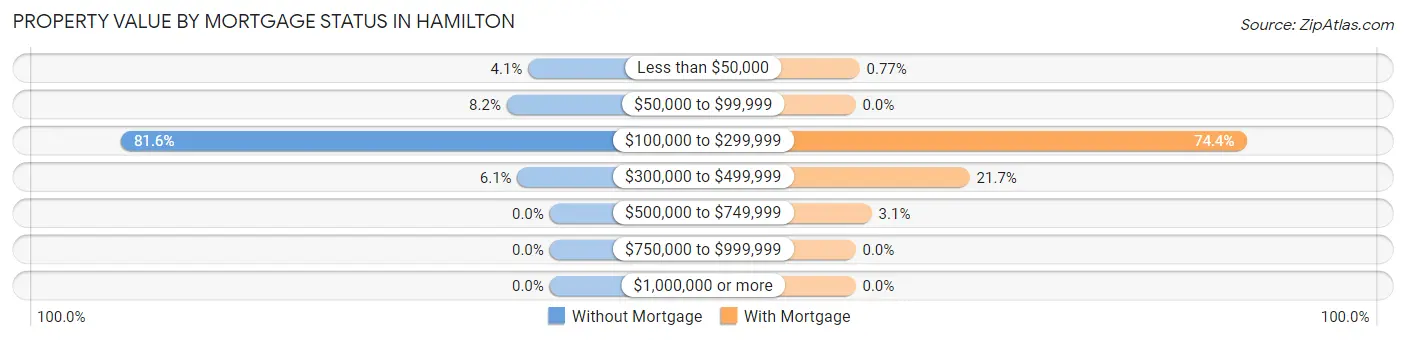
| Property Value | Without Mortgage | With Mortgage |
| Less than $50,000 | 2 (4.1%) | 3 (0.8%) |
| $50,000 to $99,999 | 4 (8.2%) | 0 (0.0%) |
| $100,000 to $299,999 | 40 (81.6%) | 291 (74.4%) |
| $300,000 to $499,999 | 3 (6.1%) | 85 (21.7%) |
| $500,000 to $749,999 | 0 (0.0%) | 12 (3.1%) |
| $750,000 to $999,999 | 0 (0.0%) | 0 (0.0%) |
| $1,000,000 or more | 0 (0.0%) | 0 (0.0%) |
| Total | 49 (100.0%) | 391 (100.0%) |
Household Income by Mortgage Status in Hamilton
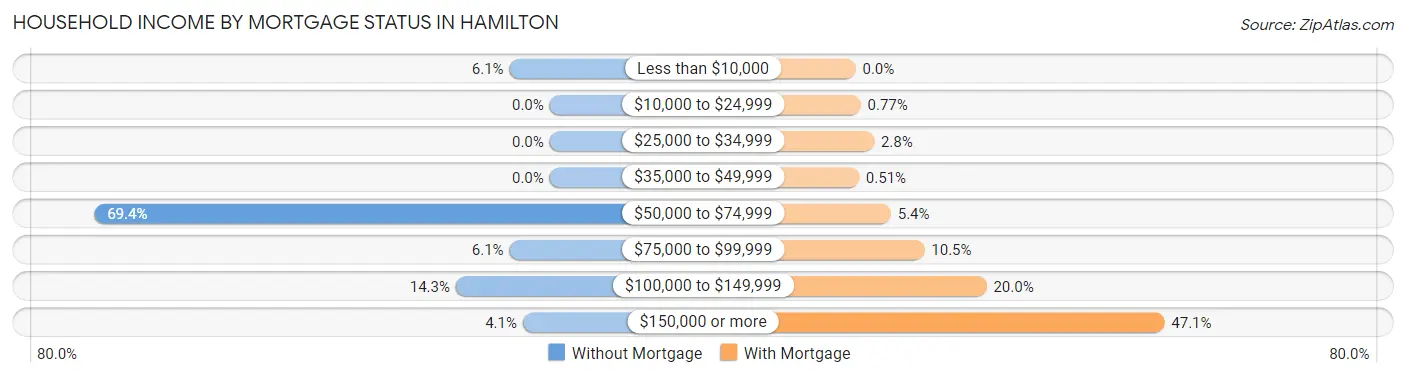
| Household Income | Without Mortgage | With Mortgage |
| Less than $10,000 | 3 (6.1%) | 0 (0.0%) |
| $10,000 to $24,999 | 0 (0.0%) | 3 (0.8%) |
| $25,000 to $34,999 | 0 (0.0%) | 11 (2.8%) |
| $35,000 to $49,999 | 0 (0.0%) | 2 (0.5%) |
| $50,000 to $74,999 | 34 (69.4%) | 21 (5.4%) |
| $75,000 to $99,999 | 3 (6.1%) | 41 (10.5%) |
| $100,000 to $149,999 | 7 (14.3%) | 78 (20.0%) |
| $150,000 or more | 2 (4.1%) | 184 (47.1%) |
| Total | 49 (100.0%) | 391 (100.0%) |
Property Value to Household Income Ratio in Hamilton
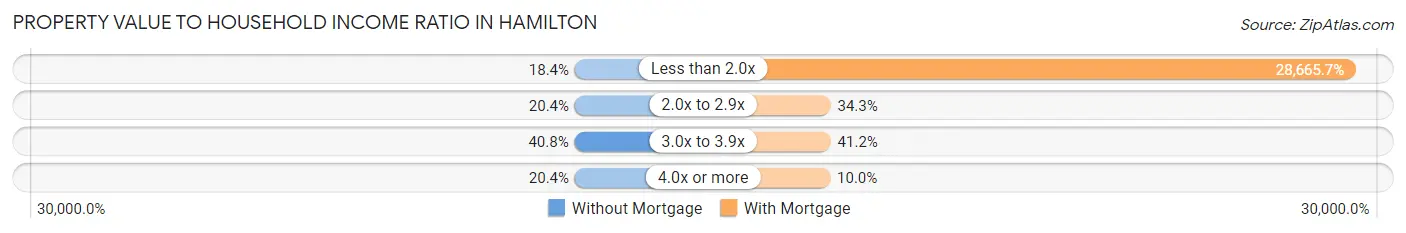
| Value-to-Income Ratio | Without Mortgage | With Mortgage |
| Less than 2.0x | 9 (18.4%) | 112,083 (28,665.7%) |
| 2.0x to 2.9x | 10 (20.4%) | 134 (34.3%) |
| 3.0x to 3.9x | 20 (40.8%) | 161 (41.2%) |
| 4.0x or more | 10 (20.4%) | 39 (10.0%) |
| Total | 49 (100.0%) | 391 (100.0%) |
Real Estate Taxes by Mortgage Status in Hamilton
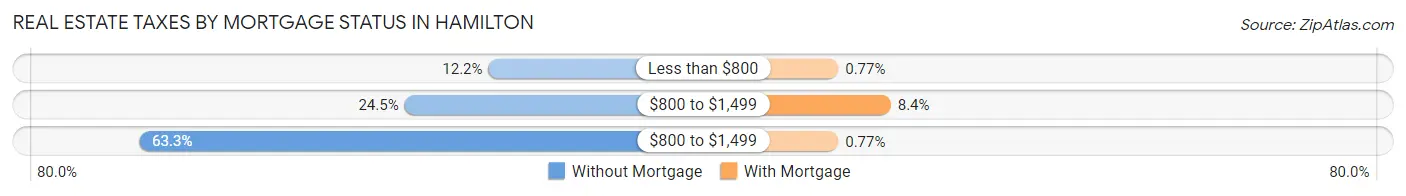
| Property Taxes | Without Mortgage | With Mortgage |
| Less than $800 | 6 (12.2%) | 3 (0.8%) |
| $800 to $1,499 | 12 (24.5%) | 33 (8.4%) |
| $800 to $1,499 | 31 (63.3%) | 3 (0.8%) |
| Total | 49 (100.0%) | 391 (100.0%) |
Health & Disability in Hamilton
Health Insurance Coverage by Age in Hamilton
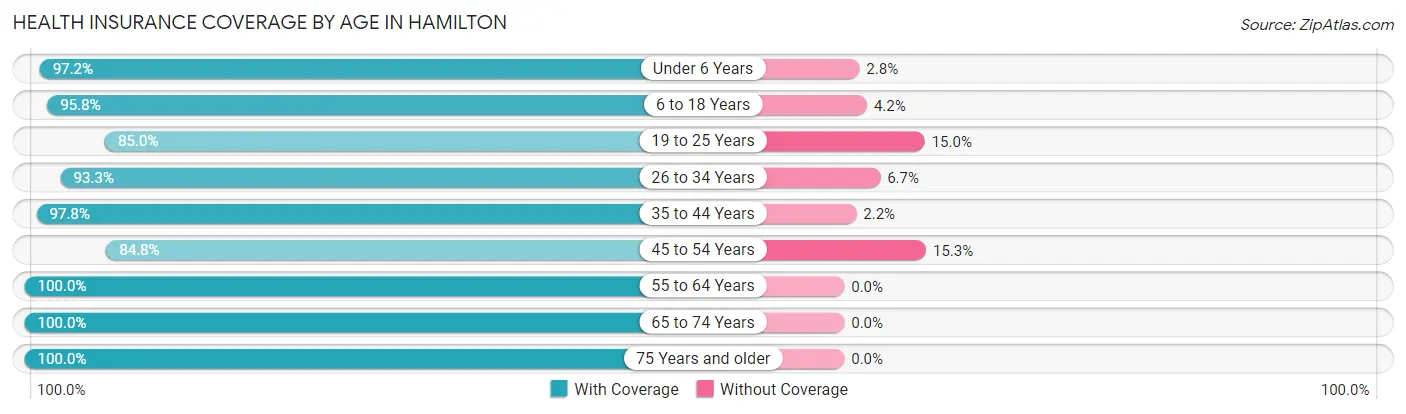
| Age Bracket | With Coverage | Without Coverage |
| Under 6 Years | 172 (97.2%) | 5 (2.8%) |
| 6 to 18 Years | 453 (95.8%) | 20 (4.2%) |
| 19 to 25 Years | 102 (85.0%) | 18 (15.0%) |
| 26 to 34 Years | 181 (93.3%) | 13 (6.7%) |
| 35 to 44 Years | 305 (97.8%) | 7 (2.2%) |
| 45 to 54 Years | 150 (84.8%) | 27 (15.2%) |
| 55 to 64 Years | 89 (100.0%) | 0 (0.0%) |
| 65 to 74 Years | 108 (100.0%) | 0 (0.0%) |
| 75 Years and older | 69 (100.0%) | 0 (0.0%) |
| Total | 1,629 (94.8%) | 90 (5.2%) |
Health Insurance Coverage by Citizenship Status in Hamilton
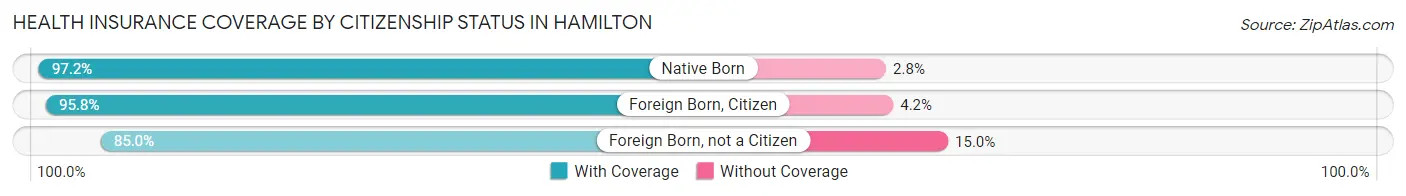
| Citizenship Status | With Coverage | Without Coverage |
| Native Born | 172 (97.2%) | 5 (2.8%) |
| Foreign Born, Citizen | 453 (95.8%) | 20 (4.2%) |
| Foreign Born, not a Citizen | 102 (85.0%) | 18 (15.0%) |
Health Insurance Coverage by Household Income in Hamilton
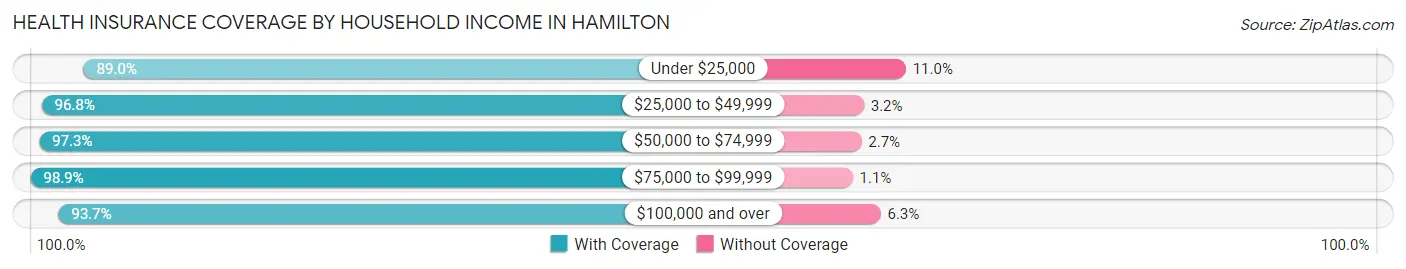
| Household Income | With Coverage | Without Coverage |
| Under $25,000 | 137 (89.0%) | 17 (11.0%) |
| $25,000 to $49,999 | 152 (96.8%) | 5 (3.2%) |
| $50,000 to $74,999 | 179 (97.3%) | 5 (2.7%) |
| $75,000 to $99,999 | 271 (98.9%) | 3 (1.1%) |
| $100,000 and over | 890 (93.7%) | 60 (6.3%) |
Public vs Private Health Insurance Coverage by Age in Hamilton
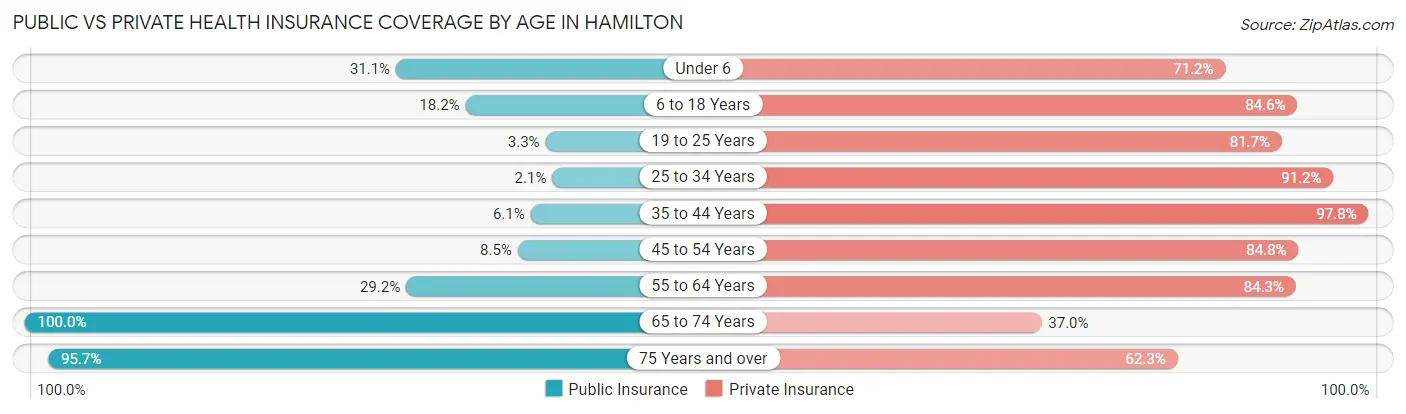
| Age Bracket | Public Insurance | Private Insurance |
| Under 6 | 55 (31.1%) | 126 (71.2%) |
| 6 to 18 Years | 86 (18.2%) | 400 (84.6%) |
| 19 to 25 Years | 4 (3.3%) | 98 (81.7%) |
| 25 to 34 Years | 4 (2.1%) | 177 (91.2%) |
| 35 to 44 Years | 19 (6.1%) | 305 (97.8%) |
| 45 to 54 Years | 15 (8.5%) | 150 (84.8%) |
| 55 to 64 Years | 26 (29.2%) | 75 (84.3%) |
| 65 to 74 Years | 108 (100.0%) | 40 (37.0%) |
| 75 Years and over | 66 (95.7%) | 43 (62.3%) |
| Total | 383 (22.3%) | 1,414 (82.3%) |
Disability Status by Sex by Age in Hamilton
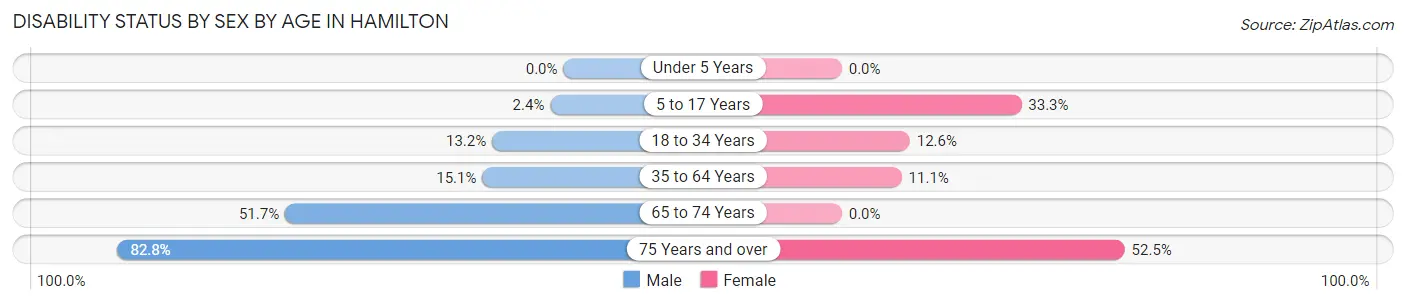
| Age Bracket | Male | Female |
| Under 5 Years | 0 (0.0%) | 0 (0.0%) |
| 5 to 17 Years | 5 (2.4%) | 80 (33.3%) |
| 18 to 34 Years | 18 (13.2%) | 27 (12.6%) |
| 35 to 64 Years | 45 (15.0%) | 31 (11.1%) |
| 65 to 74 Years | 31 (51.7%) | 0 (0.0%) |
| 75 Years and over | 24 (82.8%) | 21 (52.5%) |
Disability Class by Sex by Age in Hamilton
Disability Class: Hearing Difficulty
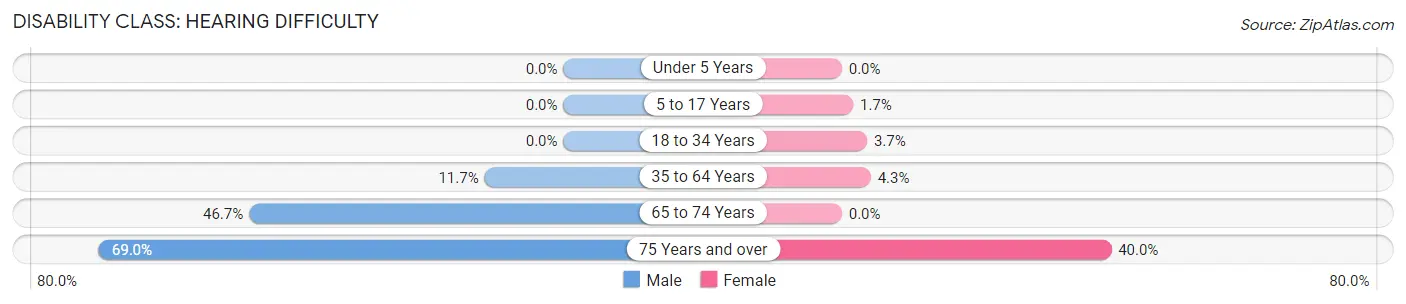
| Age Bracket | Male | Female |
| Under 5 Years | 0 (0.0%) | 0 (0.0%) |
| 5 to 17 Years | 0 (0.0%) | 4 (1.7%) |
| 18 to 34 Years | 0 (0.0%) | 8 (3.7%) |
| 35 to 64 Years | 35 (11.7%) | 12 (4.3%) |
| 65 to 74 Years | 28 (46.7%) | 0 (0.0%) |
| 75 Years and over | 20 (69.0%) | 16 (40.0%) |
Disability Class: Vision Difficulty
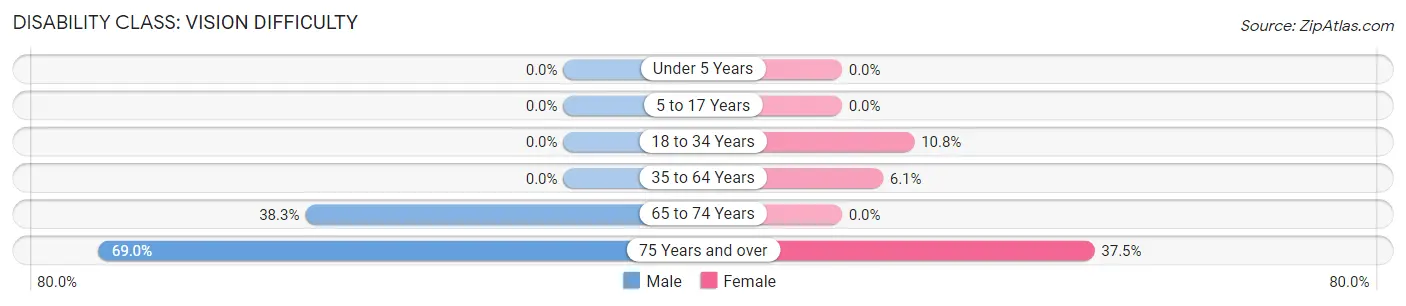
| Age Bracket | Male | Female |
| Under 5 Years | 0 (0.0%) | 0 (0.0%) |
| 5 to 17 Years | 0 (0.0%) | 0 (0.0%) |
| 18 to 34 Years | 0 (0.0%) | 23 (10.7%) |
| 35 to 64 Years | 0 (0.0%) | 17 (6.1%) |
| 65 to 74 Years | 23 (38.3%) | 0 (0.0%) |
| 75 Years and over | 20 (69.0%) | 15 (37.5%) |
Disability Class: Cognitive Difficulty
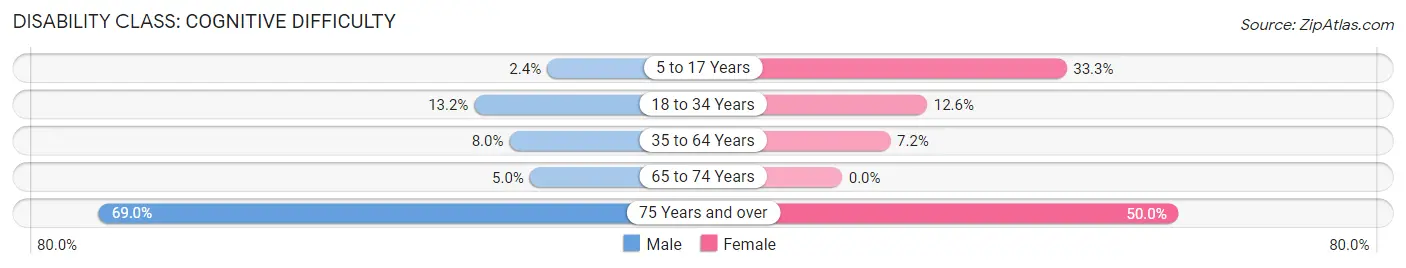
| Age Bracket | Male | Female |
| 5 to 17 Years | 5 (2.4%) | 80 (33.3%) |
| 18 to 34 Years | 18 (13.2%) | 27 (12.6%) |
| 35 to 64 Years | 24 (8.0%) | 20 (7.2%) |
| 65 to 74 Years | 3 (5.0%) | 0 (0.0%) |
| 75 Years and over | 20 (69.0%) | 20 (50.0%) |
Disability Class: Ambulatory Difficulty
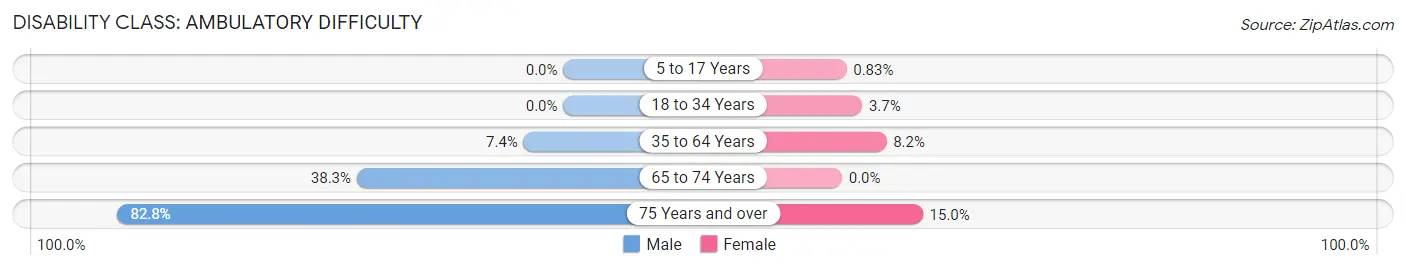
| Age Bracket | Male | Female |
| 5 to 17 Years | 0 (0.0%) | 2 (0.8%) |
| 18 to 34 Years | 0 (0.0%) | 8 (3.7%) |
| 35 to 64 Years | 22 (7.4%) | 23 (8.2%) |
| 65 to 74 Years | 23 (38.3%) | 0 (0.0%) |
| 75 Years and over | 24 (82.8%) | 6 (15.0%) |
Disability Class: Self-Care Difficulty
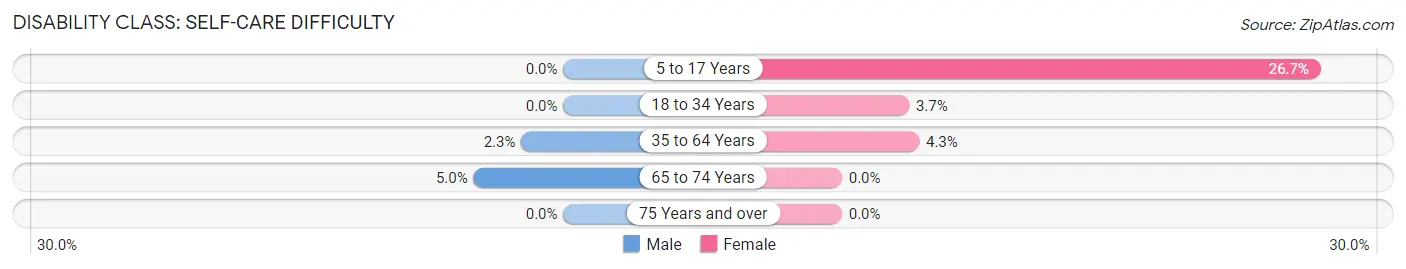
| Age Bracket | Male | Female |
| 5 to 17 Years | 0 (0.0%) | 64 (26.7%) |
| 18 to 34 Years | 0 (0.0%) | 8 (3.7%) |
| 35 to 64 Years | 7 (2.3%) | 12 (4.3%) |
| 65 to 74 Years | 3 (5.0%) | 0 (0.0%) |
| 75 Years and over | 0 (0.0%) | 0 (0.0%) |
Technology Access in Hamilton
Computing Device Access in Hamilton
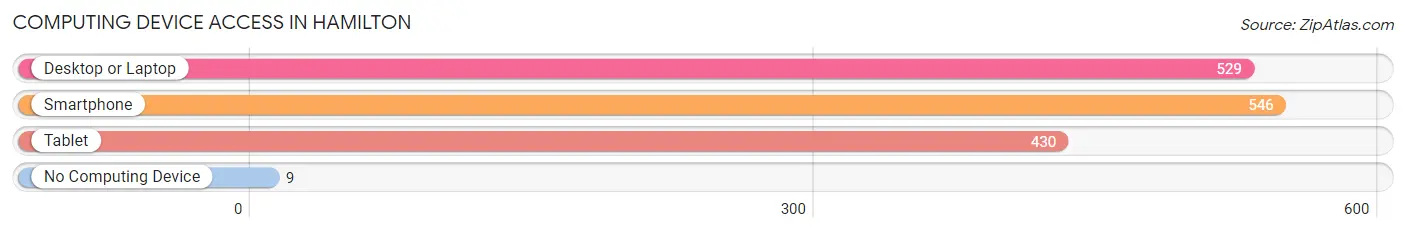
| Device Type | # Households | % Households |
| Desktop or Laptop | 529 | 91.7% |
| Smartphone | 546 | 94.6% |
| Tablet | 430 | 74.5% |
| No Computing Device | 9 | 1.6% |
| Total | 577 | 100.0% |
Internet Access in Hamilton
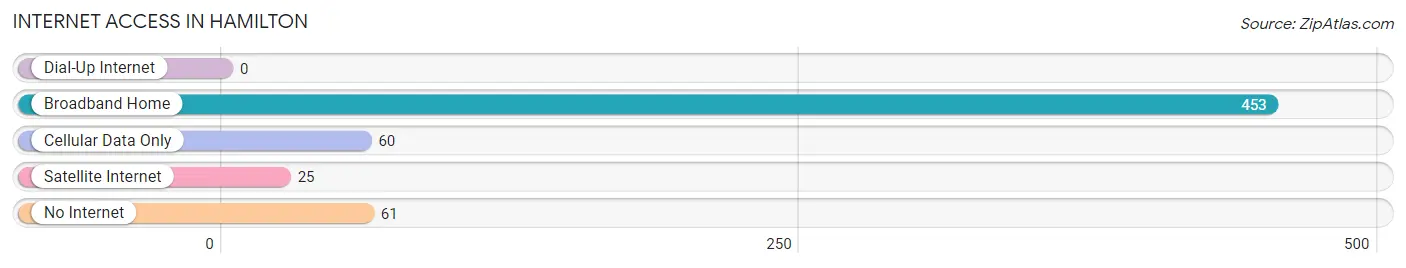
| Internet Type | # Households | % Households |
| Dial-Up Internet | 0 | 0.0% |
| Broadband Home | 453 | 78.5% |
| Cellular Data Only | 60 | 10.4% |
| Satellite Internet | 25 | 4.3% |
| No Internet | 61 | 10.6% |
| Total | 577 | 100.0% |
Hamilton Summary
Hamilton, Georgia is a small city located in the northwest corner of the state, in Harris County. It is situated on the banks of the Chattahoochee River, and is part of the Columbus, Georgia metropolitan area. The city has a population of approximately 2,000 people, and is known for its historic downtown area, which is listed on the National Register of Historic Places.
Geography
Hamilton is located in the northwest corner of Georgia, in Harris County. It is situated on the banks of the Chattahoochee River, and is part of the Columbus, Georgia metropolitan area. The city has a total area of 2.2 square miles, all of which is land. The terrain is mostly flat, with some rolling hills in the surrounding area. The climate is humid subtropical, with hot, humid summers and mild winters.
History
The area that is now Hamilton was first settled in the early 1800s by settlers from North Carolina. The town was originally known as Harrisburg, and was later renamed Hamilton in 1832. The city was incorporated in 1837, and was named after Alexander Hamilton, the first Secretary of the Treasury.
In the late 1800s, Hamilton was a thriving agricultural center, with cotton, corn, and tobacco being the main crops. The city also had a thriving lumber industry, and was home to several sawmills. In the early 1900s, the city began to experience a decline in population, as many of the residents moved away to larger cities in search of better job opportunities.
Economy
The economy of Hamilton is largely based on agriculture and manufacturing. The city is home to several large farms, which produce cotton, corn, and tobacco. The city also has several manufacturing plants, which produce a variety of products, including furniture, textiles, and automotive parts.
The city also has a thriving tourism industry, with many visitors coming to the area to enjoy the city’s historic downtown area, as well as the nearby Chattahoochee River.
Demographics
As of the 2010 census, the population of Hamilton was 2,000 people. The racial makeup of the city was 79.2% White, 17.2% African American, 0.7% Native American, 0.3% Asian, 0.1% Pacific Islander, and 2.5% from other races. The median household income was $30,000, and the median family income was $35,000.
Conclusion
Hamilton, Georgia is a small city located in the northwest corner of the state, in Harris County. It is situated on the banks of the Chattahoochee River, and is part of the Columbus, Georgia metropolitan area. The city has a population of approximately 2,000 people, and is known for its historic downtown area, which is listed on the National Register of Historic Places. The economy of Hamilton is largely based on agriculture and manufacturing, and the city also has a thriving tourism industry. The population of the city is mostly White, with a small percentage of African Americans, Native Americans, Asians, and Pacific Islanders.
Common Questions
What is Per Capita Income in Hamilton?
Per Capita income in Hamilton is $27,301.
What is the Median Family Income in Hamilton?
Median Family Income in Hamilton is $98,750.
What is the Median Household income in Hamilton?
Median Household Income in Hamilton is $86,607.
What is Income or Wage Gap in Hamilton?
Income or Wage Gap in Hamilton is 19.8%.
Women in Hamilton earn 80.2 cents for every dollar earned by a man.
What is Inequality or Gini Index in Hamilton?
Inequality or Gini Index in Hamilton is 0.35.
What is the Total Population of Hamilton?
Total Population of Hamilton is 1,946.
What is the Total Male Population of Hamilton?
Total Male Population of Hamilton is 1,077.
What is the Total Female Population of Hamilton?
Total Female Population of Hamilton is 869.
What is the Ratio of Males per 100 Females in Hamilton?
There are 123.94 Males per 100 Females in Hamilton.
What is the Ratio of Females per 100 Males in Hamilton?
There are 80.69 Females per 100 Males in Hamilton.
What is the Median Population Age in Hamilton?
Median Population Age in Hamilton is 32.7 Years.
What is the Average Family Size in Hamilton
Average Family Size in Hamilton is 3.3 People.
What is the Average Household Size in Hamilton
Average Household Size in Hamilton is 3.0 People.
How Large is the Labor Force in Hamilton?
There are 787 People in the Labor Forcein in Hamilton.
What is the Percentage of People in the Labor Force in Hamilton?
57.7% of People are in the Labor Force in Hamilton.
What is the Unemployment Rate in Hamilton?
Unemployment Rate in Hamilton is 7.7%.