College Park, GA Map & Demographics
College Park Map
College Park Overview
$32,004
PER CAPITA INCOME
$59,292
AVG FAMILY INCOME
$47,706
AVG HOUSEHOLD INCOME
13.6%
WAGE / INCOME GAP [ % ]
86.4¢/ $1
WAGE / INCOME GAP [ $ ]
0.51
INEQUALITY / GINI INDEX
14,113
TOTAL POPULATION
6,616
MALE POPULATION
7,497
FEMALE POPULATION
88.25
MALES / 100 FEMALES
113.32
FEMALES / 100 MALES
32.2
MEDIAN AGE
3.3
AVG FAMILY SIZE
2.3
AVG HOUSEHOLD SIZE
7,838
LABOR FORCE [ PEOPLE ]
72.6%
PERCENT IN LABOR FORCE
13.0%
UNEMPLOYMENT RATE
Income in College Park
Income Overview in College Park
Per Capita Income in College Park is $32,004, while median incomes of families and households are $59,292 and $47,706 respectively.
| Characteristic | Number | Measure |
| Per Capita Income | 14,113 | $32,004 |
| Median Family Income | 3,174 | $59,292 |
| Mean Family Income | 3,174 | $90,154 |
| Median Household Income | 6,016 | $47,706 |
| Mean Household Income | 6,016 | $73,528 |
| Income Deficit | 3,174 | $0 |
| Wage / Income Gap (%) | 14,113 | 13.56% |
| Wage / Income Gap ($) | 14,113 | 86.44¢ per $1 |
| Gini / Inequality Index | 14,113 | 0.51 |
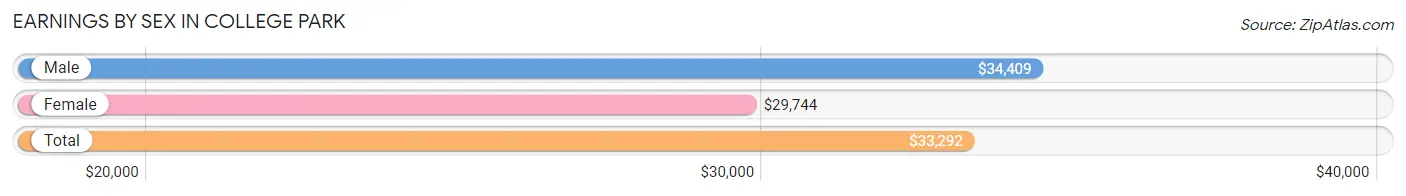
Earnings by Sex in College Park
Average Earnings in College Park are $33,292, $34,409 for men and $29,744 for women, a difference of 13.6%.
| Sex | Number | Average Earnings |
| Male | 3,611 (47.4%) | $34,409 |
| Female | 4,003 (52.6%) | $29,744 |
| Total | 7,614 (100.0%) | $33,292 |
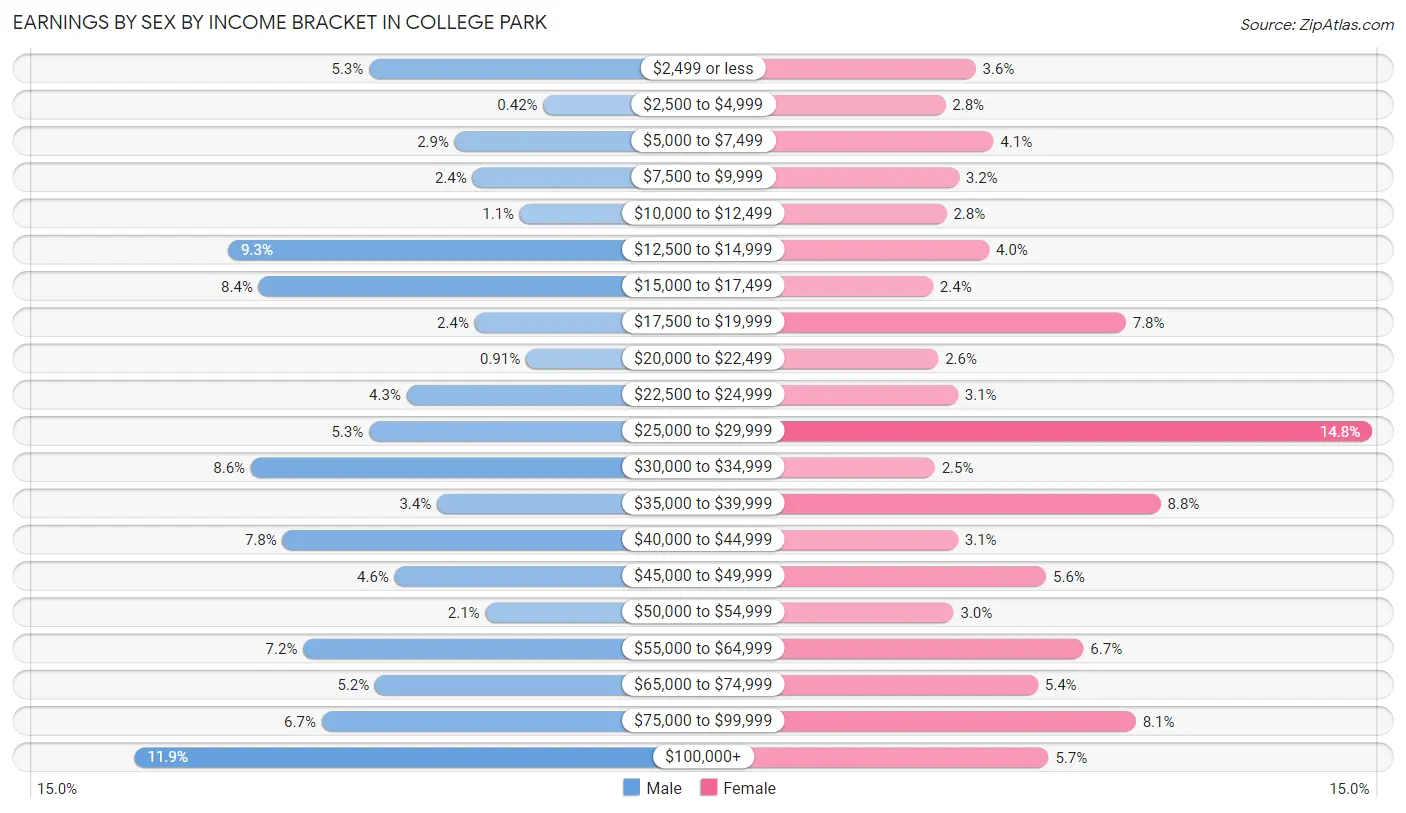
Earnings by Sex by Income Bracket in College Park
The most common earnings brackets in College Park are $100,000+ for men (430 | 11.9%) and $25,000 to $29,999 for women (591 | 14.8%).
| Income | Male | Female |
| $2,499 or less | 192 (5.3%) | 145 (3.6%) |
| $2,500 to $4,999 | 15 (0.4%) | 111 (2.8%) |
| $5,000 to $7,499 | 105 (2.9%) | 165 (4.1%) |
| $7,500 to $9,999 | 87 (2.4%) | 126 (3.2%) |
| $10,000 to $12,499 | 39 (1.1%) | 112 (2.8%) |
| $12,500 to $14,999 | 335 (9.3%) | 160 (4.0%) |
| $15,000 to $17,499 | 304 (8.4%) | 97 (2.4%) |
| $17,500 to $19,999 | 85 (2.4%) | 314 (7.8%) |
| $20,000 to $22,499 | 33 (0.9%) | 103 (2.6%) |
| $22,500 to $24,999 | 154 (4.3%) | 125 (3.1%) |
| $25,000 to $29,999 | 192 (5.3%) | 591 (14.8%) |
| $30,000 to $34,999 | 312 (8.6%) | 99 (2.5%) |
| $35,000 to $39,999 | 123 (3.4%) | 353 (8.8%) |
| $40,000 to $44,999 | 280 (7.7%) | 125 (3.1%) |
| $45,000 to $49,999 | 166 (4.6%) | 224 (5.6%) |
| $50,000 to $54,999 | 74 (2.1%) | 120 (3.0%) |
| $55,000 to $64,999 | 259 (7.2%) | 266 (6.7%) |
| $65,000 to $74,999 | 186 (5.1%) | 215 (5.4%) |
| $75,000 to $99,999 | 240 (6.7%) | 325 (8.1%) |
| $100,000+ | 430 (11.9%) | 227 (5.7%) |
| Total | 3,611 (100.0%) | 4,003 (100.0%) |
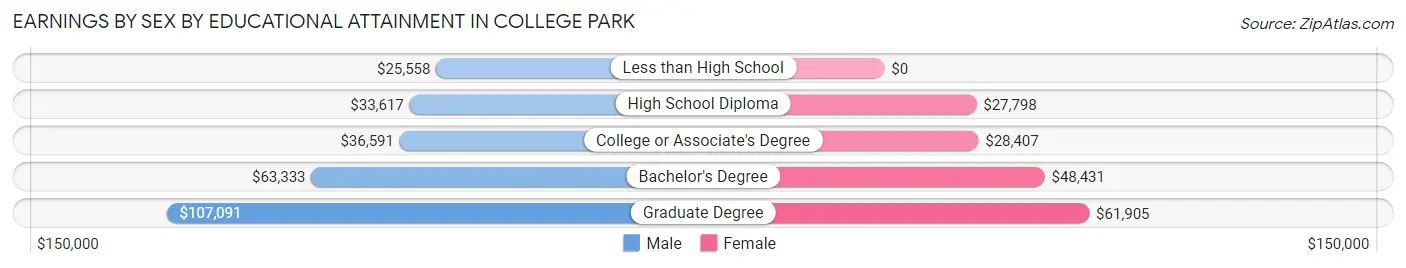
Earnings by Sex by Educational Attainment in College Park
Average earnings in College Park are $41,287 for men and $35,820 for women, a difference of 13.2%. Men with an educational attainment of graduate degree enjoy the highest average annual earnings of $107,091, while those with less than high school education earn the least with $25,558. Women with an educational attainment of graduate degree earn the most with the average annual earnings of $61,905, while those with high school diploma education have the smallest earnings of $27,798.
| Educational Attainment | Male Income | Female Income |
| Less than High School | $25,558 | $0 |
| High School Diploma | $33,617 | $27,798 |
| College or Associate's Degree | $36,591 | $28,407 |
| Bachelor's Degree | $63,333 | $48,431 |
| Graduate Degree | $107,091 | $61,905 |
| Total | $41,287 | $35,820 |
Family Income in College Park
Family Income Brackets in College Park
According to the College Park family income data, there are 511 families falling into the $75,000 to $99,999 income range, which is the most common income bracket and makes up 16.1% of all families.
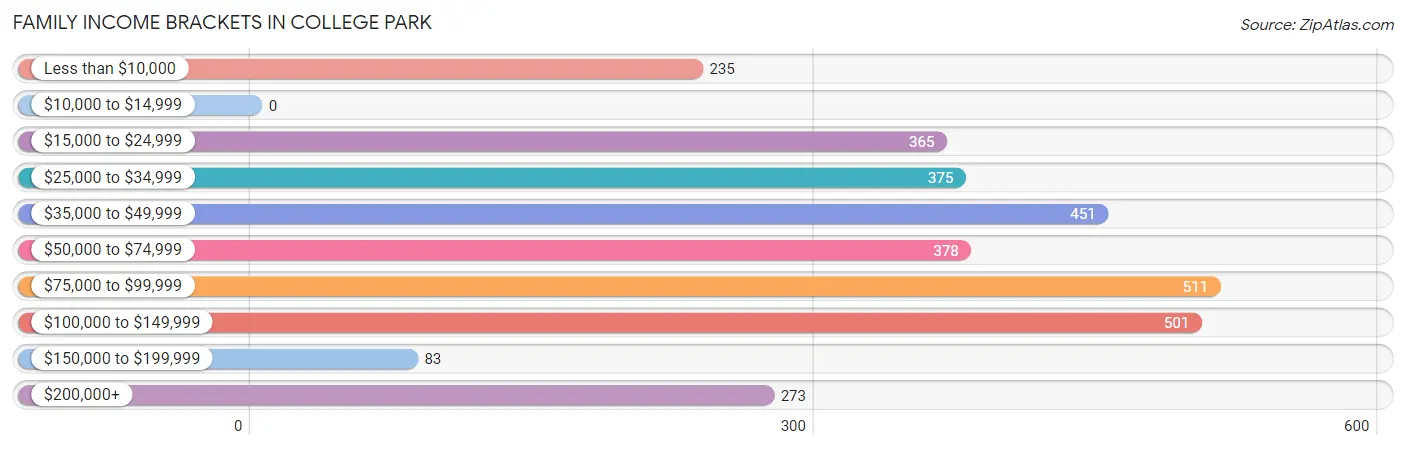
| Income Bracket | # Families | % Families |
| Less than $10,000 | 235 | 7.4% |
| $10,000 to $14,999 | 0 | 0.0% |
| $15,000 to $24,999 | 365 | 11.5% |
| $25,000 to $34,999 | 375 | 11.8% |
| $35,000 to $49,999 | 451 | 14.2% |
| $50,000 to $74,999 | 378 | 11.9% |
| $75,000 to $99,999 | 511 | 16.1% |
| $100,000 to $149,999 | 501 | 15.8% |
| $150,000 to $199,999 | 83 | 2.6% |
| $200,000+ | 273 | 8.6% |
Family Income by Famaliy Size in College Park
6-person families (36 | 1.1%) account for the highest median family income in College Park with $220,833 per family, while 6-person families (36 | 1.1%) have the highest median income of $36,806 per family member.
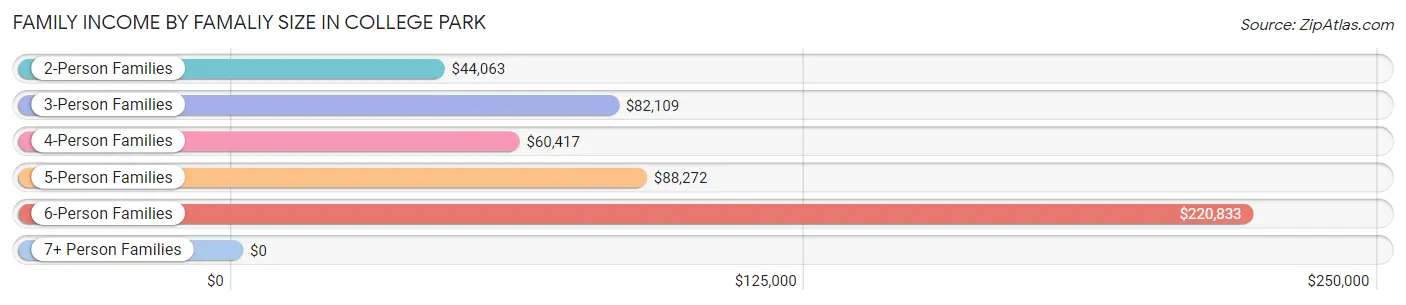
| Income Bracket | # Families | Median Income |
| 2-Person Families | 1,544 (48.6%) | $44,063 |
| 3-Person Families | 731 (23.0%) | $82,109 |
| 4-Person Families | 353 (11.1%) | $60,417 |
| 5-Person Families | 447 (14.1%) | $88,272 |
| 6-Person Families | 36 (1.1%) | $220,833 |
| 7+ Person Families | 63 (2.0%) | $0 |
| Total | 3,174 (100.0%) | $59,292 |
Family Income by Number of Earners in College Park
The median family income in College Park is $59,292, with families comprising 3+ earners (180) having the highest median family income of $130,427, while families with no earners (297) have the lowest median family income of $25,938, accounting for 5.7% and 9.4% of families, respectively.
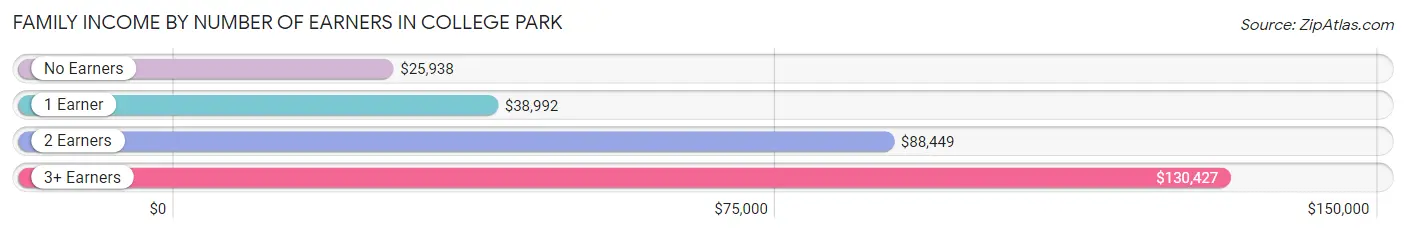
| Number of Earners | # Families | Median Income |
| No Earners | 297 (9.4%) | $25,938 |
| 1 Earner | 1,374 (43.3%) | $38,992 |
| 2 Earners | 1,323 (41.7%) | $88,449 |
| 3+ Earners | 180 (5.7%) | $130,427 |
| Total | 3,174 (100.0%) | $59,292 |
Household Income in College Park
Household Income Brackets in College Park
With 1,107 households falling in the category, the $35,000 to $49,999 income range is the most frequent in College Park, accounting for 18.4% of all households. In contrast, only 150 households (2.5%) fall into the $150,000 to $199,999 income bracket, making it the least populous group.
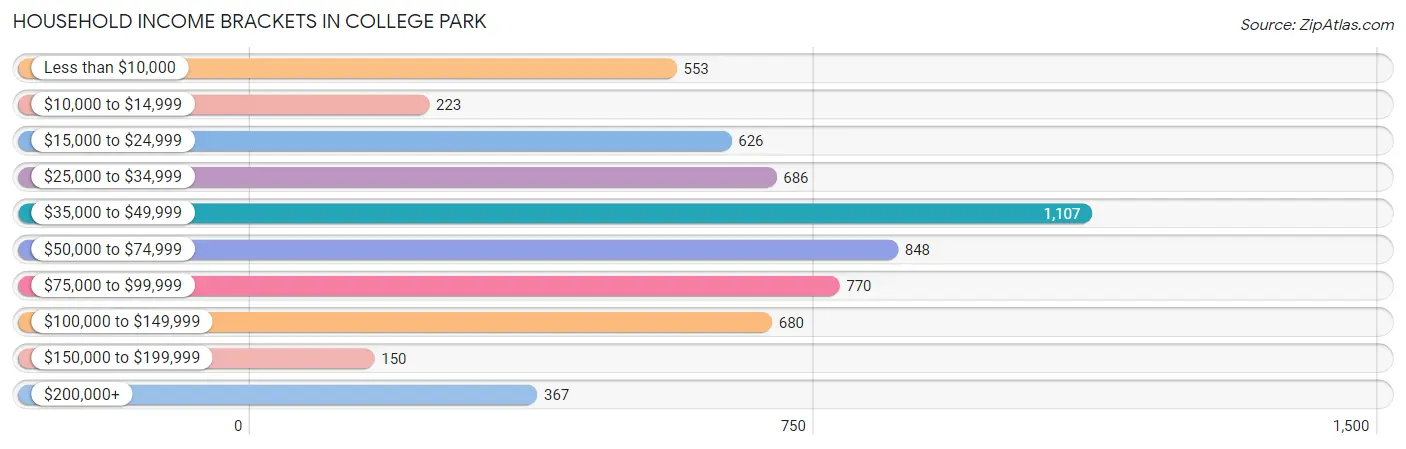
| Income Bracket | # Households | % Households |
| Less than $10,000 | 553 | 9.2% |
| $10,000 to $14,999 | 223 | 3.7% |
| $15,000 to $24,999 | 626 | 10.4% |
| $25,000 to $34,999 | 686 | 11.4% |
| $35,000 to $49,999 | 1,107 | 18.4% |
| $50,000 to $74,999 | 848 | 14.1% |
| $75,000 to $99,999 | 770 | 12.8% |
| $100,000 to $149,999 | 680 | 11.3% |
| $150,000 to $199,999 | 150 | 2.5% |
| $200,000+ | 367 | 6.1% |
Household Income by Householder Age in College Park
The median household income in College Park is $47,706, with the highest median household income of $65,054 found in the 45 to 64 years age bracket for the primary householder. A total of 2,359 households (39.2%) fall into this category. Meanwhile, the 15 to 24 years age bracket for the primary householder has the lowest median household income of $28,500, with 310 households (5.1%) in this group.
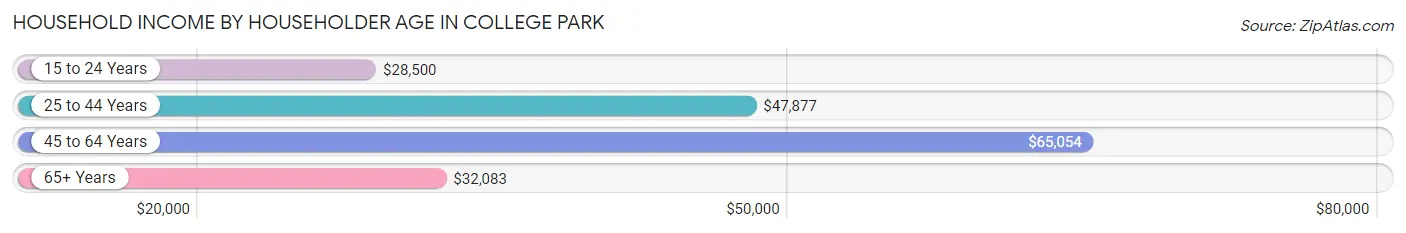
| Income Bracket | # Households | Median Income |
| 15 to 24 Years | 310 (5.1%) | $28,500 |
| 25 to 44 Years | 2,477 (41.2%) | $47,877 |
| 45 to 64 Years | 2,359 (39.2%) | $65,054 |
| 65+ Years | 870 (14.5%) | $32,083 |
| Total | 6,016 (100.0%) | $47,706 |
Poverty in College Park
Income Below Poverty by Sex and Age in College Park
With 18.1% poverty level for males and 18.1% for females among the residents of College Park, 5 year old males and 12 to 14 year old females are the most vulnerable to poverty, with 18 males (100.0%) and 112 females (31.8%) in their respective age groups living below the poverty level.
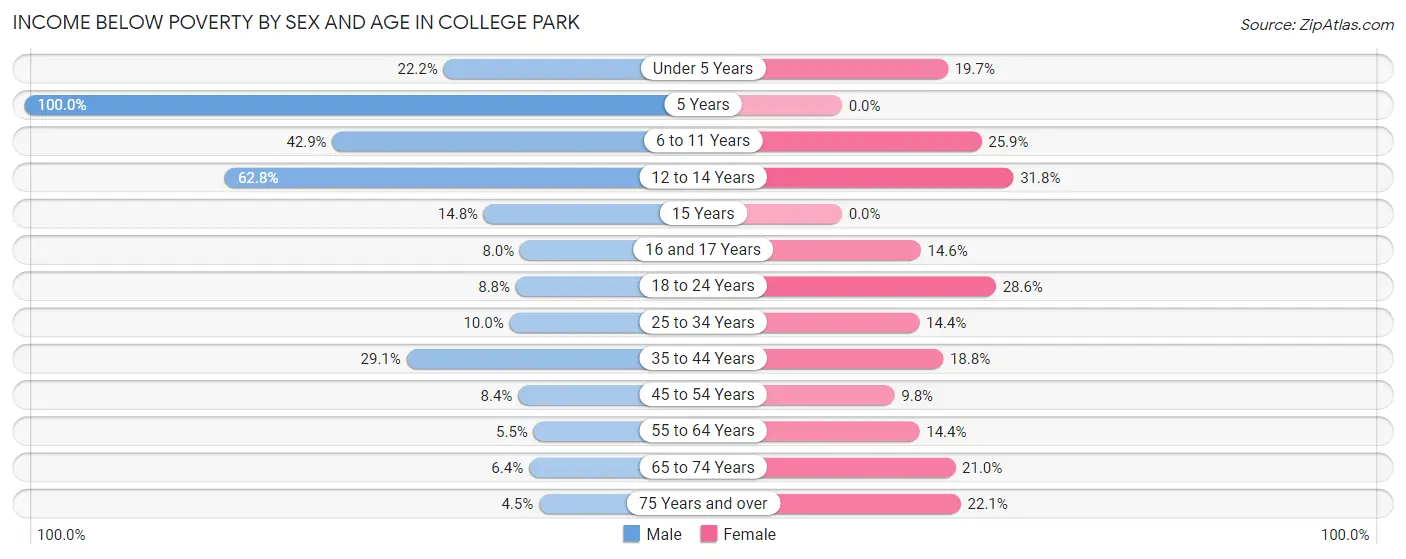
| Age Bracket | Male | Female |
| Under 5 Years | 113 (22.2%) | 93 (19.7%) |
| 5 Years | 18 (100.0%) | 0 (0.0%) |
| 6 to 11 Years | 294 (42.9%) | 204 (25.9%) |
| 12 to 14 Years | 184 (62.8%) | 112 (31.8%) |
| 15 Years | 9 (14.7%) | 0 (0.0%) |
| 16 and 17 Years | 19 (8.0%) | 26 (14.6%) |
| 18 to 24 Years | 64 (8.8%) | 190 (28.6%) |
| 25 to 34 Years | 114 (10.0%) | 209 (14.3%) |
| 35 to 44 Years | 242 (29.1%) | 154 (18.8%) |
| 45 to 54 Years | 67 (8.4%) | 124 (9.8%) |
| 55 to 64 Years | 46 (5.5%) | 100 (14.4%) |
| 65 to 74 Years | 22 (6.4%) | 94 (21.0%) |
| 75 Years and over | 6 (4.5%) | 43 (22.1%) |
| Total | 1,198 (18.1%) | 1,349 (18.1%) |
Income Above Poverty by Sex and Age in College Park
According to the poverty statistics in College Park, males aged 75 years and over and females aged 5 years are the age groups that are most secure financially, with 95.5% of males and 100.0% of females in these age groups living above the poverty line.
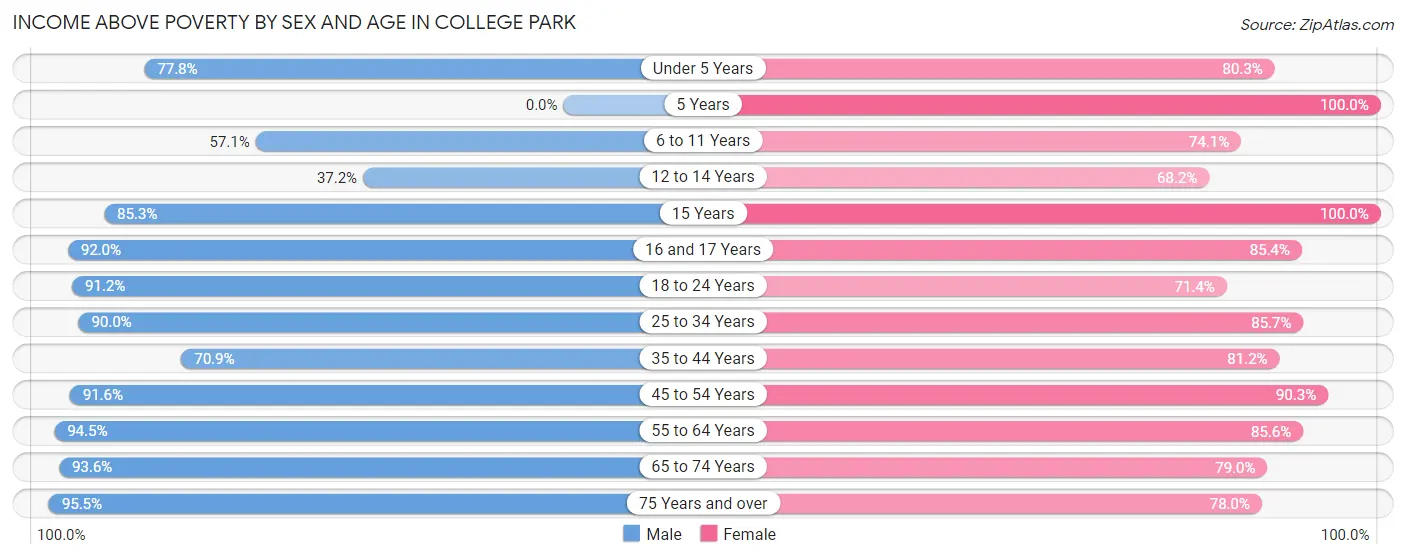
| Age Bracket | Male | Female |
| Under 5 Years | 395 (77.8%) | 380 (80.3%) |
| 5 Years | 0 (0.0%) | 76 (100.0%) |
| 6 to 11 Years | 392 (57.1%) | 584 (74.1%) |
| 12 to 14 Years | 109 (37.2%) | 240 (68.2%) |
| 15 Years | 52 (85.3%) | 47 (100.0%) |
| 16 and 17 Years | 218 (92.0%) | 152 (85.4%) |
| 18 to 24 Years | 662 (91.2%) | 475 (71.4%) |
| 25 to 34 Years | 1,026 (90.0%) | 1,247 (85.7%) |
| 35 to 44 Years | 590 (70.9%) | 666 (81.2%) |
| 45 to 54 Years | 732 (91.6%) | 1,148 (90.2%) |
| 55 to 64 Years | 789 (94.5%) | 595 (85.6%) |
| 65 to 74 Years | 323 (93.6%) | 353 (79.0%) |
| 75 Years and over | 127 (95.5%) | 152 (77.9%) |
| Total | 5,415 (81.9%) | 6,115 (81.9%) |
Income Below Poverty Among Married-Couple Families in College Park
The poverty statistics for married-couple families in College Park show that 6.2% or 81 of the total 1,316 families live below the poverty line. Families with 1 or 2 children have the highest poverty rate of 10.4%, comprising of 53 families. On the other hand, families with 3 or 4 children have the lowest poverty rate of 0.0%, which includes 0 families.
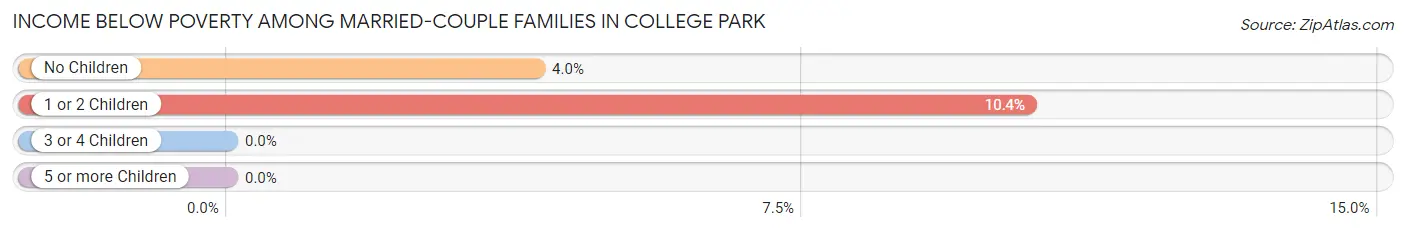
| Children | Above Poverty | Below Poverty |
| No Children | 670 (96.0%) | 28 (4.0%) |
| 1 or 2 Children | 455 (89.6%) | 53 (10.4%) |
| 3 or 4 Children | 86 (100.0%) | 0 (0.0%) |
| 5 or more Children | 24 (100.0%) | 0 (0.0%) |
| Total | 1,235 (93.8%) | 81 (6.2%) |
Income Below Poverty Among Single-Parent Households in College Park
According to the poverty data in College Park, 11.9% or 52 single-father households and 24.8% or 352 single-mother households are living below the poverty line. Among single-father households, those with 3 or 4 children have the highest poverty rate, with 19 households (52.8%) experiencing poverty. Likewise, among single-mother households, those with 5 or more children have the highest poverty rate, with 39 households (100.0%) falling below the poverty line.
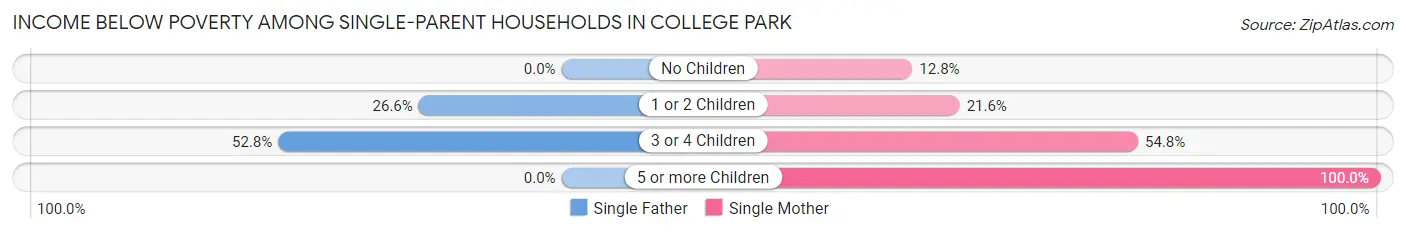
| Children | Single Father | Single Mother |
| No Children | 0 (0.0%) | 54 (12.8%) |
| 1 or 2 Children | 33 (26.6%) | 174 (21.6%) |
| 3 or 4 Children | 19 (52.8%) | 85 (54.8%) |
| 5 or more Children | 0 (0.0%) | 39 (100.0%) |
| Total | 52 (11.9%) | 352 (24.8%) |
Income Below Poverty Among Married-Couple vs Single-Parent Households in College Park
The poverty data for College Park shows that 81 of the married-couple family households (6.2%) and 404 of the single-parent households (21.7%) are living below the poverty level. Within the married-couple family households, those with 1 or 2 children have the highest poverty rate, with 53 households (10.4%) falling below the poverty line. Among the single-parent households, those with 5 or more children have the highest poverty rate, with 39 household (100.0%) living below poverty.
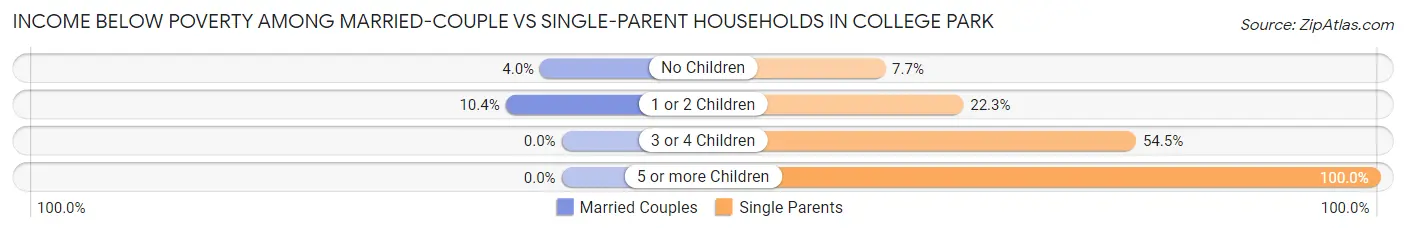
| Children | Married-Couple Families | Single-Parent Households |
| No Children | 28 (4.0%) | 54 (7.7%) |
| 1 or 2 Children | 53 (10.4%) | 207 (22.3%) |
| 3 or 4 Children | 0 (0.0%) | 104 (54.4%) |
| 5 or more Children | 0 (0.0%) | 39 (100.0%) |
| Total | 81 (6.2%) | 404 (21.7%) |
Race in College Park
The most populous races in College Park are Black / African American (11,607 | 82.2%), White / Caucasian (1,414 | 10.0%), and Hispanic or Latino (542 | 3.8%).
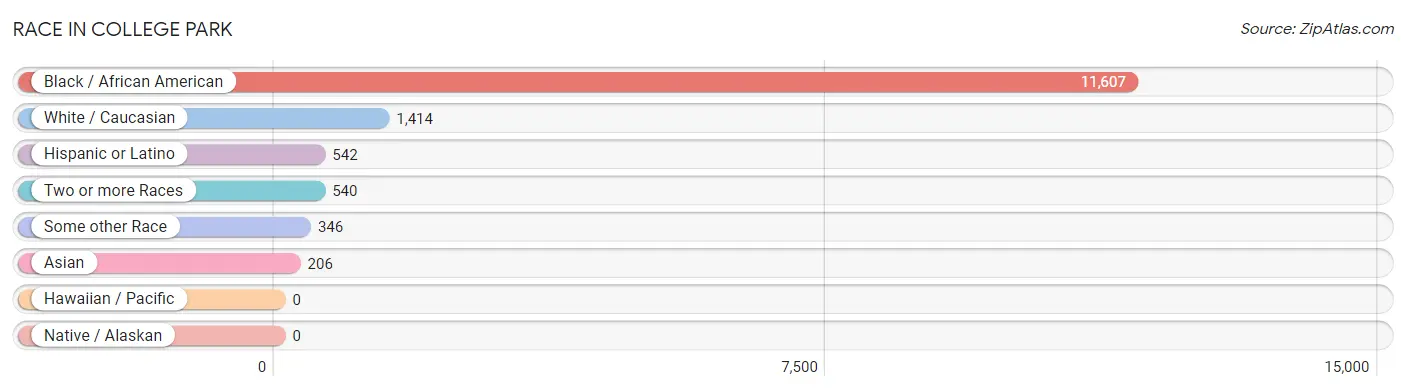
| Race | # Population | % Population |
| Asian | 206 | 1.5% |
| Black / African American | 11,607 | 82.2% |
| Hawaiian / Pacific | 0 | 0.0% |
| Hispanic or Latino | 542 | 3.8% |
| Native / Alaskan | 0 | 0.0% |
| White / Caucasian | 1,414 | 10.0% |
| Two or more Races | 540 | 3.8% |
| Some other Race | 346 | 2.5% |
| Total | 14,113 | 100.0% |
Ancestry in College Park
The most populous ancestries reported in College Park are American (746 | 5.3%), Subsaharan African (381 | 2.7%), English (272 | 1.9%), Central American (251 | 1.8%), and Honduran (242 | 1.7%), together accounting for 13.4% of all College Park residents.
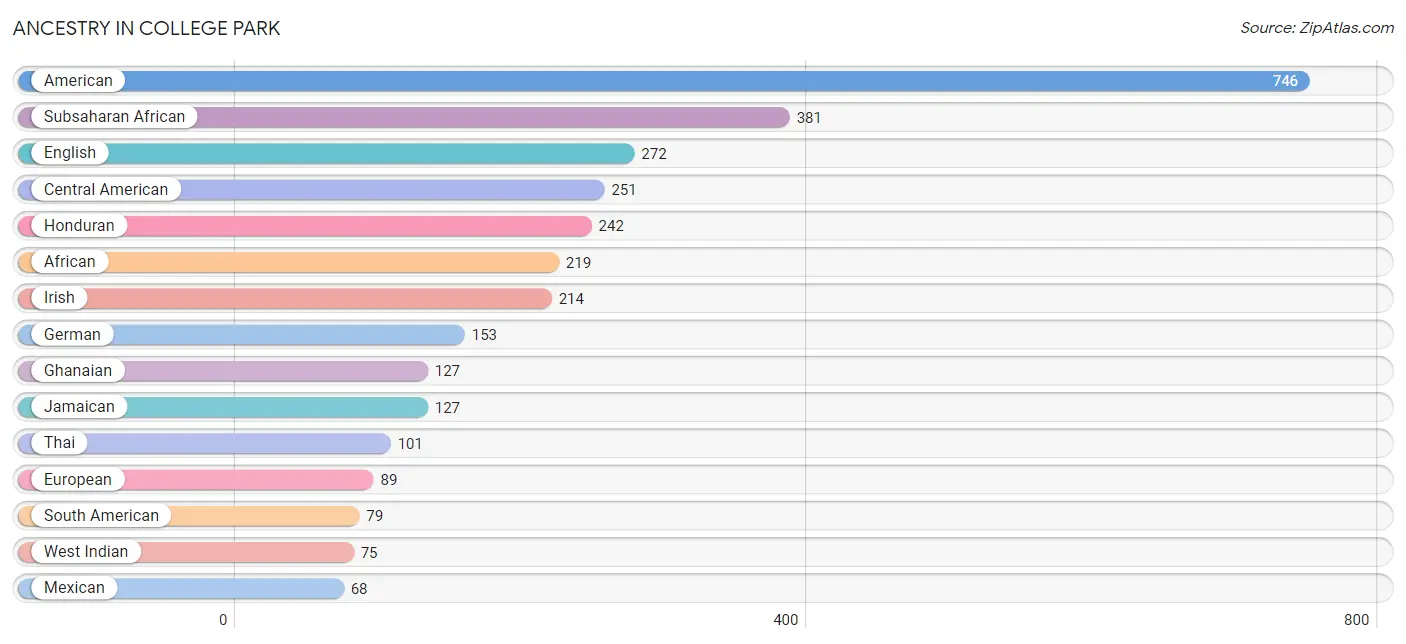
| Ancestry | # Population | % Population |
| African | 219 | 1.5% |
| American | 746 | 5.3% |
| Argentinean | 55 | 0.4% |
| Bahamian | 26 | 0.2% |
| Brazilian | 10 | 0.1% |
| British | 13 | 0.1% |
| British West Indian | 43 | 0.3% |
| Central American | 251 | 1.8% |
| Central American Indian | 14 | 0.1% |
| Cherokee | 10 | 0.1% |
| Colombian | 16 | 0.1% |
| Costa Rican | 9 | 0.1% |
| Creek | 14 | 0.1% |
| Cuban | 16 | 0.1% |
| Danish | 24 | 0.2% |
| Dominican | 7 | 0.1% |
| Dutch | 7 | 0.1% |
| Eastern European | 24 | 0.2% |
| English | 272 | 1.9% |
| European | 89 | 0.6% |
| French | 14 | 0.1% |
| French Canadian | 7 | 0.1% |
| German | 153 | 1.1% |
| Ghanaian | 127 | 0.9% |
| Haitian | 42 | 0.3% |
| Honduran | 242 | 1.7% |
| Icelander | 6 | 0.0% |
| Indian (Asian) | 48 | 0.3% |
| Irish | 214 | 1.5% |
| Italian | 24 | 0.2% |
| Jamaican | 127 | 0.9% |
| Korean | 66 | 0.5% |
| Mexican | 68 | 0.5% |
| Northern European | 9 | 0.1% |
| Pakistani | 49 | 0.4% |
| Puerto Rican | 52 | 0.4% |
| Scotch-Irish | 26 | 0.2% |
| Scottish | 59 | 0.4% |
| Slovene | 17 | 0.1% |
| South American | 79 | 0.6% |
| Spaniard | 32 | 0.2% |
| Spanish | 30 | 0.2% |
| Subsaharan African | 381 | 2.7% |
| Swedish | 21 | 0.2% |
| Thai | 101 | 0.7% |
| Vietnamese | 23 | 0.2% |
| Welsh | 28 | 0.2% |
| West Indian | 75 | 0.5% | View All 48 Rows |
Immigrants in College Park
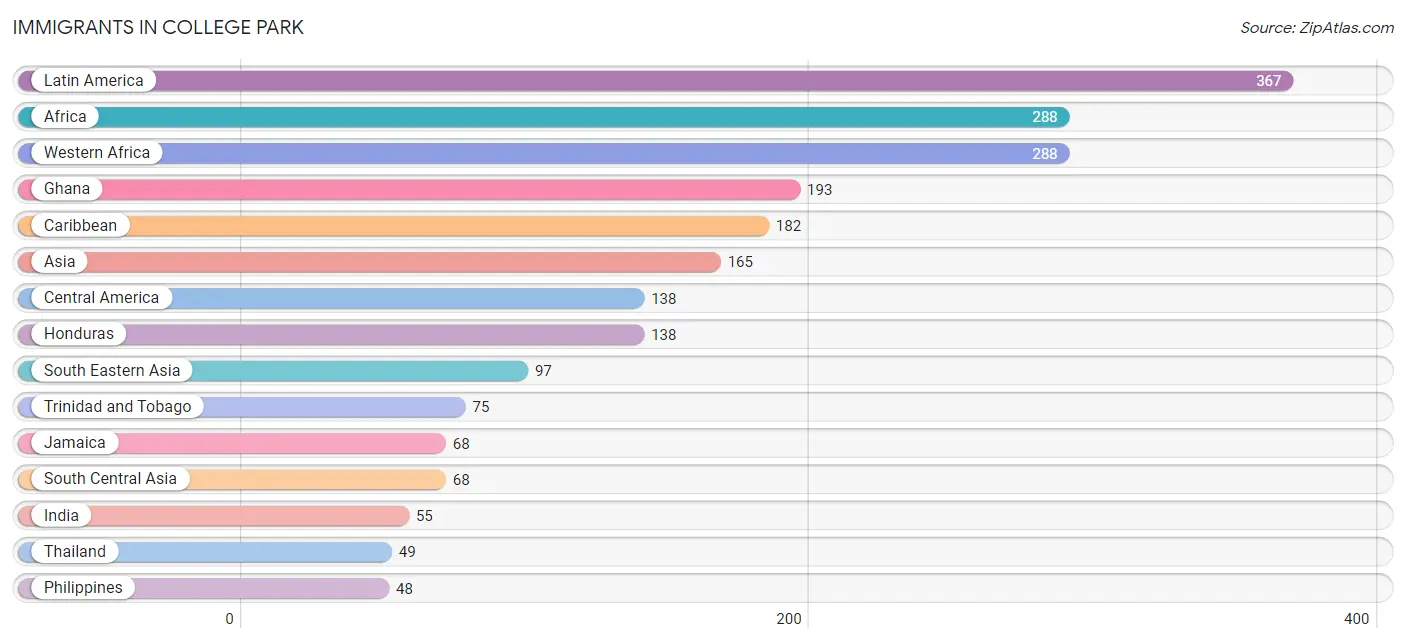
The most numerous immigrant groups reported in College Park came from Latin America (367 | 2.6%), Africa (288 | 2.0%), Western Africa (288 | 2.0%), Ghana (193 | 1.4%), and Caribbean (182 | 1.3%), together accounting for 9.3% of all College Park residents.
| Immigration Origin | # Population | % Population |
| Africa | 288 | 2.0% |
| Argentina | 13 | 0.1% |
| Asia | 165 | 1.2% |
| Bangladesh | 13 | 0.1% |
| Brazil | 10 | 0.1% |
| Canada | 19 | 0.1% |
| Caribbean | 182 | 1.3% |
| Central America | 138 | 1.0% |
| Colombia | 16 | 0.1% |
| Cuba | 16 | 0.1% |
| Dominican Republic | 7 | 0.1% |
| Europe | 14 | 0.1% |
| Ghana | 193 | 1.4% |
| Grenada | 16 | 0.1% |
| Guyana | 8 | 0.1% |
| Honduras | 138 | 1.0% |
| India | 55 | 0.4% |
| Jamaica | 68 | 0.5% |
| Latin America | 367 | 2.6% |
| Nigeria | 21 | 0.2% |
| Northern Europe | 14 | 0.1% |
| Philippines | 48 | 0.3% |
| Senegal | 26 | 0.2% |
| South America | 47 | 0.3% |
| South Central Asia | 68 | 0.5% |
| South Eastern Asia | 97 | 0.7% |
| Thailand | 49 | 0.4% |
| Trinidad and Tobago | 75 | 0.5% |
| Western Africa | 288 | 2.0% | View All 29 Rows |
Sex and Age in College Park
Sex and Age in College Park
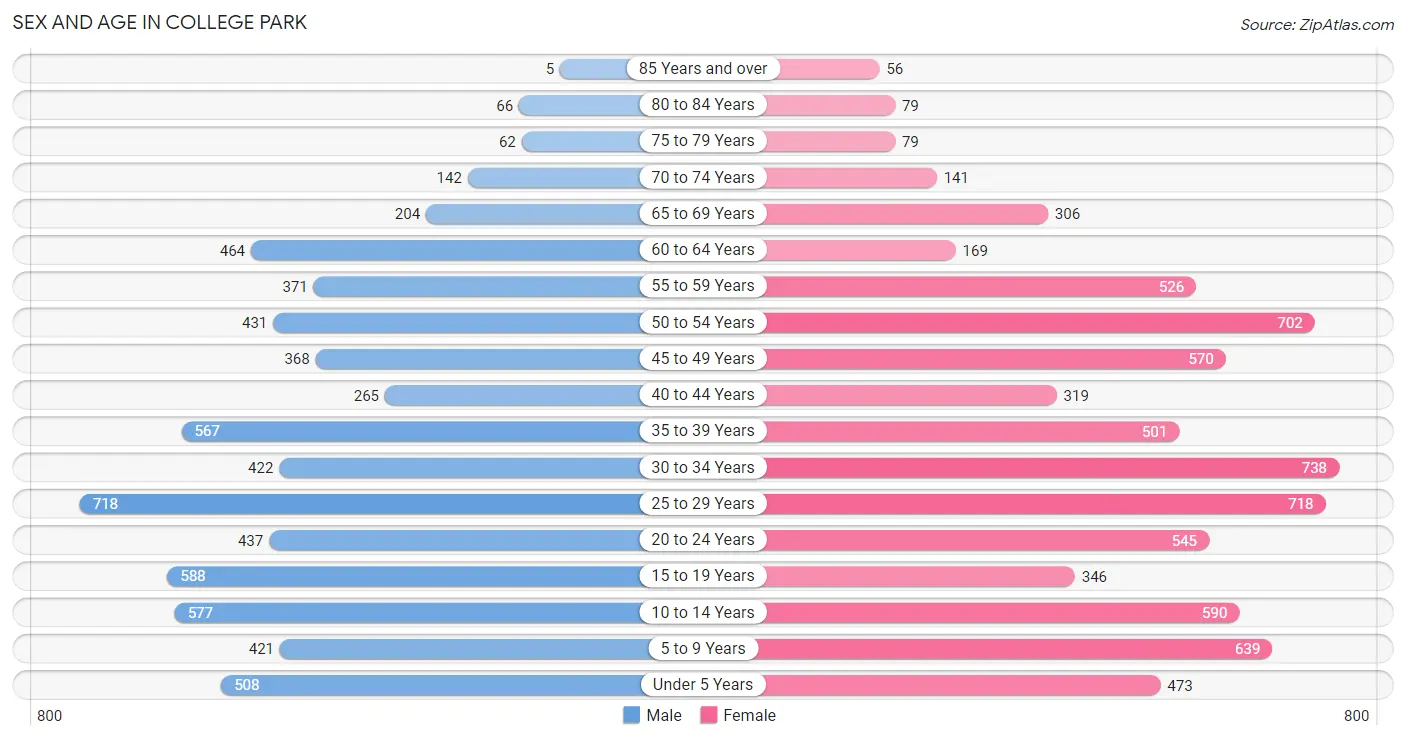
The most populous age groups in College Park are 25 to 29 Years (718 | 10.8%) for men and 30 to 34 Years (738 | 9.8%) for women.
| Age Bracket | Male | Female |
| Under 5 Years | 508 (7.7%) | 473 (6.3%) |
| 5 to 9 Years | 421 (6.4%) | 639 (8.5%) |
| 10 to 14 Years | 577 (8.7%) | 590 (7.9%) |
| 15 to 19 Years | 588 (8.9%) | 346 (4.6%) |
| 20 to 24 Years | 437 (6.6%) | 545 (7.3%) |
| 25 to 29 Years | 718 (10.8%) | 718 (9.6%) |
| 30 to 34 Years | 422 (6.4%) | 738 (9.8%) |
| 35 to 39 Years | 567 (8.6%) | 501 (6.7%) |
| 40 to 44 Years | 265 (4.0%) | 319 (4.3%) |
| 45 to 49 Years | 368 (5.6%) | 570 (7.6%) |
| 50 to 54 Years | 431 (6.5%) | 702 (9.4%) |
| 55 to 59 Years | 371 (5.6%) | 526 (7.0%) |
| 60 to 64 Years | 464 (7.0%) | 169 (2.2%) |
| 65 to 69 Years | 204 (3.1%) | 306 (4.1%) |
| 70 to 74 Years | 142 (2.1%) | 141 (1.9%) |
| 75 to 79 Years | 62 (0.9%) | 79 (1.1%) |
| 80 to 84 Years | 66 (1.0%) | 79 (1.1%) |
| 85 Years and over | 5 (0.1%) | 56 (0.7%) |
| Total | 6,616 (100.0%) | 7,497 (100.0%) |
Families and Households in College Park
Median Family Size in College Park
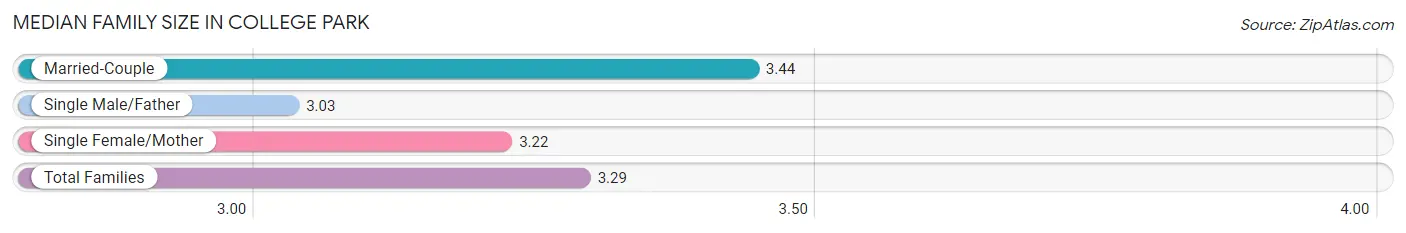
The median family size in College Park is 3.29 persons per family, with married-couple families (1,316 | 41.5%) accounting for the largest median family size of 3.44 persons per family. On the other hand, single male/father families (437 | 13.8%) represent the smallest median family size with 3.03 persons per family.
| Family Type | # Families | Family Size |
| Married-Couple | 1,316 (41.5%) | 3.44 |
| Single Male/Father | 437 (13.8%) | 3.03 |
| Single Female/Mother | 1,421 (44.8%) | 3.22 |
| Total Families | 3,174 (100.0%) | 3.29 |
Median Household Size in College Park
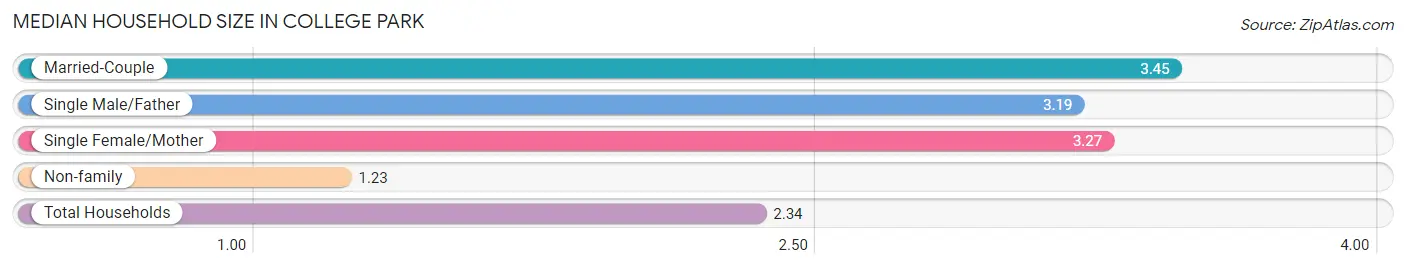
The median household size in College Park is 2.34 persons per household, with married-couple households (1,316 | 21.9%) accounting for the largest median household size of 3.45 persons per household. non-family households (2,842 | 47.2%) represent the smallest median household size with 1.23 persons per household.
| Household Type | # Households | Household Size |
| Married-Couple | 1,316 (21.9%) | 3.45 |
| Single Male/Father | 437 (7.3%) | 3.19 |
| Single Female/Mother | 1,421 (23.6%) | 3.27 |
| Non-family | 2,842 (47.2%) | 1.23 |
| Total Households | 6,016 (100.0%) | 2.34 |
Household Size by Marriage Status in College Park
Out of a total of 6,016 households in College Park, 3,174 (52.8%) are family households, while 2,842 (47.2%) are nonfamily households. The most numerous type of family households are 2-person households, comprising 1,488, and the most common type of nonfamily households are 1-person households, comprising 2,216.
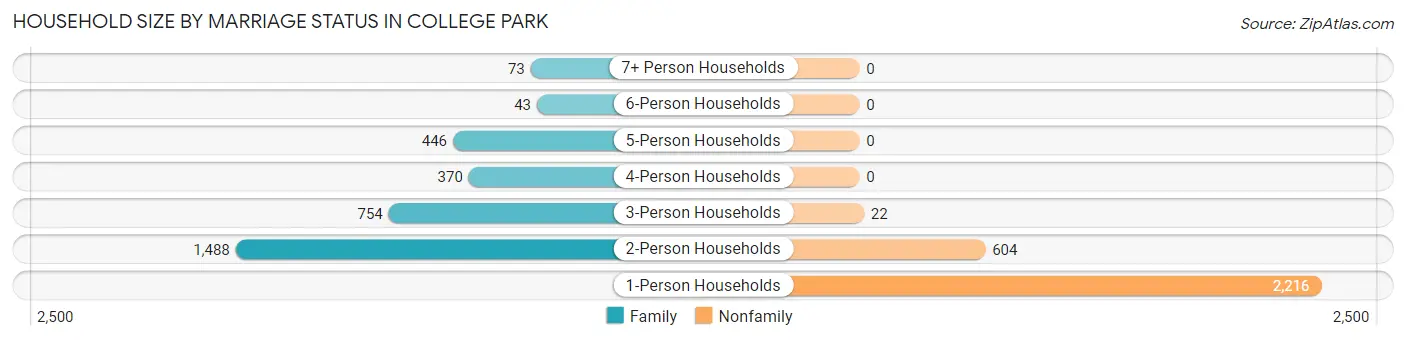
| Household Size | Family Households | Nonfamily Households |
| 1-Person Households | - | 2,216 (36.8%) |
| 2-Person Households | 1,488 (24.7%) | 604 (10.0%) |
| 3-Person Households | 754 (12.5%) | 22 (0.4%) |
| 4-Person Households | 370 (6.1%) | 0 (0.0%) |
| 5-Person Households | 446 (7.4%) | 0 (0.0%) |
| 6-Person Households | 43 (0.7%) | 0 (0.0%) |
| 7+ Person Households | 73 (1.2%) | 0 (0.0%) |
| Total | 3,174 (52.8%) | 2,842 (47.2%) |
Female Fertility in College Park
Fertility by Age in College Park
Average fertility rate in College Park is 85.0 births per 1,000 women. Women in the age bracket of 20 to 34 years have the highest fertility rate with 158.0 births per 1,000 women. Women in the age bracket of 20 to 34 years acount for 94.6% of all women with births.
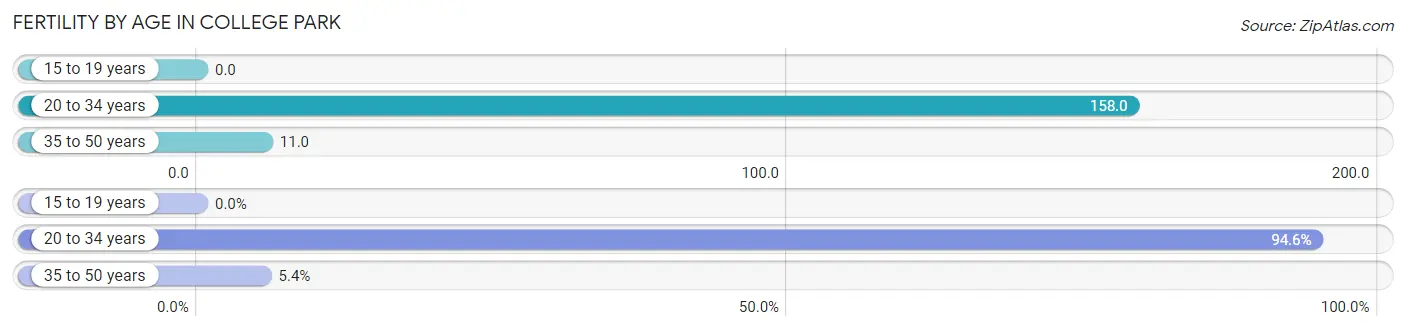
| Age Bracket | Women with Births | Births / 1,000 Women |
| 15 to 19 years | 0 (0.0%) | 0.0 |
| 20 to 34 years | 316 (94.6%) | 158.0 |
| 35 to 50 years | 18 (5.4%) | 11.0 |
| Total | 334 (100.0%) | 85.0 |
Fertility by Age by Marriage Status in College Park
11.7% of women with births (334) in College Park are married. The highest percentage of unmarried women with births falls into 35 to 50 years age bracket with 100.0% of them unmarried at the time of birth, while the lowest percentage of unmarried women with births belong to 20 to 34 years age bracket with 87.7% of them unmarried.
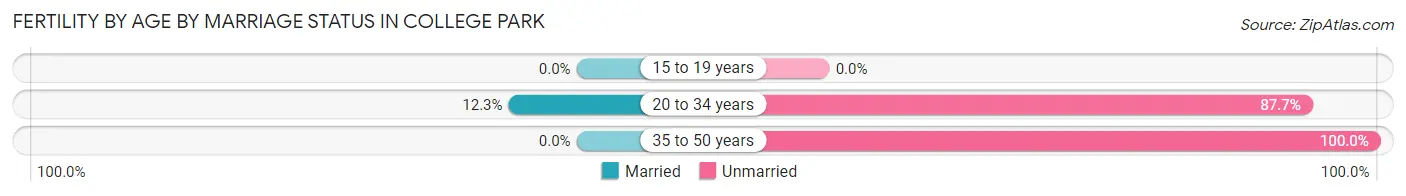
| Age Bracket | Married | Unmarried |
| 15 to 19 years | 0 (0.0%) | 0 (0.0%) |
| 20 to 34 years | 39 (12.3%) | 277 (87.7%) |
| 35 to 50 years | 0 (0.0%) | 18 (100.0%) |
| Total | 39 (11.7%) | 295 (88.3%) |
Fertility by Education in College Park
Average fertility rate in College Park is 85.0 births per 1,000 women. Women with the education attainment of college or associate's degree have the highest fertility rate of 174.0 births per 1,000 women, while women with the education attainment of bachelor's degree have the lowest fertility at 26.0 births per 1,000 women. Women with the education attainment of college or associate's degree represent 59.0% of all women with births.
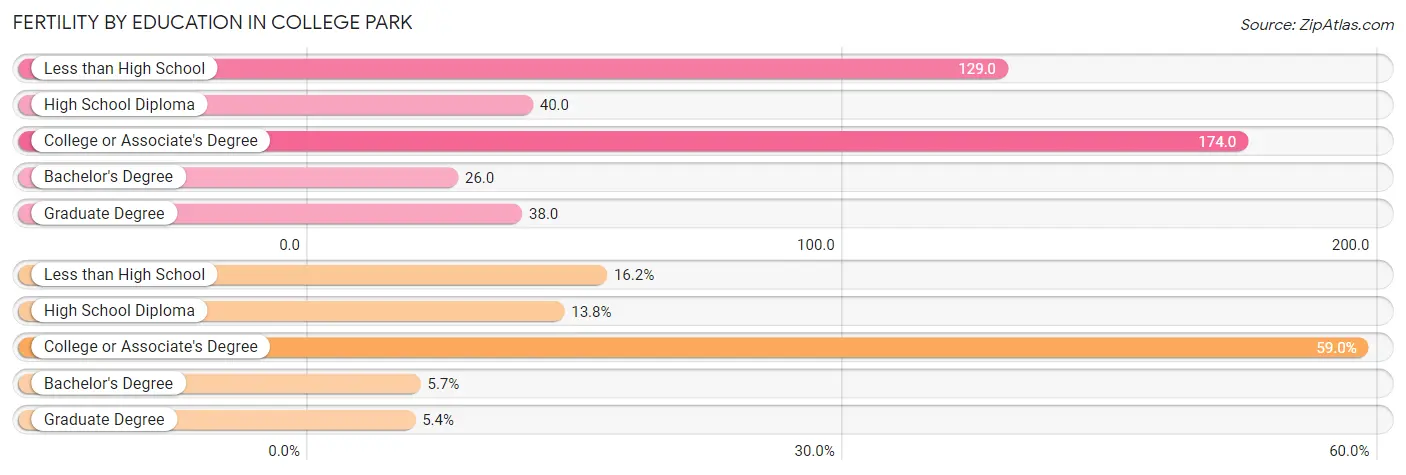
| Educational Attainment | Women with Births | Births / 1,000 Women |
| Less than High School | 54 (16.2%) | 129.0 |
| High School Diploma | 46 (13.8%) | 40.0 |
| College or Associate's Degree | 197 (59.0%) | 174.0 |
| Bachelor's Degree | 19 (5.7%) | 26.0 |
| Graduate Degree | 18 (5.4%) | 38.0 |
| Total | 334 (100.0%) | 85.0 |
Fertility by Education by Marriage Status in College Park
88.3% of women with births in College Park are unmarried. Women with the educational attainment of bachelor's degree are most likely to be married with 100.0% of them married at childbirth, while women with the educational attainment of less than high school are least likely to be married with 100.0% of them unmarried at childbirth.
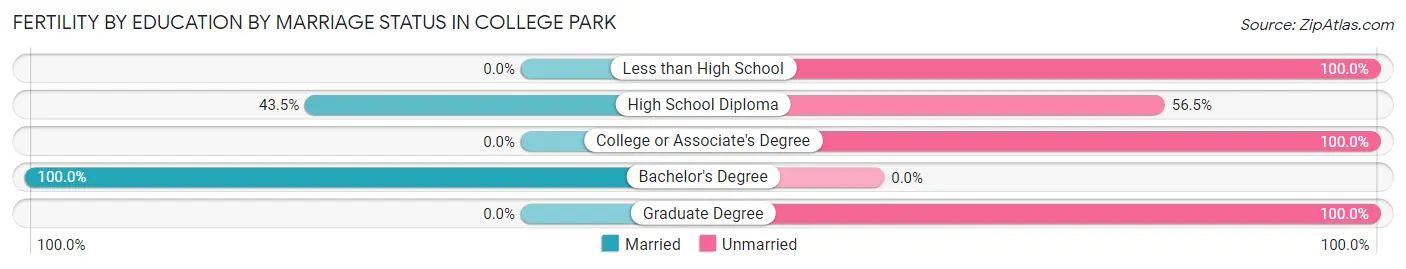
| Educational Attainment | Married | Unmarried |
| Less than High School | 0 (0.0%) | 54 (100.0%) |
| High School Diploma | 20 (43.5%) | 26 (56.5%) |
| College or Associate's Degree | 0 (0.0%) | 197 (100.0%) |
| Bachelor's Degree | 19 (100.0%) | 0 (0.0%) |
| Graduate Degree | 0 (0.0%) | 18 (100.0%) |
| Total | 39 (11.7%) | 295 (88.3%) |
Employment Characteristics in College Park
Employment by Class of Employer in College Park
Among the 6,541 employed individuals in College Park, private company employees (5,049 | 77.2%), self-employed (not incorporated) (418 | 6.4%), and not-for-profit organizations (351 | 5.4%) make up the most common classes of employment.
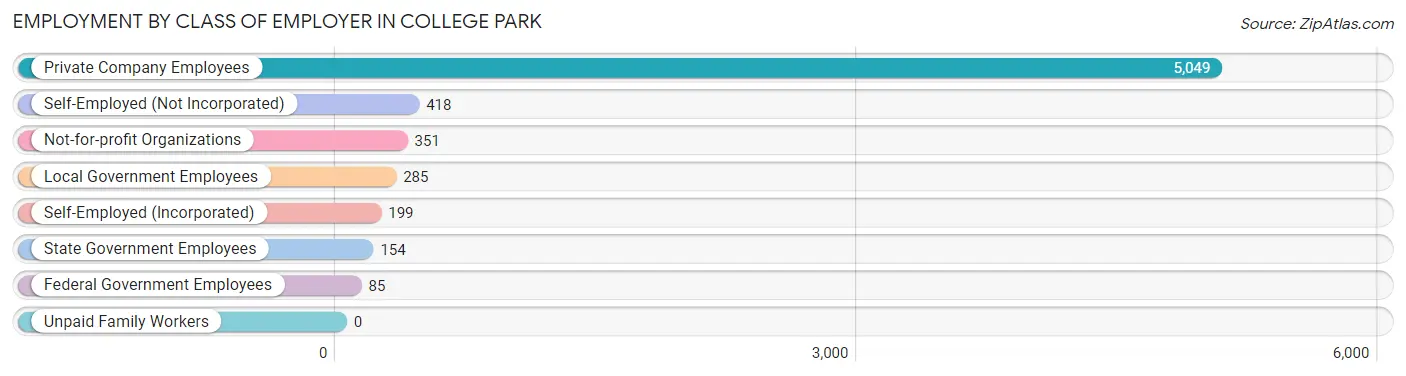
| Employer Class | # Employees | % Employees |
| Private Company Employees | 5,049 | 77.2% |
| Self-Employed (Incorporated) | 199 | 3.0% |
| Self-Employed (Not Incorporated) | 418 | 6.4% |
| Not-for-profit Organizations | 351 | 5.4% |
| Local Government Employees | 285 | 4.4% |
| State Government Employees | 154 | 2.4% |
| Federal Government Employees | 85 | 1.3% |
| Unpaid Family Workers | 0 | 0.0% |
| Total | 6,541 | 100.0% |
Employment Status by Age in College Park
According to the labor force statistics for College Park, out of the total population over 16 years of age (10,796), 72.6% or 7,838 individuals are in the labor force, with 13.0% or 1,019 of them unemployed. The age group with the highest labor force participation rate is 35 to 44 years, with 92.2% or 1,523 individuals in the labor force. Within the labor force, the 25 to 29 years age range has the highest percentage of unemployed individuals, with 26.4% or 324 of them being unemployed.
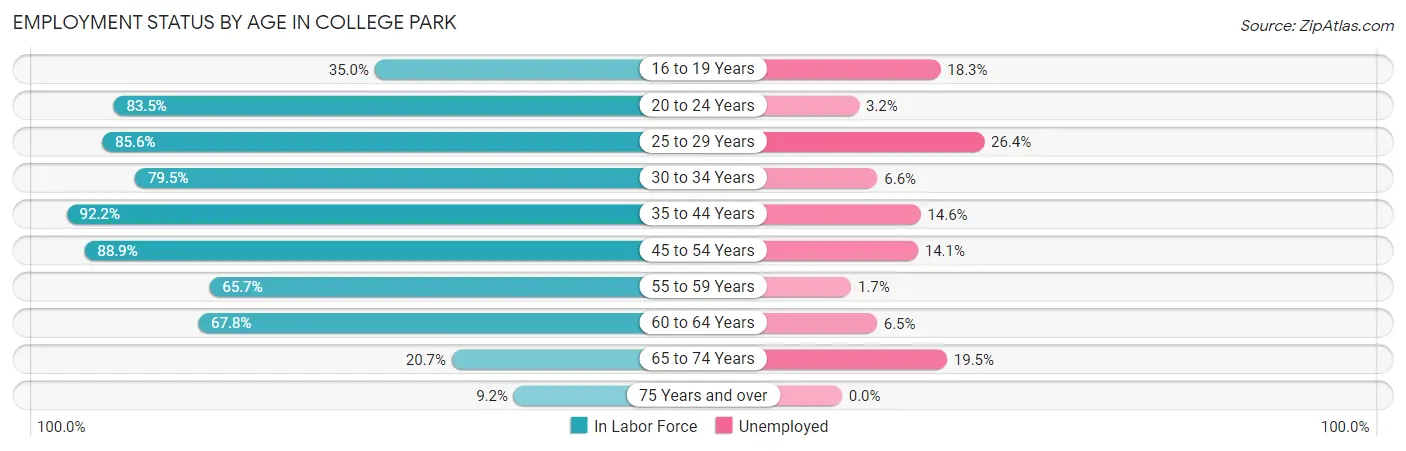
| Age Bracket | In Labor Force | Unemployed |
| 16 to 19 Years | 289 (35.0%) | 53 (18.3%) |
| 20 to 24 Years | 820 (83.5%) | 26 (3.2%) |
| 25 to 29 Years | 1,229 (85.6%) | 324 (26.4%) |
| 30 to 34 Years | 922 (79.5%) | 61 (6.6%) |
| 35 to 44 Years | 1,523 (92.2%) | 222 (14.6%) |
| 45 to 54 Years | 1,841 (88.9%) | 260 (14.1%) |
| 55 to 59 Years | 589 (65.7%) | 10 (1.7%) |
| 60 to 64 Years | 429 (67.8%) | 28 (6.5%) |
| 65 to 74 Years | 164 (20.7%) | 32 (19.5%) |
| 75 Years and over | 32 (9.2%) | 0 (0.0%) |
| Total | 7,838 (72.6%) | 1,019 (13.0%) |
Employment Status by Educational Attainment in College Park
According to labor force statistics for College Park, 83.2% of individuals (6,530) out of the total population between 25 and 64 years of age (7,849) are in the labor force, with 13.9% or 908 of them being unemployed. The group with the highest labor force participation rate are those with the educational attainment of bachelor's degree or higher, with 89.9% or 2,017 individuals in the labor force. Within the labor force, individuals with high school diploma education have the highest percentage of unemployment, with 20.5% or 399 of them being unemployed.
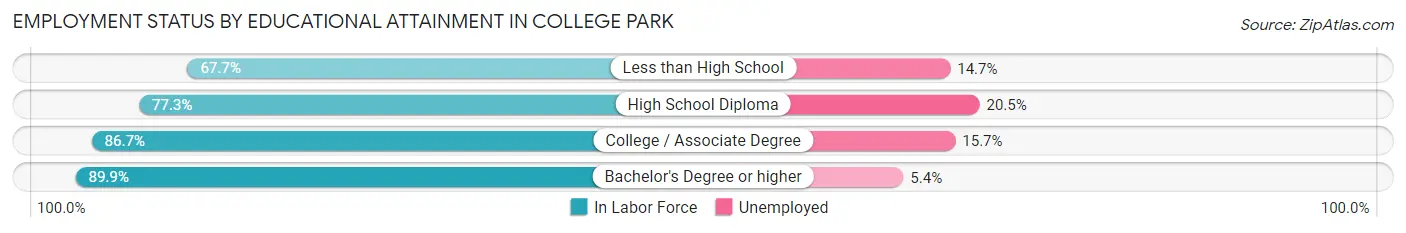
| Educational Attainment | In Labor Force | Unemployed |
| Less than High School | 381 (67.7%) | 83 (14.7%) |
| High School Diploma | 1,948 (77.3%) | 517 (20.5%) |
| College / Associate Degree | 2,187 (86.7%) | 396 (15.7%) |
| Bachelor's Degree or higher | 2,017 (89.9%) | 121 (5.4%) |
| Total | 6,530 (83.2%) | 1,091 (13.9%) |
Employment Occupations by Sex in College Park
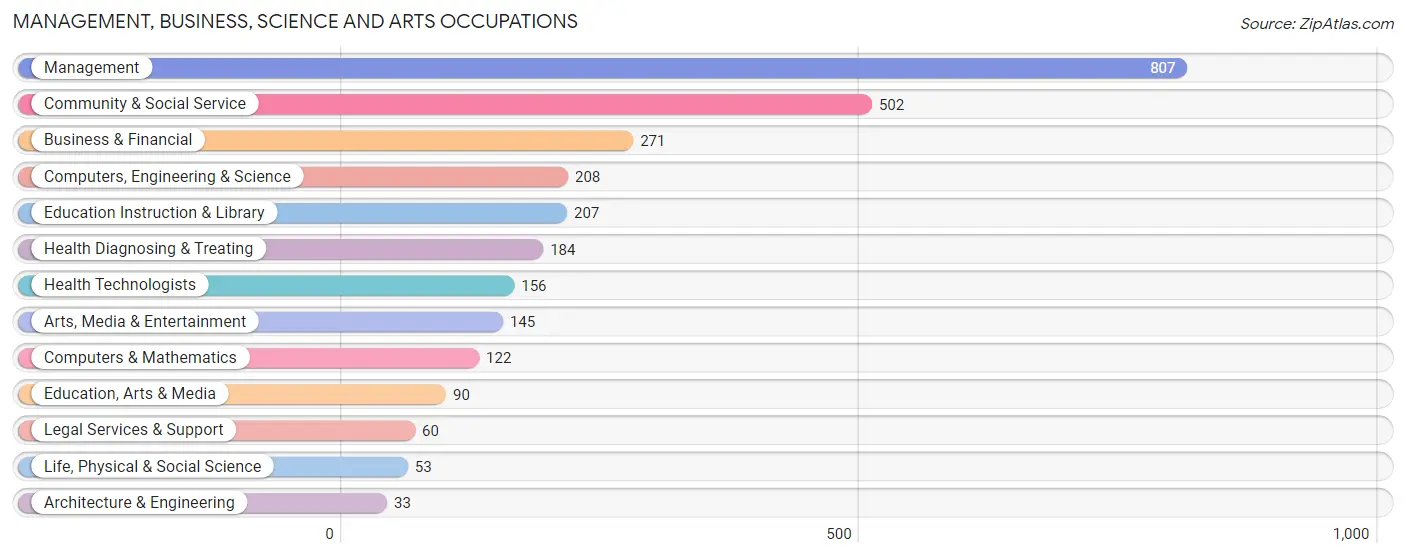
Management, Business, Science and Arts Occupations
The most common Management, Business, Science and Arts occupations in College Park are Management (807 | 11.8%), Community & Social Service (502 | 7.4%), Business & Financial (271 | 4.0%), Computers, Engineering & Science (208 | 3.0%), and Education Instruction & Library (207 | 3.0%).
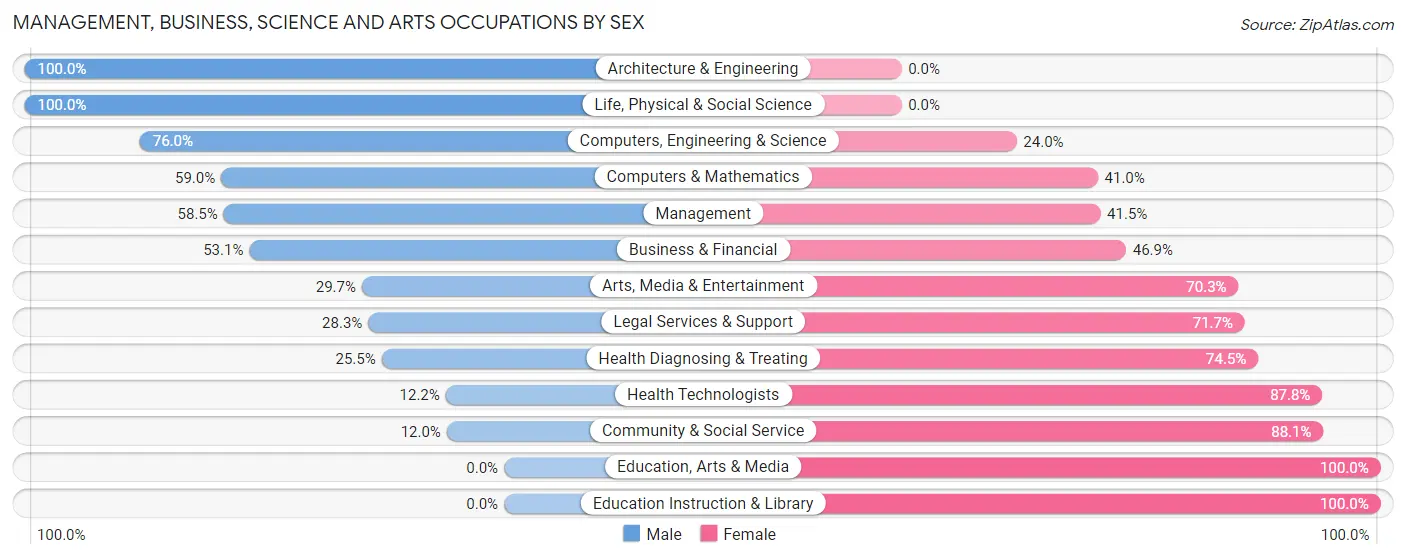
Management, Business, Science and Arts Occupations by Sex
Within the Management, Business, Science and Arts occupations in College Park, the most male-oriented occupations are Architecture & Engineering (100.0%), Life, Physical & Social Science (100.0%), and Computers, Engineering & Science (76.0%), while the most female-oriented occupations are Education, Arts & Media (100.0%), Education Instruction & Library (100.0%), and Community & Social Service (88.0%).
| Occupation | Male | Female |
| Management | 472 (58.5%) | 335 (41.5%) |
| Business & Financial | 144 (53.1%) | 127 (46.9%) |
| Computers, Engineering & Science | 158 (76.0%) | 50 (24.0%) |
| Computers & Mathematics | 72 (59.0%) | 50 (41.0%) |
| Architecture & Engineering | 33 (100.0%) | 0 (0.0%) |
| Life, Physical & Social Science | 53 (100.0%) | 0 (0.0%) |
| Community & Social Service | 60 (11.9%) | 442 (88.0%) |
| Education, Arts & Media | 0 (0.0%) | 90 (100.0%) |
| Legal Services & Support | 17 (28.3%) | 43 (71.7%) |
| Education Instruction & Library | 0 (0.0%) | 207 (100.0%) |
| Arts, Media & Entertainment | 43 (29.7%) | 102 (70.3%) |
| Health Diagnosing & Treating | 47 (25.5%) | 137 (74.5%) |
| Health Technologists | 19 (12.2%) | 137 (87.8%) |
| Total (Category) | 881 (44.7%) | 1,091 (55.3%) |
| Total (Overall) | 3,259 (47.8%) | 3,563 (52.2%) |
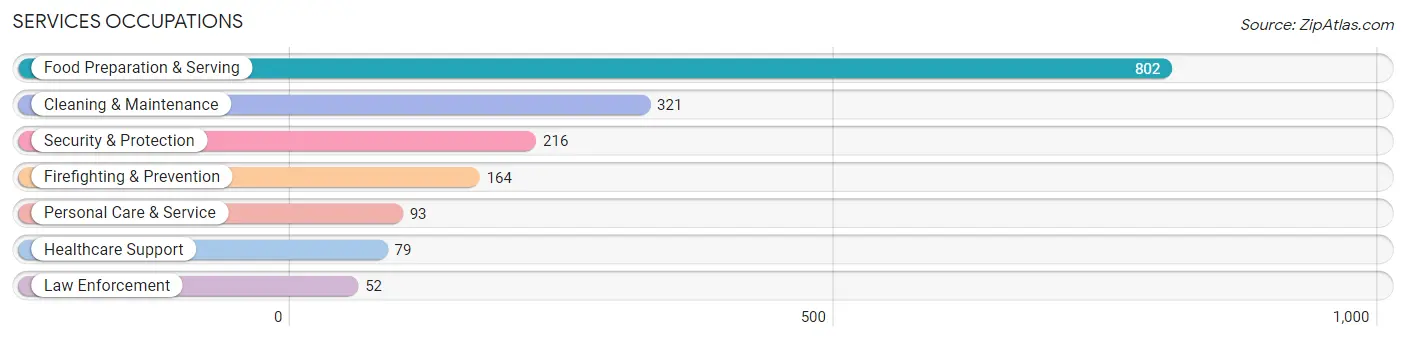
Services Occupations
The most common Services occupations in College Park are Food Preparation & Serving (802 | 11.8%), Cleaning & Maintenance (321 | 4.7%), Security & Protection (216 | 3.2%), Firefighting & Prevention (164 | 2.4%), and Personal Care & Service (93 | 1.4%).
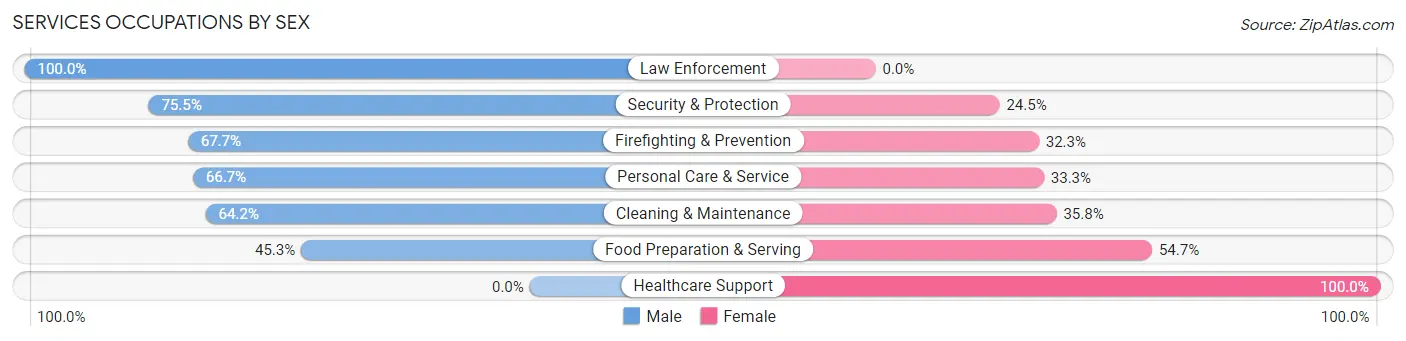
Services Occupations by Sex
Within the Services occupations in College Park, the most male-oriented occupations are Law Enforcement (100.0%), Security & Protection (75.5%), and Firefighting & Prevention (67.7%), while the most female-oriented occupations are Healthcare Support (100.0%), Food Preparation & Serving (54.7%), and Cleaning & Maintenance (35.8%).
| Occupation | Male | Female |
| Healthcare Support | 0 (0.0%) | 79 (100.0%) |
| Security & Protection | 163 (75.5%) | 53 (24.5%) |
| Firefighting & Prevention | 111 (67.7%) | 53 (32.3%) |
| Law Enforcement | 52 (100.0%) | 0 (0.0%) |
| Food Preparation & Serving | 363 (45.3%) | 439 (54.7%) |
| Cleaning & Maintenance | 206 (64.2%) | 115 (35.8%) |
| Personal Care & Service | 62 (66.7%) | 31 (33.3%) |
| Total (Category) | 794 (52.5%) | 717 (47.4%) |
| Total (Overall) | 3,259 (47.8%) | 3,563 (52.2%) |
Sales and Office Occupations
The most common Sales and Office occupations in College Park are Sales & Related (974 | 14.3%), and Office & Administration (778 | 11.4%).
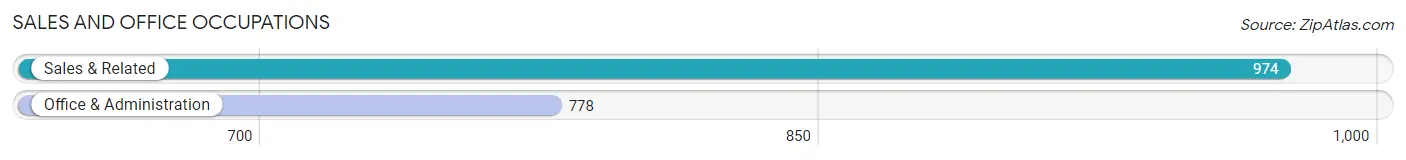
Sales and Office Occupations by Sex
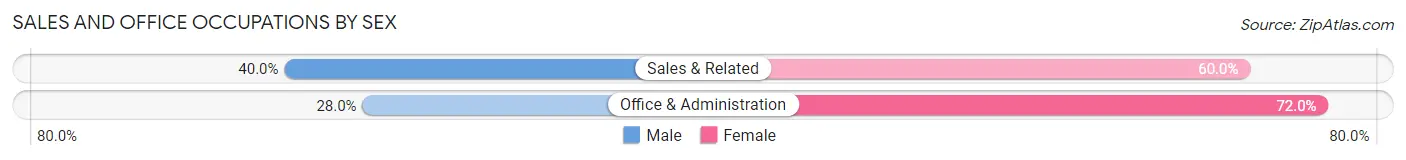
| Occupation | Male | Female |
| Sales & Related | 390 (40.0%) | 584 (60.0%) |
| Office & Administration | 218 (28.0%) | 560 (72.0%) |
| Total (Category) | 608 (34.7%) | 1,144 (65.3%) |
| Total (Overall) | 3,259 (47.8%) | 3,563 (52.2%) |
Natural Resources, Construction and Maintenance Occupations
The most common Natural Resources, Construction and Maintenance occupations in College Park are Installation, Maintenance & Repair (90 | 1.3%), and Construction & Extraction (69 | 1.0%).
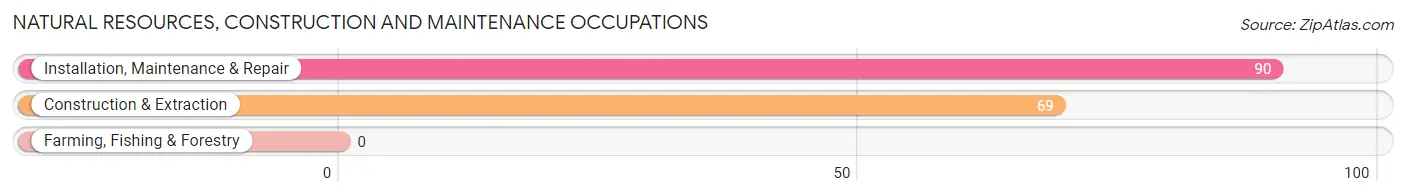
Natural Resources, Construction and Maintenance Occupations by Sex
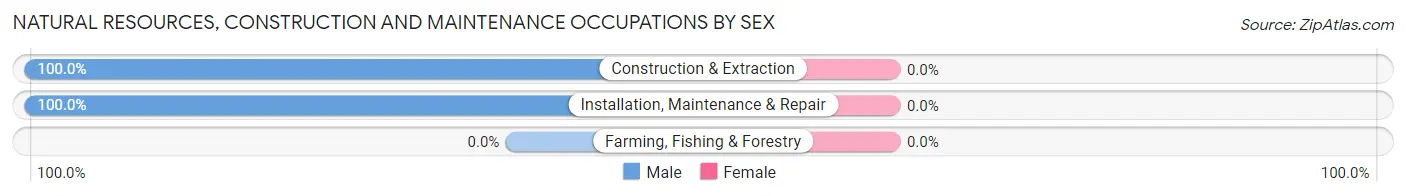
| Occupation | Male | Female |
| Farming, Fishing & Forestry | 0 (0.0%) | 0 (0.0%) |
| Construction & Extraction | 69 (100.0%) | 0 (0.0%) |
| Installation, Maintenance & Repair | 90 (100.0%) | 0 (0.0%) |
| Total (Category) | 159 (100.0%) | 0 (0.0%) |
| Total (Overall) | 3,259 (47.8%) | 3,563 (52.2%) |
Production, Transportation and Moving Occupations
The most common Production, Transportation and Moving occupations in College Park are Material Moving (633 | 9.3%), Transportation (558 | 8.2%), and Production (237 | 3.5%).
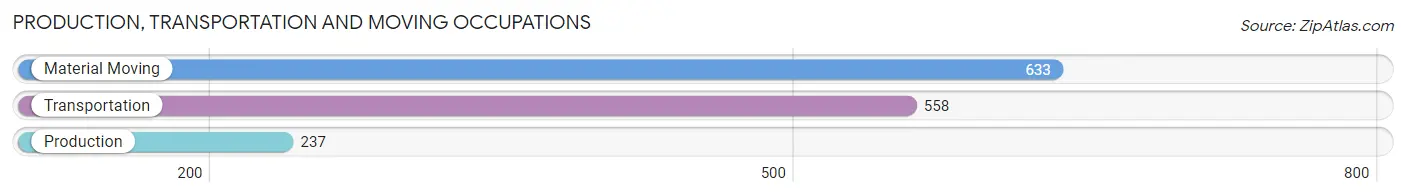
Production, Transportation and Moving Occupations by Sex
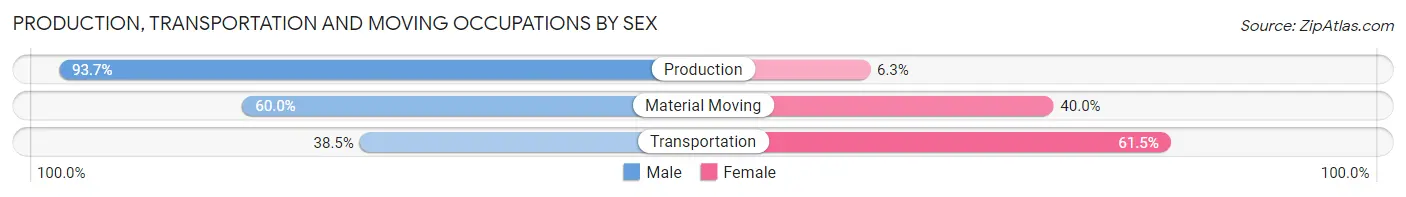
| Occupation | Male | Female |
| Production | 222 (93.7%) | 15 (6.3%) |
| Transportation | 215 (38.5%) | 343 (61.5%) |
| Material Moving | 380 (60.0%) | 253 (40.0%) |
| Total (Category) | 817 (57.2%) | 611 (42.8%) |
| Total (Overall) | 3,259 (47.8%) | 3,563 (52.2%) |
Employment Industries by Sex in College Park
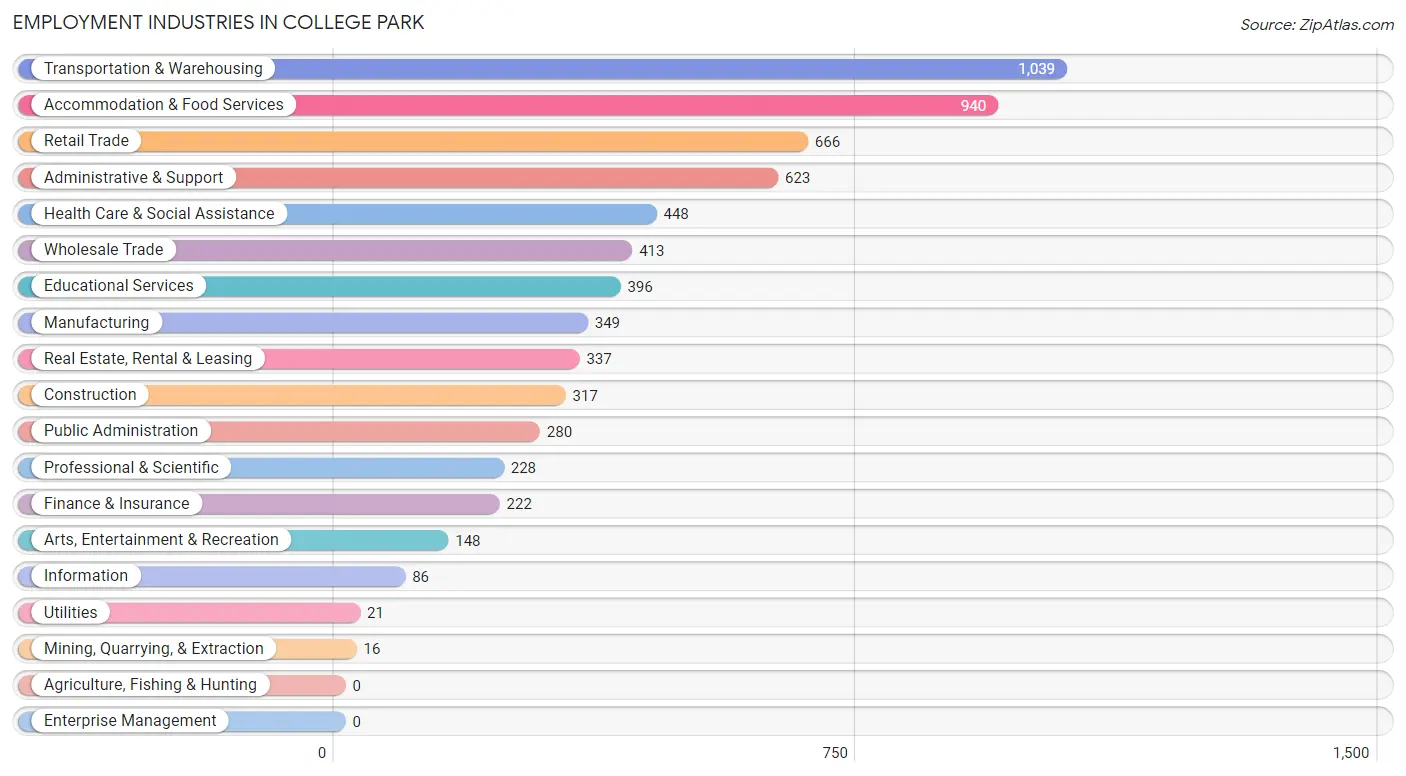
Employment Industries in College Park
The major employment industries in College Park include Transportation & Warehousing (1,039 | 15.2%), Accommodation & Food Services (940 | 13.8%), Retail Trade (666 | 9.8%), Administrative & Support (623 | 9.1%), and Health Care & Social Assistance (448 | 6.6%).
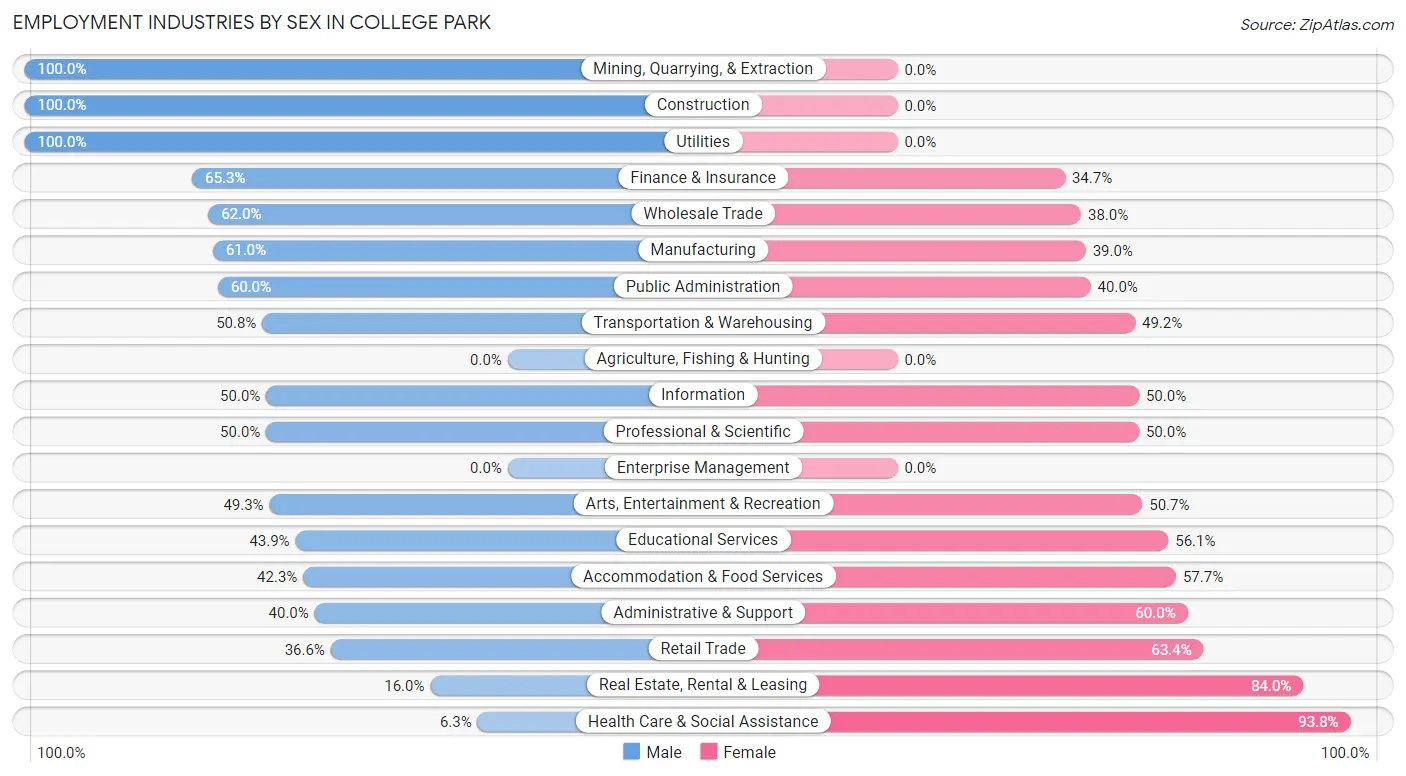
Employment Industries by Sex in College Park
The College Park industries that see more men than women are Mining, Quarrying, & Extraction (100.0%), Construction (100.0%), and Utilities (100.0%), whereas the industries that tend to have a higher number of women are Health Care & Social Assistance (93.8%), Real Estate, Rental & Leasing (84.0%), and Retail Trade (63.4%).
| Industry | Male | Female |
| Agriculture, Fishing & Hunting | 0 (0.0%) | 0 (0.0%) |
| Mining, Quarrying, & Extraction | 16 (100.0%) | 0 (0.0%) |
| Construction | 317 (100.0%) | 0 (0.0%) |
| Manufacturing | 213 (61.0%) | 136 (39.0%) |
| Wholesale Trade | 256 (62.0%) | 157 (38.0%) |
| Retail Trade | 244 (36.6%) | 422 (63.4%) |
| Transportation & Warehousing | 528 (50.8%) | 511 (49.2%) |
| Utilities | 21 (100.0%) | 0 (0.0%) |
| Information | 43 (50.0%) | 43 (50.0%) |
| Finance & Insurance | 145 (65.3%) | 77 (34.7%) |
| Real Estate, Rental & Leasing | 54 (16.0%) | 283 (84.0%) |
| Professional & Scientific | 114 (50.0%) | 114 (50.0%) |
| Enterprise Management | 0 (0.0%) | 0 (0.0%) |
| Administrative & Support | 249 (40.0%) | 374 (60.0%) |
| Educational Services | 174 (43.9%) | 222 (56.1%) |
| Health Care & Social Assistance | 28 (6.2%) | 420 (93.8%) |
| Arts, Entertainment & Recreation | 73 (49.3%) | 75 (50.7%) |
| Accommodation & Food Services | 398 (42.3%) | 542 (57.7%) |
| Public Administration | 168 (60.0%) | 112 (40.0%) |
| Total | 3,259 (47.8%) | 3,563 (52.2%) |
Education in College Park
School Enrollment in College Park
The most common levels of schooling among the 3,682 students in College Park are elementary school (1,104 | 30.0%), middle school (784 | 21.3%), and high school (752 | 20.4%).
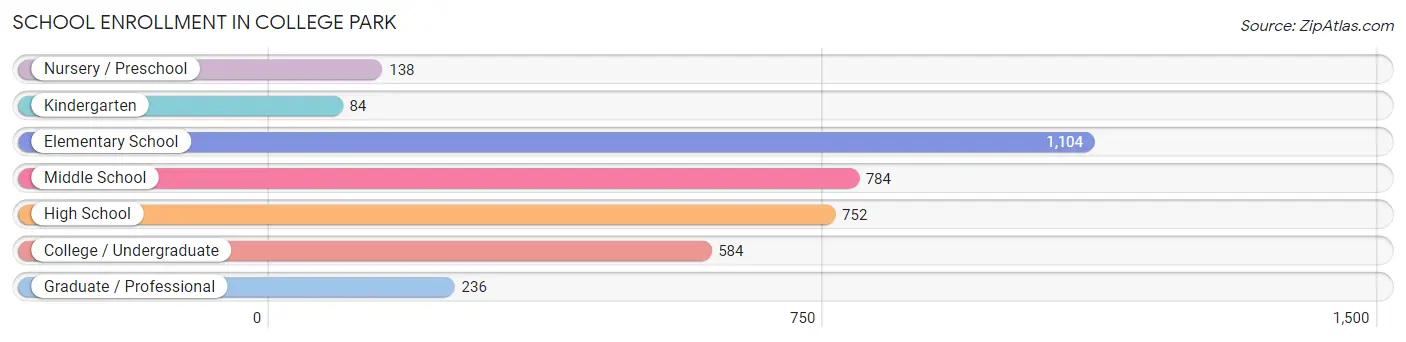
| School Level | # Students | % Students |
| Nursery / Preschool | 138 | 3.7% |
| Kindergarten | 84 | 2.3% |
| Elementary School | 1,104 | 30.0% |
| Middle School | 784 | 21.3% |
| High School | 752 | 20.4% |
| College / Undergraduate | 584 | 15.9% |
| Graduate / Professional | 236 | 6.4% |
| Total | 3,682 | 100.0% |
School Enrollment by Age by Funding Source in College Park
Out of a total of 3,682 students who are enrolled in schools in College Park, 814 (22.1%) attend a private institution, while the remaining 2,868 (77.9%) are enrolled in public schools. The age group of 25 to 34 year olds has the highest likelihood of being enrolled in private schools, with 140 (54.9% in the age bracket) enrolled. Conversely, the age group of 15 to 17 year olds has the lowest likelihood of being enrolled in a private school, with 359 (89.7% in the age bracket) attending a public institution.
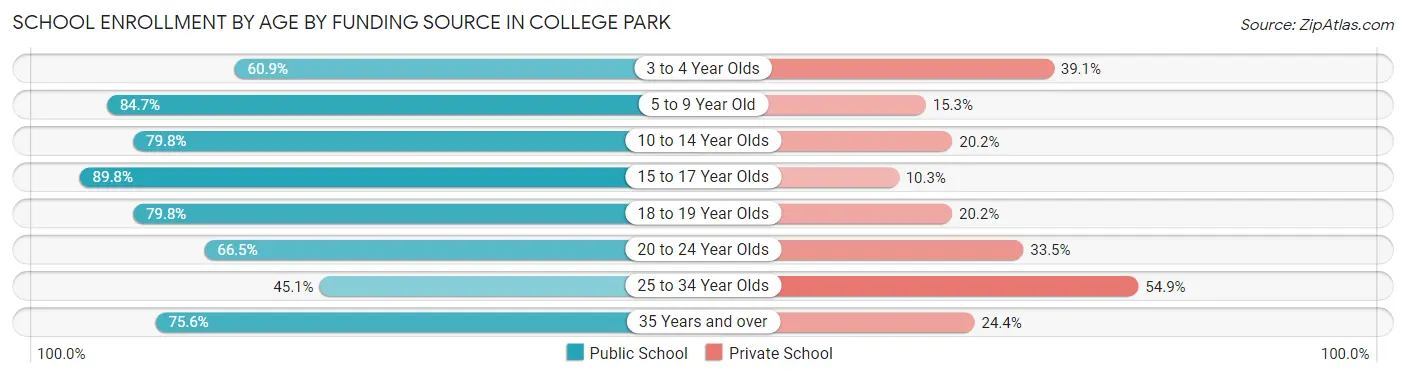
| Age Bracket | Public School | Private School |
| 3 to 4 Year Olds | 84 (60.9%) | 54 (39.1%) |
| 5 to 9 Year Old | 880 (84.7%) | 159 (15.3%) |
| 10 to 14 Year Olds | 891 (79.8%) | 226 (20.2%) |
| 15 to 17 Year Olds | 359 (89.7%) | 41 (10.2%) |
| 18 to 19 Year Olds | 166 (79.8%) | 42 (20.2%) |
| 20 to 24 Year Olds | 161 (66.5%) | 81 (33.5%) |
| 25 to 34 Year Olds | 115 (45.1%) | 140 (54.9%) |
| 35 Years and over | 214 (75.6%) | 69 (24.4%) |
| Total | 2,868 (77.9%) | 814 (22.1%) |
Educational Attainment by Field of Study in College Park
Business (616 | 23.0%), arts & humanities (362 | 13.5%), communications (305 | 11.4%), liberal arts & history (254 | 9.5%), and science & technology (223 | 8.3%) are the most common fields of study among 2,682 individuals in College Park who have obtained a bachelor's degree or higher.
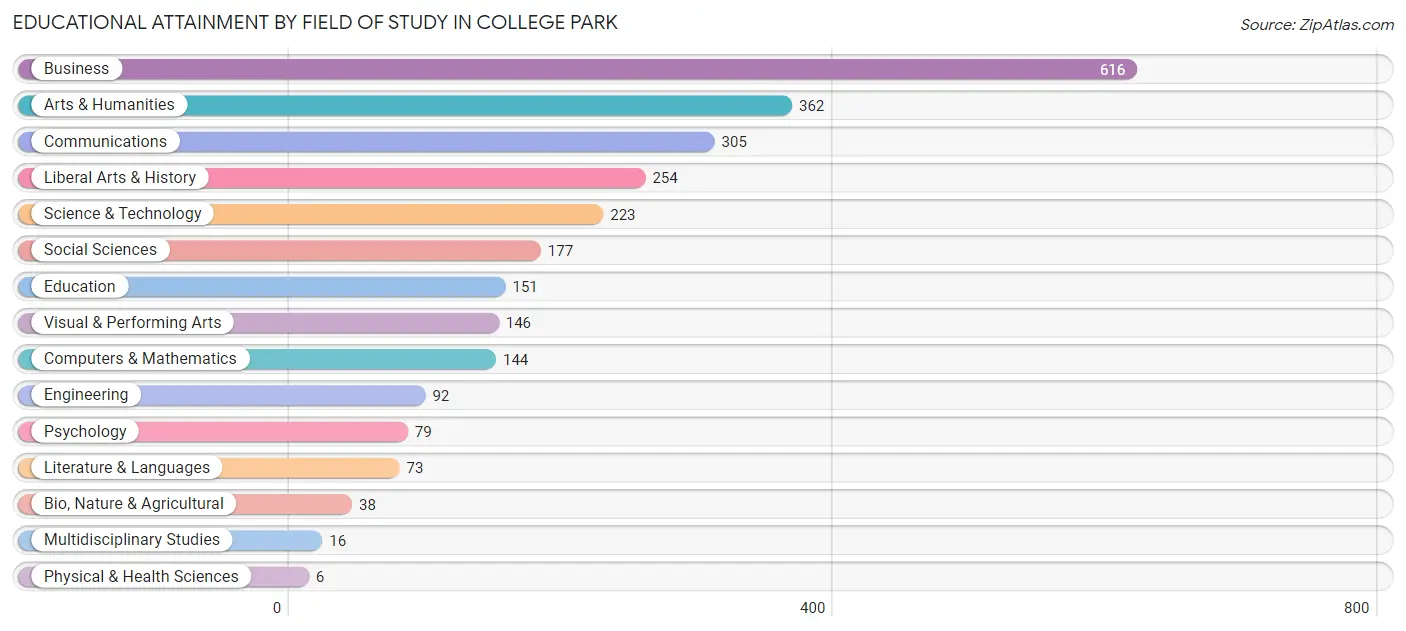
| Field of Study | # Graduates | % Graduates |
| Computers & Mathematics | 144 | 5.4% |
| Bio, Nature & Agricultural | 38 | 1.4% |
| Physical & Health Sciences | 6 | 0.2% |
| Psychology | 79 | 2.9% |
| Social Sciences | 177 | 6.6% |
| Engineering | 92 | 3.4% |
| Multidisciplinary Studies | 16 | 0.6% |
| Science & Technology | 223 | 8.3% |
| Business | 616 | 23.0% |
| Education | 151 | 5.6% |
| Literature & Languages | 73 | 2.7% |
| Liberal Arts & History | 254 | 9.5% |
| Visual & Performing Arts | 146 | 5.4% |
| Communications | 305 | 11.4% |
| Arts & Humanities | 362 | 13.5% |
| Total | 2,682 | 100.0% |
Transportation & Commute in College Park
Vehicle Availability by Sex in College Park
The most prevalent vehicle ownership categories in College Park are males with 1 vehicle (1,283, accounting for 39.5%) and females with 1 vehicle (1,481, making up 39.0%).
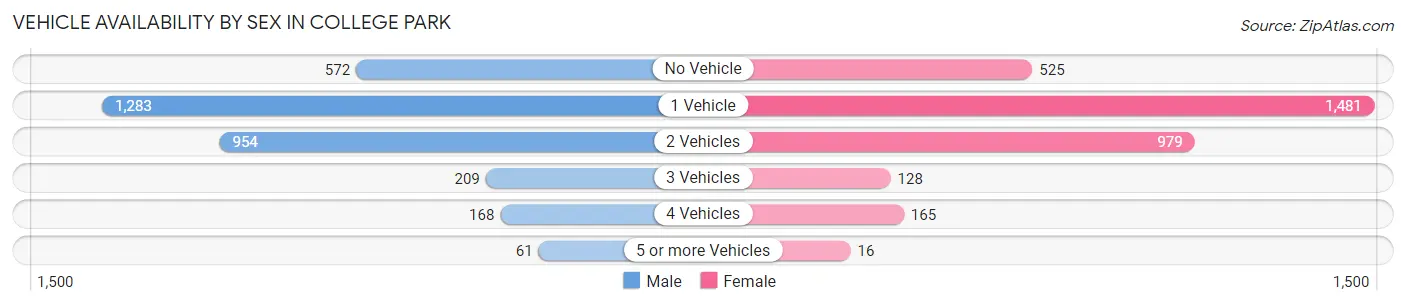
| Vehicles Available | Male | Female |
| No Vehicle | 572 (17.6%) | 525 (15.9%) |
| 1 Vehicle | 1,283 (39.5%) | 1,481 (45.0%) |
| 2 Vehicles | 954 (29.4%) | 979 (29.7%) |
| 3 Vehicles | 209 (6.4%) | 128 (3.9%) |
| 4 Vehicles | 168 (5.2%) | 165 (5.0%) |
| 5 or more Vehicles | 61 (1.9%) | 16 (0.5%) |
| Total | 3,247 (100.0%) | 3,294 (100.0%) |
Commute Time in College Park
The most frequently occuring commute durations in College Park are 15 to 19 minutes (1,192 commuters, 20.2%), 20 to 24 minutes (938 commuters, 15.9%), and 10 to 14 minutes (861 commuters, 14.6%).
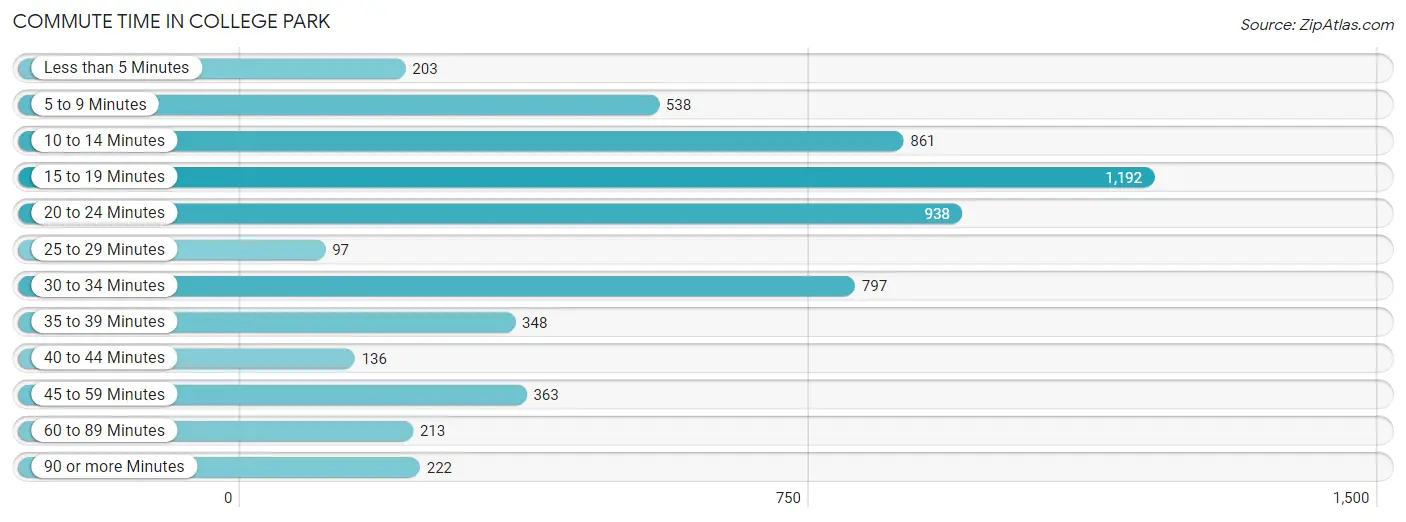
| Commute Time | # Commuters | % Commuters |
| Less than 5 Minutes | 203 | 3.4% |
| 5 to 9 Minutes | 538 | 9.1% |
| 10 to 14 Minutes | 861 | 14.6% |
| 15 to 19 Minutes | 1,192 | 20.2% |
| 20 to 24 Minutes | 938 | 15.9% |
| 25 to 29 Minutes | 97 | 1.6% |
| 30 to 34 Minutes | 797 | 13.5% |
| 35 to 39 Minutes | 348 | 5.9% |
| 40 to 44 Minutes | 136 | 2.3% |
| 45 to 59 Minutes | 363 | 6.1% |
| 60 to 89 Minutes | 213 | 3.6% |
| 90 or more Minutes | 222 | 3.8% |
Commute Time by Sex in College Park
The most common commute times in College Park are 20 to 24 minutes (726 commuters, 23.8%) for males and 15 to 19 minutes (646 commuters, 22.6%) for females.
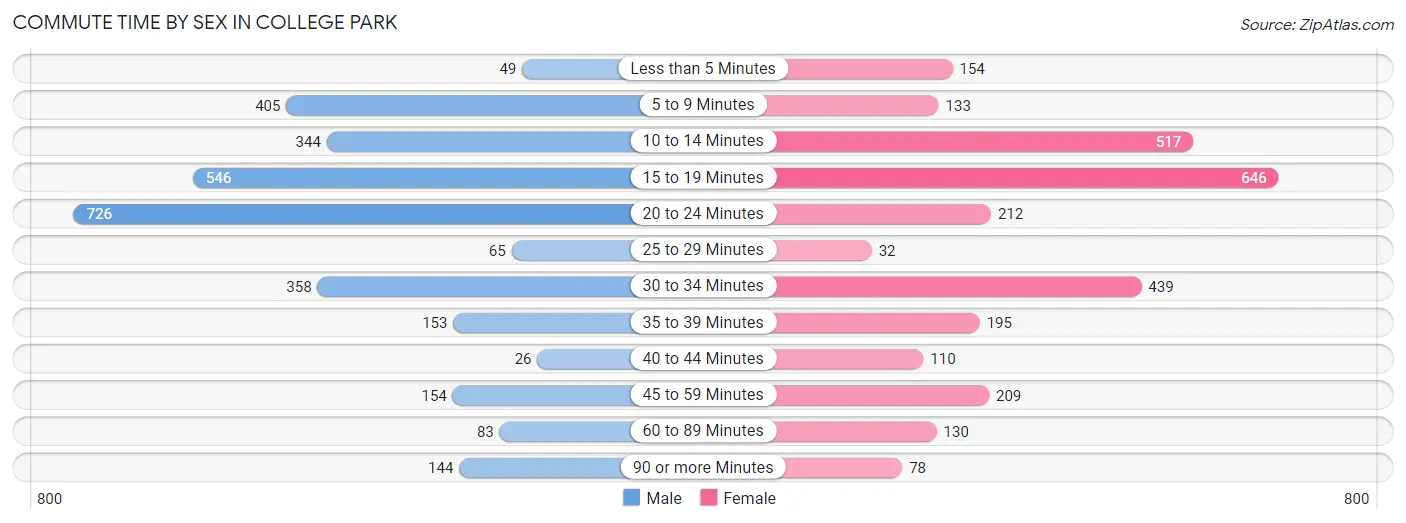
| Commute Time | Male | Female |
| Less than 5 Minutes | 49 (1.6%) | 154 (5.4%) |
| 5 to 9 Minutes | 405 (13.3%) | 133 (4.7%) |
| 10 to 14 Minutes | 344 (11.3%) | 517 (18.1%) |
| 15 to 19 Minutes | 546 (17.9%) | 646 (22.6%) |
| 20 to 24 Minutes | 726 (23.8%) | 212 (7.4%) |
| 25 to 29 Minutes | 65 (2.1%) | 32 (1.1%) |
| 30 to 34 Minutes | 358 (11.7%) | 439 (15.4%) |
| 35 to 39 Minutes | 153 (5.0%) | 195 (6.8%) |
| 40 to 44 Minutes | 26 (0.9%) | 110 (3.8%) |
| 45 to 59 Minutes | 154 (5.0%) | 209 (7.3%) |
| 60 to 89 Minutes | 83 (2.7%) | 130 (4.5%) |
| 90 or more Minutes | 144 (4.7%) | 78 (2.7%) |
Time of Departure to Work by Sex in College Park
The most frequent times of departure to work in College Park are 12:00 PM to 3:59 PM (452, 14.8%) for males and 7:00 AM to 7:29 AM (449, 15.7%) for females.
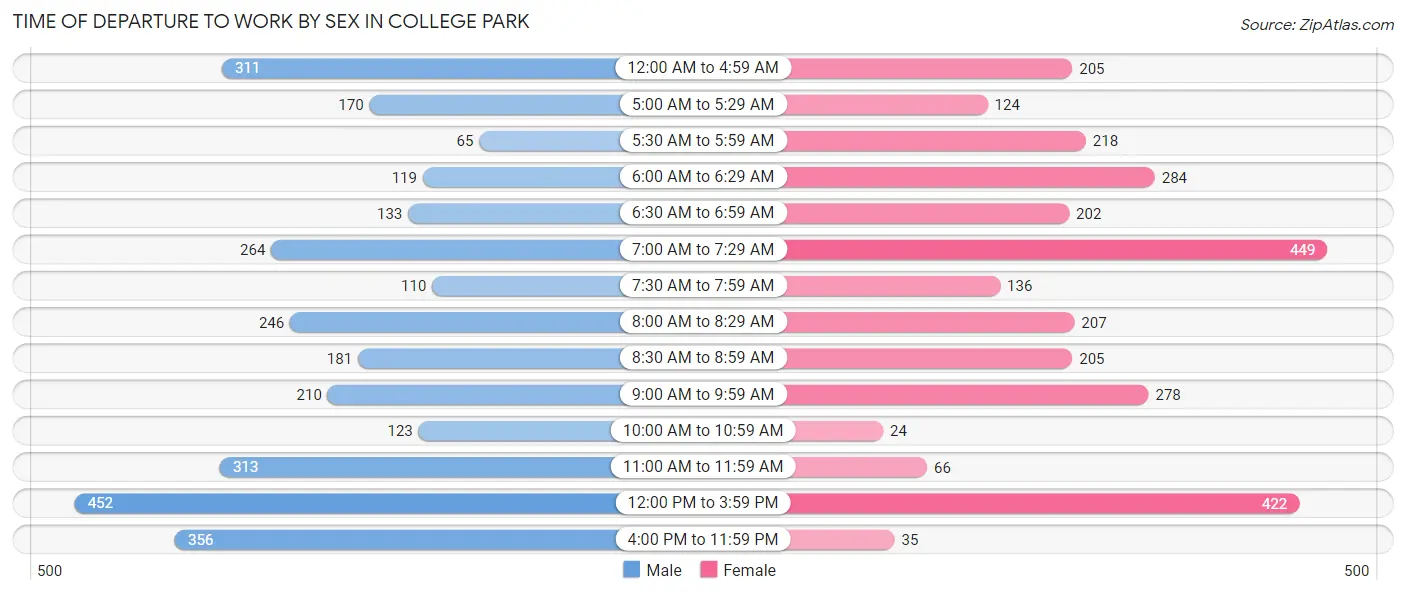
| Time of Departure | Male | Female |
| 12:00 AM to 4:59 AM | 311 (10.2%) | 205 (7.2%) |
| 5:00 AM to 5:29 AM | 170 (5.6%) | 124 (4.3%) |
| 5:30 AM to 5:59 AM | 65 (2.1%) | 218 (7.6%) |
| 6:00 AM to 6:29 AM | 119 (3.9%) | 284 (10.0%) |
| 6:30 AM to 6:59 AM | 133 (4.4%) | 202 (7.1%) |
| 7:00 AM to 7:29 AM | 264 (8.6%) | 449 (15.7%) |
| 7:30 AM to 7:59 AM | 110 (3.6%) | 136 (4.8%) |
| 8:00 AM to 8:29 AM | 246 (8.1%) | 207 (7.2%) |
| 8:30 AM to 8:59 AM | 181 (5.9%) | 205 (7.2%) |
| 9:00 AM to 9:59 AM | 210 (6.9%) | 278 (9.7%) |
| 10:00 AM to 10:59 AM | 123 (4.0%) | 24 (0.8%) |
| 11:00 AM to 11:59 AM | 313 (10.2%) | 66 (2.3%) |
| 12:00 PM to 3:59 PM | 452 (14.8%) | 422 (14.8%) |
| 4:00 PM to 11:59 PM | 356 (11.7%) | 35 (1.2%) |
| Total | 3,053 (100.0%) | 2,855 (100.0%) |
Housing Occupancy in College Park
Occupancy by Ownership in College Park
Of the total 6,016 dwellings in College Park, owner-occupied units account for 1,436 (23.9%), while renter-occupied units make up 4,580 (76.1%).
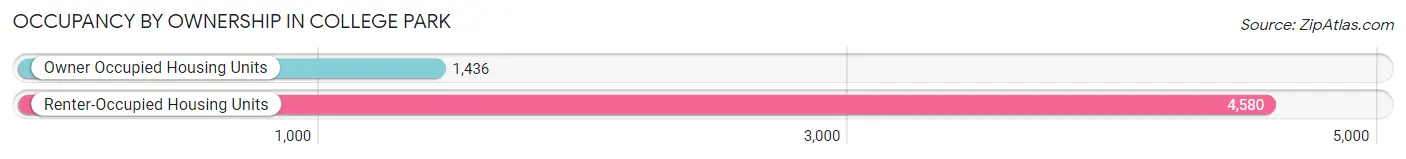
| Occupancy | # Housing Units | % Housing Units |
| Owner Occupied Housing Units | 1,436 | 23.9% |
| Renter-Occupied Housing Units | 4,580 | 76.1% |
| Total Occupied Housing Units | 6,016 | 100.0% |
Occupancy by Household Size in College Park
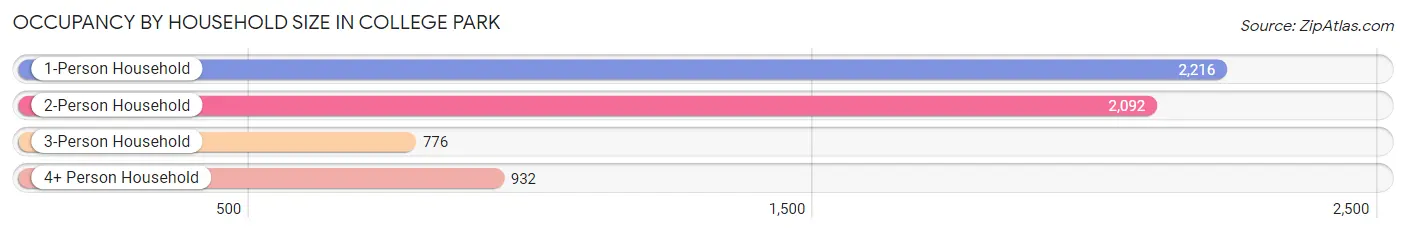
| Household Size | # Housing Units | % Housing Units |
| 1-Person Household | 2,216 | 36.8% |
| 2-Person Household | 2,092 | 34.8% |
| 3-Person Household | 776 | 12.9% |
| 4+ Person Household | 932 | 15.5% |
| Total Housing Units | 6,016 | 100.0% |
Occupancy by Ownership by Household Size in College Park
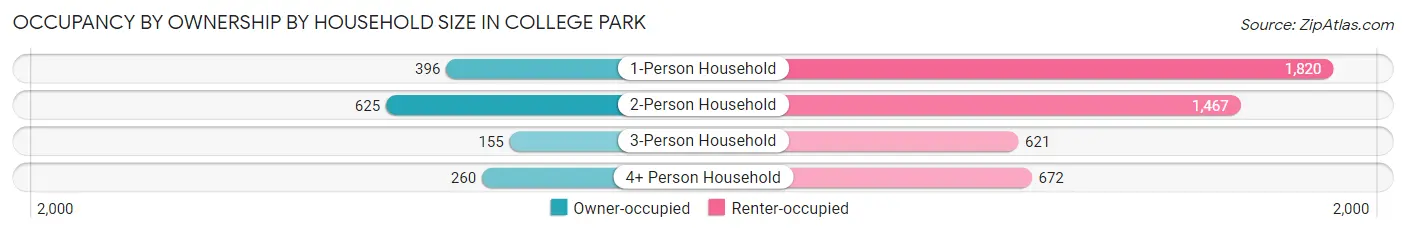
| Household Size | Owner-occupied | Renter-occupied |
| 1-Person Household | 396 (17.9%) | 1,820 (82.1%) |
| 2-Person Household | 625 (29.9%) | 1,467 (70.1%) |
| 3-Person Household | 155 (20.0%) | 621 (80.0%) |
| 4+ Person Household | 260 (27.9%) | 672 (72.1%) |
| Total Housing Units | 1,436 (23.9%) | 4,580 (76.1%) |
Occupancy by Educational Attainment in College Park
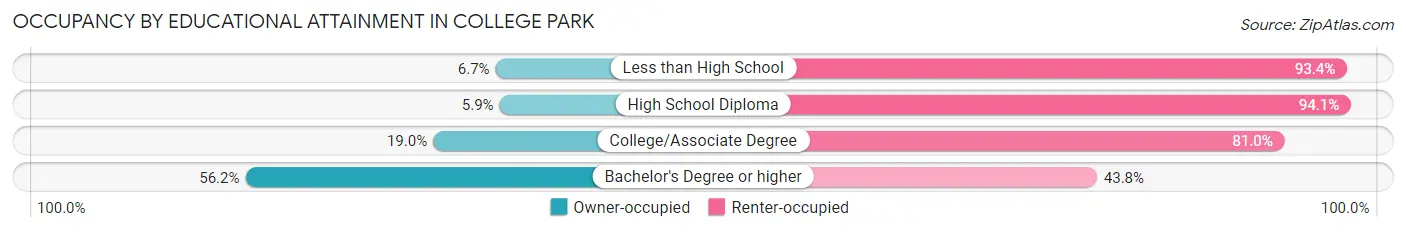
| Household Size | Owner-occupied | Renter-occupied |
| Less than High School | 36 (6.7%) | 505 (93.3%) |
| High School Diploma | 102 (5.9%) | 1,639 (94.1%) |
| College/Associate Degree | 410 (19.0%) | 1,745 (81.0%) |
| Bachelor's Degree or higher | 888 (56.2%) | 691 (43.8%) |
Occupancy by Age of Householder in College Park
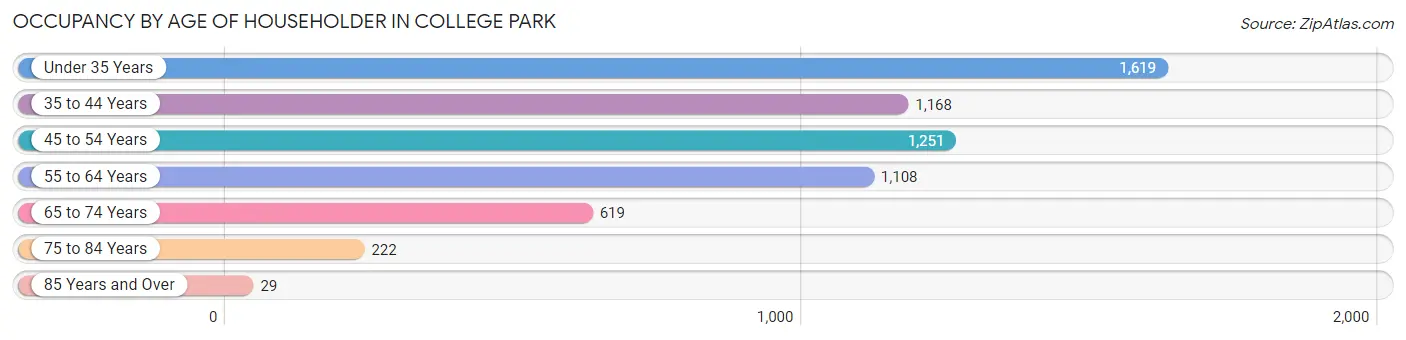
| Age Bracket | # Households | % Households |
| Under 35 Years | 1,619 | 26.9% |
| 35 to 44 Years | 1,168 | 19.4% |
| 45 to 54 Years | 1,251 | 20.8% |
| 55 to 64 Years | 1,108 | 18.4% |
| 65 to 74 Years | 619 | 10.3% |
| 75 to 84 Years | 222 | 3.7% |
| 85 Years and Over | 29 | 0.5% |
| Total | 6,016 | 100.0% |
Housing Finances in College Park
Median Income by Occupancy in College Park
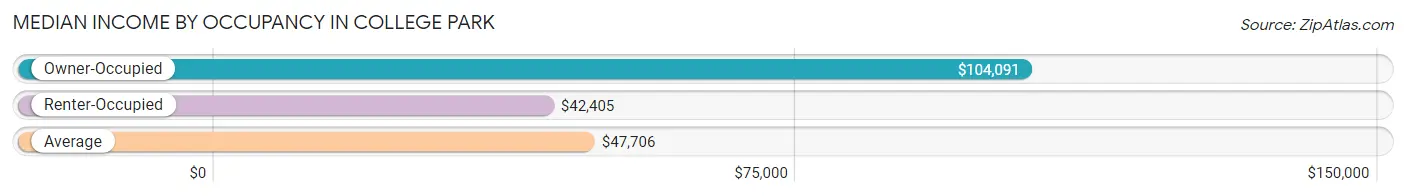
| Occupancy Type | # Households | Median Income |
| Owner-Occupied | 1,436 (23.9%) | $104,091 |
| Renter-Occupied | 4,580 (76.1%) | $42,405 |
| Average | 6,016 (100.0%) | $47,706 |
Occupancy by Householder Income Bracket in College Park
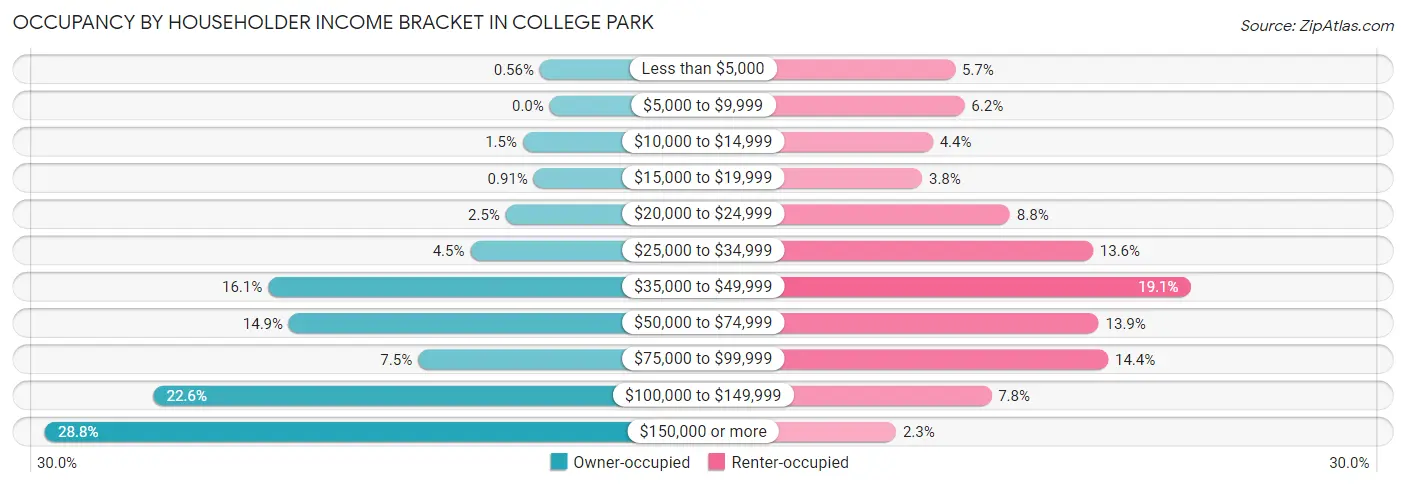
| Income Bracket | Owner-occupied | Renter-occupied |
| Less than $5,000 | 8 (0.6%) | 260 (5.7%) |
| $5,000 to $9,999 | 0 (0.0%) | 285 (6.2%) |
| $10,000 to $14,999 | 22 (1.5%) | 202 (4.4%) |
| $15,000 to $19,999 | 13 (0.9%) | 174 (3.8%) |
| $20,000 to $24,999 | 36 (2.5%) | 404 (8.8%) |
| $25,000 to $34,999 | 65 (4.5%) | 621 (13.6%) |
| $35,000 to $49,999 | 231 (16.1%) | 876 (19.1%) |
| $50,000 to $74,999 | 214 (14.9%) | 636 (13.9%) |
| $75,000 to $99,999 | 108 (7.5%) | 661 (14.4%) |
| $100,000 to $149,999 | 325 (22.6%) | 355 (7.7%) |
| $150,000 or more | 414 (28.8%) | 106 (2.3%) |
| Total | 1,436 (100.0%) | 4,580 (100.0%) |
Monthly Housing Cost Tiers in College Park
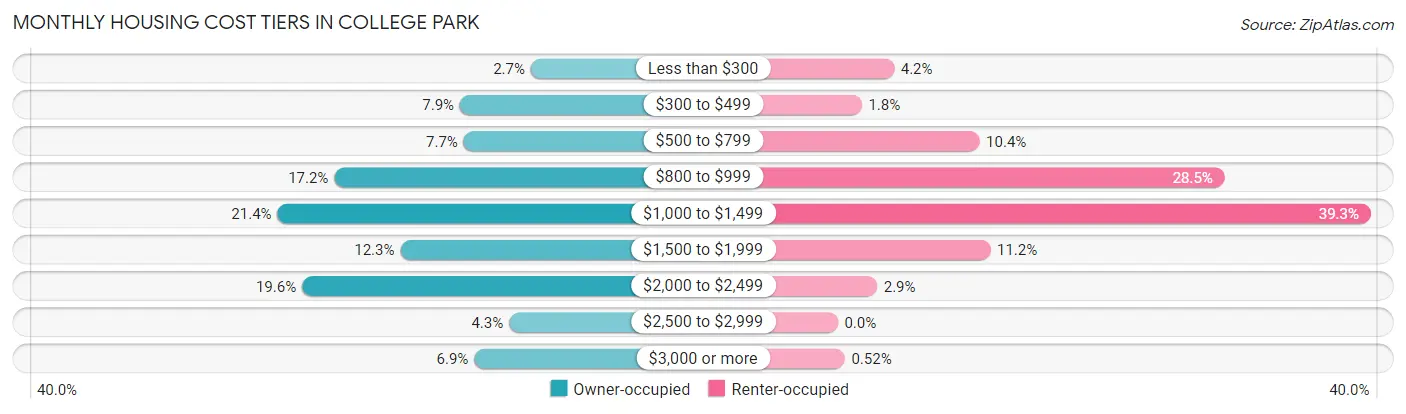
| Monthly Cost | Owner-occupied | Renter-occupied |
| Less than $300 | 39 (2.7%) | 190 (4.2%) |
| $300 to $499 | 114 (7.9%) | 81 (1.8%) |
| $500 to $799 | 110 (7.7%) | 478 (10.4%) |
| $800 to $999 | 247 (17.2%) | 1,306 (28.5%) |
| $1,000 to $1,499 | 307 (21.4%) | 1,799 (39.3%) |
| $1,500 to $1,999 | 177 (12.3%) | 515 (11.2%) |
| $2,000 to $2,499 | 281 (19.6%) | 133 (2.9%) |
| $2,500 to $2,999 | 62 (4.3%) | 0 (0.0%) |
| $3,000 or more | 99 (6.9%) | 24 (0.5%) |
| Total | 1,436 (100.0%) | 4,580 (100.0%) |
Physical Housing Characteristics in College Park
Housing Structures in College Park
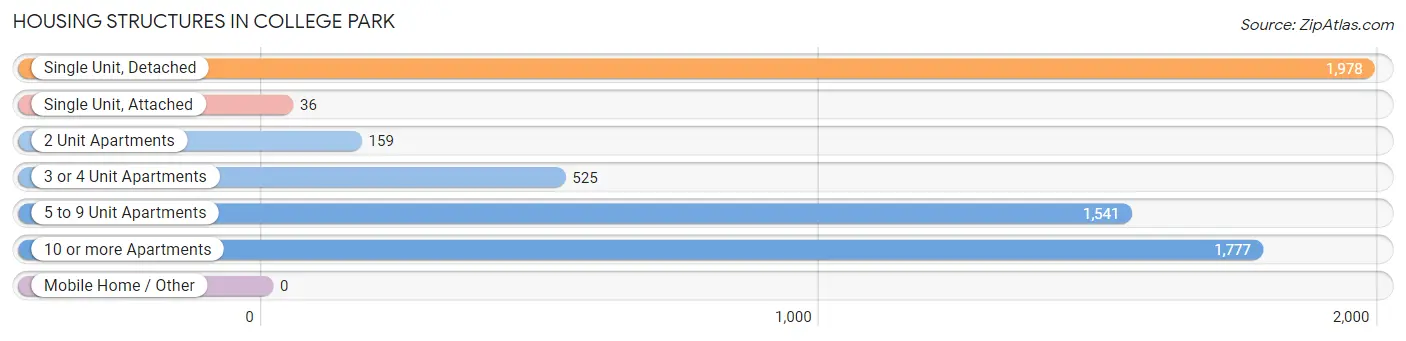
| Structure Type | # Housing Units | % Housing Units |
| Single Unit, Detached | 1,978 | 32.9% |
| Single Unit, Attached | 36 | 0.6% |
| 2 Unit Apartments | 159 | 2.6% |
| 3 or 4 Unit Apartments | 525 | 8.7% |
| 5 to 9 Unit Apartments | 1,541 | 25.6% |
| 10 or more Apartments | 1,777 | 29.5% |
| Mobile Home / Other | 0 | 0.0% |
| Total | 6,016 | 100.0% |
Housing Structures by Occupancy in College Park
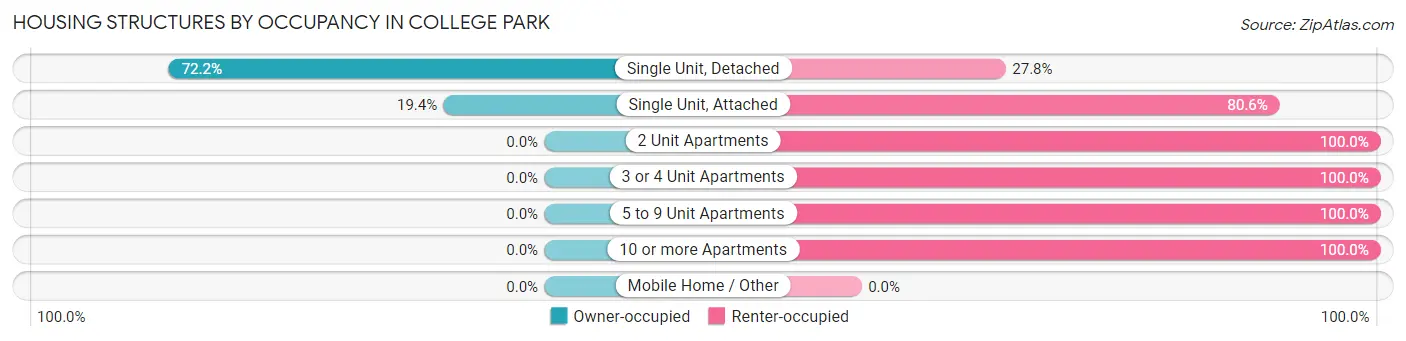
| Structure Type | Owner-occupied | Renter-occupied |
| Single Unit, Detached | 1,429 (72.2%) | 549 (27.8%) |
| Single Unit, Attached | 7 (19.4%) | 29 (80.6%) |
| 2 Unit Apartments | 0 (0.0%) | 159 (100.0%) |
| 3 or 4 Unit Apartments | 0 (0.0%) | 525 (100.0%) |
| 5 to 9 Unit Apartments | 0 (0.0%) | 1,541 (100.0%) |
| 10 or more Apartments | 0 (0.0%) | 1,777 (100.0%) |
| Mobile Home / Other | 0 (0.0%) | 0 (0.0%) |
| Total | 1,436 (23.9%) | 4,580 (76.1%) |
Housing Structures by Number of Rooms in College Park
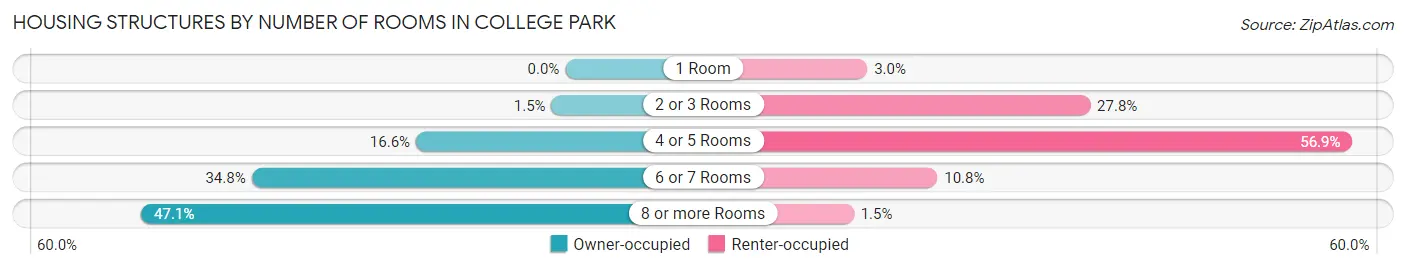
| Number of Rooms | Owner-occupied | Renter-occupied |
| 1 Room | 0 (0.0%) | 139 (3.0%) |
| 2 or 3 Rooms | 22 (1.5%) | 1,272 (27.8%) |
| 4 or 5 Rooms | 238 (16.6%) | 2,604 (56.9%) |
| 6 or 7 Rooms | 500 (34.8%) | 495 (10.8%) |
| 8 or more Rooms | 676 (47.1%) | 70 (1.5%) |
| Total | 1,436 (100.0%) | 4,580 (100.0%) |
Housing Structure by Heating Type in College Park
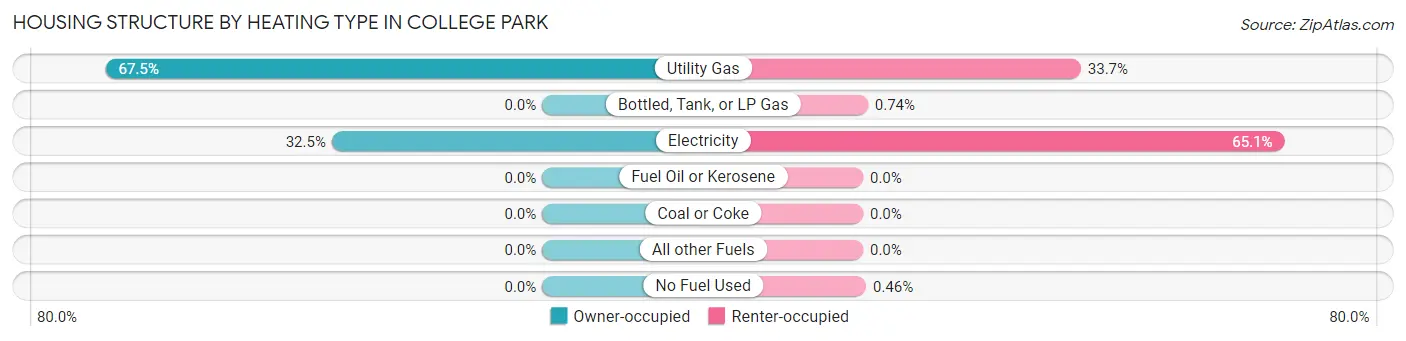
| Heating Type | Owner-occupied | Renter-occupied |
| Utility Gas | 969 (67.5%) | 1,542 (33.7%) |
| Bottled, Tank, or LP Gas | 0 (0.0%) | 34 (0.7%) |
| Electricity | 467 (32.5%) | 2,983 (65.1%) |
| Fuel Oil or Kerosene | 0 (0.0%) | 0 (0.0%) |
| Coal or Coke | 0 (0.0%) | 0 (0.0%) |
| All other Fuels | 0 (0.0%) | 0 (0.0%) |
| No Fuel Used | 0 (0.0%) | 21 (0.5%) |
| Total | 1,436 (100.0%) | 4,580 (100.0%) |
Household Vehicle Usage in College Park
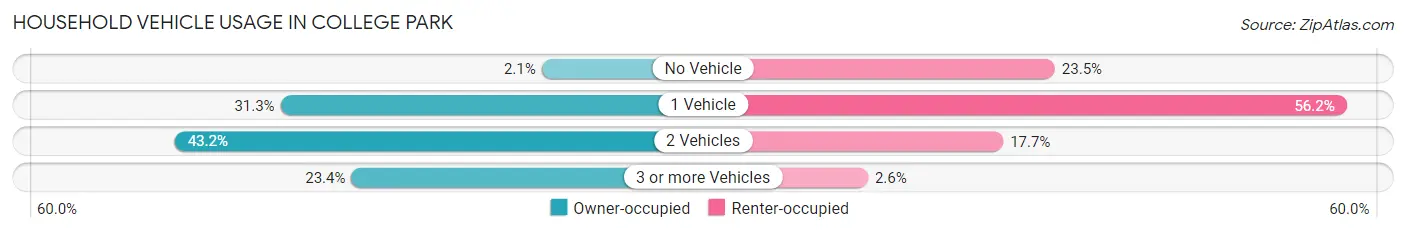
| Vehicles per Household | Owner-occupied | Renter-occupied |
| No Vehicle | 30 (2.1%) | 1,077 (23.5%) |
| 1 Vehicle | 450 (31.3%) | 2,573 (56.2%) |
| 2 Vehicles | 620 (43.2%) | 812 (17.7%) |
| 3 or more Vehicles | 336 (23.4%) | 118 (2.6%) |
| Total | 1,436 (100.0%) | 4,580 (100.0%) |
Real Estate & Mortgages in College Park
Real Estate and Mortgage Overview in College Park
| Characteristic | Without Mortgage | With Mortgage |
| Housing Units | 357 | 1,079 |
| Median Property Value | $286,300 | $287,000 |
| Median Household Income | $108,472 | $260 |
| Monthly Housing Costs | $562 | $99 |
| Real Estate Taxes | - | - |
Property Value by Mortgage Status in College Park
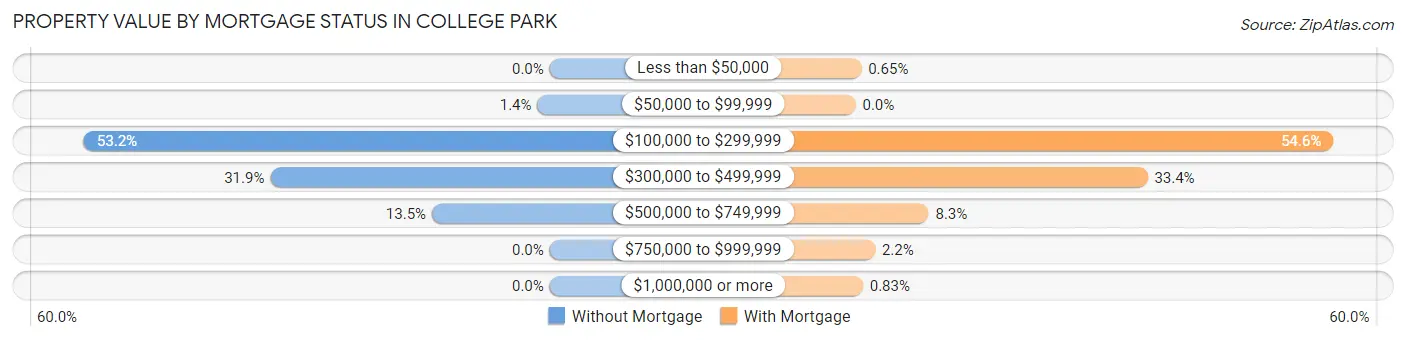
| Property Value | Without Mortgage | With Mortgage |
| Less than $50,000 | 0 (0.0%) | 7 (0.6%) |
| $50,000 to $99,999 | 5 (1.4%) | 0 (0.0%) |
| $100,000 to $299,999 | 190 (53.2%) | 589 (54.6%) |
| $300,000 to $499,999 | 114 (31.9%) | 360 (33.4%) |
| $500,000 to $749,999 | 48 (13.5%) | 90 (8.3%) |
| $750,000 to $999,999 | 0 (0.0%) | 24 (2.2%) |
| $1,000,000 or more | 0 (0.0%) | 9 (0.8%) |
| Total | 357 (100.0%) | 1,079 (100.0%) |
Household Income by Mortgage Status in College Park
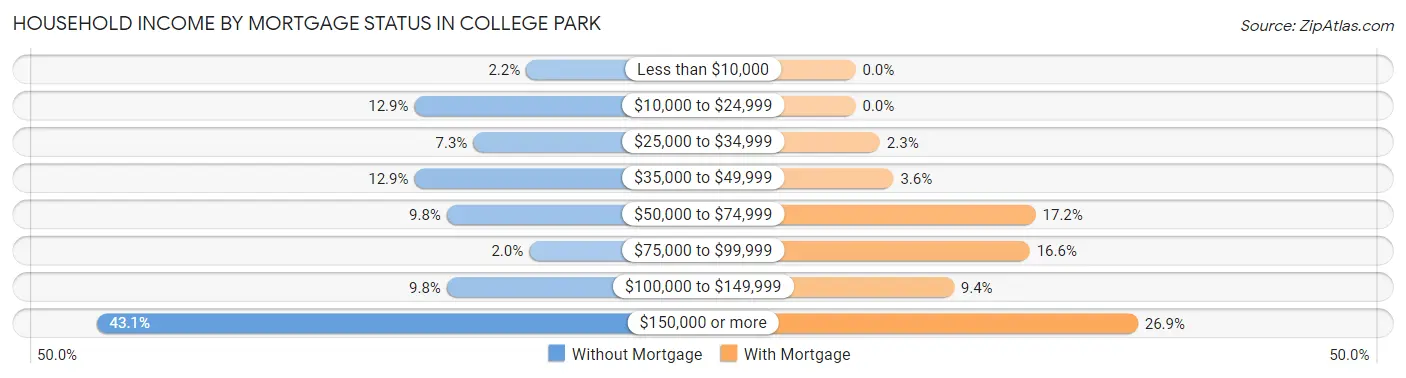
| Household Income | Without Mortgage | With Mortgage |
| Less than $10,000 | 8 (2.2%) | 0 (0.0%) |
| $10,000 to $24,999 | 46 (12.9%) | 0 (0.0%) |
| $25,000 to $34,999 | 26 (7.3%) | 25 (2.3%) |
| $35,000 to $49,999 | 46 (12.9%) | 39 (3.6%) |
| $50,000 to $74,999 | 35 (9.8%) | 185 (17.2%) |
| $75,000 to $99,999 | 7 (2.0%) | 179 (16.6%) |
| $100,000 to $149,999 | 35 (9.8%) | 101 (9.4%) |
| $150,000 or more | 154 (43.1%) | 290 (26.9%) |
| Total | 357 (100.0%) | 1,079 (100.0%) |
Property Value to Household Income Ratio in College Park
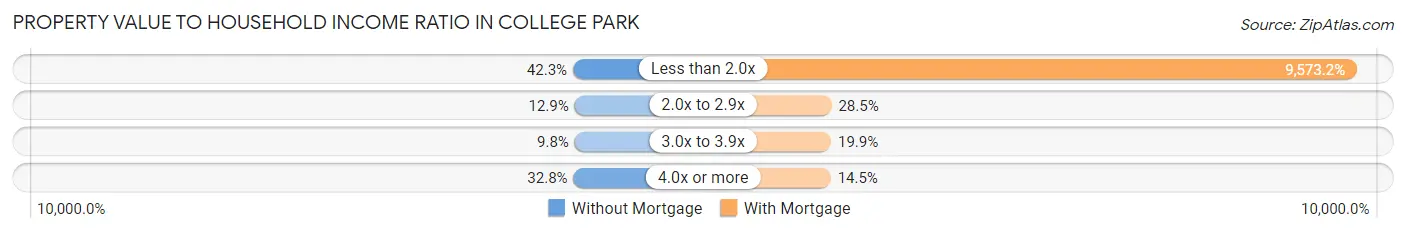
| Value-to-Income Ratio | Without Mortgage | With Mortgage |
| Less than 2.0x | 151 (42.3%) | 103,295 (9,573.2%) |
| 2.0x to 2.9x | 46 (12.9%) | 308 (28.5%) |
| 3.0x to 3.9x | 35 (9.8%) | 215 (19.9%) |
| 4.0x or more | 117 (32.8%) | 156 (14.5%) |
| Total | 357 (100.0%) | 1,079 (100.0%) |
Real Estate Taxes by Mortgage Status in College Park
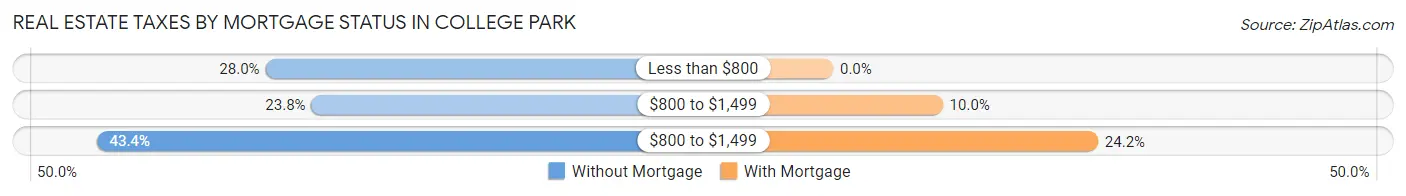
| Property Taxes | Without Mortgage | With Mortgage |
| Less than $800 | 100 (28.0%) | 0 (0.0%) |
| $800 to $1,499 | 85 (23.8%) | 108 (10.0%) |
| $800 to $1,499 | 155 (43.4%) | 261 (24.2%) |
| Total | 357 (100.0%) | 1,079 (100.0%) |
Health & Disability in College Park
Health Insurance Coverage by Age in College Park
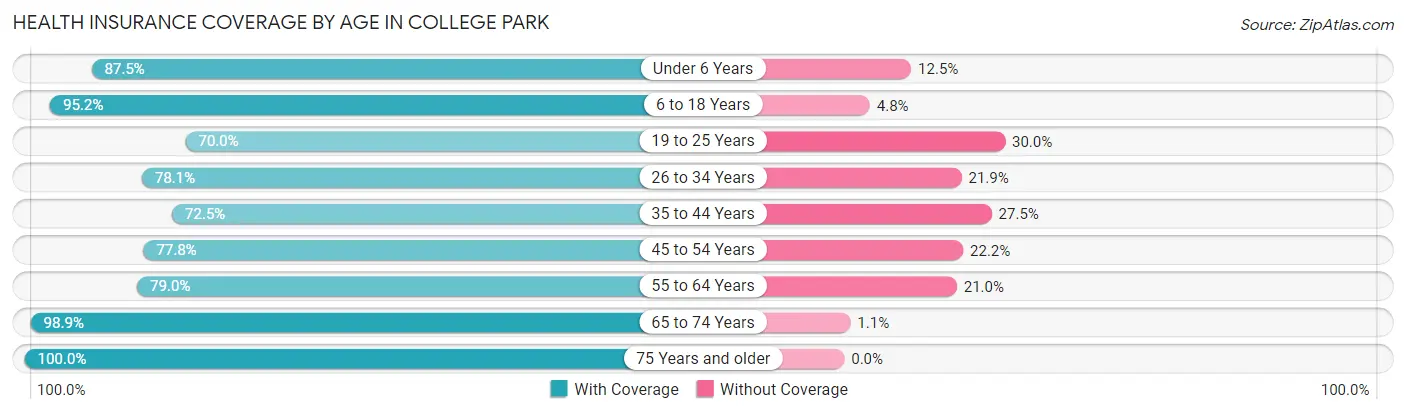
| Age Bracket | With Coverage | Without Coverage |
| Under 6 Years | 941 (87.5%) | 134 (12.5%) |
| 6 to 18 Years | 2,781 (95.2%) | 139 (4.8%) |
| 19 to 25 Years | 855 (70.0%) | 366 (30.0%) |
| 26 to 34 Years | 1,952 (78.1%) | 546 (21.9%) |
| 35 to 44 Years | 1,198 (72.5%) | 454 (27.5%) |
| 45 to 54 Years | 1,612 (77.8%) | 459 (22.2%) |
| 55 to 64 Years | 1,209 (79.0%) | 321 (21.0%) |
| 65 to 74 Years | 783 (98.9%) | 9 (1.1%) |
| 75 Years and older | 328 (100.0%) | 0 (0.0%) |
| Total | 11,659 (82.8%) | 2,428 (17.2%) |
Health Insurance Coverage by Citizenship Status in College Park
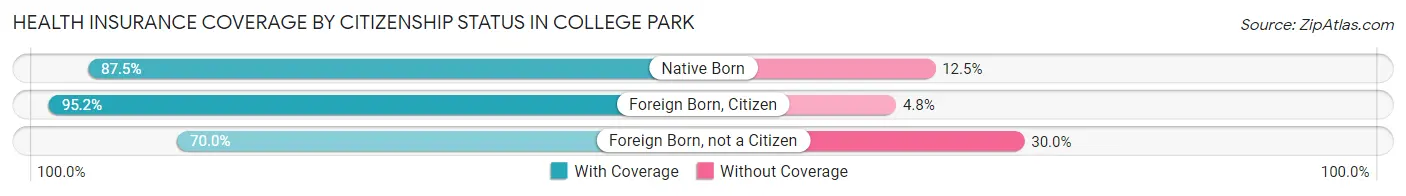
| Citizenship Status | With Coverage | Without Coverage |
| Native Born | 941 (87.5%) | 134 (12.5%) |
| Foreign Born, Citizen | 2,781 (95.2%) | 139 (4.8%) |
| Foreign Born, not a Citizen | 855 (70.0%) | 366 (30.0%) |
Health Insurance Coverage by Household Income in College Park
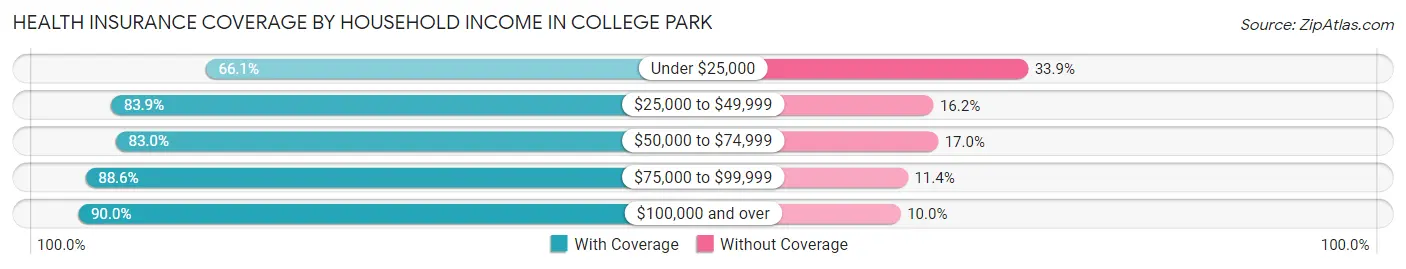
| Household Income | With Coverage | Without Coverage |
| Under $25,000 | 1,700 (66.1%) | 872 (33.9%) |
| $25,000 to $49,999 | 3,048 (83.9%) | 587 (16.2%) |
| $50,000 to $74,999 | 1,757 (83.0%) | 361 (17.0%) |
| $75,000 to $99,999 | 2,066 (88.6%) | 265 (11.4%) |
| $100,000 and over | 3,085 (90.0%) | 343 (10.0%) |
Public vs Private Health Insurance Coverage by Age in College Park
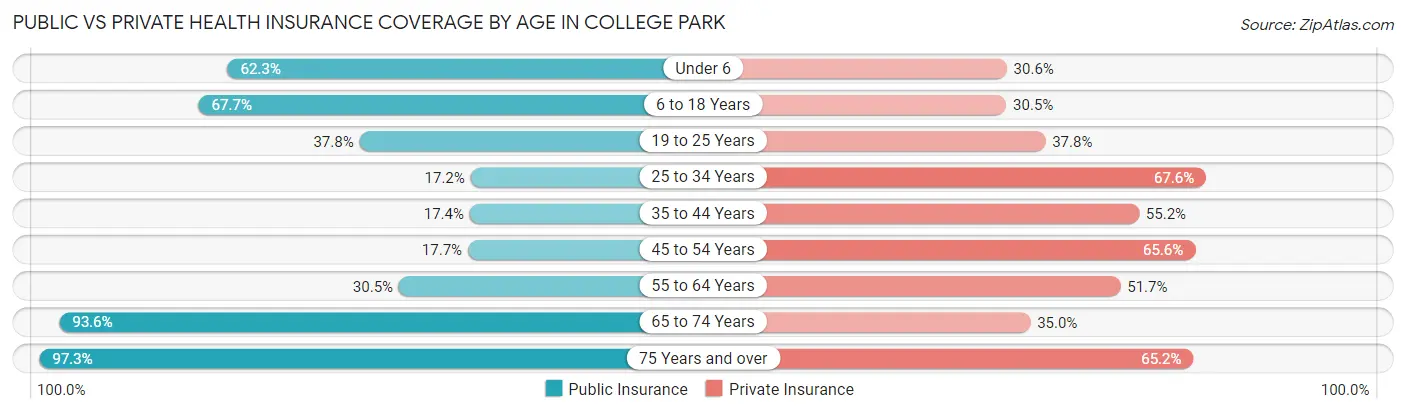
| Age Bracket | Public Insurance | Private Insurance |
| Under 6 | 670 (62.3%) | 329 (30.6%) |
| 6 to 18 Years | 1,977 (67.7%) | 891 (30.5%) |
| 19 to 25 Years | 462 (37.8%) | 461 (37.8%) |
| 25 to 34 Years | 430 (17.2%) | 1,689 (67.6%) |
| 35 to 44 Years | 287 (17.4%) | 911 (55.1%) |
| 45 to 54 Years | 367 (17.7%) | 1,358 (65.6%) |
| 55 to 64 Years | 467 (30.5%) | 791 (51.7%) |
| 65 to 74 Years | 741 (93.6%) | 277 (35.0%) |
| 75 Years and over | 319 (97.3%) | 214 (65.2%) |
| Total | 5,720 (40.6%) | 6,921 (49.1%) |
Disability Status by Sex by Age in College Park
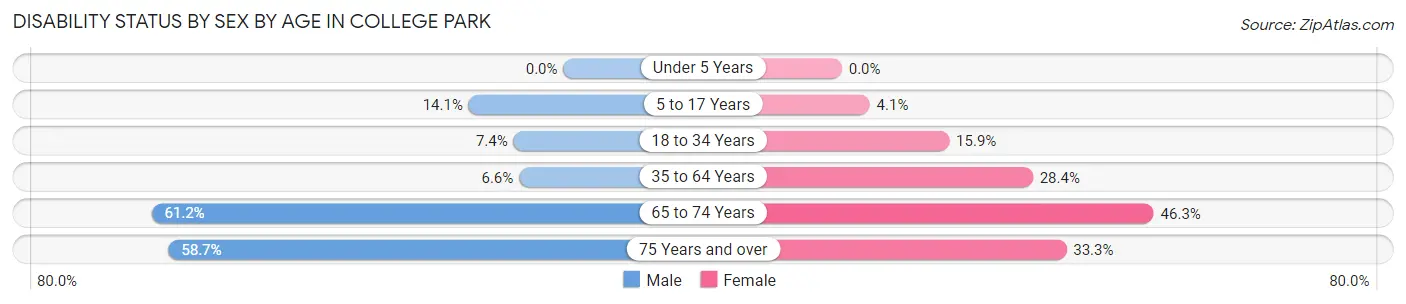
| Age Bracket | Male | Female |
| Under 5 Years | 0 (0.0%) | 0 (0.0%) |
| 5 to 17 Years | 182 (14.1%) | 60 (4.1%) |
| 18 to 34 Years | 138 (7.4%) | 338 (15.9%) |
| 35 to 64 Years | 162 (6.6%) | 790 (28.3%) |
| 65 to 74 Years | 211 (61.2%) | 207 (46.3%) |
| 75 Years and over | 78 (58.7%) | 65 (33.3%) |
Disability Class by Sex by Age in College Park
Disability Class: Hearing Difficulty
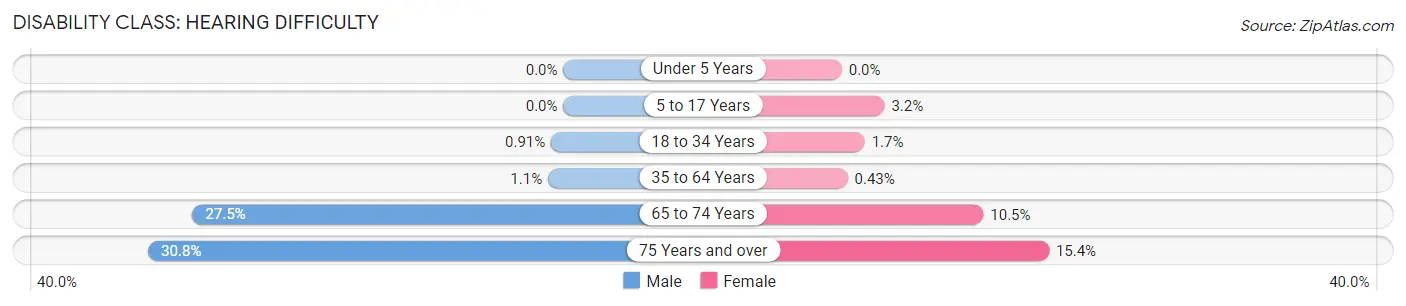
| Age Bracket | Male | Female |
| Under 5 Years | 0 (0.0%) | 0 (0.0%) |
| 5 to 17 Years | 0 (0.0%) | 46 (3.2%) |
| 18 to 34 Years | 17 (0.9%) | 36 (1.7%) |
| 35 to 64 Years | 28 (1.1%) | 12 (0.4%) |
| 65 to 74 Years | 95 (27.5%) | 47 (10.5%) |
| 75 Years and over | 41 (30.8%) | 30 (15.4%) |
Disability Class: Vision Difficulty
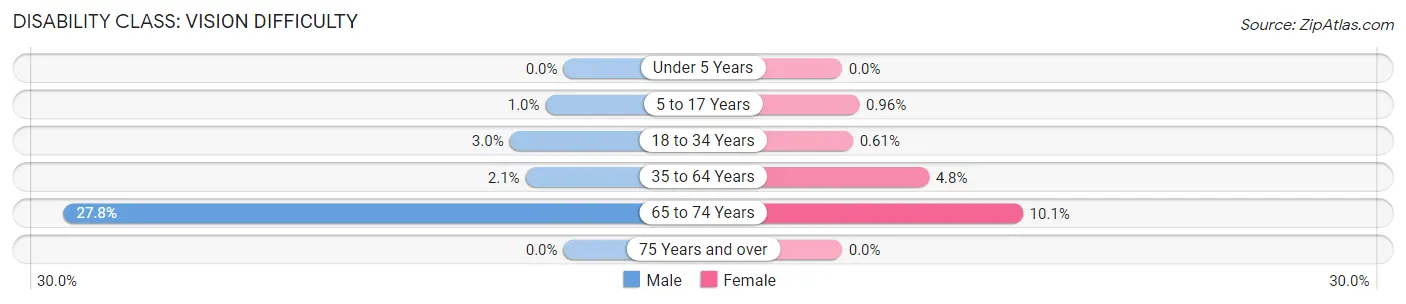
| Age Bracket | Male | Female |
| Under 5 Years | 0 (0.0%) | 0 (0.0%) |
| 5 to 17 Years | 13 (1.0%) | 14 (1.0%) |
| 18 to 34 Years | 56 (3.0%) | 13 (0.6%) |
| 35 to 64 Years | 52 (2.1%) | 135 (4.8%) |
| 65 to 74 Years | 96 (27.8%) | 45 (10.1%) |
| 75 Years and over | 0 (0.0%) | 0 (0.0%) |
Disability Class: Cognitive Difficulty
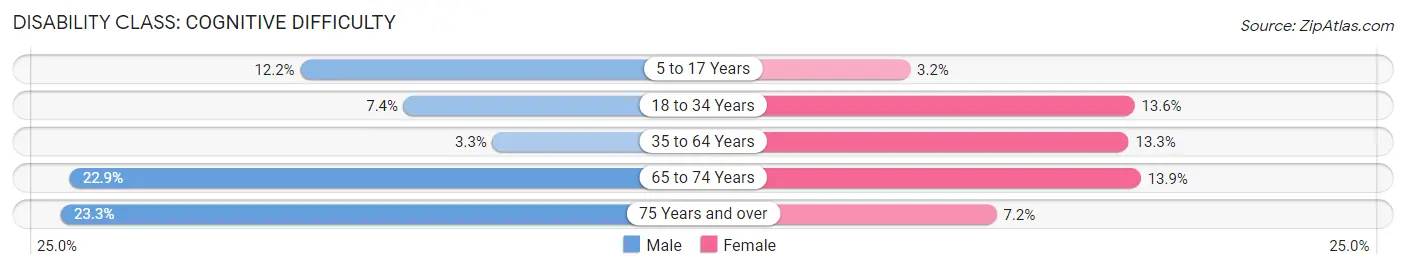
| Age Bracket | Male | Female |
| 5 to 17 Years | 158 (12.2%) | 46 (3.2%) |
| 18 to 34 Years | 138 (7.4%) | 288 (13.6%) |
| 35 to 64 Years | 81 (3.3%) | 371 (13.3%) |
| 65 to 74 Years | 79 (22.9%) | 62 (13.9%) |
| 75 Years and over | 31 (23.3%) | 14 (7.2%) |
Disability Class: Ambulatory Difficulty
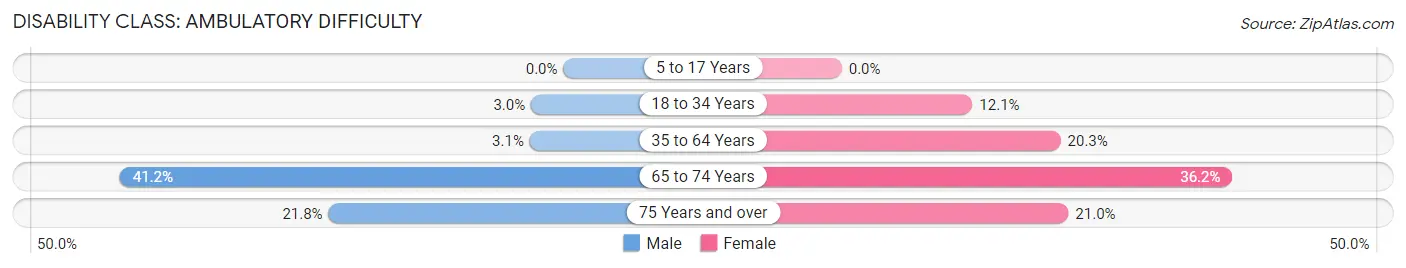
| Age Bracket | Male | Female |
| 5 to 17 Years | 0 (0.0%) | 0 (0.0%) |
| 18 to 34 Years | 56 (3.0%) | 257 (12.1%) |
| 35 to 64 Years | 77 (3.1%) | 566 (20.3%) |
| 65 to 74 Years | 142 (41.2%) | 162 (36.2%) |
| 75 Years and over | 29 (21.8%) | 41 (21.0%) |
Disability Class: Self-Care Difficulty
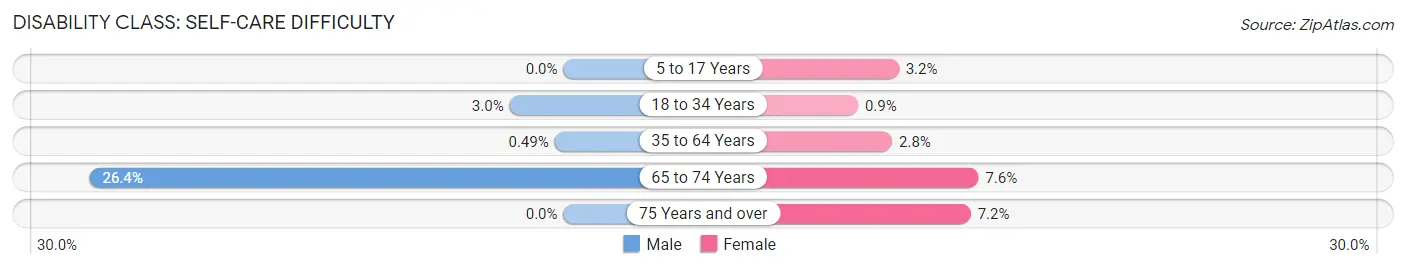
| Age Bracket | Male | Female |
| 5 to 17 Years | 0 (0.0%) | 46 (3.2%) |
| 18 to 34 Years | 56 (3.0%) | 19 (0.9%) |
| 35 to 64 Years | 12 (0.5%) | 78 (2.8%) |
| 65 to 74 Years | 91 (26.4%) | 34 (7.6%) |
| 75 Years and over | 0 (0.0%) | 14 (7.2%) |
Technology Access in College Park
Computing Device Access in College Park
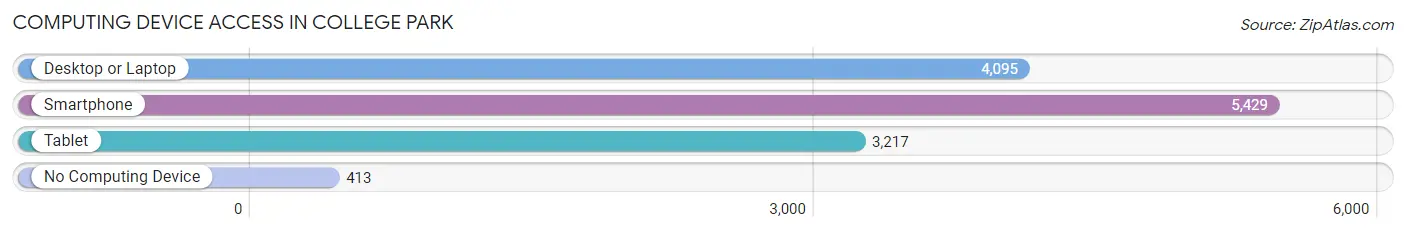
| Device Type | # Households | % Households |
| Desktop or Laptop | 4,095 | 68.1% |
| Smartphone | 5,429 | 90.2% |
| Tablet | 3,217 | 53.5% |
| No Computing Device | 413 | 6.9% |
| Total | 6,016 | 100.0% |
Internet Access in College Park
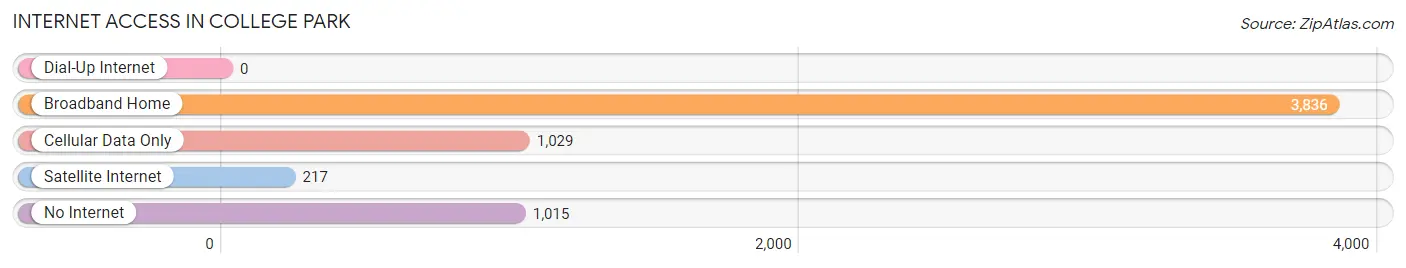
| Internet Type | # Households | % Households |
| Dial-Up Internet | 0 | 0.0% |
| Broadband Home | 3,836 | 63.8% |
| Cellular Data Only | 1,029 | 17.1% |
| Satellite Internet | 217 | 3.6% |
| No Internet | 1,015 | 16.9% |
| Total | 6,016 | 100.0% |
College Park Summary
History
The city of College Park, Georgia is located in the southern part of Fulton County, just south of the city of Atlanta. It is the oldest city in the county, having been founded in 1890. The city was named after the nearby Atlanta Baptist College, which was founded in 1877. The college was later renamed to Morehouse College, and is now a historically black college.
The city of College Park was originally a small farming community, but it began to grow rapidly in the early 20th century. The city was incorporated in 1908, and the population grew from just over 500 people in 1910 to over 5,000 by 1930. The city was a popular destination for African Americans who were looking for a place to live and work during the Great Migration.
The city continued to grow throughout the 20th century, and by 2000, the population had grown to over 20,000 people. The city has become a popular destination for people looking to live close to the city of Atlanta, but still have a small-town feel.
Geography
College Park is located in the southern part of Fulton County, just south of the city of Atlanta. It is bordered by the cities of East Point, Hapeville, and Union City. The city is situated on the banks of the Chattahoochee River, and is located in the Piedmont region of Georgia.
The city has a total area of 8.3 square miles, of which 8.2 square miles is land and 0.1 square miles is water. The city is located at an elevation of 845 feet above sea level.
Economy
The economy of College Park is largely based on the service industry. The city is home to several large companies, including Delta Air Lines, which has its headquarters in the city. Other major employers in the city include the U.S. Postal Service, the Federal Aviation Administration, and the Atlanta-Fulton County Airport.
The city also has a thriving retail sector, with several large shopping centers and malls located in the city. The city is also home to several large hotels, including the Marriott Atlanta Airport and the Renaissance Atlanta Airport Gateway Hotel.
Demographics
As of the 2010 census, the population of College Park was 21,942. The racial makeup of the city was 57.2% African American, 33.3% White, 4.2% Hispanic or Latino, 2.2% Asian, and 0.3% Native American.
The median household income in the city was $37,845, and the median family income was $45,845. The per capita income in the city was $20,845. The poverty rate in the city was 22.3%.
Conclusion
College Park, Georgia is a city located in the southern part of Fulton County, just south of the city of Atlanta. It is the oldest city in the county, having been founded in 1890. The city has a population of over 20,000 people, and is a popular destination for people looking to live close to the city of Atlanta, but still have a small-town feel. The economy of College Park is largely based on the service industry, and the city is home to several large companies, including Delta Air Lines. The racial makeup of the city is 57.2% African American, 33.3% White, 4.2% Hispanic or Latino, 2.2% Asian, and 0.3% Native American. The median household income in the city was $37,845, and the poverty rate was 22.3%.
Common Questions
What is Per Capita Income in College Park?
Per Capita income in College Park is $32,004.
What is the Median Family Income in College Park?
Median Family Income in College Park is $59,292.
What is the Median Household income in College Park?
Median Household Income in College Park is $47,706.
What is Income or Wage Gap in College Park?
Income or Wage Gap in College Park is 13.6%.
Women in College Park earn 86.4 cents for every dollar earned by a man.
What is Inequality or Gini Index in College Park?
Inequality or Gini Index in College Park is 0.51.
What is the Total Population of College Park?
Total Population of College Park is 14,113.
What is the Total Male Population of College Park?
Total Male Population of College Park is 6,616.
What is the Total Female Population of College Park?
Total Female Population of College Park is 7,497.
What is the Ratio of Males per 100 Females in College Park?
There are 88.25 Males per 100 Females in College Park.
What is the Ratio of Females per 100 Males in College Park?
There are 113.32 Females per 100 Males in College Park.
What is the Median Population Age in College Park?
Median Population Age in College Park is 32.2 Years.
What is the Average Family Size in College Park
Average Family Size in College Park is 3.3 People.
What is the Average Household Size in College Park
Average Household Size in College Park is 2.3 People.
How Large is the Labor Force in College Park?
There are 7,838 People in the Labor Forcein in College Park.
What is the Percentage of People in the Labor Force in College Park?
72.6% of People are in the Labor Force in College Park.
What is the Unemployment Rate in College Park?
Unemployment Rate in College Park is 13.0%.