Blakely, GA Map & Demographics
Blakely Map
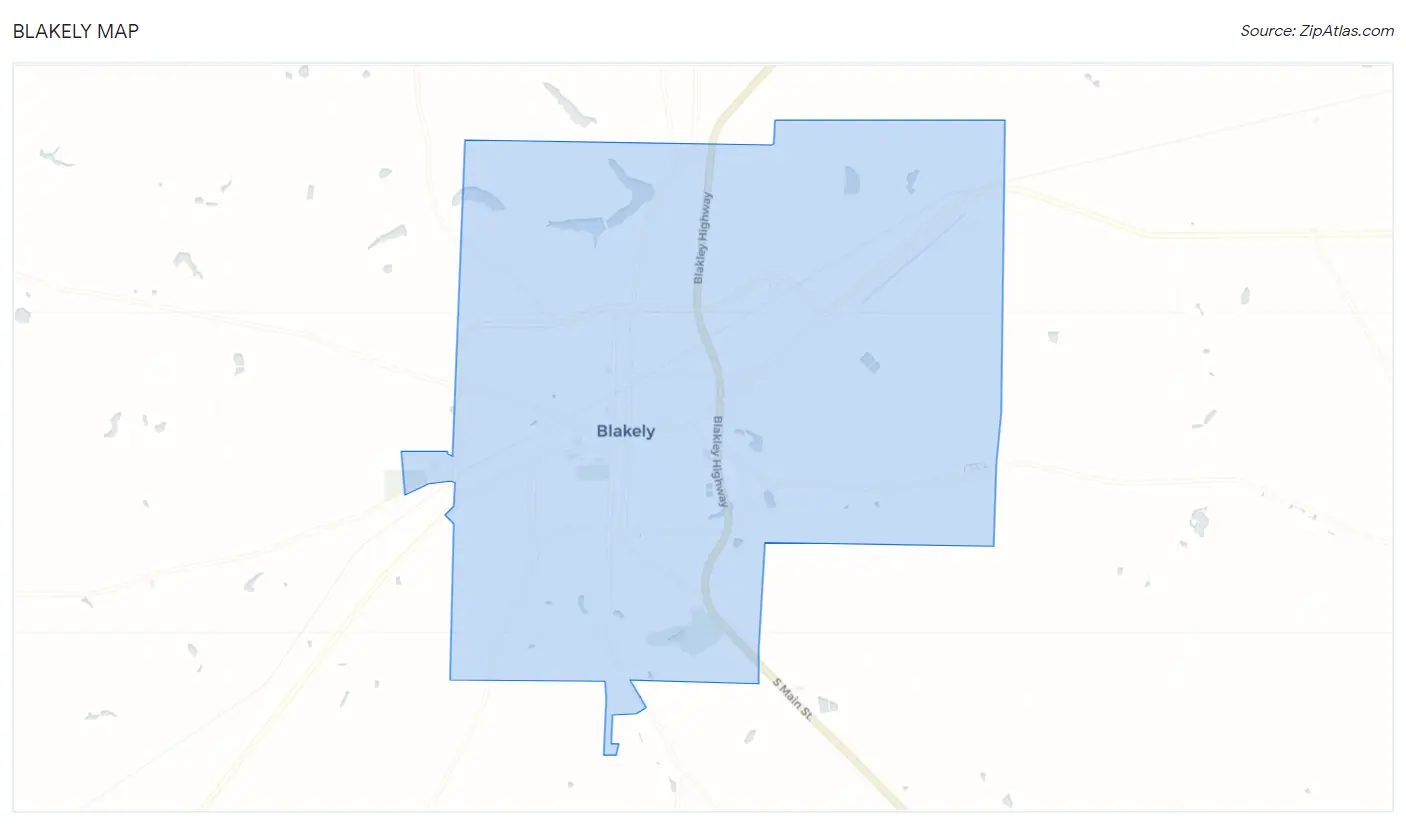
Blakely Overview
$17,779
PER CAPITA INCOME
$53,906
AVG FAMILY INCOME
$43,008
AVG HOUSEHOLD INCOME
30.4%
WAGE / INCOME GAP [ % ]
69.6¢/ $1
WAGE / INCOME GAP [ $ ]
$12,506
FAMILY INCOME DEFICIT
0.42
INEQUALITY / GINI INDEX
5,299
TOTAL POPULATION
2,274
MALE POPULATION
3,025
FEMALE POPULATION
75.17
MALES / 100 FEMALES
133.03
FEMALES / 100 MALES
31.5
MEDIAN AGE
3.7
AVG FAMILY SIZE
3.2
AVG HOUSEHOLD SIZE
2,231
LABOR FORCE [ PEOPLE ]
57.5%
PERCENT IN LABOR FORCE
5.6%
UNEMPLOYMENT RATE
Blakely Zip Codes
Blakely Area Codes
Income in Blakely
Income Overview in Blakely
Per Capita Income in Blakely is $17,779, while median incomes of families and households are $53,906 and $43,008 respectively.
| Characteristic | Number | Measure |
| Per Capita Income | 5,299 | $17,779 |
| Median Family Income | 1,236 | $53,906 |
| Mean Family Income | 1,236 | $60,594 |
| Median Household Income | 1,610 | $43,008 |
| Mean Household Income | 1,610 | $54,095 |
| Income Deficit | 1,236 | $12,506 |
| Wage / Income Gap (%) | 5,299 | 30.39% |
| Wage / Income Gap ($) | 5,299 | 69.61¢ per $1 |
| Gini / Inequality Index | 5,299 | 0.42 |
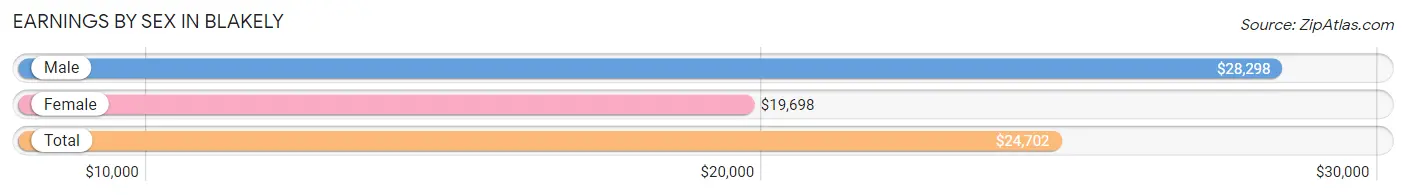
Earnings by Sex in Blakely
Average Earnings in Blakely are $24,702, $28,298 for men and $19,698 for women, a difference of 30.4%.
| Sex | Number | Average Earnings |
| Male | 967 (41.3%) | $28,298 |
| Female | 1,373 (58.7%) | $19,698 |
| Total | 2,340 (100.0%) | $24,702 |
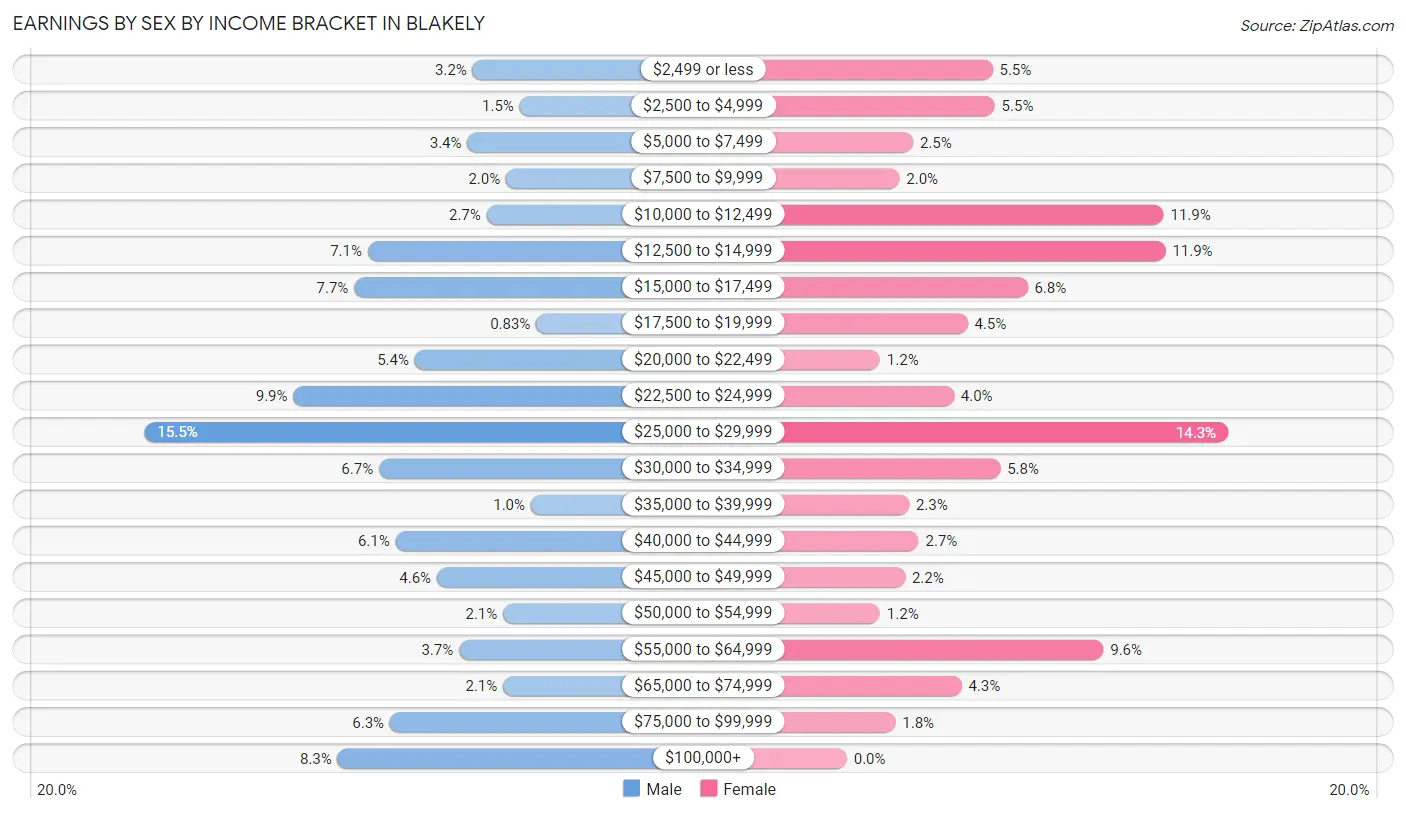
Earnings by Sex by Income Bracket in Blakely
The most common earnings brackets in Blakely are $25,000 to $29,999 for men (150 | 15.5%) and $25,000 to $29,999 for women (196 | 14.3%).
| Income | Male | Female |
| $2,499 or less | 31 (3.2%) | 75 (5.5%) |
| $2,500 to $4,999 | 14 (1.5%) | 76 (5.5%) |
| $5,000 to $7,499 | 33 (3.4%) | 34 (2.5%) |
| $7,500 to $9,999 | 19 (2.0%) | 27 (2.0%) |
| $10,000 to $12,499 | 26 (2.7%) | 163 (11.9%) |
| $12,500 to $14,999 | 69 (7.1%) | 164 (11.9%) |
| $15,000 to $17,499 | 74 (7.6%) | 93 (6.8%) |
| $17,500 to $19,999 | 8 (0.8%) | 62 (4.5%) |
| $20,000 to $22,499 | 52 (5.4%) | 17 (1.2%) |
| $22,500 to $24,999 | 96 (9.9%) | 55 (4.0%) |
| $25,000 to $29,999 | 150 (15.5%) | 196 (14.3%) |
| $30,000 to $34,999 | 65 (6.7%) | 79 (5.8%) |
| $35,000 to $39,999 | 10 (1.0%) | 32 (2.3%) |
| $40,000 to $44,999 | 59 (6.1%) | 37 (2.7%) |
| $45,000 to $49,999 | 44 (4.5%) | 30 (2.2%) |
| $50,000 to $54,999 | 20 (2.1%) | 17 (1.2%) |
| $55,000 to $64,999 | 36 (3.7%) | 132 (9.6%) |
| $65,000 to $74,999 | 20 (2.1%) | 59 (4.3%) |
| $75,000 to $99,999 | 61 (6.3%) | 25 (1.8%) |
| $100,000+ | 80 (8.3%) | 0 (0.0%) |
| Total | 967 (100.0%) | 1,373 (100.0%) |
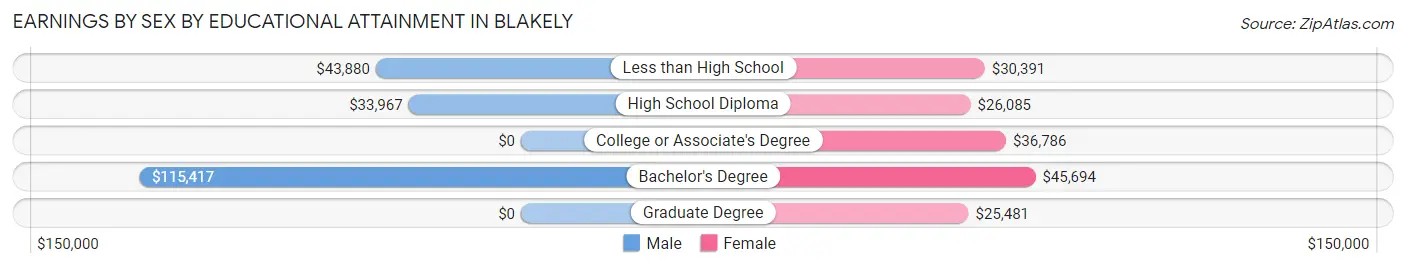
Earnings by Sex by Educational Attainment in Blakely
Average earnings in Blakely are $34,750 for men and $27,021 for women, a difference of 22.2%. Men with an educational attainment of bachelor's degree enjoy the highest average annual earnings of $115,417, while those with high school diploma education earn the least with $33,967. Women with an educational attainment of bachelor's degree earn the most with the average annual earnings of $45,694, while those with graduate degree education have the smallest earnings of $25,481.
| Educational Attainment | Male Income | Female Income |
| Less than High School | $43,880 | $30,391 |
| High School Diploma | $33,967 | $26,085 |
| College or Associate's Degree | - | - |
| Bachelor's Degree | $115,417 | $45,694 |
| Graduate Degree | - | - |
| Total | $34,750 | $27,021 |
Family Income in Blakely
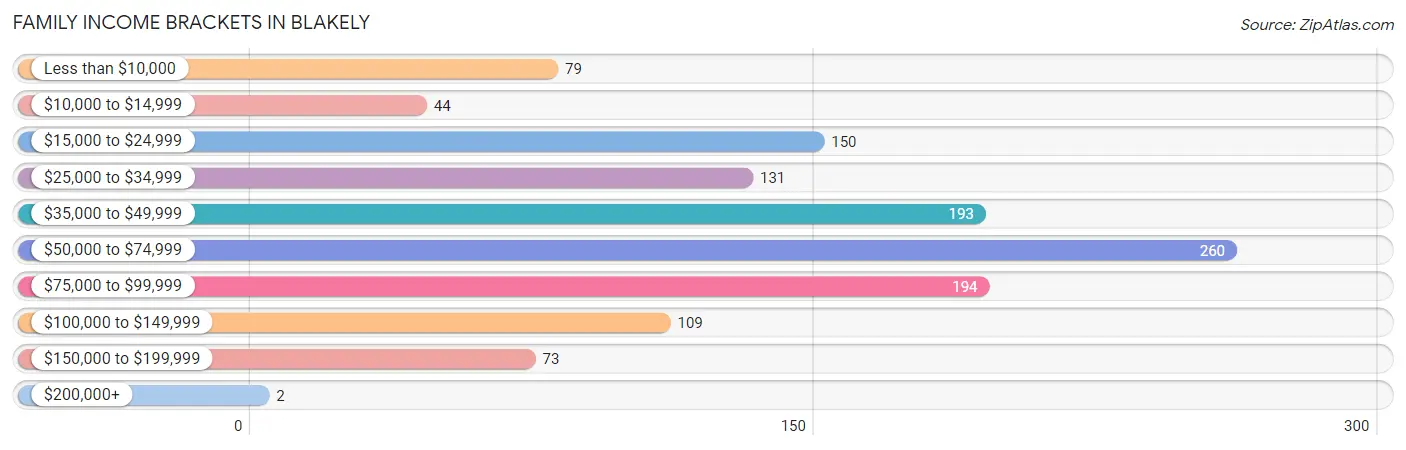
Family Income Brackets in Blakely
According to the Blakely family income data, there are 260 families falling into the $50,000 to $74,999 income range, which is the most common income bracket and makes up 21.0% of all families. Conversely, the $200,000+ income bracket is the least frequent group with only 2 families (0.2%) belonging to this category.
| Income Bracket | # Families | % Families |
| Less than $10,000 | 79 | 6.4% |
| $10,000 to $14,999 | 44 | 3.6% |
| $15,000 to $24,999 | 150 | 12.1% |
| $25,000 to $34,999 | 131 | 10.6% |
| $35,000 to $49,999 | 193 | 15.6% |
| $50,000 to $74,999 | 260 | 21.0% |
| $75,000 to $99,999 | 194 | 15.7% |
| $100,000 to $149,999 | 109 | 8.8% |
| $150,000 to $199,999 | 73 | 5.9% |
| $200,000+ | 2 | 0.2% |
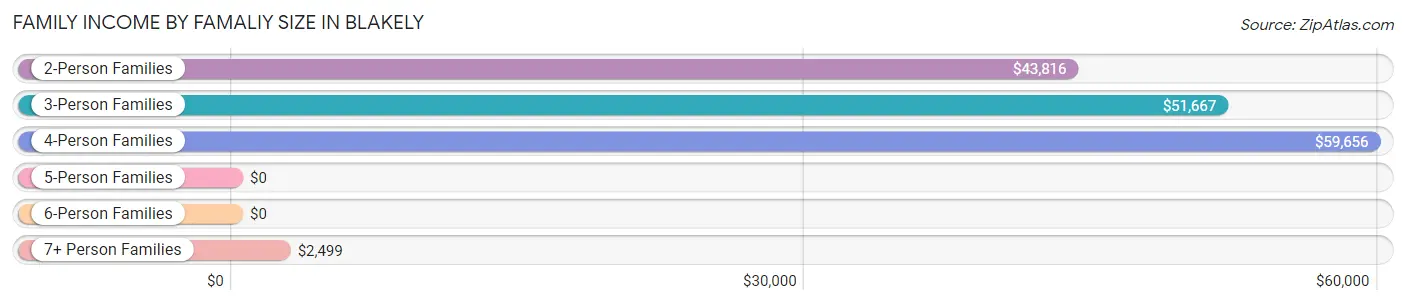
Family Income by Famaliy Size in Blakely
4-person families (247 | 20.0%) account for the highest median family income in Blakely with $59,656 per family, while 2-person families (540 | 43.7%) have the highest median income of $21,908 per family member.
| Income Bracket | # Families | Median Income |
| 2-Person Families | 540 (43.7%) | $43,816 |
| 3-Person Families | 146 (11.8%) | $51,667 |
| 4-Person Families | 247 (20.0%) | $59,656 |
| 5-Person Families | 239 (19.3%) | $0 |
| 6-Person Families | 22 (1.8%) | $0 |
| 7+ Person Families | 42 (3.4%) | $2,499 |
| Total | 1,236 (100.0%) | $53,906 |
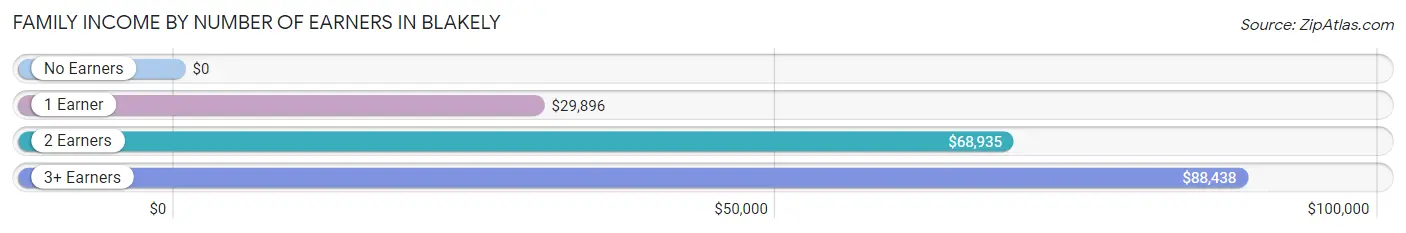
Family Income by Number of Earners in Blakely
| Number of Earners | # Families | Median Income |
| No Earners | 197 (15.9%) | $0 |
| 1 Earner | 391 (31.6%) | $29,896 |
| 2 Earners | 501 (40.5%) | $68,935 |
| 3+ Earners | 147 (11.9%) | $88,438 |
| Total | 1,236 (100.0%) | $53,906 |
Household Income in Blakely
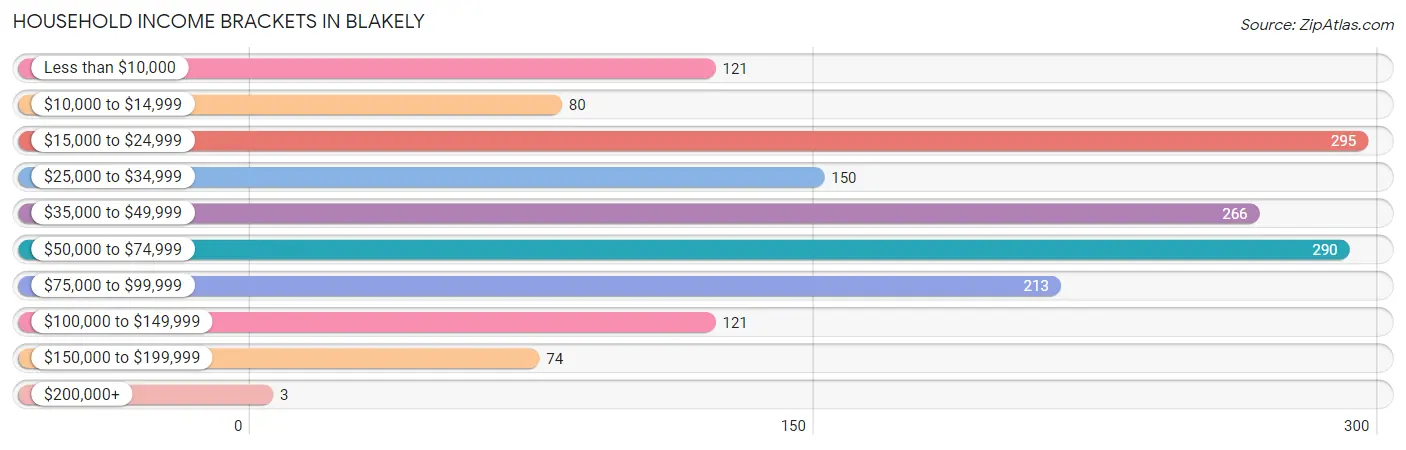
Household Income Brackets in Blakely
With 295 households falling in the category, the $15,000 to $24,999 income range is the most frequent in Blakely, accounting for 18.3% of all households. In contrast, only 3 households (0.2%) fall into the $200,000+ income bracket, making it the least populous group.
| Income Bracket | # Households | % Households |
| Less than $10,000 | 121 | 7.5% |
| $10,000 to $14,999 | 80 | 5.0% |
| $15,000 to $24,999 | 295 | 18.3% |
| $25,000 to $34,999 | 150 | 9.3% |
| $35,000 to $49,999 | 266 | 16.5% |
| $50,000 to $74,999 | 290 | 18.0% |
| $75,000 to $99,999 | 213 | 13.2% |
| $100,000 to $149,999 | 121 | 7.5% |
| $150,000 to $199,999 | 74 | 4.6% |
| $200,000+ | 3 | 0.2% |
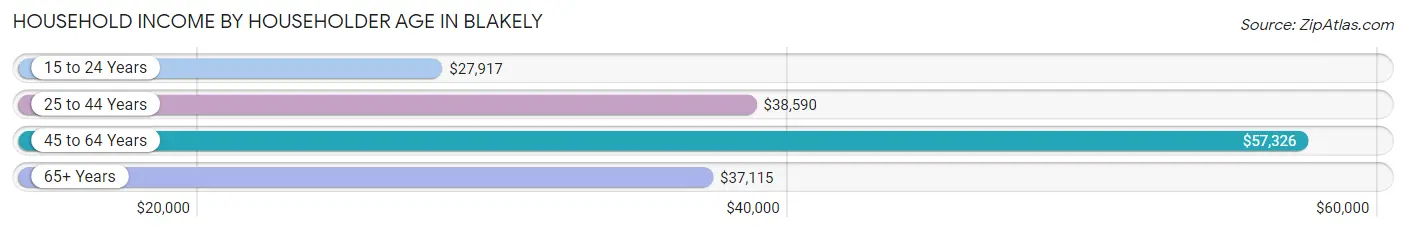
Household Income by Householder Age in Blakely
The median household income in Blakely is $43,008, with the highest median household income of $57,326 found in the 45 to 64 years age bracket for the primary householder. A total of 552 households (34.3%) fall into this category. Meanwhile, the 15 to 24 years age bracket for the primary householder has the lowest median household income of $27,917, with 117 households (7.3%) in this group.
| Income Bracket | # Households | Median Income |
| 15 to 24 Years | 117 (7.3%) | $27,917 |
| 25 to 44 Years | 447 (27.8%) | $38,590 |
| 45 to 64 Years | 552 (34.3%) | $57,326 |
| 65+ Years | 494 (30.7%) | $37,115 |
| Total | 1,610 (100.0%) | $43,008 |
Poverty in Blakely
Income Below Poverty by Sex and Age in Blakely
With 23.7% poverty level for males and 32.1% for females among the residents of Blakely, under 5 year old males and 5 year old females are the most vulnerable to poverty, with 130 males (73.5%) and 75 females (100.0%) in their respective age groups living below the poverty level.
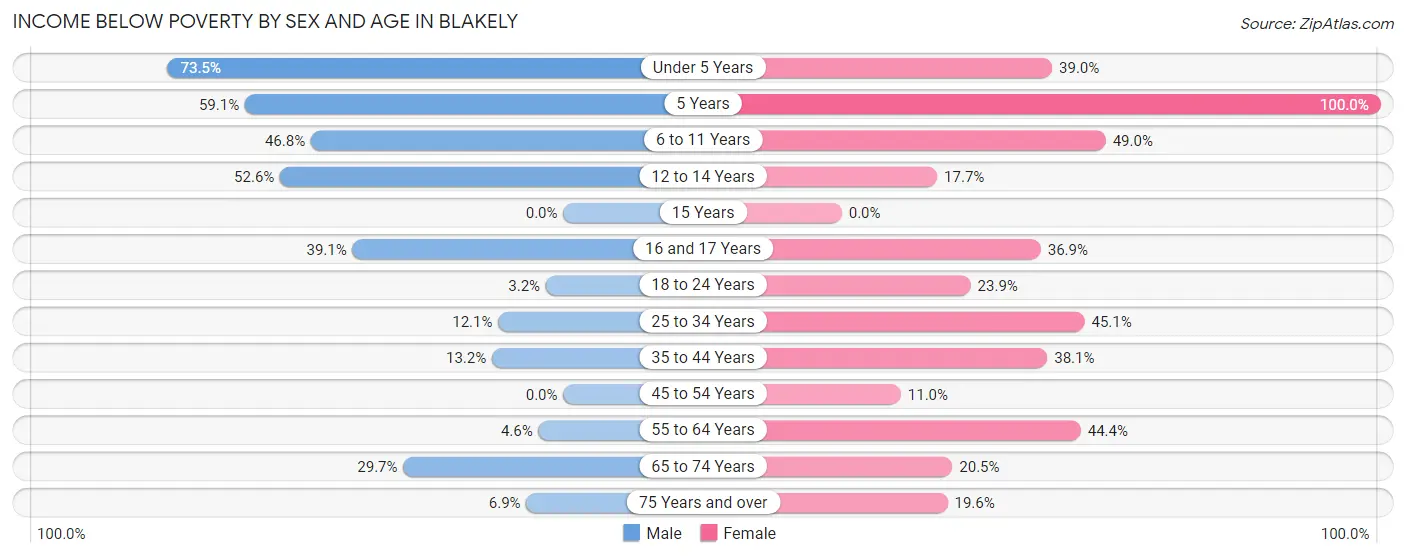
| Age Bracket | Male | Female |
| Under 5 Years | 130 (73.5%) | 98 (39.0%) |
| 5 Years | 13 (59.1%) | 75 (100.0%) |
| 6 to 11 Years | 111 (46.8%) | 73 (49.0%) |
| 12 to 14 Years | 113 (52.6%) | 37 (17.7%) |
| 15 Years | 0 (0.0%) | 0 (0.0%) |
| 16 and 17 Years | 36 (39.1%) | 41 (36.9%) |
| 18 to 24 Years | 12 (3.2%) | 105 (23.9%) |
| 25 to 34 Years | 18 (12.1%) | 114 (45.1%) |
| 35 to 44 Years | 34 (13.2%) | 164 (38.1%) |
| 45 to 54 Years | 0 (0.0%) | 33 (11.0%) |
| 55 to 64 Years | 4 (4.6%) | 122 (44.4%) |
| 65 to 74 Years | 49 (29.7%) | 55 (20.5%) |
| 75 Years and over | 5 (6.9%) | 32 (19.6%) |
| Total | 525 (23.7%) | 949 (32.1%) |
Income Above Poverty by Sex and Age in Blakely
According to the poverty statistics in Blakely, males aged 15 years and females aged 15 years are the age groups that are most secure financially, with 100.0% of males and 100.0% of females in these age groups living above the poverty line.
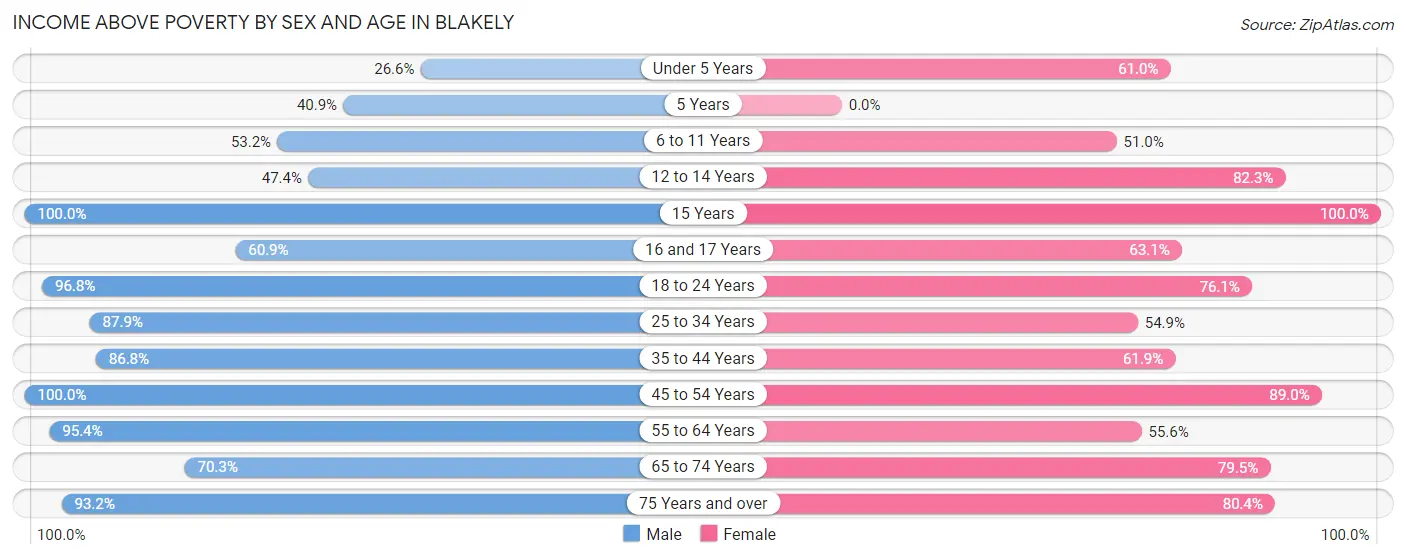
| Age Bracket | Male | Female |
| Under 5 Years | 47 (26.6%) | 153 (61.0%) |
| 5 Years | 9 (40.9%) | 0 (0.0%) |
| 6 to 11 Years | 126 (53.2%) | 76 (51.0%) |
| 12 to 14 Years | 102 (47.4%) | 172 (82.3%) |
| 15 Years | 53 (100.0%) | 31 (100.0%) |
| 16 and 17 Years | 56 (60.9%) | 70 (63.1%) |
| 18 to 24 Years | 358 (96.8%) | 334 (76.1%) |
| 25 to 34 Years | 131 (87.9%) | 139 (54.9%) |
| 35 to 44 Years | 223 (86.8%) | 266 (61.9%) |
| 45 to 54 Years | 314 (100.0%) | 268 (89.0%) |
| 55 to 64 Years | 83 (95.4%) | 153 (55.6%) |
| 65 to 74 Years | 116 (70.3%) | 213 (79.5%) |
| 75 Years and over | 68 (93.1%) | 131 (80.4%) |
| Total | 1,686 (76.3%) | 2,006 (67.9%) |
Income Below Poverty Among Married-Couple Families in Blakely
The poverty statistics for married-couple families in Blakely show that 8.9% or 58 of the total 651 families live below the poverty line. Families with no children have the highest poverty rate of 9.7%, comprising of 30 families. On the other hand, families with 1 or 2 children have the lowest poverty rate of 8.0%, which includes 20 families.
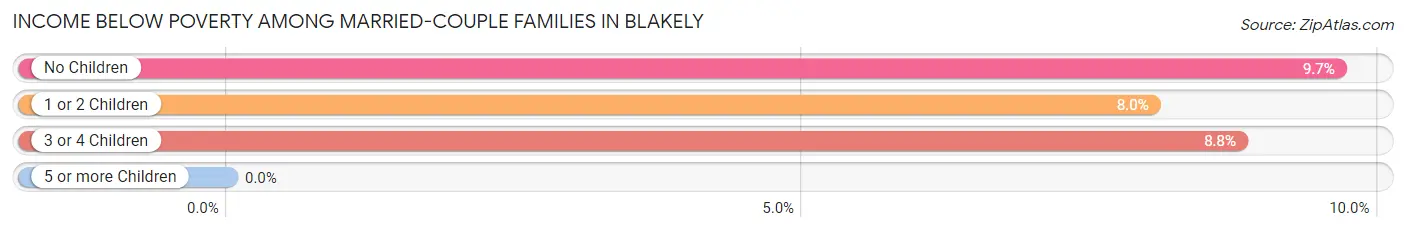
| Children | Above Poverty | Below Poverty |
| No Children | 281 (90.3%) | 30 (9.7%) |
| 1 or 2 Children | 229 (92.0%) | 20 (8.0%) |
| 3 or 4 Children | 83 (91.2%) | 8 (8.8%) |
| 5 or more Children | 0 (0.0%) | 0 (0.0%) |
| Total | 593 (91.1%) | 58 (8.9%) |
Income Below Poverty Among Single-Parent Households in Blakely
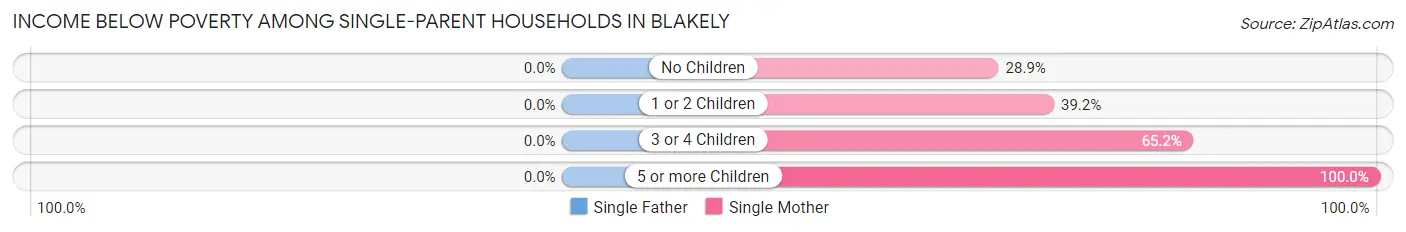
| Children | Single Father | Single Mother |
| No Children | 0 (0.0%) | 56 (28.9%) |
| 1 or 2 Children | 0 (0.0%) | 67 (39.2%) |
| 3 or 4 Children | 0 (0.0%) | 88 (65.2%) |
| 5 or more Children | 0 (0.0%) | 25 (100.0%) |
| Total | 0 (0.0%) | 236 (45.0%) |
Income Below Poverty Among Married-Couple vs Single-Parent Households in Blakely
The poverty data for Blakely shows that 58 of the married-couple family households (8.9%) and 236 of the single-parent households (40.3%) are living below the poverty level. Within the married-couple family households, those with no children have the highest poverty rate, with 30 households (9.7%) falling below the poverty line. Among the single-parent households, those with 5 or more children have the highest poverty rate, with 25 household (100.0%) living below poverty.
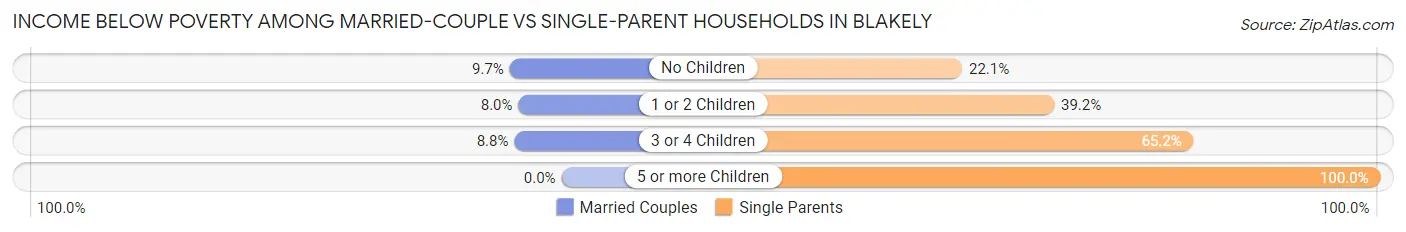
| Children | Married-Couple Families | Single-Parent Households |
| No Children | 30 (9.7%) | 56 (22.1%) |
| 1 or 2 Children | 20 (8.0%) | 67 (39.2%) |
| 3 or 4 Children | 8 (8.8%) | 88 (65.2%) |
| 5 or more Children | 0 (0.0%) | 25 (100.0%) |
| Total | 58 (8.9%) | 236 (40.3%) |
Race in Blakely
The most populous races in Blakely are Black / African American (4,008 | 75.6%), White / Caucasian (1,260 | 23.8%), and Two or more Races (31 | 0.6%).
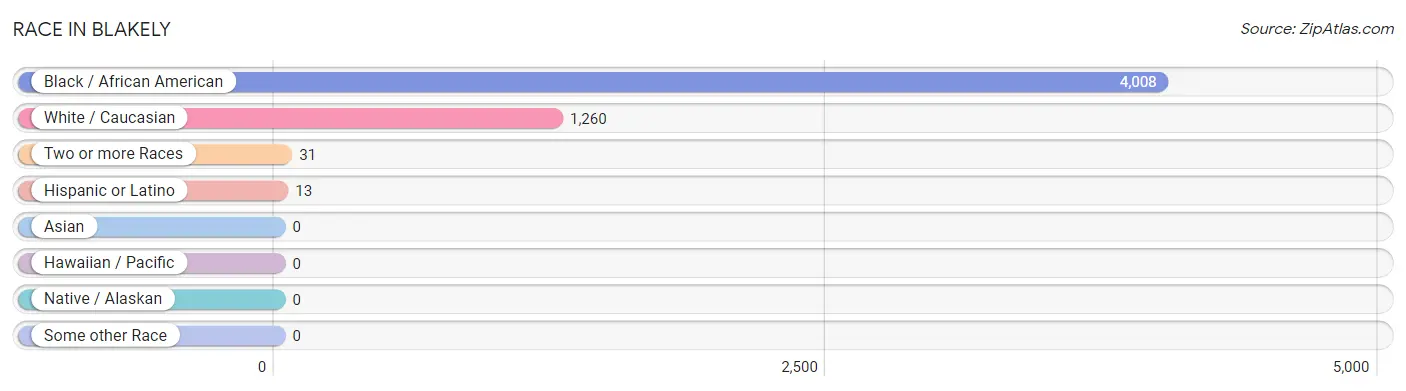
| Race | # Population | % Population |
| Asian | 0 | 0.0% |
| Black / African American | 4,008 | 75.6% |
| Hawaiian / Pacific | 0 | 0.0% |
| Hispanic or Latino | 13 | 0.3% |
| Native / Alaskan | 0 | 0.0% |
| White / Caucasian | 1,260 | 23.8% |
| Two or more Races | 31 | 0.6% |
| Some other Race | 0 | 0.0% |
| Total | 5,299 | 100.0% |
Ancestry in Blakely
The most populous ancestries reported in Blakely are American (292 | 5.5%), Subsaharan African (118 | 2.2%), African (111 | 2.1%), English (82 | 1.5%), and Irish (47 | 0.9%), together accounting for 12.3% of all Blakely residents.
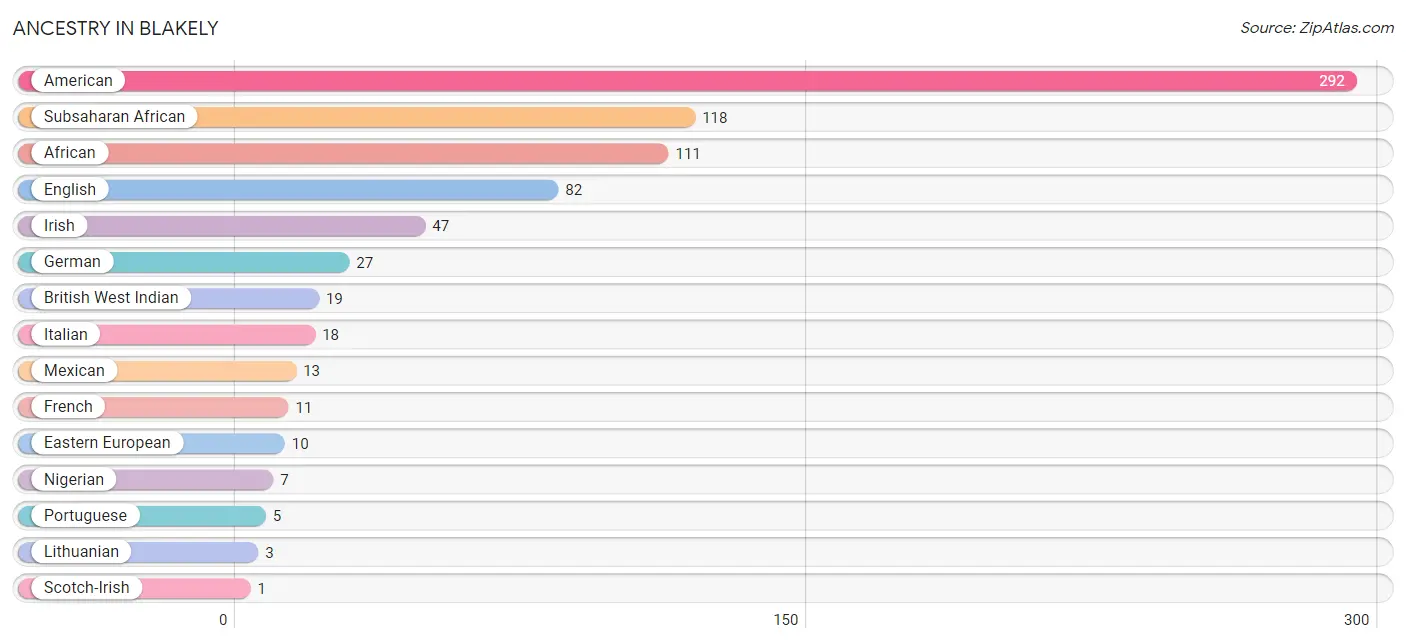
| Ancestry | # Population | % Population |
| African | 111 | 2.1% |
| American | 292 | 5.5% |
| British West Indian | 19 | 0.4% |
| Eastern European | 10 | 0.2% |
| English | 82 | 1.5% |
| French | 11 | 0.2% |
| German | 27 | 0.5% |
| Irish | 47 | 0.9% |
| Italian | 18 | 0.3% |
| Lithuanian | 3 | 0.1% |
| Mexican | 13 | 0.3% |
| Nigerian | 7 | 0.1% |
| Portuguese | 5 | 0.1% |
| Scotch-Irish | 1 | 0.0% |
| Subsaharan African | 118 | 2.2% | View All 15 Rows |
Immigrants in Blakely
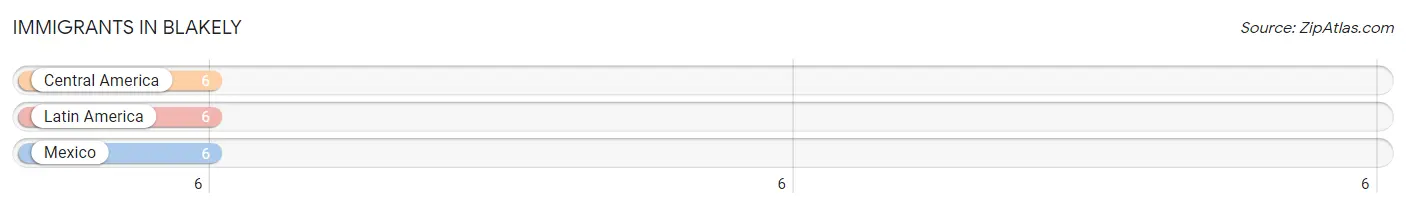
The most numerous immigrant groups reported in Blakely came from Central America (6 | 0.1%), Latin America (6 | 0.1%), and Mexico (6 | 0.1%), together accounting for 0.3% of all Blakely residents.
| Immigration Origin | # Population | % Population |
| Central America | 6 | 0.1% |
| Latin America | 6 | 0.1% |
| Mexico | 6 | 0.1% | View All 3 Rows |
Sex and Age in Blakely
Sex and Age in Blakely
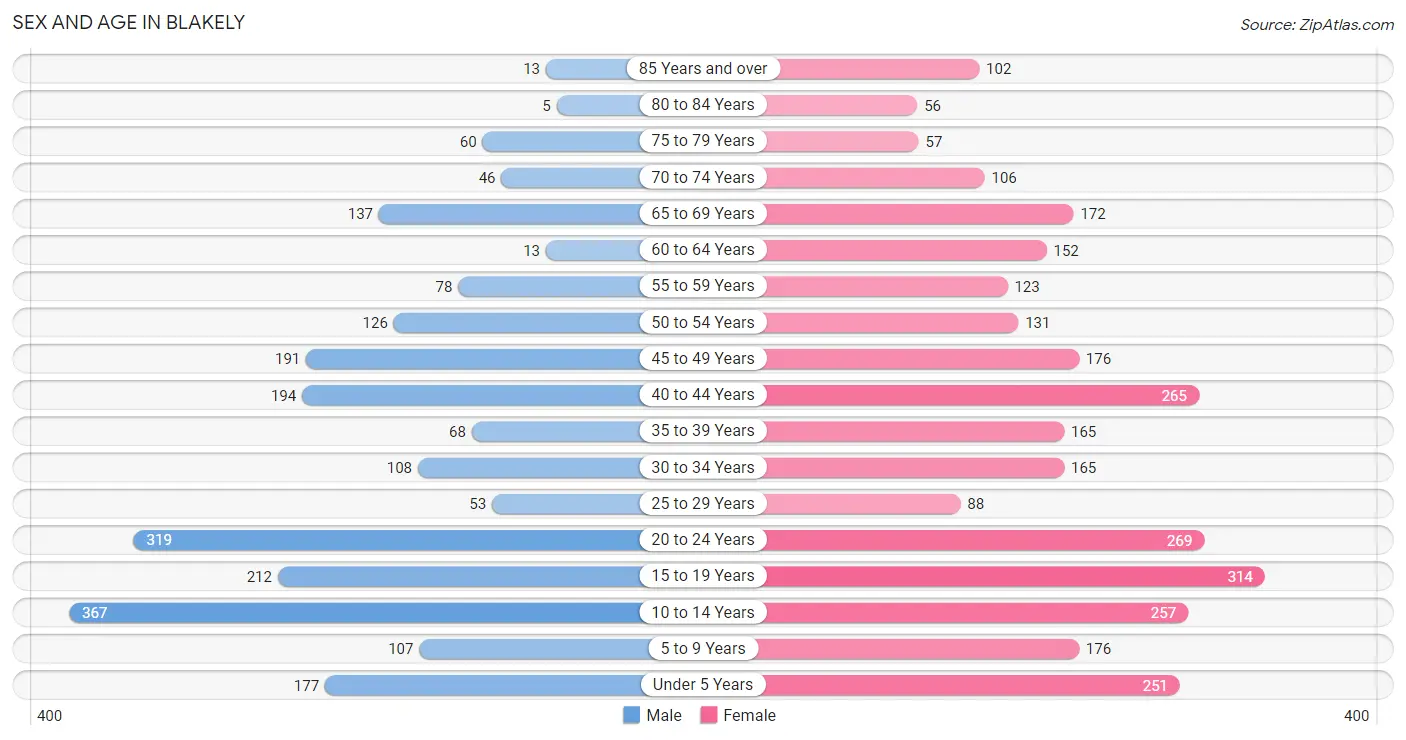
The most populous age groups in Blakely are 10 to 14 Years (367 | 16.1%) for men and 15 to 19 Years (314 | 10.4%) for women.
| Age Bracket | Male | Female |
| Under 5 Years | 177 (7.8%) | 251 (8.3%) |
| 5 to 9 Years | 107 (4.7%) | 176 (5.8%) |
| 10 to 14 Years | 367 (16.1%) | 257 (8.5%) |
| 15 to 19 Years | 212 (9.3%) | 314 (10.4%) |
| 20 to 24 Years | 319 (14.0%) | 269 (8.9%) |
| 25 to 29 Years | 53 (2.3%) | 88 (2.9%) |
| 30 to 34 Years | 108 (4.8%) | 165 (5.4%) |
| 35 to 39 Years | 68 (3.0%) | 165 (5.4%) |
| 40 to 44 Years | 194 (8.5%) | 265 (8.8%) |
| 45 to 49 Years | 191 (8.4%) | 176 (5.8%) |
| 50 to 54 Years | 126 (5.5%) | 131 (4.3%) |
| 55 to 59 Years | 78 (3.4%) | 123 (4.1%) |
| 60 to 64 Years | 13 (0.6%) | 152 (5.0%) |
| 65 to 69 Years | 137 (6.0%) | 172 (5.7%) |
| 70 to 74 Years | 46 (2.0%) | 106 (3.5%) |
| 75 to 79 Years | 60 (2.6%) | 57 (1.9%) |
| 80 to 84 Years | 5 (0.2%) | 56 (1.8%) |
| 85 Years and over | 13 (0.6%) | 102 (3.4%) |
| Total | 2,274 (100.0%) | 3,025 (100.0%) |
Families and Households in Blakely
Median Family Size in Blakely
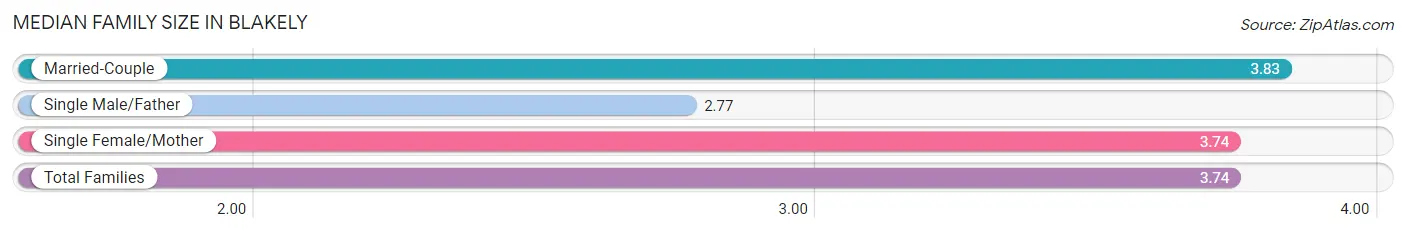
The median family size in Blakely is 3.74 persons per family, with married-couple families (651 | 52.7%) accounting for the largest median family size of 3.83 persons per family. On the other hand, single male/father families (60 | 4.9%) represent the smallest median family size with 2.77 persons per family.
| Family Type | # Families | Family Size |
| Married-Couple | 651 (52.7%) | 3.83 |
| Single Male/Father | 60 (4.9%) | 2.77 |
| Single Female/Mother | 525 (42.5%) | 3.74 |
| Total Families | 1,236 (100.0%) | 3.74 |
Median Household Size in Blakely
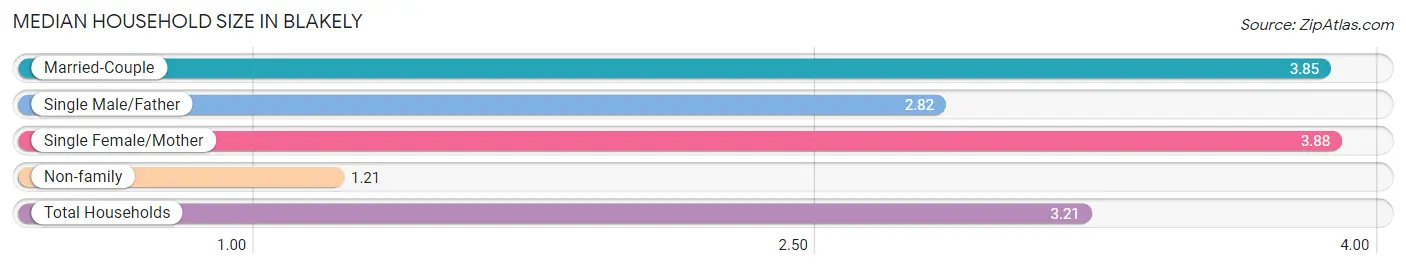
The median household size in Blakely is 3.21 persons per household, with single female/mother households (525 | 32.6%) accounting for the largest median household size of 3.88 persons per household. non-family households (374 | 23.2%) represent the smallest median household size with 1.21 persons per household.
| Household Type | # Households | Household Size |
| Married-Couple | 651 (40.4%) | 3.85 |
| Single Male/Father | 60 (3.7%) | 2.82 |
| Single Female/Mother | 525 (32.6%) | 3.88 |
| Non-family | 374 (23.2%) | 1.21 |
| Total Households | 1,610 (100.0%) | 3.21 |
Household Size by Marriage Status in Blakely
Out of a total of 1,610 households in Blakely, 1,236 (76.8%) are family households, while 374 (23.2%) are nonfamily households. The most numerous type of family households are 2-person households, comprising 523, and the most common type of nonfamily households are 1-person households, comprising 342.
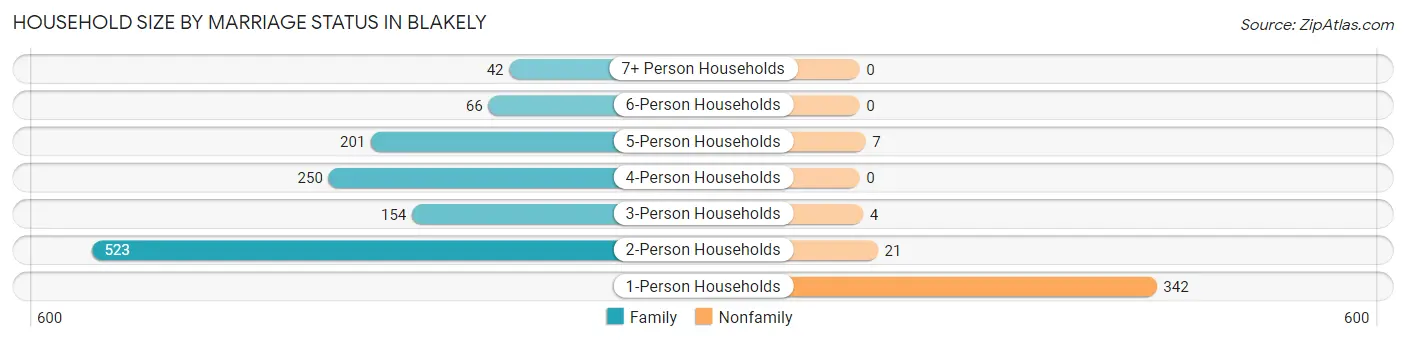
| Household Size | Family Households | Nonfamily Households |
| 1-Person Households | - | 342 (21.2%) |
| 2-Person Households | 523 (32.5%) | 21 (1.3%) |
| 3-Person Households | 154 (9.6%) | 4 (0.3%) |
| 4-Person Households | 250 (15.5%) | 0 (0.0%) |
| 5-Person Households | 201 (12.5%) | 7 (0.4%) |
| 6-Person Households | 66 (4.1%) | 0 (0.0%) |
| 7+ Person Households | 42 (2.6%) | 0 (0.0%) |
| Total | 1,236 (76.8%) | 374 (23.2%) |
Female Fertility in Blakely
Fertility by Age in Blakely
Average fertility rate in Blakely is 30.0 births per 1,000 women. Women in the age bracket of 35 to 50 years have the highest fertility rate with 55.0 births per 1,000 women. Women in the age bracket of 35 to 50 years acount for 77.3% of all women with births.
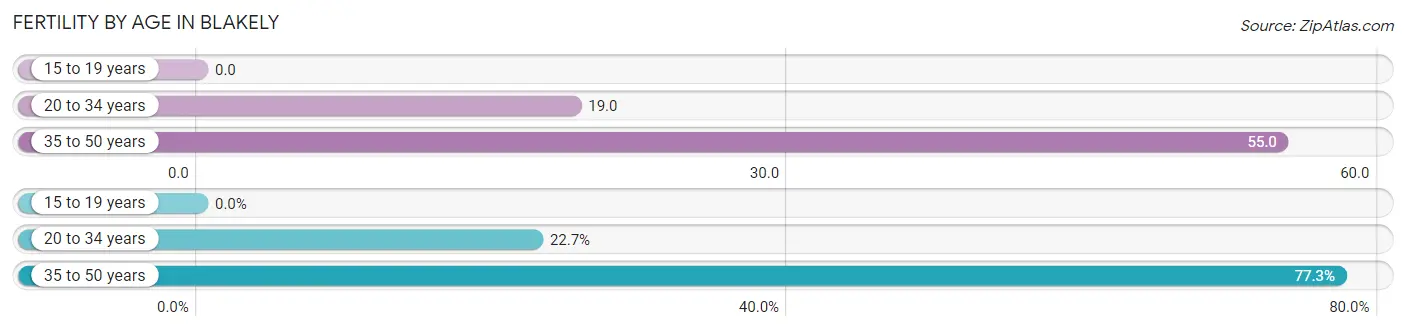
| Age Bracket | Women with Births | Births / 1,000 Women |
| 15 to 19 years | 0 (0.0%) | 0.0 |
| 20 to 34 years | 10 (22.7%) | 19.0 |
| 35 to 50 years | 34 (77.3%) | 55.0 |
| Total | 44 (100.0%) | 30.0 |
Fertility by Age by Marriage Status in Blakely
22.7% of women with births (44) in Blakely are married. The highest percentage of unmarried women with births falls into 35 to 50 years age bracket with 100.0% of them unmarried at the time of birth, while the lowest percentage of unmarried women with births belong to 20 to 34 years age bracket with 0.0% of them unmarried.
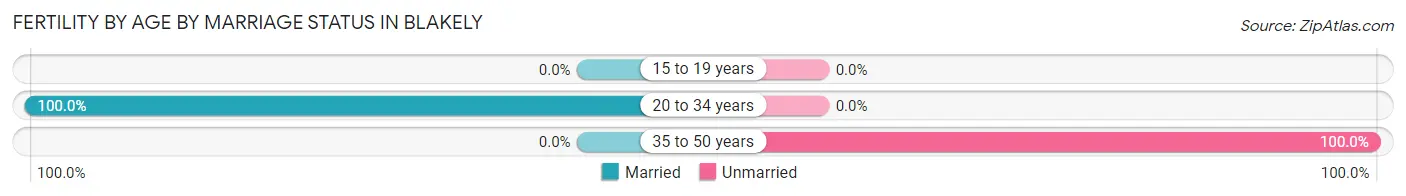
| Age Bracket | Married | Unmarried |
| 15 to 19 years | 0 (0.0%) | 0 (0.0%) |
| 20 to 34 years | 10 (100.0%) | 0 (0.0%) |
| 35 to 50 years | 0 (0.0%) | 34 (100.0%) |
| Total | 10 (22.7%) | 34 (77.3%) |
Fertility by Education in Blakely
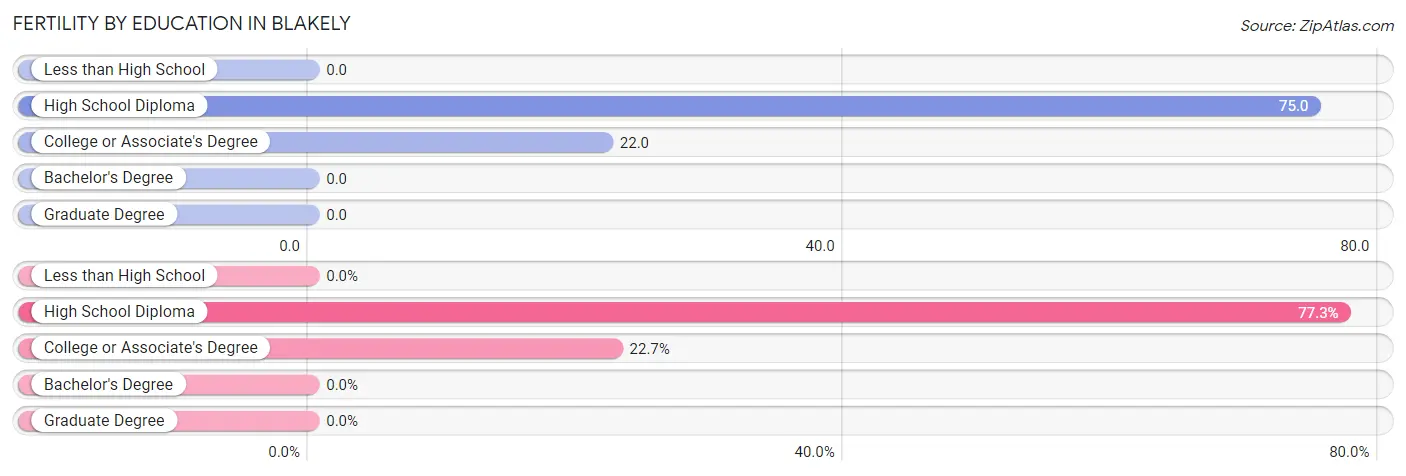
| Educational Attainment | Women with Births | Births / 1,000 Women |
| Less than High School | 0 (0.0%) | 0.0 |
| High School Diploma | 34 (77.3%) | 75.0 |
| College or Associate's Degree | 10 (22.7%) | 22.0 |
| Bachelor's Degree | 0 (0.0%) | 0.0 |
| Graduate Degree | 0 (0.0%) | 0.0 |
| Total | 44 (100.0%) | 30.0 |
Fertility by Education by Marriage Status in Blakely
77.3% of women with births in Blakely are unmarried. Women with the educational attainment of college or associate's degree are most likely to be married with 100.0% of them married at childbirth, while women with the educational attainment of high school diploma are least likely to be married with 100.0% of them unmarried at childbirth.
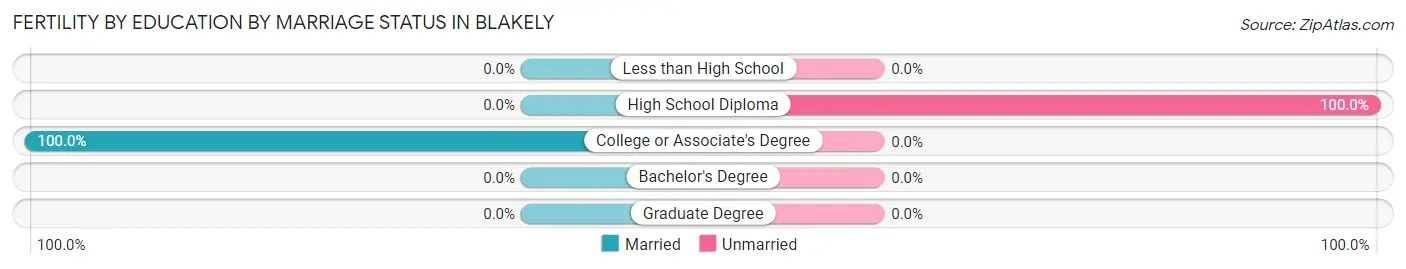
| Educational Attainment | Married | Unmarried |
| Less than High School | 0 (0.0%) | 0 (0.0%) |
| High School Diploma | 0 (0.0%) | 34 (100.0%) |
| College or Associate's Degree | 10 (100.0%) | 0 (0.0%) |
| Bachelor's Degree | 0 (0.0%) | 0 (0.0%) |
| Graduate Degree | 0 (0.0%) | 0 (0.0%) |
| Total | 10 (22.7%) | 34 (77.3%) |
Employment Characteristics in Blakely
Employment by Class of Employer in Blakely
Among the 2,105 employed individuals in Blakely, private company employees (1,385 | 65.8%), local government employees (235 | 11.2%), and state government employees (194 | 9.2%) make up the most common classes of employment.
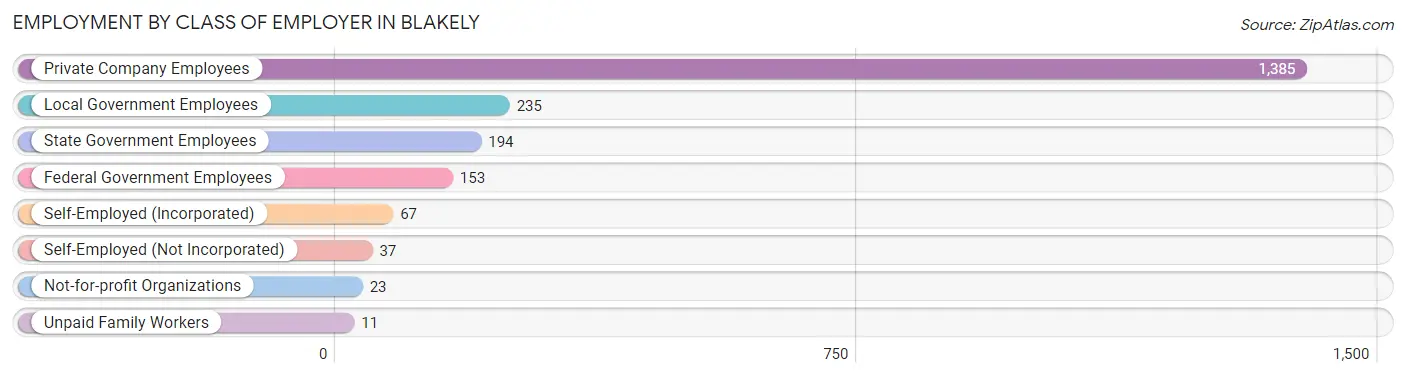
| Employer Class | # Employees | % Employees |
| Private Company Employees | 1,385 | 65.8% |
| Self-Employed (Incorporated) | 67 | 3.2% |
| Self-Employed (Not Incorporated) | 37 | 1.8% |
| Not-for-profit Organizations | 23 | 1.1% |
| Local Government Employees | 235 | 11.2% |
| State Government Employees | 194 | 9.2% |
| Federal Government Employees | 153 | 7.3% |
| Unpaid Family Workers | 11 | 0.5% |
| Total | 2,105 | 100.0% |
Employment Status by Age in Blakely
According to the labor force statistics for Blakely, out of the total population over 16 years of age (3,880), 57.5% or 2,231 individuals are in the labor force, with 5.6% or 125 of them unemployed. The age group with the highest labor force participation rate is 25 to 29 years, with 92.2% or 130 individuals in the labor force. Within the labor force, the 25 to 29 years age range has the highest percentage of unemployed individuals, with 41.5% or 54 of them being unemployed.
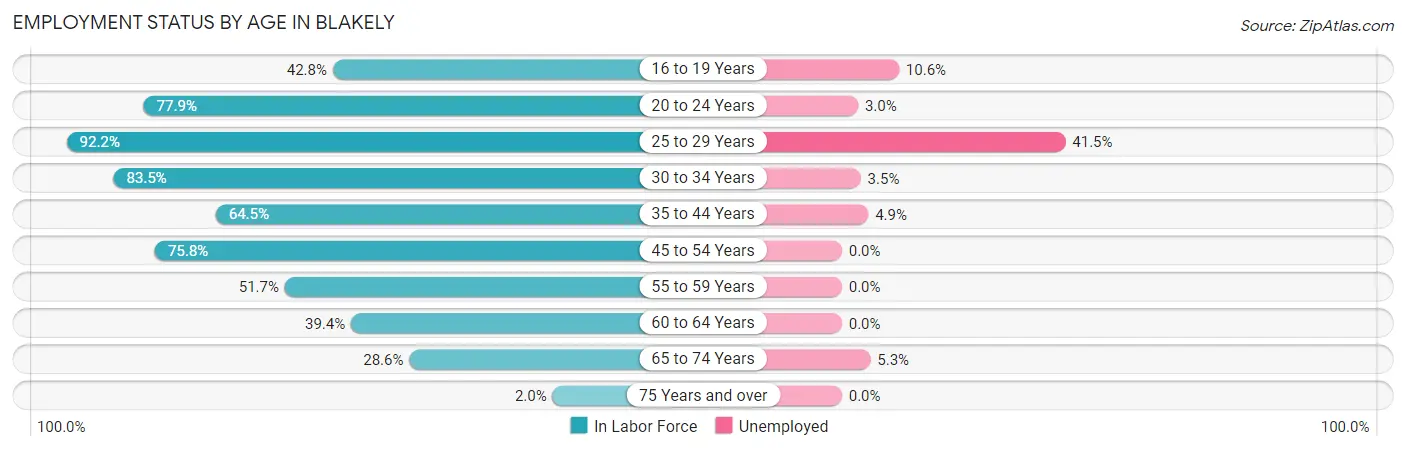
| Age Bracket | In Labor Force | Unemployed |
| 16 to 19 Years | 189 (42.8%) | 20 (10.6%) |
| 20 to 24 Years | 458 (77.9%) | 14 (3.0%) |
| 25 to 29 Years | 130 (92.2%) | 54 (41.5%) |
| 30 to 34 Years | 228 (83.5%) | 8 (3.5%) |
| 35 to 44 Years | 446 (64.5%) | 22 (4.9%) |
| 45 to 54 Years | 473 (75.8%) | 0 (0.0%) |
| 55 to 59 Years | 104 (51.7%) | 0 (0.0%) |
| 60 to 64 Years | 65 (39.4%) | 0 (0.0%) |
| 65 to 74 Years | 132 (28.6%) | 7 (5.3%) |
| 75 Years and over | 6 (2.0%) | 0 (0.0%) |
| Total | 2,231 (57.5%) | 125 (5.6%) |
Employment Status by Educational Attainment in Blakely
According to labor force statistics for Blakely, 69.0% of individuals (1,446) out of the total population between 25 and 64 years of age (2,096) are in the labor force, with 5.8% or 84 of them being unemployed. The group with the highest labor force participation rate are those with the educational attainment of college / associate degree, with 85.2% or 511 individuals in the labor force. Within the labor force, individuals with high school diploma education have the highest percentage of unemployment, with 9.3% or 48 of them being unemployed.
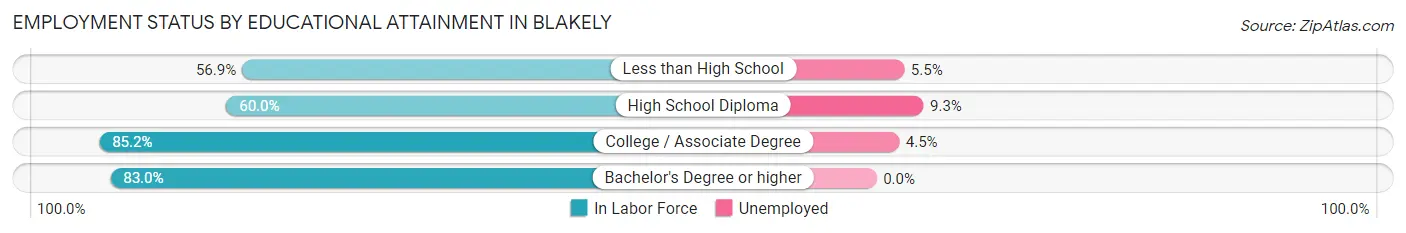
| Educational Attainment | In Labor Force | Unemployed |
| Less than High School | 236 (56.9%) | 23 (5.5%) |
| High School Diploma | 518 (60.0%) | 80 (9.3%) |
| College / Associate Degree | 511 (85.2%) | 27 (4.5%) |
| Bachelor's Degree or higher | 181 (83.0%) | 0 (0.0%) |
| Total | 1,446 (69.0%) | 122 (5.8%) |
Employment Occupations by Sex in Blakely
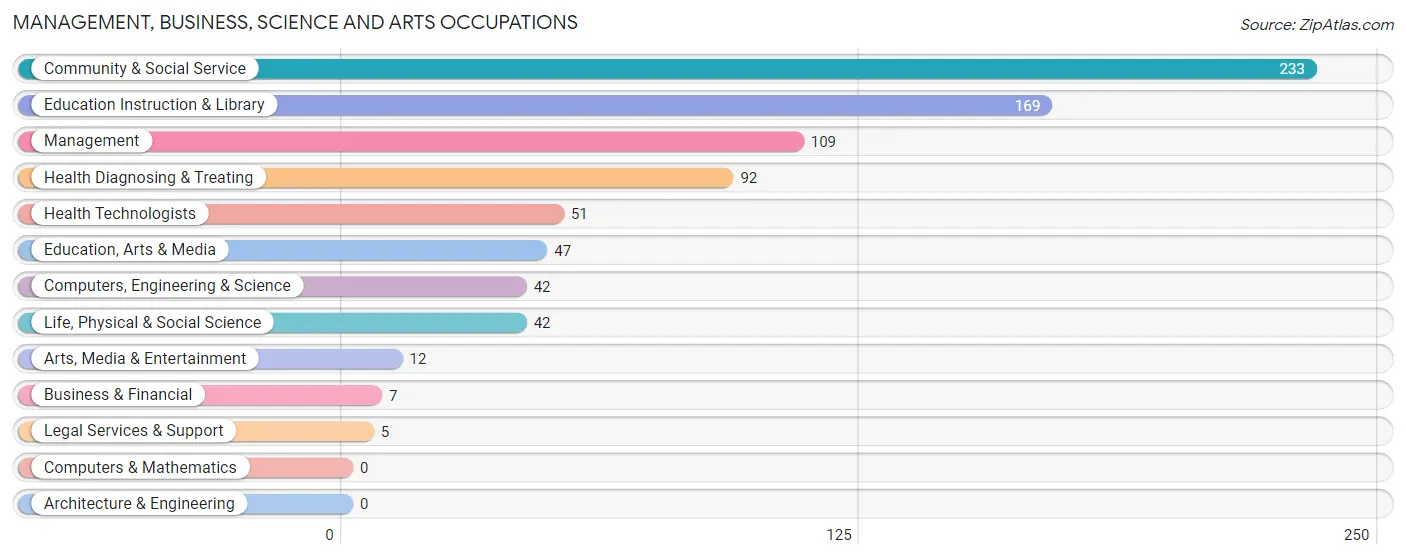
Management, Business, Science and Arts Occupations
The most common Management, Business, Science and Arts occupations in Blakely are Community & Social Service (233 | 11.2%), Education Instruction & Library (169 | 8.1%), Management (109 | 5.2%), Health Diagnosing & Treating (92 | 4.4%), and Health Technologists (51 | 2.5%).
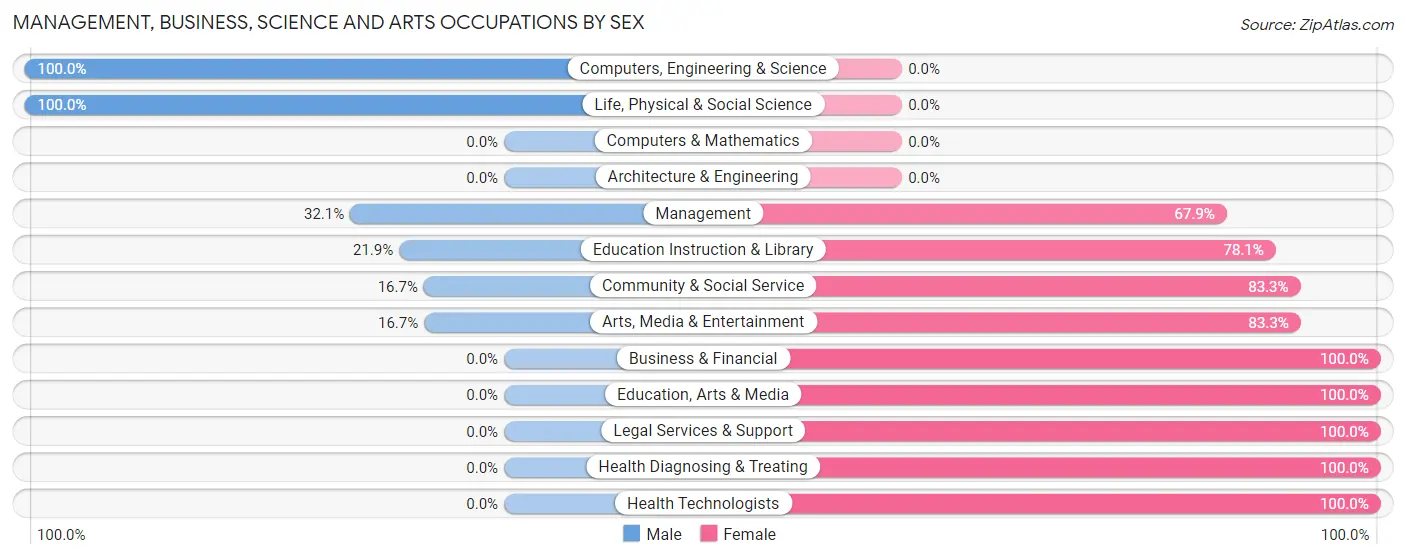
Management, Business, Science and Arts Occupations by Sex
Within the Management, Business, Science and Arts occupations in Blakely, the most male-oriented occupations are Computers, Engineering & Science (100.0%), Life, Physical & Social Science (100.0%), and Management (32.1%), while the most female-oriented occupations are Business & Financial (100.0%), Education, Arts & Media (100.0%), and Legal Services & Support (100.0%).
| Occupation | Male | Female |
| Management | 35 (32.1%) | 74 (67.9%) |
| Business & Financial | 0 (0.0%) | 7 (100.0%) |
| Computers, Engineering & Science | 42 (100.0%) | 0 (0.0%) |
| Computers & Mathematics | 0 (0.0%) | 0 (0.0%) |
| Architecture & Engineering | 0 (0.0%) | 0 (0.0%) |
| Life, Physical & Social Science | 42 (100.0%) | 0 (0.0%) |
| Community & Social Service | 39 (16.7%) | 194 (83.3%) |
| Education, Arts & Media | 0 (0.0%) | 47 (100.0%) |
| Legal Services & Support | 0 (0.0%) | 5 (100.0%) |
| Education Instruction & Library | 37 (21.9%) | 132 (78.1%) |
| Arts, Media & Entertainment | 2 (16.7%) | 10 (83.3%) |
| Health Diagnosing & Treating | 0 (0.0%) | 92 (100.0%) |
| Health Technologists | 0 (0.0%) | 51 (100.0%) |
| Total (Category) | 116 (24.0%) | 367 (76.0%) |
| Total (Overall) | 922 (44.4%) | 1,154 (55.6%) |
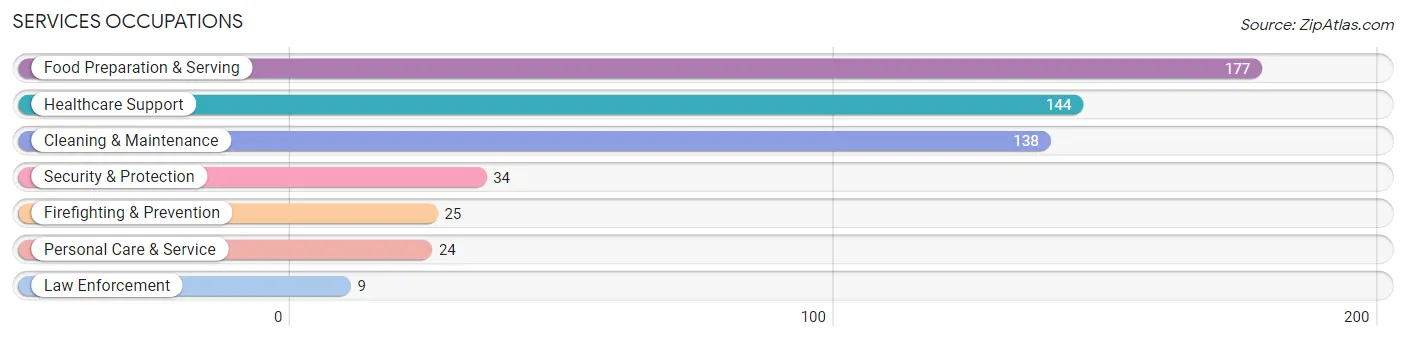
Services Occupations
The most common Services occupations in Blakely are Food Preparation & Serving (177 | 8.5%), Healthcare Support (144 | 6.9%), Cleaning & Maintenance (138 | 6.7%), Security & Protection (34 | 1.6%), and Firefighting & Prevention (25 | 1.2%).
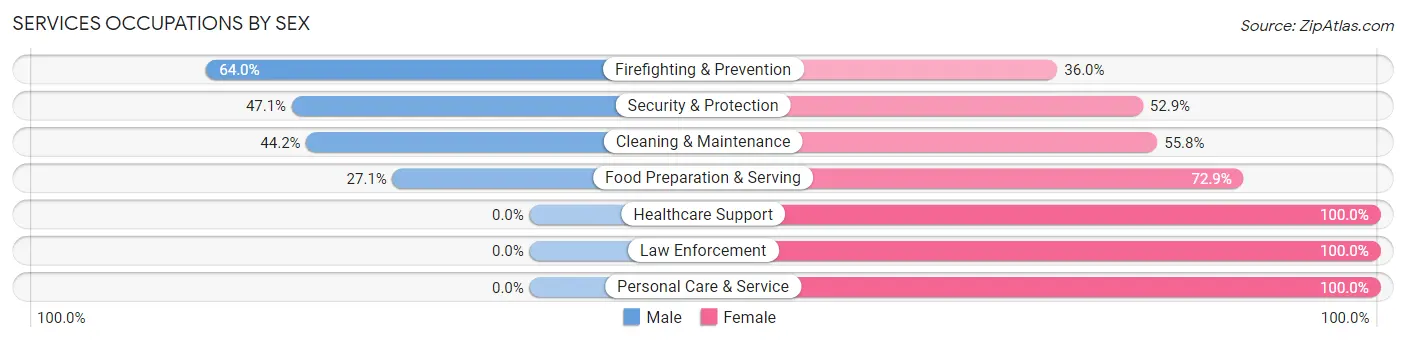
Services Occupations by Sex
Within the Services occupations in Blakely, the most male-oriented occupations are Firefighting & Prevention (64.0%), Security & Protection (47.1%), and Cleaning & Maintenance (44.2%), while the most female-oriented occupations are Healthcare Support (100.0%), Law Enforcement (100.0%), and Personal Care & Service (100.0%).
| Occupation | Male | Female |
| Healthcare Support | 0 (0.0%) | 144 (100.0%) |
| Security & Protection | 16 (47.1%) | 18 (52.9%) |
| Firefighting & Prevention | 16 (64.0%) | 9 (36.0%) |
| Law Enforcement | 0 (0.0%) | 9 (100.0%) |
| Food Preparation & Serving | 48 (27.1%) | 129 (72.9%) |
| Cleaning & Maintenance | 61 (44.2%) | 77 (55.8%) |
| Personal Care & Service | 0 (0.0%) | 24 (100.0%) |
| Total (Category) | 125 (24.2%) | 392 (75.8%) |
| Total (Overall) | 922 (44.4%) | 1,154 (55.6%) |
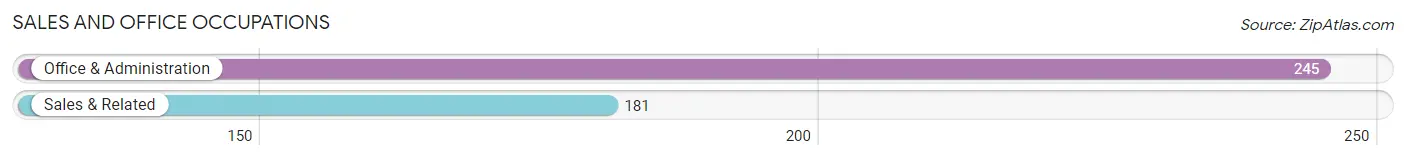
Sales and Office Occupations
The most common Sales and Office occupations in Blakely are Office & Administration (245 | 11.8%), and Sales & Related (181 | 8.7%).
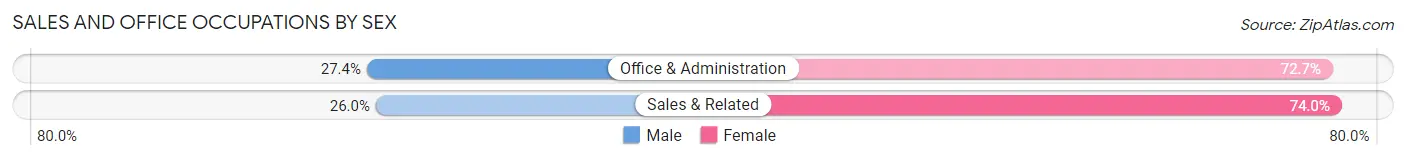
Sales and Office Occupations by Sex
| Occupation | Male | Female |
| Sales & Related | 47 (26.0%) | 134 (74.0%) |
| Office & Administration | 67 (27.4%) | 178 (72.7%) |
| Total (Category) | 114 (26.8%) | 312 (73.2%) |
| Total (Overall) | 922 (44.4%) | 1,154 (55.6%) |
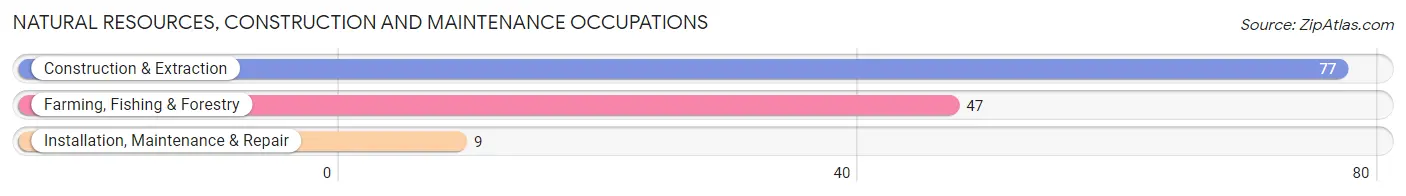
Natural Resources, Construction and Maintenance Occupations
The most common Natural Resources, Construction and Maintenance occupations in Blakely are Construction & Extraction (77 | 3.7%), Farming, Fishing & Forestry (47 | 2.3%), and Installation, Maintenance & Repair (9 | 0.4%).
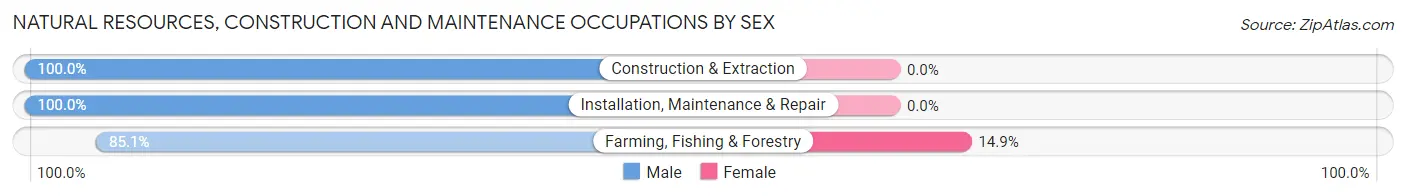
Natural Resources, Construction and Maintenance Occupations by Sex
| Occupation | Male | Female |
| Farming, Fishing & Forestry | 40 (85.1%) | 7 (14.9%) |
| Construction & Extraction | 77 (100.0%) | 0 (0.0%) |
| Installation, Maintenance & Repair | 9 (100.0%) | 0 (0.0%) |
| Total (Category) | 126 (94.7%) | 7 (5.3%) |
| Total (Overall) | 922 (44.4%) | 1,154 (55.6%) |
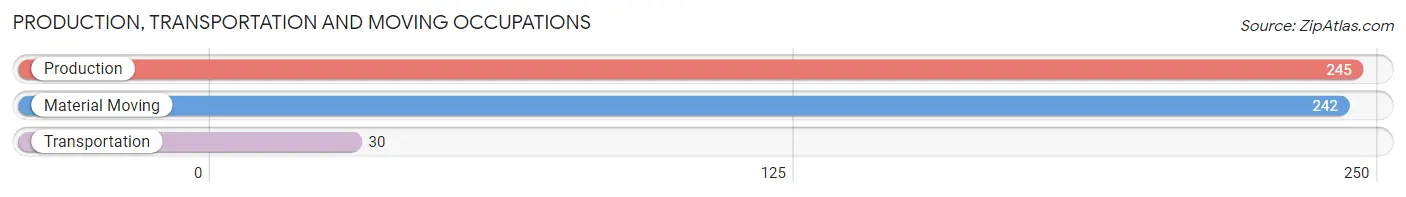
Production, Transportation and Moving Occupations
The most common Production, Transportation and Moving occupations in Blakely are Production (245 | 11.8%), Material Moving (242 | 11.7%), and Transportation (30 | 1.5%).
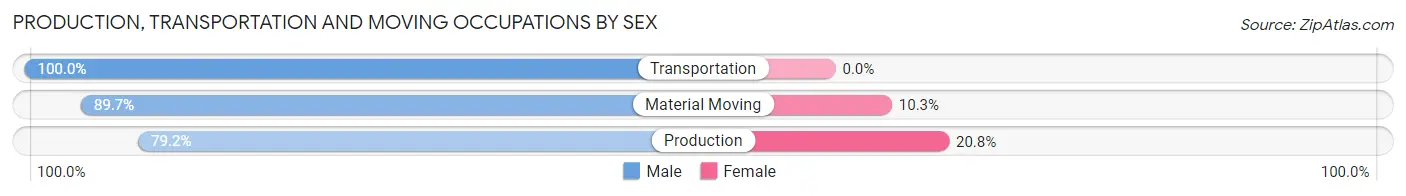
Production, Transportation and Moving Occupations by Sex
| Occupation | Male | Female |
| Production | 194 (79.2%) | 51 (20.8%) |
| Transportation | 30 (100.0%) | 0 (0.0%) |
| Material Moving | 217 (89.7%) | 25 (10.3%) |
| Total (Category) | 441 (85.3%) | 76 (14.7%) |
| Total (Overall) | 922 (44.4%) | 1,154 (55.6%) |
Employment Industries by Sex in Blakely
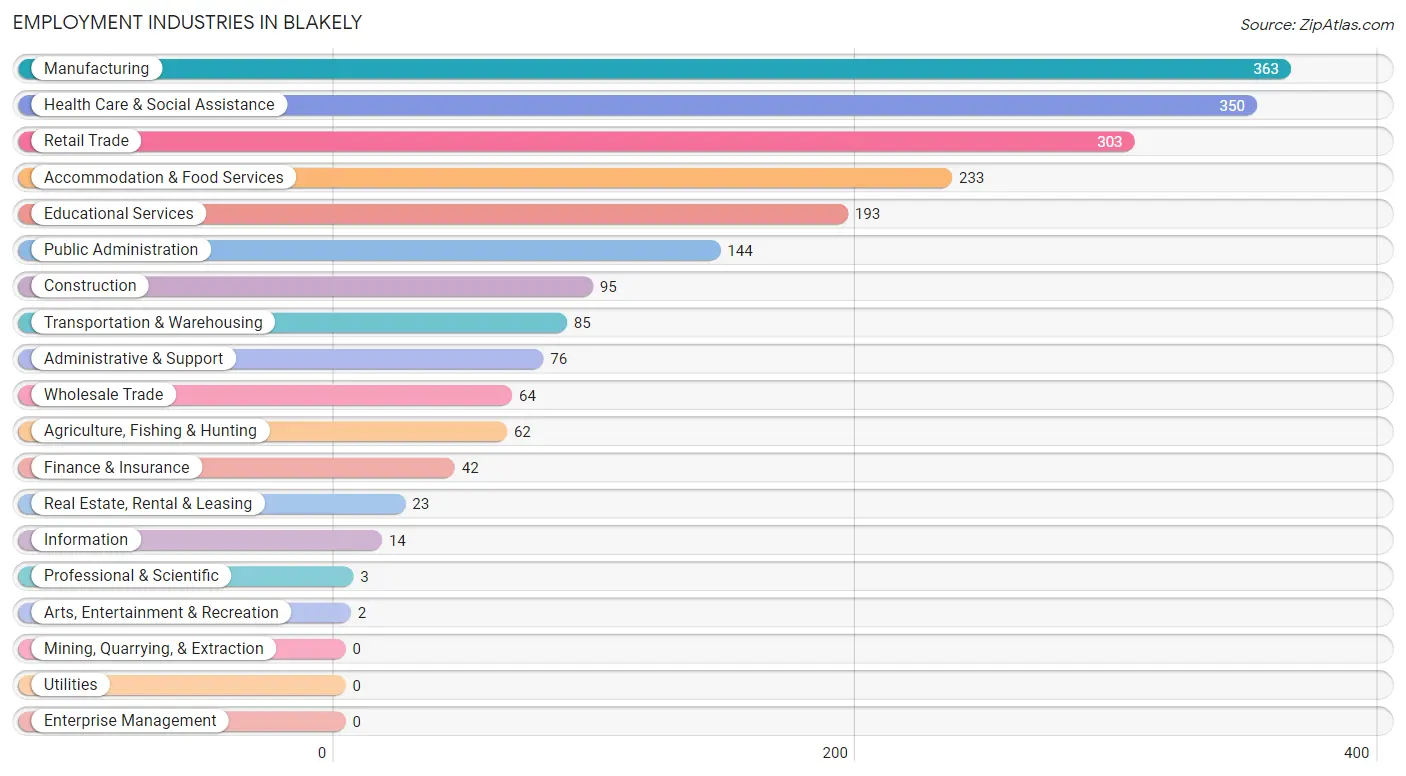
Employment Industries in Blakely
The major employment industries in Blakely include Manufacturing (363 | 17.5%), Health Care & Social Assistance (350 | 16.9%), Retail Trade (303 | 14.6%), Accommodation & Food Services (233 | 11.2%), and Educational Services (193 | 9.3%).
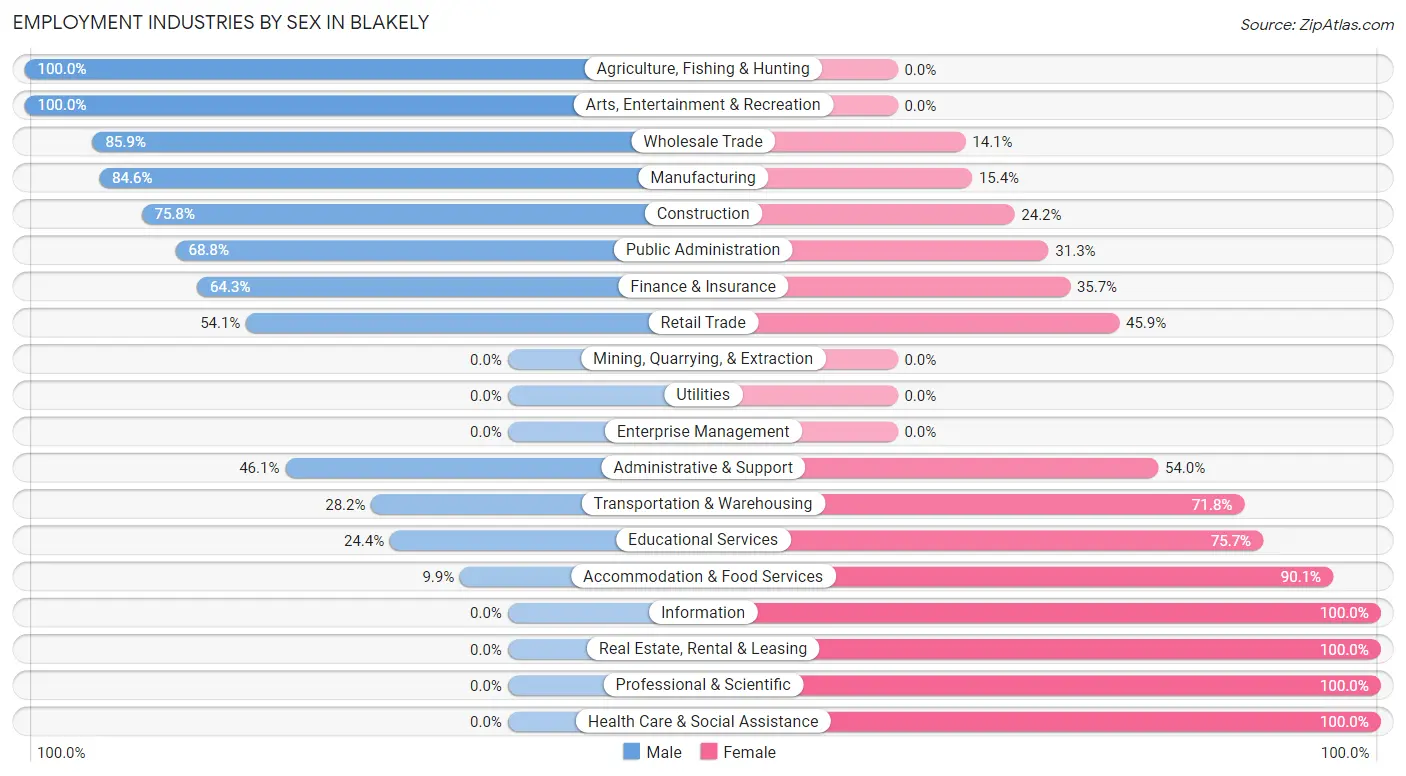
Employment Industries by Sex in Blakely
The Blakely industries that see more men than women are Agriculture, Fishing & Hunting (100.0%), Arts, Entertainment & Recreation (100.0%), and Wholesale Trade (85.9%), whereas the industries that tend to have a higher number of women are Information (100.0%), Real Estate, Rental & Leasing (100.0%), and Professional & Scientific (100.0%).
| Industry | Male | Female |
| Agriculture, Fishing & Hunting | 62 (100.0%) | 0 (0.0%) |
| Mining, Quarrying, & Extraction | 0 (0.0%) | 0 (0.0%) |
| Construction | 72 (75.8%) | 23 (24.2%) |
| Manufacturing | 307 (84.6%) | 56 (15.4%) |
| Wholesale Trade | 55 (85.9%) | 9 (14.1%) |
| Retail Trade | 164 (54.1%) | 139 (45.9%) |
| Transportation & Warehousing | 24 (28.2%) | 61 (71.8%) |
| Utilities | 0 (0.0%) | 0 (0.0%) |
| Information | 0 (0.0%) | 14 (100.0%) |
| Finance & Insurance | 27 (64.3%) | 15 (35.7%) |
| Real Estate, Rental & Leasing | 0 (0.0%) | 23 (100.0%) |
| Professional & Scientific | 0 (0.0%) | 3 (100.0%) |
| Enterprise Management | 0 (0.0%) | 0 (0.0%) |
| Administrative & Support | 35 (46.1%) | 41 (53.9%) |
| Educational Services | 47 (24.3%) | 146 (75.6%) |
| Health Care & Social Assistance | 0 (0.0%) | 350 (100.0%) |
| Arts, Entertainment & Recreation | 2 (100.0%) | 0 (0.0%) |
| Accommodation & Food Services | 23 (9.9%) | 210 (90.1%) |
| Public Administration | 99 (68.8%) | 45 (31.2%) |
| Total | 922 (44.4%) | 1,154 (55.6%) |
Education in Blakely
School Enrollment in Blakely
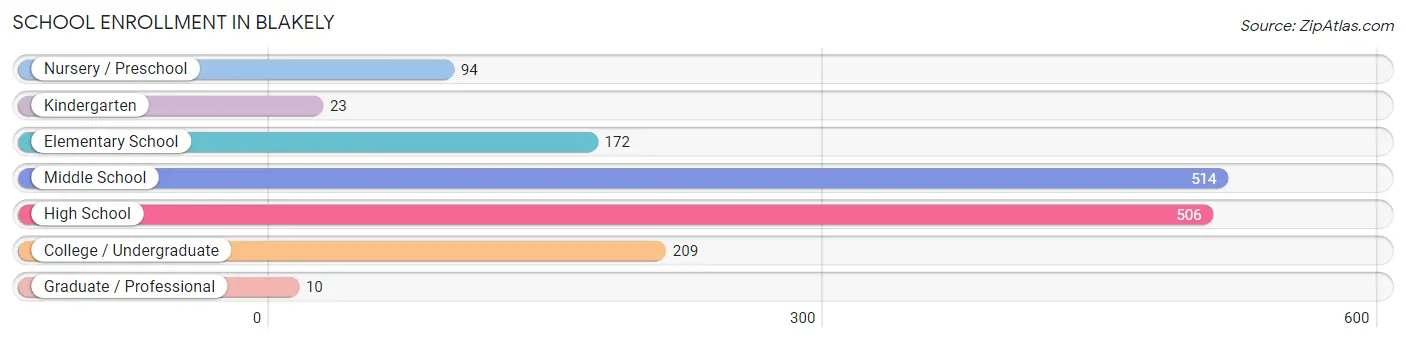
The most common levels of schooling among the 1,528 students in Blakely are middle school (514 | 33.6%), high school (506 | 33.1%), and college / undergraduate (209 | 13.7%).
| School Level | # Students | % Students |
| Nursery / Preschool | 94 | 6.1% |
| Kindergarten | 23 | 1.5% |
| Elementary School | 172 | 11.3% |
| Middle School | 514 | 33.6% |
| High School | 506 | 33.1% |
| College / Undergraduate | 209 | 13.7% |
| Graduate / Professional | 10 | 0.6% |
| Total | 1,528 | 100.0% |
School Enrollment by Age by Funding Source in Blakely
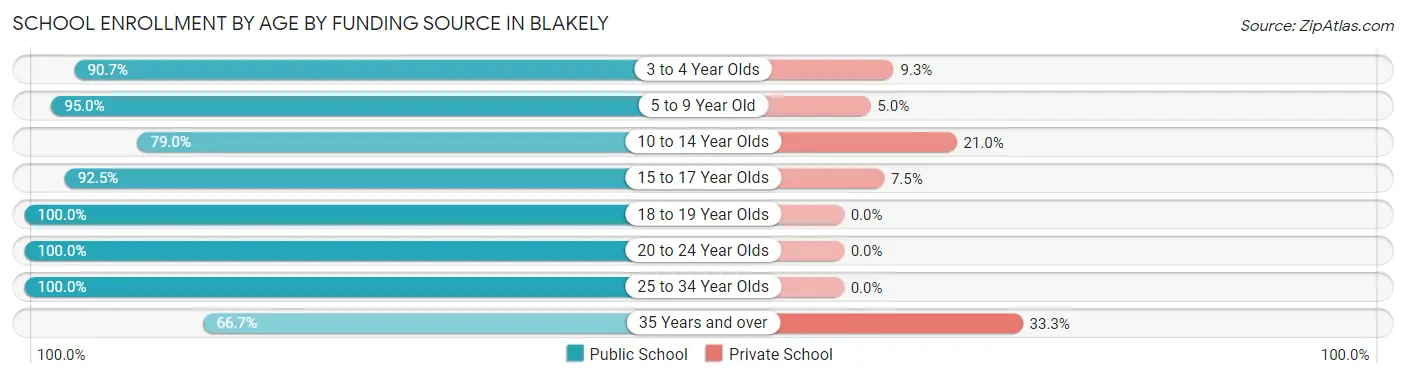
Out of a total of 1,528 students who are enrolled in schools in Blakely, 173 (11.3%) attend a private institution, while the remaining 1,355 (88.7%) are enrolled in public schools. The age group of 35 years and over has the highest likelihood of being enrolled in private schools, with 4 (33.3% in the age bracket) enrolled. Conversely, the age group of 18 to 19 year olds has the lowest likelihood of being enrolled in a private school, with 152 (100.0% in the age bracket) attending a public institution.
| Age Bracket | Public School | Private School |
| 3 to 4 Year Olds | 39 (90.7%) | 4 (9.3%) |
| 5 to 9 Year Old | 229 (95.0%) | 12 (5.0%) |
| 10 to 14 Year Olds | 488 (79.0%) | 130 (21.0%) |
| 15 to 17 Year Olds | 271 (92.5%) | 22 (7.5%) |
| 18 to 19 Year Olds | 152 (100.0%) | 0 (0.0%) |
| 20 to 24 Year Olds | 162 (100.0%) | 0 (0.0%) |
| 25 to 34 Year Olds | 7 (100.0%) | 0 (0.0%) |
| 35 Years and over | 8 (66.7%) | 4 (33.3%) |
| Total | 1,355 (88.7%) | 173 (11.3%) |
Educational Attainment by Field of Study in Blakely
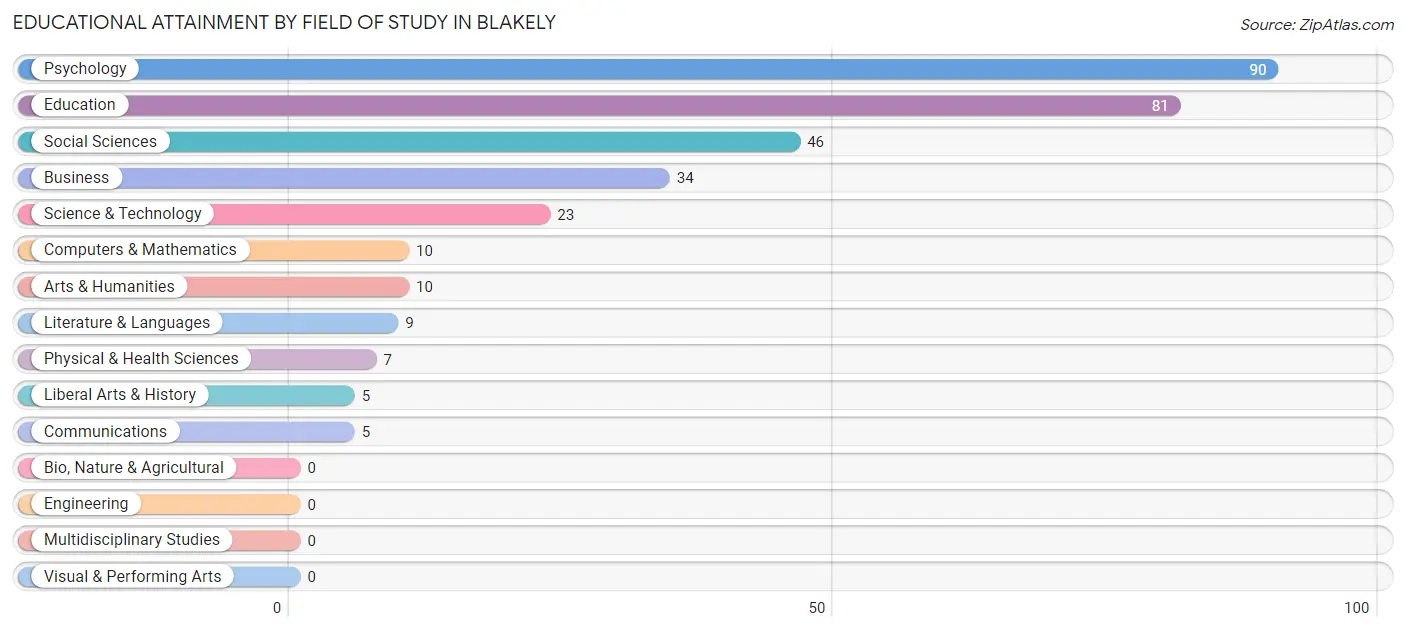
Psychology (90 | 28.1%), education (81 | 25.3%), social sciences (46 | 14.4%), business (34 | 10.6%), and science & technology (23 | 7.2%) are the most common fields of study among 320 individuals in Blakely who have obtained a bachelor's degree or higher.
| Field of Study | # Graduates | % Graduates |
| Computers & Mathematics | 10 | 3.1% |
| Bio, Nature & Agricultural | 0 | 0.0% |
| Physical & Health Sciences | 7 | 2.2% |
| Psychology | 90 | 28.1% |
| Social Sciences | 46 | 14.4% |
| Engineering | 0 | 0.0% |
| Multidisciplinary Studies | 0 | 0.0% |
| Science & Technology | 23 | 7.2% |
| Business | 34 | 10.6% |
| Education | 81 | 25.3% |
| Literature & Languages | 9 | 2.8% |
| Liberal Arts & History | 5 | 1.6% |
| Visual & Performing Arts | 0 | 0.0% |
| Communications | 5 | 1.6% |
| Arts & Humanities | 10 | 3.1% |
| Total | 320 | 100.0% |
Transportation & Commute in Blakely
Vehicle Availability by Sex in Blakely
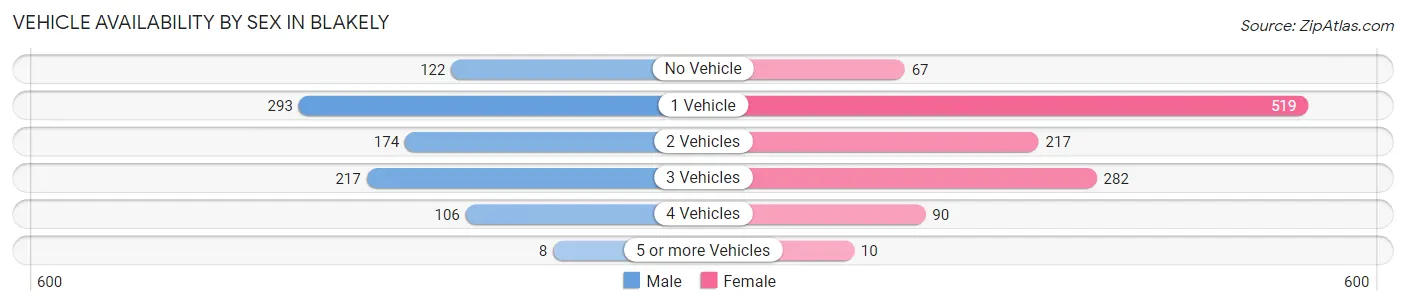
The most prevalent vehicle ownership categories in Blakely are males with 1 vehicle (293, accounting for 31.9%) and females with 1 vehicle (519, making up 24.7%).
| Vehicles Available | Male | Female |
| No Vehicle | 122 (13.3%) | 67 (5.7%) |
| 1 Vehicle | 293 (31.9%) | 519 (43.8%) |
| 2 Vehicles | 174 (18.9%) | 217 (18.3%) |
| 3 Vehicles | 217 (23.6%) | 282 (23.8%) |
| 4 Vehicles | 106 (11.5%) | 90 (7.6%) |
| 5 or more Vehicles | 8 (0.9%) | 10 (0.8%) |
| Total | 920 (100.0%) | 1,185 (100.0%) |
Commute Time in Blakely
The most frequently occuring commute durations in Blakely are 5 to 9 minutes (419 commuters, 21.2%), 10 to 14 minutes (294 commuters, 14.9%), and less than 5 minutes (232 commuters, 11.7%).
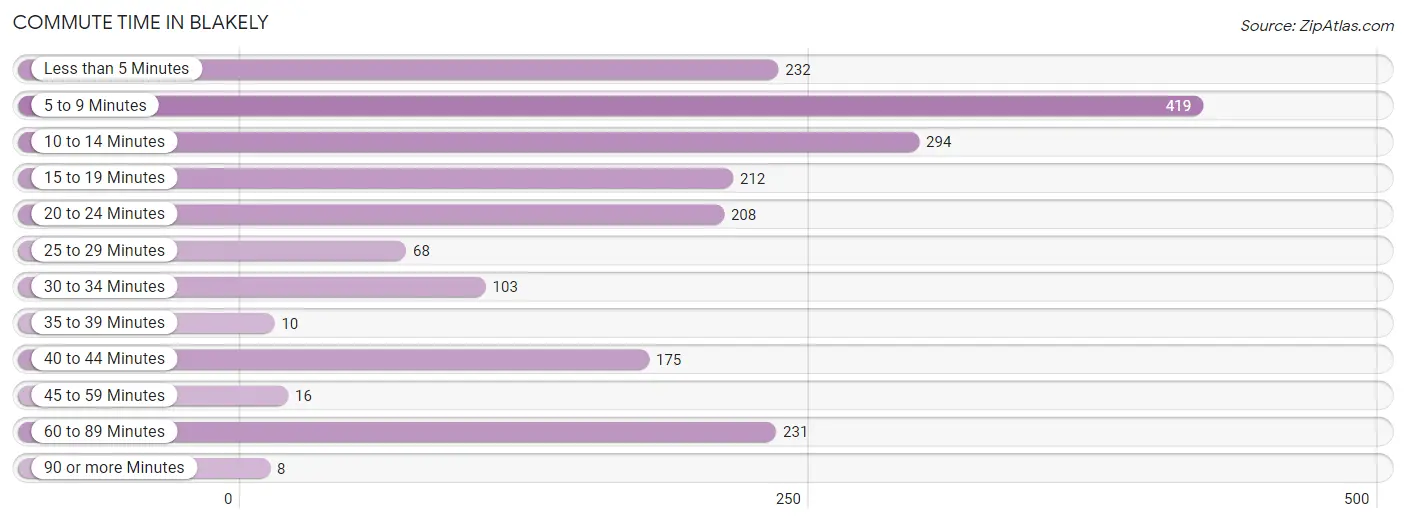
| Commute Time | # Commuters | % Commuters |
| Less than 5 Minutes | 232 | 11.7% |
| 5 to 9 Minutes | 419 | 21.2% |
| 10 to 14 Minutes | 294 | 14.9% |
| 15 to 19 Minutes | 212 | 10.7% |
| 20 to 24 Minutes | 208 | 10.5% |
| 25 to 29 Minutes | 68 | 3.4% |
| 30 to 34 Minutes | 103 | 5.2% |
| 35 to 39 Minutes | 10 | 0.5% |
| 40 to 44 Minutes | 175 | 8.9% |
| 45 to 59 Minutes | 16 | 0.8% |
| 60 to 89 Minutes | 231 | 11.7% |
| 90 or more Minutes | 8 | 0.4% |
Commute Time by Sex in Blakely
The most common commute times in Blakely are 5 to 9 minutes (288 commuters, 32.0%) for males and 10 to 14 minutes (241 commuters, 22.4%) for females.
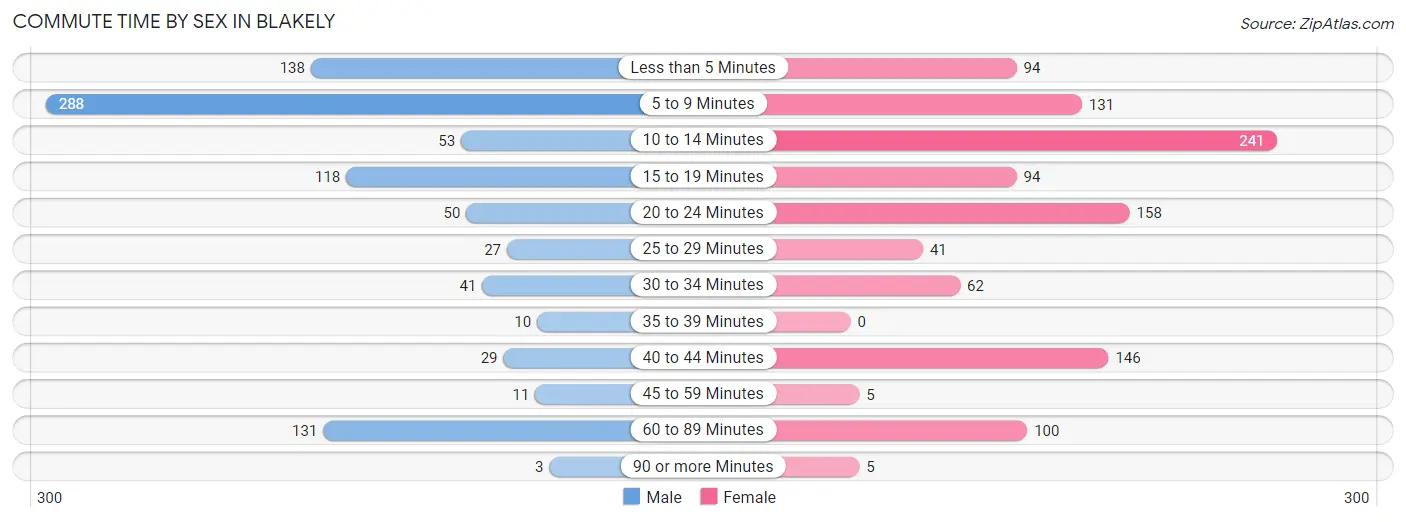
| Commute Time | Male | Female |
| Less than 5 Minutes | 138 (15.3%) | 94 (8.7%) |
| 5 to 9 Minutes | 288 (32.0%) | 131 (12.2%) |
| 10 to 14 Minutes | 53 (5.9%) | 241 (22.4%) |
| 15 to 19 Minutes | 118 (13.1%) | 94 (8.7%) |
| 20 to 24 Minutes | 50 (5.6%) | 158 (14.7%) |
| 25 to 29 Minutes | 27 (3.0%) | 41 (3.8%) |
| 30 to 34 Minutes | 41 (4.6%) | 62 (5.8%) |
| 35 to 39 Minutes | 10 (1.1%) | 0 (0.0%) |
| 40 to 44 Minutes | 29 (3.2%) | 146 (13.6%) |
| 45 to 59 Minutes | 11 (1.2%) | 5 (0.5%) |
| 60 to 89 Minutes | 131 (14.6%) | 100 (9.3%) |
| 90 or more Minutes | 3 (0.3%) | 5 (0.5%) |
Time of Departure to Work by Sex in Blakely
The most frequent times of departure to work in Blakely are 5:00 AM to 5:29 AM (155, 17.2%) for males and 4:00 PM to 11:59 PM (183, 17.0%) for females.
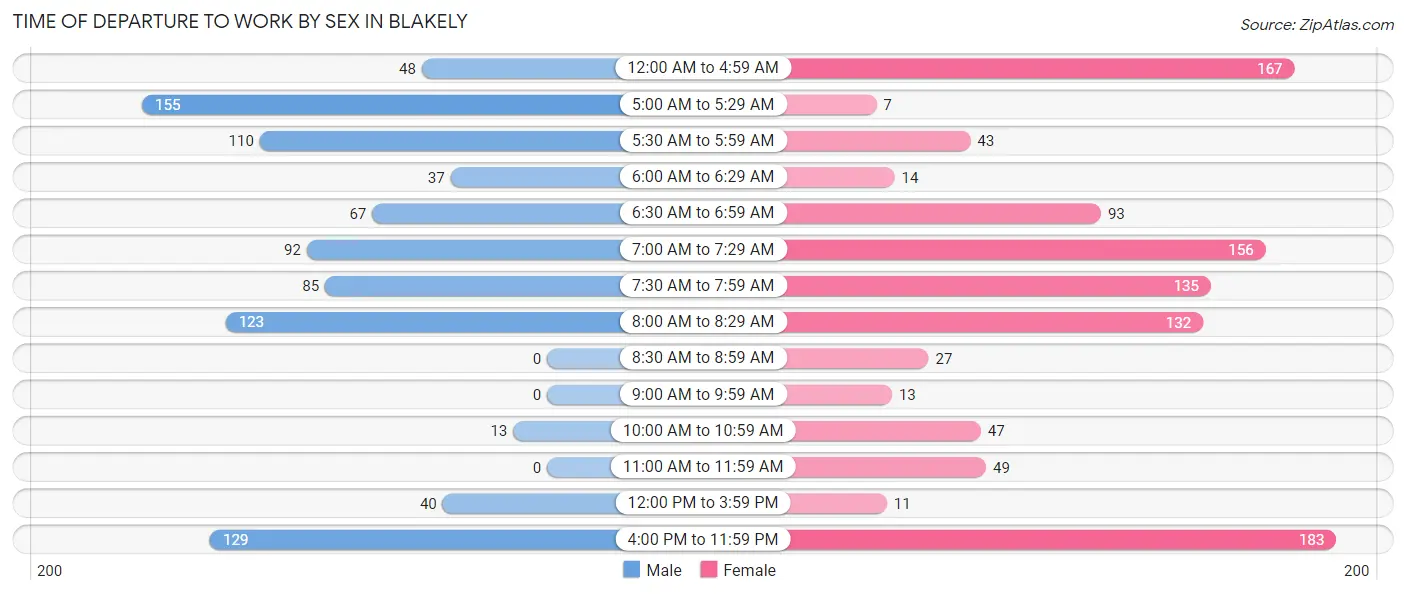
| Time of Departure | Male | Female |
| 12:00 AM to 4:59 AM | 48 (5.3%) | 167 (15.5%) |
| 5:00 AM to 5:29 AM | 155 (17.2%) | 7 (0.6%) |
| 5:30 AM to 5:59 AM | 110 (12.2%) | 43 (4.0%) |
| 6:00 AM to 6:29 AM | 37 (4.1%) | 14 (1.3%) |
| 6:30 AM to 6:59 AM | 67 (7.4%) | 93 (8.6%) |
| 7:00 AM to 7:29 AM | 92 (10.2%) | 156 (14.5%) |
| 7:30 AM to 7:59 AM | 85 (9.5%) | 135 (12.5%) |
| 8:00 AM to 8:29 AM | 123 (13.7%) | 132 (12.3%) |
| 8:30 AM to 8:59 AM | 0 (0.0%) | 27 (2.5%) |
| 9:00 AM to 9:59 AM | 0 (0.0%) | 13 (1.2%) |
| 10:00 AM to 10:59 AM | 13 (1.5%) | 47 (4.4%) |
| 11:00 AM to 11:59 AM | 0 (0.0%) | 49 (4.5%) |
| 12:00 PM to 3:59 PM | 40 (4.4%) | 11 (1.0%) |
| 4:00 PM to 11:59 PM | 129 (14.3%) | 183 (17.0%) |
| Total | 899 (100.0%) | 1,077 (100.0%) |
Housing Occupancy in Blakely
Occupancy by Ownership in Blakely
Of the total 1,610 dwellings in Blakely, owner-occupied units account for 787 (48.9%), while renter-occupied units make up 823 (51.1%).
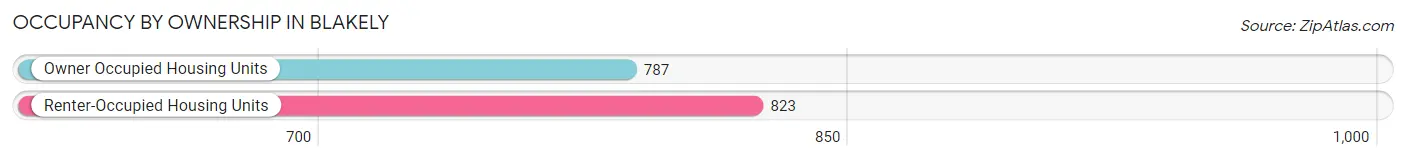
| Occupancy | # Housing Units | % Housing Units |
| Owner Occupied Housing Units | 787 | 48.9% |
| Renter-Occupied Housing Units | 823 | 51.1% |
| Total Occupied Housing Units | 1,610 | 100.0% |
Occupancy by Household Size in Blakely
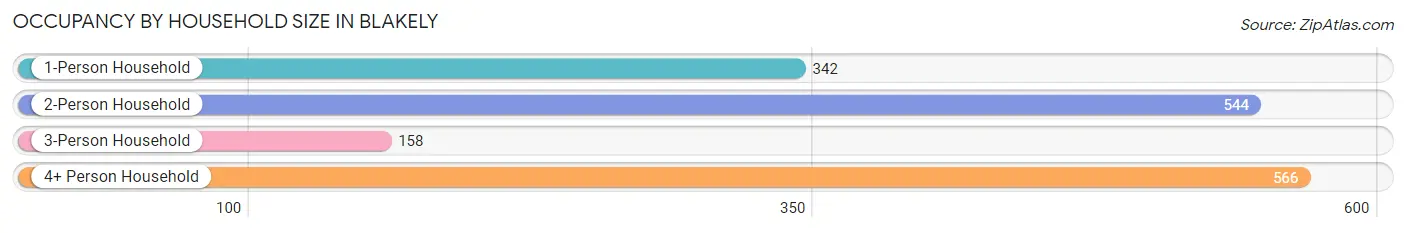
| Household Size | # Housing Units | % Housing Units |
| 1-Person Household | 342 | 21.2% |
| 2-Person Household | 544 | 33.8% |
| 3-Person Household | 158 | 9.8% |
| 4+ Person Household | 566 | 35.2% |
| Total Housing Units | 1,610 | 100.0% |
Occupancy by Ownership by Household Size in Blakely
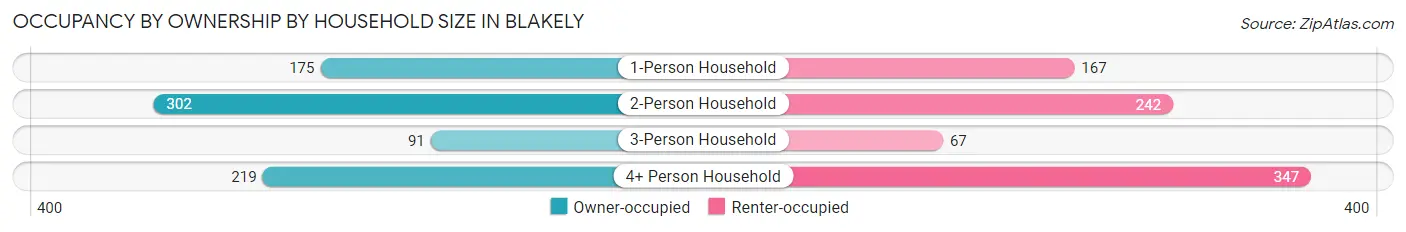
| Household Size | Owner-occupied | Renter-occupied |
| 1-Person Household | 175 (51.2%) | 167 (48.8%) |
| 2-Person Household | 302 (55.5%) | 242 (44.5%) |
| 3-Person Household | 91 (57.6%) | 67 (42.4%) |
| 4+ Person Household | 219 (38.7%) | 347 (61.3%) |
| Total Housing Units | 787 (48.9%) | 823 (51.1%) |
Occupancy by Educational Attainment in Blakely
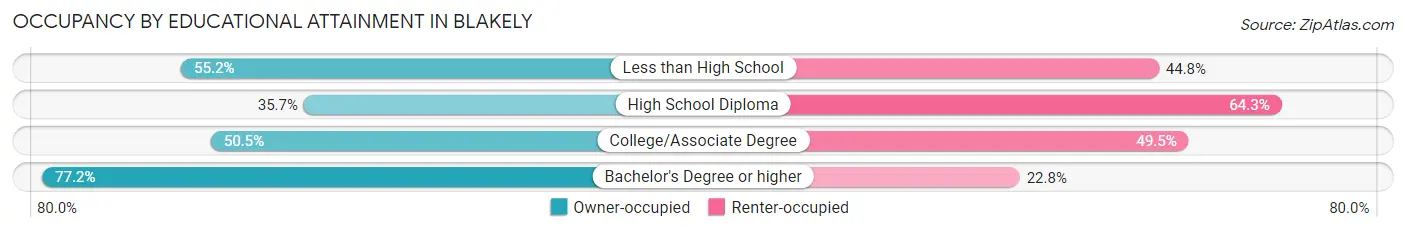
| Household Size | Owner-occupied | Renter-occupied |
| Less than High School | 155 (55.2%) | 126 (44.8%) |
| High School Diploma | 239 (35.7%) | 430 (64.3%) |
| College/Associate Degree | 220 (50.5%) | 216 (49.5%) |
| Bachelor's Degree or higher | 173 (77.2%) | 51 (22.8%) |
Occupancy by Age of Householder in Blakely
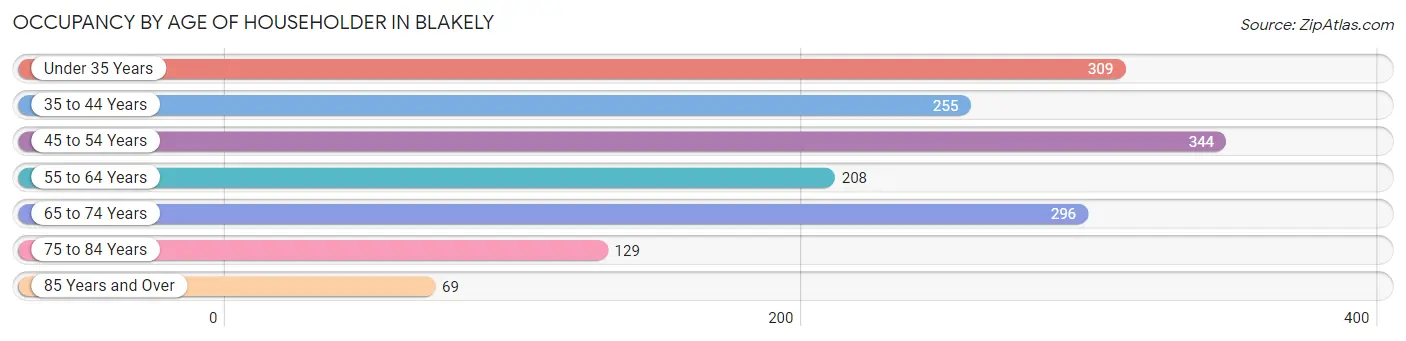
| Age Bracket | # Households | % Households |
| Under 35 Years | 309 | 19.2% |
| 35 to 44 Years | 255 | 15.8% |
| 45 to 54 Years | 344 | 21.4% |
| 55 to 64 Years | 208 | 12.9% |
| 65 to 74 Years | 296 | 18.4% |
| 75 to 84 Years | 129 | 8.0% |
| 85 Years and Over | 69 | 4.3% |
| Total | 1,610 | 100.0% |
Housing Finances in Blakely
Median Income by Occupancy in Blakely
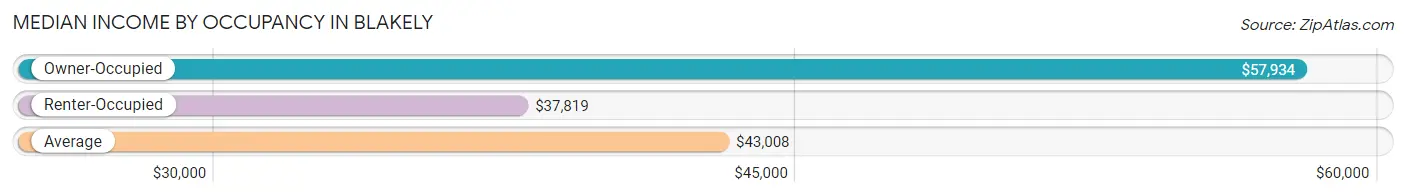
| Occupancy Type | # Households | Median Income |
| Owner-Occupied | 787 (48.9%) | $57,934 |
| Renter-Occupied | 823 (51.1%) | $37,819 |
| Average | 1,610 (100.0%) | $43,008 |
Occupancy by Householder Income Bracket in Blakely
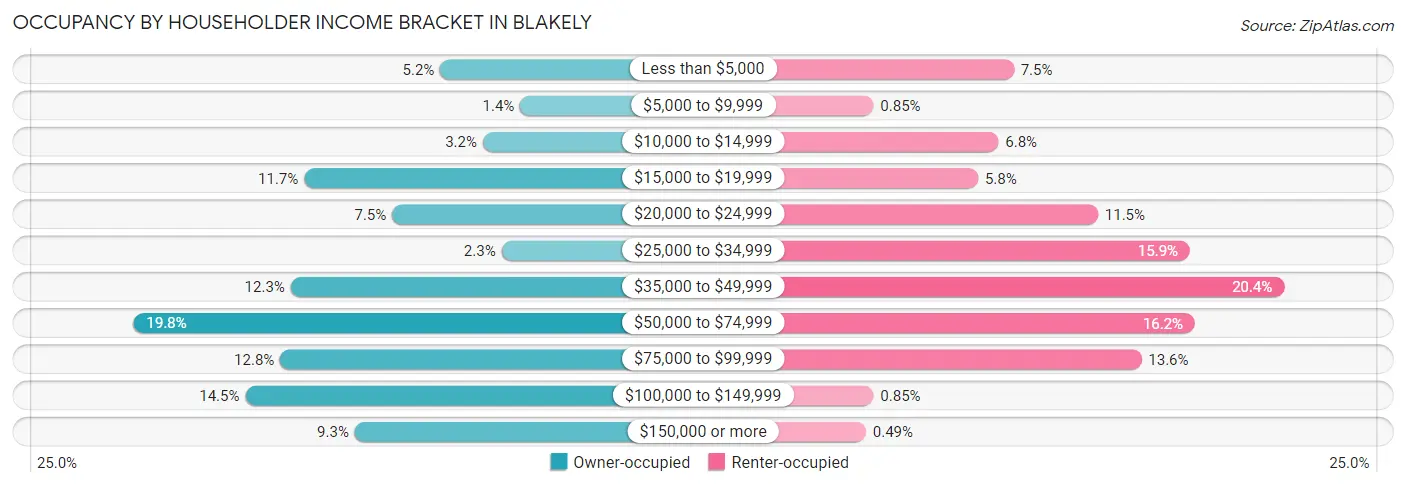
| Income Bracket | Owner-occupied | Renter-occupied |
| Less than $5,000 | 41 (5.2%) | 62 (7.5%) |
| $5,000 to $9,999 | 11 (1.4%) | 7 (0.9%) |
| $10,000 to $14,999 | 25 (3.2%) | 56 (6.8%) |
| $15,000 to $19,999 | 92 (11.7%) | 48 (5.8%) |
| $20,000 to $24,999 | 59 (7.5%) | 95 (11.5%) |
| $25,000 to $34,999 | 18 (2.3%) | 131 (15.9%) |
| $35,000 to $49,999 | 97 (12.3%) | 168 (20.4%) |
| $50,000 to $74,999 | 156 (19.8%) | 133 (16.2%) |
| $75,000 to $99,999 | 101 (12.8%) | 112 (13.6%) |
| $100,000 to $149,999 | 114 (14.5%) | 7 (0.9%) |
| $150,000 or more | 73 (9.3%) | 4 (0.5%) |
| Total | 787 (100.0%) | 823 (100.0%) |
Monthly Housing Cost Tiers in Blakely
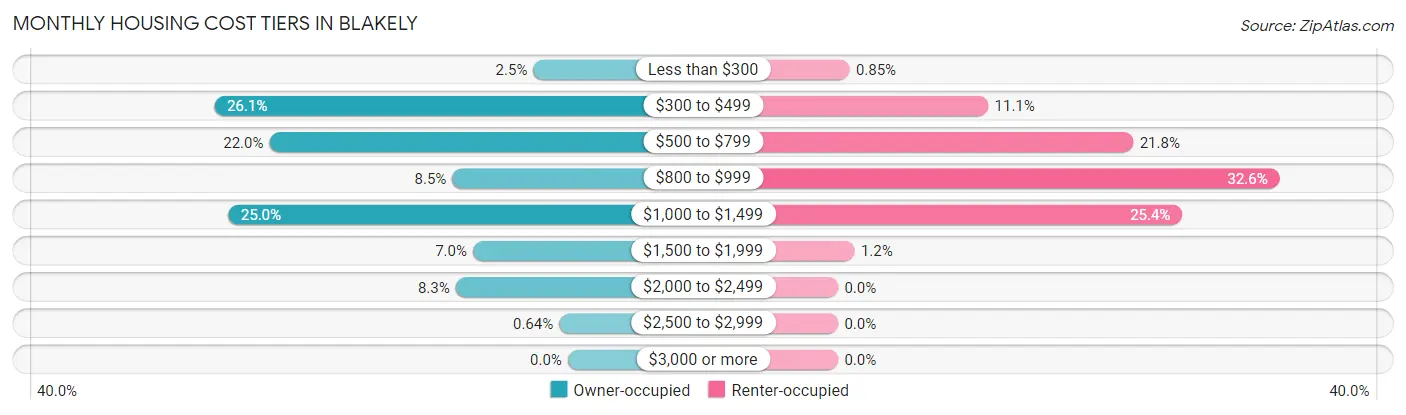
| Monthly Cost | Owner-occupied | Renter-occupied |
| Less than $300 | 20 (2.5%) | 7 (0.9%) |
| $300 to $499 | 205 (26.1%) | 91 (11.1%) |
| $500 to $799 | 173 (22.0%) | 179 (21.7%) |
| $800 to $999 | 67 (8.5%) | 268 (32.6%) |
| $1,000 to $1,499 | 197 (25.0%) | 209 (25.4%) |
| $1,500 to $1,999 | 55 (7.0%) | 10 (1.2%) |
| $2,000 to $2,499 | 65 (8.3%) | 0 (0.0%) |
| $2,500 to $2,999 | 5 (0.6%) | 0 (0.0%) |
| $3,000 or more | 0 (0.0%) | 0 (0.0%) |
| Total | 787 (100.0%) | 823 (100.0%) |
Physical Housing Characteristics in Blakely
Housing Structures in Blakely
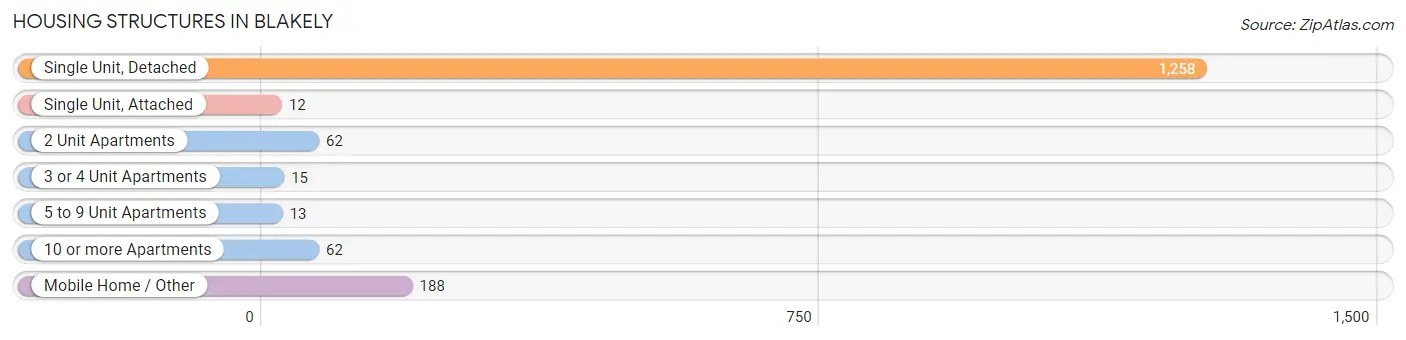
| Structure Type | # Housing Units | % Housing Units |
| Single Unit, Detached | 1,258 | 78.1% |
| Single Unit, Attached | 12 | 0.7% |
| 2 Unit Apartments | 62 | 3.8% |
| 3 or 4 Unit Apartments | 15 | 0.9% |
| 5 to 9 Unit Apartments | 13 | 0.8% |
| 10 or more Apartments | 62 | 3.8% |
| Mobile Home / Other | 188 | 11.7% |
| Total | 1,610 | 100.0% |
Housing Structures by Occupancy in Blakely
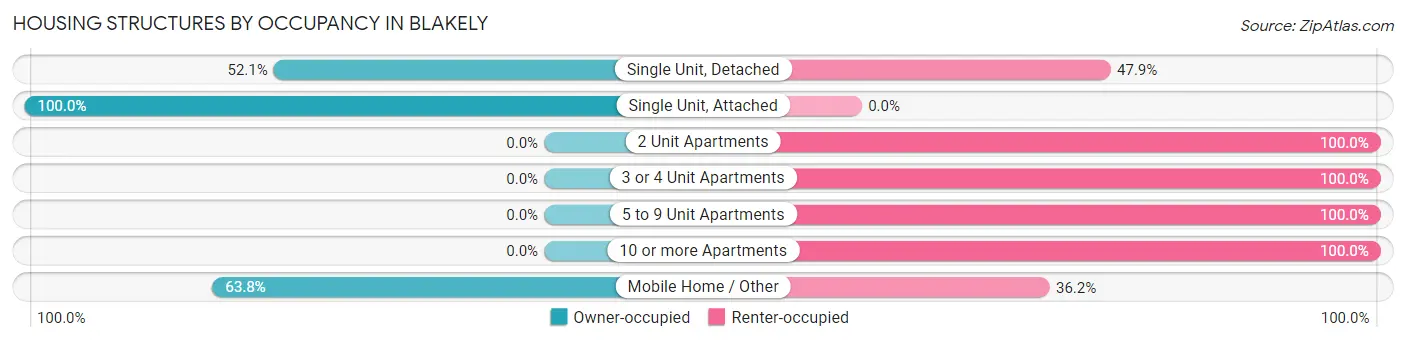
| Structure Type | Owner-occupied | Renter-occupied |
| Single Unit, Detached | 655 (52.1%) | 603 (47.9%) |
| Single Unit, Attached | 12 (100.0%) | 0 (0.0%) |
| 2 Unit Apartments | 0 (0.0%) | 62 (100.0%) |
| 3 or 4 Unit Apartments | 0 (0.0%) | 15 (100.0%) |
| 5 to 9 Unit Apartments | 0 (0.0%) | 13 (100.0%) |
| 10 or more Apartments | 0 (0.0%) | 62 (100.0%) |
| Mobile Home / Other | 120 (63.8%) | 68 (36.2%) |
| Total | 787 (48.9%) | 823 (51.1%) |
Housing Structures by Number of Rooms in Blakely
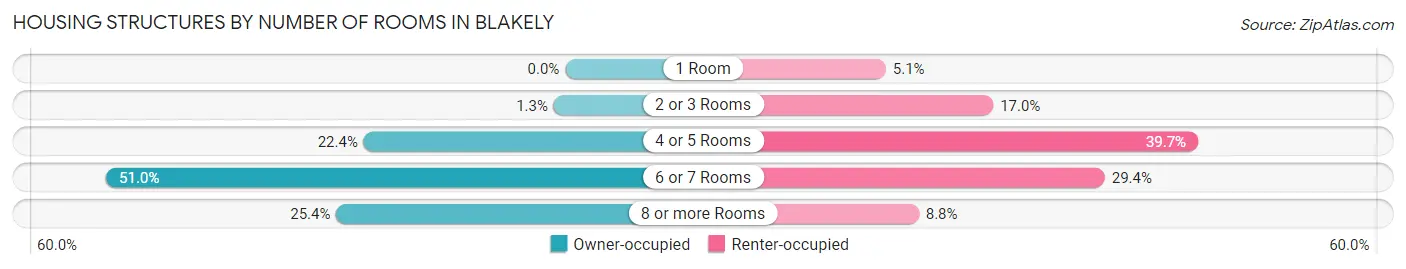
| Number of Rooms | Owner-occupied | Renter-occupied |
| 1 Room | 0 (0.0%) | 42 (5.1%) |
| 2 or 3 Rooms | 10 (1.3%) | 140 (17.0%) |
| 4 or 5 Rooms | 176 (22.4%) | 327 (39.7%) |
| 6 or 7 Rooms | 401 (50.9%) | 242 (29.4%) |
| 8 or more Rooms | 200 (25.4%) | 72 (8.7%) |
| Total | 787 (100.0%) | 823 (100.0%) |
Housing Structure by Heating Type in Blakely
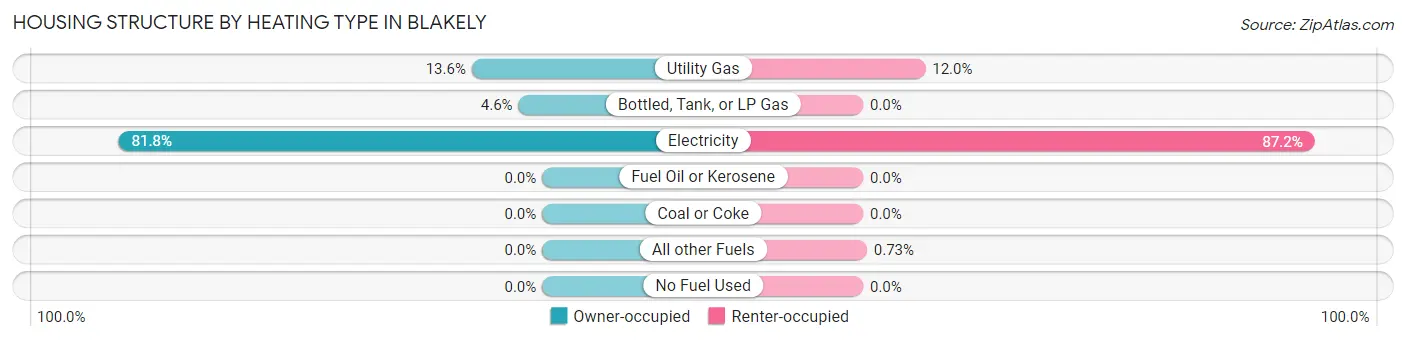
| Heating Type | Owner-occupied | Renter-occupied |
| Utility Gas | 107 (13.6%) | 99 (12.0%) |
| Bottled, Tank, or LP Gas | 36 (4.6%) | 0 (0.0%) |
| Electricity | 644 (81.8%) | 718 (87.2%) |
| Fuel Oil or Kerosene | 0 (0.0%) | 0 (0.0%) |
| Coal or Coke | 0 (0.0%) | 0 (0.0%) |
| All other Fuels | 0 (0.0%) | 6 (0.7%) |
| No Fuel Used | 0 (0.0%) | 0 (0.0%) |
| Total | 787 (100.0%) | 823 (100.0%) |
Household Vehicle Usage in Blakely
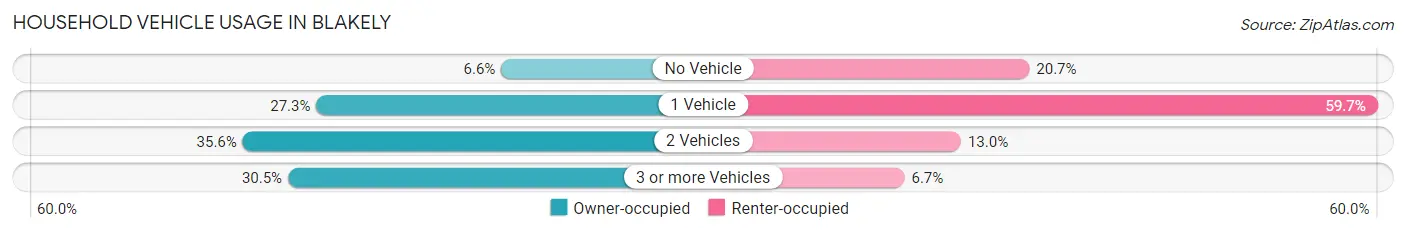
| Vehicles per Household | Owner-occupied | Renter-occupied |
| No Vehicle | 52 (6.6%) | 170 (20.7%) |
| 1 Vehicle | 215 (27.3%) | 491 (59.7%) |
| 2 Vehicles | 280 (35.6%) | 107 (13.0%) |
| 3 or more Vehicles | 240 (30.5%) | 55 (6.7%) |
| Total | 787 (100.0%) | 823 (100.0%) |
Real Estate & Mortgages in Blakely
Real Estate and Mortgage Overview in Blakely
| Characteristic | Without Mortgage | With Mortgage |
| Housing Units | 437 | 350 |
| Median Property Value | $154,200 | $128,800 |
| Median Household Income | $39,375 | $69 |
| Monthly Housing Costs | $501 | $0 |
| Real Estate Taxes | $1,311 | $19 |
Property Value by Mortgage Status in Blakely
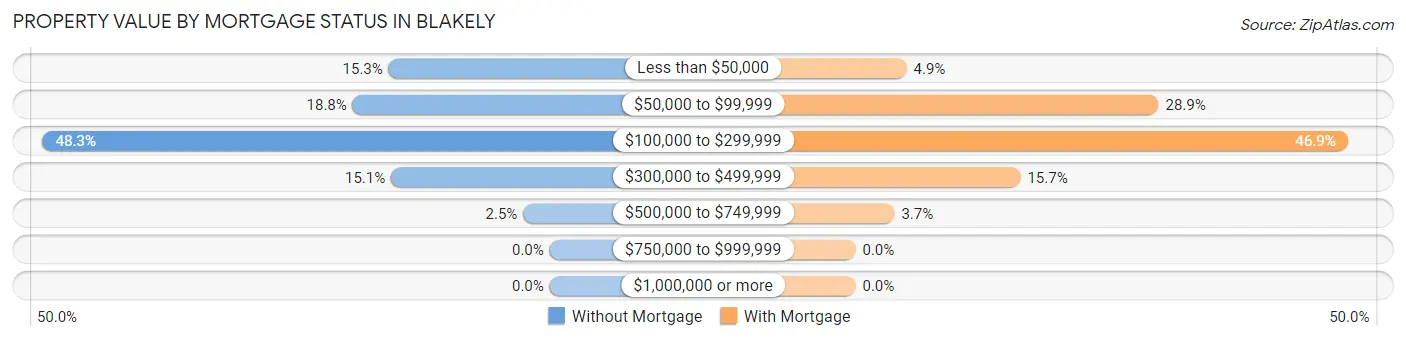
| Property Value | Without Mortgage | With Mortgage |
| Less than $50,000 | 67 (15.3%) | 17 (4.9%) |
| $50,000 to $99,999 | 82 (18.8%) | 101 (28.9%) |
| $100,000 to $299,999 | 211 (48.3%) | 164 (46.9%) |
| $300,000 to $499,999 | 66 (15.1%) | 55 (15.7%) |
| $500,000 to $749,999 | 11 (2.5%) | 13 (3.7%) |
| $750,000 to $999,999 | 0 (0.0%) | 0 (0.0%) |
| $1,000,000 or more | 0 (0.0%) | 0 (0.0%) |
| Total | 437 (100.0%) | 350 (100.0%) |
Household Income by Mortgage Status in Blakely
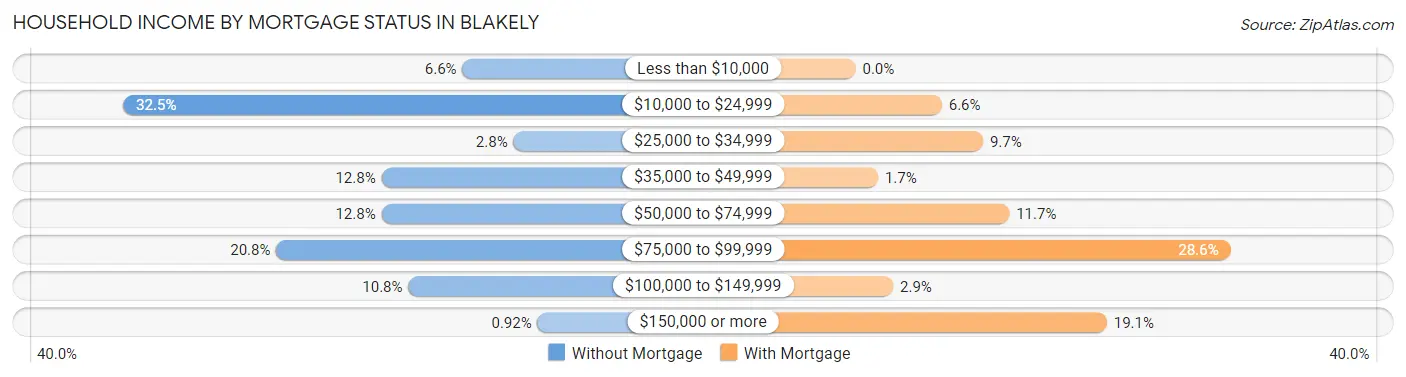
| Household Income | Without Mortgage | With Mortgage |
| Less than $10,000 | 29 (6.6%) | 0 (0.0%) |
| $10,000 to $24,999 | 142 (32.5%) | 23 (6.6%) |
| $25,000 to $34,999 | 12 (2.8%) | 34 (9.7%) |
| $35,000 to $49,999 | 56 (12.8%) | 6 (1.7%) |
| $50,000 to $74,999 | 56 (12.8%) | 41 (11.7%) |
| $75,000 to $99,999 | 91 (20.8%) | 100 (28.6%) |
| $100,000 to $149,999 | 47 (10.8%) | 10 (2.9%) |
| $150,000 or more | 4 (0.9%) | 67 (19.1%) |
| Total | 437 (100.0%) | 350 (100.0%) |
Property Value to Household Income Ratio in Blakely
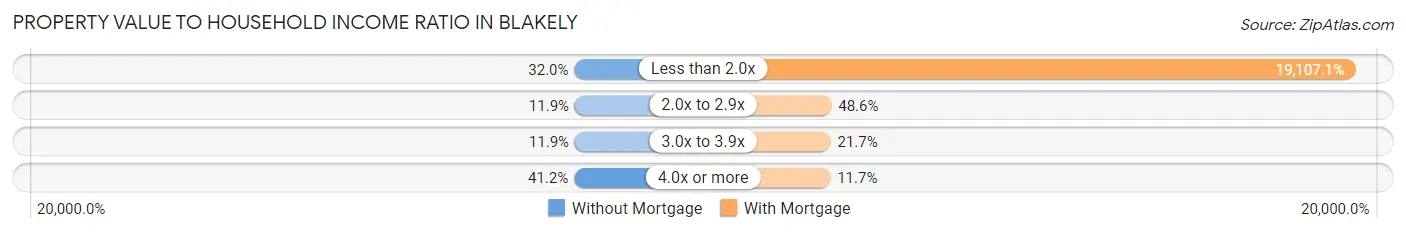
| Value-to-Income Ratio | Without Mortgage | With Mortgage |
| Less than 2.0x | 140 (32.0%) | 66,875 (19,107.1%) |
| 2.0x to 2.9x | 52 (11.9%) | 170 (48.6%) |
| 3.0x to 3.9x | 52 (11.9%) | 76 (21.7%) |
| 4.0x or more | 180 (41.2%) | 41 (11.7%) |
| Total | 437 (100.0%) | 350 (100.0%) |
Real Estate Taxes by Mortgage Status in Blakely
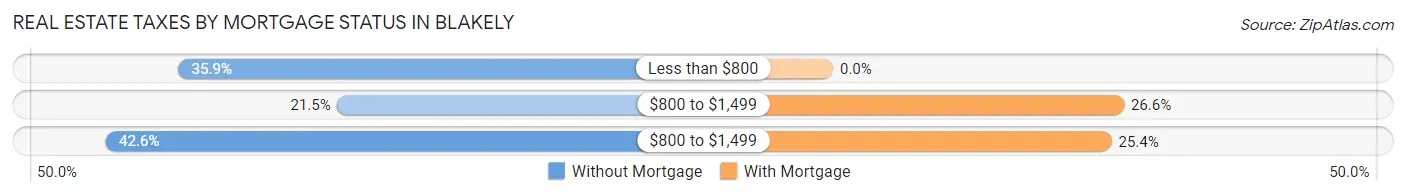
| Property Taxes | Without Mortgage | With Mortgage |
| Less than $800 | 157 (35.9%) | 0 (0.0%) |
| $800 to $1,499 | 94 (21.5%) | 93 (26.6%) |
| $800 to $1,499 | 186 (42.6%) | 89 (25.4%) |
| Total | 437 (100.0%) | 350 (100.0%) |
Health & Disability in Blakely
Health Insurance Coverage by Age in Blakely
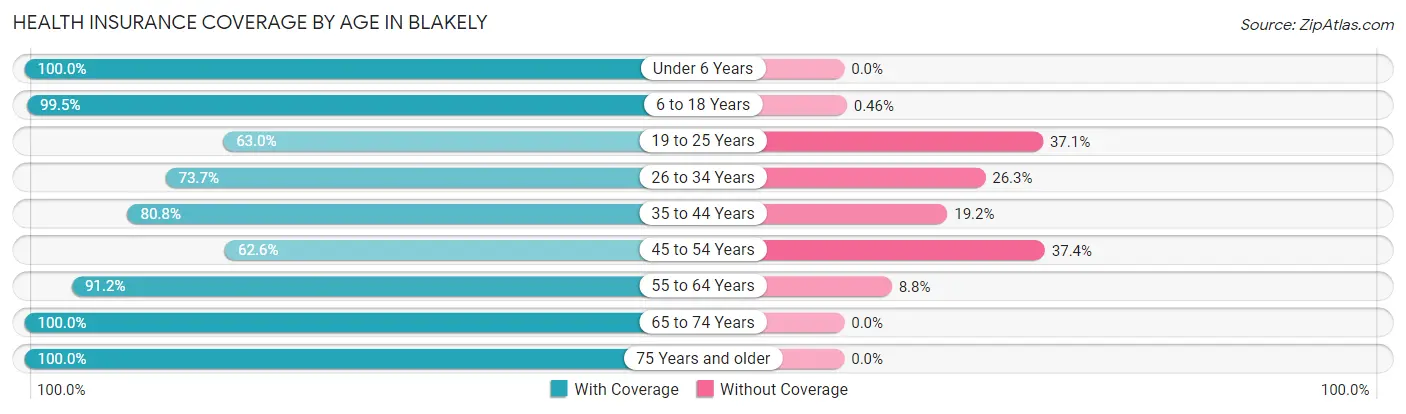
| Age Bracket | With Coverage | Without Coverage |
| Under 6 Years | 525 (100.0%) | 0 (0.0%) |
| 6 to 18 Years | 1,292 (99.5%) | 6 (0.5%) |
| 19 to 25 Years | 384 (62.9%) | 226 (37.0%) |
| 26 to 34 Years | 272 (73.7%) | 97 (26.3%) |
| 35 to 44 Years | 555 (80.8%) | 132 (19.2%) |
| 45 to 54 Years | 385 (62.6%) | 230 (37.4%) |
| 55 to 64 Years | 330 (91.2%) | 32 (8.8%) |
| 65 to 74 Years | 433 (100.0%) | 0 (0.0%) |
| 75 Years and older | 236 (100.0%) | 0 (0.0%) |
| Total | 4,412 (85.9%) | 723 (14.1%) |
Health Insurance Coverage by Citizenship Status in Blakely
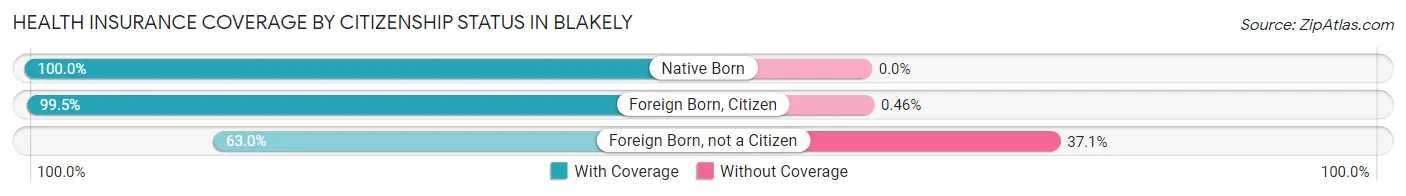
| Citizenship Status | With Coverage | Without Coverage |
| Native Born | 525 (100.0%) | 0 (0.0%) |
| Foreign Born, Citizen | 1,292 (99.5%) | 6 (0.5%) |
| Foreign Born, not a Citizen | 384 (62.9%) | 226 (37.0%) |
Health Insurance Coverage by Household Income in Blakely
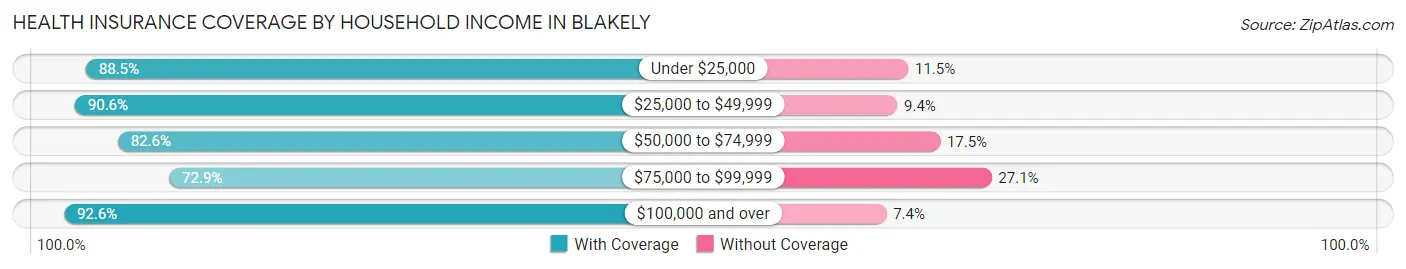
| Household Income | With Coverage | Without Coverage |
| Under $25,000 | 1,102 (88.5%) | 143 (11.5%) |
| $25,000 to $49,999 | 1,154 (90.6%) | 120 (9.4%) |
| $50,000 to $74,999 | 757 (82.6%) | 160 (17.4%) |
| $75,000 to $99,999 | 646 (72.9%) | 240 (27.1%) |
| $100,000 and over | 753 (92.6%) | 60 (7.4%) |
Public vs Private Health Insurance Coverage by Age in Blakely
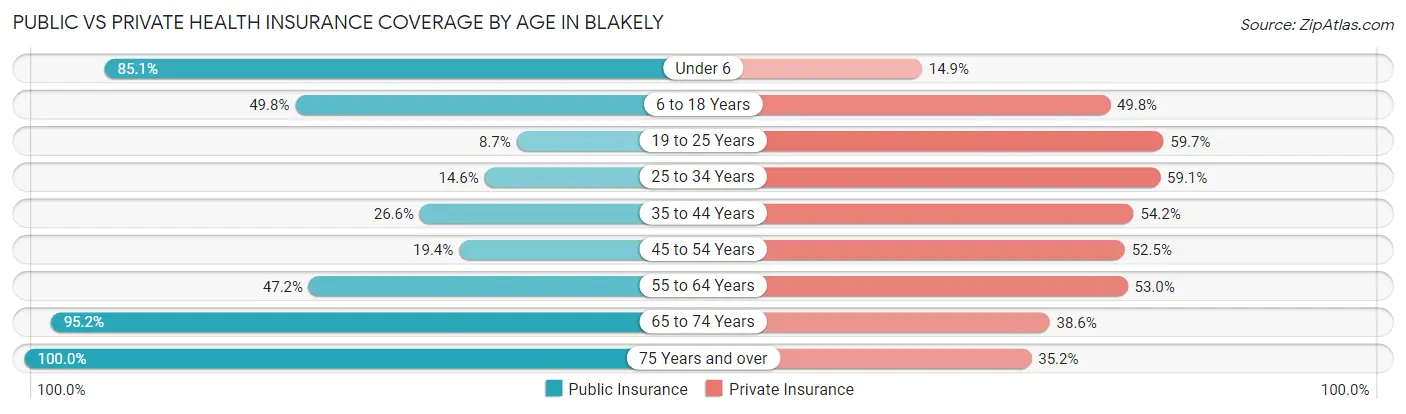
| Age Bracket | Public Insurance | Private Insurance |
| Under 6 | 447 (85.1%) | 78 (14.9%) |
| 6 to 18 Years | 646 (49.8%) | 646 (49.8%) |
| 19 to 25 Years | 53 (8.7%) | 364 (59.7%) |
| 25 to 34 Years | 54 (14.6%) | 218 (59.1%) |
| 35 to 44 Years | 183 (26.6%) | 372 (54.1%) |
| 45 to 54 Years | 119 (19.4%) | 323 (52.5%) |
| 55 to 64 Years | 171 (47.2%) | 192 (53.0%) |
| 65 to 74 Years | 412 (95.2%) | 167 (38.6%) |
| 75 Years and over | 236 (100.0%) | 83 (35.2%) |
| Total | 2,321 (45.2%) | 2,443 (47.6%) |
Disability Status by Sex by Age in Blakely
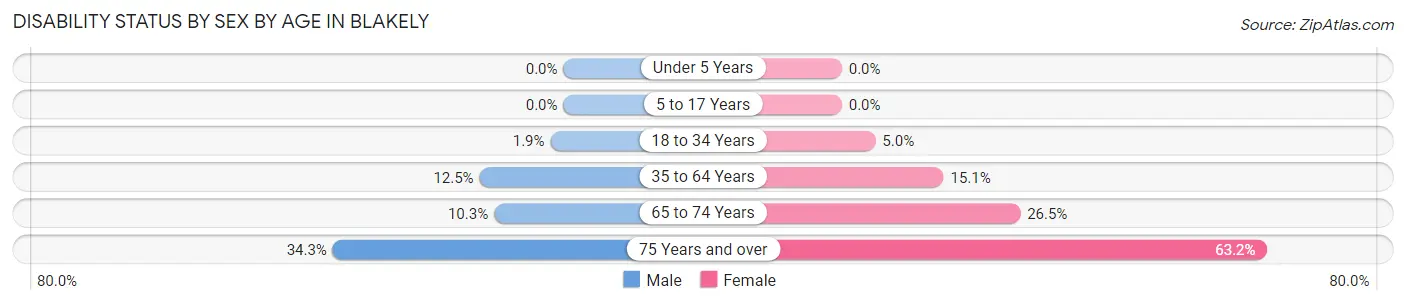
| Age Bracket | Male | Female |
| Under 5 Years | 0 (0.0%) | 0 (0.0%) |
| 5 to 17 Years | 0 (0.0%) | 0 (0.0%) |
| 18 to 34 Years | 10 (1.9%) | 33 (5.0%) |
| 35 to 64 Years | 82 (12.5%) | 152 (15.1%) |
| 65 to 74 Years | 17 (10.3%) | 71 (26.5%) |
| 75 Years and over | 25 (34.3%) | 103 (63.2%) |
Disability Class by Sex by Age in Blakely
Disability Class: Hearing Difficulty
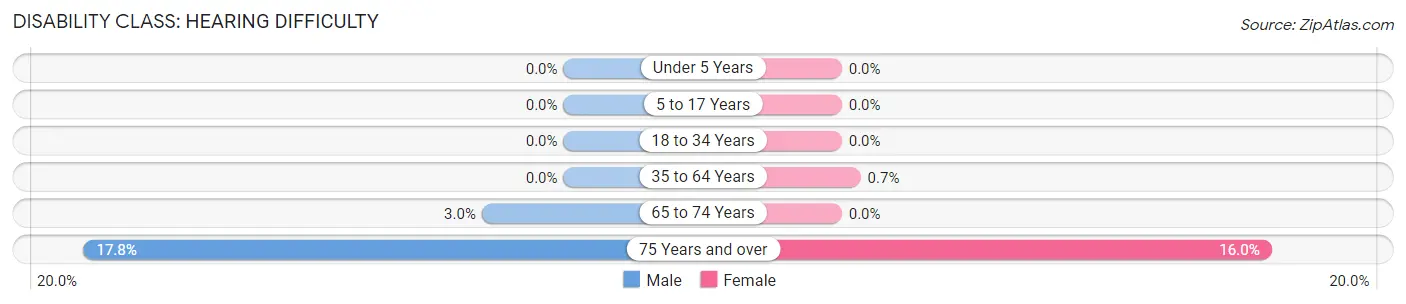
| Age Bracket | Male | Female |
| Under 5 Years | 0 (0.0%) | 0 (0.0%) |
| 5 to 17 Years | 0 (0.0%) | 0 (0.0%) |
| 18 to 34 Years | 0 (0.0%) | 0 (0.0%) |
| 35 to 64 Years | 0 (0.0%) | 7 (0.7%) |
| 65 to 74 Years | 5 (3.0%) | 0 (0.0%) |
| 75 Years and over | 13 (17.8%) | 26 (16.0%) |
Disability Class: Vision Difficulty
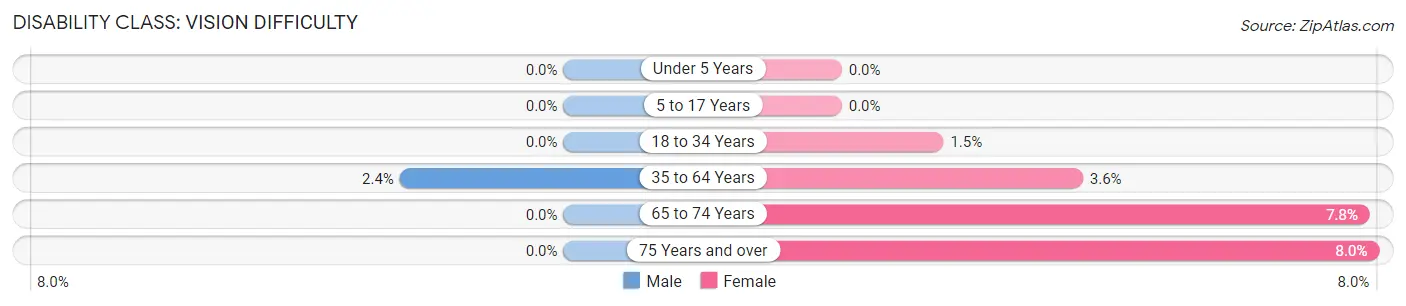
| Age Bracket | Male | Female |
| Under 5 Years | 0 (0.0%) | 0 (0.0%) |
| 5 to 17 Years | 0 (0.0%) | 0 (0.0%) |
| 18 to 34 Years | 0 (0.0%) | 10 (1.5%) |
| 35 to 64 Years | 16 (2.4%) | 36 (3.6%) |
| 65 to 74 Years | 0 (0.0%) | 21 (7.8%) |
| 75 Years and over | 0 (0.0%) | 13 (8.0%) |
Disability Class: Cognitive Difficulty
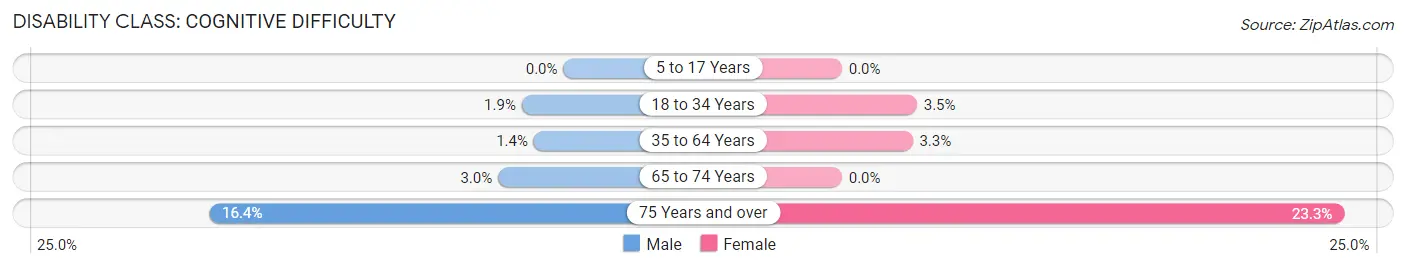
| Age Bracket | Male | Female |
| 5 to 17 Years | 0 (0.0%) | 0 (0.0%) |
| 18 to 34 Years | 10 (1.9%) | 23 (3.5%) |
| 35 to 64 Years | 9 (1.4%) | 33 (3.3%) |
| 65 to 74 Years | 5 (3.0%) | 0 (0.0%) |
| 75 Years and over | 12 (16.4%) | 38 (23.3%) |
Disability Class: Ambulatory Difficulty
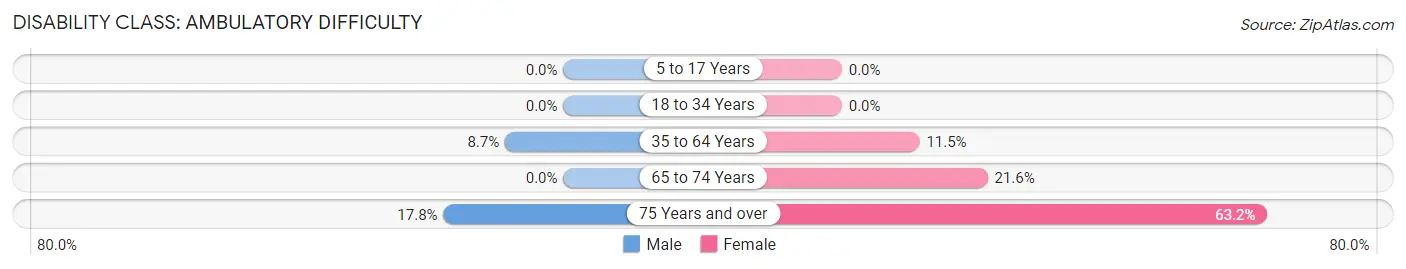
| Age Bracket | Male | Female |
| 5 to 17 Years | 0 (0.0%) | 0 (0.0%) |
| 18 to 34 Years | 0 (0.0%) | 0 (0.0%) |
| 35 to 64 Years | 57 (8.7%) | 116 (11.5%) |
| 65 to 74 Years | 0 (0.0%) | 58 (21.6%) |
| 75 Years and over | 13 (17.8%) | 103 (63.2%) |
Disability Class: Self-Care Difficulty
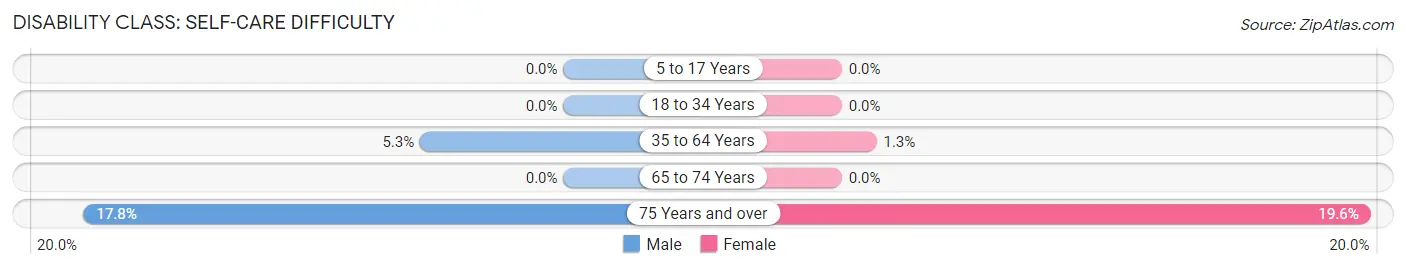
| Age Bracket | Male | Female |
| 5 to 17 Years | 0 (0.0%) | 0 (0.0%) |
| 18 to 34 Years | 0 (0.0%) | 0 (0.0%) |
| 35 to 64 Years | 35 (5.3%) | 13 (1.3%) |
| 65 to 74 Years | 0 (0.0%) | 0 (0.0%) |
| 75 Years and over | 13 (17.8%) | 32 (19.6%) |
Technology Access in Blakely
Computing Device Access in Blakely
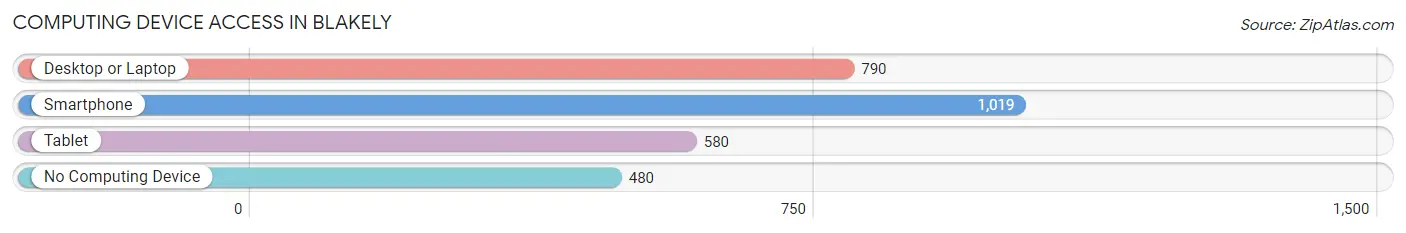
| Device Type | # Households | % Households |
| Desktop or Laptop | 790 | 49.1% |
| Smartphone | 1,019 | 63.3% |
| Tablet | 580 | 36.0% |
| No Computing Device | 480 | 29.8% |
| Total | 1,610 | 100.0% |
Internet Access in Blakely
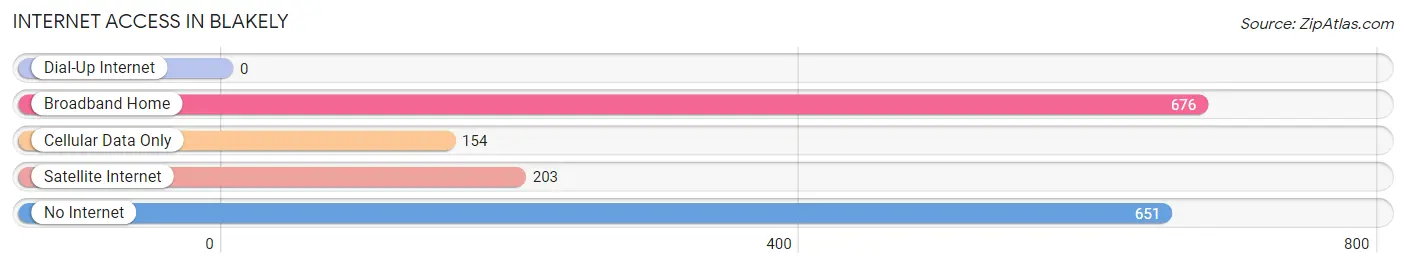
| Internet Type | # Households | % Households |
| Dial-Up Internet | 0 | 0.0% |
| Broadband Home | 676 | 42.0% |
| Cellular Data Only | 154 | 9.6% |
| Satellite Internet | 203 | 12.6% |
| No Internet | 651 | 40.4% |
| Total | 1,610 | 100.0% |
Blakely Summary
Blakely, Georgia is a small city located in Early County, Georgia. It is the county seat of Early County and is located in the southwestern part of the state. The city is situated along the Chattahoochee River and is part of the Dothan, Alabama metropolitan area. As of the 2010 census, the population of Blakely was 5,255.
History
The area that is now Blakely was first settled in the early 1800s by settlers from the Carolinas and Virginia. The town was originally known as Blakely Court House, and was named after a local family. In 1818, the town was officially incorporated as Blakely.
In the early 1900s, Blakely was a thriving agricultural center, with cotton, corn, and peanuts being the main crops. The town also had a thriving timber industry, with several sawmills located in the area.
In the late 1950s, the town began to experience a decline in population as people moved away to larger cities. In the 1970s, the town began to experience a resurgence in population as people moved back to the area.
Geography
Blakely is located in southwestern Georgia, in Early County. It is situated along the Chattahoochee River, and is part of the Dothan, Alabama metropolitan area. The city has a total area of 4.2 square miles, all of which is land.
The climate in Blakely is classified as humid subtropical, with hot, humid summers and mild winters. The average annual temperature is around 70 degrees Fahrenheit, with an average high of around 90 degrees in the summer and an average low of around 50 degrees in the winter.
Economy
The economy of Blakely is largely based on agriculture and timber. The town is home to several large farms, which produce cotton, corn, peanuts, and other crops. The timber industry is also an important part of the local economy, with several sawmills located in the area.
In addition to agriculture and timber, Blakely is also home to several small businesses, including restaurants, retail stores, and service providers. The town is also home to several manufacturing companies, including a furniture factory and a paper mill.
Demographics
As of the 2010 census, the population of Blakely was 5,255. The racial makeup of the city was 65.3% White, 30.2% African American, 0.3% Native American, 0.7% Asian, 0.1% Pacific Islander, and 3.4% from other races. Hispanic or Latino of any race were 2.2% of the population.
The median household income in Blakely was $30,938, and the median family income was $37,917. The per capita income was $17,845. About 22.2% of the population was below the poverty line.
Common Questions
What is Per Capita Income in Blakely?
Per Capita income in Blakely is $17,779.
What is the Median Family Income in Blakely?
Median Family Income in Blakely is $53,906.
What is the Median Household income in Blakely?
Median Household Income in Blakely is $43,008.
What is Income or Wage Gap in Blakely?
Income or Wage Gap in Blakely is 30.4%.
Women in Blakely earn 69.6 cents for every dollar earned by a man.
What is Family Income Deficit in Blakely?
Family Income Deficit in Blakely is $12,506.
Families that are below poverty line in Blakely earn $12,506 less on average than the poverty threshold level.
What is Inequality or Gini Index in Blakely?
Inequality or Gini Index in Blakely is 0.42.
What is the Total Population of Blakely?
Total Population of Blakely is 5,299.
What is the Total Male Population of Blakely?
Total Male Population of Blakely is 2,274.
What is the Total Female Population of Blakely?
Total Female Population of Blakely is 3,025.
What is the Ratio of Males per 100 Females in Blakely?
There are 75.17 Males per 100 Females in Blakely.
What is the Ratio of Females per 100 Males in Blakely?
There are 133.03 Females per 100 Males in Blakely.
What is the Median Population Age in Blakely?
Median Population Age in Blakely is 31.5 Years.
What is the Average Family Size in Blakely
Average Family Size in Blakely is 3.7 People.
What is the Average Household Size in Blakely
Average Household Size in Blakely is 3.2 People.
How Large is the Labor Force in Blakely?
There are 2,231 People in the Labor Forcein in Blakely.
What is the Percentage of People in the Labor Force in Blakely?
57.5% of People are in the Labor Force in Blakely.
What is the Unemployment Rate in Blakely?
Unemployment Rate in Blakely is 5.6%.