East Dublin, GA Map & Demographics
East Dublin Map
East Dublin Overview
$20,165
PER CAPITA INCOME
$54,912
AVG FAMILY INCOME
$54,601
AVG HOUSEHOLD INCOME
3.0%
WAGE / INCOME GAP [ % ]
97.0¢/ $1
WAGE / INCOME GAP [ $ ]
0.42
INEQUALITY / GINI INDEX
2,889
TOTAL POPULATION
1,619
MALE POPULATION
1,270
FEMALE POPULATION
127.48
MALES / 100 FEMALES
78.44
FEMALES / 100 MALES
28.7
MEDIAN AGE
4.0
AVG FAMILY SIZE
3.4
AVG HOUSEHOLD SIZE
1,433
LABOR FORCE [ PEOPLE ]
69.7%
PERCENT IN LABOR FORCE
7.3%
UNEMPLOYMENT RATE
East Dublin Zip Codes
East Dublin Area Codes
Income in East Dublin
Income Overview in East Dublin
Per Capita Income in East Dublin is $20,165, while median incomes of families and households are $54,912 and $54,601 respectively.
| Characteristic | Number | Measure |
| Per Capita Income | 2,889 | $20,165 |
| Median Family Income | 643 | $54,912 |
| Mean Family Income | 643 | $61,815 |
| Median Household Income | 855 | $54,601 |
| Mean Household Income | 855 | $62,410 |
| Income Deficit | 643 | $0 |
| Wage / Income Gap (%) | 2,889 | 3.04% |
| Wage / Income Gap ($) | 2,889 | 96.96¢ per $1 |
| Gini / Inequality Index | 2,889 | 0.42 |
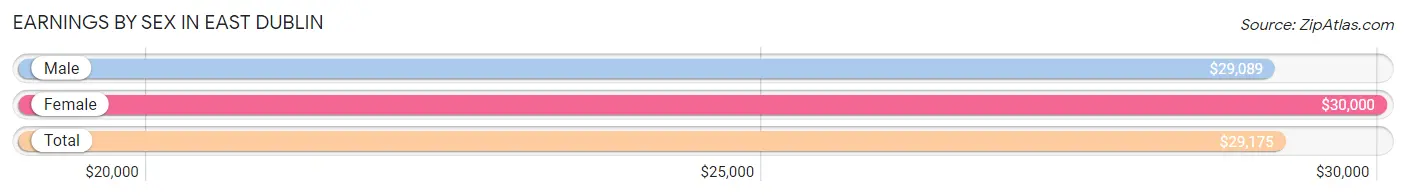
Earnings by Sex in East Dublin
Average Earnings in East Dublin are $29,175, $29,089 for men and $30,000 for women, a difference of 3.0%.
| Sex | Number | Average Earnings |
| Male | 763 (54.1%) | $29,089 |
| Female | 646 (45.9%) | $30,000 |
| Total | 1,409 (100.0%) | $29,175 |
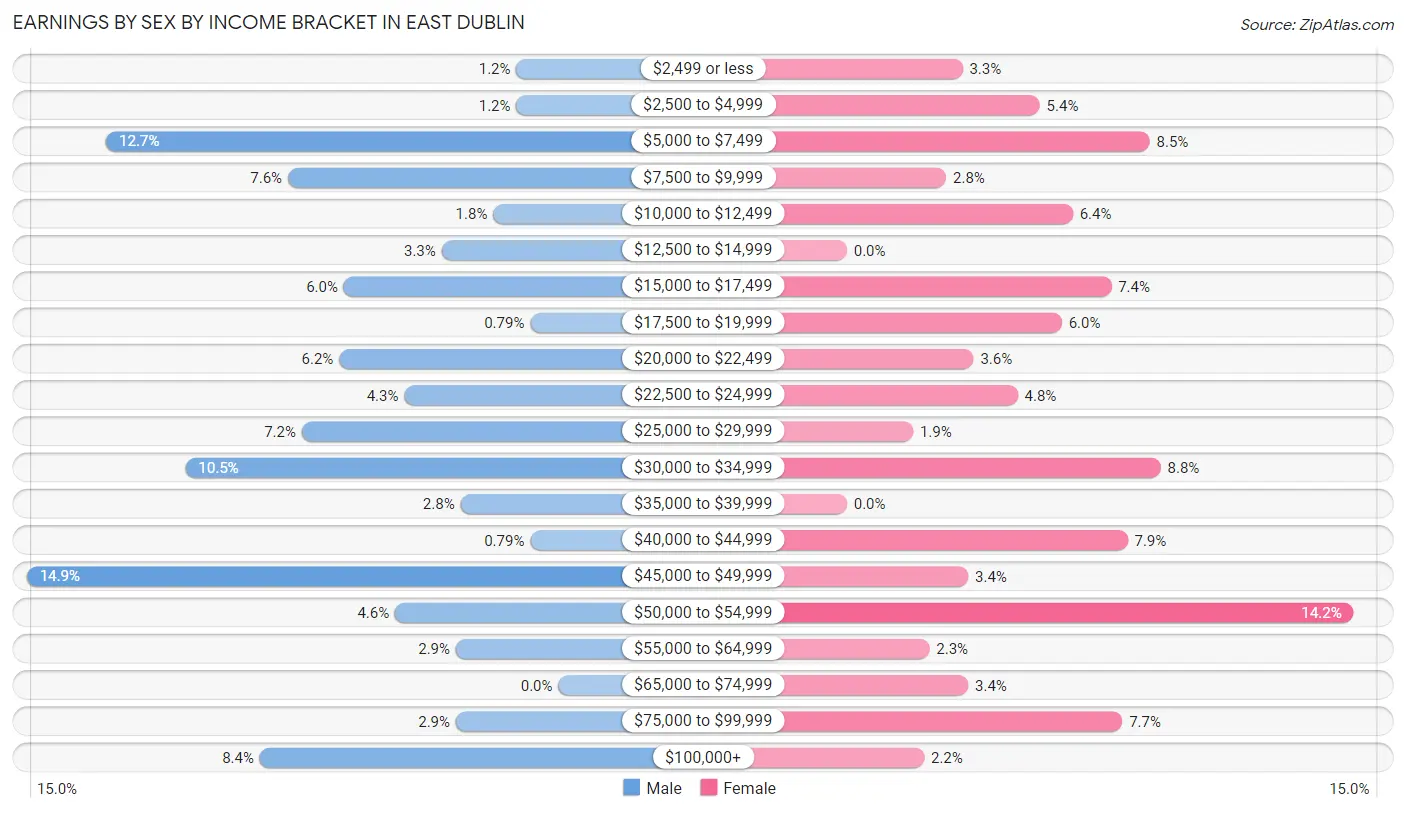
Earnings by Sex by Income Bracket in East Dublin
The most common earnings brackets in East Dublin are $45,000 to $49,999 for men (114 | 14.9%) and $50,000 to $54,999 for women (92 | 14.2%).
| Income | Male | Female |
| $2,499 or less | 9 (1.2%) | 21 (3.3%) |
| $2,500 to $4,999 | 9 (1.2%) | 35 (5.4%) |
| $5,000 to $7,499 | 97 (12.7%) | 55 (8.5%) |
| $7,500 to $9,999 | 58 (7.6%) | 18 (2.8%) |
| $10,000 to $12,499 | 14 (1.8%) | 41 (6.4%) |
| $12,500 to $14,999 | 25 (3.3%) | 0 (0.0%) |
| $15,000 to $17,499 | 46 (6.0%) | 48 (7.4%) |
| $17,500 to $19,999 | 6 (0.8%) | 39 (6.0%) |
| $20,000 to $22,499 | 47 (6.2%) | 23 (3.6%) |
| $22,500 to $24,999 | 33 (4.3%) | 31 (4.8%) |
| $25,000 to $29,999 | 55 (7.2%) | 12 (1.9%) |
| $30,000 to $34,999 | 80 (10.5%) | 57 (8.8%) |
| $35,000 to $39,999 | 21 (2.8%) | 0 (0.0%) |
| $40,000 to $44,999 | 6 (0.8%) | 51 (7.9%) |
| $45,000 to $49,999 | 114 (14.9%) | 22 (3.4%) |
| $50,000 to $54,999 | 35 (4.6%) | 92 (14.2%) |
| $55,000 to $64,999 | 22 (2.9%) | 15 (2.3%) |
| $65,000 to $74,999 | 0 (0.0%) | 22 (3.4%) |
| $75,000 to $99,999 | 22 (2.9%) | 50 (7.7%) |
| $100,000+ | 64 (8.4%) | 14 (2.2%) |
| Total | 763 (100.0%) | 646 (100.0%) |
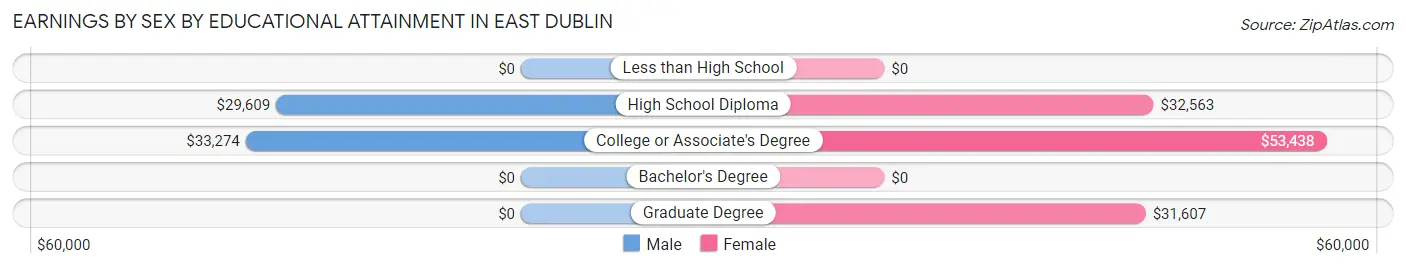
Earnings by Sex by Educational Attainment in East Dublin
Average earnings in East Dublin are $31,477 for men and $33,625 for women, a difference of 6.4%. Men with an educational attainment of college or associate's degree enjoy the highest average annual earnings of $33,274, while those with high school diploma education earn the least with $29,609. Women with an educational attainment of college or associate's degree earn the most with the average annual earnings of $53,438, while those with graduate degree education have the smallest earnings of $31,607.
| Educational Attainment | Male Income | Female Income |
| Less than High School | - | - |
| High School Diploma | $29,609 | $32,563 |
| College or Associate's Degree | $33,274 | $53,438 |
| Bachelor's Degree | - | - |
| Graduate Degree | - | - |
| Total | $31,477 | $33,625 |
Family Income in East Dublin
Family Income Brackets in East Dublin
According to the East Dublin family income data, there are 222 families falling into the $50,000 to $74,999 income range, which is the most common income bracket and makes up 34.5% of all families.
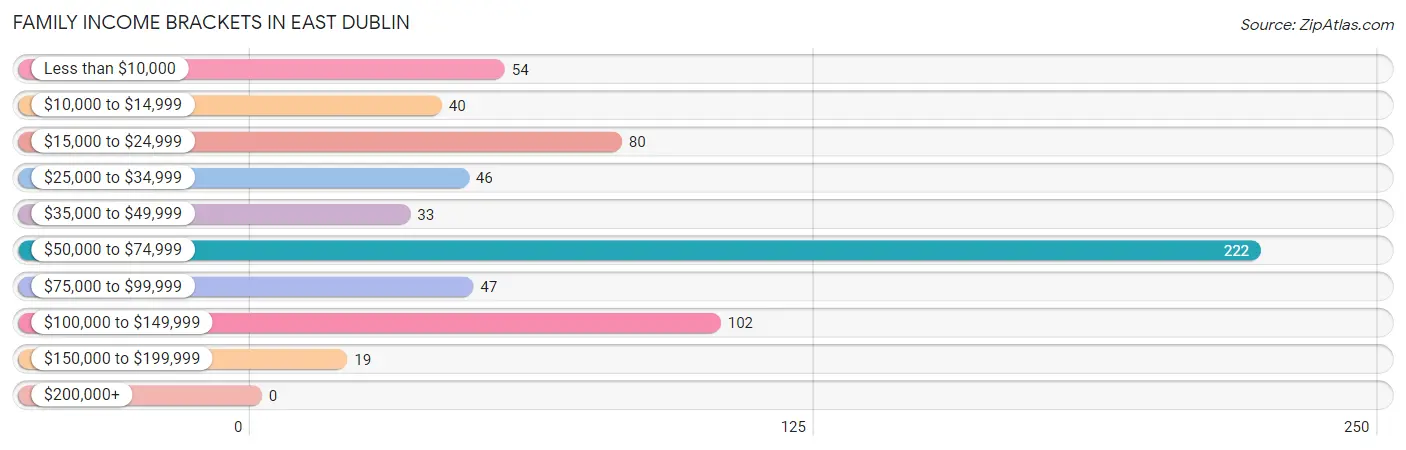
| Income Bracket | # Families | % Families |
| Less than $10,000 | 54 | 8.4% |
| $10,000 to $14,999 | 40 | 6.2% |
| $15,000 to $24,999 | 80 | 12.4% |
| $25,000 to $34,999 | 46 | 7.2% |
| $35,000 to $49,999 | 33 | 5.1% |
| $50,000 to $74,999 | 222 | 34.5% |
| $75,000 to $99,999 | 47 | 7.3% |
| $100,000 to $149,999 | 102 | 15.9% |
| $150,000 to $199,999 | 19 | 3.0% |
| $200,000+ | 0 | 0.0% |
Family Income by Famaliy Size in East Dublin
4-person families (184 | 28.6%) account for the highest median family income in East Dublin with $61,591 per family, while 2-person families (240 | 37.3%) have the highest median income of $29,474 per family member.
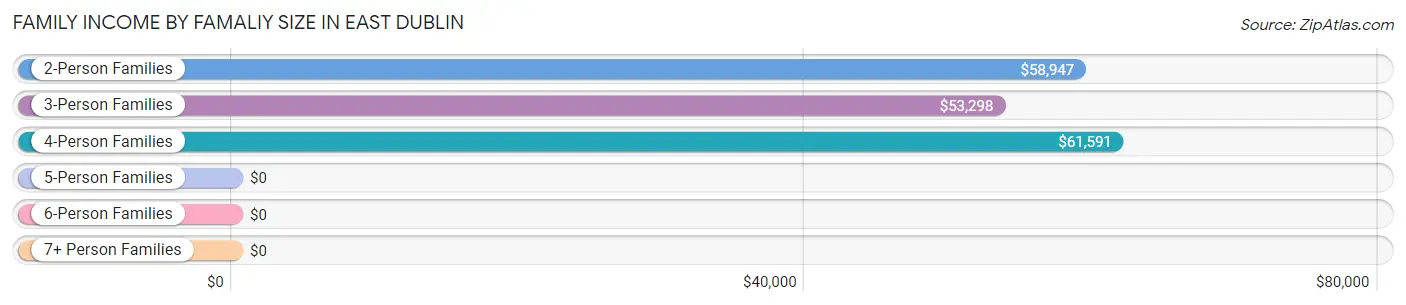
| Income Bracket | # Families | Median Income |
| 2-Person Families | 240 (37.3%) | $58,947 |
| 3-Person Families | 168 (26.1%) | $53,298 |
| 4-Person Families | 184 (28.6%) | $61,591 |
| 5-Person Families | 21 (3.3%) | $0 |
| 6-Person Families | 6 (0.9%) | $0 |
| 7+ Person Families | 24 (3.7%) | $0 |
| Total | 643 (100.0%) | $54,912 |
Family Income by Number of Earners in East Dublin
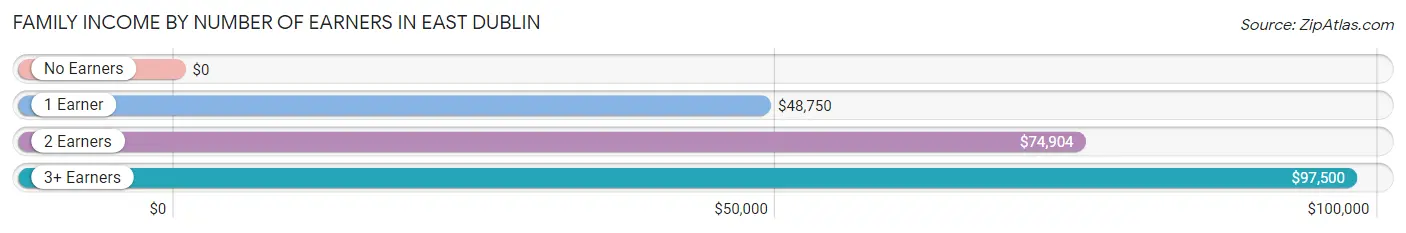
| Number of Earners | # Families | Median Income |
| No Earners | 73 (11.4%) | $0 |
| 1 Earner | 263 (40.9%) | $48,750 |
| 2 Earners | 239 (37.2%) | $74,904 |
| 3+ Earners | 68 (10.6%) | $97,500 |
| Total | 643 (100.0%) | $54,912 |
Household Income in East Dublin
Household Income Brackets in East Dublin
With 201 households falling in the category, the $50,000 to $74,999 income range is the most frequent in East Dublin, accounting for 23.5% of all households. In contrast, only 6 households (0.7%) fall into the $200,000+ income bracket, making it the least populous group.
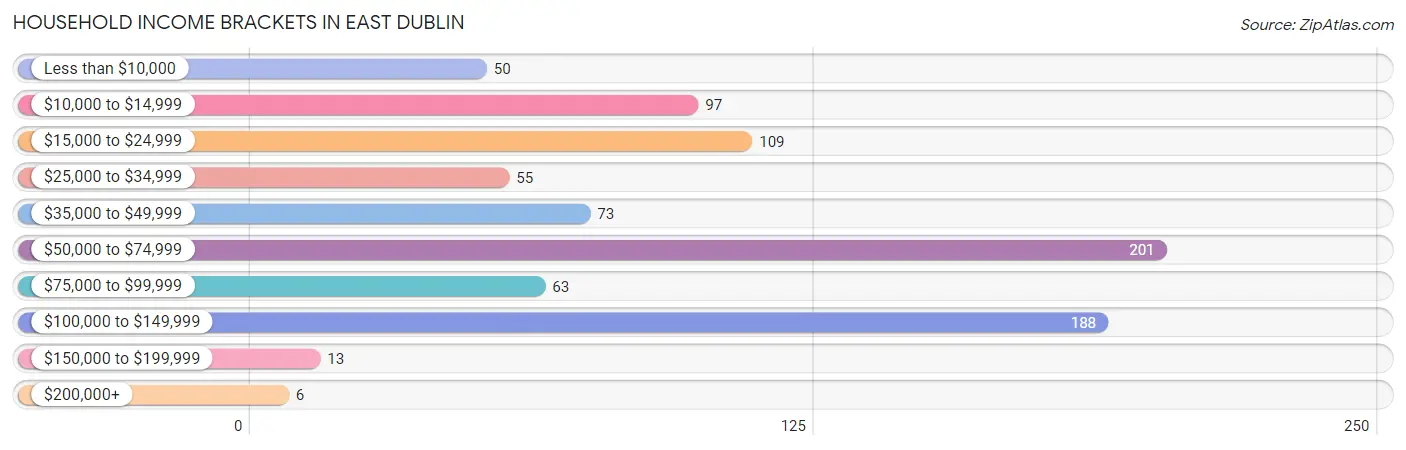
| Income Bracket | # Households | % Households |
| Less than $10,000 | 50 | 5.8% |
| $10,000 to $14,999 | 97 | 11.3% |
| $15,000 to $24,999 | 109 | 12.7% |
| $25,000 to $34,999 | 55 | 6.4% |
| $35,000 to $49,999 | 73 | 8.5% |
| $50,000 to $74,999 | 201 | 23.5% |
| $75,000 to $99,999 | 63 | 7.4% |
| $100,000 to $149,999 | 188 | 22.0% |
| $150,000 to $199,999 | 13 | 1.5% |
| $200,000+ | 6 | 0.7% |
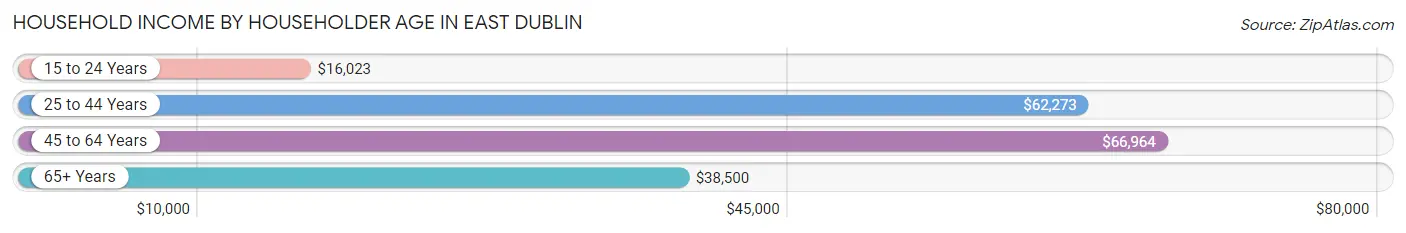
Household Income by Householder Age in East Dublin
The median household income in East Dublin is $54,601, with the highest median household income of $66,964 found in the 45 to 64 years age bracket for the primary householder. A total of 281 households (32.9%) fall into this category. Meanwhile, the 15 to 24 years age bracket for the primary householder has the lowest median household income of $16,023, with 46 households (5.4%) in this group.
| Income Bracket | # Households | Median Income |
| 15 to 24 Years | 46 (5.4%) | $16,023 |
| 25 to 44 Years | 336 (39.3%) | $62,273 |
| 45 to 64 Years | 281 (32.9%) | $66,964 |
| 65+ Years | 192 (22.5%) | $38,500 |
| Total | 855 (100.0%) | $54,601 |
Poverty in East Dublin
Income Below Poverty by Sex and Age in East Dublin
With 25.3% poverty level for males and 27.9% for females among the residents of East Dublin, 16 and 17 year old males and under 5 year old females are the most vulnerable to poverty, with 13 males (92.9%) and 53 females (100.0%) in their respective age groups living below the poverty level.
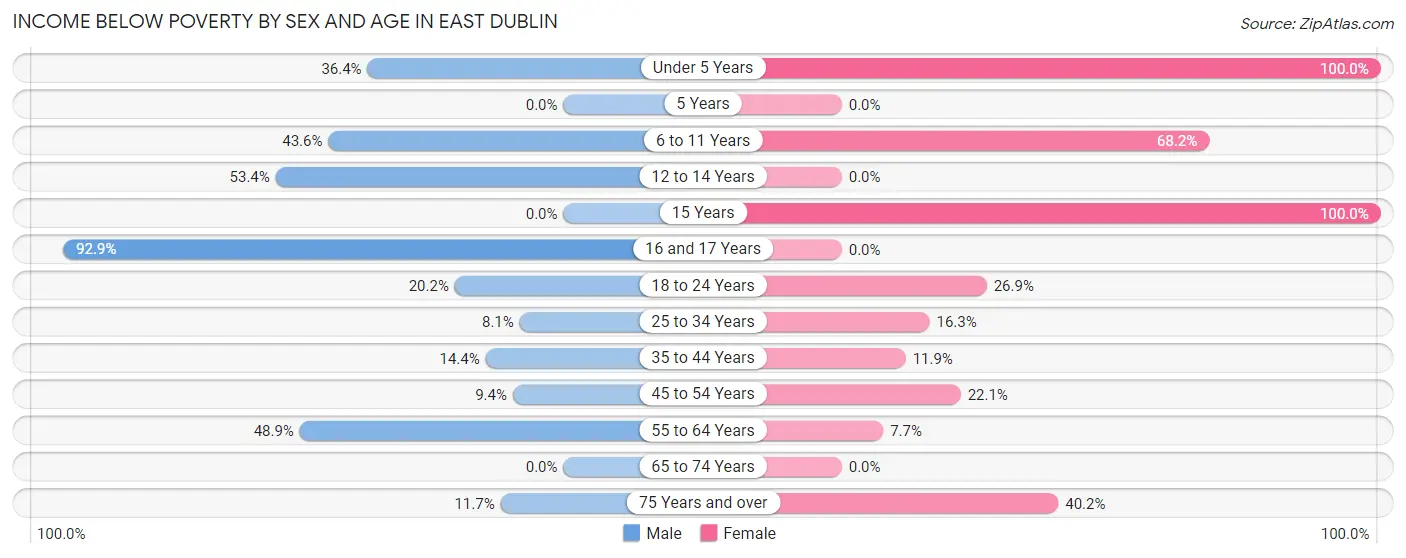
| Age Bracket | Male | Female |
| Under 5 Years | 40 (36.4%) | 53 (100.0%) |
| 5 Years | 0 (0.0%) | 0 (0.0%) |
| 6 to 11 Years | 161 (43.6%) | 105 (68.2%) |
| 12 to 14 Years | 47 (53.4%) | 0 (0.0%) |
| 15 Years | 0 (0.0%) | 6 (100.0%) |
| 16 and 17 Years | 13 (92.9%) | 0 (0.0%) |
| 18 to 24 Years | 50 (20.2%) | 46 (26.9%) |
| 25 to 34 Years | 13 (8.1%) | 43 (16.3%) |
| 35 to 44 Years | 40 (14.4%) | 21 (11.9%) |
| 45 to 54 Years | 15 (9.4%) | 32 (22.1%) |
| 55 to 64 Years | 23 (48.9%) | 4 (7.7%) |
| 65 to 74 Years | 0 (0.0%) | 0 (0.0%) |
| 75 Years and over | 7 (11.7%) | 43 (40.2%) |
| Total | 409 (25.3%) | 353 (27.9%) |
Income Above Poverty by Sex and Age in East Dublin
According to the poverty statistics in East Dublin, males aged 5 years and females aged 12 to 14 years are the age groups that are most secure financially, with 100.0% of males and 100.0% of females in these age groups living above the poverty line.
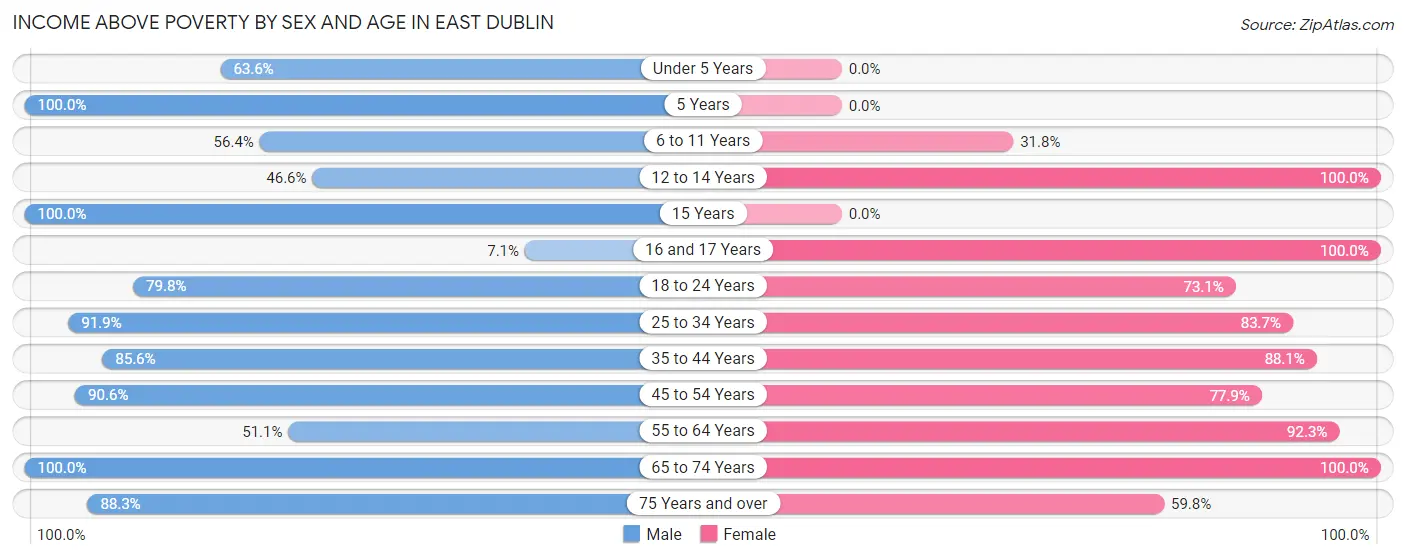
| Age Bracket | Male | Female |
| Under 5 Years | 70 (63.6%) | 0 (0.0%) |
| 5 Years | 7 (100.0%) | 0 (0.0%) |
| 6 to 11 Years | 208 (56.4%) | 49 (31.8%) |
| 12 to 14 Years | 41 (46.6%) | 35 (100.0%) |
| 15 Years | 6 (100.0%) | 0 (0.0%) |
| 16 and 17 Years | 1 (7.1%) | 30 (100.0%) |
| 18 to 24 Years | 198 (79.8%) | 125 (73.1%) |
| 25 to 34 Years | 147 (91.9%) | 221 (83.7%) |
| 35 to 44 Years | 237 (85.6%) | 156 (88.1%) |
| 45 to 54 Years | 145 (90.6%) | 113 (77.9%) |
| 55 to 64 Years | 24 (51.1%) | 48 (92.3%) |
| 65 to 74 Years | 73 (100.0%) | 71 (100.0%) |
| 75 Years and over | 53 (88.3%) | 64 (59.8%) |
| Total | 1,210 (74.7%) | 912 (72.1%) |
Income Below Poverty Among Married-Couple Families in East Dublin
The poverty statistics for married-couple families in East Dublin show that 15.0% or 47 of the total 313 families live below the poverty line. Families with 1 or 2 children have the highest poverty rate of 33.1%, comprising of 40 families. On the other hand, families with no children have the lowest poverty rate of 3.6%, which includes 7 families.
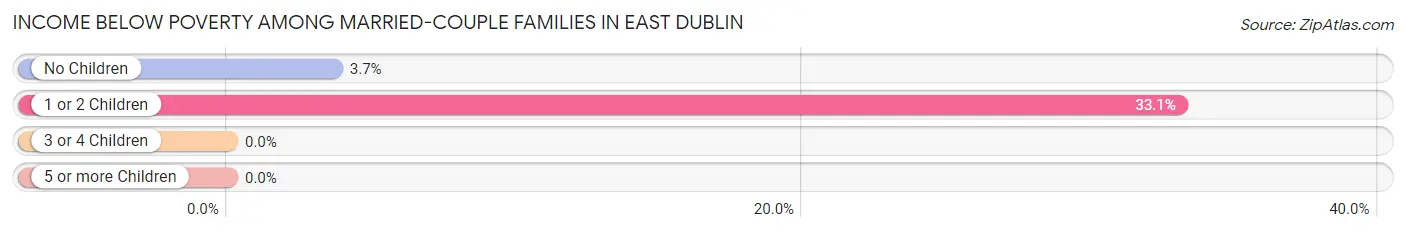
| Children | Above Poverty | Below Poverty |
| No Children | 185 (96.4%) | 7 (3.6%) |
| 1 or 2 Children | 81 (66.9%) | 40 (33.1%) |
| 3 or 4 Children | 0 (0.0%) | 0 (0.0%) |
| 5 or more Children | 0 (0.0%) | 0 (0.0%) |
| Total | 266 (85.0%) | 47 (15.0%) |
Income Below Poverty Among Single-Parent Households in East Dublin
According to the poverty data in East Dublin, 34.2% or 13 single-father households and 36.3% or 106 single-mother households are living below the poverty line. Among single-father households, those with 1 or 2 children have the highest poverty rate, with 13 households (61.9%) experiencing poverty. Likewise, among single-mother households, those with 3 or 4 children have the highest poverty rate, with 40 households (100.0%) falling below the poverty line.
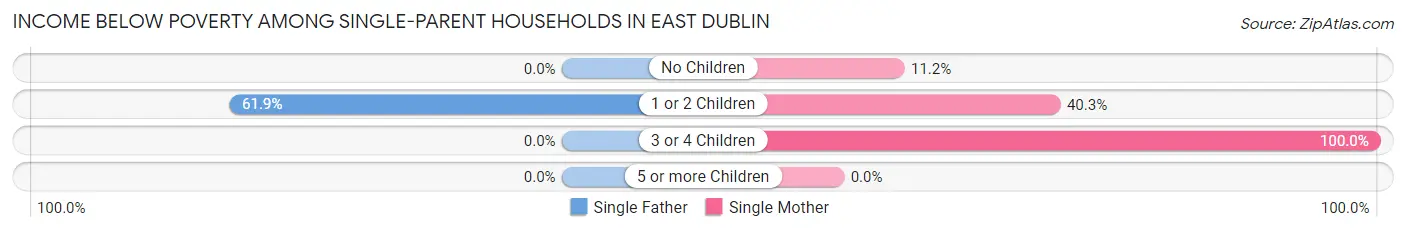
| Children | Single Father | Single Mother |
| No Children | 0 (0.0%) | 10 (11.2%) |
| 1 or 2 Children | 13 (61.9%) | 56 (40.3%) |
| 3 or 4 Children | 0 (0.0%) | 40 (100.0%) |
| 5 or more Children | 0 (0.0%) | 0 (0.0%) |
| Total | 13 (34.2%) | 106 (36.3%) |
Income Below Poverty Among Married-Couple vs Single-Parent Households in East Dublin
The poverty data for East Dublin shows that 47 of the married-couple family households (15.0%) and 119 of the single-parent households (36.1%) are living below the poverty level. Within the married-couple family households, those with 1 or 2 children have the highest poverty rate, with 40 households (33.1%) falling below the poverty line. Among the single-parent households, those with 3 or 4 children have the highest poverty rate, with 40 household (100.0%) living below poverty.
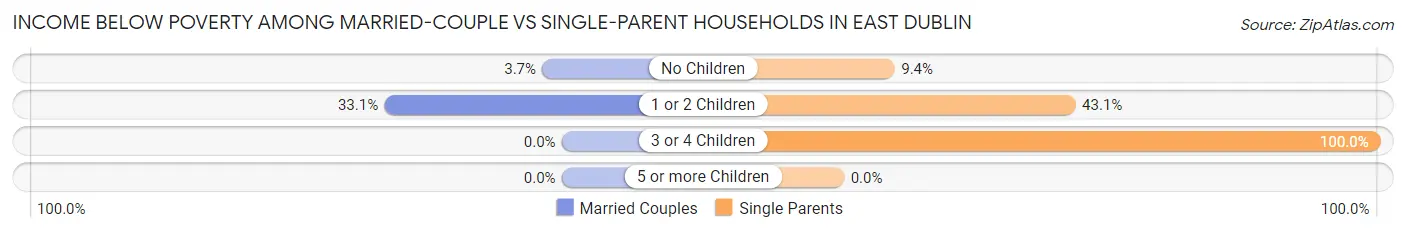
| Children | Married-Couple Families | Single-Parent Households |
| No Children | 7 (3.6%) | 10 (9.4%) |
| 1 or 2 Children | 40 (33.1%) | 69 (43.1%) |
| 3 or 4 Children | 0 (0.0%) | 40 (100.0%) |
| 5 or more Children | 0 (0.0%) | 0 (0.0%) |
| Total | 47 (15.0%) | 119 (36.1%) |
Race in East Dublin
The most populous races in East Dublin are Black / African American (1,538 | 53.2%), White / Caucasian (763 | 26.4%), and Hispanic or Latino (555 | 19.2%).
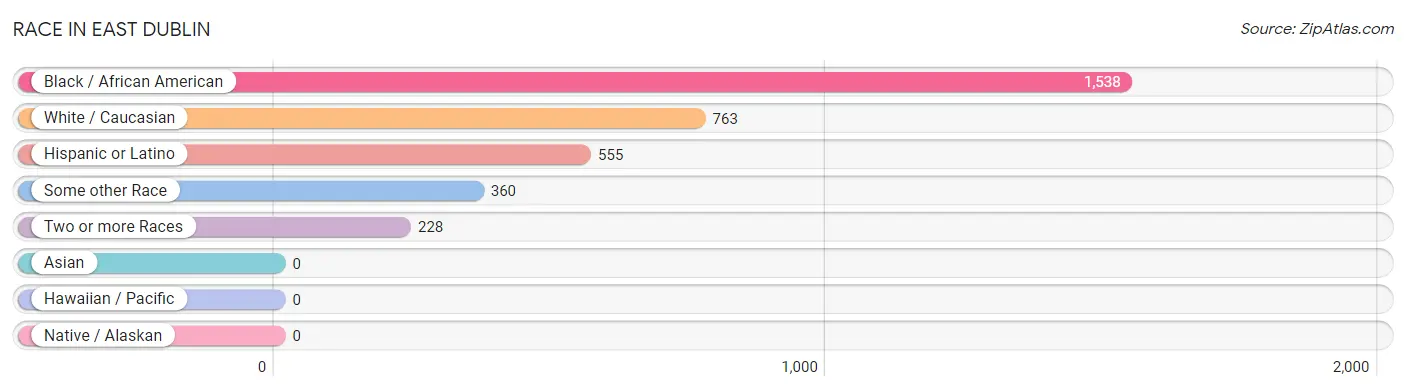
| Race | # Population | % Population |
| Asian | 0 | 0.0% |
| Black / African American | 1,538 | 53.2% |
| Hawaiian / Pacific | 0 | 0.0% |
| Hispanic or Latino | 555 | 19.2% |
| Native / Alaskan | 0 | 0.0% |
| White / Caucasian | 763 | 26.4% |
| Two or more Races | 228 | 7.9% |
| Some other Race | 360 | 12.5% |
| Total | 2,889 | 100.0% |
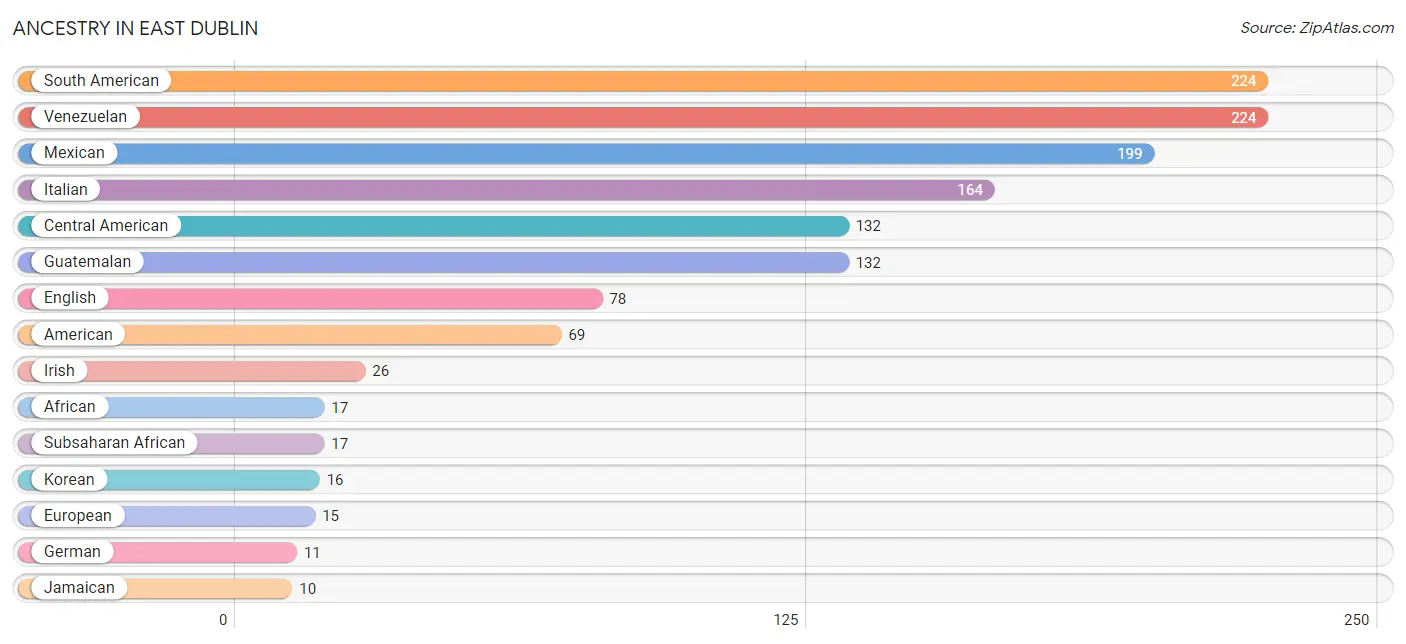
Ancestry in East Dublin
The most populous ancestries reported in East Dublin are South American (224 | 7.7%), Venezuelan (224 | 7.7%), Mexican (199 | 6.9%), Italian (164 | 5.7%), and Central American (132 | 4.6%), together accounting for 32.6% of all East Dublin residents.
| Ancestry | # Population | % Population |
| African | 17 | 0.6% |
| American | 69 | 2.4% |
| Central American | 132 | 4.6% |
| Cherokee | 3 | 0.1% |
| English | 78 | 2.7% |
| European | 15 | 0.5% |
| French | 3 | 0.1% |
| German | 11 | 0.4% |
| Guatemalan | 132 | 4.6% |
| Irish | 26 | 0.9% |
| Italian | 164 | 5.7% |
| Jamaican | 10 | 0.4% |
| Korean | 16 | 0.5% |
| Lithuanian | 5 | 0.2% |
| Mexican | 199 | 6.9% |
| Scotch-Irish | 7 | 0.2% |
| South American | 224 | 7.7% |
| Subsaharan African | 17 | 0.6% |
| Swedish | 5 | 0.2% |
| Venezuelan | 224 | 7.7% |
| Welsh | 5 | 0.2% | View All 21 Rows |
Immigrants in East Dublin
The most numerous immigrant groups reported in East Dublin came from Latin America (309 | 10.7%), South America (224 | 7.7%), Venezuela (224 | 7.7%), Central America (85 | 2.9%), and Guatemala (85 | 2.9%), together accounting for 32.1% of all East Dublin residents.
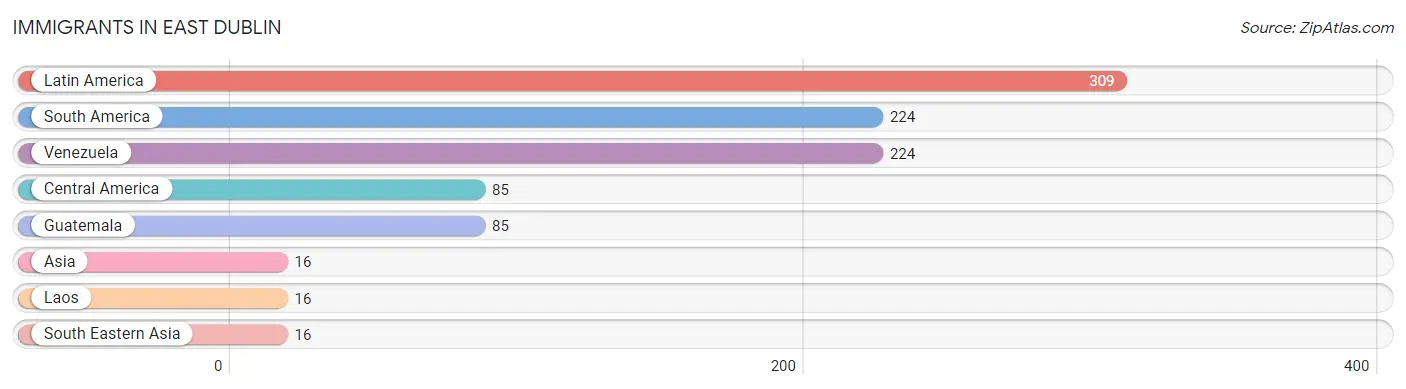
| Immigration Origin | # Population | % Population |
| Asia | 16 | 0.5% |
| Central America | 85 | 2.9% |
| Guatemala | 85 | 2.9% |
| Laos | 16 | 0.5% |
| Latin America | 309 | 10.7% |
| South America | 224 | 7.7% |
| South Eastern Asia | 16 | 0.5% |
| Venezuela | 224 | 7.7% | View All 8 Rows |
Sex and Age in East Dublin
Sex and Age in East Dublin
The most populous age groups in East Dublin are 10 to 14 Years (312 | 19.3%) for men and 25 to 29 Years (201 | 15.8%) for women.
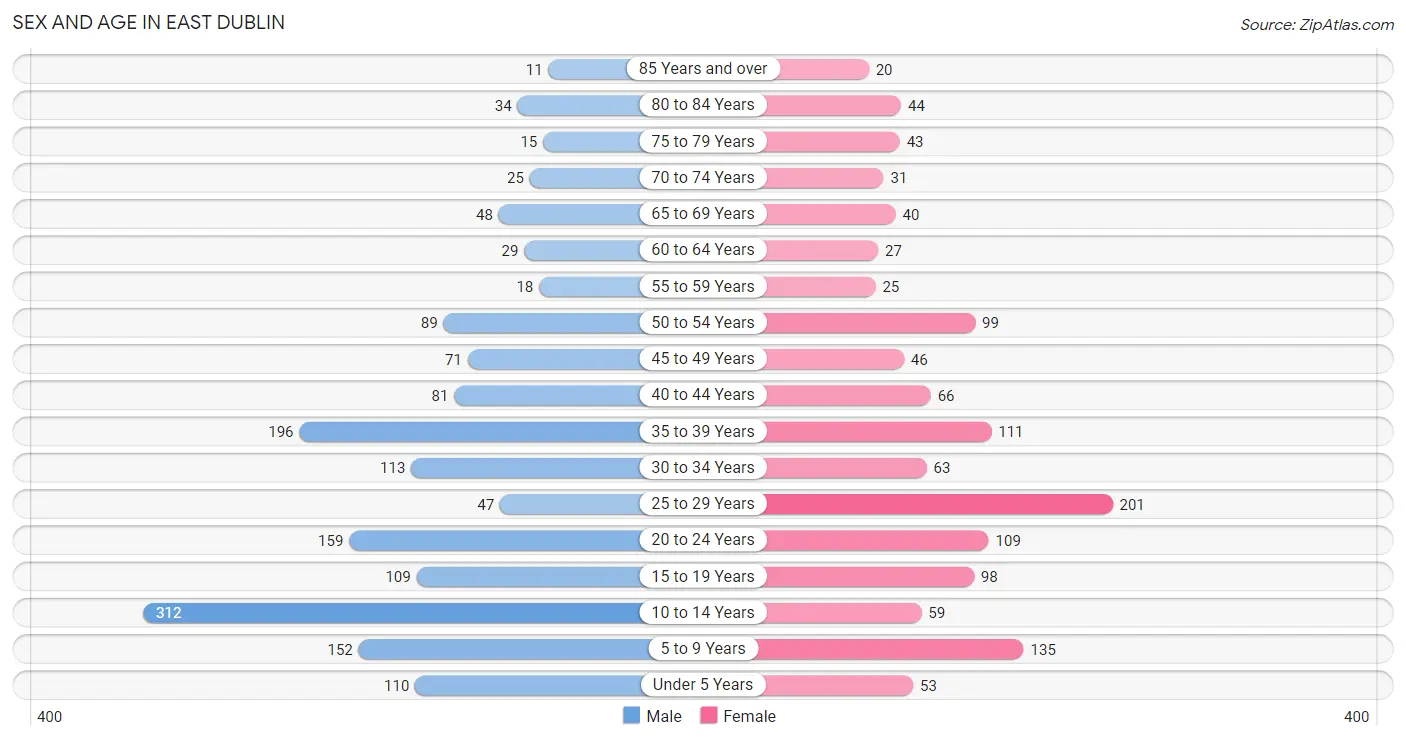
| Age Bracket | Male | Female |
| Under 5 Years | 110 (6.8%) | 53 (4.2%) |
| 5 to 9 Years | 152 (9.4%) | 135 (10.6%) |
| 10 to 14 Years | 312 (19.3%) | 59 (4.6%) |
| 15 to 19 Years | 109 (6.7%) | 98 (7.7%) |
| 20 to 24 Years | 159 (9.8%) | 109 (8.6%) |
| 25 to 29 Years | 47 (2.9%) | 201 (15.8%) |
| 30 to 34 Years | 113 (7.0%) | 63 (5.0%) |
| 35 to 39 Years | 196 (12.1%) | 111 (8.7%) |
| 40 to 44 Years | 81 (5.0%) | 66 (5.2%) |
| 45 to 49 Years | 71 (4.4%) | 46 (3.6%) |
| 50 to 54 Years | 89 (5.5%) | 99 (7.8%) |
| 55 to 59 Years | 18 (1.1%) | 25 (2.0%) |
| 60 to 64 Years | 29 (1.8%) | 27 (2.1%) |
| 65 to 69 Years | 48 (3.0%) | 40 (3.2%) |
| 70 to 74 Years | 25 (1.5%) | 31 (2.4%) |
| 75 to 79 Years | 15 (0.9%) | 43 (3.4%) |
| 80 to 84 Years | 34 (2.1%) | 44 (3.5%) |
| 85 Years and over | 11 (0.7%) | 20 (1.6%) |
| Total | 1,619 (100.0%) | 1,270 (100.0%) |
Families and Households in East Dublin
Median Family Size in East Dublin
The median family size in East Dublin is 3.97 persons per family, with married-couple families (313 | 48.7%) accounting for the largest median family size of 3.99 persons per family. On the other hand, single male/father families (38 | 5.9%) represent the smallest median family size with 3.89 persons per family.
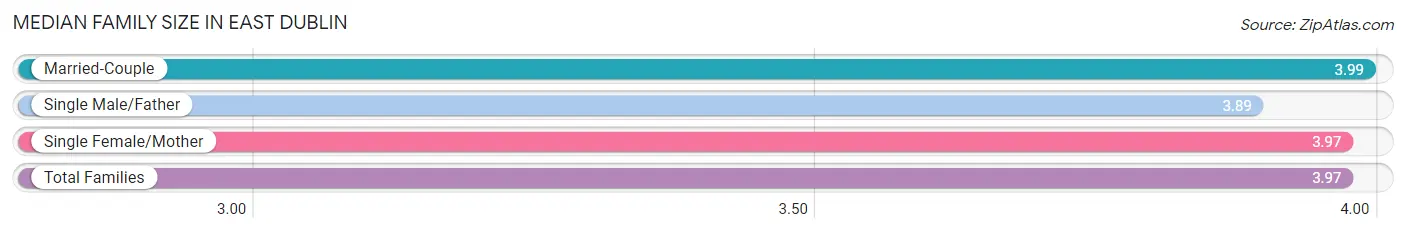
| Family Type | # Families | Family Size |
| Married-Couple | 313 (48.7%) | 3.99 |
| Single Male/Father | 38 (5.9%) | 3.89 |
| Single Female/Mother | 292 (45.4%) | 3.97 |
| Total Families | 643 (100.0%) | 3.97 |
Median Household Size in East Dublin
The median household size in East Dublin is 3.38 persons per household, with single female/mother households (292 | 34.2%) accounting for the largest median household size of 4.25 persons per household. non-family households (212 | 24.8%) represent the smallest median household size with 1.14 persons per household.
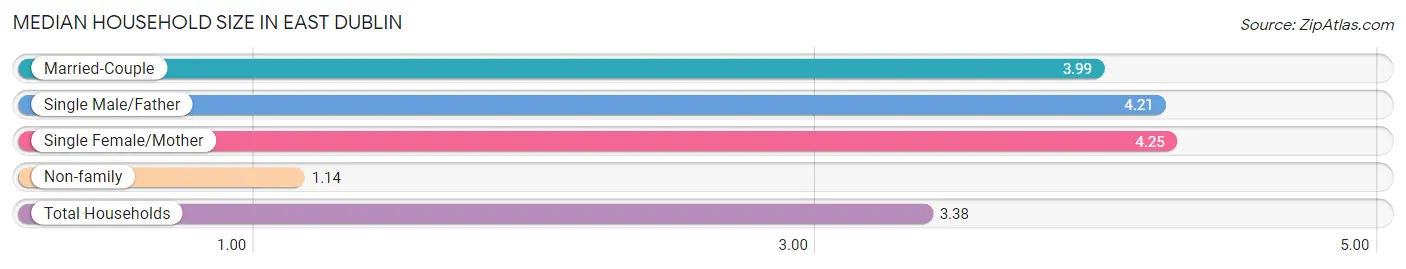
| Household Type | # Households | Household Size |
| Married-Couple | 313 (36.6%) | 3.99 |
| Single Male/Father | 38 (4.4%) | 4.21 |
| Single Female/Mother | 292 (34.2%) | 4.25 |
| Non-family | 212 (24.8%) | 1.14 |
| Total Households | 855 (100.0%) | 3.38 |
Household Size by Marriage Status in East Dublin
Out of a total of 855 households in East Dublin, 643 (75.2%) are family households, while 212 (24.8%) are nonfamily households. The most numerous type of family households are 4-person households, comprising 237, and the most common type of nonfamily households are 1-person households, comprising 197.
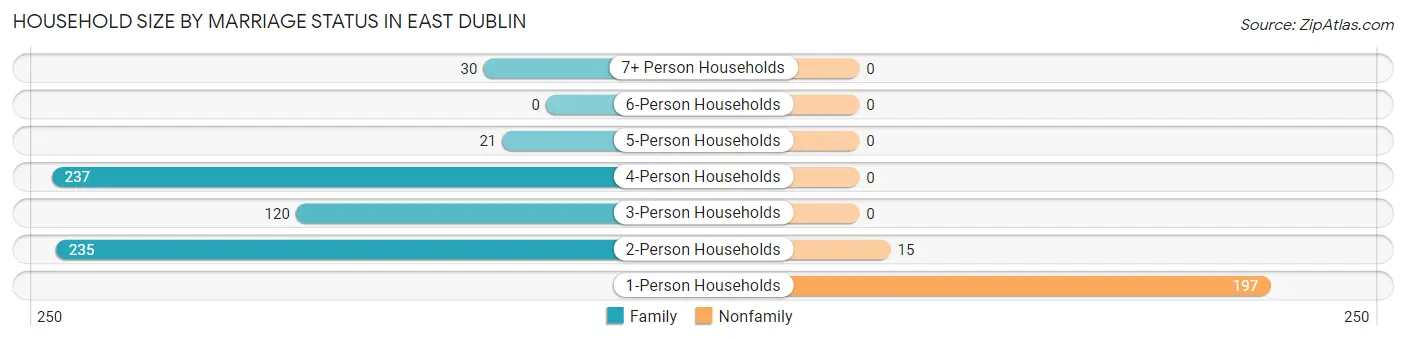
| Household Size | Family Households | Nonfamily Households |
| 1-Person Households | - | 197 (23.0%) |
| 2-Person Households | 235 (27.5%) | 15 (1.8%) |
| 3-Person Households | 120 (14.0%) | 0 (0.0%) |
| 4-Person Households | 237 (27.7%) | 0 (0.0%) |
| 5-Person Households | 21 (2.5%) | 0 (0.0%) |
| 6-Person Households | 0 (0.0%) | 0 (0.0%) |
| 7+ Person Households | 30 (3.5%) | 0 (0.0%) |
| Total | 643 (75.2%) | 212 (24.8%) |
Female Fertility in East Dublin
Fertility by Age in East Dublin
Average fertility rate in East Dublin is 16.0 births per 1,000 women. Women in the age bracket of 35 to 50 years have the highest fertility rate with 27.0 births per 1,000 women. Women in the age bracket of 35 to 50 years acount for 54.5% of all women with births.
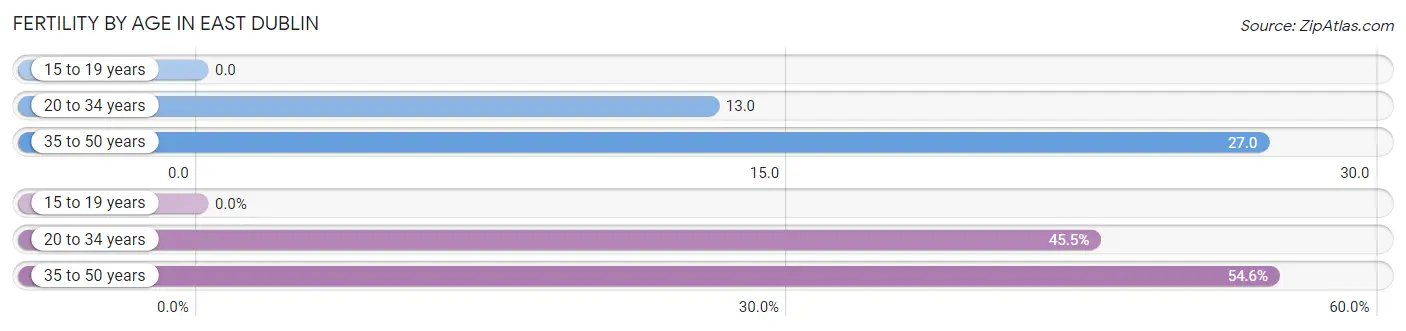
| Age Bracket | Women with Births | Births / 1,000 Women |
| 15 to 19 years | 0 (0.0%) | 0.0 |
| 20 to 34 years | 5 (45.5%) | 13.0 |
| 35 to 50 years | 6 (54.5%) | 27.0 |
| Total | 11 (100.0%) | 16.0 |
Fertility by Age by Marriage Status in East Dublin
45.5% of women with births (11) in East Dublin are married. The highest percentage of unmarried women with births falls into 35 to 50 years age bracket with 100.0% of them unmarried at the time of birth, while the lowest percentage of unmarried women with births belong to 20 to 34 years age bracket with 0.0% of them unmarried.
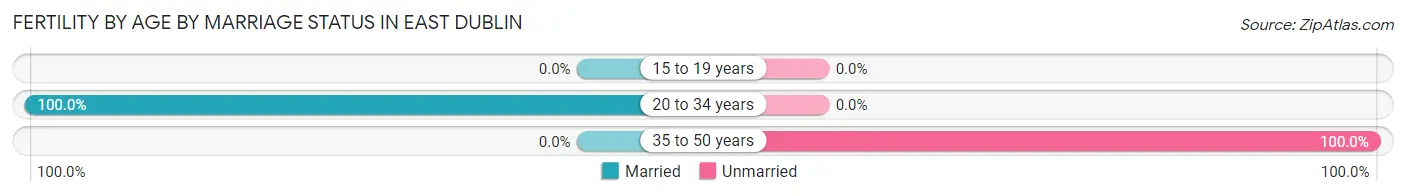
| Age Bracket | Married | Unmarried |
| 15 to 19 years | 0 (0.0%) | 0 (0.0%) |
| 20 to 34 years | 5 (100.0%) | 0 (0.0%) |
| 35 to 50 years | 0 (0.0%) | 6 (100.0%) |
| Total | 5 (45.5%) | 6 (54.5%) |
Fertility by Education in East Dublin
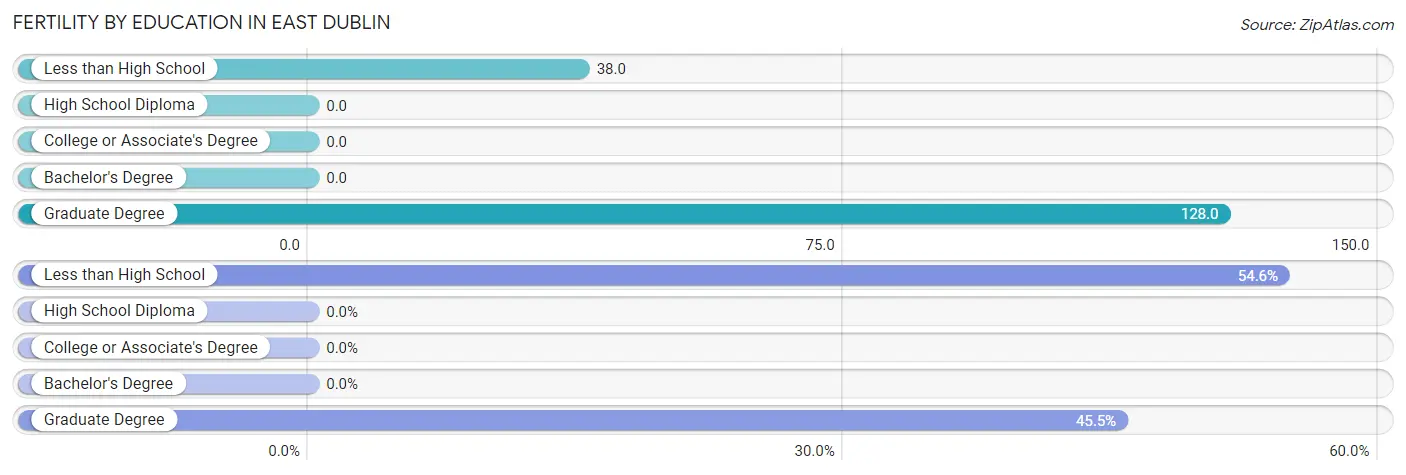
| Educational Attainment | Women with Births | Births / 1,000 Women |
| Less than High School | 6 (54.5%) | 38.0 |
| High School Diploma | 0 (0.0%) | 0.0 |
| College or Associate's Degree | 0 (0.0%) | 0.0 |
| Bachelor's Degree | 0 (0.0%) | 0.0 |
| Graduate Degree | 5 (45.5%) | 128.0 |
| Total | 11 (100.0%) | 16.0 |
Fertility by Education by Marriage Status in East Dublin
54.5% of women with births in East Dublin are unmarried. Women with the educational attainment of graduate degree are most likely to be married with 100.0% of them married at childbirth, while women with the educational attainment of less than high school are least likely to be married with 100.0% of them unmarried at childbirth.
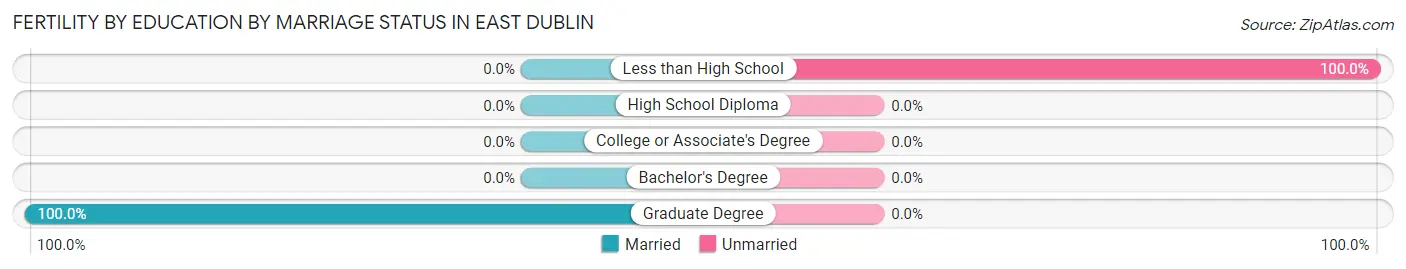
| Educational Attainment | Married | Unmarried |
| Less than High School | 0 (0.0%) | 6 (100.0%) |
| High School Diploma | 0 (0.0%) | 0 (0.0%) |
| College or Associate's Degree | 0 (0.0%) | 0 (0.0%) |
| Bachelor's Degree | 0 (0.0%) | 0 (0.0%) |
| Graduate Degree | 5 (100.0%) | 0 (0.0%) |
| Total | 5 (45.5%) | 6 (54.5%) |
Employment Characteristics in East Dublin
Employment by Class of Employer in East Dublin
Among the 1,321 employed individuals in East Dublin, private company employees (831 | 62.9%), not-for-profit organizations (198 | 15.0%), and federal government employees (103 | 7.8%) make up the most common classes of employment.
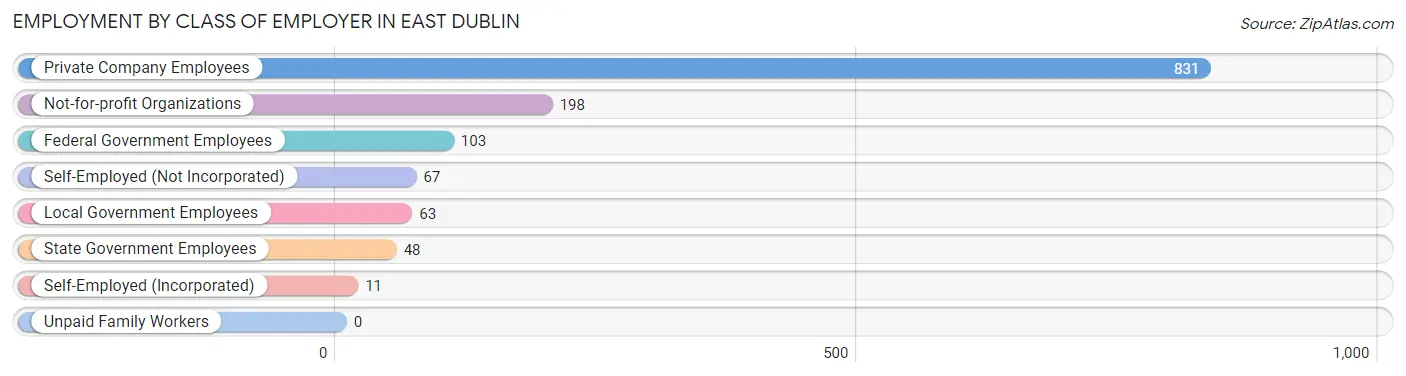
| Employer Class | # Employees | % Employees |
| Private Company Employees | 831 | 62.9% |
| Self-Employed (Incorporated) | 11 | 0.8% |
| Self-Employed (Not Incorporated) | 67 | 5.1% |
| Not-for-profit Organizations | 198 | 15.0% |
| Local Government Employees | 63 | 4.8% |
| State Government Employees | 48 | 3.6% |
| Federal Government Employees | 103 | 7.8% |
| Unpaid Family Workers | 0 | 0.0% |
| Total | 1,321 | 100.0% |
Employment Status by Age in East Dublin
According to the labor force statistics for East Dublin, out of the total population over 16 years of age (2,056), 69.7% or 1,433 individuals are in the labor force, with 7.3% or 105 of them unemployed. The age group with the highest labor force participation rate is 35 to 44 years, with 100.0% or 454 individuals in the labor force. Within the labor force, the 65 to 74 years age range has the highest percentage of unemployed individuals, with 28.3% or 13 of them being unemployed.
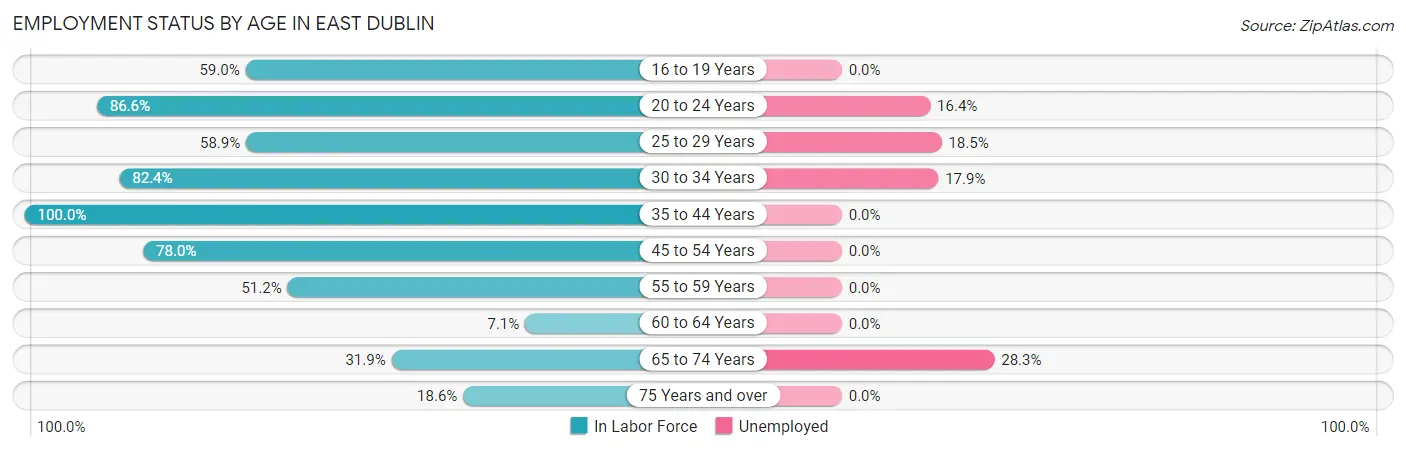
| Age Bracket | In Labor Force | Unemployed |
| 16 to 19 Years | 115 (59.0%) | 0 (0.0%) |
| 20 to 24 Years | 232 (86.6%) | 38 (16.4%) |
| 25 to 29 Years | 146 (58.9%) | 27 (18.5%) |
| 30 to 34 Years | 145 (82.4%) | 26 (17.9%) |
| 35 to 44 Years | 454 (100.0%) | 0 (0.0%) |
| 45 to 54 Years | 238 (78.0%) | 0 (0.0%) |
| 55 to 59 Years | 22 (51.2%) | 0 (0.0%) |
| 60 to 64 Years | 4 (7.1%) | 0 (0.0%) |
| 65 to 74 Years | 46 (31.9%) | 13 (28.3%) |
| 75 Years and over | 31 (18.6%) | 0 (0.0%) |
| Total | 1,433 (69.7%) | 105 (7.3%) |
Employment Status by Educational Attainment in East Dublin
According to labor force statistics for East Dublin, 78.7% of individuals (1,009) out of the total population between 25 and 64 years of age (1,282) are in the labor force, with 5.3% or 53 of them being unemployed. The group with the highest labor force participation rate are those with the educational attainment of bachelor's degree or higher, with 88.8% or 223 individuals in the labor force. Within the labor force, individuals with high school diploma education have the highest percentage of unemployment, with 14.4% or 53 of them being unemployed.
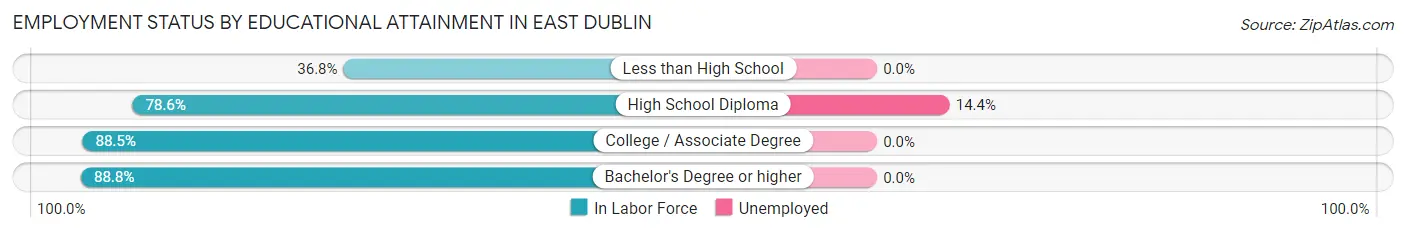
| Educational Attainment | In Labor Force | Unemployed |
| Less than High School | 57 (36.8%) | 0 (0.0%) |
| High School Diploma | 367 (78.6%) | 67 (14.4%) |
| College / Associate Degree | 362 (88.5%) | 0 (0.0%) |
| Bachelor's Degree or higher | 223 (88.8%) | 0 (0.0%) |
| Total | 1,009 (78.7%) | 68 (5.3%) |
Employment Occupations by Sex in East Dublin
Management, Business, Science and Arts Occupations
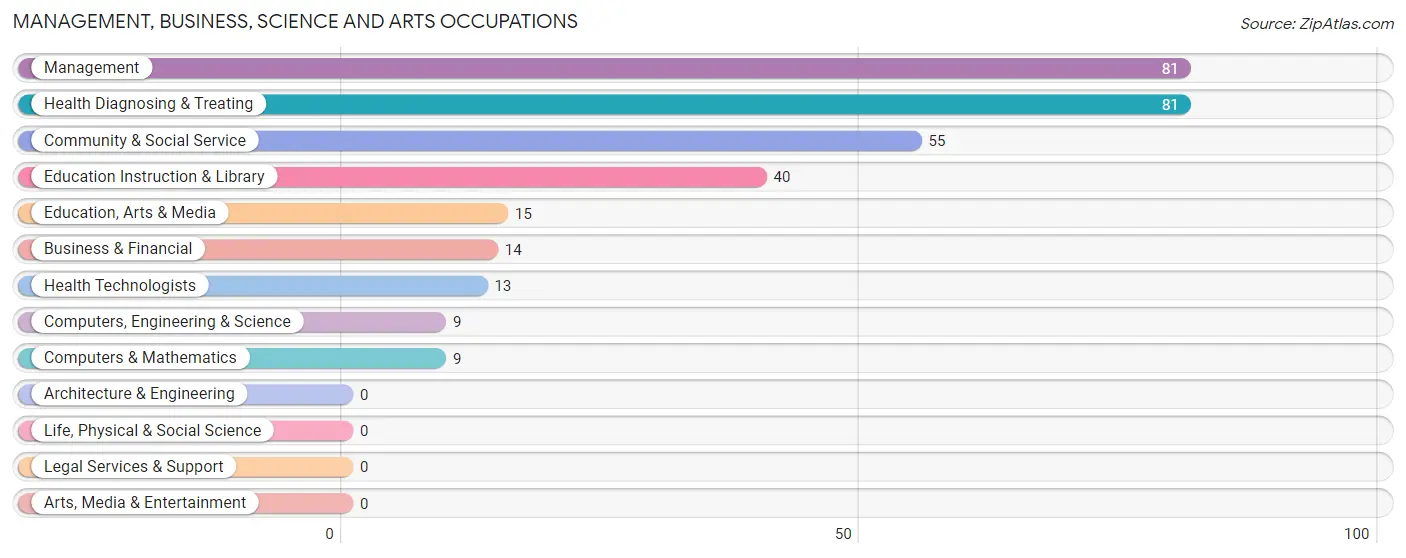
The most common Management, Business, Science and Arts occupations in East Dublin are Management (81 | 6.1%), Health Diagnosing & Treating (81 | 6.1%), Community & Social Service (55 | 4.1%), Education Instruction & Library (40 | 3.0%), and Education, Arts & Media (15 | 1.1%).
Management, Business, Science and Arts Occupations by Sex
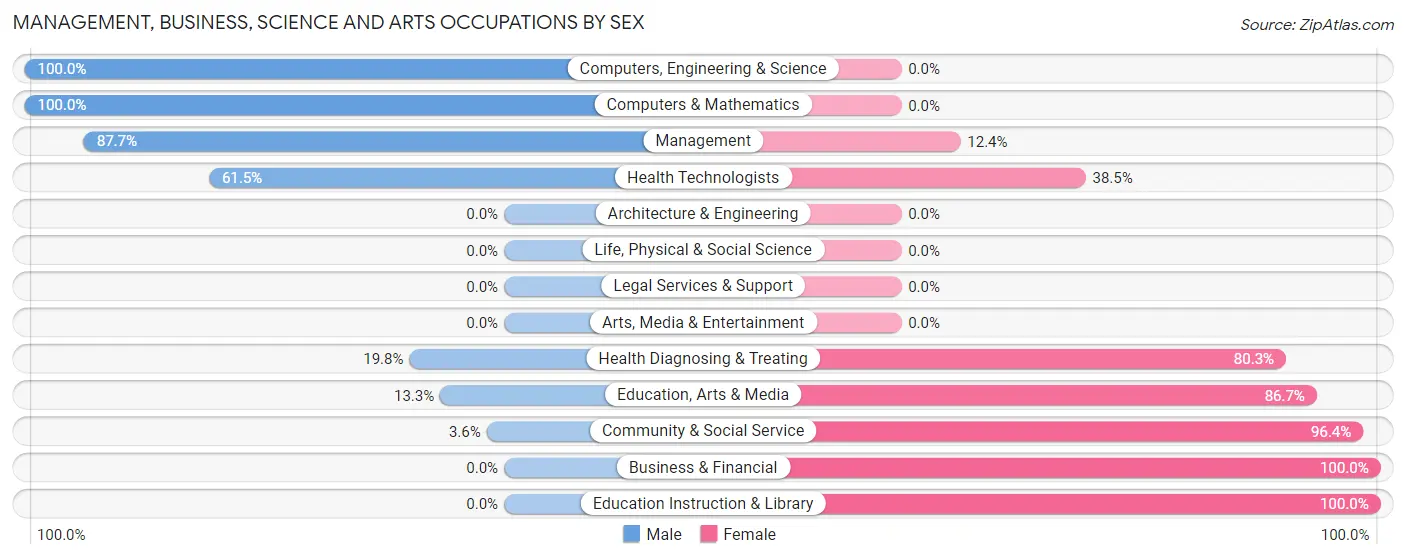
Within the Management, Business, Science and Arts occupations in East Dublin, the most male-oriented occupations are Computers, Engineering & Science (100.0%), Computers & Mathematics (100.0%), and Management (87.6%), while the most female-oriented occupations are Business & Financial (100.0%), Education Instruction & Library (100.0%), and Community & Social Service (96.4%).
| Occupation | Male | Female |
| Management | 71 (87.6%) | 10 (12.3%) |
| Business & Financial | 0 (0.0%) | 14 (100.0%) |
| Computers, Engineering & Science | 9 (100.0%) | 0 (0.0%) |
| Computers & Mathematics | 9 (100.0%) | 0 (0.0%) |
| Architecture & Engineering | 0 (0.0%) | 0 (0.0%) |
| Life, Physical & Social Science | 0 (0.0%) | 0 (0.0%) |
| Community & Social Service | 2 (3.6%) | 53 (96.4%) |
| Education, Arts & Media | 2 (13.3%) | 13 (86.7%) |
| Legal Services & Support | 0 (0.0%) | 0 (0.0%) |
| Education Instruction & Library | 0 (0.0%) | 40 (100.0%) |
| Arts, Media & Entertainment | 0 (0.0%) | 0 (0.0%) |
| Health Diagnosing & Treating | 16 (19.8%) | 65 (80.2%) |
| Health Technologists | 8 (61.5%) | 5 (38.5%) |
| Total (Category) | 98 (40.8%) | 142 (59.2%) |
| Total (Overall) | 745 (56.1%) | 584 (43.9%) |
Services Occupations
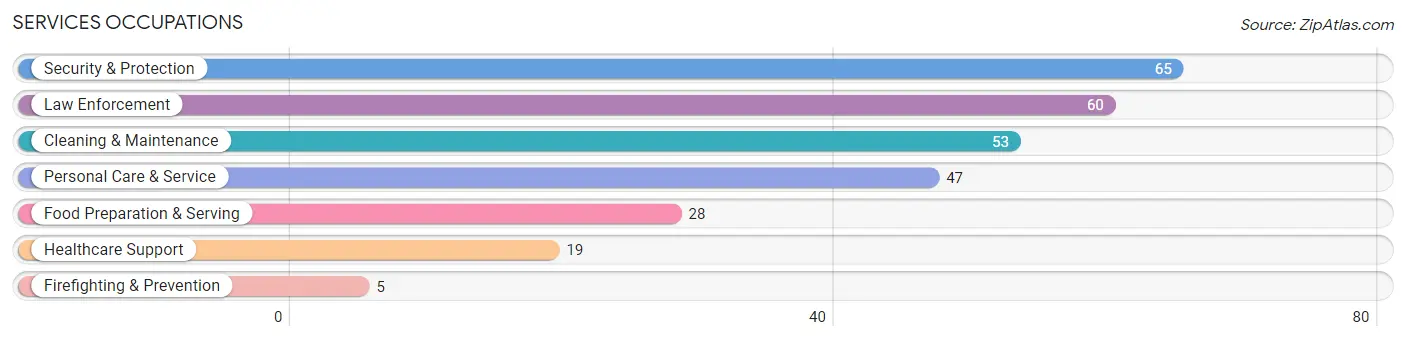
The most common Services occupations in East Dublin are Security & Protection (65 | 4.9%), Law Enforcement (60 | 4.5%), Cleaning & Maintenance (53 | 4.0%), Personal Care & Service (47 | 3.5%), and Food Preparation & Serving (28 | 2.1%).
Services Occupations by Sex
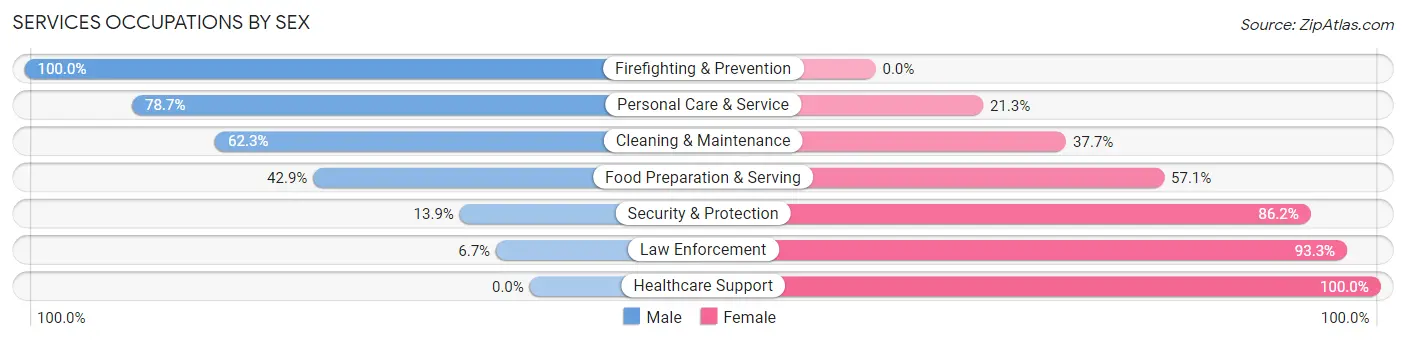
Within the Services occupations in East Dublin, the most male-oriented occupations are Firefighting & Prevention (100.0%), Personal Care & Service (78.7%), and Cleaning & Maintenance (62.3%), while the most female-oriented occupations are Healthcare Support (100.0%), Law Enforcement (93.3%), and Security & Protection (86.2%).
| Occupation | Male | Female |
| Healthcare Support | 0 (0.0%) | 19 (100.0%) |
| Security & Protection | 9 (13.9%) | 56 (86.2%) |
| Firefighting & Prevention | 5 (100.0%) | 0 (0.0%) |
| Law Enforcement | 4 (6.7%) | 56 (93.3%) |
| Food Preparation & Serving | 12 (42.9%) | 16 (57.1%) |
| Cleaning & Maintenance | 33 (62.3%) | 20 (37.7%) |
| Personal Care & Service | 37 (78.7%) | 10 (21.3%) |
| Total (Category) | 91 (42.9%) | 121 (57.1%) |
| Total (Overall) | 745 (56.1%) | 584 (43.9%) |
Sales and Office Occupations
The most common Sales and Office occupations in East Dublin are Office & Administration (174 | 13.1%), and Sales & Related (157 | 11.8%).

Sales and Office Occupations by Sex

| Occupation | Male | Female |
| Sales & Related | 59 (37.6%) | 98 (62.4%) |
| Office & Administration | 73 (41.9%) | 101 (58.1%) |
| Total (Category) | 132 (39.9%) | 199 (60.1%) |
| Total (Overall) | 745 (56.1%) | 584 (43.9%) |
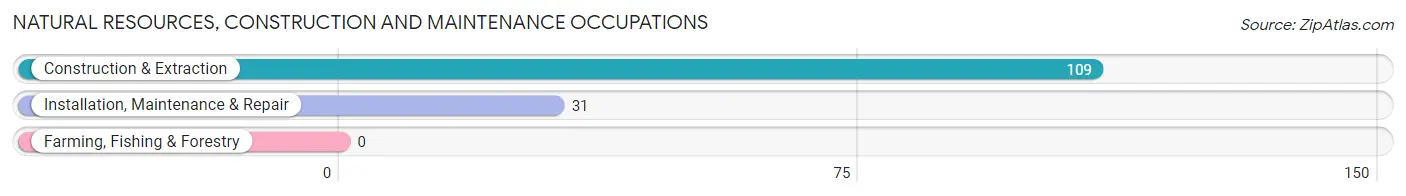
Natural Resources, Construction and Maintenance Occupations
The most common Natural Resources, Construction and Maintenance occupations in East Dublin are Construction & Extraction (109 | 8.2%), and Installation, Maintenance & Repair (31 | 2.3%).
Natural Resources, Construction and Maintenance Occupations by Sex
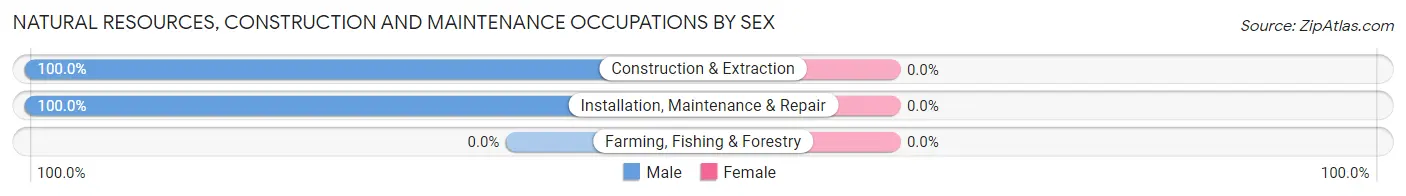
| Occupation | Male | Female |
| Farming, Fishing & Forestry | 0 (0.0%) | 0 (0.0%) |
| Construction & Extraction | 109 (100.0%) | 0 (0.0%) |
| Installation, Maintenance & Repair | 31 (100.0%) | 0 (0.0%) |
| Total (Category) | 140 (100.0%) | 0 (0.0%) |
| Total (Overall) | 745 (56.1%) | 584 (43.9%) |
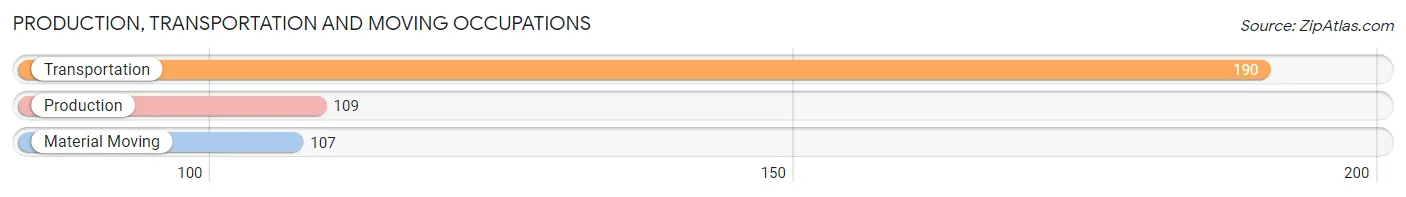
Production, Transportation and Moving Occupations
The most common Production, Transportation and Moving occupations in East Dublin are Transportation (190 | 14.3%), Production (109 | 8.2%), and Material Moving (107 | 8.1%).
Production, Transportation and Moving Occupations by Sex
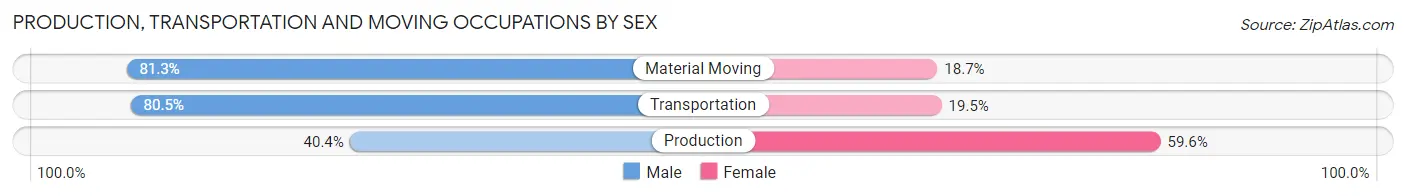
| Occupation | Male | Female |
| Production | 44 (40.4%) | 65 (59.6%) |
| Transportation | 153 (80.5%) | 37 (19.5%) |
| Material Moving | 87 (81.3%) | 20 (18.7%) |
| Total (Category) | 284 (70.0%) | 122 (30.0%) |
| Total (Overall) | 745 (56.1%) | 584 (43.9%) |
Employment Industries by Sex in East Dublin
Employment Industries in East Dublin
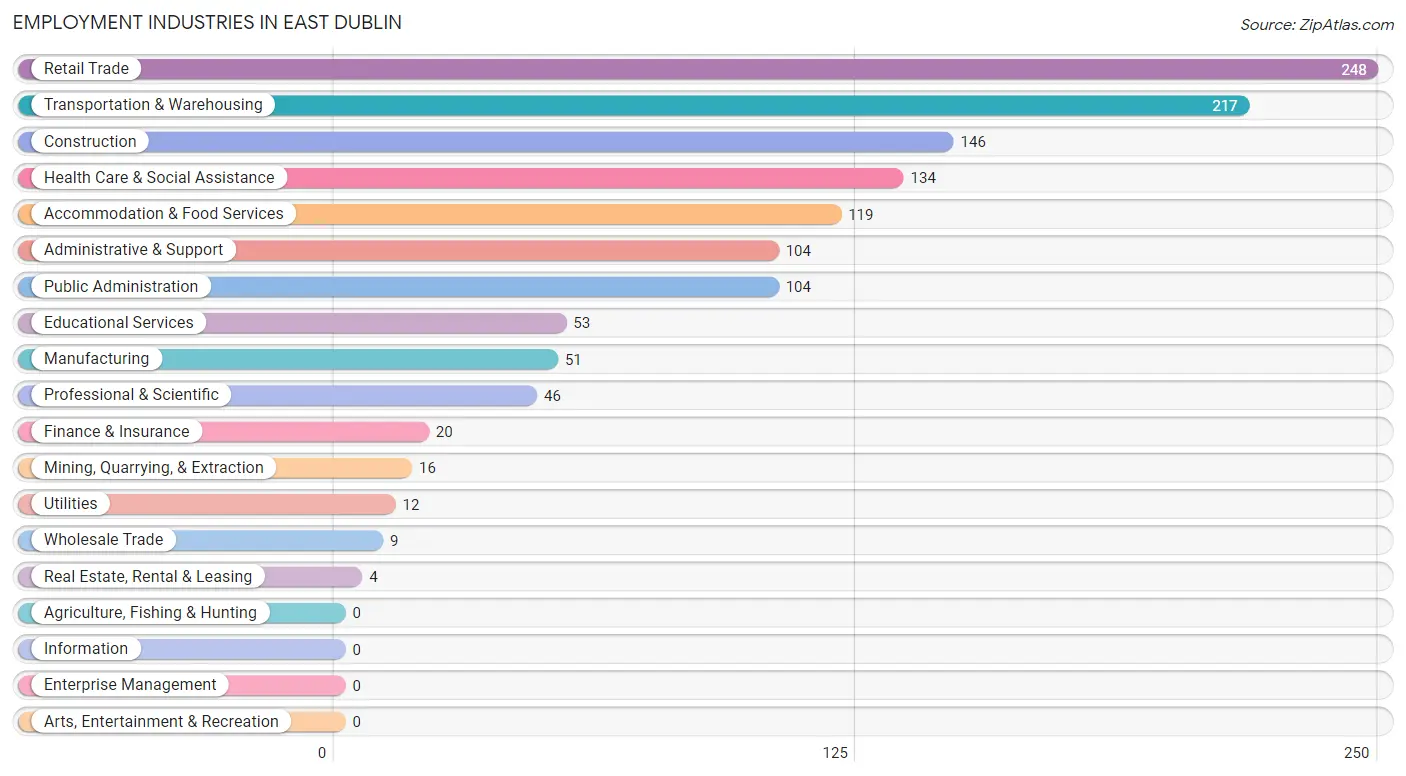
The major employment industries in East Dublin include Retail Trade (248 | 18.7%), Transportation & Warehousing (217 | 16.3%), Construction (146 | 11.0%), Health Care & Social Assistance (134 | 10.1%), and Accommodation & Food Services (119 | 8.9%).
Employment Industries by Sex in East Dublin
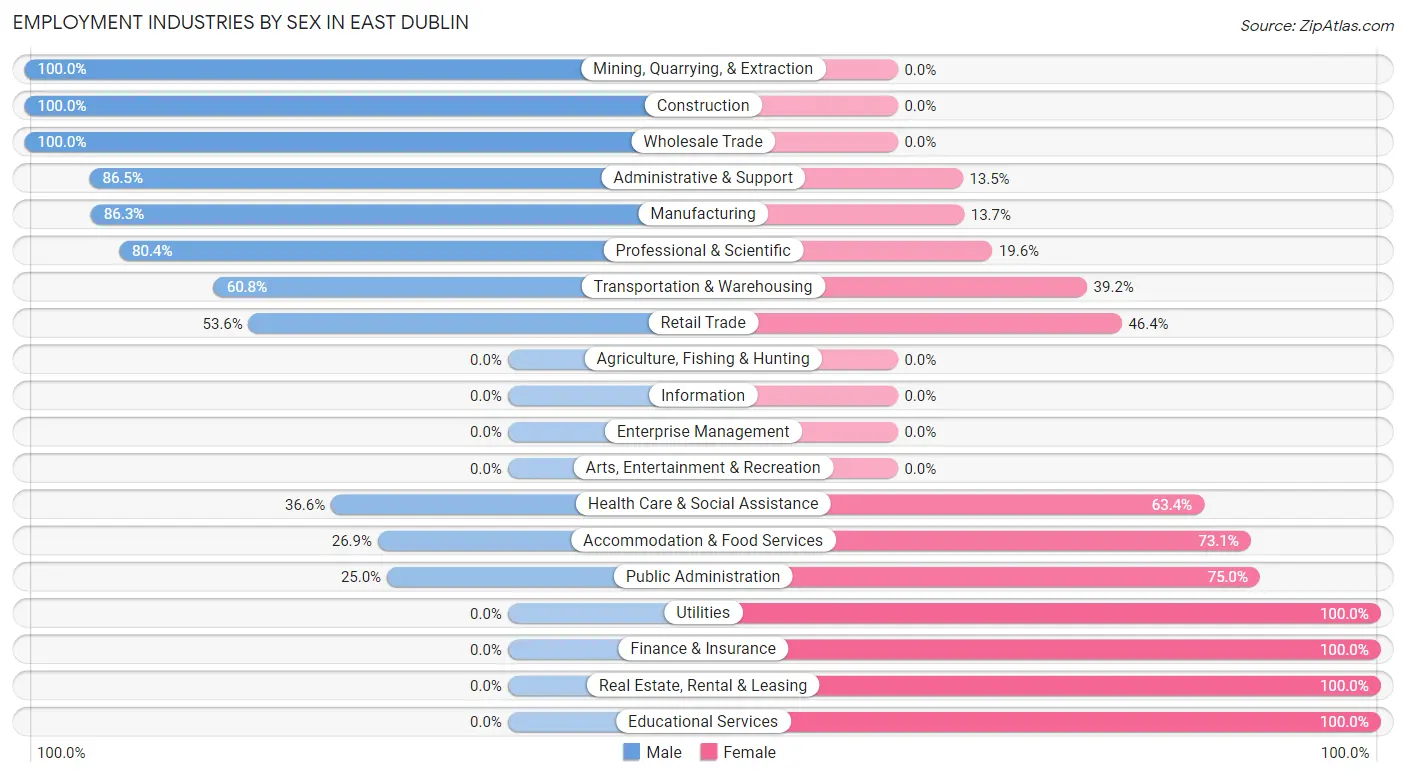
The East Dublin industries that see more men than women are Mining, Quarrying, & Extraction (100.0%), Construction (100.0%), and Wholesale Trade (100.0%), whereas the industries that tend to have a higher number of women are Utilities (100.0%), Finance & Insurance (100.0%), and Real Estate, Rental & Leasing (100.0%).
| Industry | Male | Female |
| Agriculture, Fishing & Hunting | 0 (0.0%) | 0 (0.0%) |
| Mining, Quarrying, & Extraction | 16 (100.0%) | 0 (0.0%) |
| Construction | 146 (100.0%) | 0 (0.0%) |
| Manufacturing | 44 (86.3%) | 7 (13.7%) |
| Wholesale Trade | 9 (100.0%) | 0 (0.0%) |
| Retail Trade | 133 (53.6%) | 115 (46.4%) |
| Transportation & Warehousing | 132 (60.8%) | 85 (39.2%) |
| Utilities | 0 (0.0%) | 12 (100.0%) |
| Information | 0 (0.0%) | 0 (0.0%) |
| Finance & Insurance | 0 (0.0%) | 20 (100.0%) |
| Real Estate, Rental & Leasing | 0 (0.0%) | 4 (100.0%) |
| Professional & Scientific | 37 (80.4%) | 9 (19.6%) |
| Enterprise Management | 0 (0.0%) | 0 (0.0%) |
| Administrative & Support | 90 (86.5%) | 14 (13.5%) |
| Educational Services | 0 (0.0%) | 53 (100.0%) |
| Health Care & Social Assistance | 49 (36.6%) | 85 (63.4%) |
| Arts, Entertainment & Recreation | 0 (0.0%) | 0 (0.0%) |
| Accommodation & Food Services | 32 (26.9%) | 87 (73.1%) |
| Public Administration | 26 (25.0%) | 78 (75.0%) |
| Total | 745 (56.1%) | 584 (43.9%) |
Education in East Dublin
School Enrollment in East Dublin
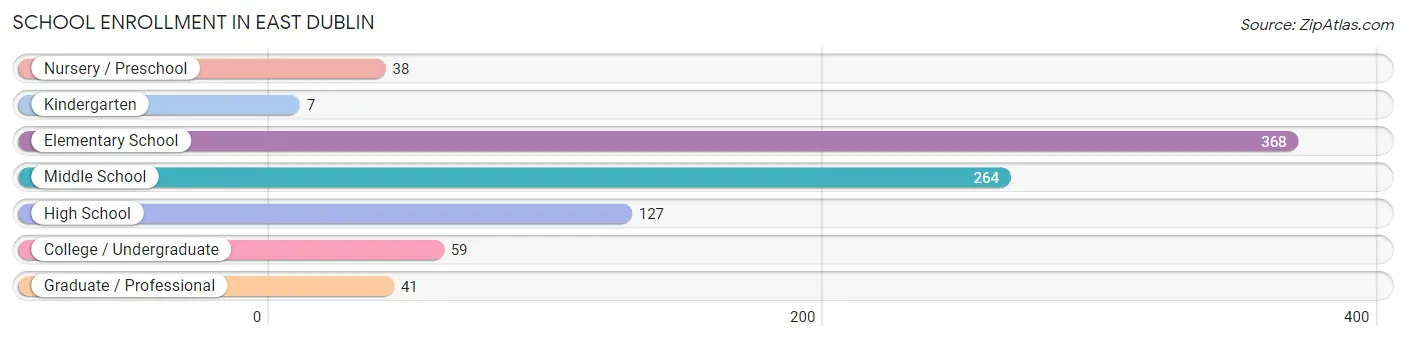
The most common levels of schooling among the 904 students in East Dublin are elementary school (368 | 40.7%), middle school (264 | 29.2%), and high school (127 | 14.1%).
| School Level | # Students | % Students |
| Nursery / Preschool | 38 | 4.2% |
| Kindergarten | 7 | 0.8% |
| Elementary School | 368 | 40.7% |
| Middle School | 264 | 29.2% |
| High School | 127 | 14.1% |
| College / Undergraduate | 59 | 6.5% |
| Graduate / Professional | 41 | 4.5% |
| Total | 904 | 100.0% |
School Enrollment by Age by Funding Source in East Dublin
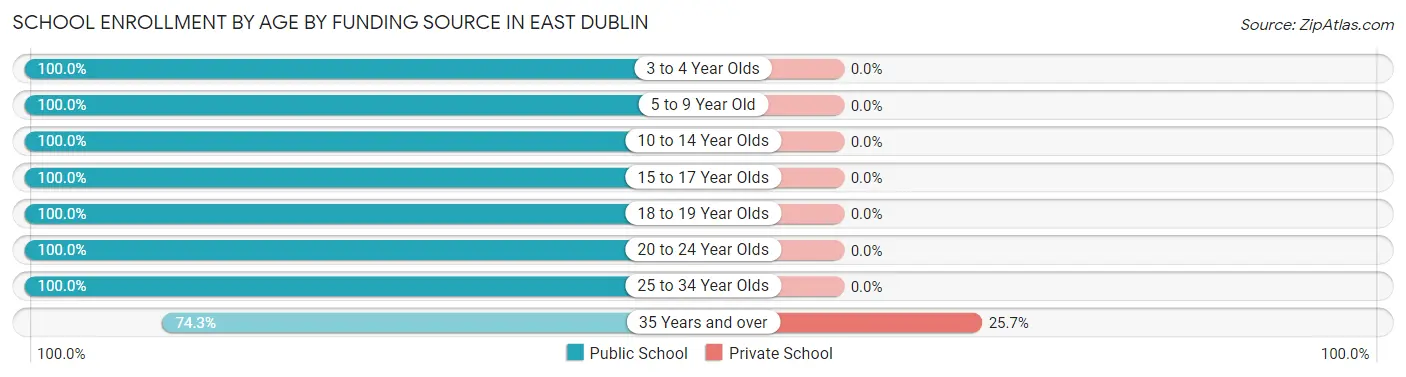
Out of a total of 904 students who are enrolled in schools in East Dublin, 9 (1.0%) attend a private institution, while the remaining 895 (99.0%) are enrolled in public schools. The age group of 35 years and over has the highest likelihood of being enrolled in private schools, with 9 (25.7% in the age bracket) enrolled. Conversely, the age group of 3 to 4 year olds has the lowest likelihood of being enrolled in a private school, with 38 (100.0% in the age bracket) attending a public institution.
| Age Bracket | Public School | Private School |
| 3 to 4 Year Olds | 38 (100.0%) | 0 (0.0%) |
| 5 to 9 Year Old | 287 (100.0%) | 0 (0.0%) |
| 10 to 14 Year Olds | 371 (100.0%) | 0 (0.0%) |
| 15 to 17 Year Olds | 56 (100.0%) | 0 (0.0%) |
| 18 to 19 Year Olds | 52 (100.0%) | 0 (0.0%) |
| 20 to 24 Year Olds | 27 (100.0%) | 0 (0.0%) |
| 25 to 34 Year Olds | 38 (100.0%) | 0 (0.0%) |
| 35 Years and over | 26 (74.3%) | 9 (25.7%) |
| Total | 895 (99.0%) | 9 (1.0%) |
Educational Attainment by Field of Study in East Dublin
Business (66 | 21.9%), science & technology (52 | 17.3%), arts & humanities (34 | 11.3%), education (32 | 10.6%), and physical & health sciences (30 | 10.0%) are the most common fields of study among 301 individuals in East Dublin who have obtained a bachelor's degree or higher.
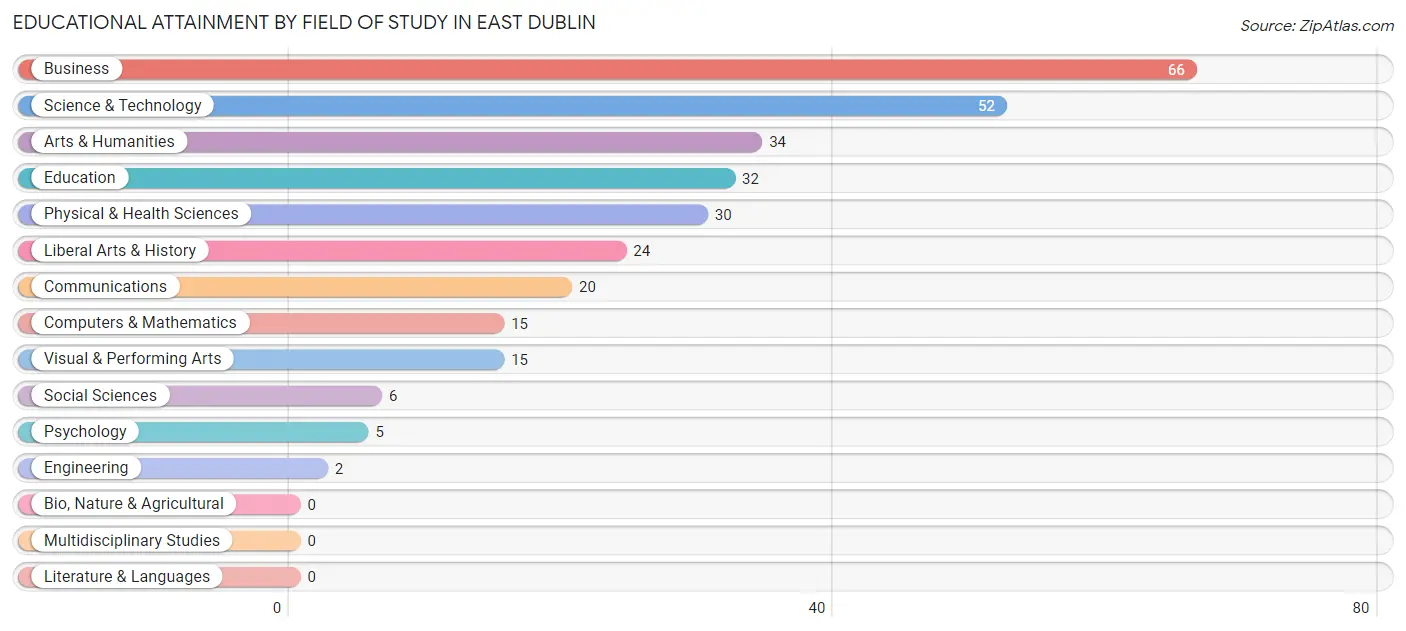
| Field of Study | # Graduates | % Graduates |
| Computers & Mathematics | 15 | 5.0% |
| Bio, Nature & Agricultural | 0 | 0.0% |
| Physical & Health Sciences | 30 | 10.0% |
| Psychology | 5 | 1.7% |
| Social Sciences | 6 | 2.0% |
| Engineering | 2 | 0.7% |
| Multidisciplinary Studies | 0 | 0.0% |
| Science & Technology | 52 | 17.3% |
| Business | 66 | 21.9% |
| Education | 32 | 10.6% |
| Literature & Languages | 0 | 0.0% |
| Liberal Arts & History | 24 | 8.0% |
| Visual & Performing Arts | 15 | 5.0% |
| Communications | 20 | 6.6% |
| Arts & Humanities | 34 | 11.3% |
| Total | 301 | 100.0% |
Transportation & Commute in East Dublin
Vehicle Availability by Sex in East Dublin
The most prevalent vehicle ownership categories in East Dublin are males with 2 vehicles (262, accounting for 35.2%) and females with 2 vehicles (187, making up 45.5%).
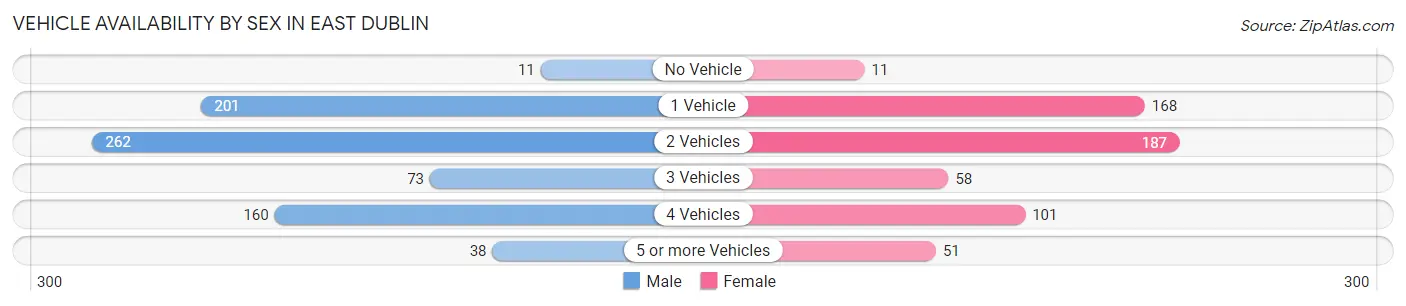
| Vehicles Available | Male | Female |
| No Vehicle | 11 (1.5%) | 11 (1.9%) |
| 1 Vehicle | 201 (27.0%) | 168 (29.2%) |
| 2 Vehicles | 262 (35.2%) | 187 (32.5%) |
| 3 Vehicles | 73 (9.8%) | 58 (10.1%) |
| 4 Vehicles | 160 (21.5%) | 101 (17.5%) |
| 5 or more Vehicles | 38 (5.1%) | 51 (8.8%) |
| Total | 745 (100.0%) | 576 (100.0%) |
Commute Time in East Dublin
The most frequently occuring commute durations in East Dublin are 10 to 14 minutes (352 commuters, 28.1%), 15 to 19 minutes (192 commuters, 15.3%), and 20 to 24 minutes (180 commuters, 14.4%).
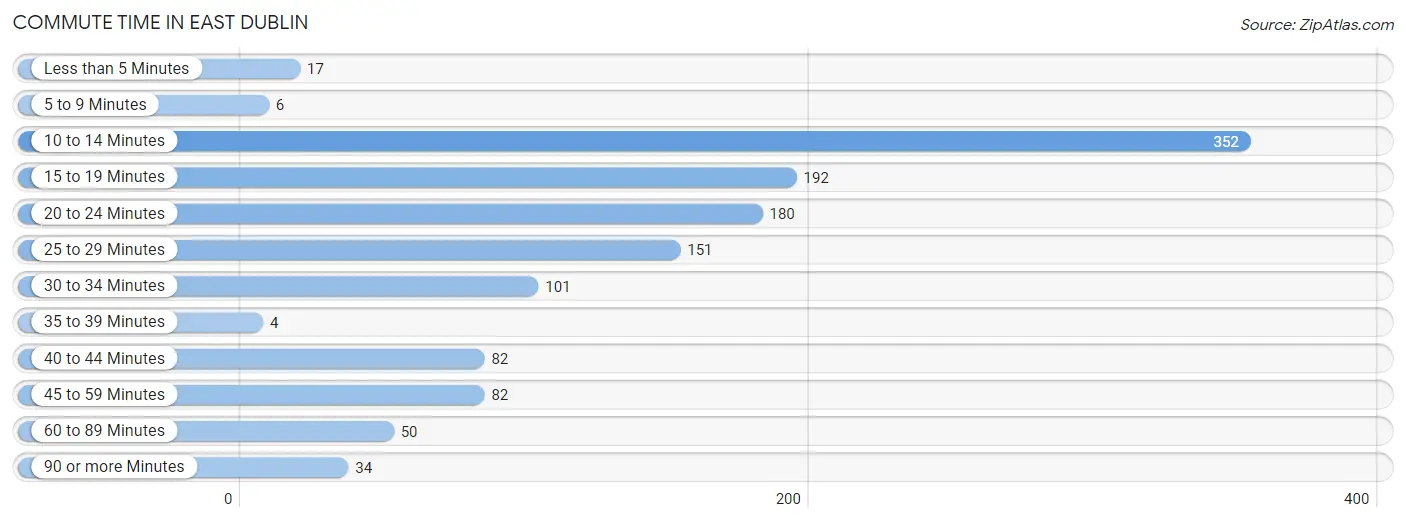
| Commute Time | # Commuters | % Commuters |
| Less than 5 Minutes | 17 | 1.4% |
| 5 to 9 Minutes | 6 | 0.5% |
| 10 to 14 Minutes | 352 | 28.1% |
| 15 to 19 Minutes | 192 | 15.3% |
| 20 to 24 Minutes | 180 | 14.4% |
| 25 to 29 Minutes | 151 | 12.1% |
| 30 to 34 Minutes | 101 | 8.1% |
| 35 to 39 Minutes | 4 | 0.3% |
| 40 to 44 Minutes | 82 | 6.6% |
| 45 to 59 Minutes | 82 | 6.6% |
| 60 to 89 Minutes | 50 | 4.0% |
| 90 or more Minutes | 34 | 2.7% |
Commute Time by Sex in East Dublin
The most common commute times in East Dublin are 10 to 14 minutes (263 commuters, 36.6%) for males and 15 to 19 minutes (102 commuters, 19.1%) for females.
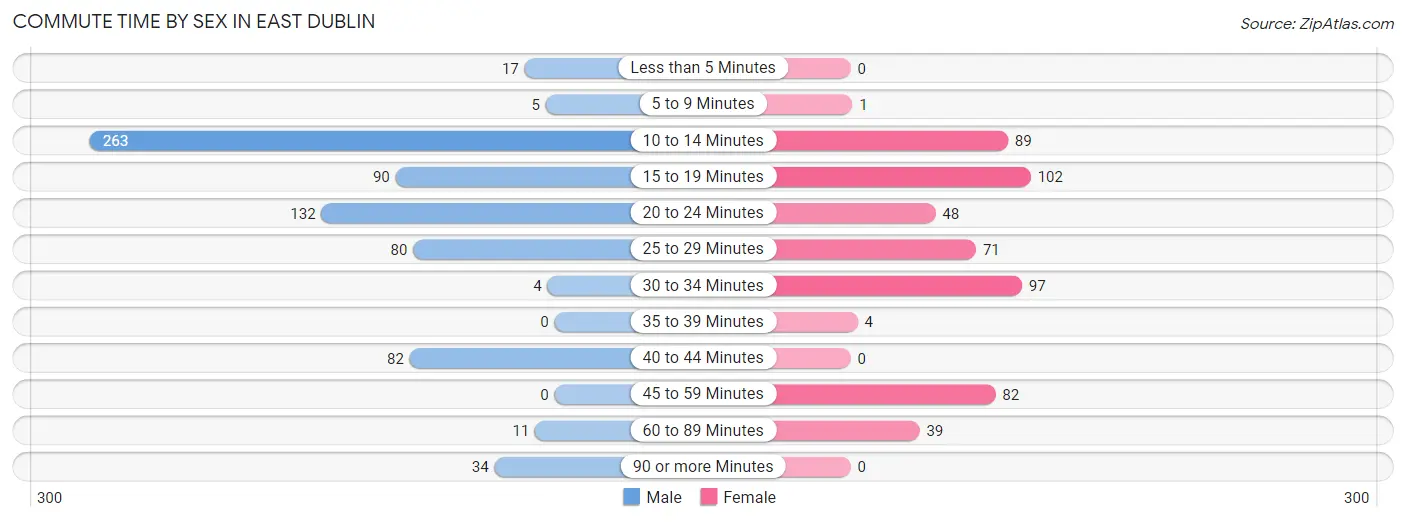
| Commute Time | Male | Female |
| Less than 5 Minutes | 17 (2.4%) | 0 (0.0%) |
| 5 to 9 Minutes | 5 (0.7%) | 1 (0.2%) |
| 10 to 14 Minutes | 263 (36.6%) | 89 (16.7%) |
| 15 to 19 Minutes | 90 (12.5%) | 102 (19.1%) |
| 20 to 24 Minutes | 132 (18.4%) | 48 (9.0%) |
| 25 to 29 Minutes | 80 (11.1%) | 71 (13.3%) |
| 30 to 34 Minutes | 4 (0.6%) | 97 (18.2%) |
| 35 to 39 Minutes | 0 (0.0%) | 4 (0.7%) |
| 40 to 44 Minutes | 82 (11.4%) | 0 (0.0%) |
| 45 to 59 Minutes | 0 (0.0%) | 82 (15.4%) |
| 60 to 89 Minutes | 11 (1.5%) | 39 (7.3%) |
| 90 or more Minutes | 34 (4.7%) | 0 (0.0%) |
Time of Departure to Work by Sex in East Dublin
The most frequent times of departure to work in East Dublin are 7:00 AM to 7:29 AM (285, 39.7%) for males and 7:00 AM to 7:29 AM (161, 30.2%) for females.
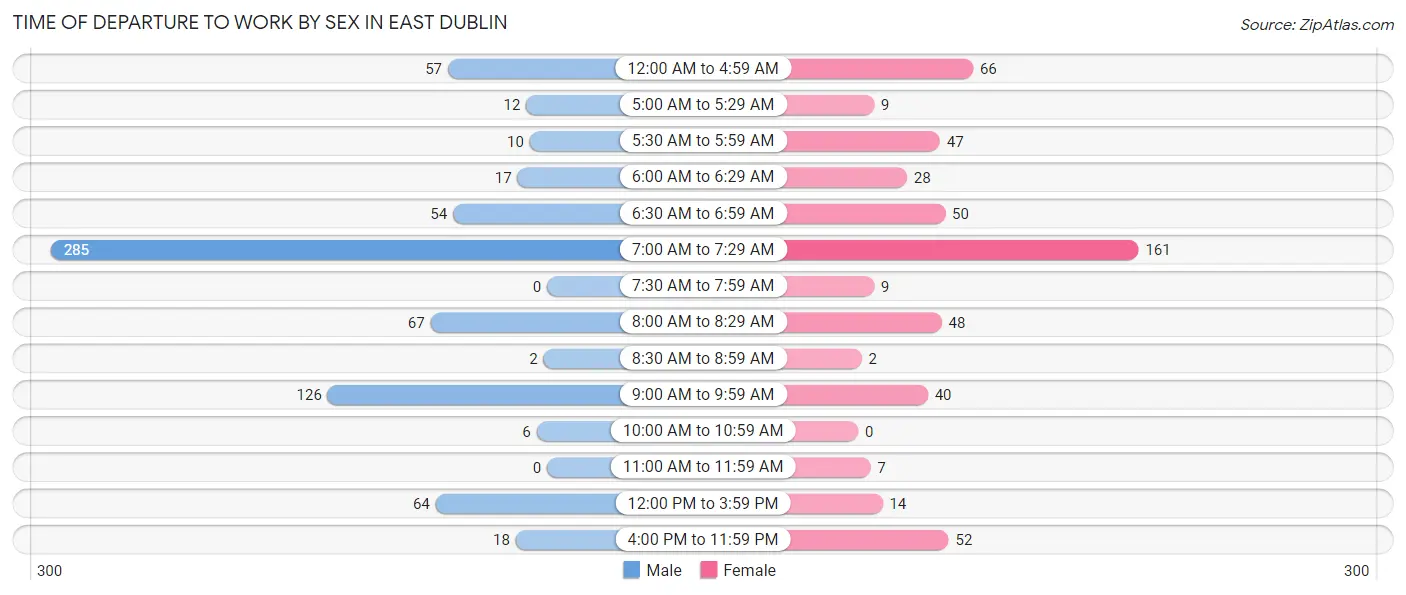
| Time of Departure | Male | Female |
| 12:00 AM to 4:59 AM | 57 (7.9%) | 66 (12.4%) |
| 5:00 AM to 5:29 AM | 12 (1.7%) | 9 (1.7%) |
| 5:30 AM to 5:59 AM | 10 (1.4%) | 47 (8.8%) |
| 6:00 AM to 6:29 AM | 17 (2.4%) | 28 (5.2%) |
| 6:30 AM to 6:59 AM | 54 (7.5%) | 50 (9.4%) |
| 7:00 AM to 7:29 AM | 285 (39.7%) | 161 (30.2%) |
| 7:30 AM to 7:59 AM | 0 (0.0%) | 9 (1.7%) |
| 8:00 AM to 8:29 AM | 67 (9.3%) | 48 (9.0%) |
| 8:30 AM to 8:59 AM | 2 (0.3%) | 2 (0.4%) |
| 9:00 AM to 9:59 AM | 126 (17.5%) | 40 (7.5%) |
| 10:00 AM to 10:59 AM | 6 (0.8%) | 0 (0.0%) |
| 11:00 AM to 11:59 AM | 0 (0.0%) | 7 (1.3%) |
| 12:00 PM to 3:59 PM | 64 (8.9%) | 14 (2.6%) |
| 4:00 PM to 11:59 PM | 18 (2.5%) | 52 (9.8%) |
| Total | 718 (100.0%) | 533 (100.0%) |
Housing Occupancy in East Dublin
Occupancy by Ownership in East Dublin
Of the total 855 dwellings in East Dublin, owner-occupied units account for 302 (35.3%), while renter-occupied units make up 553 (64.7%).
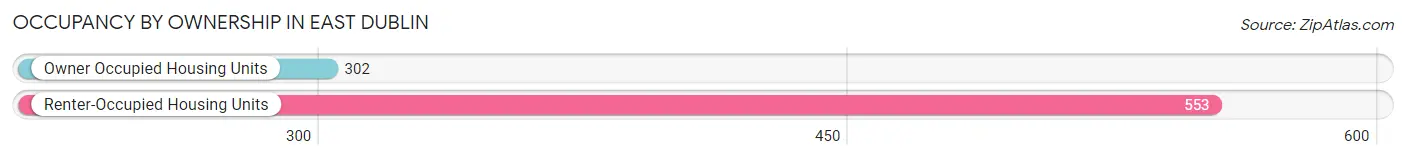
| Occupancy | # Housing Units | % Housing Units |
| Owner Occupied Housing Units | 302 | 35.3% |
| Renter-Occupied Housing Units | 553 | 64.7% |
| Total Occupied Housing Units | 855 | 100.0% |
Occupancy by Household Size in East Dublin
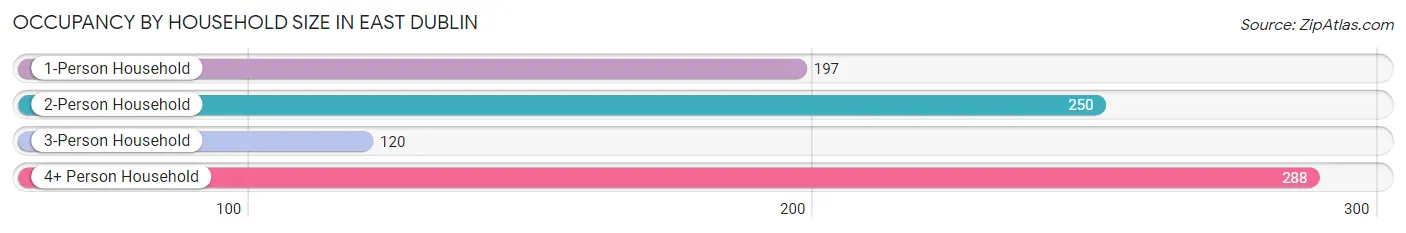
| Household Size | # Housing Units | % Housing Units |
| 1-Person Household | 197 | 23.0% |
| 2-Person Household | 250 | 29.2% |
| 3-Person Household | 120 | 14.0% |
| 4+ Person Household | 288 | 33.7% |
| Total Housing Units | 855 | 100.0% |
Occupancy by Ownership by Household Size in East Dublin
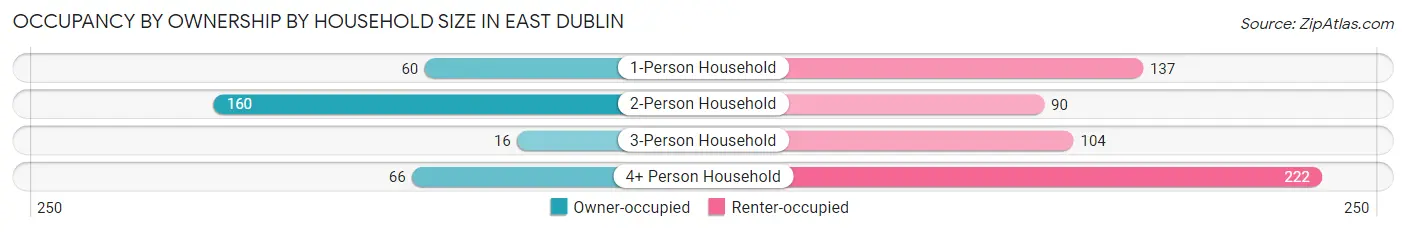
| Household Size | Owner-occupied | Renter-occupied |
| 1-Person Household | 60 (30.5%) | 137 (69.5%) |
| 2-Person Household | 160 (64.0%) | 90 (36.0%) |
| 3-Person Household | 16 (13.3%) | 104 (86.7%) |
| 4+ Person Household | 66 (22.9%) | 222 (77.1%) |
| Total Housing Units | 302 (35.3%) | 553 (64.7%) |
Occupancy by Educational Attainment in East Dublin
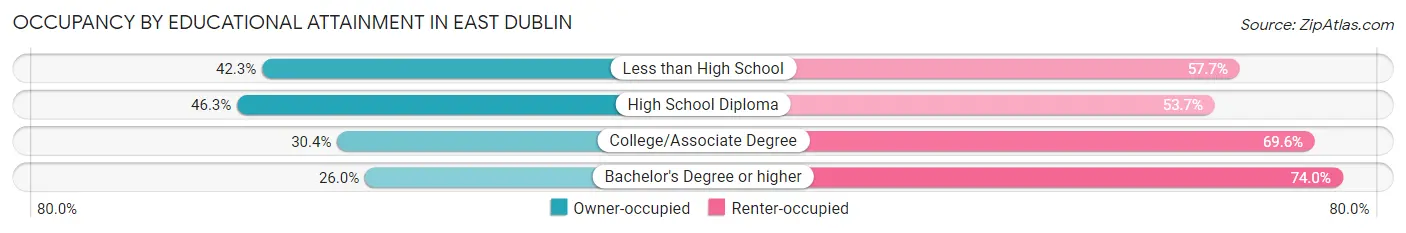
| Household Size | Owner-occupied | Renter-occupied |
| Less than High School | 47 (42.3%) | 64 (57.7%) |
| High School Diploma | 106 (46.3%) | 123 (53.7%) |
| College/Associate Degree | 104 (30.4%) | 238 (69.6%) |
| Bachelor's Degree or higher | 45 (26.0%) | 128 (74.0%) |
Occupancy by Age of Householder in East Dublin
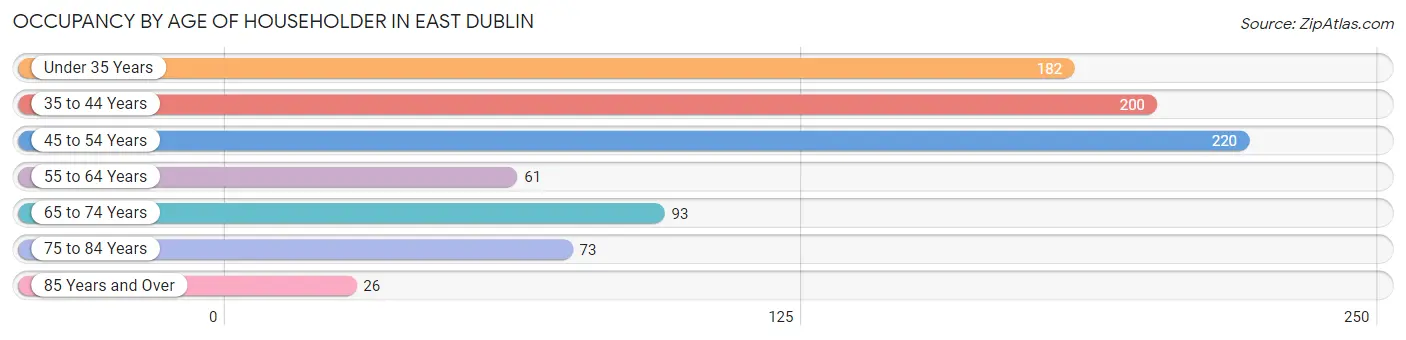
| Age Bracket | # Households | % Households |
| Under 35 Years | 182 | 21.3% |
| 35 to 44 Years | 200 | 23.4% |
| 45 to 54 Years | 220 | 25.7% |
| 55 to 64 Years | 61 | 7.1% |
| 65 to 74 Years | 93 | 10.9% |
| 75 to 84 Years | 73 | 8.5% |
| 85 Years and Over | 26 | 3.0% |
| Total | 855 | 100.0% |
Housing Finances in East Dublin
Median Income by Occupancy in East Dublin
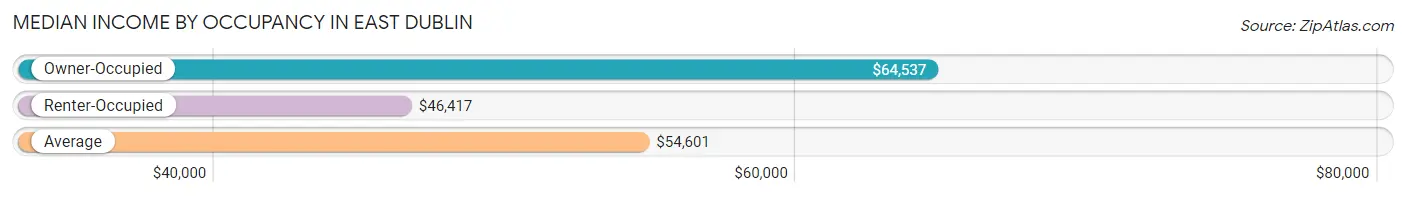
| Occupancy Type | # Households | Median Income |
| Owner-Occupied | 302 (35.3%) | $64,537 |
| Renter-Occupied | 553 (64.7%) | $46,417 |
| Average | 855 (100.0%) | $54,601 |
Occupancy by Householder Income Bracket in East Dublin
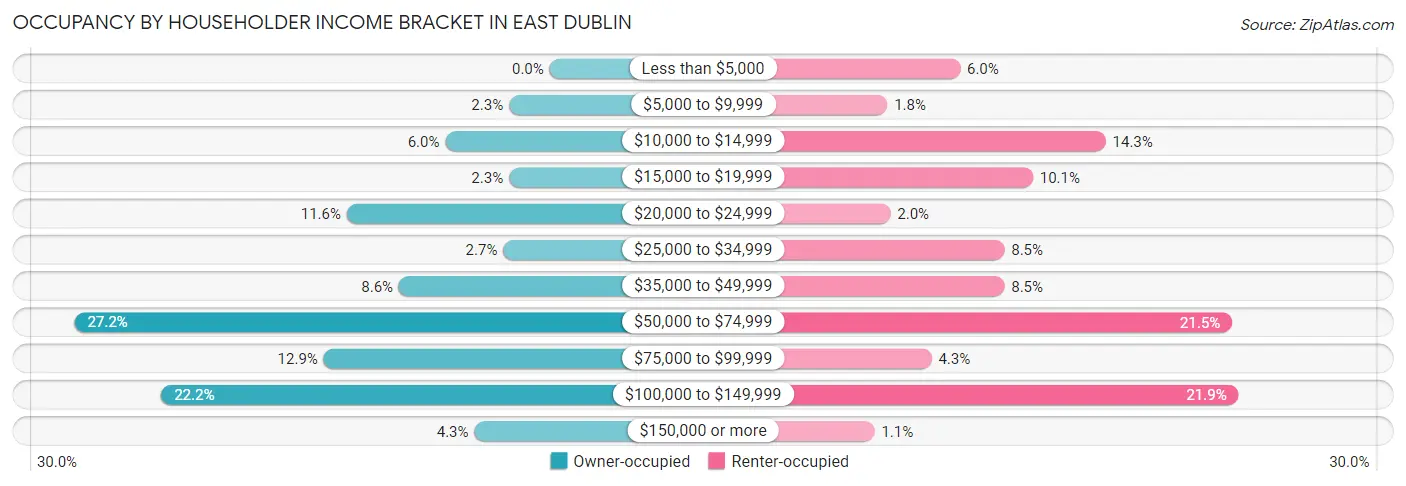
| Income Bracket | Owner-occupied | Renter-occupied |
| Less than $5,000 | 0 (0.0%) | 33 (6.0%) |
| $5,000 to $9,999 | 7 (2.3%) | 10 (1.8%) |
| $10,000 to $14,999 | 18 (6.0%) | 79 (14.3%) |
| $15,000 to $19,999 | 7 (2.3%) | 56 (10.1%) |
| $20,000 to $24,999 | 35 (11.6%) | 11 (2.0%) |
| $25,000 to $34,999 | 8 (2.6%) | 47 (8.5%) |
| $35,000 to $49,999 | 26 (8.6%) | 47 (8.5%) |
| $50,000 to $74,999 | 82 (27.2%) | 119 (21.5%) |
| $75,000 to $99,999 | 39 (12.9%) | 24 (4.3%) |
| $100,000 to $149,999 | 67 (22.2%) | 121 (21.9%) |
| $150,000 or more | 13 (4.3%) | 6 (1.1%) |
| Total | 302 (100.0%) | 553 (100.0%) |
Monthly Housing Cost Tiers in East Dublin
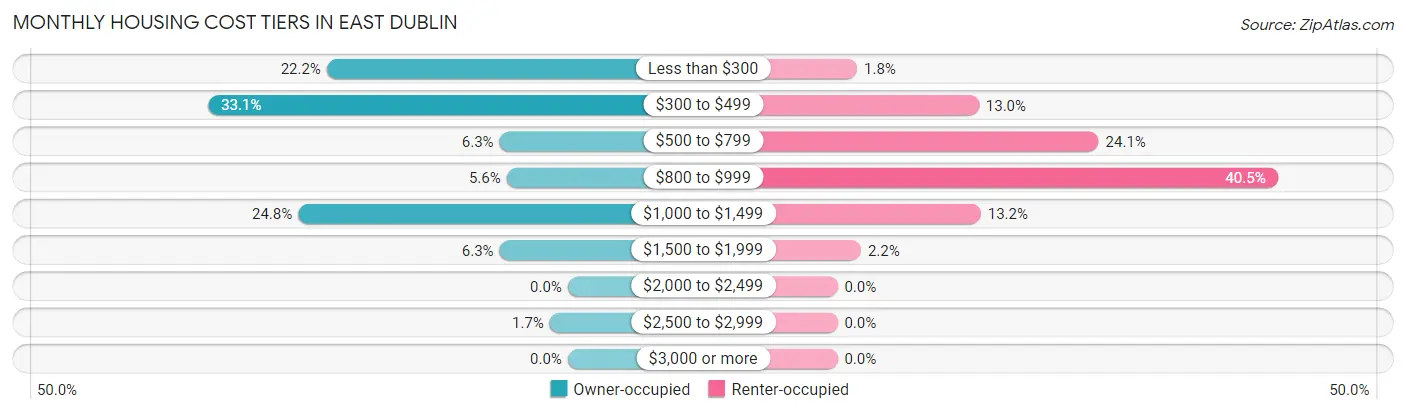
| Monthly Cost | Owner-occupied | Renter-occupied |
| Less than $300 | 67 (22.2%) | 10 (1.8%) |
| $300 to $499 | 100 (33.1%) | 72 (13.0%) |
| $500 to $799 | 19 (6.3%) | 133 (24.0%) |
| $800 to $999 | 17 (5.6%) | 224 (40.5%) |
| $1,000 to $1,499 | 75 (24.8%) | 73 (13.2%) |
| $1,500 to $1,999 | 19 (6.3%) | 12 (2.2%) |
| $2,000 to $2,499 | 0 (0.0%) | 0 (0.0%) |
| $2,500 to $2,999 | 5 (1.7%) | 0 (0.0%) |
| $3,000 or more | 0 (0.0%) | 0 (0.0%) |
| Total | 302 (100.0%) | 553 (100.0%) |
Physical Housing Characteristics in East Dublin
Housing Structures in East Dublin
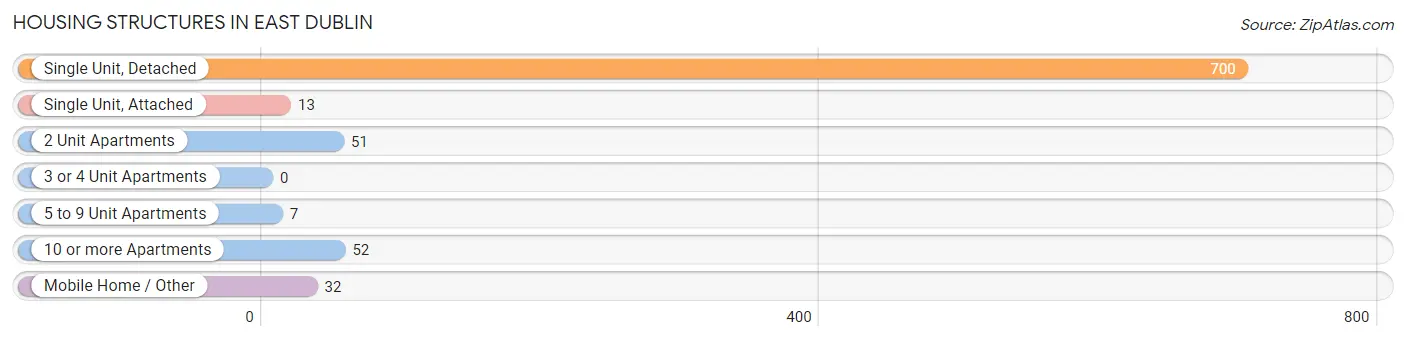
| Structure Type | # Housing Units | % Housing Units |
| Single Unit, Detached | 700 | 81.9% |
| Single Unit, Attached | 13 | 1.5% |
| 2 Unit Apartments | 51 | 6.0% |
| 3 or 4 Unit Apartments | 0 | 0.0% |
| 5 to 9 Unit Apartments | 7 | 0.8% |
| 10 or more Apartments | 52 | 6.1% |
| Mobile Home / Other | 32 | 3.7% |
| Total | 855 | 100.0% |
Housing Structures by Occupancy in East Dublin
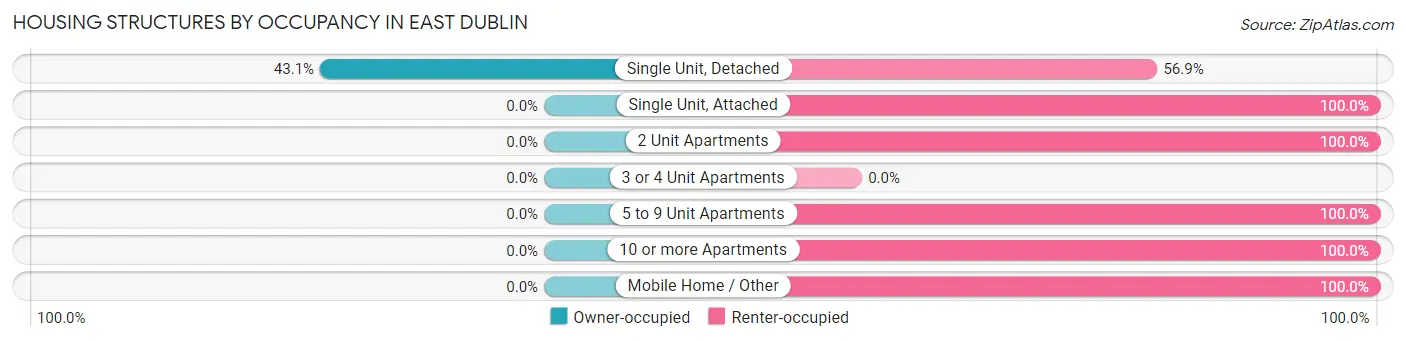
| Structure Type | Owner-occupied | Renter-occupied |
| Single Unit, Detached | 302 (43.1%) | 398 (56.9%) |
| Single Unit, Attached | 0 (0.0%) | 13 (100.0%) |
| 2 Unit Apartments | 0 (0.0%) | 51 (100.0%) |
| 3 or 4 Unit Apartments | 0 (0.0%) | 0 (0.0%) |
| 5 to 9 Unit Apartments | 0 (0.0%) | 7 (100.0%) |
| 10 or more Apartments | 0 (0.0%) | 52 (100.0%) |
| Mobile Home / Other | 0 (0.0%) | 32 (100.0%) |
| Total | 302 (35.3%) | 553 (64.7%) |
Housing Structures by Number of Rooms in East Dublin
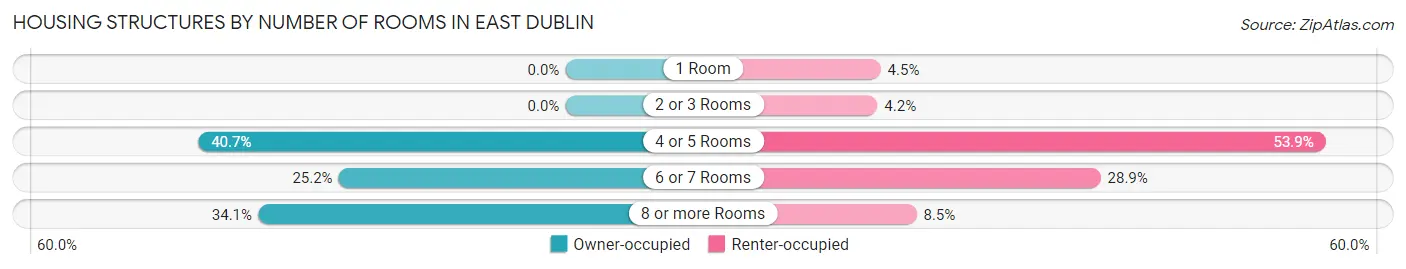
| Number of Rooms | Owner-occupied | Renter-occupied |
| 1 Room | 0 (0.0%) | 25 (4.5%) |
| 2 or 3 Rooms | 0 (0.0%) | 23 (4.2%) |
| 4 or 5 Rooms | 123 (40.7%) | 298 (53.9%) |
| 6 or 7 Rooms | 76 (25.2%) | 160 (28.9%) |
| 8 or more Rooms | 103 (34.1%) | 47 (8.5%) |
| Total | 302 (100.0%) | 553 (100.0%) |
Housing Structure by Heating Type in East Dublin
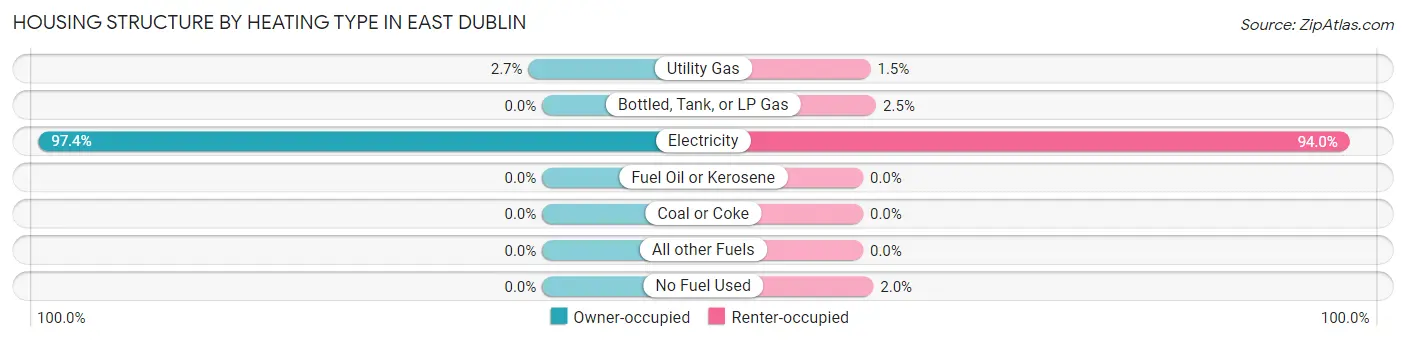
| Heating Type | Owner-occupied | Renter-occupied |
| Utility Gas | 8 (2.6%) | 8 (1.5%) |
| Bottled, Tank, or LP Gas | 0 (0.0%) | 14 (2.5%) |
| Electricity | 294 (97.4%) | 520 (94.0%) |
| Fuel Oil or Kerosene | 0 (0.0%) | 0 (0.0%) |
| Coal or Coke | 0 (0.0%) | 0 (0.0%) |
| All other Fuels | 0 (0.0%) | 0 (0.0%) |
| No Fuel Used | 0 (0.0%) | 11 (2.0%) |
| Total | 302 (100.0%) | 553 (100.0%) |
Household Vehicle Usage in East Dublin
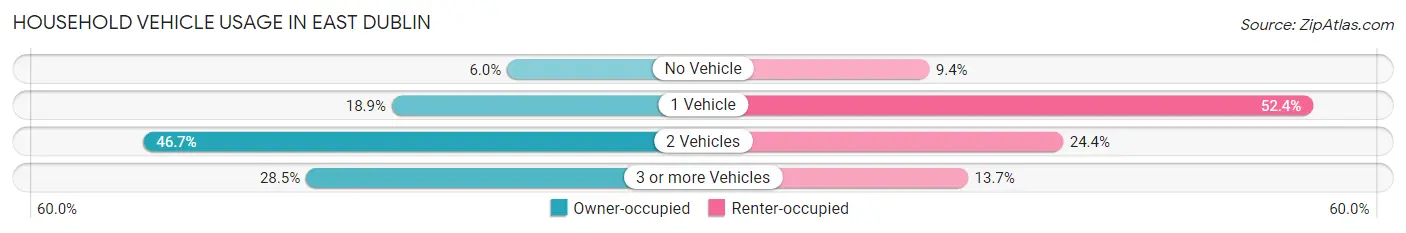
| Vehicles per Household | Owner-occupied | Renter-occupied |
| No Vehicle | 18 (6.0%) | 52 (9.4%) |
| 1 Vehicle | 57 (18.9%) | 290 (52.4%) |
| 2 Vehicles | 141 (46.7%) | 135 (24.4%) |
| 3 or more Vehicles | 86 (28.5%) | 76 (13.7%) |
| Total | 302 (100.0%) | 553 (100.0%) |
Real Estate & Mortgages in East Dublin
Real Estate and Mortgage Overview in East Dublin
| Characteristic | Without Mortgage | With Mortgage |
| Housing Units | 176 | 126 |
| Median Property Value | $110,800 | $175,000 |
| Median Household Income | $48,438 | $8 |
| Monthly Housing Costs | $363 | $0 |
| Real Estate Taxes | $638 | $0 |
Property Value by Mortgage Status in East Dublin
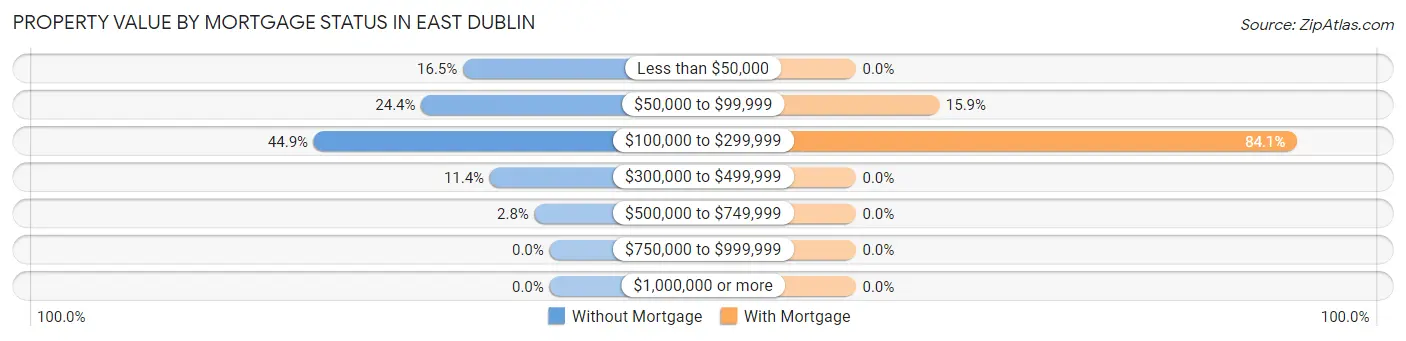
| Property Value | Without Mortgage | With Mortgage |
| Less than $50,000 | 29 (16.5%) | 0 (0.0%) |
| $50,000 to $99,999 | 43 (24.4%) | 20 (15.9%) |
| $100,000 to $299,999 | 79 (44.9%) | 106 (84.1%) |
| $300,000 to $499,999 | 20 (11.4%) | 0 (0.0%) |
| $500,000 to $749,999 | 5 (2.8%) | 0 (0.0%) |
| $750,000 to $999,999 | 0 (0.0%) | 0 (0.0%) |
| $1,000,000 or more | 0 (0.0%) | 0 (0.0%) |
| Total | 176 (100.0%) | 126 (100.0%) |
Household Income by Mortgage Status in East Dublin
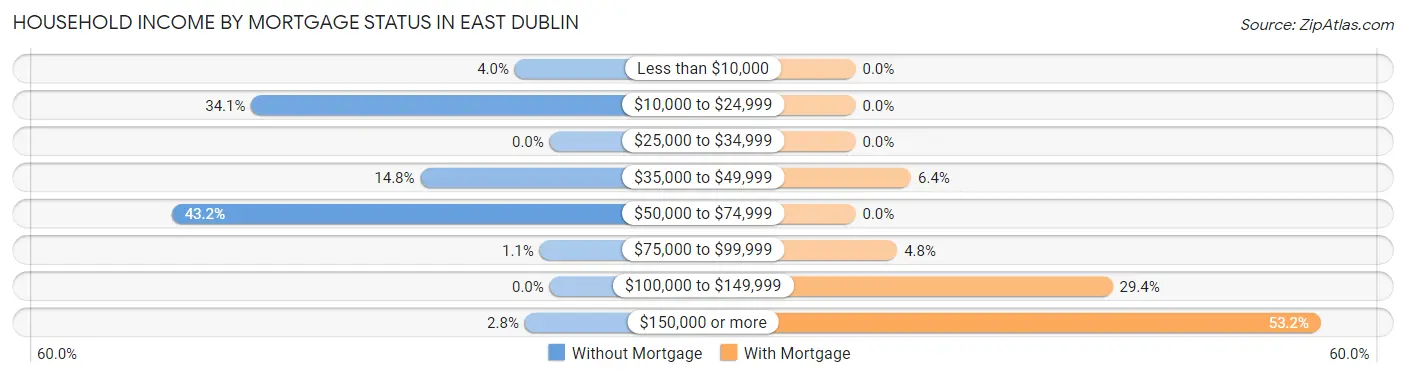
| Household Income | Without Mortgage | With Mortgage |
| Less than $10,000 | 7 (4.0%) | 0 (0.0%) |
| $10,000 to $24,999 | 60 (34.1%) | 0 (0.0%) |
| $25,000 to $34,999 | 0 (0.0%) | 0 (0.0%) |
| $35,000 to $49,999 | 26 (14.8%) | 8 (6.4%) |
| $50,000 to $74,999 | 76 (43.2%) | 0 (0.0%) |
| $75,000 to $99,999 | 2 (1.1%) | 6 (4.8%) |
| $100,000 to $149,999 | 0 (0.0%) | 37 (29.4%) |
| $150,000 or more | 5 (2.8%) | 67 (53.2%) |
| Total | 176 (100.0%) | 126 (100.0%) |
Property Value to Household Income Ratio in East Dublin
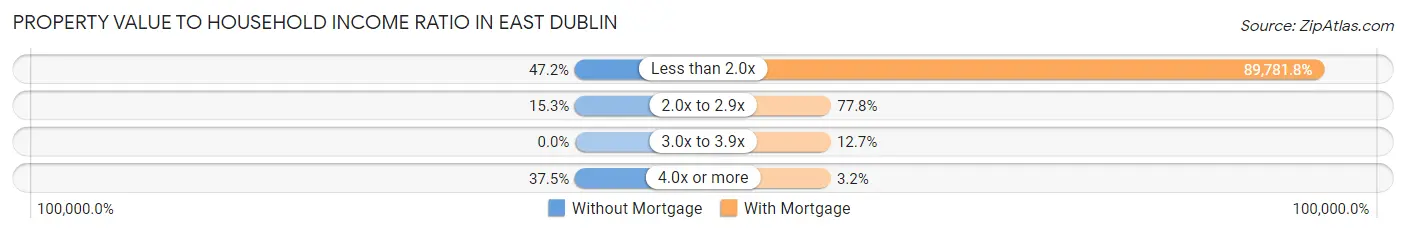
| Value-to-Income Ratio | Without Mortgage | With Mortgage |
| Less than 2.0x | 83 (47.2%) | 113,125 (89,781.7%) |
| 2.0x to 2.9x | 27 (15.3%) | 98 (77.8%) |
| 3.0x to 3.9x | 0 (0.0%) | 16 (12.7%) |
| 4.0x or more | 66 (37.5%) | 4 (3.2%) |
| Total | 176 (100.0%) | 126 (100.0%) |
Real Estate Taxes by Mortgage Status in East Dublin
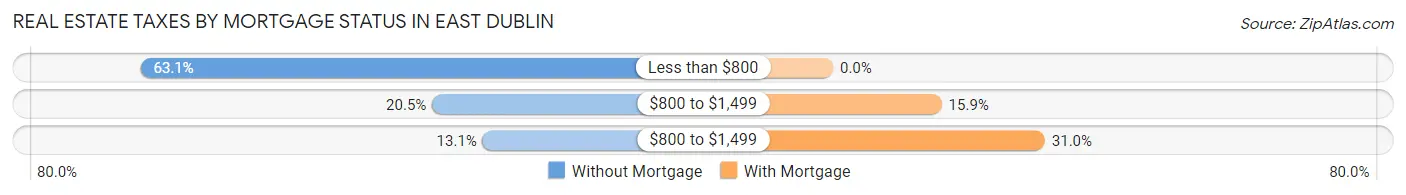
| Property Taxes | Without Mortgage | With Mortgage |
| Less than $800 | 111 (63.1%) | 0 (0.0%) |
| $800 to $1,499 | 36 (20.4%) | 20 (15.9%) |
| $800 to $1,499 | 23 (13.1%) | 39 (30.9%) |
| Total | 176 (100.0%) | 126 (100.0%) |
Health & Disability in East Dublin
Health Insurance Coverage by Age in East Dublin
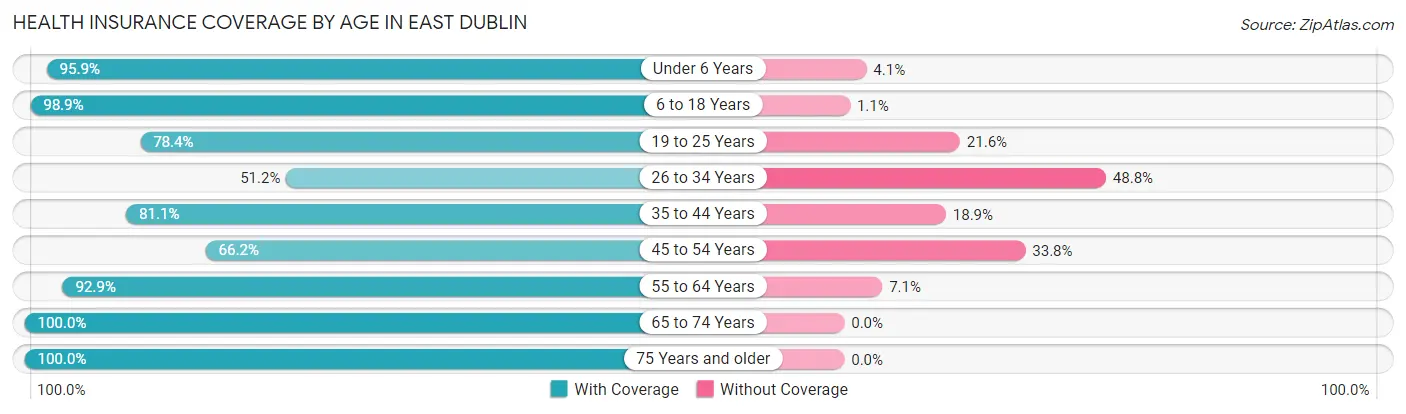
| Age Bracket | With Coverage | Without Coverage |
| Under 6 Years | 163 (95.9%) | 7 (4.1%) |
| 6 to 18 Years | 745 (98.9%) | 8 (1.1%) |
| 19 to 25 Years | 302 (78.4%) | 83 (21.6%) |
| 26 to 34 Years | 211 (51.2%) | 201 (48.8%) |
| 35 to 44 Years | 368 (81.1%) | 86 (18.9%) |
| 45 to 54 Years | 202 (66.2%) | 103 (33.8%) |
| 55 to 64 Years | 92 (92.9%) | 7 (7.1%) |
| 65 to 74 Years | 144 (100.0%) | 0 (0.0%) |
| 75 Years and older | 167 (100.0%) | 0 (0.0%) |
| Total | 2,394 (82.9%) | 495 (17.1%) |
Health Insurance Coverage by Citizenship Status in East Dublin
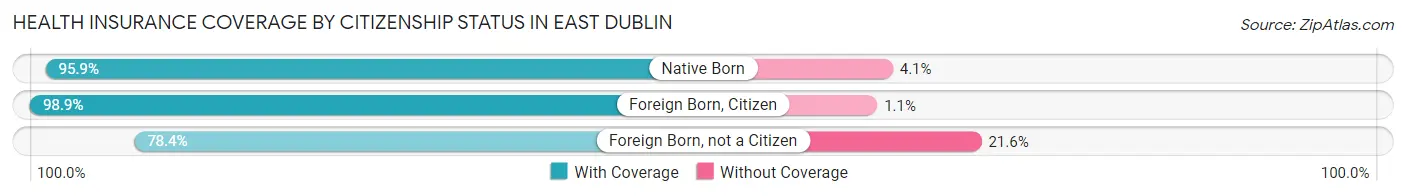
| Citizenship Status | With Coverage | Without Coverage |
| Native Born | 163 (95.9%) | 7 (4.1%) |
| Foreign Born, Citizen | 745 (98.9%) | 8 (1.1%) |
| Foreign Born, not a Citizen | 302 (78.4%) | 83 (21.6%) |
Health Insurance Coverage by Household Income in East Dublin
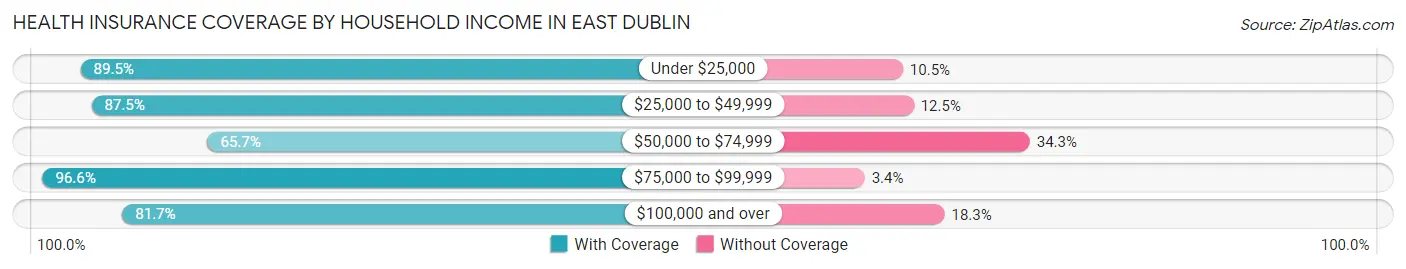
| Household Income | With Coverage | Without Coverage |
| Under $25,000 | 630 (89.5%) | 74 (10.5%) |
| $25,000 to $49,999 | 265 (87.5%) | 38 (12.5%) |
| $50,000 to $74,999 | 487 (65.7%) | 254 (34.3%) |
| $75,000 to $99,999 | 517 (96.6%) | 18 (3.4%) |
| $100,000 and over | 495 (81.7%) | 111 (18.3%) |
Public vs Private Health Insurance Coverage by Age in East Dublin
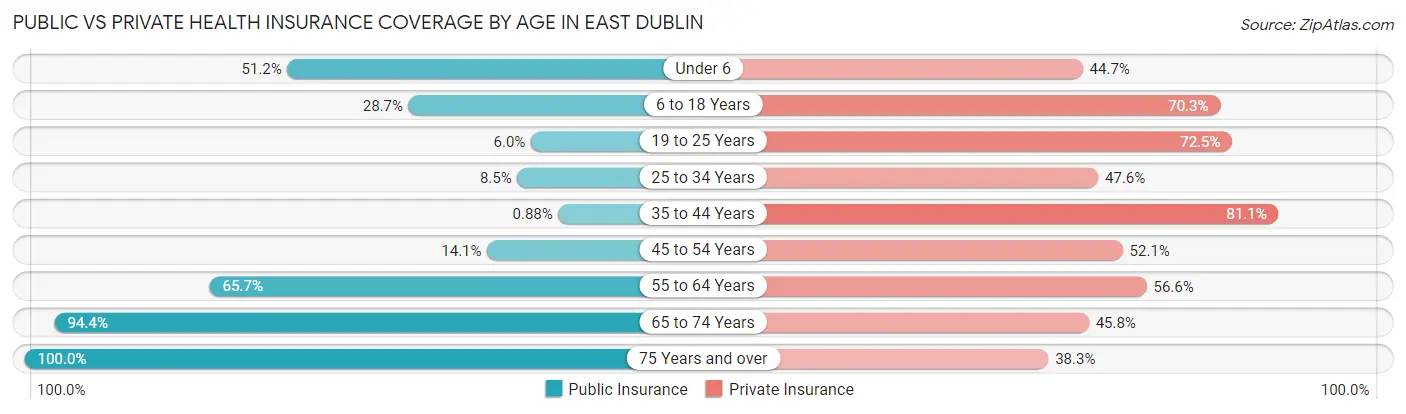
| Age Bracket | Public Insurance | Private Insurance |
| Under 6 | 87 (51.2%) | 76 (44.7%) |
| 6 to 18 Years | 216 (28.7%) | 529 (70.3%) |
| 19 to 25 Years | 23 (6.0%) | 279 (72.5%) |
| 25 to 34 Years | 35 (8.5%) | 196 (47.6%) |
| 35 to 44 Years | 4 (0.9%) | 368 (81.1%) |
| 45 to 54 Years | 43 (14.1%) | 159 (52.1%) |
| 55 to 64 Years | 65 (65.7%) | 56 (56.6%) |
| 65 to 74 Years | 136 (94.4%) | 66 (45.8%) |
| 75 Years and over | 167 (100.0%) | 64 (38.3%) |
| Total | 776 (26.9%) | 1,793 (62.1%) |
Disability Status by Sex by Age in East Dublin
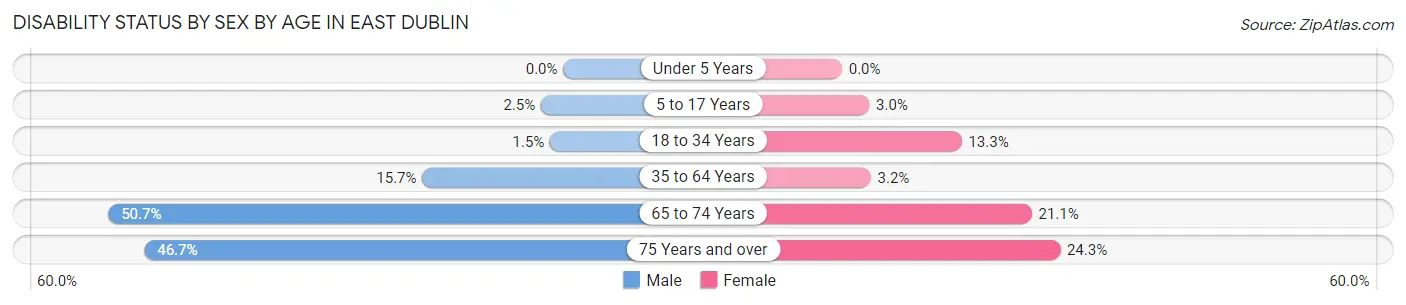
| Age Bracket | Male | Female |
| Under 5 Years | 0 (0.0%) | 0 (0.0%) |
| 5 to 17 Years | 12 (2.5%) | 7 (3.0%) |
| 18 to 34 Years | 6 (1.5%) | 58 (13.3%) |
| 35 to 64 Years | 76 (15.7%) | 12 (3.2%) |
| 65 to 74 Years | 37 (50.7%) | 15 (21.1%) |
| 75 Years and over | 28 (46.7%) | 26 (24.3%) |
Disability Class by Sex by Age in East Dublin
Disability Class: Hearing Difficulty
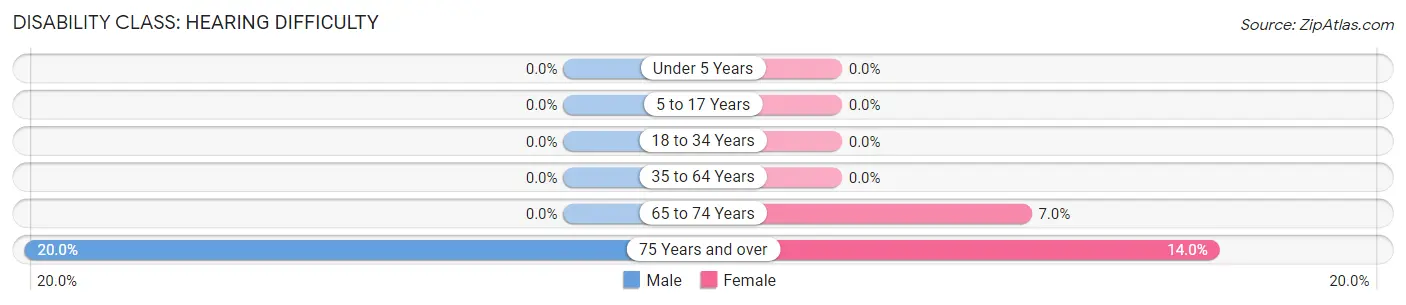
| Age Bracket | Male | Female |
| Under 5 Years | 0 (0.0%) | 0 (0.0%) |
| 5 to 17 Years | 0 (0.0%) | 0 (0.0%) |
| 18 to 34 Years | 0 (0.0%) | 0 (0.0%) |
| 35 to 64 Years | 0 (0.0%) | 0 (0.0%) |
| 65 to 74 Years | 0 (0.0%) | 5 (7.0%) |
| 75 Years and over | 12 (20.0%) | 15 (14.0%) |
Disability Class: Vision Difficulty
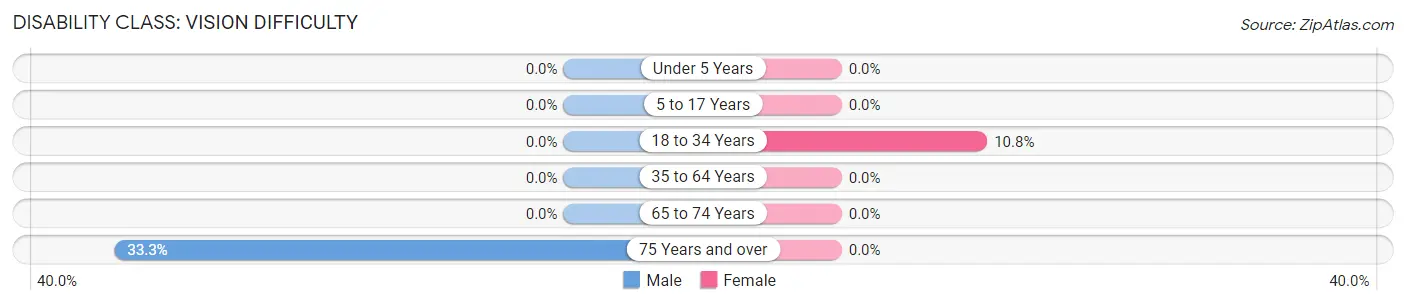
| Age Bracket | Male | Female |
| Under 5 Years | 0 (0.0%) | 0 (0.0%) |
| 5 to 17 Years | 0 (0.0%) | 0 (0.0%) |
| 18 to 34 Years | 0 (0.0%) | 47 (10.8%) |
| 35 to 64 Years | 0 (0.0%) | 0 (0.0%) |
| 65 to 74 Years | 0 (0.0%) | 0 (0.0%) |
| 75 Years and over | 20 (33.3%) | 0 (0.0%) |
Disability Class: Cognitive Difficulty
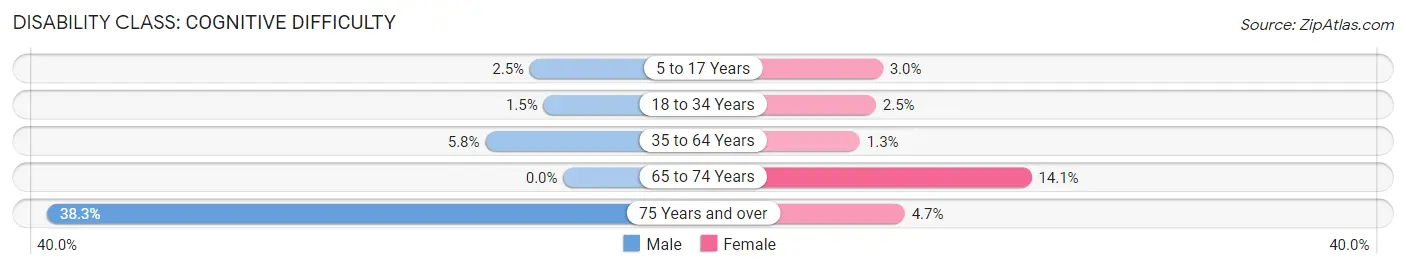
| Age Bracket | Male | Female |
| 5 to 17 Years | 12 (2.5%) | 7 (3.0%) |
| 18 to 34 Years | 6 (1.5%) | 11 (2.5%) |
| 35 to 64 Years | 28 (5.8%) | 5 (1.3%) |
| 65 to 74 Years | 0 (0.0%) | 10 (14.1%) |
| 75 Years and over | 23 (38.3%) | 5 (4.7%) |
Disability Class: Ambulatory Difficulty
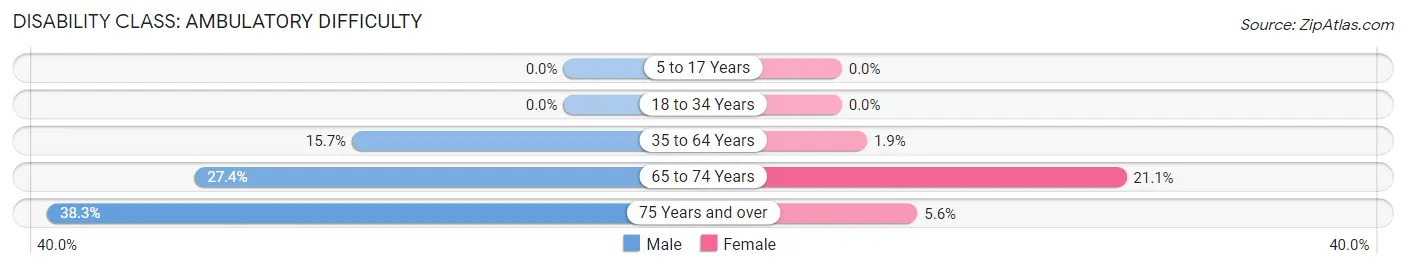
| Age Bracket | Male | Female |
| 5 to 17 Years | 0 (0.0%) | 0 (0.0%) |
| 18 to 34 Years | 0 (0.0%) | 0 (0.0%) |
| 35 to 64 Years | 76 (15.7%) | 7 (1.9%) |
| 65 to 74 Years | 20 (27.4%) | 15 (21.1%) |
| 75 Years and over | 23 (38.3%) | 6 (5.6%) |
Disability Class: Self-Care Difficulty
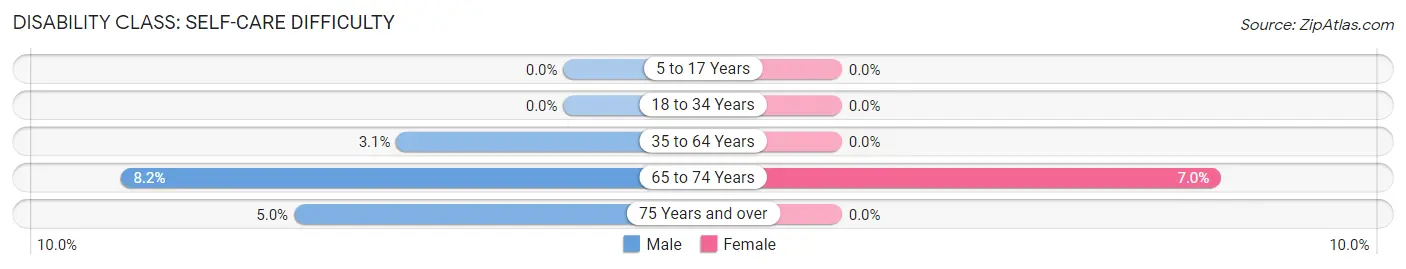
| Age Bracket | Male | Female |
| 5 to 17 Years | 0 (0.0%) | 0 (0.0%) |
| 18 to 34 Years | 0 (0.0%) | 0 (0.0%) |
| 35 to 64 Years | 15 (3.1%) | 0 (0.0%) |
| 65 to 74 Years | 6 (8.2%) | 5 (7.0%) |
| 75 Years and over | 3 (5.0%) | 0 (0.0%) |
Technology Access in East Dublin
Computing Device Access in East Dublin
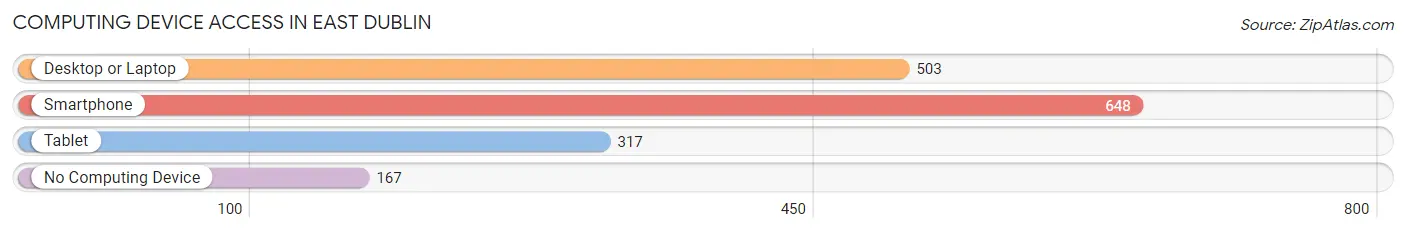
| Device Type | # Households | % Households |
| Desktop or Laptop | 503 | 58.8% |
| Smartphone | 648 | 75.8% |
| Tablet | 317 | 37.1% |
| No Computing Device | 167 | 19.5% |
| Total | 855 | 100.0% |
Internet Access in East Dublin
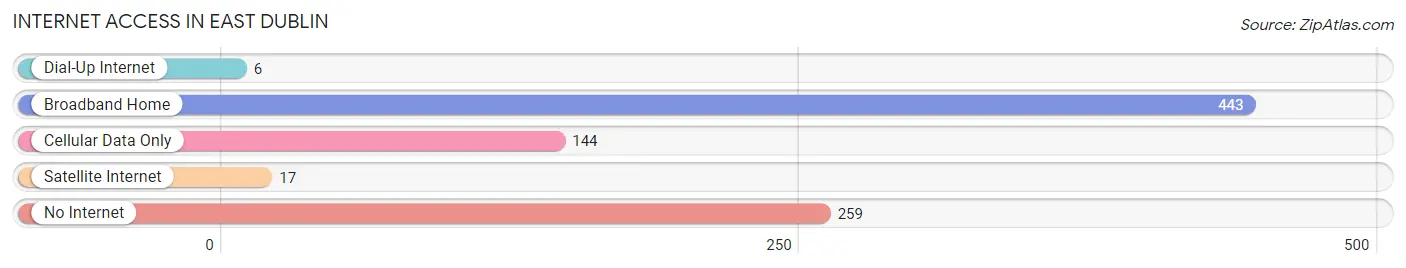
| Internet Type | # Households | % Households |
| Dial-Up Internet | 6 | 0.7% |
| Broadband Home | 443 | 51.8% |
| Cellular Data Only | 144 | 16.8% |
| Satellite Internet | 17 | 2.0% |
| No Internet | 259 | 30.3% |
| Total | 855 | 100.0% |
East Dublin Summary
Dublin, Georgia is a city located in Laurens County in the east-central part of the state. It is the county seat of Laurens County and is located approximately 90 miles southeast of Atlanta. The city is situated along the Oconee River and is part of the larger Macon-Warner Robins metropolitan area. Dublin is a small city with a population of approximately 16,000 people as of the 2010 census.
History
The area that is now Dublin was first settled in the early 19th century by settlers from the Carolinas. The city was officially founded in 1812 and was named after Dublin, Ireland. The city was incorporated in 1812 and was designated as the county seat of Laurens County in 1818.
During the Civil War, Dublin was the site of a major battle between Union and Confederate forces in 1864. The Battle of Dublin was a decisive victory for the Union forces and helped to secure the region for the Union.
In the late 19th century, Dublin became an important center for the timber industry. The city was also home to several cotton mills and other industries.
Geography
Dublin is located in east-central Georgia at the intersection of Interstate 16 and U.S. Route 441. The city is situated along the Oconee River and is part of the larger Macon-Warner Robins metropolitan area. The city has a total area of 10.3 square miles, all of which is land.
Economy
Dublin’s economy is largely based on the service industry. The city is home to several hospitals, medical centers, and other health care facilities. The city is also home to several retail stores, restaurants, and other businesses.
The city is also home to several manufacturing companies, including a paper mill, a furniture manufacturer, and a plastics manufacturer. The city is also home to several agricultural businesses, including a poultry processing plant and a cotton gin.
Demographics
As of the 2010 census, Dublin had a population of 16,201 people. The racial makeup of the city was 57.3% White, 37.2% African American, 0.4% Native American, 1.2% Asian, 0.1% Pacific Islander, 1.7% from other races, and 2.1% from two or more races. Hispanic or Latino of any race were 4.2% of the population.
The median income for a household in the city was $30,945, and the median income for a family was $37,945. The per capita income for the city was $17,845. About 19.2% of the population was below the poverty line.
Conclusion
Dublin, Georgia is a small city located in east-central Georgia. The city has a long history, dating back to the early 19th century. The city is situated along the Oconee River and is part of the larger Macon-Warner Robins metropolitan area. The city’s economy is largely based on the service industry, with several hospitals, medical centers, and other health care facilities. The city also has several manufacturing companies, agricultural businesses, and retail stores. As of the 2010 census, the city had a population of 16,201 people. The median income for a household in the city was $30,945, and the median income for a family was $37,945.
Common Questions
What is Per Capita Income in East Dublin?
Per Capita income in East Dublin is $20,165.
What is the Median Family Income in East Dublin?
Median Family Income in East Dublin is $54,912.
What is the Median Household income in East Dublin?
Median Household Income in East Dublin is $54,601.
What is Income or Wage Gap in East Dublin?
Income or Wage Gap in East Dublin is 3.0%.
Women in East Dublin earn 97.0 cents for every dollar earned by a man.
What is Inequality or Gini Index in East Dublin?
Inequality or Gini Index in East Dublin is 0.42.
What is the Total Population of East Dublin?
Total Population of East Dublin is 2,889.
What is the Total Male Population of East Dublin?
Total Male Population of East Dublin is 1,619.
What is the Total Female Population of East Dublin?
Total Female Population of East Dublin is 1,270.
What is the Ratio of Males per 100 Females in East Dublin?
There are 127.48 Males per 100 Females in East Dublin.
What is the Ratio of Females per 100 Males in East Dublin?
There are 78.44 Females per 100 Males in East Dublin.
What is the Median Population Age in East Dublin?
Median Population Age in East Dublin is 28.7 Years.
What is the Average Family Size in East Dublin
Average Family Size in East Dublin is 4.0 People.
What is the Average Household Size in East Dublin
Average Household Size in East Dublin is 3.4 People.
How Large is the Labor Force in East Dublin?
There are 1,433 People in the Labor Forcein in East Dublin.
What is the Percentage of People in the Labor Force in East Dublin?
69.7% of People are in the Labor Force in East Dublin.
What is the Unemployment Rate in East Dublin?
Unemployment Rate in East Dublin is 7.3%.