Toccoa, GA Map & Demographics
Toccoa Map
Toccoa Overview
$24,608
PER CAPITA INCOME
$57,675
AVG FAMILY INCOME
$49,860
AVG HOUSEHOLD INCOME
19.1%
WAGE / INCOME GAP [ % ]
80.9¢/ $1
WAGE / INCOME GAP [ $ ]
$7,818
FAMILY INCOME DEFICIT
0.43
INEQUALITY / GINI INDEX
9,055
TOTAL POPULATION
4,149
MALE POPULATION
4,906
FEMALE POPULATION
84.57
MALES / 100 FEMALES
118.25
FEMALES / 100 MALES
42.3
MEDIAN AGE
3.1
AVG FAMILY SIZE
2.5
AVG HOUSEHOLD SIZE
4,264
LABOR FORCE [ PEOPLE ]
57.6%
PERCENT IN LABOR FORCE
10.3%
UNEMPLOYMENT RATE
Toccoa Zip Codes
Toccoa Area Codes
Income in Toccoa
Income Overview in Toccoa
Per Capita Income in Toccoa is $24,608, while median incomes of families and households are $57,675 and $49,860 respectively.
| Characteristic | Number | Measure |
| Per Capita Income | 9,055 | $24,608 |
| Median Family Income | 2,343 | $57,675 |
| Mean Family Income | 2,343 | $71,004 |
| Median Household Income | 3,569 | $49,860 |
| Mean Household Income | 3,569 | $60,057 |
| Income Deficit | 2,343 | $7,818 |
| Wage / Income Gap (%) | 9,055 | 19.07% |
| Wage / Income Gap ($) | 9,055 | 80.93¢ per $1 |
| Gini / Inequality Index | 9,055 | 0.43 |
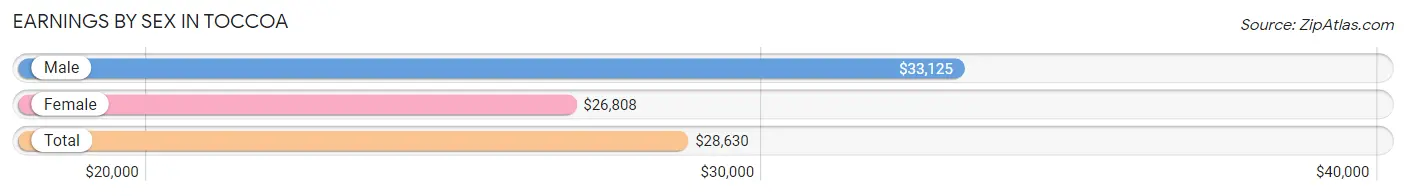
Earnings by Sex in Toccoa
Average Earnings in Toccoa are $28,630, $33,125 for men and $26,808 for women, a difference of 19.1%.
| Sex | Number | Average Earnings |
| Male | 2,252 (54.8%) | $33,125 |
| Female | 1,856 (45.2%) | $26,808 |
| Total | 4,108 (100.0%) | $28,630 |
Earnings by Sex by Income Bracket in Toccoa
The most common earnings brackets in Toccoa are $5,000 to $7,499 for men (271 | 12.0%) and $25,000 to $29,999 for women (301 | 16.2%).

| Income | Male | Female |
| $2,499 or less | 92 (4.1%) | 20 (1.1%) |
| $2,500 to $4,999 | 0 (0.0%) | 0 (0.0%) |
| $5,000 to $7,499 | 271 (12.0%) | 100 (5.4%) |
| $7,500 to $9,999 | 125 (5.6%) | 141 (7.6%) |
| $10,000 to $12,499 | 61 (2.7%) | 57 (3.1%) |
| $12,500 to $14,999 | 115 (5.1%) | 61 (3.3%) |
| $15,000 to $17,499 | 104 (4.6%) | 180 (9.7%) |
| $17,500 to $19,999 | 17 (0.7%) | 18 (1.0%) |
| $20,000 to $22,499 | 68 (3.0%) | 81 (4.4%) |
| $22,500 to $24,999 | 52 (2.3%) | 155 (8.4%) |
| $25,000 to $29,999 | 149 (6.6%) | 301 (16.2%) |
| $30,000 to $34,999 | 174 (7.7%) | 128 (6.9%) |
| $35,000 to $39,999 | 198 (8.8%) | 189 (10.2%) |
| $40,000 to $44,999 | 228 (10.1%) | 106 (5.7%) |
| $45,000 to $49,999 | 92 (4.1%) | 28 (1.5%) |
| $50,000 to $54,999 | 105 (4.7%) | 54 (2.9%) |
| $55,000 to $64,999 | 62 (2.8%) | 67 (3.6%) |
| $65,000 to $74,999 | 34 (1.5%) | 83 (4.5%) |
| $75,000 to $99,999 | 177 (7.9%) | 52 (2.8%) |
| $100,000+ | 128 (5.7%) | 35 (1.9%) |
| Total | 2,252 (100.0%) | 1,856 (100.0%) |
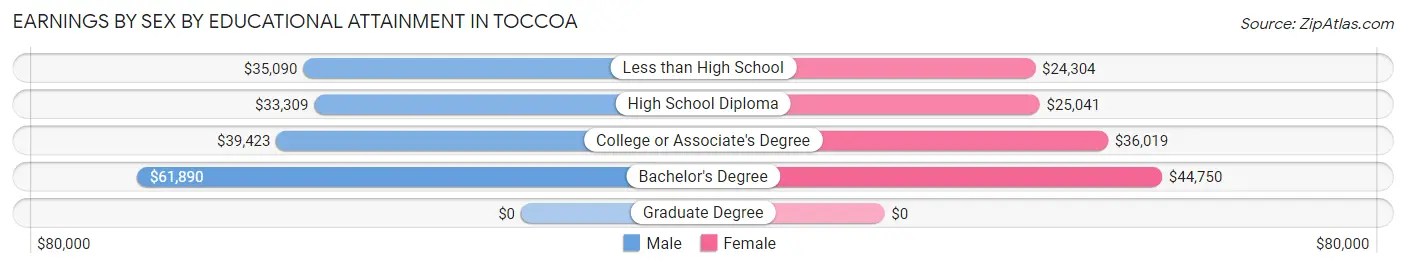
Earnings by Sex by Educational Attainment in Toccoa
Average earnings in Toccoa are $36,132 for men and $27,319 for women, a difference of 24.4%. Men with an educational attainment of bachelor's degree enjoy the highest average annual earnings of $61,890, while those with high school diploma education earn the least with $33,309. Women with an educational attainment of bachelor's degree earn the most with the average annual earnings of $44,750, while those with less than high school education have the smallest earnings of $24,304.
| Educational Attainment | Male Income | Female Income |
| Less than High School | $35,090 | $24,304 |
| High School Diploma | $33,309 | $25,041 |
| College or Associate's Degree | $39,423 | $36,019 |
| Bachelor's Degree | $61,890 | $44,750 |
| Graduate Degree | - | - |
| Total | $36,132 | $27,319 |
Family Income in Toccoa
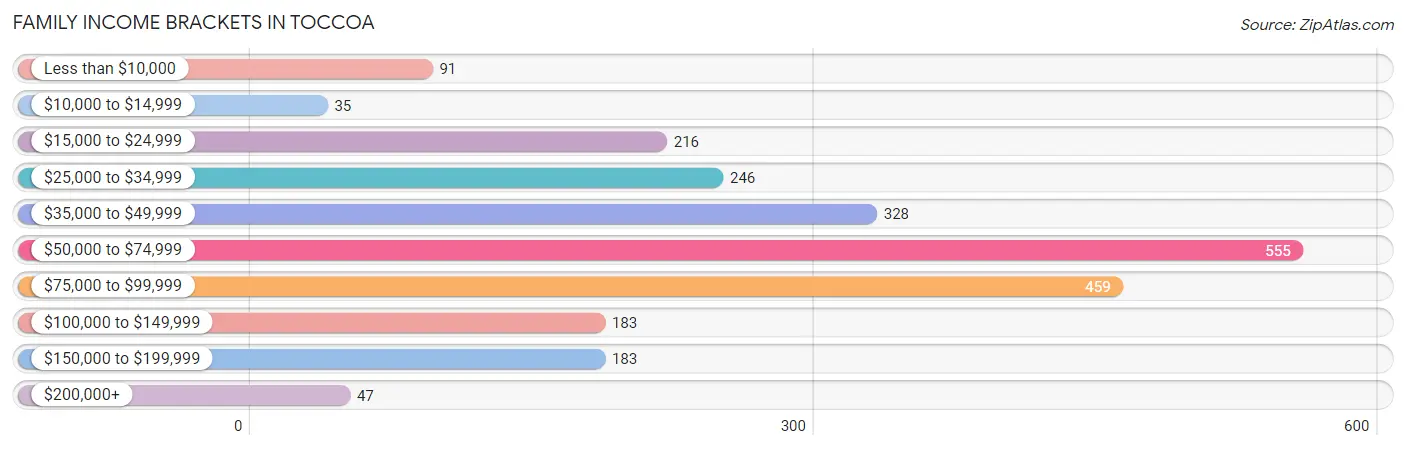
Family Income Brackets in Toccoa
According to the Toccoa family income data, there are 555 families falling into the $50,000 to $74,999 income range, which is the most common income bracket and makes up 23.7% of all families. Conversely, the $10,000 to $14,999 income bracket is the least frequent group with only 35 families (1.5%) belonging to this category.
| Income Bracket | # Families | % Families |
| Less than $10,000 | 91 | 3.9% |
| $10,000 to $14,999 | 35 | 1.5% |
| $15,000 to $24,999 | 216 | 9.2% |
| $25,000 to $34,999 | 246 | 10.5% |
| $35,000 to $49,999 | 328 | 14.0% |
| $50,000 to $74,999 | 555 | 23.7% |
| $75,000 to $99,999 | 459 | 19.6% |
| $100,000 to $149,999 | 183 | 7.8% |
| $150,000 to $199,999 | 183 | 7.8% |
| $200,000+ | 47 | 2.0% |
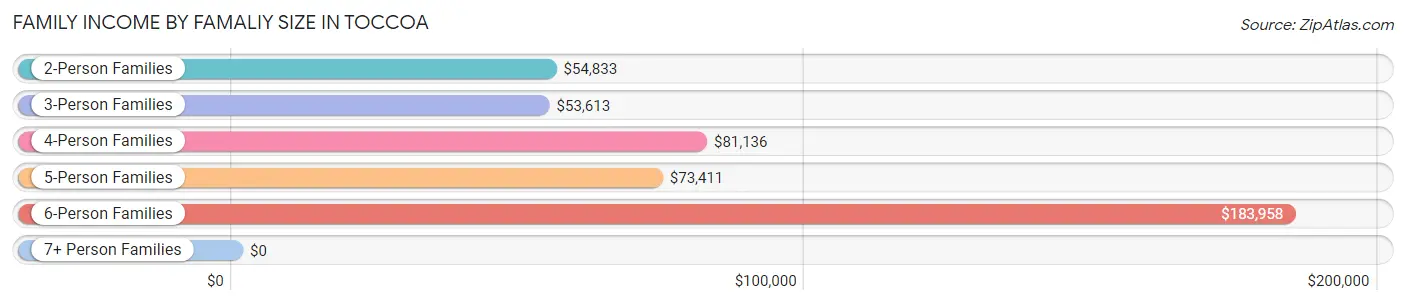
Family Income by Famaliy Size in Toccoa
6-person families (44 | 1.9%) account for the highest median family income in Toccoa with $183,958 per family, while 6-person families (44 | 1.9%) have the highest median income of $30,660 per family member.
| Income Bracket | # Families | Median Income |
| 2-Person Families | 1,310 (55.9%) | $54,833 |
| 3-Person Families | 597 (25.5%) | $53,613 |
| 4-Person Families | 236 (10.1%) | $81,136 |
| 5-Person Families | 145 (6.2%) | $73,411 |
| 6-Person Families | 44 (1.9%) | $183,958 |
| 7+ Person Families | 11 (0.5%) | $0 |
| Total | 2,343 (100.0%) | $57,675 |
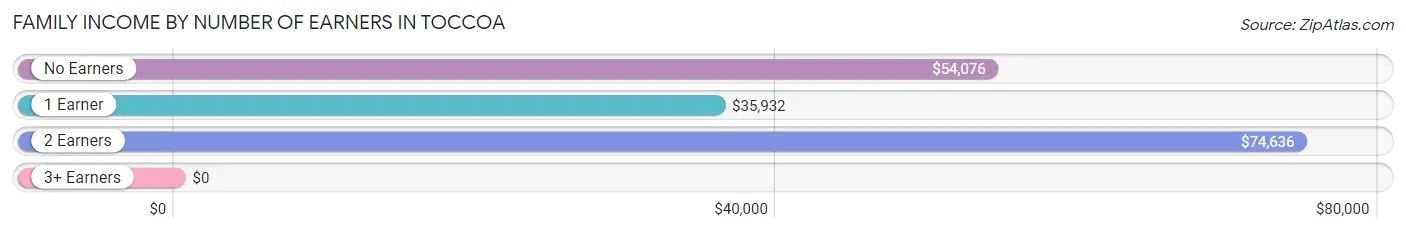
Family Income by Number of Earners in Toccoa
| Number of Earners | # Families | Median Income |
| No Earners | 509 (21.7%) | $54,076 |
| 1 Earner | 830 (35.4%) | $35,932 |
| 2 Earners | 871 (37.2%) | $74,636 |
| 3+ Earners | 133 (5.7%) | $0 |
| Total | 2,343 (100.0%) | $57,675 |
Household Income in Toccoa
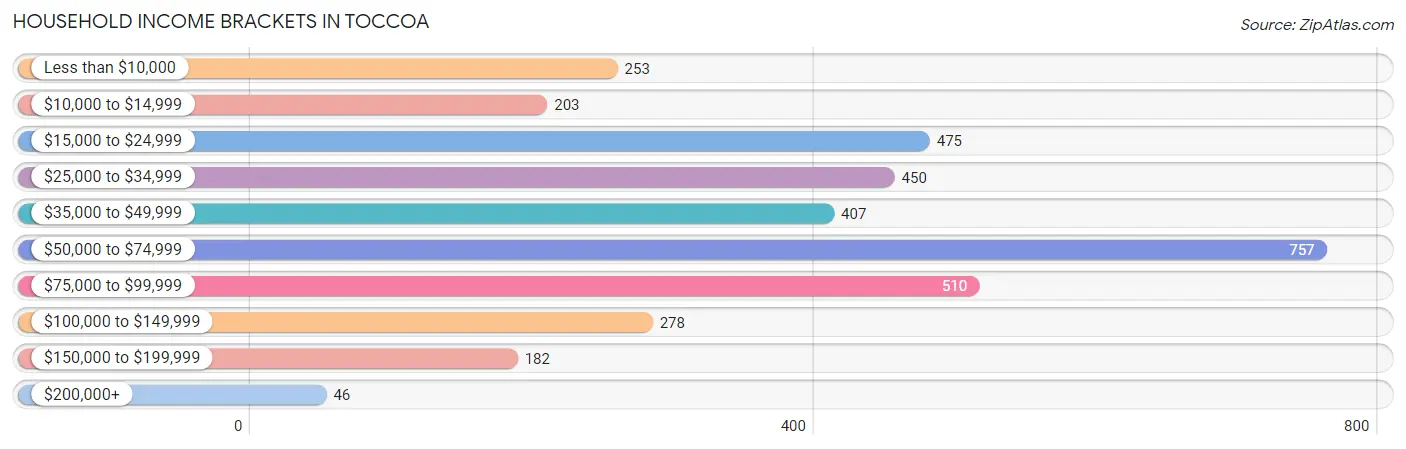
Household Income Brackets in Toccoa
With 757 households falling in the category, the $50,000 to $74,999 income range is the most frequent in Toccoa, accounting for 21.2% of all households. In contrast, only 46 households (1.3%) fall into the $200,000+ income bracket, making it the least populous group.
| Income Bracket | # Households | % Households |
| Less than $10,000 | 253 | 7.1% |
| $10,000 to $14,999 | 203 | 5.7% |
| $15,000 to $24,999 | 475 | 13.3% |
| $25,000 to $34,999 | 450 | 12.6% |
| $35,000 to $49,999 | 407 | 11.4% |
| $50,000 to $74,999 | 757 | 21.2% |
| $75,000 to $99,999 | 510 | 14.3% |
| $100,000 to $149,999 | 278 | 7.8% |
| $150,000 to $199,999 | 182 | 5.1% |
| $200,000+ | 46 | 1.3% |
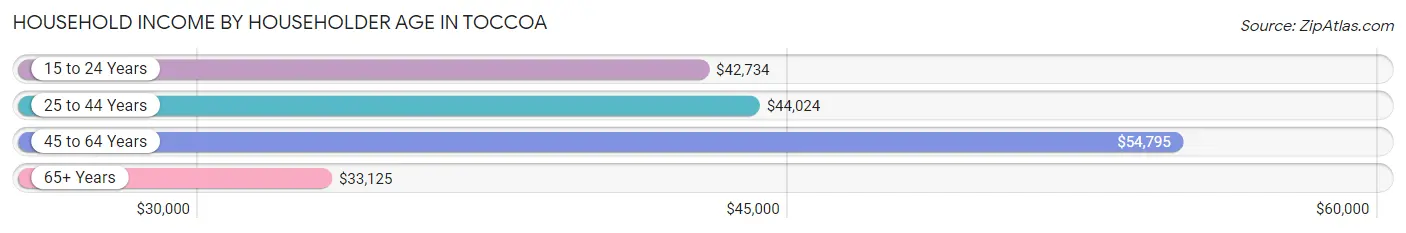
Household Income by Householder Age in Toccoa
The median household income in Toccoa is $49,860, with the highest median household income of $54,795 found in the 45 to 64 years age bracket for the primary householder. A total of 1,434 households (40.2%) fall into this category. Meanwhile, the 65+ years age bracket for the primary householder has the lowest median household income of $33,125, with 1,042 households (29.2%) in this group.
| Income Bracket | # Households | Median Income |
| 15 to 24 Years | 137 (3.8%) | $42,734 |
| 25 to 44 Years | 956 (26.8%) | $44,024 |
| 45 to 64 Years | 1,434 (40.2%) | $54,795 |
| 65+ Years | 1,042 (29.2%) | $33,125 |
| Total | 3,569 (100.0%) | $49,860 |
Poverty in Toccoa
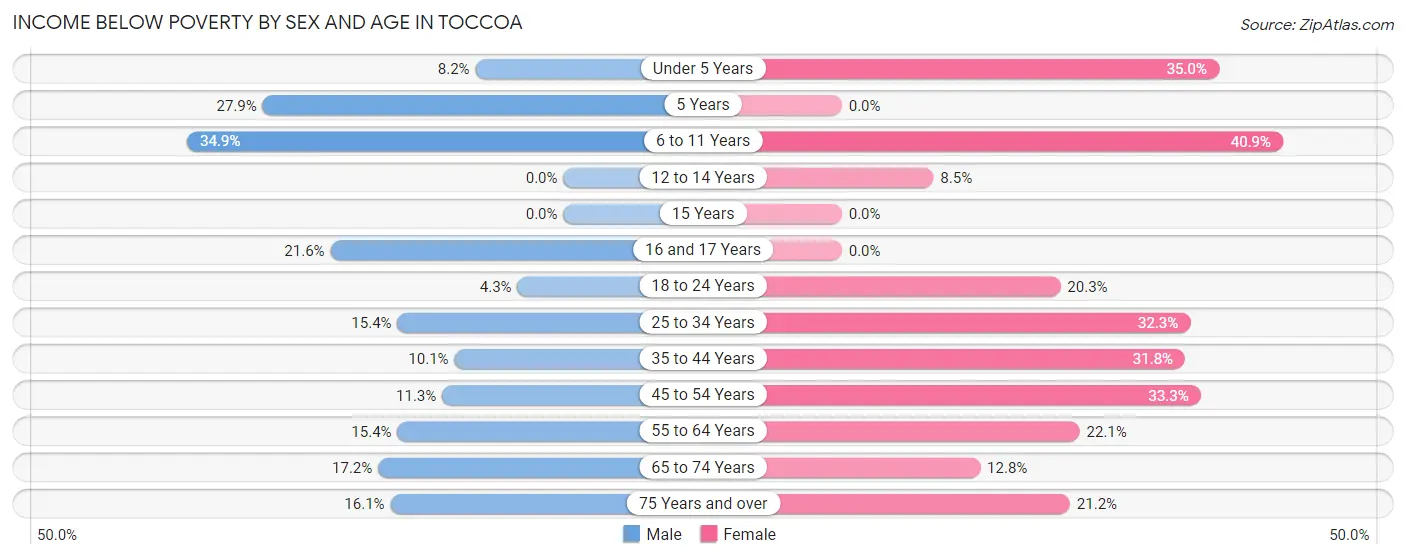
Income Below Poverty by Sex and Age in Toccoa
With 13.6% poverty level for males and 25.3% for females among the residents of Toccoa, 6 to 11 year old males and 6 to 11 year old females are the most vulnerable to poverty, with 103 males (34.9%) and 176 females (40.9%) in their respective age groups living below the poverty level.
| Age Bracket | Male | Female |
| Under 5 Years | 28 (8.2%) | 71 (35.0%) |
| 5 Years | 12 (27.9%) | 0 (0.0%) |
| 6 to 11 Years | 103 (34.9%) | 176 (40.9%) |
| 12 to 14 Years | 0 (0.0%) | 13 (8.5%) |
| 15 Years | 0 (0.0%) | 0 (0.0%) |
| 16 and 17 Years | 16 (21.6%) | 0 (0.0%) |
| 18 to 24 Years | 17 (4.3%) | 84 (20.3%) |
| 25 to 34 Years | 69 (15.4%) | 213 (32.3%) |
| 35 to 44 Years | 64 (10.1%) | 114 (31.8%) |
| 45 to 54 Years | 73 (11.3%) | 240 (33.3%) |
| 55 to 64 Years | 61 (15.4%) | 141 (22.1%) |
| 65 to 74 Years | 60 (17.2%) | 86 (12.8%) |
| 75 Years and over | 56 (16.1%) | 98 (21.2%) |
| Total | 559 (13.6%) | 1,236 (25.3%) |
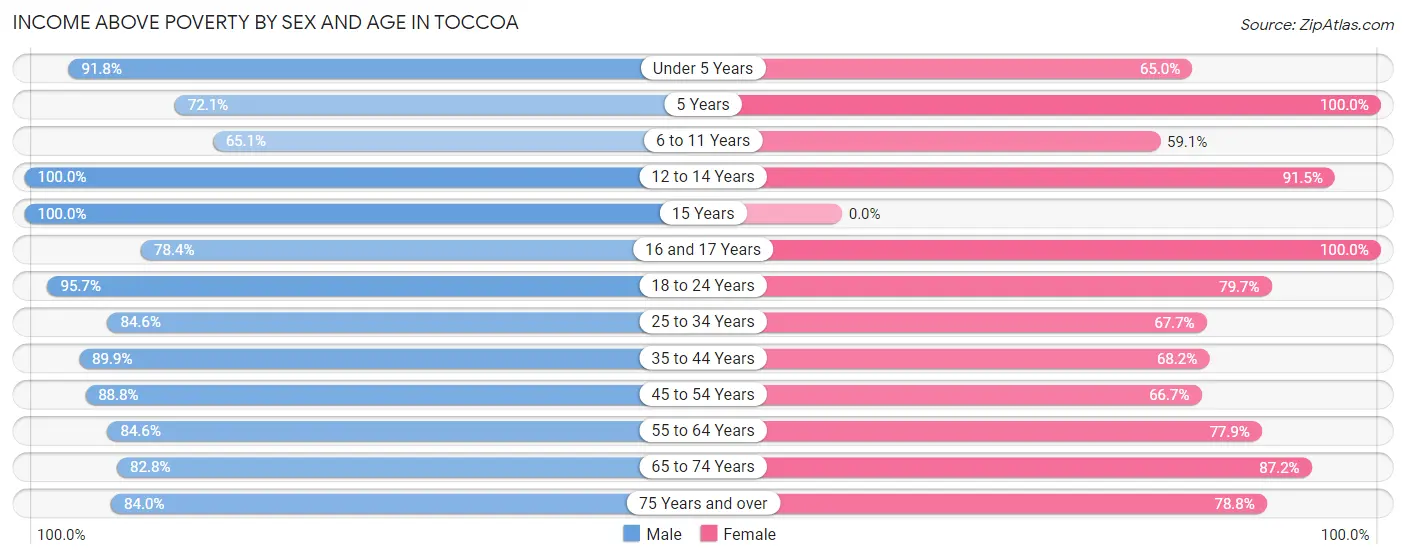
Income Above Poverty by Sex and Age in Toccoa
According to the poverty statistics in Toccoa, males aged 12 to 14 years and females aged 5 years are the age groups that are most secure financially, with 100.0% of males and 100.0% of females in these age groups living above the poverty line.
| Age Bracket | Male | Female |
| Under 5 Years | 315 (91.8%) | 132 (65.0%) |
| 5 Years | 31 (72.1%) | 38 (100.0%) |
| 6 to 11 Years | 192 (65.1%) | 254 (59.1%) |
| 12 to 14 Years | 97 (100.0%) | 140 (91.5%) |
| 15 Years | 51 (100.0%) | 0 (0.0%) |
| 16 and 17 Years | 58 (78.4%) | 148 (100.0%) |
| 18 to 24 Years | 382 (95.7%) | 330 (79.7%) |
| 25 to 34 Years | 379 (84.6%) | 446 (67.7%) |
| 35 to 44 Years | 569 (89.9%) | 244 (68.2%) |
| 45 to 54 Years | 576 (88.7%) | 481 (66.7%) |
| 55 to 64 Years | 335 (84.6%) | 498 (77.9%) |
| 65 to 74 Years | 289 (82.8%) | 584 (87.2%) |
| 75 Years and over | 293 (84.0%) | 365 (78.8%) |
| Total | 3,567 (86.5%) | 3,660 (74.8%) |
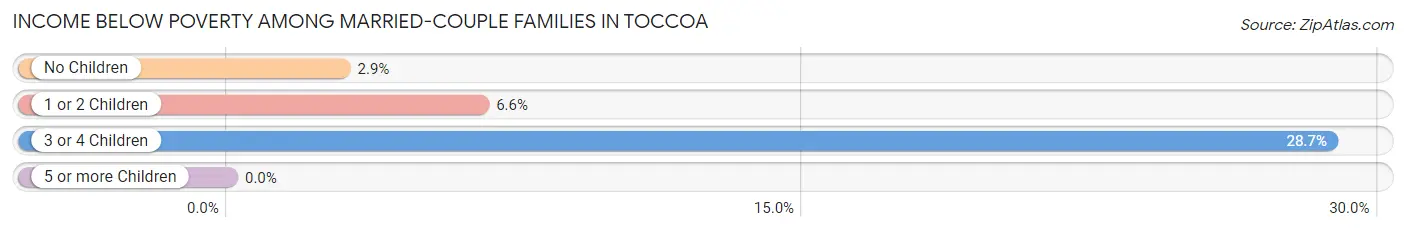
Income Below Poverty Among Married-Couple Families in Toccoa
The poverty statistics for married-couple families in Toccoa show that 5.6% or 76 of the total 1,351 families live below the poverty line. Families with 3 or 4 children have the highest poverty rate of 28.7%, comprising of 25 families. On the other hand, families with no children have the lowest poverty rate of 2.9%, which includes 26 families.
| Children | Above Poverty | Below Poverty |
| No Children | 857 (97.1%) | 26 (2.9%) |
| 1 or 2 Children | 356 (93.4%) | 25 (6.6%) |
| 3 or 4 Children | 62 (71.3%) | 25 (28.7%) |
| 5 or more Children | 0 (0.0%) | 0 (0.0%) |
| Total | 1,275 (94.4%) | 76 (5.6%) |
Income Below Poverty Among Single-Parent Households in Toccoa

| Children | Single Father | Single Mother |
| No Children | 0 (0.0%) | 26 (7.9%) |
| 1 or 2 Children | 0 (0.0%) | 215 (58.1%) |
| 3 or 4 Children | 0 (0.0%) | 9 (19.2%) |
| 5 or more Children | 0 (0.0%) | 0 (0.0%) |
| Total | 0 (0.0%) | 250 (33.6%) |
Income Below Poverty Among Married-Couple vs Single-Parent Households in Toccoa
The poverty data for Toccoa shows that 76 of the married-couple family households (5.6%) and 250 of the single-parent households (25.2%) are living below the poverty level. Within the married-couple family households, those with 3 or 4 children have the highest poverty rate, with 25 households (28.7%) falling below the poverty line. Among the single-parent households, those with 1 or 2 children have the highest poverty rate, with 215 household (44.0%) living below poverty.

| Children | Married-Couple Families | Single-Parent Households |
| No Children | 26 (2.9%) | 26 (6.3%) |
| 1 or 2 Children | 25 (6.6%) | 215 (44.0%) |
| 3 or 4 Children | 25 (28.7%) | 9 (10.2%) |
| 5 or more Children | 0 (0.0%) | 0 (0.0%) |
| Total | 76 (5.6%) | 250 (25.2%) |
Race in Toccoa
The most populous races in Toccoa are White / Caucasian (6,656 | 73.5%), Black / African American (1,734 | 19.2%), and Two or more Races (399 | 4.4%).

| Race | # Population | % Population |
| Asian | 202 | 2.2% |
| Black / African American | 1,734 | 19.2% |
| Hawaiian / Pacific | 38 | 0.4% |
| Hispanic or Latino | 65 | 0.7% |
| Native / Alaskan | 0 | 0.0% |
| White / Caucasian | 6,656 | 73.5% |
| Two or more Races | 399 | 4.4% |
| Some other Race | 26 | 0.3% |
| Total | 9,055 | 100.0% |
Ancestry in Toccoa
The most populous ancestries reported in Toccoa are English (1,525 | 16.8%), American (1,349 | 14.9%), Irish (968 | 10.7%), German (854 | 9.4%), and European (190 | 2.1%), together accounting for 54.0% of all Toccoa residents.

| Ancestry | # Population | % Population |
| African | 89 | 1.0% |
| American | 1,349 | 14.9% |
| Blackfeet | 32 | 0.4% |
| British | 16 | 0.2% |
| Cherokee | 25 | 0.3% |
| Dutch | 71 | 0.8% |
| English | 1,525 | 16.8% |
| European | 190 | 2.1% |
| French | 59 | 0.6% |
| French Canadian | 92 | 1.0% |
| German | 854 | 9.4% |
| Greek | 81 | 0.9% |
| Hungarian | 18 | 0.2% |
| Irish | 968 | 10.7% |
| Italian | 121 | 1.3% |
| Korean | 21 | 0.2% |
| Mexican | 26 | 0.3% |
| Norwegian | 52 | 0.6% |
| Pennsylvania German | 9 | 0.1% |
| Polish | 40 | 0.4% |
| Russian | 23 | 0.3% |
| Samoan | 38 | 0.4% |
| Scotch-Irish | 155 | 1.7% |
| Scottish | 73 | 0.8% |
| Spanish | 39 | 0.4% |
| Subsaharan African | 89 | 1.0% |
| Swedish | 10 | 0.1% |
| Swiss | 28 | 0.3% |
| Thai | 181 | 2.0% |
| Turkish | 44 | 0.5% |
| Ukrainian | 13 | 0.1% |
| Welsh | 64 | 0.7% | View All 32 Rows |
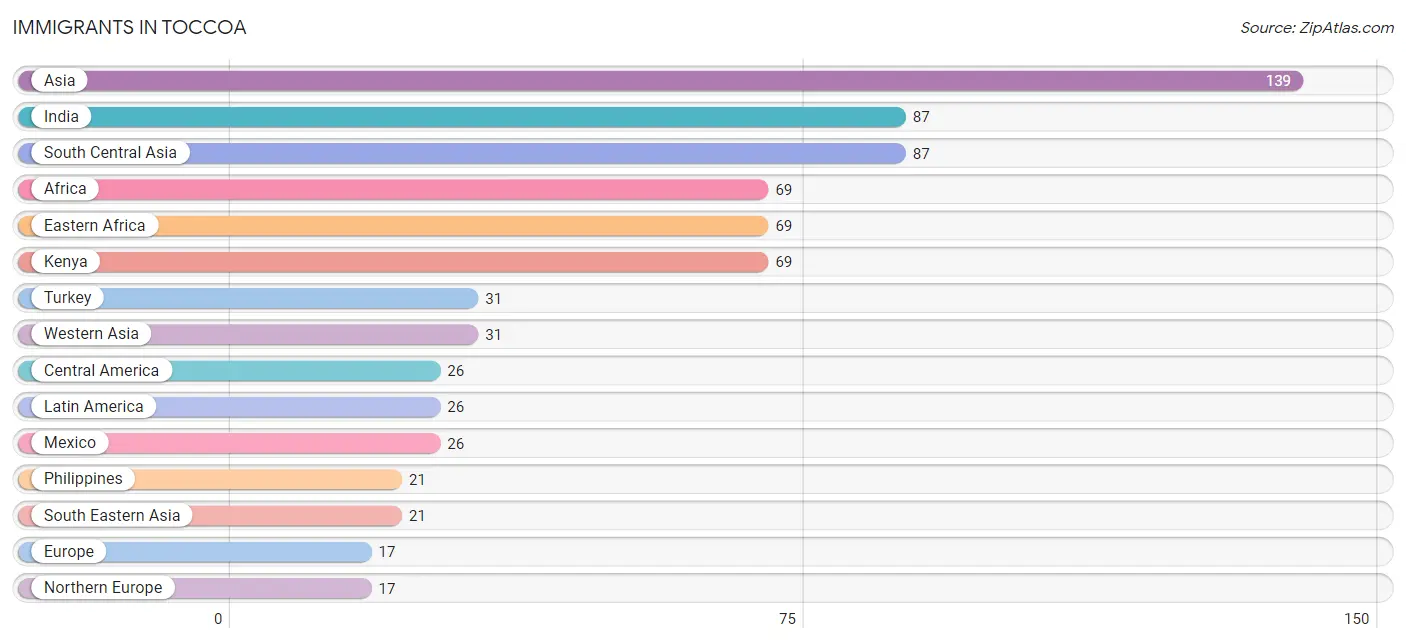
Immigrants in Toccoa
The most numerous immigrant groups reported in Toccoa came from Asia (139 | 1.5%), India (87 | 1.0%), South Central Asia (87 | 1.0%), Africa (69 | 0.8%), and Eastern Africa (69 | 0.8%), together accounting for 5.0% of all Toccoa residents.
| Immigration Origin | # Population | % Population |
| Africa | 69 | 0.8% |
| Asia | 139 | 1.5% |
| Central America | 26 | 0.3% |
| Eastern Africa | 69 | 0.8% |
| Europe | 17 | 0.2% |
| India | 87 | 1.0% |
| Kenya | 69 | 0.8% |
| Latin America | 26 | 0.3% |
| Mexico | 26 | 0.3% |
| Northern Europe | 17 | 0.2% |
| Philippines | 21 | 0.2% |
| South Central Asia | 87 | 1.0% |
| South Eastern Asia | 21 | 0.2% |
| Turkey | 31 | 0.3% |
| Western Asia | 31 | 0.3% | View All 15 Rows |
Sex and Age in Toccoa
Sex and Age in Toccoa
The most populous age groups in Toccoa are 45 to 49 Years (403 | 9.7%) for men and 25 to 29 Years (408 | 8.3%) for women.
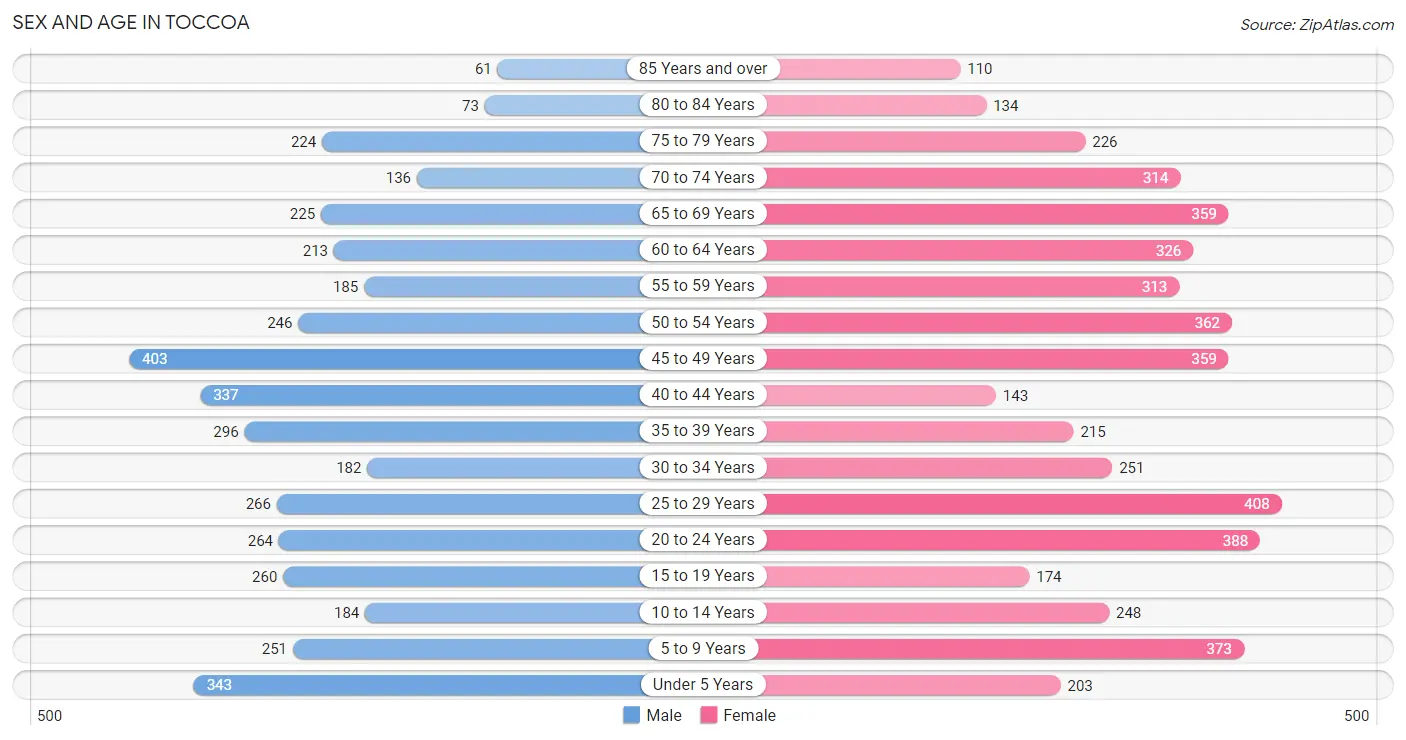
| Age Bracket | Male | Female |
| Under 5 Years | 343 (8.3%) | 203 (4.1%) |
| 5 to 9 Years | 251 (6.0%) | 373 (7.6%) |
| 10 to 14 Years | 184 (4.4%) | 248 (5.1%) |
| 15 to 19 Years | 260 (6.3%) | 174 (3.5%) |
| 20 to 24 Years | 264 (6.4%) | 388 (7.9%) |
| 25 to 29 Years | 266 (6.4%) | 408 (8.3%) |
| 30 to 34 Years | 182 (4.4%) | 251 (5.1%) |
| 35 to 39 Years | 296 (7.1%) | 215 (4.4%) |
| 40 to 44 Years | 337 (8.1%) | 143 (2.9%) |
| 45 to 49 Years | 403 (9.7%) | 359 (7.3%) |
| 50 to 54 Years | 246 (5.9%) | 362 (7.4%) |
| 55 to 59 Years | 185 (4.5%) | 313 (6.4%) |
| 60 to 64 Years | 213 (5.1%) | 326 (6.6%) |
| 65 to 69 Years | 225 (5.4%) | 359 (7.3%) |
| 70 to 74 Years | 136 (3.3%) | 314 (6.4%) |
| 75 to 79 Years | 224 (5.4%) | 226 (4.6%) |
| 80 to 84 Years | 73 (1.8%) | 134 (2.7%) |
| 85 Years and over | 61 (1.5%) | 110 (2.2%) |
| Total | 4,149 (100.0%) | 4,906 (100.0%) |
Families and Households in Toccoa
Median Family Size in Toccoa
The median family size in Toccoa is 3.06 persons per family, with single female/mother families (745 | 31.8%) accounting for the largest median family size of 3.08 persons per family. On the other hand, single male/father families (247 | 10.5%) represent the smallest median family size with 3.00 persons per family.

| Family Type | # Families | Family Size |
| Married-Couple | 1,351 (57.7%) | 3.05 |
| Single Male/Father | 247 (10.5%) | 3.00 |
| Single Female/Mother | 745 (31.8%) | 3.08 |
| Total Families | 2,343 (100.0%) | 3.06 |
Median Household Size in Toccoa
The median household size in Toccoa is 2.52 persons per household, with single male/father households (247 | 6.9%) accounting for the largest median household size of 3.76 persons per household. non-family households (1,226 | 34.4%) represent the smallest median household size with 1.25 persons per household.
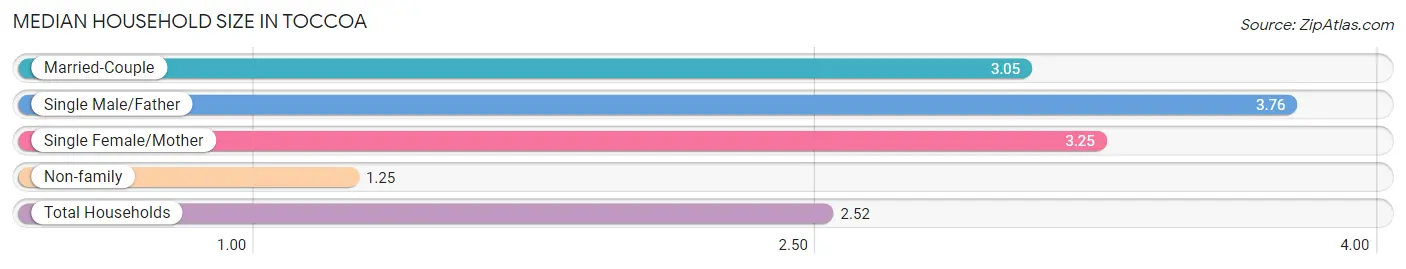
| Household Type | # Households | Household Size |
| Married-Couple | 1,351 (37.9%) | 3.05 |
| Single Male/Father | 247 (6.9%) | 3.76 |
| Single Female/Mother | 745 (20.9%) | 3.25 |
| Non-family | 1,226 (34.4%) | 1.25 |
| Total Households | 3,569 (100.0%) | 2.52 |
Household Size by Marriage Status in Toccoa
Out of a total of 3,569 households in Toccoa, 2,343 (65.6%) are family households, while 1,226 (34.4%) are nonfamily households. The most numerous type of family households are 2-person households, comprising 1,243, and the most common type of nonfamily households are 1-person households, comprising 1,010.
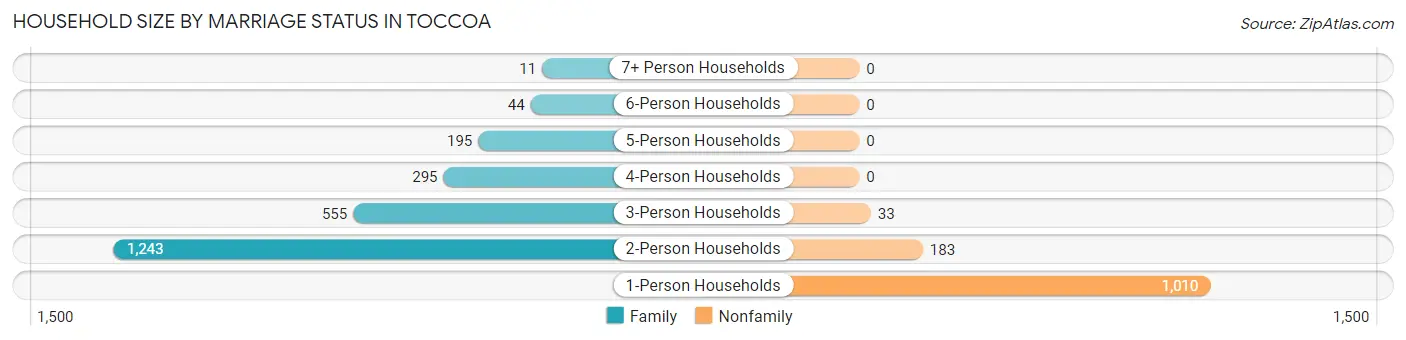
| Household Size | Family Households | Nonfamily Households |
| 1-Person Households | - | 1,010 (28.3%) |
| 2-Person Households | 1,243 (34.8%) | 183 (5.1%) |
| 3-Person Households | 555 (15.5%) | 33 (0.9%) |
| 4-Person Households | 295 (8.3%) | 0 (0.0%) |
| 5-Person Households | 195 (5.5%) | 0 (0.0%) |
| 6-Person Households | 44 (1.2%) | 0 (0.0%) |
| 7+ Person Households | 11 (0.3%) | 0 (0.0%) |
| Total | 2,343 (65.6%) | 1,226 (34.4%) |
Female Fertility in Toccoa
Fertility by Age in Toccoa
Average fertility rate in Toccoa is 38.0 births per 1,000 women. Women in the age bracket of 15 to 19 years have the highest fertility rate with 149.0 births per 1,000 women. Women in the age bracket of 15 to 19 years acount for 35.1% of all women with births.

| Age Bracket | Women with Births | Births / 1,000 Women |
| 15 to 19 years | 26 (35.1%) | 149.0 |
| 20 to 34 years | 23 (31.1%) | 22.0 |
| 35 to 50 years | 25 (33.8%) | 35.0 |
| Total | 74 (100.0%) | 38.0 |
Fertility by Age by Marriage Status in Toccoa
20.3% of women with births (74) in Toccoa are married. The highest percentage of unmarried women with births falls into 15 to 19 years age bracket with 100.0% of them unmarried at the time of birth, while the lowest percentage of unmarried women with births belong to 20 to 34 years age bracket with 34.8% of them unmarried.
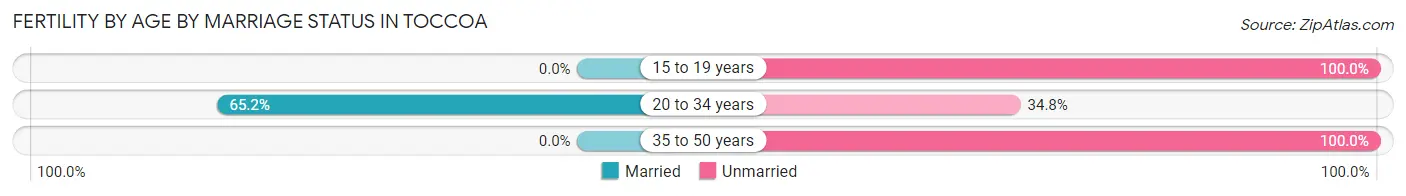
| Age Bracket | Married | Unmarried |
| 15 to 19 years | 0 (0.0%) | 26 (100.0%) |
| 20 to 34 years | 15 (65.2%) | 8 (34.8%) |
| 35 to 50 years | 0 (0.0%) | 25 (100.0%) |
| Total | 15 (20.3%) | 59 (79.7%) |
Fertility by Education in Toccoa
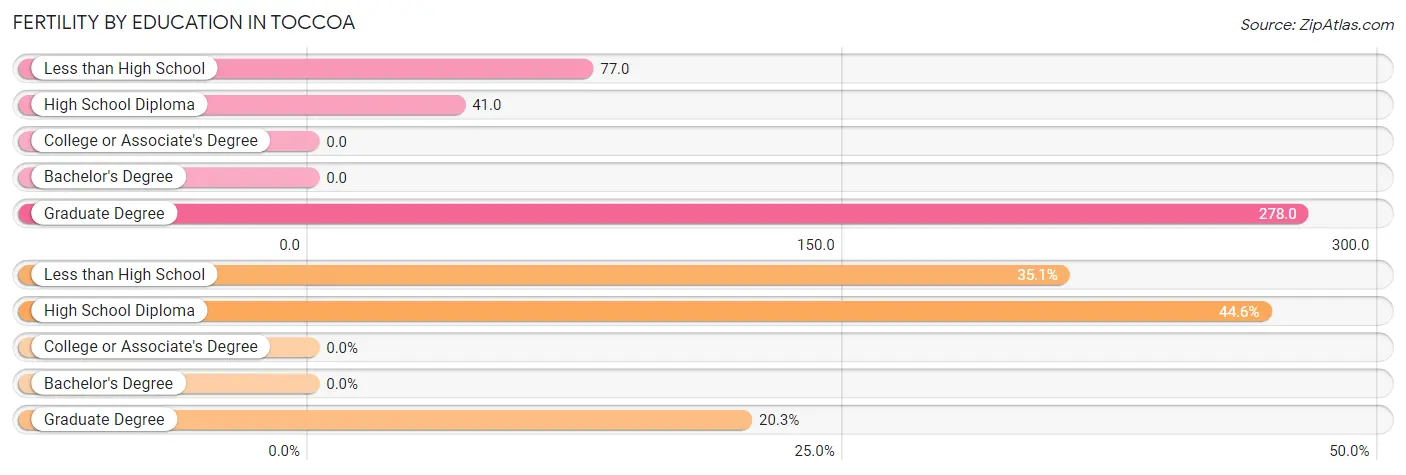
| Educational Attainment | Women with Births | Births / 1,000 Women |
| Less than High School | 26 (35.1%) | 77.0 |
| High School Diploma | 33 (44.6%) | 41.0 |
| College or Associate's Degree | 0 (0.0%) | 0.0 |
| Bachelor's Degree | 0 (0.0%) | 0.0 |
| Graduate Degree | 15 (20.3%) | 278.0 |
| Total | 74 (100.0%) | 38.0 |
Fertility by Education by Marriage Status in Toccoa
79.7% of women with births in Toccoa are unmarried. Women with the educational attainment of graduate degree are most likely to be married with 100.0% of them married at childbirth, while women with the educational attainment of less than high school are least likely to be married with 100.0% of them unmarried at childbirth.

| Educational Attainment | Married | Unmarried |
| Less than High School | 0 (0.0%) | 26 (100.0%) |
| High School Diploma | 0 (0.0%) | 33 (100.0%) |
| College or Associate's Degree | 0 (0.0%) | 0 (0.0%) |
| Bachelor's Degree | 0 (0.0%) | 0 (0.0%) |
| Graduate Degree | 15 (100.0%) | 0 (0.0%) |
| Total | 15 (20.3%) | 59 (79.7%) |
Employment Characteristics in Toccoa
Employment by Class of Employer in Toccoa
Among the 3,796 employed individuals in Toccoa, private company employees (2,919 | 76.9%), state government employees (255 | 6.7%), and self-employed (incorporated) (216 | 5.7%) make up the most common classes of employment.
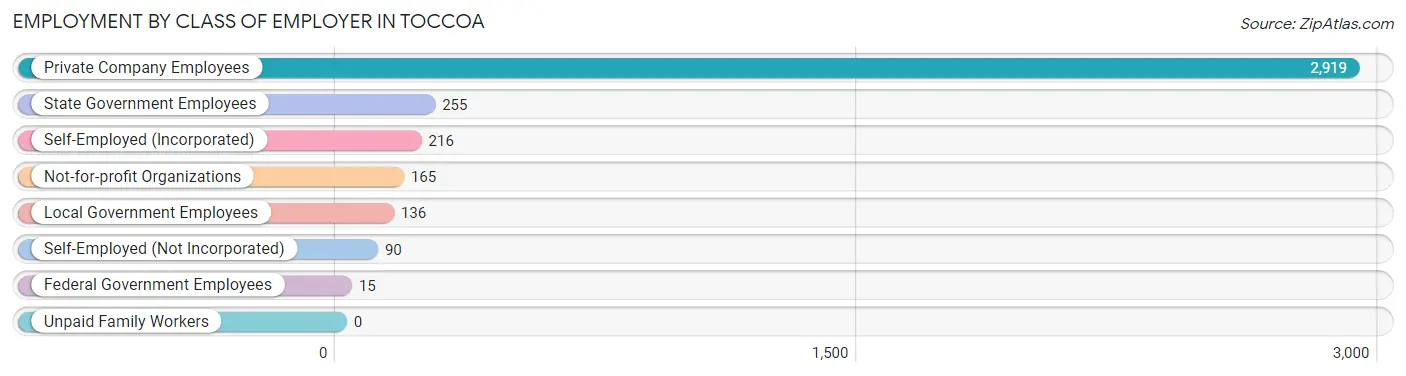
| Employer Class | # Employees | % Employees |
| Private Company Employees | 2,919 | 76.9% |
| Self-Employed (Incorporated) | 216 | 5.7% |
| Self-Employed (Not Incorporated) | 90 | 2.4% |
| Not-for-profit Organizations | 165 | 4.3% |
| Local Government Employees | 136 | 3.6% |
| State Government Employees | 255 | 6.7% |
| Federal Government Employees | 15 | 0.4% |
| Unpaid Family Workers | 0 | 0.0% |
| Total | 3,796 | 100.0% |
Employment Status by Age in Toccoa
According to the labor force statistics for Toccoa, out of the total population over 16 years of age (7,402), 57.6% or 4,264 individuals are in the labor force, with 10.3% or 439 of them unemployed. The age group with the highest labor force participation rate is 25 to 29 years, with 89.5% or 603 individuals in the labor force. Within the labor force, the 45 to 54 years age range has the highest percentage of unemployed individuals, with 19.0% or 217 of them being unemployed.

| Age Bracket | In Labor Force | Unemployed |
| 16 to 19 Years | 242 (63.2%) | 33 (13.6%) |
| 20 to 24 Years | 456 (69.9%) | 17 (3.7%) |
| 25 to 29 Years | 603 (89.5%) | 74 (12.3%) |
| 30 to 34 Years | 347 (80.1%) | 22 (6.3%) |
| 35 to 44 Years | 710 (71.6%) | 46 (6.5%) |
| 45 to 54 Years | 1,140 (83.2%) | 217 (19.0%) |
| 55 to 59 Years | 365 (73.3%) | 29 (7.9%) |
| 60 to 64 Years | 182 (33.8%) | 0 (0.0%) |
| 65 to 74 Years | 179 (17.3%) | 0 (0.0%) |
| 75 Years and over | 39 (4.7%) | 0 (0.0%) |
| Total | 4,264 (57.6%) | 439 (10.3%) |
Employment Status by Educational Attainment in Toccoa
According to labor force statistics for Toccoa, 74.3% of individuals (3,347) out of the total population between 25 and 64 years of age (4,505) are in the labor force, with 11.6% or 388 of them being unemployed. The group with the highest labor force participation rate are those with the educational attainment of high school diploma, with 76.4% or 1,546 individuals in the labor force. Within the labor force, individuals with high school diploma education have the highest percentage of unemployment, with 21.2% or 328 of them being unemployed.
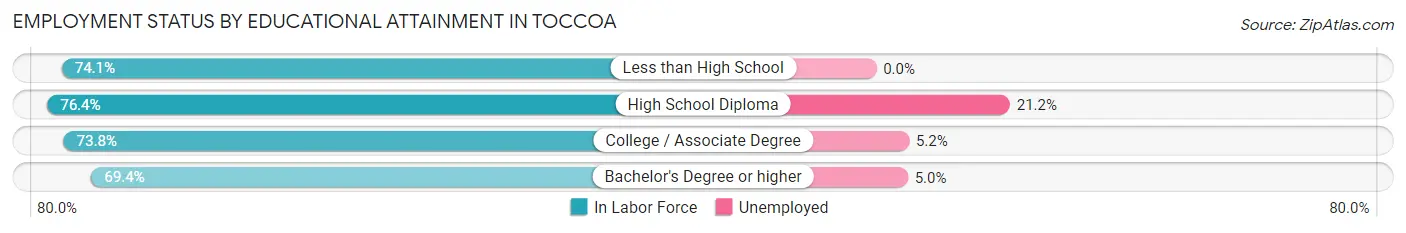
| Educational Attainment | In Labor Force | Unemployed |
| Less than High School | 625 (74.1%) | 0 (0.0%) |
| High School Diploma | 1,546 (76.4%) | 429 (21.2%) |
| College / Associate Degree | 672 (73.8%) | 47 (5.2%) |
| Bachelor's Degree or higher | 505 (69.4%) | 36 (5.0%) |
| Total | 3,347 (74.3%) | 523 (11.6%) |
Employment Occupations by Sex in Toccoa
Management, Business, Science and Arts Occupations
The most common Management, Business, Science and Arts occupations in Toccoa are Community & Social Service (322 | 8.4%), Education Instruction & Library (290 | 7.6%), Management (286 | 7.5%), Health Diagnosing & Treating (165 | 4.3%), and Business & Financial (98 | 2.6%).

Management, Business, Science and Arts Occupations by Sex
Within the Management, Business, Science and Arts occupations in Toccoa, the most male-oriented occupations are Computers, Engineering & Science (100.0%), Computers & Mathematics (100.0%), and Architecture & Engineering (100.0%), while the most female-oriented occupations are Health Technologists (100.0%), Health Diagnosing & Treating (57.6%), and Business & Financial (55.1%).

| Occupation | Male | Female |
| Management | 203 (71.0%) | 83 (29.0%) |
| Business & Financial | 44 (44.9%) | 54 (55.1%) |
| Computers, Engineering & Science | 50 (100.0%) | 0 (0.0%) |
| Computers & Mathematics | 13 (100.0%) | 0 (0.0%) |
| Architecture & Engineering | 37 (100.0%) | 0 (0.0%) |
| Life, Physical & Social Science | 0 (0.0%) | 0 (0.0%) |
| Community & Social Service | 169 (52.5%) | 153 (47.5%) |
| Education, Arts & Media | 20 (100.0%) | 0 (0.0%) |
| Legal Services & Support | 0 (0.0%) | 0 (0.0%) |
| Education Instruction & Library | 137 (47.2%) | 153 (52.8%) |
| Arts, Media & Entertainment | 12 (100.0%) | 0 (0.0%) |
| Health Diagnosing & Treating | 70 (42.4%) | 95 (57.6%) |
| Health Technologists | 0 (0.0%) | 23 (100.0%) |
| Total (Category) | 536 (58.2%) | 385 (41.8%) |
| Total (Overall) | 2,053 (53.7%) | 1,772 (46.3%) |
Services Occupations
The most common Services occupations in Toccoa are Food Preparation & Serving (573 | 15.0%), Healthcare Support (201 | 5.2%), Cleaning & Maintenance (140 | 3.7%), Security & Protection (71 | 1.9%), and Personal Care & Service (57 | 1.5%).

Services Occupations by Sex
Within the Services occupations in Toccoa, the most male-oriented occupations are Firefighting & Prevention (100.0%), Personal Care & Service (84.2%), and Cleaning & Maintenance (81.4%), while the most female-oriented occupations are Healthcare Support (91.0%), Food Preparation & Serving (84.5%), and Law Enforcement (27.5%).
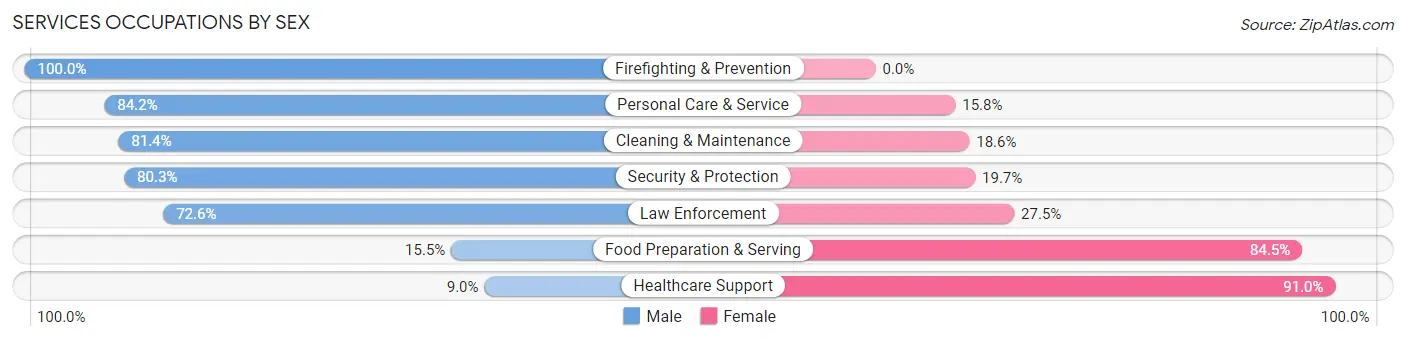
| Occupation | Male | Female |
| Healthcare Support | 18 (9.0%) | 183 (91.0%) |
| Security & Protection | 57 (80.3%) | 14 (19.7%) |
| Firefighting & Prevention | 20 (100.0%) | 0 (0.0%) |
| Law Enforcement | 37 (72.6%) | 14 (27.5%) |
| Food Preparation & Serving | 89 (15.5%) | 484 (84.5%) |
| Cleaning & Maintenance | 114 (81.4%) | 26 (18.6%) |
| Personal Care & Service | 48 (84.2%) | 9 (15.8%) |
| Total (Category) | 326 (31.3%) | 716 (68.7%) |
| Total (Overall) | 2,053 (53.7%) | 1,772 (46.3%) |
Sales and Office Occupations
The most common Sales and Office occupations in Toccoa are Sales & Related (312 | 8.2%), and Office & Administration (280 | 7.3%).
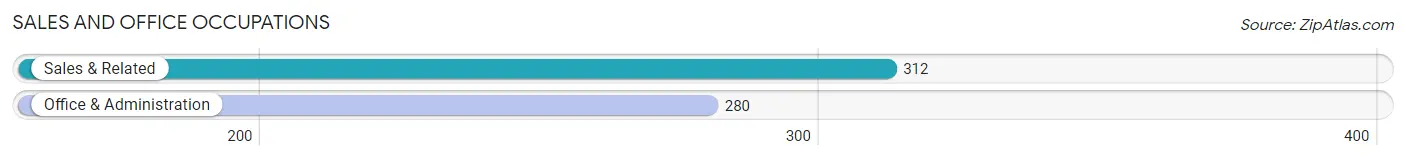
Sales and Office Occupations by Sex
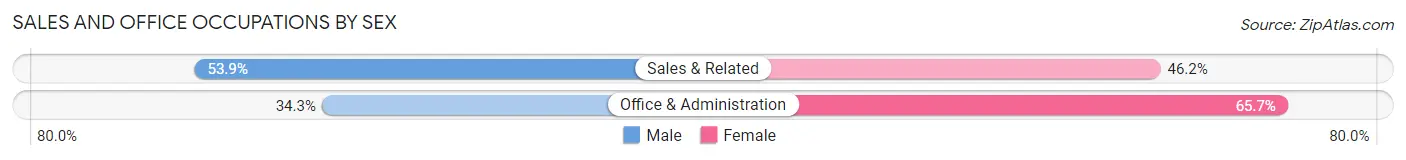
| Occupation | Male | Female |
| Sales & Related | 168 (53.8%) | 144 (46.2%) |
| Office & Administration | 96 (34.3%) | 184 (65.7%) |
| Total (Category) | 264 (44.6%) | 328 (55.4%) |
| Total (Overall) | 2,053 (53.7%) | 1,772 (46.3%) |
Natural Resources, Construction and Maintenance Occupations
The most common Natural Resources, Construction and Maintenance occupations in Toccoa are Installation, Maintenance & Repair (124 | 3.2%), and Construction & Extraction (94 | 2.5%).
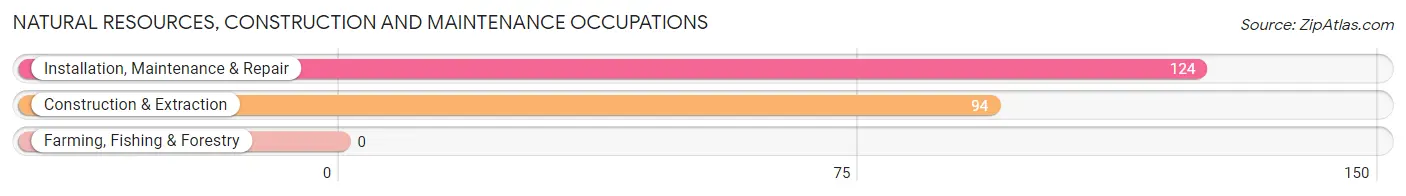
Natural Resources, Construction and Maintenance Occupations by Sex

| Occupation | Male | Female |
| Farming, Fishing & Forestry | 0 (0.0%) | 0 (0.0%) |
| Construction & Extraction | 94 (100.0%) | 0 (0.0%) |
| Installation, Maintenance & Repair | 124 (100.0%) | 0 (0.0%) |
| Total (Category) | 218 (100.0%) | 0 (0.0%) |
| Total (Overall) | 2,053 (53.7%) | 1,772 (46.3%) |
Production, Transportation and Moving Occupations
The most common Production, Transportation and Moving occupations in Toccoa are Production (504 | 13.2%), Transportation (372 | 9.7%), and Material Moving (176 | 4.6%).
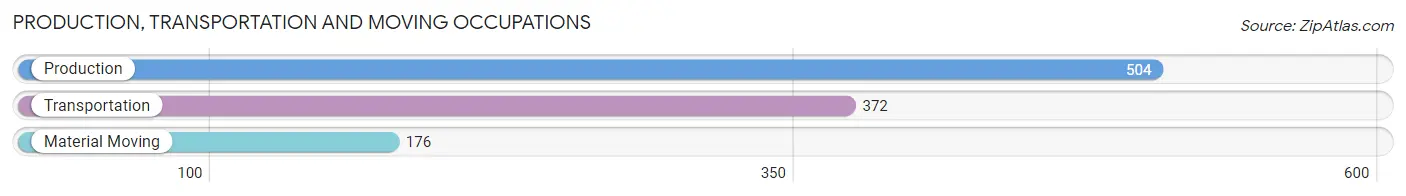
Production, Transportation and Moving Occupations by Sex

| Occupation | Male | Female |
| Production | 301 (59.7%) | 203 (40.3%) |
| Transportation | 240 (64.5%) | 132 (35.5%) |
| Material Moving | 168 (95.5%) | 8 (4.5%) |
| Total (Category) | 709 (67.4%) | 343 (32.6%) |
| Total (Overall) | 2,053 (53.7%) | 1,772 (46.3%) |
Employment Industries by Sex in Toccoa
Employment Industries in Toccoa
The major employment industries in Toccoa include Manufacturing (742 | 19.4%), Accommodation & Food Services (656 | 17.2%), Retail Trade (421 | 11.0%), Educational Services (366 | 9.6%), and Health Care & Social Assistance (320 | 8.4%).

Employment Industries by Sex in Toccoa
The Toccoa industries that see more men than women are Agriculture, Fishing & Hunting (100.0%), Utilities (100.0%), and Arts, Entertainment & Recreation (100.0%), whereas the industries that tend to have a higher number of women are Professional & Scientific (100.0%), Health Care & Social Assistance (76.2%), and Real Estate, Rental & Leasing (76.2%).
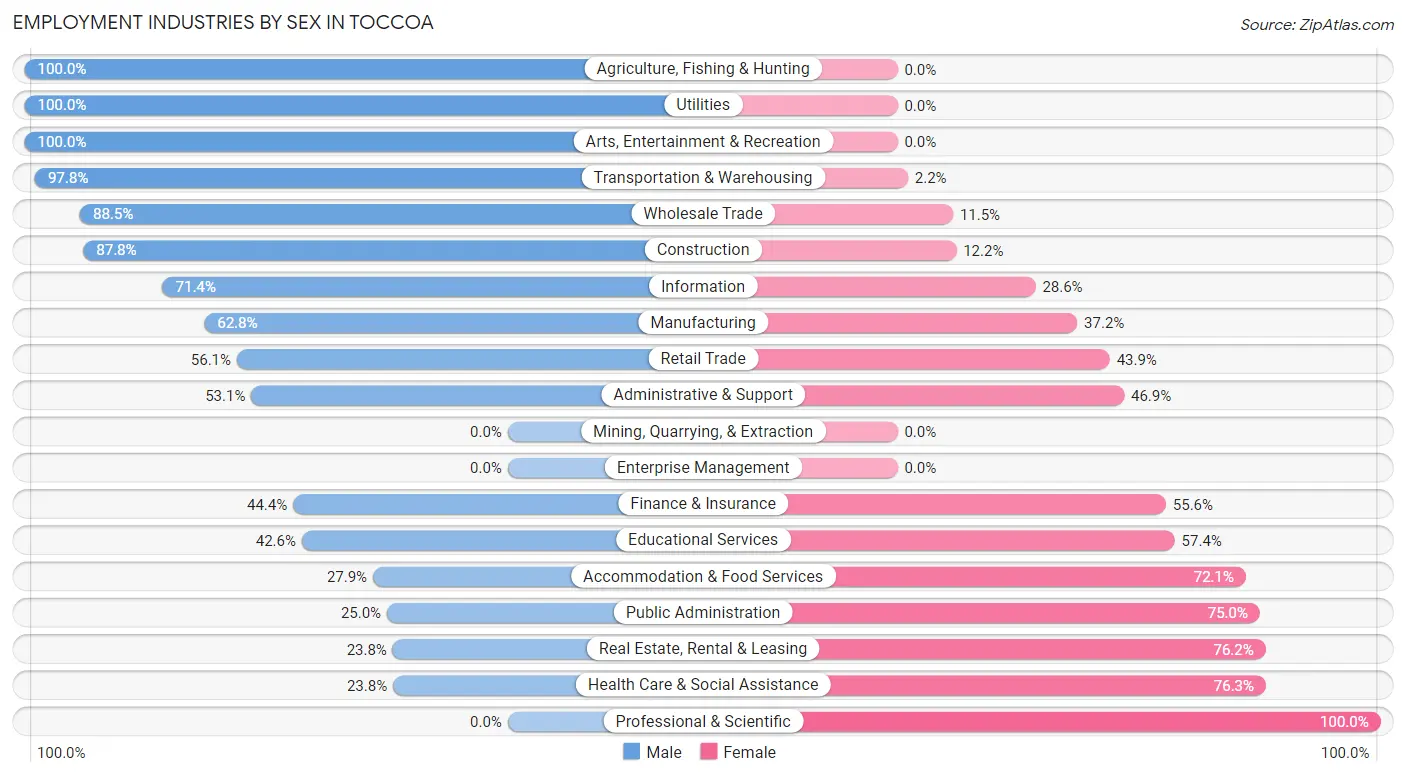
| Industry | Male | Female |
| Agriculture, Fishing & Hunting | 57 (100.0%) | 0 (0.0%) |
| Mining, Quarrying, & Extraction | 0 (0.0%) | 0 (0.0%) |
| Construction | 166 (87.8%) | 23 (12.2%) |
| Manufacturing | 466 (62.8%) | 276 (37.2%) |
| Wholesale Trade | 77 (88.5%) | 10 (11.5%) |
| Retail Trade | 236 (56.1%) | 185 (43.9%) |
| Transportation & Warehousing | 226 (97.8%) | 5 (2.2%) |
| Utilities | 87 (100.0%) | 0 (0.0%) |
| Information | 65 (71.4%) | 26 (28.6%) |
| Finance & Insurance | 36 (44.4%) | 45 (55.6%) |
| Real Estate, Rental & Leasing | 5 (23.8%) | 16 (76.2%) |
| Professional & Scientific | 0 (0.0%) | 72 (100.0%) |
| Enterprise Management | 0 (0.0%) | 0 (0.0%) |
| Administrative & Support | 86 (53.1%) | 76 (46.9%) |
| Educational Services | 156 (42.6%) | 210 (57.4%) |
| Health Care & Social Assistance | 76 (23.7%) | 244 (76.2%) |
| Arts, Entertainment & Recreation | 28 (100.0%) | 0 (0.0%) |
| Accommodation & Food Services | 183 (27.9%) | 473 (72.1%) |
| Public Administration | 37 (25.0%) | 111 (75.0%) |
| Total | 2,053 (53.7%) | 1,772 (46.3%) |
Education in Toccoa
School Enrollment in Toccoa
The most common levels of schooling among the 1,681 students in Toccoa are elementary school (542 | 32.2%), high school (334 | 19.9%), and middle school (313 | 18.6%).
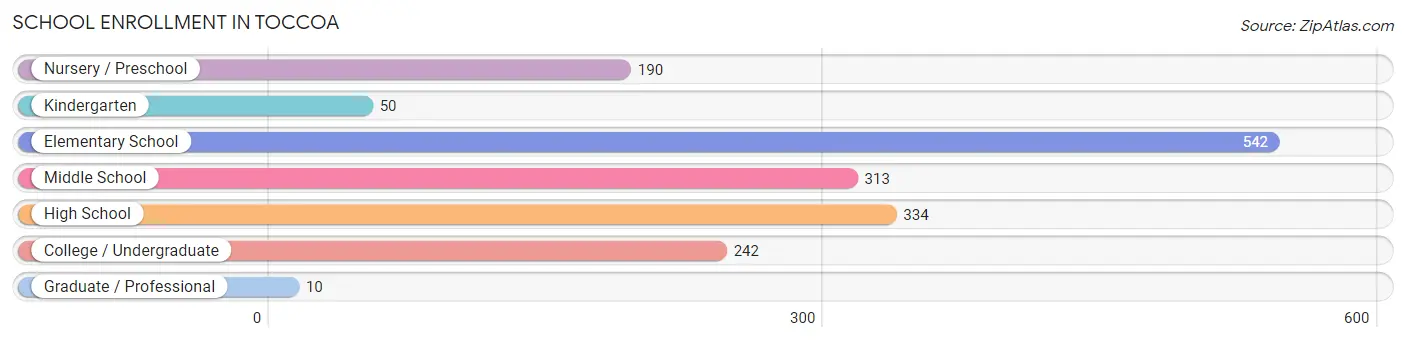
| School Level | # Students | % Students |
| Nursery / Preschool | 190 | 11.3% |
| Kindergarten | 50 | 3.0% |
| Elementary School | 542 | 32.2% |
| Middle School | 313 | 18.6% |
| High School | 334 | 19.9% |
| College / Undergraduate | 242 | 14.4% |
| Graduate / Professional | 10 | 0.6% |
| Total | 1,681 | 100.0% |
School Enrollment by Age by Funding Source in Toccoa
Out of a total of 1,681 students who are enrolled in schools in Toccoa, 140 (8.3%) attend a private institution, while the remaining 1,541 (91.7%) are enrolled in public schools. The age group of 20 to 24 year olds has the highest likelihood of being enrolled in private schools, with 76 (74.5% in the age bracket) enrolled. Conversely, the age group of 5 to 9 year old has the lowest likelihood of being enrolled in a private school, with 589 (100.0% in the age bracket) attending a public institution.
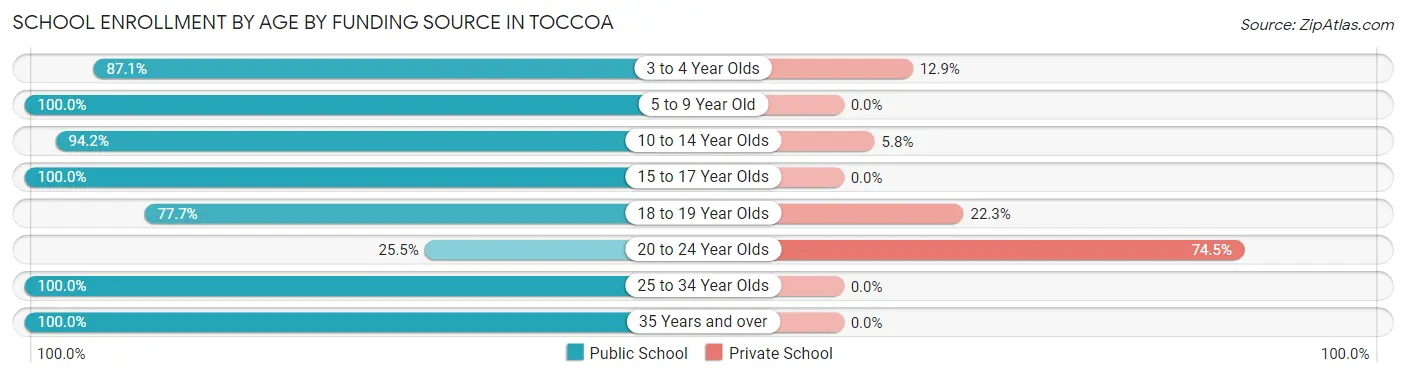
| Age Bracket | Public School | Private School |
| 3 to 4 Year Olds | 122 (87.1%) | 18 (12.9%) |
| 5 to 9 Year Old | 589 (100.0%) | 0 (0.0%) |
| 10 to 14 Year Olds | 359 (94.2%) | 22 (5.8%) |
| 15 to 17 Year Olds | 252 (100.0%) | 0 (0.0%) |
| 18 to 19 Year Olds | 80 (77.7%) | 23 (22.3%) |
| 20 to 24 Year Olds | 26 (25.5%) | 76 (74.5%) |
| 25 to 34 Year Olds | 56 (100.0%) | 0 (0.0%) |
| 35 Years and over | 58 (100.0%) | 0 (0.0%) |
| Total | 1,541 (91.7%) | 140 (8.3%) |
Educational Attainment by Field of Study in Toccoa
Education (212 | 17.2%), business (202 | 16.4%), science & technology (191 | 15.5%), social sciences (115 | 9.3%), and physical & health sciences (84 | 6.8%) are the most common fields of study among 1,230 individuals in Toccoa who have obtained a bachelor's degree or higher.

| Field of Study | # Graduates | % Graduates |
| Computers & Mathematics | 60 | 4.9% |
| Bio, Nature & Agricultural | 72 | 5.9% |
| Physical & Health Sciences | 84 | 6.8% |
| Psychology | 15 | 1.2% |
| Social Sciences | 115 | 9.3% |
| Engineering | 63 | 5.1% |
| Multidisciplinary Studies | 18 | 1.5% |
| Science & Technology | 191 | 15.5% |
| Business | 202 | 16.4% |
| Education | 212 | 17.2% |
| Literature & Languages | 42 | 3.4% |
| Liberal Arts & History | 80 | 6.5% |
| Visual & Performing Arts | 53 | 4.3% |
| Communications | 23 | 1.9% |
| Arts & Humanities | 0 | 0.0% |
| Total | 1,230 | 100.0% |
Transportation & Commute in Toccoa
Vehicle Availability by Sex in Toccoa
The most prevalent vehicle ownership categories in Toccoa are males with 2 vehicles (806, accounting for 39.7%) and females with 2 vehicles (769, making up 45.8%).
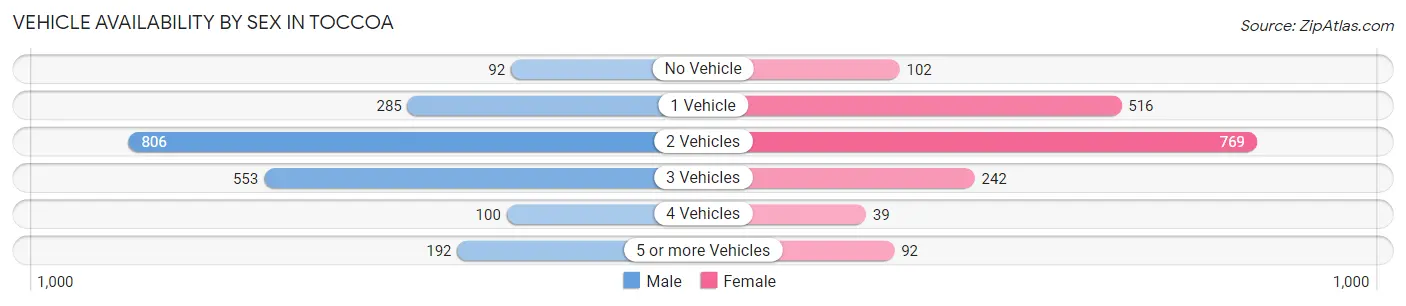
| Vehicles Available | Male | Female |
| No Vehicle | 92 (4.5%) | 102 (5.8%) |
| 1 Vehicle | 285 (14.1%) | 516 (29.3%) |
| 2 Vehicles | 806 (39.7%) | 769 (43.7%) |
| 3 Vehicles | 553 (27.3%) | 242 (13.8%) |
| 4 Vehicles | 100 (4.9%) | 39 (2.2%) |
| 5 or more Vehicles | 192 (9.5%) | 92 (5.2%) |
| Total | 2,028 (100.0%) | 1,760 (100.0%) |
Commute Time in Toccoa
The most frequently occuring commute durations in Toccoa are 10 to 14 minutes (741 commuters, 20.4%), 15 to 19 minutes (615 commuters, 17.0%), and 5 to 9 minutes (577 commuters, 15.9%).
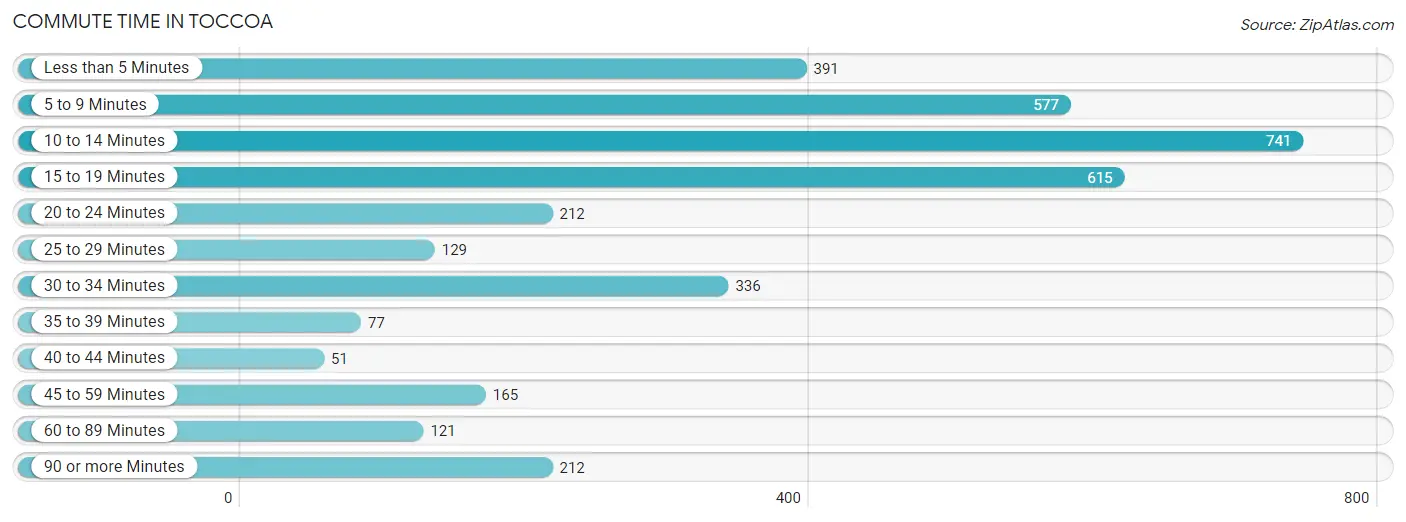
| Commute Time | # Commuters | % Commuters |
| Less than 5 Minutes | 391 | 10.8% |
| 5 to 9 Minutes | 577 | 15.9% |
| 10 to 14 Minutes | 741 | 20.4% |
| 15 to 19 Minutes | 615 | 17.0% |
| 20 to 24 Minutes | 212 | 5.9% |
| 25 to 29 Minutes | 129 | 3.6% |
| 30 to 34 Minutes | 336 | 9.3% |
| 35 to 39 Minutes | 77 | 2.1% |
| 40 to 44 Minutes | 51 | 1.4% |
| 45 to 59 Minutes | 165 | 4.5% |
| 60 to 89 Minutes | 121 | 3.3% |
| 90 or more Minutes | 212 | 5.9% |
Commute Time by Sex in Toccoa
The most common commute times in Toccoa are 10 to 14 minutes (396 commuters, 20.1%) for males and 10 to 14 minutes (345 commuters, 20.8%) for females.
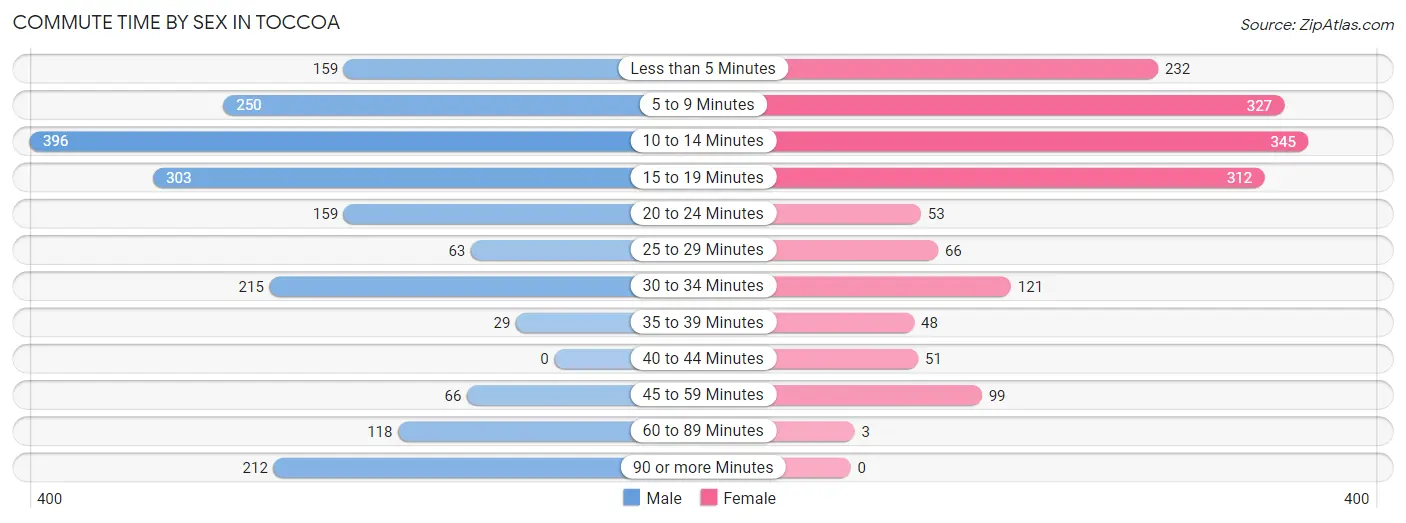
| Commute Time | Male | Female |
| Less than 5 Minutes | 159 (8.1%) | 232 (14.0%) |
| 5 to 9 Minutes | 250 (12.7%) | 327 (19.7%) |
| 10 to 14 Minutes | 396 (20.1%) | 345 (20.8%) |
| 15 to 19 Minutes | 303 (15.4%) | 312 (18.8%) |
| 20 to 24 Minutes | 159 (8.1%) | 53 (3.2%) |
| 25 to 29 Minutes | 63 (3.2%) | 66 (4.0%) |
| 30 to 34 Minutes | 215 (10.9%) | 121 (7.3%) |
| 35 to 39 Minutes | 29 (1.5%) | 48 (2.9%) |
| 40 to 44 Minutes | 0 (0.0%) | 51 (3.1%) |
| 45 to 59 Minutes | 66 (3.4%) | 99 (6.0%) |
| 60 to 89 Minutes | 118 (6.0%) | 3 (0.2%) |
| 90 or more Minutes | 212 (10.8%) | 0 (0.0%) |
Time of Departure to Work by Sex in Toccoa
The most frequent times of departure to work in Toccoa are 12:00 AM to 4:59 AM (308, 15.6%) for males and 12:00 PM to 3:59 PM (244, 14.7%) for females.
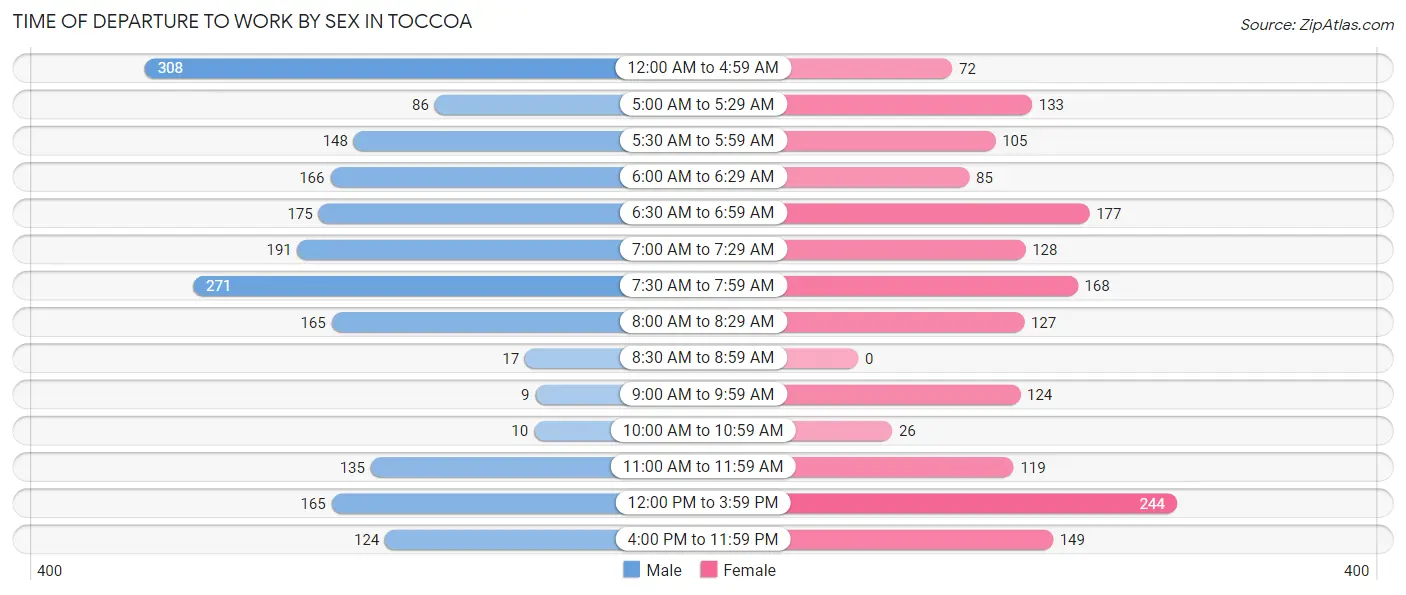
| Time of Departure | Male | Female |
| 12:00 AM to 4:59 AM | 308 (15.6%) | 72 (4.3%) |
| 5:00 AM to 5:29 AM | 86 (4.4%) | 133 (8.0%) |
| 5:30 AM to 5:59 AM | 148 (7.5%) | 105 (6.3%) |
| 6:00 AM to 6:29 AM | 166 (8.4%) | 85 (5.1%) |
| 6:30 AM to 6:59 AM | 175 (8.9%) | 177 (10.7%) |
| 7:00 AM to 7:29 AM | 191 (9.7%) | 128 (7.7%) |
| 7:30 AM to 7:59 AM | 271 (13.8%) | 168 (10.1%) |
| 8:00 AM to 8:29 AM | 165 (8.4%) | 127 (7.7%) |
| 8:30 AM to 8:59 AM | 17 (0.9%) | 0 (0.0%) |
| 9:00 AM to 9:59 AM | 9 (0.5%) | 124 (7.5%) |
| 10:00 AM to 10:59 AM | 10 (0.5%) | 26 (1.6%) |
| 11:00 AM to 11:59 AM | 135 (6.9%) | 119 (7.2%) |
| 12:00 PM to 3:59 PM | 165 (8.4%) | 244 (14.7%) |
| 4:00 PM to 11:59 PM | 124 (6.3%) | 149 (9.0%) |
| Total | 1,970 (100.0%) | 1,657 (100.0%) |
Housing Occupancy in Toccoa
Occupancy by Ownership in Toccoa
Of the total 3,569 dwellings in Toccoa, owner-occupied units account for 2,015 (56.5%), while renter-occupied units make up 1,554 (43.5%).

| Occupancy | # Housing Units | % Housing Units |
| Owner Occupied Housing Units | 2,015 | 56.5% |
| Renter-Occupied Housing Units | 1,554 | 43.5% |
| Total Occupied Housing Units | 3,569 | 100.0% |
Occupancy by Household Size in Toccoa

| Household Size | # Housing Units | % Housing Units |
| 1-Person Household | 1,010 | 28.3% |
| 2-Person Household | 1,426 | 40.0% |
| 3-Person Household | 588 | 16.5% |
| 4+ Person Household | 545 | 15.3% |
| Total Housing Units | 3,569 | 100.0% |
Occupancy by Ownership by Household Size in Toccoa
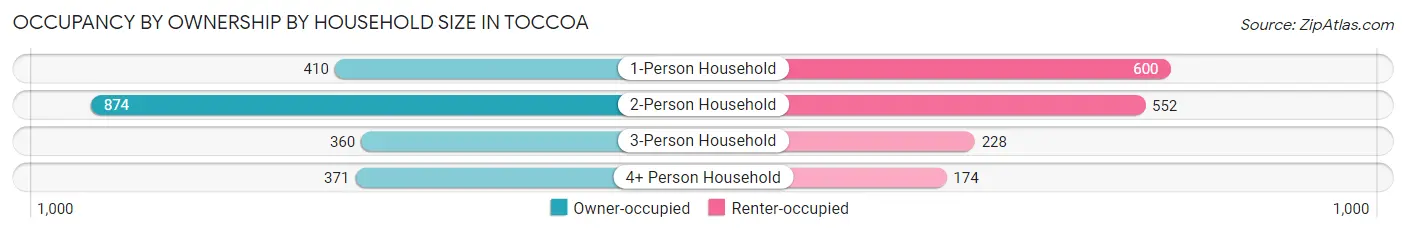
| Household Size | Owner-occupied | Renter-occupied |
| 1-Person Household | 410 (40.6%) | 600 (59.4%) |
| 2-Person Household | 874 (61.3%) | 552 (38.7%) |
| 3-Person Household | 360 (61.2%) | 228 (38.8%) |
| 4+ Person Household | 371 (68.1%) | 174 (31.9%) |
| Total Housing Units | 2,015 (56.5%) | 1,554 (43.5%) |
Occupancy by Educational Attainment in Toccoa
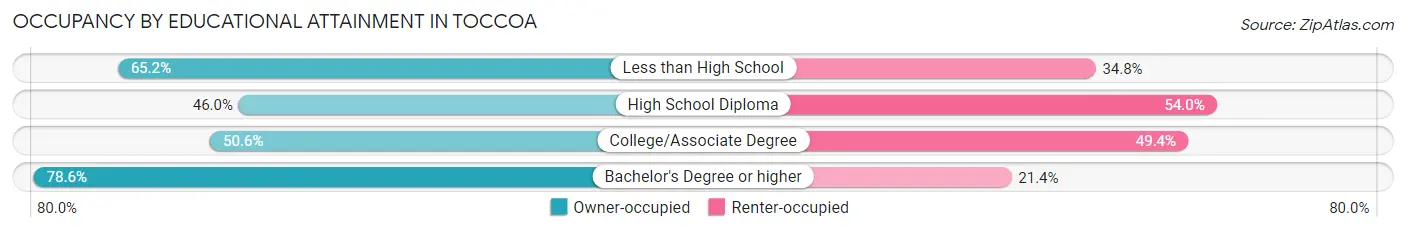
| Household Size | Owner-occupied | Renter-occupied |
| Less than High School | 392 (65.2%) | 209 (34.8%) |
| High School Diploma | 654 (46.0%) | 767 (54.0%) |
| College/Associate Degree | 445 (50.6%) | 435 (49.4%) |
| Bachelor's Degree or higher | 524 (78.6%) | 143 (21.4%) |
Occupancy by Age of Householder in Toccoa
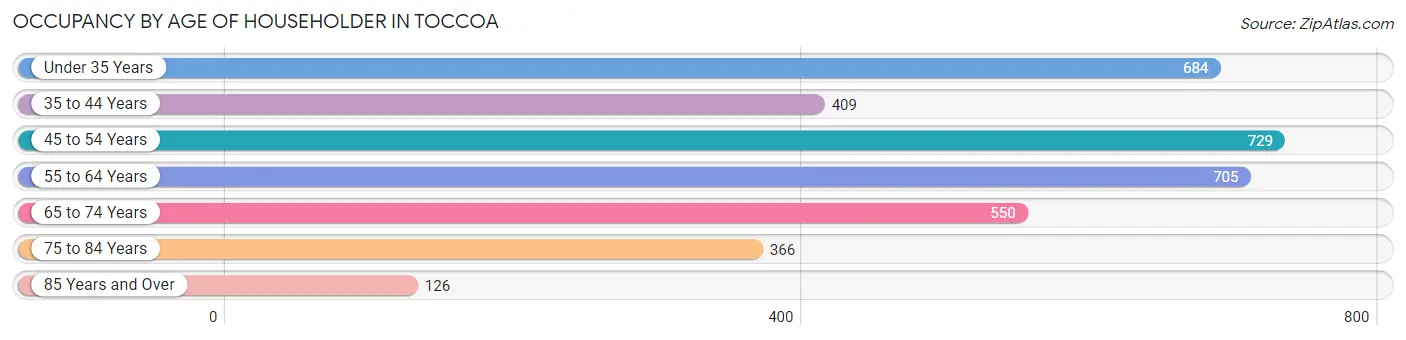
| Age Bracket | # Households | % Households |
| Under 35 Years | 684 | 19.2% |
| 35 to 44 Years | 409 | 11.5% |
| 45 to 54 Years | 729 | 20.4% |
| 55 to 64 Years | 705 | 19.8% |
| 65 to 74 Years | 550 | 15.4% |
| 75 to 84 Years | 366 | 10.2% |
| 85 Years and Over | 126 | 3.5% |
| Total | 3,569 | 100.0% |
Housing Finances in Toccoa
Median Income by Occupancy in Toccoa
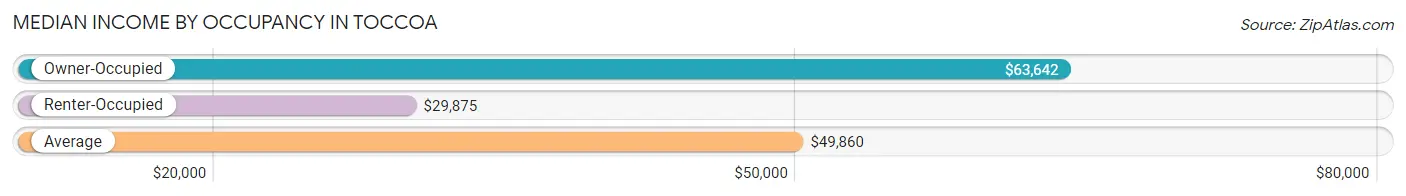
| Occupancy Type | # Households | Median Income |
| Owner-Occupied | 2,015 (56.5%) | $63,642 |
| Renter-Occupied | 1,554 (43.5%) | $29,875 |
| Average | 3,569 (100.0%) | $49,860 |
Occupancy by Householder Income Bracket in Toccoa

| Income Bracket | Owner-occupied | Renter-occupied |
| Less than $5,000 | 83 (4.1%) | 115 (7.4%) |
| $5,000 to $9,999 | 34 (1.7%) | 23 (1.5%) |
| $10,000 to $14,999 | 73 (3.6%) | 131 (8.4%) |
| $15,000 to $19,999 | 102 (5.1%) | 190 (12.2%) |
| $20,000 to $24,999 | 41 (2.0%) | 143 (9.2%) |
| $25,000 to $34,999 | 138 (6.9%) | 310 (20.0%) |
| $35,000 to $49,999 | 149 (7.4%) | 259 (16.7%) |
| $50,000 to $74,999 | 596 (29.6%) | 162 (10.4%) |
| $75,000 to $99,999 | 403 (20.0%) | 109 (7.0%) |
| $100,000 to $149,999 | 167 (8.3%) | 112 (7.2%) |
| $150,000 or more | 229 (11.4%) | 0 (0.0%) |
| Total | 2,015 (100.0%) | 1,554 (100.0%) |
Monthly Housing Cost Tiers in Toccoa
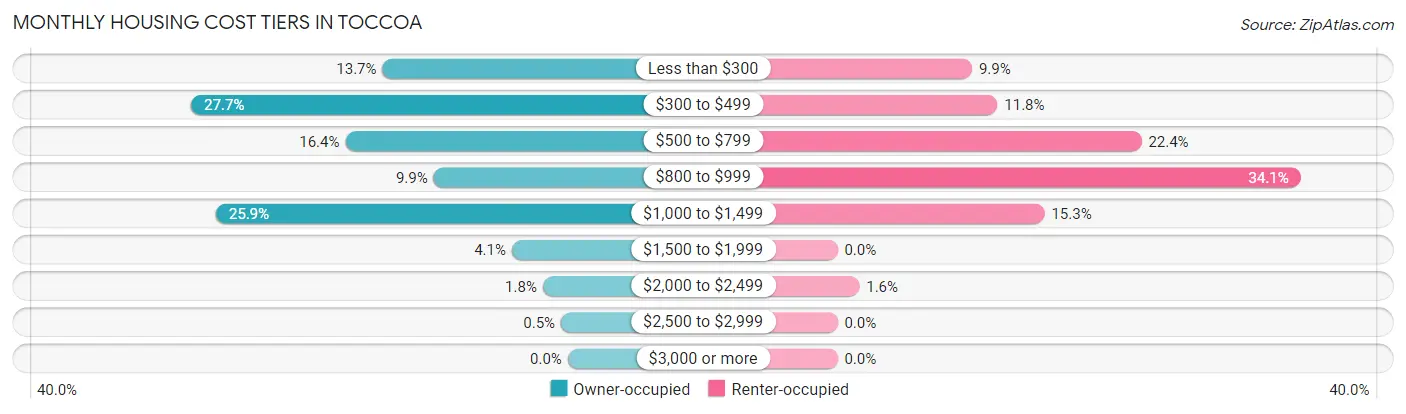
| Monthly Cost | Owner-occupied | Renter-occupied |
| Less than $300 | 275 (13.7%) | 154 (9.9%) |
| $300 to $499 | 559 (27.7%) | 183 (11.8%) |
| $500 to $799 | 330 (16.4%) | 348 (22.4%) |
| $800 to $999 | 199 (9.9%) | 530 (34.1%) |
| $1,000 to $1,499 | 522 (25.9%) | 237 (15.2%) |
| $1,500 to $1,999 | 83 (4.1%) | 0 (0.0%) |
| $2,000 to $2,499 | 37 (1.8%) | 25 (1.6%) |
| $2,500 to $2,999 | 10 (0.5%) | 0 (0.0%) |
| $3,000 or more | 0 (0.0%) | 0 (0.0%) |
| Total | 2,015 (100.0%) | 1,554 (100.0%) |
Physical Housing Characteristics in Toccoa
Housing Structures in Toccoa
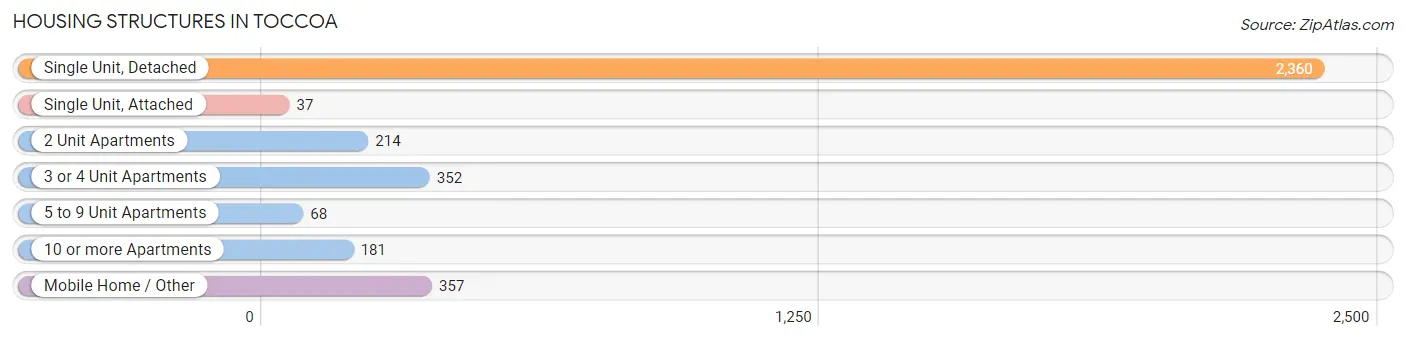
| Structure Type | # Housing Units | % Housing Units |
| Single Unit, Detached | 2,360 | 66.1% |
| Single Unit, Attached | 37 | 1.0% |
| 2 Unit Apartments | 214 | 6.0% |
| 3 or 4 Unit Apartments | 352 | 9.9% |
| 5 to 9 Unit Apartments | 68 | 1.9% |
| 10 or more Apartments | 181 | 5.1% |
| Mobile Home / Other | 357 | 10.0% |
| Total | 3,569 | 100.0% |
Housing Structures by Occupancy in Toccoa
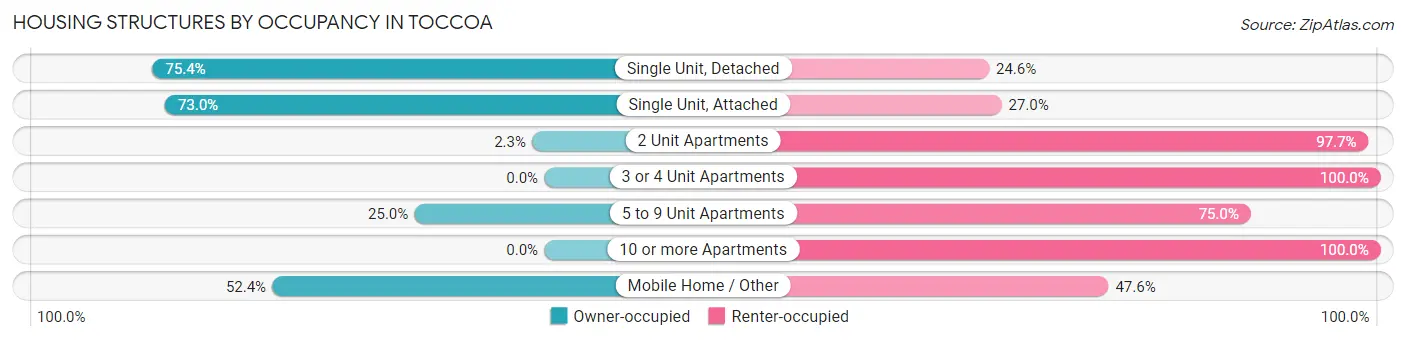
| Structure Type | Owner-occupied | Renter-occupied |
| Single Unit, Detached | 1,779 (75.4%) | 581 (24.6%) |
| Single Unit, Attached | 27 (73.0%) | 10 (27.0%) |
| 2 Unit Apartments | 5 (2.3%) | 209 (97.7%) |
| 3 or 4 Unit Apartments | 0 (0.0%) | 352 (100.0%) |
| 5 to 9 Unit Apartments | 17 (25.0%) | 51 (75.0%) |
| 10 or more Apartments | 0 (0.0%) | 181 (100.0%) |
| Mobile Home / Other | 187 (52.4%) | 170 (47.6%) |
| Total | 2,015 (56.5%) | 1,554 (43.5%) |
Housing Structures by Number of Rooms in Toccoa

| Number of Rooms | Owner-occupied | Renter-occupied |
| 1 Room | 0 (0.0%) | 9 (0.6%) |
| 2 or 3 Rooms | 65 (3.2%) | 212 (13.6%) |
| 4 or 5 Rooms | 674 (33.5%) | 993 (63.9%) |
| 6 or 7 Rooms | 687 (34.1%) | 281 (18.1%) |
| 8 or more Rooms | 589 (29.2%) | 59 (3.8%) |
| Total | 2,015 (100.0%) | 1,554 (100.0%) |
Housing Structure by Heating Type in Toccoa

| Heating Type | Owner-occupied | Renter-occupied |
| Utility Gas | 726 (36.0%) | 443 (28.5%) |
| Bottled, Tank, or LP Gas | 153 (7.6%) | 19 (1.2%) |
| Electricity | 1,088 (54.0%) | 1,075 (69.2%) |
| Fuel Oil or Kerosene | 0 (0.0%) | 0 (0.0%) |
| Coal or Coke | 0 (0.0%) | 0 (0.0%) |
| All other Fuels | 15 (0.7%) | 0 (0.0%) |
| No Fuel Used | 33 (1.6%) | 17 (1.1%) |
| Total | 2,015 (100.0%) | 1,554 (100.0%) |
Household Vehicle Usage in Toccoa
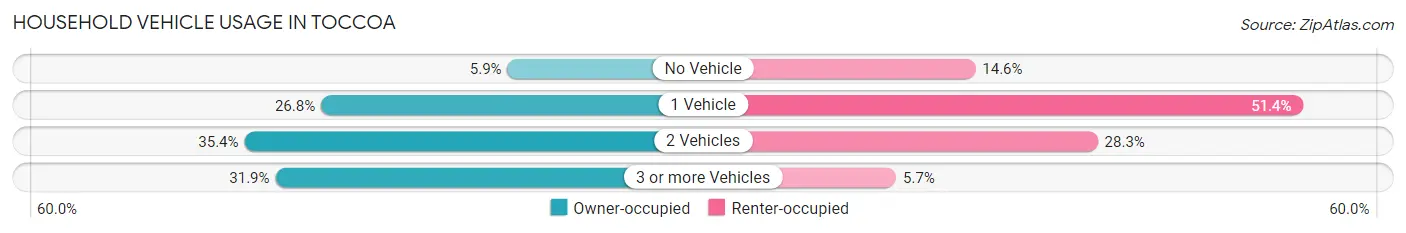
| Vehicles per Household | Owner-occupied | Renter-occupied |
| No Vehicle | 119 (5.9%) | 227 (14.6%) |
| 1 Vehicle | 540 (26.8%) | 798 (51.3%) |
| 2 Vehicles | 713 (35.4%) | 440 (28.3%) |
| 3 or more Vehicles | 643 (31.9%) | 89 (5.7%) |
| Total | 2,015 (100.0%) | 1,554 (100.0%) |
Real Estate & Mortgages in Toccoa
Real Estate and Mortgage Overview in Toccoa
| Characteristic | Without Mortgage | With Mortgage |
| Housing Units | 1,175 | 840 |
| Median Property Value | $112,100 | $145,500 |
| Median Household Income | $62,002 | $87 |
| Monthly Housing Costs | $420 | $0 |
| Real Estate Taxes | $704 | $23 |
Property Value by Mortgage Status in Toccoa
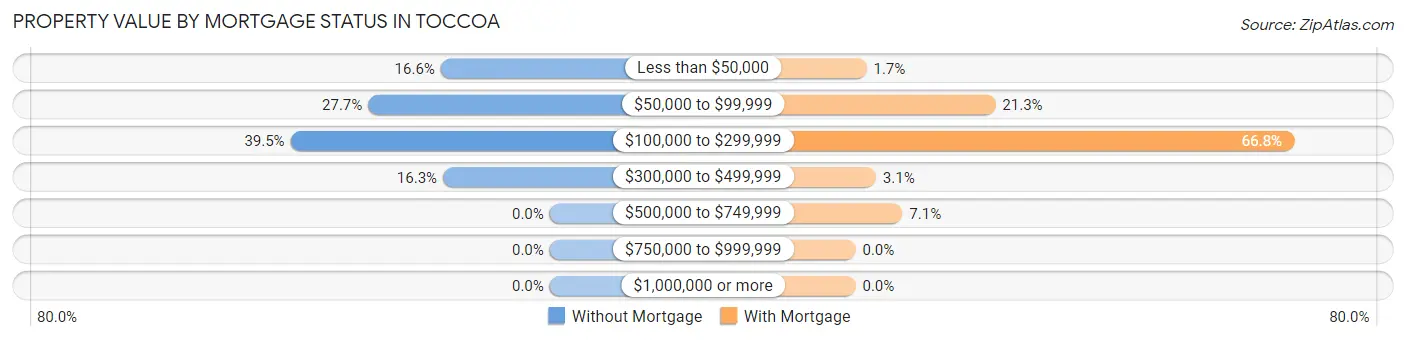
| Property Value | Without Mortgage | With Mortgage |
| Less than $50,000 | 195 (16.6%) | 14 (1.7%) |
| $50,000 to $99,999 | 325 (27.7%) | 179 (21.3%) |
| $100,000 to $299,999 | 464 (39.5%) | 561 (66.8%) |
| $300,000 to $499,999 | 191 (16.3%) | 26 (3.1%) |
| $500,000 to $749,999 | 0 (0.0%) | 60 (7.1%) |
| $750,000 to $999,999 | 0 (0.0%) | 0 (0.0%) |
| $1,000,000 or more | 0 (0.0%) | 0 (0.0%) |
| Total | 1,175 (100.0%) | 840 (100.0%) |
Household Income by Mortgage Status in Toccoa

| Household Income | Without Mortgage | With Mortgage |
| Less than $10,000 | 93 (7.9%) | 28 (3.3%) |
| $10,000 to $24,999 | 152 (12.9%) | 24 (2.9%) |
| $25,000 to $34,999 | 68 (5.8%) | 64 (7.6%) |
| $35,000 to $49,999 | 94 (8.0%) | 70 (8.3%) |
| $50,000 to $74,999 | 274 (23.3%) | 55 (6.6%) |
| $75,000 to $99,999 | 234 (19.9%) | 322 (38.3%) |
| $100,000 to $149,999 | 118 (10.0%) | 169 (20.1%) |
| $150,000 or more | 142 (12.1%) | 49 (5.8%) |
| Total | 1,175 (100.0%) | 840 (100.0%) |
Property Value to Household Income Ratio in Toccoa

| Value-to-Income Ratio | Without Mortgage | With Mortgage |
| Less than 2.0x | 500 (42.5%) | 64,128 (7,634.3%) |
| 2.0x to 2.9x | 346 (29.4%) | 387 (46.1%) |
| 3.0x to 3.9x | 56 (4.8%) | 227 (27.0%) |
| 4.0x or more | 224 (19.1%) | 62 (7.4%) |
| Total | 1,175 (100.0%) | 840 (100.0%) |
Real Estate Taxes by Mortgage Status in Toccoa
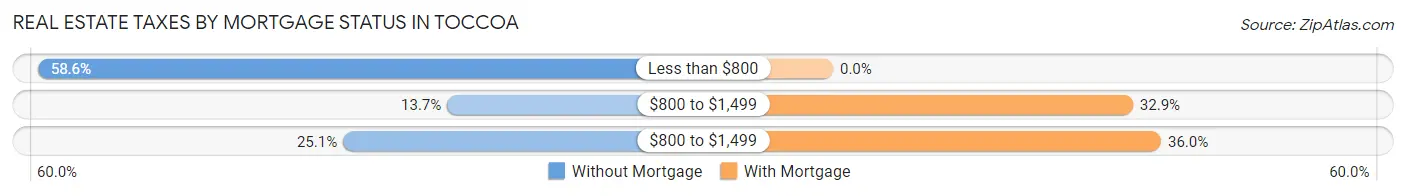
| Property Taxes | Without Mortgage | With Mortgage |
| Less than $800 | 688 (58.6%) | 0 (0.0%) |
| $800 to $1,499 | 161 (13.7%) | 276 (32.9%) |
| $800 to $1,499 | 295 (25.1%) | 302 (35.9%) |
| Total | 1,175 (100.0%) | 840 (100.0%) |
Health & Disability in Toccoa
Health Insurance Coverage by Age in Toccoa
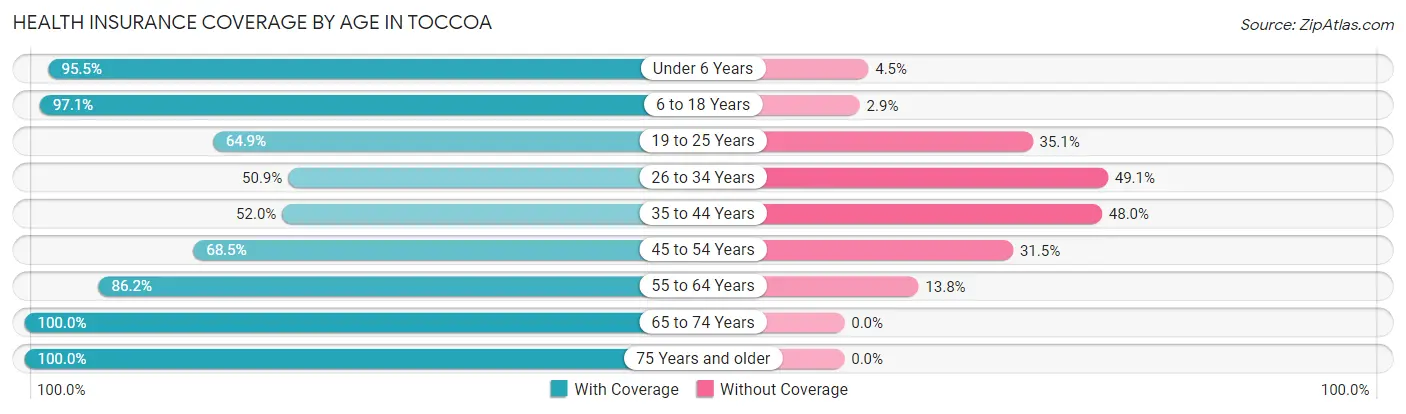
| Age Bracket | With Coverage | Without Coverage |
| Under 6 Years | 599 (95.5%) | 28 (4.5%) |
| 6 to 18 Years | 1,289 (97.1%) | 38 (2.9%) |
| 19 to 25 Years | 512 (64.9%) | 277 (35.1%) |
| 26 to 34 Years | 535 (50.9%) | 517 (49.1%) |
| 35 to 44 Years | 515 (52.0%) | 476 (48.0%) |
| 45 to 54 Years | 939 (68.5%) | 431 (31.5%) |
| 55 to 64 Years | 892 (86.2%) | 143 (13.8%) |
| 65 to 74 Years | 1,019 (100.0%) | 0 (0.0%) |
| 75 Years and older | 812 (100.0%) | 0 (0.0%) |
| Total | 7,112 (78.8%) | 1,910 (21.2%) |
Health Insurance Coverage by Citizenship Status in Toccoa
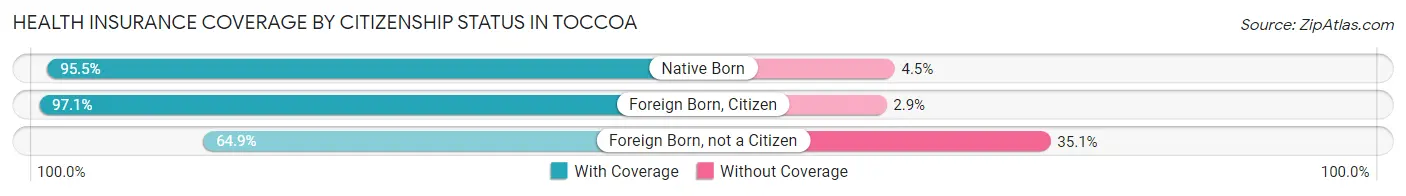
| Citizenship Status | With Coverage | Without Coverage |
| Native Born | 599 (95.5%) | 28 (4.5%) |
| Foreign Born, Citizen | 1,289 (97.1%) | 38 (2.9%) |
| Foreign Born, not a Citizen | 512 (64.9%) | 277 (35.1%) |
Health Insurance Coverage by Household Income in Toccoa
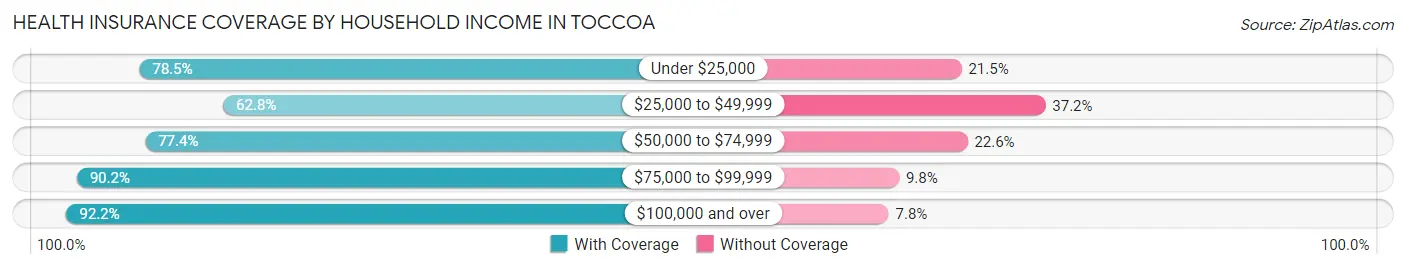
| Household Income | With Coverage | Without Coverage |
| Under $25,000 | 1,136 (78.5%) | 311 (21.5%) |
| $25,000 to $49,999 | 1,366 (62.8%) | 809 (37.2%) |
| $50,000 to $74,999 | 1,730 (77.4%) | 505 (22.6%) |
| $75,000 to $99,999 | 1,441 (90.2%) | 156 (9.8%) |
| $100,000 and over | 1,425 (92.2%) | 121 (7.8%) |
Public vs Private Health Insurance Coverage by Age in Toccoa
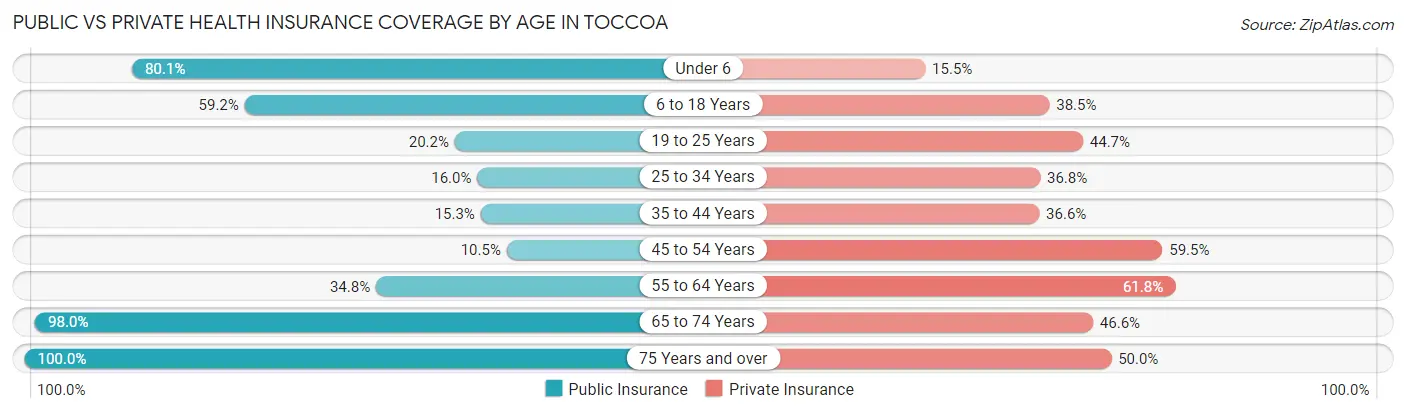
| Age Bracket | Public Insurance | Private Insurance |
| Under 6 | 502 (80.1%) | 97 (15.5%) |
| 6 to 18 Years | 785 (59.2%) | 511 (38.5%) |
| 19 to 25 Years | 159 (20.2%) | 353 (44.7%) |
| 25 to 34 Years | 168 (16.0%) | 387 (36.8%) |
| 35 to 44 Years | 152 (15.3%) | 363 (36.6%) |
| 45 to 54 Years | 144 (10.5%) | 815 (59.5%) |
| 55 to 64 Years | 360 (34.8%) | 640 (61.8%) |
| 65 to 74 Years | 999 (98.0%) | 475 (46.6%) |
| 75 Years and over | 812 (100.0%) | 406 (50.0%) |
| Total | 4,081 (45.2%) | 4,047 (44.9%) |
Disability Status by Sex by Age in Toccoa

| Age Bracket | Male | Female |
| Under 5 Years | 0 (0.0%) | 0 (0.0%) |
| 5 to 17 Years | 39 (7.0%) | 0 (0.0%) |
| 18 to 34 Years | 81 (9.6%) | 21 (2.0%) |
| 35 to 64 Years | 231 (13.8%) | 362 (21.1%) |
| 65 to 74 Years | 62 (17.8%) | 165 (24.6%) |
| 75 Years and over | 169 (48.4%) | 195 (42.1%) |
Disability Class by Sex by Age in Toccoa
Disability Class: Hearing Difficulty
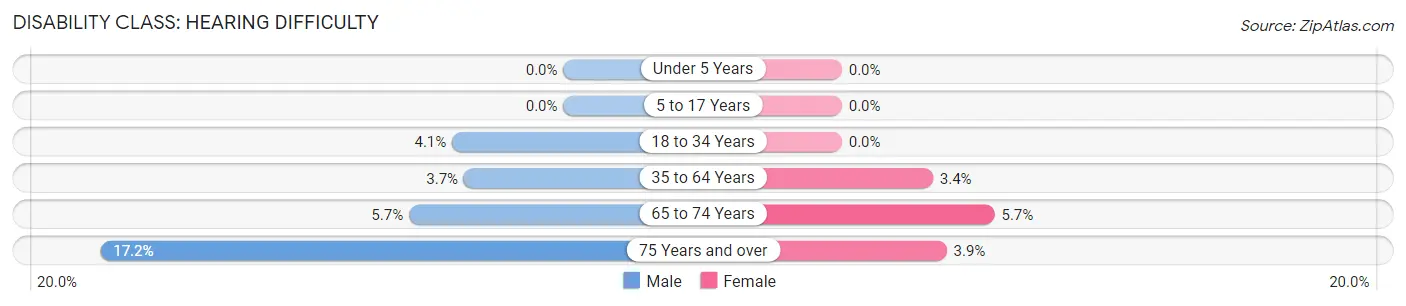
| Age Bracket | Male | Female |
| Under 5 Years | 0 (0.0%) | 0 (0.0%) |
| 5 to 17 Years | 0 (0.0%) | 0 (0.0%) |
| 18 to 34 Years | 35 (4.1%) | 0 (0.0%) |
| 35 to 64 Years | 62 (3.7%) | 58 (3.4%) |
| 65 to 74 Years | 20 (5.7%) | 38 (5.7%) |
| 75 Years and over | 60 (17.2%) | 18 (3.9%) |
Disability Class: Vision Difficulty
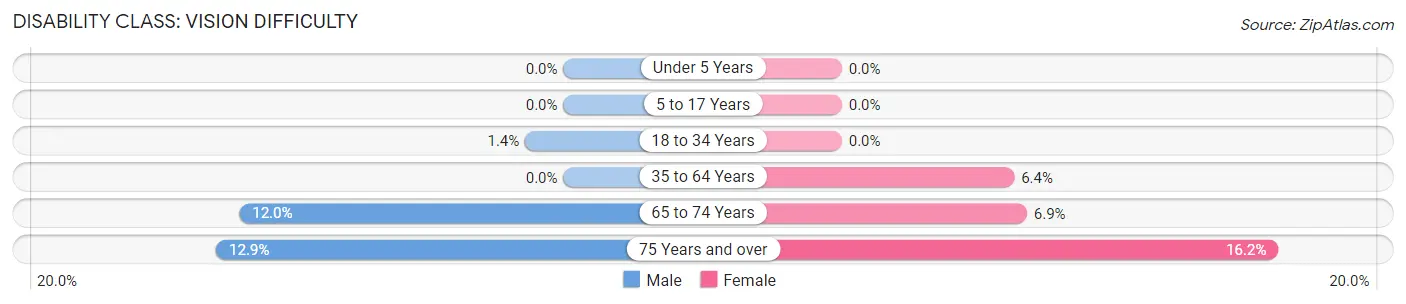
| Age Bracket | Male | Female |
| Under 5 Years | 0 (0.0%) | 0 (0.0%) |
| 5 to 17 Years | 0 (0.0%) | 0 (0.0%) |
| 18 to 34 Years | 12 (1.4%) | 0 (0.0%) |
| 35 to 64 Years | 0 (0.0%) | 110 (6.4%) |
| 65 to 74 Years | 42 (12.0%) | 46 (6.9%) |
| 75 Years and over | 45 (12.9%) | 75 (16.2%) |
Disability Class: Cognitive Difficulty
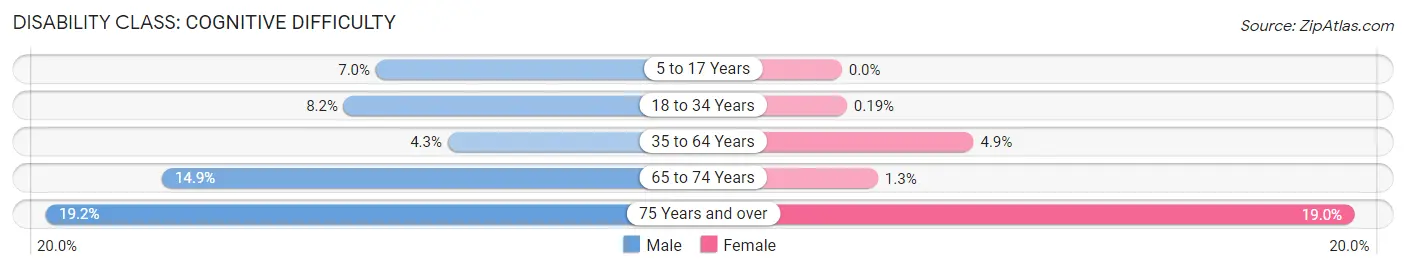
| Age Bracket | Male | Female |
| 5 to 17 Years | 39 (7.0%) | 0 (0.0%) |
| 18 to 34 Years | 69 (8.2%) | 2 (0.2%) |
| 35 to 64 Years | 72 (4.3%) | 84 (4.9%) |
| 65 to 74 Years | 52 (14.9%) | 9 (1.3%) |
| 75 Years and over | 67 (19.2%) | 88 (19.0%) |
Disability Class: Ambulatory Difficulty
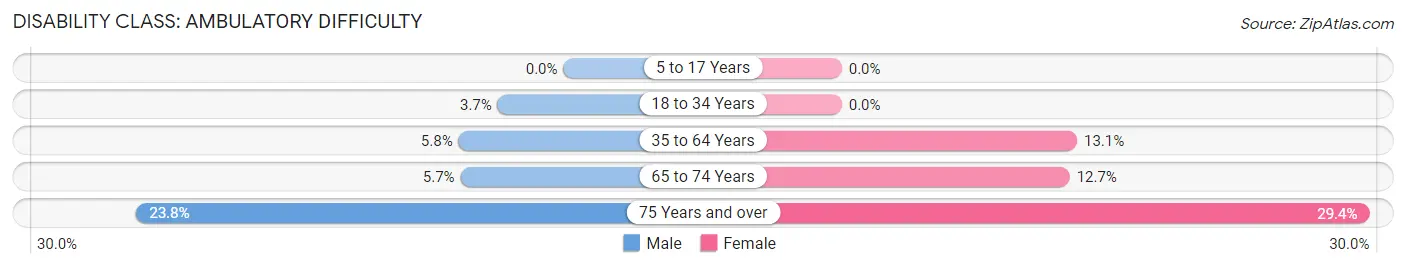
| Age Bracket | Male | Female |
| 5 to 17 Years | 0 (0.0%) | 0 (0.0%) |
| 18 to 34 Years | 31 (3.7%) | 0 (0.0%) |
| 35 to 64 Years | 98 (5.8%) | 225 (13.1%) |
| 65 to 74 Years | 20 (5.7%) | 85 (12.7%) |
| 75 Years and over | 83 (23.8%) | 136 (29.4%) |
Disability Class: Self-Care Difficulty
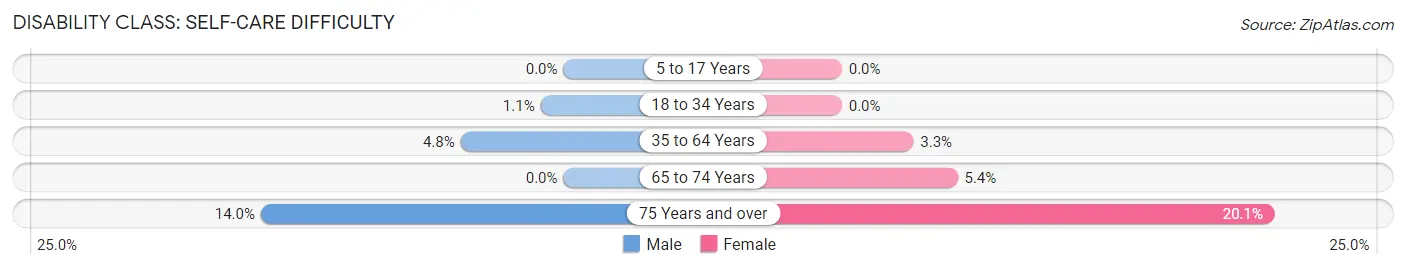
| Age Bracket | Male | Female |
| 5 to 17 Years | 0 (0.0%) | 0 (0.0%) |
| 18 to 34 Years | 9 (1.1%) | 0 (0.0%) |
| 35 to 64 Years | 80 (4.8%) | 57 (3.3%) |
| 65 to 74 Years | 0 (0.0%) | 36 (5.4%) |
| 75 Years and over | 49 (14.0%) | 93 (20.1%) |
Technology Access in Toccoa
Computing Device Access in Toccoa

| Device Type | # Households | % Households |
| Desktop or Laptop | 2,324 | 65.1% |
| Smartphone | 2,880 | 80.7% |
| Tablet | 1,965 | 55.1% |
| No Computing Device | 510 | 14.3% |
| Total | 3,569 | 100.0% |
Internet Access in Toccoa
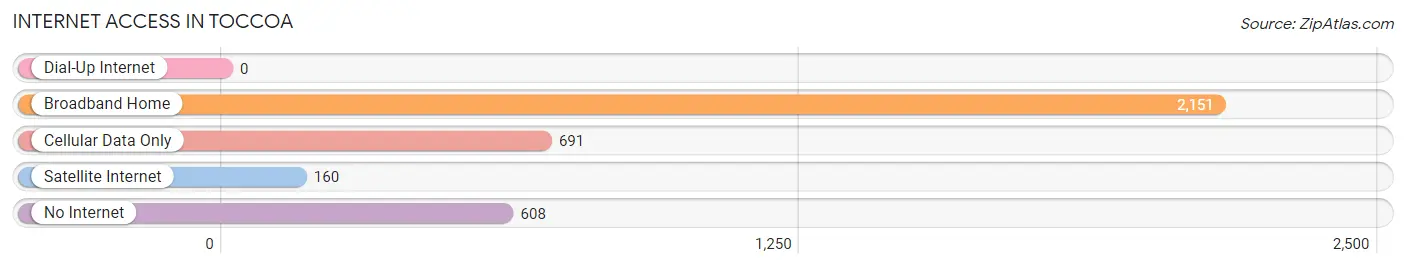
| Internet Type | # Households | % Households |
| Dial-Up Internet | 0 | 0.0% |
| Broadband Home | 2,151 | 60.3% |
| Cellular Data Only | 691 | 19.4% |
| Satellite Internet | 160 | 4.5% |
| No Internet | 608 | 17.0% |
| Total | 3,569 | 100.0% |
Toccoa Summary
Toccoa is a city located in Stephens County, Georgia, United States. It is the county seat of Stephens County. The population was 8,491 at the 2010 census. The city is the home of Toccoa Falls College and the Stephens County Airport.
History
Toccoa was founded in 1873 as a railroad town. It was named after the Cherokee word for “beautiful”. The city was incorporated in 1905. During the Civil War, Toccoa was the site of a major battle between Union and Confederate forces. The Battle of Toccoa was fought on November 9, 1864.
In the early 20th century, Toccoa was a major center for the production of textiles. The city was home to several large mills, including the Toccoa Cotton Mill, which was the largest in the state. The mill closed in the 1950s, but the city remains a major center for the textile industry.
Geography
Toccoa is located in the foothills of the Blue Ridge Mountains in northeast Georgia. The city is situated along the Tugaloo River, which flows into Lake Hartwell. The city is located about 90 miles northeast of Atlanta and about 30 miles south of the North Carolina border.
The city has a total area of 8.3 square miles, all of which is land. The city is located at an elevation of 1,068 feet above sea level.
Economy
Toccoa’s economy is largely based on the textile industry. The city is home to several large mills, including the Toccoa Cotton Mill, which is the largest in the state. The city is also home to several other industries, including manufacturing, healthcare, and retail.
The city is home to several major employers, including Stephens County Hospital, Toccoa Cotton Mill, and the Stephens County Airport. The city is also home to several small businesses, including restaurants, shops, and other services.
Demographics
As of the 2010 census, there were 8,491 people, 3,521 households, and 2,092 families residing in the city. The population density was 1,019.3 people per square mile. The racial makeup of the city was 79.2% White, 16.2% African American, 0.3% Native American, 0.7% Asian, 0.1% Pacific Islander, 1.7% from other races, and 1.8% from two or more races. Hispanic or Latino of any race were 3.7% of the population.
The median income for a household in the city was $30,917, and the median income for a family was $37,917. The per capita income for the city was $17,845. About 17.2% of families and 20.7% of the population were below the poverty line, including 28.3% of those under age 18 and 16.2% of those age 65 or over.
Toccoa is a city with a rich history and a vibrant economy. The city is home to several large industries, including the Toccoa Cotton Mill, which is the largest in the state. The city is also home to several small businesses, including restaurants, shops, and other services. The population of the city is diverse, with a mix of races and ethnicities. The city has a median income of $30,917 and a per capita income of $17,845.
Common Questions
What is Per Capita Income in Toccoa?
Per Capita income in Toccoa is $24,608.
What is the Median Family Income in Toccoa?
Median Family Income in Toccoa is $57,675.
What is the Median Household income in Toccoa?
Median Household Income in Toccoa is $49,860.
What is Income or Wage Gap in Toccoa?
Income or Wage Gap in Toccoa is 19.1%.
Women in Toccoa earn 80.9 cents for every dollar earned by a man.
What is Family Income Deficit in Toccoa?
Family Income Deficit in Toccoa is $7,818.
Families that are below poverty line in Toccoa earn $7,818 less on average than the poverty threshold level.
What is Inequality or Gini Index in Toccoa?
Inequality or Gini Index in Toccoa is 0.43.
What is the Total Population of Toccoa?
Total Population of Toccoa is 9,055.
What is the Total Male Population of Toccoa?
Total Male Population of Toccoa is 4,149.
What is the Total Female Population of Toccoa?
Total Female Population of Toccoa is 4,906.
What is the Ratio of Males per 100 Females in Toccoa?
There are 84.57 Males per 100 Females in Toccoa.
What is the Ratio of Females per 100 Males in Toccoa?
There are 118.25 Females per 100 Males in Toccoa.
What is the Median Population Age in Toccoa?
Median Population Age in Toccoa is 42.3 Years.
What is the Average Family Size in Toccoa
Average Family Size in Toccoa is 3.1 People.
What is the Average Household Size in Toccoa
Average Household Size in Toccoa is 2.5 People.
How Large is the Labor Force in Toccoa?
There are 4,264 People in the Labor Forcein in Toccoa.
What is the Percentage of People in the Labor Force in Toccoa?
57.6% of People are in the Labor Force in Toccoa.
What is the Unemployment Rate in Toccoa?
Unemployment Rate in Toccoa is 10.3%.