Austell, GA Map & Demographics
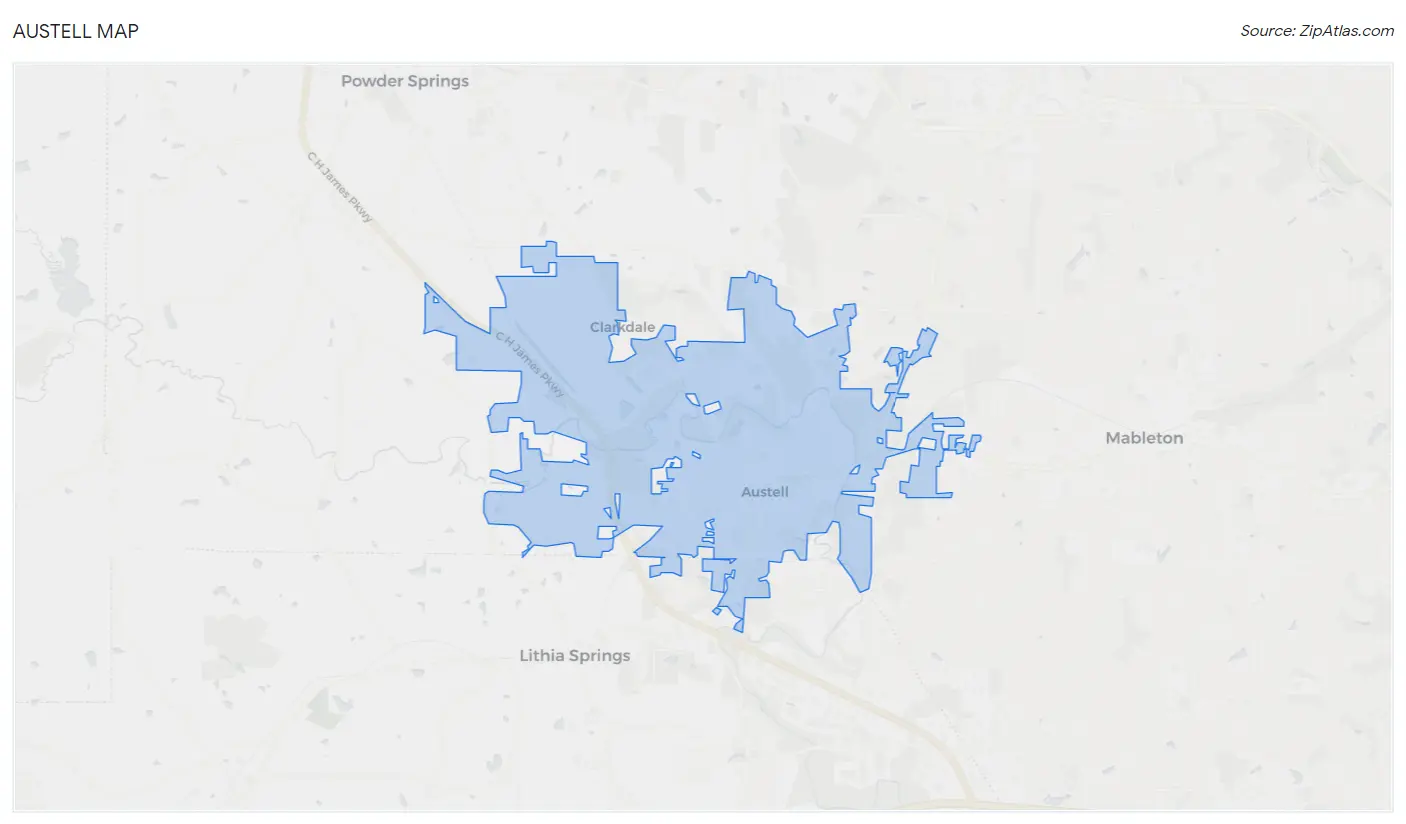
Austell Map
Austell Overview
$28,245
PER CAPITA INCOME
$61,334
AVG FAMILY INCOME
$64,071
AVG HOUSEHOLD INCOME
6.3%
WAGE / INCOME GAP [ % ]
93.7¢/ $1
WAGE / INCOME GAP [ $ ]
0.32
INEQUALITY / GINI INDEX
8,109
TOTAL POPULATION
3,589
MALE POPULATION
4,520
FEMALE POPULATION
79.40
MALES / 100 FEMALES
125.94
FEMALES / 100 MALES
33.8
MEDIAN AGE
3.3
AVG FAMILY SIZE
2.9
AVG HOUSEHOLD SIZE
4,456
LABOR FORCE [ PEOPLE ]
70.3%
PERCENT IN LABOR FORCE
5.6%
UNEMPLOYMENT RATE
Income in Austell
Income Overview in Austell
Per Capita Income in Austell is $28,245, while median incomes of families and households are $61,334 and $64,071 respectively.
| Characteristic | Number | Measure |
| Per Capita Income | 8,109 | $28,245 |
| Median Family Income | 2,129 | $61,334 |
| Mean Family Income | 2,129 | $81,480 |
| Median Household Income | 2,844 | $64,071 |
| Mean Household Income | 2,844 | $78,557 |
| Income Deficit | 2,129 | $0 |
| Wage / Income Gap (%) | 8,109 | 6.28% |
| Wage / Income Gap ($) | 8,109 | 93.72¢ per $1 |
| Gini / Inequality Index | 8,109 | 0.32 |
Earnings by Sex in Austell
Average Earnings in Austell are $41,480, $42,639 for men and $39,963 for women, a difference of 6.3%.
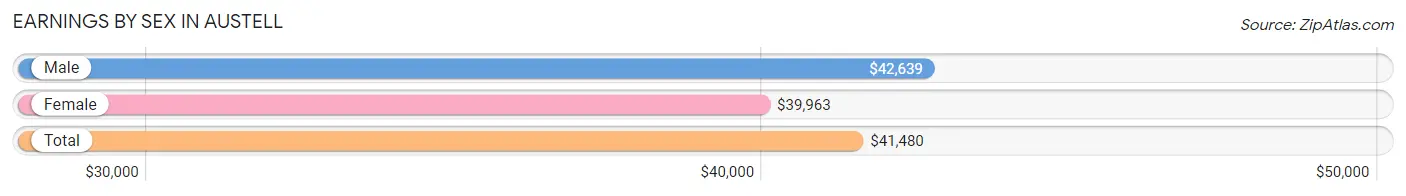
| Sex | Number | Average Earnings |
| Male | 2,158 (48.0%) | $42,639 |
| Female | 2,334 (52.0%) | $39,963 |
| Total | 4,492 (100.0%) | $41,480 |
Earnings by Sex by Income Bracket in Austell
The most common earnings brackets in Austell are $45,000 to $49,999 for men (332 | 15.4%) and $25,000 to $29,999 for women (280 | 12.0%).
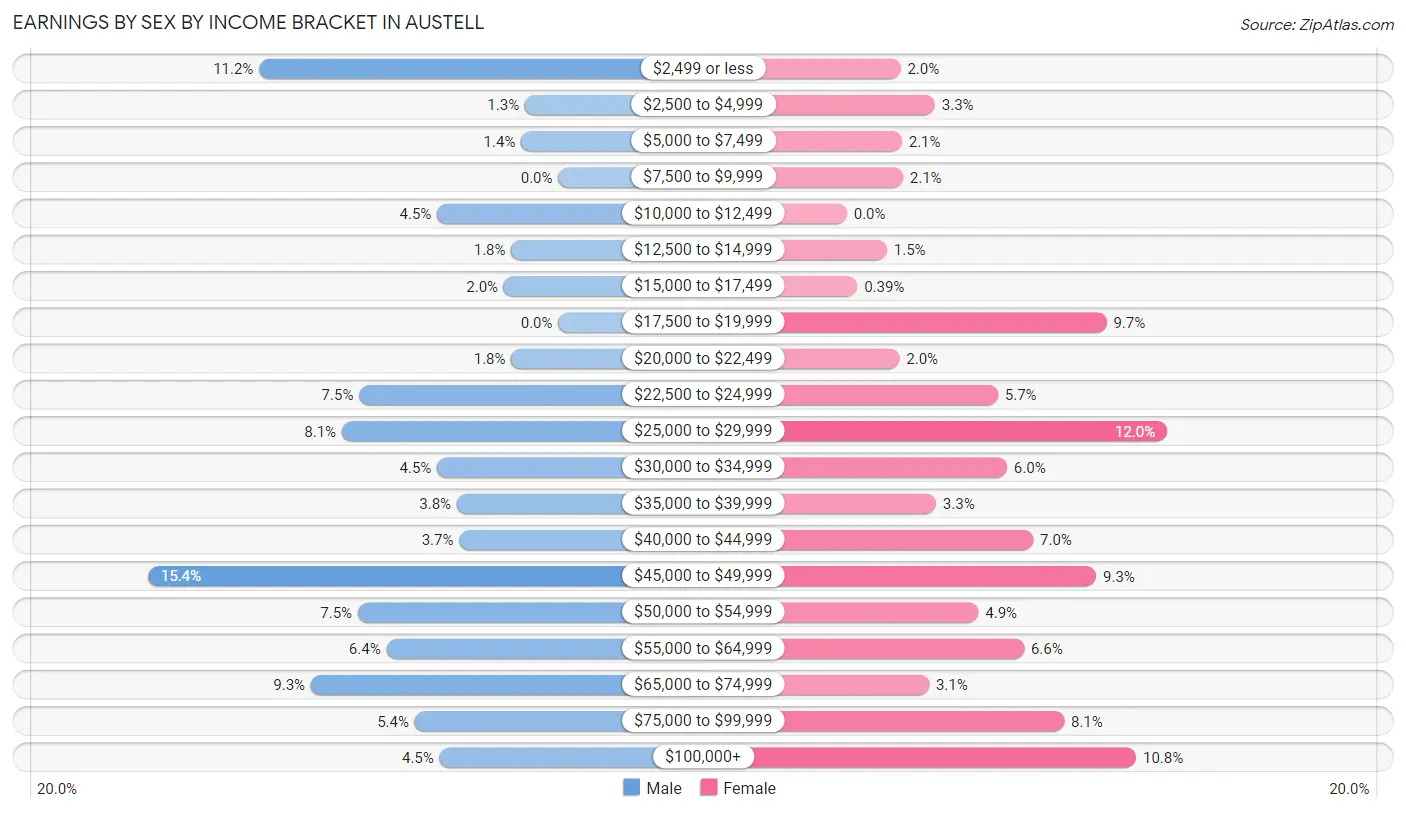
| Income | Male | Female |
| $2,499 or less | 242 (11.2%) | 47 (2.0%) |
| $2,500 to $4,999 | 27 (1.3%) | 77 (3.3%) |
| $5,000 to $7,499 | 30 (1.4%) | 48 (2.1%) |
| $7,500 to $9,999 | 0 (0.0%) | 49 (2.1%) |
| $10,000 to $12,499 | 98 (4.5%) | 0 (0.0%) |
| $12,500 to $14,999 | 38 (1.8%) | 35 (1.5%) |
| $15,000 to $17,499 | 44 (2.0%) | 9 (0.4%) |
| $17,500 to $19,999 | 0 (0.0%) | 227 (9.7%) |
| $20,000 to $22,499 | 38 (1.8%) | 46 (2.0%) |
| $22,500 to $24,999 | 161 (7.5%) | 132 (5.7%) |
| $25,000 to $29,999 | 175 (8.1%) | 280 (12.0%) |
| $30,000 to $34,999 | 98 (4.5%) | 140 (6.0%) |
| $35,000 to $39,999 | 82 (3.8%) | 78 (3.3%) |
| $40,000 to $44,999 | 80 (3.7%) | 163 (7.0%) |
| $45,000 to $49,999 | 332 (15.4%) | 218 (9.3%) |
| $50,000 to $54,999 | 162 (7.5%) | 115 (4.9%) |
| $55,000 to $64,999 | 139 (6.4%) | 155 (6.6%) |
| $65,000 to $74,999 | 200 (9.3%) | 72 (3.1%) |
| $75,000 to $99,999 | 116 (5.4%) | 190 (8.1%) |
| $100,000+ | 96 (4.4%) | 253 (10.8%) |
| Total | 2,158 (100.0%) | 2,334 (100.0%) |
Earnings by Sex by Educational Attainment in Austell
Average earnings in Austell are $47,894 for men and $41,836 for women, a difference of 12.7%. Men with an educational attainment of graduate degree enjoy the highest average annual earnings of $112,792, while those with less than high school education earn the least with $48,125. Women with an educational attainment of graduate degree earn the most with the average annual earnings of $80,737, while those with less than high school education have the smallest earnings of $26,264.
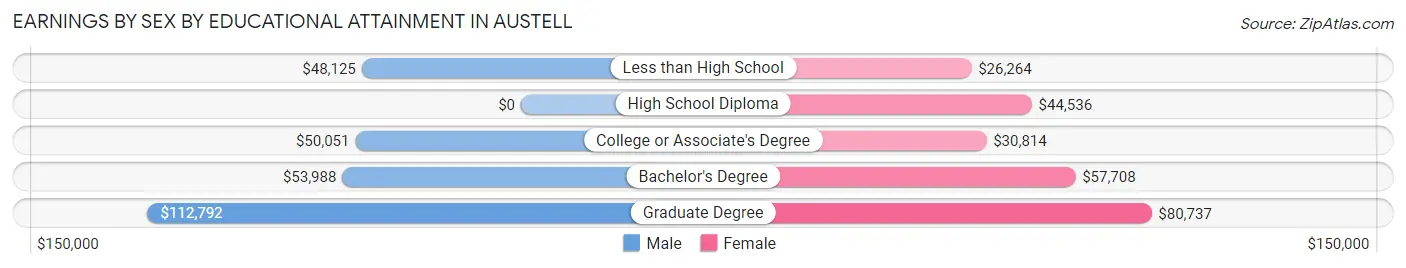
| Educational Attainment | Male Income | Female Income |
| Less than High School | $48,125 | $26,264 |
| High School Diploma | - | - |
| College or Associate's Degree | $50,051 | $30,814 |
| Bachelor's Degree | $53,988 | $57,708 |
| Graduate Degree | $112,792 | $80,737 |
| Total | $47,894 | $41,836 |
Family Income in Austell
Family Income Brackets in Austell
According to the Austell family income data, there are 581 families falling into the $50,000 to $74,999 income range, which is the most common income bracket and makes up 27.3% of all families. Conversely, the $25,000 to $34,999 income bracket is the least frequent group with only 32 families (1.5%) belonging to this category.
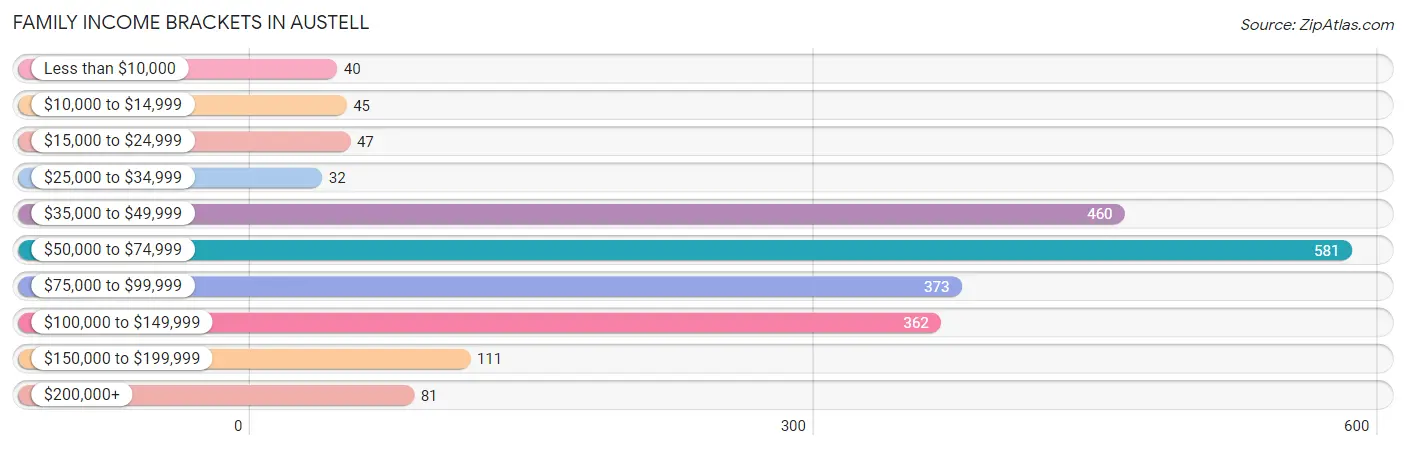
| Income Bracket | # Families | % Families |
| Less than $10,000 | 40 | 1.9% |
| $10,000 to $14,999 | 45 | 2.1% |
| $15,000 to $24,999 | 47 | 2.2% |
| $25,000 to $34,999 | 32 | 1.5% |
| $35,000 to $49,999 | 460 | 21.6% |
| $50,000 to $74,999 | 581 | 27.3% |
| $75,000 to $99,999 | 373 | 17.5% |
| $100,000 to $149,999 | 362 | 17.0% |
| $150,000 to $199,999 | 111 | 5.2% |
| $200,000+ | 81 | 3.8% |
Family Income by Famaliy Size in Austell
5-person families (238 | 11.2%) account for the highest median family income in Austell with $101,406 per family, while 2-person families (764 | 35.9%) have the highest median income of $30,963 per family member.
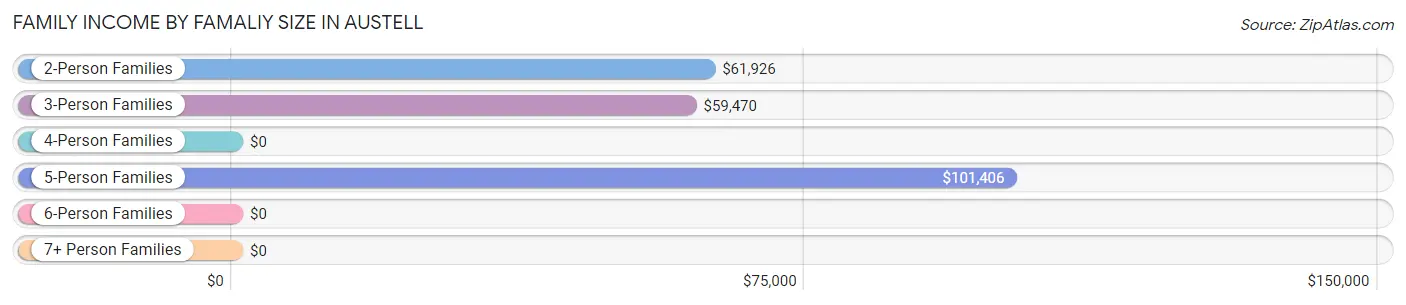
| Income Bracket | # Families | Median Income |
| 2-Person Families | 764 (35.9%) | $61,926 |
| 3-Person Families | 788 (37.0%) | $59,470 |
| 4-Person Families | 301 (14.1%) | $0 |
| 5-Person Families | 238 (11.2%) | $101,406 |
| 6-Person Families | 25 (1.2%) | $0 |
| 7+ Person Families | 13 (0.6%) | $0 |
| Total | 2,129 (100.0%) | $61,334 |
Family Income by Number of Earners in Austell
The median family income in Austell is $61,334, with families comprising 2 earners (794) having the highest median family income of $94,769, while families with 3+ earners (312) have the lowest median family income of $46,990, accounting for 37.3% and 14.6% of families, respectively.
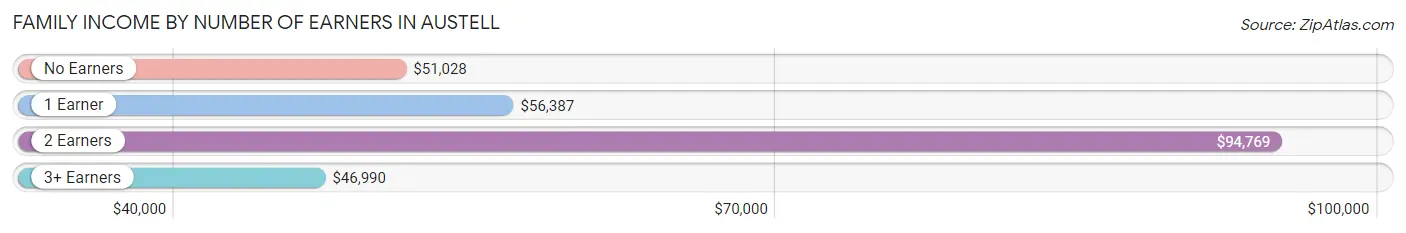
| Number of Earners | # Families | Median Income |
| No Earners | 230 (10.8%) | $51,028 |
| 1 Earner | 793 (37.2%) | $56,387 |
| 2 Earners | 794 (37.3%) | $94,769 |
| 3+ Earners | 312 (14.6%) | $46,990 |
| Total | 2,129 (100.0%) | $61,334 |
Household Income in Austell
Household Income Brackets in Austell
With 791 households falling in the category, the $50,000 to $74,999 income range is the most frequent in Austell, accounting for 27.8% of all households. In contrast, only 43 households (1.5%) fall into the $10,000 to $14,999 income bracket, making it the least populous group.
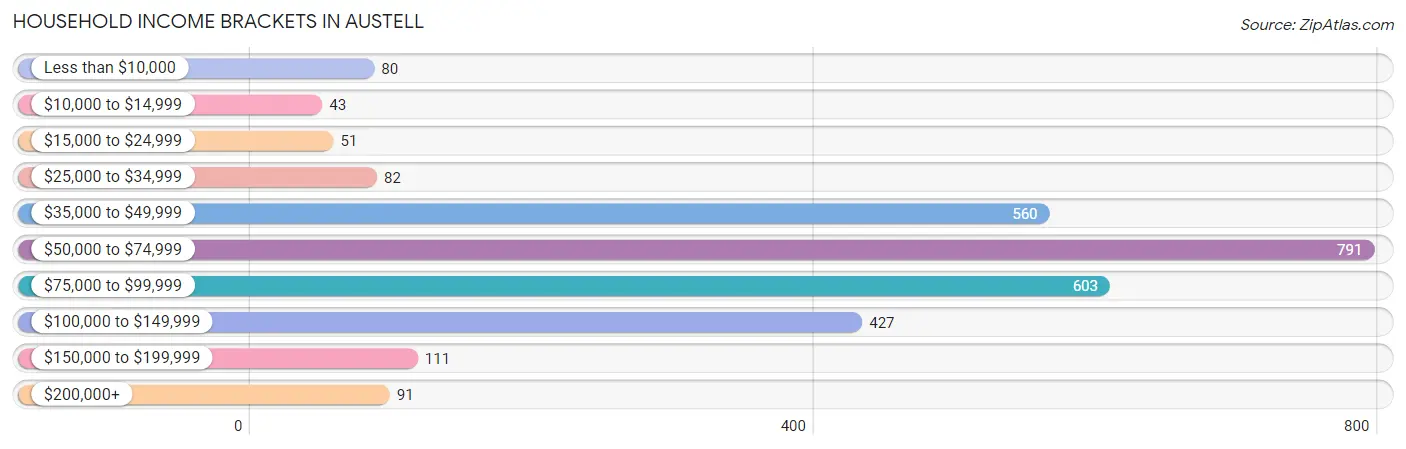
| Income Bracket | # Households | % Households |
| Less than $10,000 | 80 | 2.8% |
| $10,000 to $14,999 | 43 | 1.5% |
| $15,000 to $24,999 | 51 | 1.8% |
| $25,000 to $34,999 | 82 | 2.9% |
| $35,000 to $49,999 | 560 | 19.7% |
| $50,000 to $74,999 | 791 | 27.8% |
| $75,000 to $99,999 | 603 | 21.2% |
| $100,000 to $149,999 | 427 | 15.0% |
| $150,000 to $199,999 | 111 | 3.9% |
| $200,000+ | 91 | 3.2% |
Household Income by Householder Age in Austell
The median household income in Austell is $64,071, with the highest median household income of $93,569 found in the 15 to 24 years age bracket for the primary householder. A total of 107 households (3.8%) fall into this category. Meanwhile, the 65+ years age bracket for the primary householder has the lowest median household income of $51,090, with 493 households (17.3%) in this group.
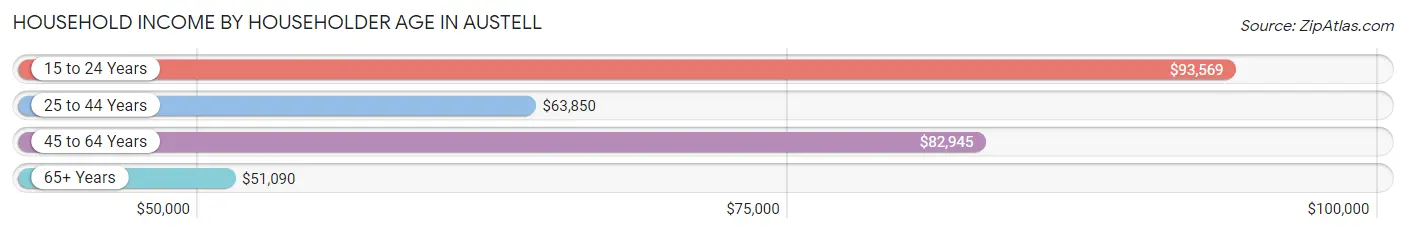
| Income Bracket | # Households | Median Income |
| 15 to 24 Years | 107 (3.8%) | $93,569 |
| 25 to 44 Years | 1,275 (44.8%) | $63,850 |
| 45 to 64 Years | 969 (34.1%) | $82,945 |
| 65+ Years | 493 (17.3%) | $51,090 |
| Total | 2,844 (100.0%) | $64,071 |
Poverty in Austell
Income Below Poverty by Sex and Age in Austell
With 5.1% poverty level for males and 10.9% for females among the residents of Austell, 5 year old males and under 5 year old females are the most vulnerable to poverty, with 29 males (30.2%) and 32 females (34.4%) in their respective age groups living below the poverty level.
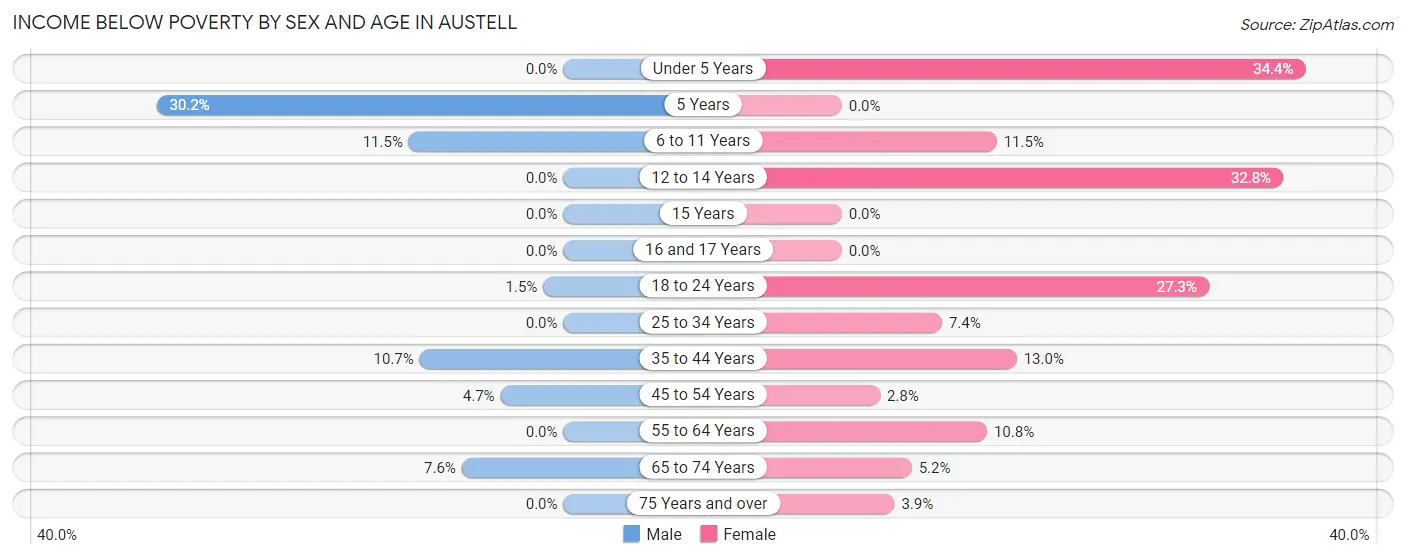
| Age Bracket | Male | Female |
| Under 5 Years | 0 (0.0%) | 32 (34.4%) |
| 5 Years | 29 (30.2%) | 0 (0.0%) |
| 6 to 11 Years | 49 (11.5%) | 46 (11.5%) |
| 12 to 14 Years | 0 (0.0%) | 93 (32.8%) |
| 15 Years | 0 (0.0%) | 0 (0.0%) |
| 16 and 17 Years | 0 (0.0%) | 0 (0.0%) |
| 18 to 24 Years | 6 (1.5%) | 121 (27.3%) |
| 25 to 34 Years | 0 (0.0%) | 55 (7.4%) |
| 35 to 44 Years | 54 (10.7%) | 60 (13.0%) |
| 45 to 54 Years | 21 (4.7%) | 31 (2.8%) |
| 55 to 64 Years | 0 (0.0%) | 40 (10.8%) |
| 65 to 74 Years | 24 (7.5%) | 11 (5.2%) |
| 75 Years and over | 0 (0.0%) | 5 (3.9%) |
| Total | 183 (5.1%) | 494 (10.9%) |
Income Above Poverty by Sex and Age in Austell
According to the poverty statistics in Austell, males aged under 5 years and females aged 5 years are the age groups that are most secure financially, with 100.0% of males and 100.0% of females in these age groups living above the poverty line.
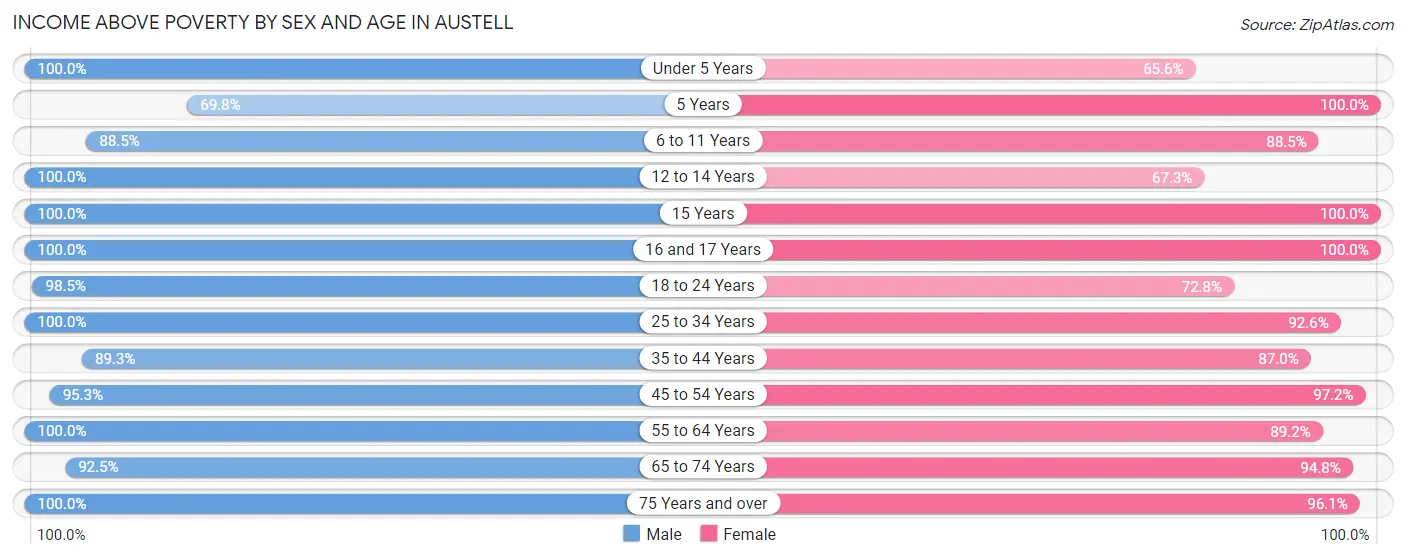
| Age Bracket | Male | Female |
| Under 5 Years | 256 (100.0%) | 61 (65.6%) |
| 5 Years | 67 (69.8%) | 82 (100.0%) |
| 6 to 11 Years | 378 (88.5%) | 354 (88.5%) |
| 12 to 14 Years | 40 (100.0%) | 191 (67.2%) |
| 15 Years | 28 (100.0%) | 64 (100.0%) |
| 16 and 17 Years | 239 (100.0%) | 148 (100.0%) |
| 18 to 24 Years | 395 (98.5%) | 323 (72.8%) |
| 25 to 34 Years | 473 (100.0%) | 684 (92.6%) |
| 35 to 44 Years | 452 (89.3%) | 402 (87.0%) |
| 45 to 54 Years | 429 (95.3%) | 1,062 (97.2%) |
| 55 to 64 Years | 294 (100.0%) | 331 (89.2%) |
| 65 to 74 Years | 294 (92.4%) | 201 (94.8%) |
| 75 Years and over | 61 (100.0%) | 123 (96.1%) |
| Total | 3,406 (94.9%) | 4,026 (89.1%) |
Income Below Poverty Among Married-Couple Families in Austell
The poverty statistics for married-couple families in Austell show that 1.8% or 18 of the total 1,008 families live below the poverty line. Families with 1 or 2 children have the highest poverty rate of 3.5%, comprising of 6 families. On the other hand, families with 3 or 4 children have the lowest poverty rate of 0.0%, which includes 0 families.
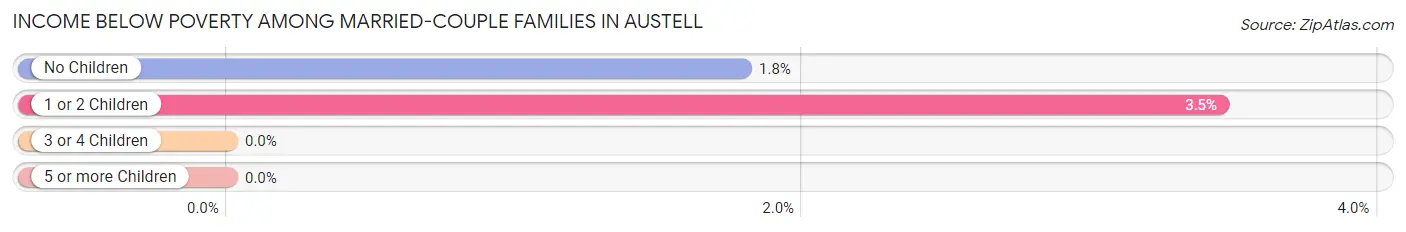
| Children | Above Poverty | Below Poverty |
| No Children | 659 (98.2%) | 12 (1.8%) |
| 1 or 2 Children | 168 (96.6%) | 6 (3.5%) |
| 3 or 4 Children | 163 (100.0%) | 0 (0.0%) |
| 5 or more Children | 0 (0.0%) | 0 (0.0%) |
| Total | 990 (98.2%) | 18 (1.8%) |
Income Below Poverty Among Single-Parent Households in Austell
According to the poverty data in Austell, 8.6% or 16 single-father households and 10.5% or 98 single-mother households are living below the poverty line. Among single-father households, those with no children have the highest poverty rate, with 16 households (14.3%) experiencing poverty. Likewise, among single-mother households, those with 3 or 4 children have the highest poverty rate, with 44 households (100.0%) falling below the poverty line.
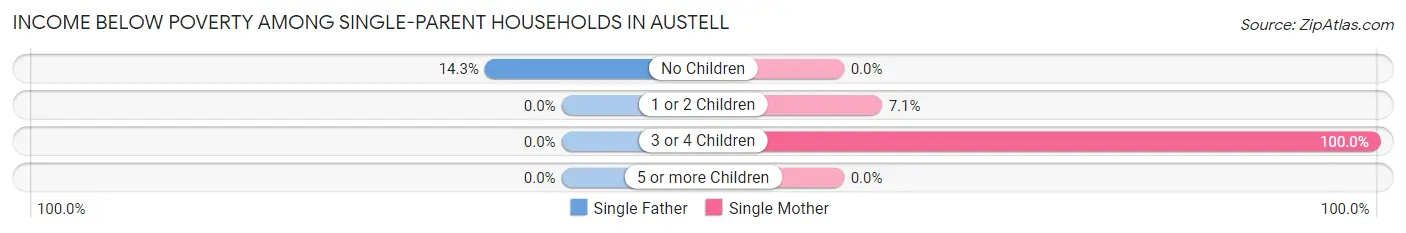
| Children | Single Father | Single Mother |
| No Children | 16 (14.3%) | 0 (0.0%) |
| 1 or 2 Children | 0 (0.0%) | 54 (7.1%) |
| 3 or 4 Children | 0 (0.0%) | 44 (100.0%) |
| 5 or more Children | 0 (0.0%) | 0 (0.0%) |
| Total | 16 (8.6%) | 98 (10.5%) |
Income Below Poverty Among Married-Couple vs Single-Parent Households in Austell
The poverty data for Austell shows that 18 of the married-couple family households (1.8%) and 114 of the single-parent households (10.2%) are living below the poverty level. Within the married-couple family households, those with 1 or 2 children have the highest poverty rate, with 6 households (3.5%) falling below the poverty line. Among the single-parent households, those with 3 or 4 children have the highest poverty rate, with 44 household (100.0%) living below poverty.
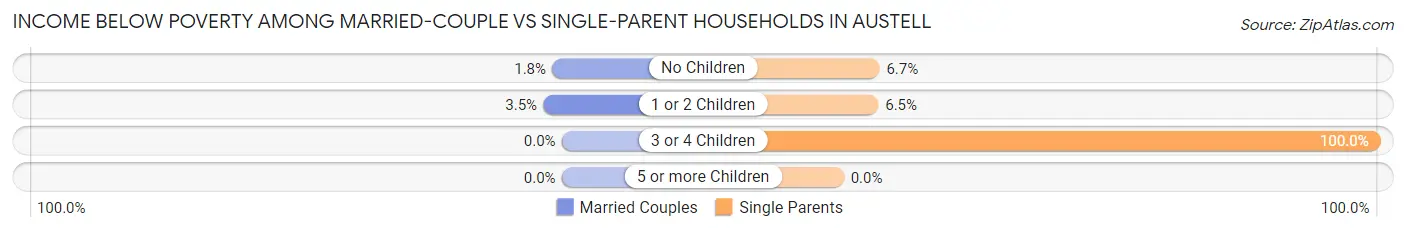
| Children | Married-Couple Families | Single-Parent Households |
| No Children | 12 (1.8%) | 16 (6.7%) |
| 1 or 2 Children | 6 (3.5%) | 54 (6.5%) |
| 3 or 4 Children | 0 (0.0%) | 44 (100.0%) |
| 5 or more Children | 0 (0.0%) | 0 (0.0%) |
| Total | 18 (1.8%) | 114 (10.2%) |
Race in Austell
The most populous races in Austell are Black / African American (5,103 | 62.9%), White / Caucasian (2,330 | 28.7%), and Hispanic or Latino (565 | 7.0%).
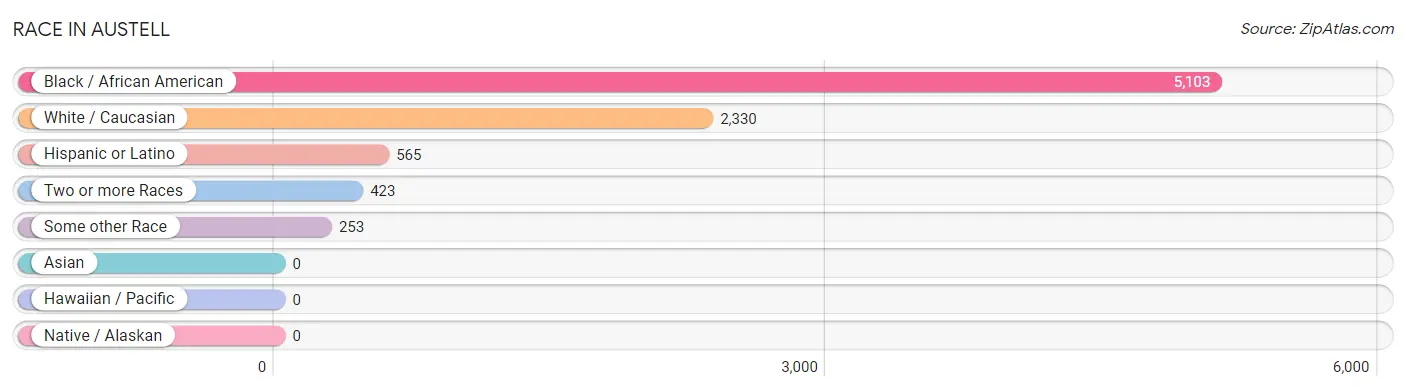
| Race | # Population | % Population |
| Asian | 0 | 0.0% |
| Black / African American | 5,103 | 62.9% |
| Hawaiian / Pacific | 0 | 0.0% |
| Hispanic or Latino | 565 | 7.0% |
| Native / Alaskan | 0 | 0.0% |
| White / Caucasian | 2,330 | 28.7% |
| Two or more Races | 423 | 5.2% |
| Some other Race | 253 | 3.1% |
| Total | 8,109 | 100.0% |
Ancestry in Austell
The most populous ancestries reported in Austell are Subsaharan African (585 | 7.2%), Mexican (431 | 5.3%), American (368 | 4.5%), Irish (331 | 4.1%), and African (284 | 3.5%), together accounting for 24.6% of all Austell residents.
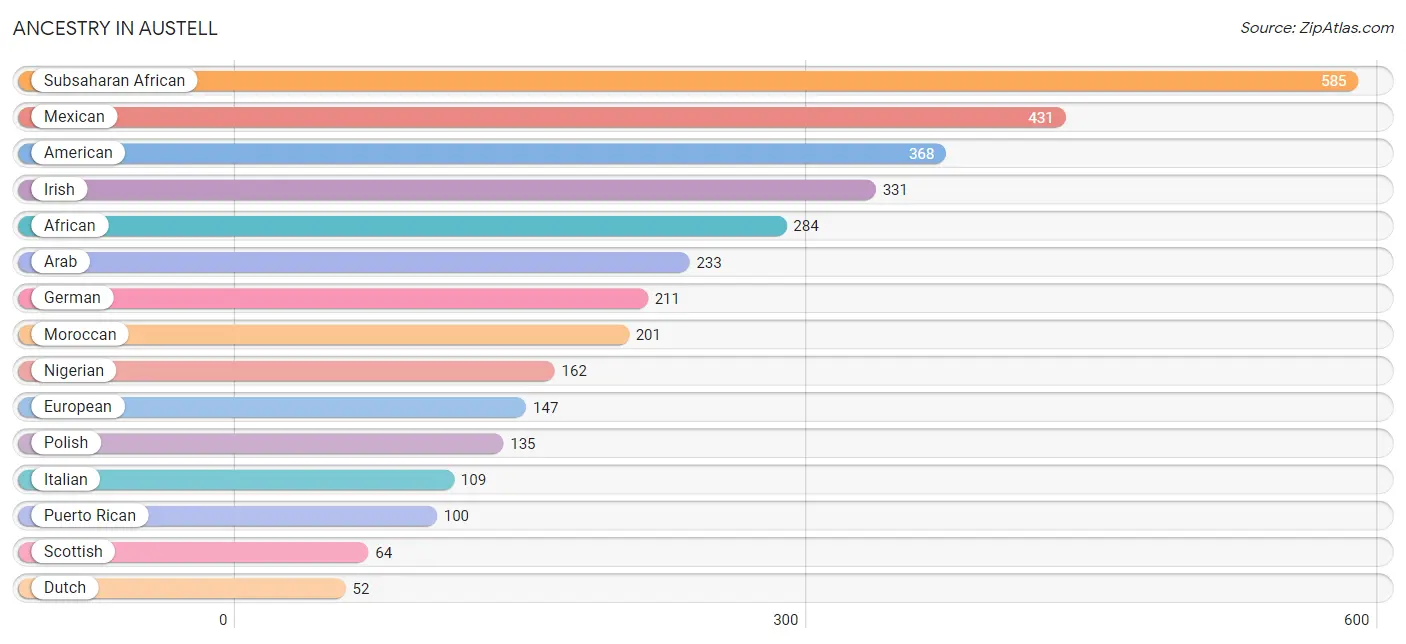
| Ancestry | # Population | % Population |
| African | 284 | 3.5% |
| American | 368 | 4.5% |
| Arab | 233 | 2.9% |
| Argentinean | 26 | 0.3% |
| Bermudan | 16 | 0.2% |
| British | 10 | 0.1% |
| British West Indian | 11 | 0.1% |
| Danish | 27 | 0.3% |
| Dutch | 52 | 0.6% |
| Egyptian | 19 | 0.2% |
| English | 29 | 0.4% |
| European | 147 | 1.8% |
| German | 211 | 2.6% |
| Greek | 34 | 0.4% |
| Haitian | 26 | 0.3% |
| Hungarian | 12 | 0.2% |
| Irish | 331 | 4.1% |
| Italian | 109 | 1.3% |
| Jamaican | 43 | 0.5% |
| Mexican | 431 | 5.3% |
| Moroccan | 201 | 2.5% |
| Nigerian | 162 | 2.0% |
| Polish | 135 | 1.7% |
| Puerto Rican | 100 | 1.2% |
| Scottish | 64 | 0.8% |
| Serbian | 22 | 0.3% |
| Sioux | 8 | 0.1% |
| South American | 26 | 0.3% |
| Spaniard | 8 | 0.1% |
| Subsaharan African | 585 | 7.2% |
| Swedish | 1 | 0.0% |
| Trinidadian and Tobagonian | 8 | 0.1% |
| West Indian | 28 | 0.4% | View All 33 Rows |
Immigrants in Austell
The most numerous immigrant groups reported in Austell came from Africa (313 | 3.9%), Western Africa (273 | 3.4%), Latin America (216 | 2.7%), Central America (171 | 2.1%), and Nigeria (158 | 1.9%), together accounting for 13.9% of all Austell residents.
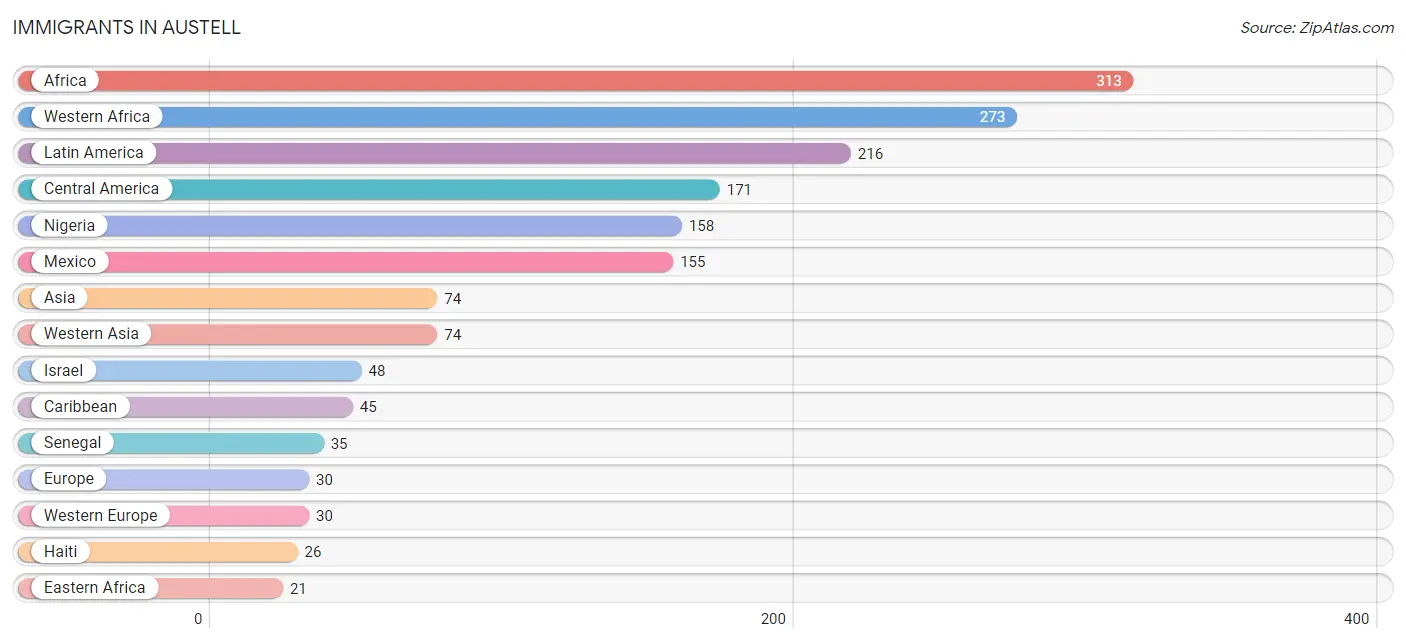
| Immigration Origin | # Population | % Population |
| Africa | 313 | 3.9% |
| Asia | 74 | 0.9% |
| Caribbean | 45 | 0.5% |
| Central America | 171 | 2.1% |
| Eastern Africa | 21 | 0.3% |
| Egypt | 19 | 0.2% |
| Europe | 30 | 0.4% |
| Germany | 10 | 0.1% |
| Guatemala | 16 | 0.2% |
| Haiti | 26 | 0.3% |
| Israel | 48 | 0.6% |
| Jordan | 13 | 0.2% |
| Kenya | 21 | 0.3% |
| Latin America | 216 | 2.7% |
| Lebanon | 13 | 0.2% |
| Mexico | 155 | 1.9% |
| Netherlands | 20 | 0.3% |
| Nigeria | 158 | 1.9% |
| Northern Africa | 19 | 0.2% |
| Senegal | 35 | 0.4% |
| Trinidad and Tobago | 8 | 0.1% |
| Western Africa | 273 | 3.4% |
| Western Asia | 74 | 0.9% |
| Western Europe | 30 | 0.4% | View All 24 Rows |
Sex and Age in Austell
Sex and Age in Austell
The most populous age groups in Austell are 15 to 19 Years (413 | 11.5%) for men and 45 to 49 Years (978 | 21.6%) for women.
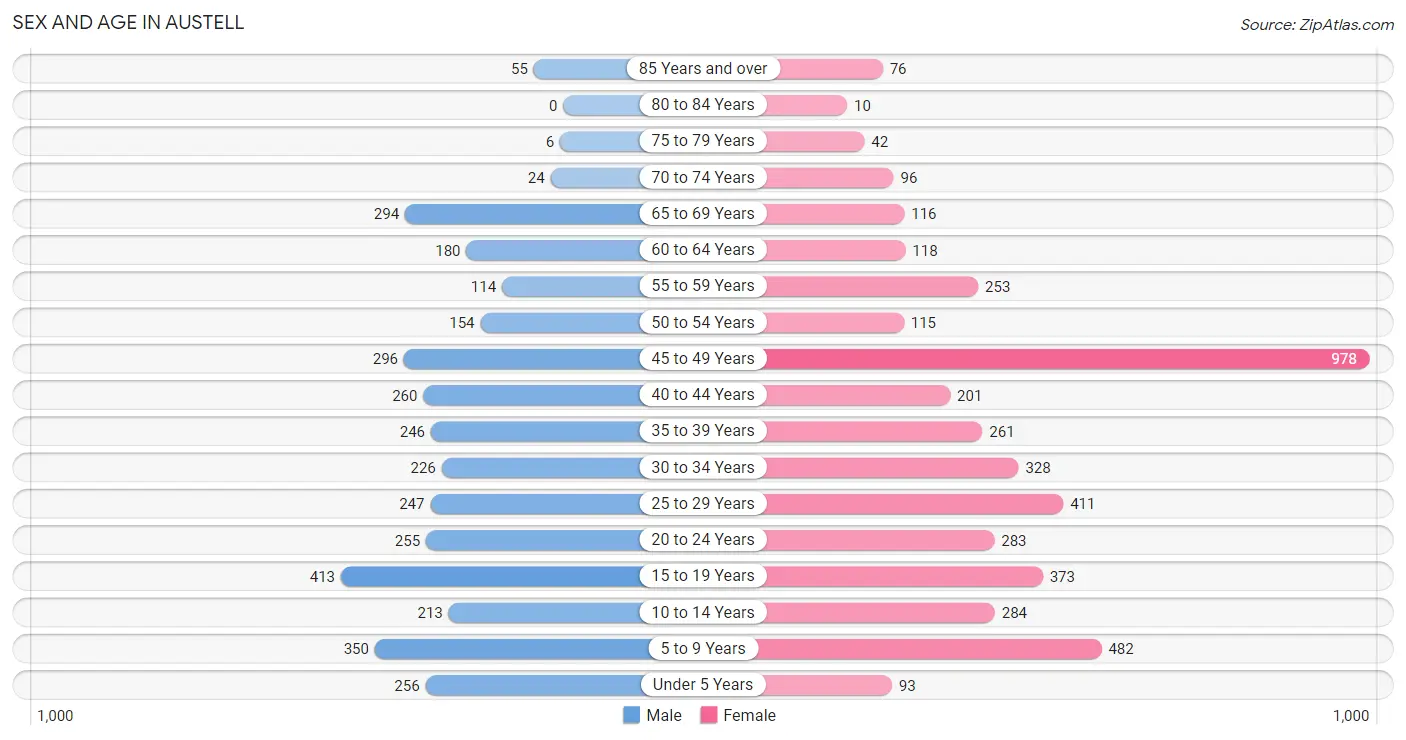
| Age Bracket | Male | Female |
| Under 5 Years | 256 (7.1%) | 93 (2.1%) |
| 5 to 9 Years | 350 (9.8%) | 482 (10.7%) |
| 10 to 14 Years | 213 (5.9%) | 284 (6.3%) |
| 15 to 19 Years | 413 (11.5%) | 373 (8.3%) |
| 20 to 24 Years | 255 (7.1%) | 283 (6.3%) |
| 25 to 29 Years | 247 (6.9%) | 411 (9.1%) |
| 30 to 34 Years | 226 (6.3%) | 328 (7.3%) |
| 35 to 39 Years | 246 (6.9%) | 261 (5.8%) |
| 40 to 44 Years | 260 (7.2%) | 201 (4.4%) |
| 45 to 49 Years | 296 (8.3%) | 978 (21.6%) |
| 50 to 54 Years | 154 (4.3%) | 115 (2.5%) |
| 55 to 59 Years | 114 (3.2%) | 253 (5.6%) |
| 60 to 64 Years | 180 (5.0%) | 118 (2.6%) |
| 65 to 69 Years | 294 (8.2%) | 116 (2.6%) |
| 70 to 74 Years | 24 (0.7%) | 96 (2.1%) |
| 75 to 79 Years | 6 (0.2%) | 42 (0.9%) |
| 80 to 84 Years | 0 (0.0%) | 10 (0.2%) |
| 85 Years and over | 55 (1.5%) | 76 (1.7%) |
| Total | 3,589 (100.0%) | 4,520 (100.0%) |
Families and Households in Austell
Median Family Size in Austell
The median family size in Austell is 3.26 persons per family, with single female/mother families (934 | 43.9%) accounting for the largest median family size of 3.45 persons per family. On the other hand, single male/father families (187 | 8.8%) represent the smallest median family size with 2.32 persons per family.
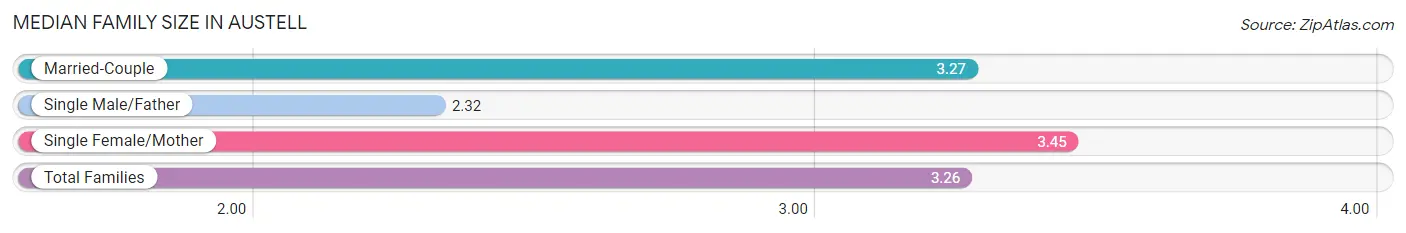
| Family Type | # Families | Family Size |
| Married-Couple | 1,008 (47.3%) | 3.27 |
| Single Male/Father | 187 (8.8%) | 2.32 |
| Single Female/Mother | 934 (43.9%) | 3.45 |
| Total Families | 2,129 (100.0%) | 3.26 |
Median Household Size in Austell
The median household size in Austell is 2.85 persons per household, with single female/mother households (934 | 32.8%) accounting for the largest median household size of 3.54 persons per household. non-family households (715 | 25.1%) represent the smallest median household size with 1.34 persons per household.
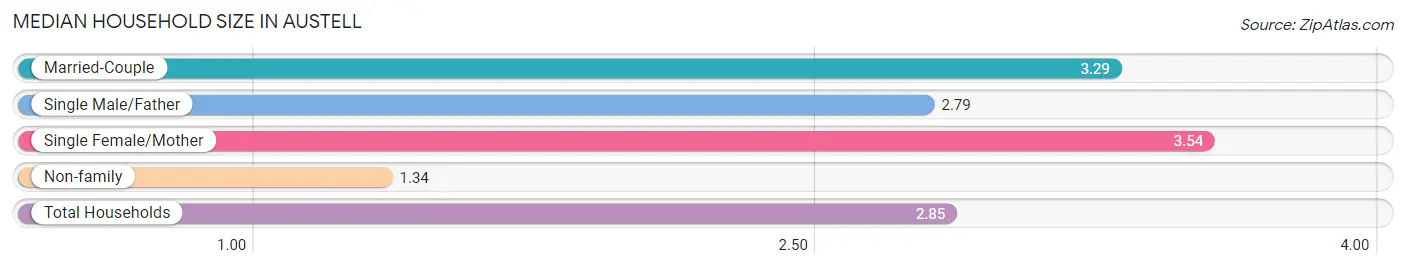
| Household Type | # Households | Household Size |
| Married-Couple | 1,008 (35.4%) | 3.29 |
| Single Male/Father | 187 (6.6%) | 2.79 |
| Single Female/Mother | 934 (32.8%) | 3.54 |
| Non-family | 715 (25.1%) | 1.34 |
| Total Households | 2,844 (100.0%) | 2.85 |
Household Size by Marriage Status in Austell
Out of a total of 2,844 households in Austell, 2,129 (74.9%) are family households, while 715 (25.1%) are nonfamily households. The most numerous type of family households are 2-person households, comprising 714, and the most common type of nonfamily households are 1-person households, comprising 465.
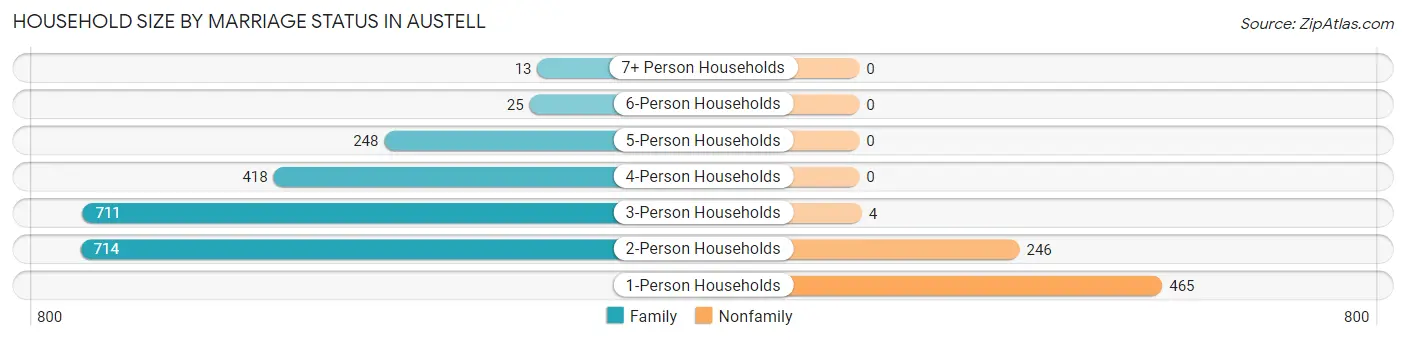
| Household Size | Family Households | Nonfamily Households |
| 1-Person Households | - | 465 (16.4%) |
| 2-Person Households | 714 (25.1%) | 246 (8.6%) |
| 3-Person Households | 711 (25.0%) | 4 (0.1%) |
| 4-Person Households | 418 (14.7%) | 0 (0.0%) |
| 5-Person Households | 248 (8.7%) | 0 (0.0%) |
| 6-Person Households | 25 (0.9%) | 0 (0.0%) |
| 7+ Person Households | 13 (0.5%) | 0 (0.0%) |
| Total | 2,129 (74.9%) | 715 (25.1%) |
Female Fertility in Austell
Fertility by Age in Austell
Average fertility rate in Austell is 7.0 births per 1,000 women. Women in the age bracket of 35 to 50 years have the highest fertility rate with 12.0 births per 1,000 women. Women in the age bracket of 35 to 50 years acount for 80.9% of all women with births.
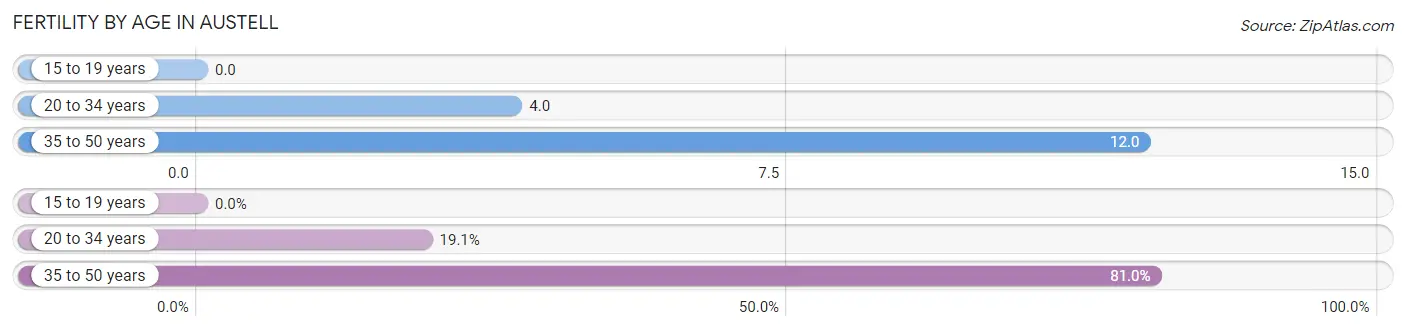
| Age Bracket | Women with Births | Births / 1,000 Women |
| 15 to 19 years | 0 (0.0%) | 0.0 |
| 20 to 34 years | 4 (19.1%) | 4.0 |
| 35 to 50 years | 17 (80.9%) | 12.0 |
| Total | 21 (100.0%) | 7.0 |
Fertility by Age by Marriage Status in Austell
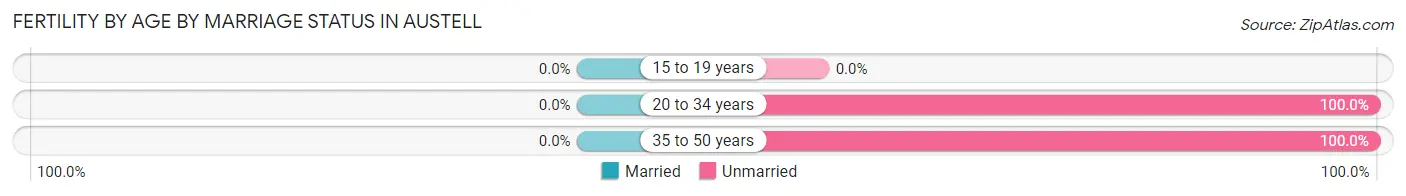
| Age Bracket | Married | Unmarried |
| 15 to 19 years | 0 (0.0%) | 0 (0.0%) |
| 20 to 34 years | 0 (0.0%) | 4 (100.0%) |
| 35 to 50 years | 0 (0.0%) | 17 (100.0%) |
| Total | 0 (0.0%) | 21 (100.0%) |
Fertility by Education in Austell
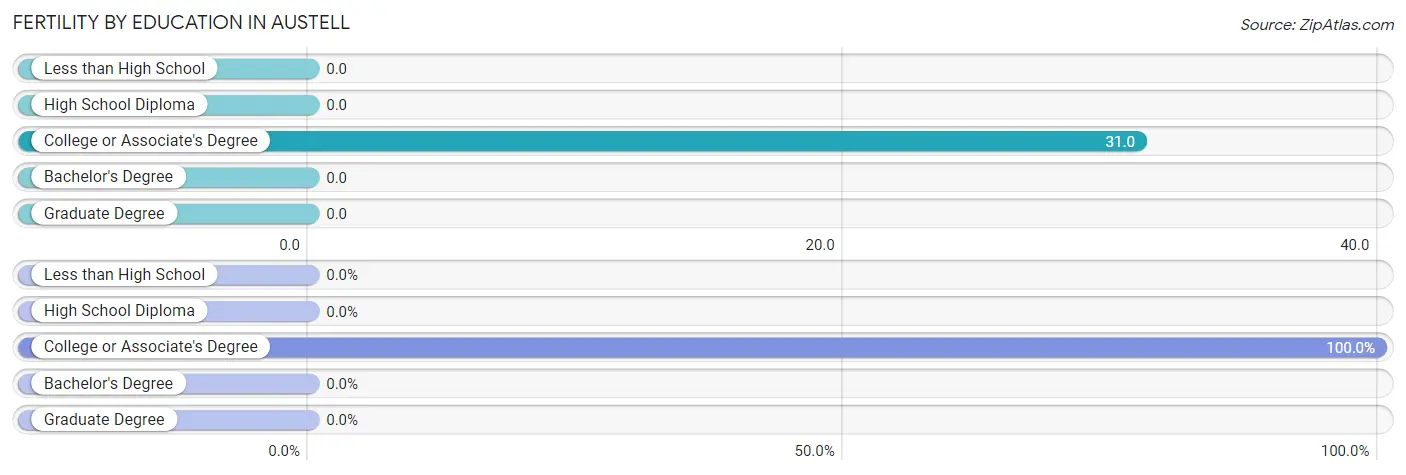
| Educational Attainment | Women with Births | Births / 1,000 Women |
| Less than High School | 0 (0.0%) | 0.0 |
| High School Diploma | 0 (0.0%) | 0.0 |
| College or Associate's Degree | 21 (100.0%) | 31.0 |
| Bachelor's Degree | 0 (0.0%) | 0.0 |
| Graduate Degree | 0 (0.0%) | 0.0 |
| Total | 21 (100.0%) | 7.0 |
Fertility by Education by Marriage Status in Austell
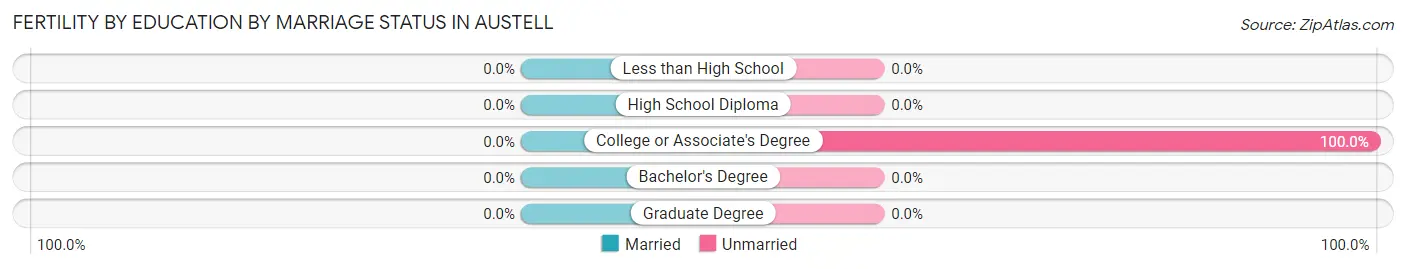
| Educational Attainment | Married | Unmarried |
| Less than High School | 0 (0.0%) | 0 (0.0%) |
| High School Diploma | 0 (0.0%) | 0 (0.0%) |
| College or Associate's Degree | 0 (0.0%) | 21 (100.0%) |
| Bachelor's Degree | 0 (0.0%) | 0 (0.0%) |
| Graduate Degree | 0 (0.0%) | 0 (0.0%) |
| Total | 0 (0.0%) | 21 (100.0%) |
Employment Characteristics in Austell
Employment by Class of Employer in Austell
Among the 3,918 employed individuals in Austell, private company employees (3,149 | 80.4%), not-for-profit organizations (193 | 4.9%), and self-employed (incorporated) (160 | 4.1%) make up the most common classes of employment.
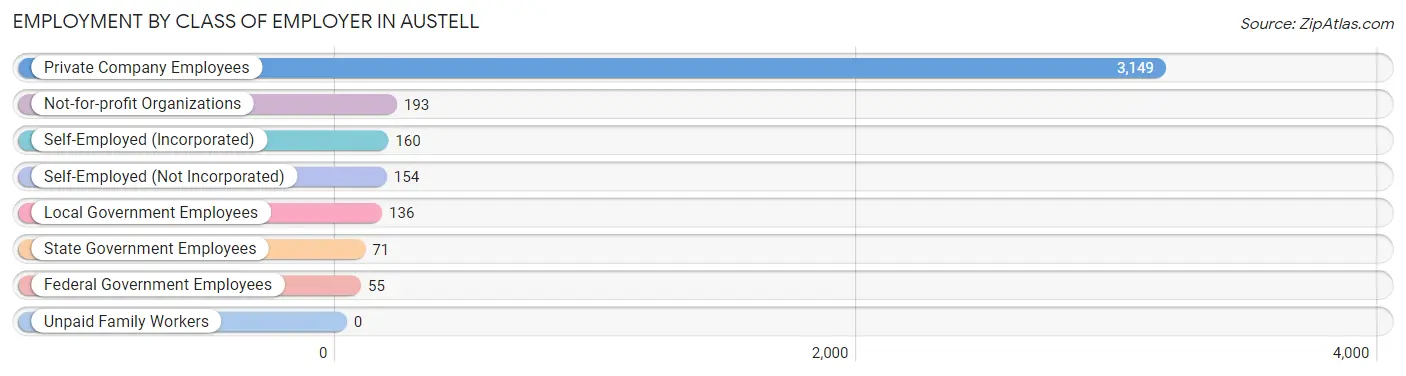
| Employer Class | # Employees | % Employees |
| Private Company Employees | 3,149 | 80.4% |
| Self-Employed (Incorporated) | 160 | 4.1% |
| Self-Employed (Not Incorporated) | 154 | 3.9% |
| Not-for-profit Organizations | 193 | 4.9% |
| Local Government Employees | 136 | 3.5% |
| State Government Employees | 71 | 1.8% |
| Federal Government Employees | 55 | 1.4% |
| Unpaid Family Workers | 0 | 0.0% |
| Total | 3,918 | 100.0% |
Employment Status by Age in Austell
According to the labor force statistics for Austell, out of the total population over 16 years of age (6,339), 70.3% or 4,456 individuals are in the labor force, with 5.6% or 250 of them unemployed. The age group with the highest labor force participation rate is 35 to 44 years, with 97.0% or 939 individuals in the labor force. Within the labor force, the 25 to 29 years age range has the highest percentage of unemployed individuals, with 24.6% or 155 of them being unemployed.
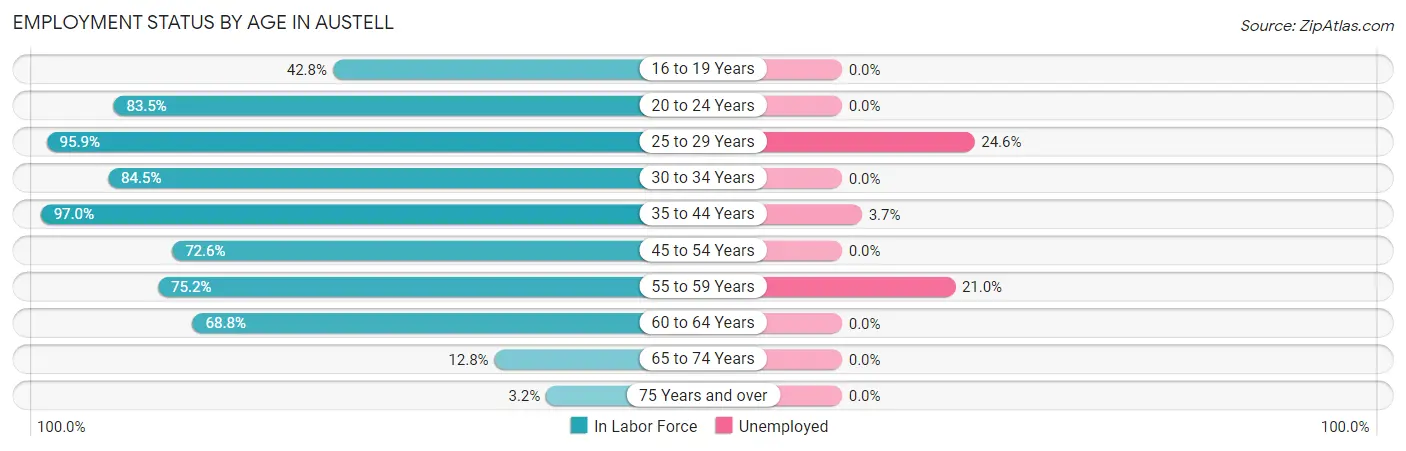
| Age Bracket | In Labor Force | Unemployed |
| 16 to 19 Years | 297 (42.8%) | 0 (0.0%) |
| 20 to 24 Years | 449 (83.5%) | 0 (0.0%) |
| 25 to 29 Years | 631 (95.9%) | 155 (24.6%) |
| 30 to 34 Years | 468 (84.5%) | 0 (0.0%) |
| 35 to 44 Years | 939 (97.0%) | 35 (3.7%) |
| 45 to 54 Years | 1,120 (72.6%) | 0 (0.0%) |
| 55 to 59 Years | 276 (75.2%) | 58 (21.0%) |
| 60 to 64 Years | 205 (68.8%) | 0 (0.0%) |
| 65 to 74 Years | 68 (12.8%) | 0 (0.0%) |
| 75 Years and over | 6 (3.2%) | 0 (0.0%) |
| Total | 4,456 (70.3%) | 250 (5.6%) |
Employment Status by Educational Attainment in Austell
According to labor force statistics for Austell, 82.9% of individuals (3,638) out of the total population between 25 and 64 years of age (4,388) are in the labor force, with 6.8% or 247 of them being unemployed. The group with the highest labor force participation rate are those with the educational attainment of bachelor's degree or higher, with 92.7% or 991 individuals in the labor force. Within the labor force, individuals with college / associate degree education have the highest percentage of unemployment, with 15.8% or 163 of them being unemployed.
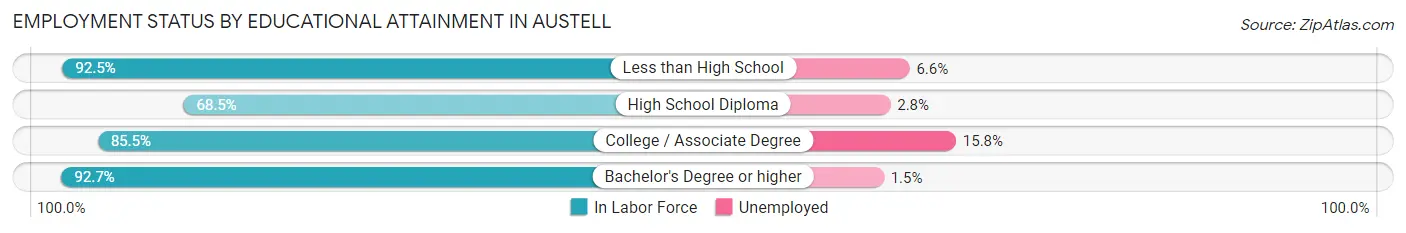
| Educational Attainment | In Labor Force | Unemployed |
| Less than High School | 655 (92.5%) | 47 (6.6%) |
| High School Diploma | 964 (68.5%) | 39 (2.8%) |
| College / Associate Degree | 1,029 (85.5%) | 190 (15.8%) |
| Bachelor's Degree or higher | 991 (92.7%) | 16 (1.5%) |
| Total | 3,638 (82.9%) | 298 (6.8%) |
Employment Occupations by Sex in Austell
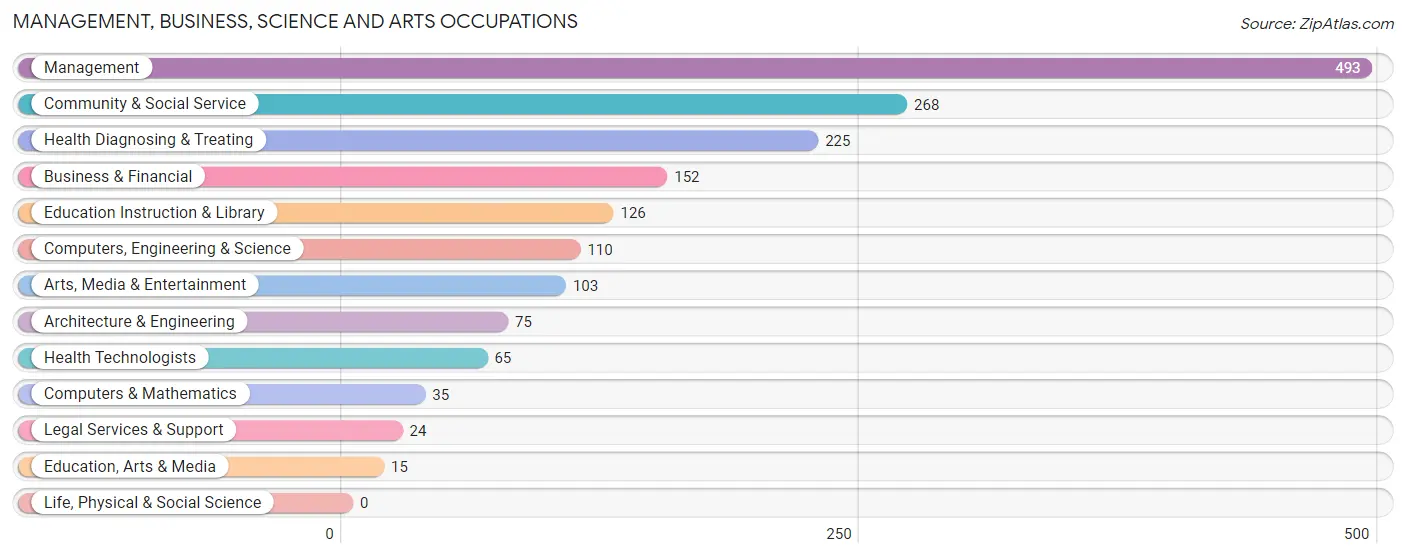
Management, Business, Science and Arts Occupations
The most common Management, Business, Science and Arts occupations in Austell are Management (493 | 11.7%), Community & Social Service (268 | 6.4%), Health Diagnosing & Treating (225 | 5.3%), Business & Financial (152 | 3.6%), and Education Instruction & Library (126 | 3.0%).
Management, Business, Science and Arts Occupations by Sex
Within the Management, Business, Science and Arts occupations in Austell, the most male-oriented occupations are Education, Arts & Media (100.0%), Education Instruction & Library (66.7%), and Community & Social Service (57.1%), while the most female-oriented occupations are Computers & Mathematics (100.0%), Legal Services & Support (100.0%), and Health Technologists (100.0%).
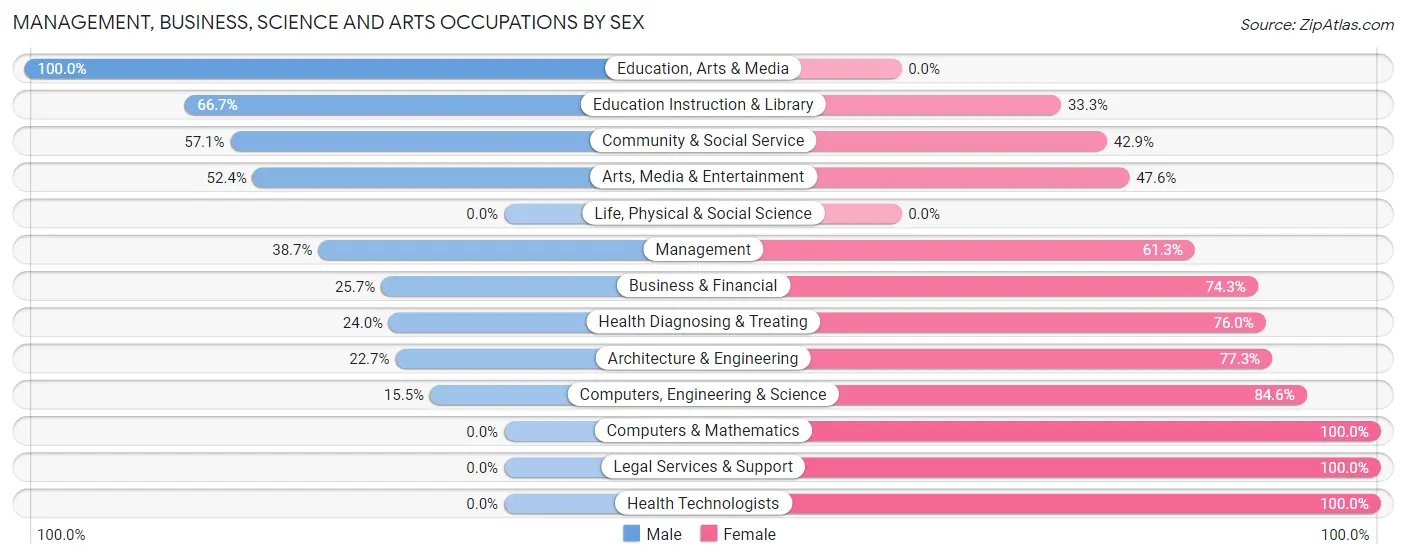
| Occupation | Male | Female |
| Management | 191 (38.7%) | 302 (61.3%) |
| Business & Financial | 39 (25.7%) | 113 (74.3%) |
| Computers, Engineering & Science | 17 (15.4%) | 93 (84.6%) |
| Computers & Mathematics | 0 (0.0%) | 35 (100.0%) |
| Architecture & Engineering | 17 (22.7%) | 58 (77.3%) |
| Life, Physical & Social Science | 0 (0.0%) | 0 (0.0%) |
| Community & Social Service | 153 (57.1%) | 115 (42.9%) |
| Education, Arts & Media | 15 (100.0%) | 0 (0.0%) |
| Legal Services & Support | 0 (0.0%) | 24 (100.0%) |
| Education Instruction & Library | 84 (66.7%) | 42 (33.3%) |
| Arts, Media & Entertainment | 54 (52.4%) | 49 (47.6%) |
| Health Diagnosing & Treating | 54 (24.0%) | 171 (76.0%) |
| Health Technologists | 0 (0.0%) | 65 (100.0%) |
| Total (Category) | 454 (36.4%) | 794 (63.6%) |
| Total (Overall) | 2,090 (49.6%) | 2,121 (50.4%) |
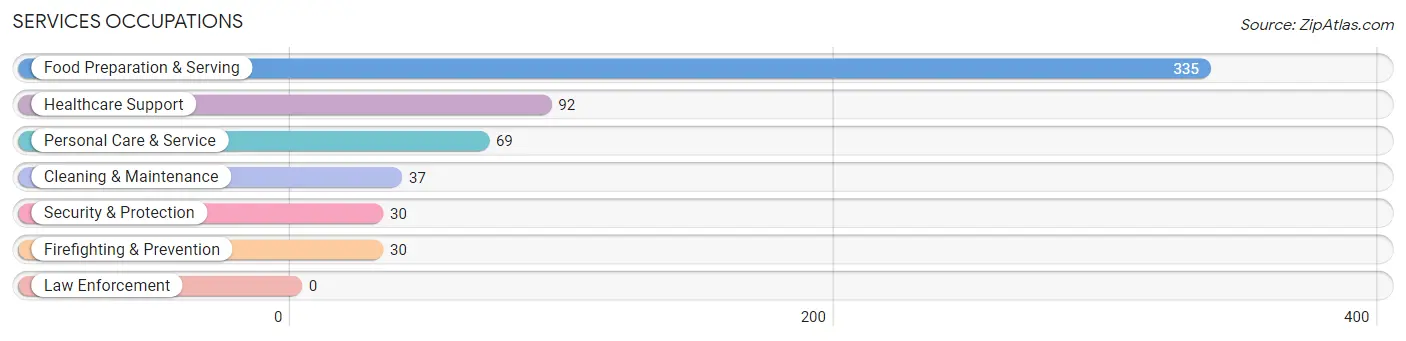
Services Occupations
The most common Services occupations in Austell are Food Preparation & Serving (335 | 8.0%), Healthcare Support (92 | 2.2%), Personal Care & Service (69 | 1.6%), Cleaning & Maintenance (37 | 0.9%), and Security & Protection (30 | 0.7%).
Services Occupations by Sex
Within the Services occupations in Austell, the most male-oriented occupations are Security & Protection (100.0%), Firefighting & Prevention (100.0%), and Food Preparation & Serving (86.6%), while the most female-oriented occupations are Healthcare Support (100.0%), Cleaning & Maintenance (24.3%), and Personal Care & Service (23.2%).
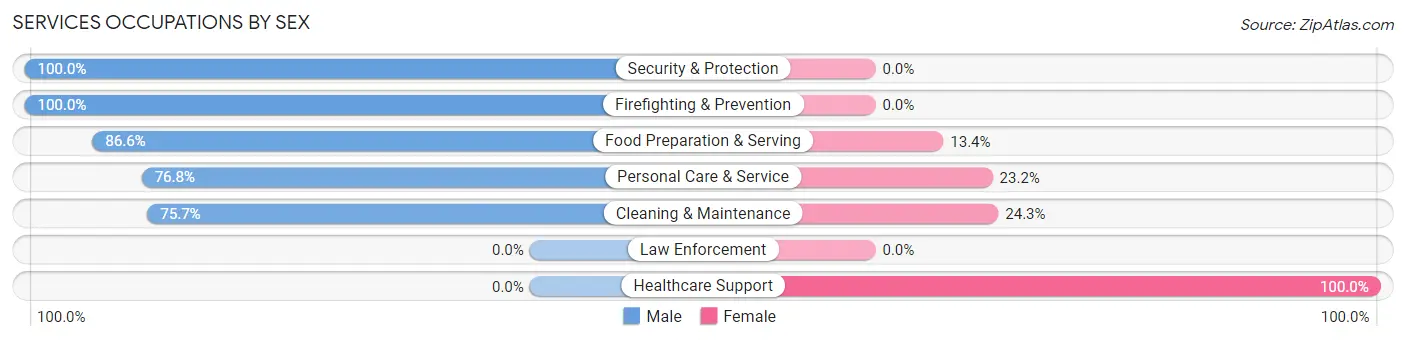
| Occupation | Male | Female |
| Healthcare Support | 0 (0.0%) | 92 (100.0%) |
| Security & Protection | 30 (100.0%) | 0 (0.0%) |
| Firefighting & Prevention | 30 (100.0%) | 0 (0.0%) |
| Law Enforcement | 0 (0.0%) | 0 (0.0%) |
| Food Preparation & Serving | 290 (86.6%) | 45 (13.4%) |
| Cleaning & Maintenance | 28 (75.7%) | 9 (24.3%) |
| Personal Care & Service | 53 (76.8%) | 16 (23.2%) |
| Total (Category) | 401 (71.2%) | 162 (28.8%) |
| Total (Overall) | 2,090 (49.6%) | 2,121 (50.4%) |
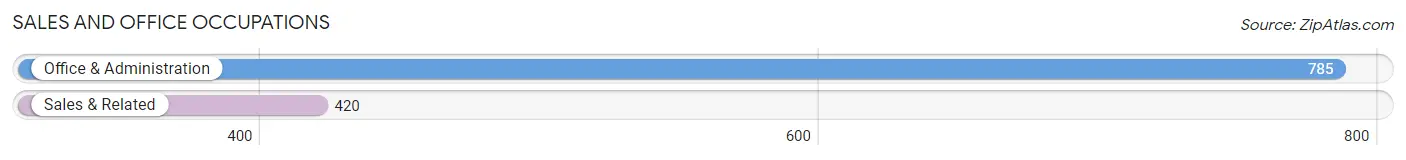
Sales and Office Occupations
The most common Sales and Office occupations in Austell are Office & Administration (785 | 18.6%), and Sales & Related (420 | 10.0%).
Sales and Office Occupations by Sex
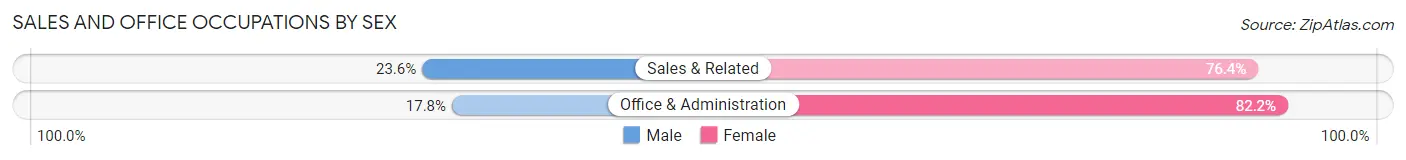
| Occupation | Male | Female |
| Sales & Related | 99 (23.6%) | 321 (76.4%) |
| Office & Administration | 140 (17.8%) | 645 (82.2%) |
| Total (Category) | 239 (19.8%) | 966 (80.2%) |
| Total (Overall) | 2,090 (49.6%) | 2,121 (50.4%) |
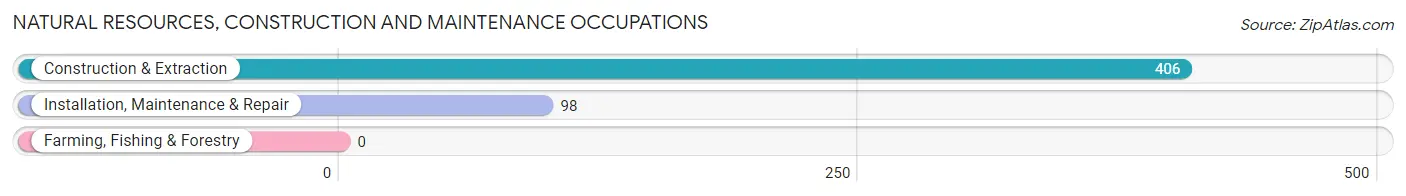
Natural Resources, Construction and Maintenance Occupations
The most common Natural Resources, Construction and Maintenance occupations in Austell are Construction & Extraction (406 | 9.6%), and Installation, Maintenance & Repair (98 | 2.3%).
Natural Resources, Construction and Maintenance Occupations by Sex
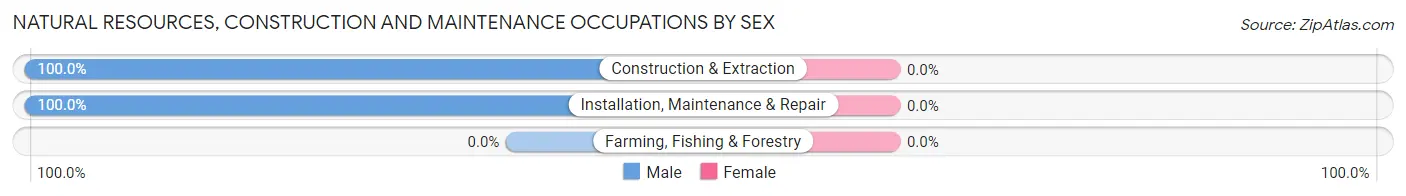
| Occupation | Male | Female |
| Farming, Fishing & Forestry | 0 (0.0%) | 0 (0.0%) |
| Construction & Extraction | 406 (100.0%) | 0 (0.0%) |
| Installation, Maintenance & Repair | 98 (100.0%) | 0 (0.0%) |
| Total (Category) | 504 (100.0%) | 0 (0.0%) |
| Total (Overall) | 2,090 (49.6%) | 2,121 (50.4%) |
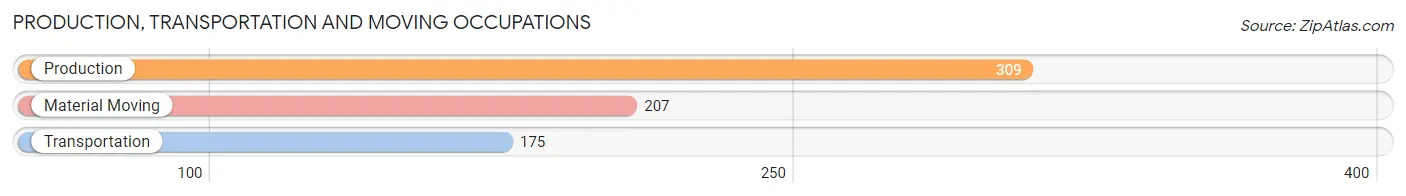
Production, Transportation and Moving Occupations
The most common Production, Transportation and Moving occupations in Austell are Production (309 | 7.3%), Material Moving (207 | 4.9%), and Transportation (175 | 4.2%).
Production, Transportation and Moving Occupations by Sex
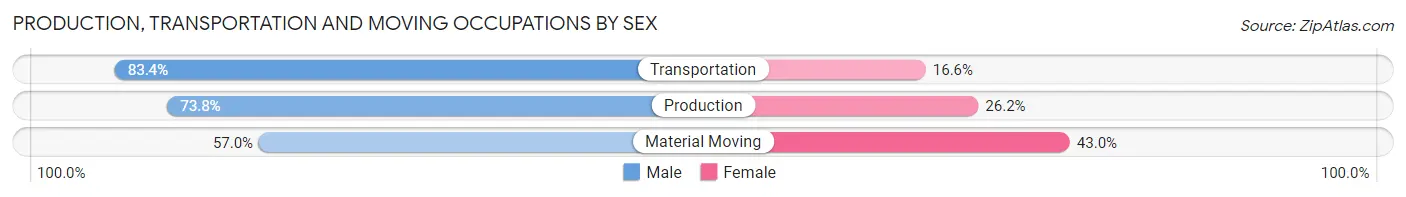
| Occupation | Male | Female |
| Production | 228 (73.8%) | 81 (26.2%) |
| Transportation | 146 (83.4%) | 29 (16.6%) |
| Material Moving | 118 (57.0%) | 89 (43.0%) |
| Total (Category) | 492 (71.2%) | 199 (28.8%) |
| Total (Overall) | 2,090 (49.6%) | 2,121 (50.4%) |
Employment Industries by Sex in Austell
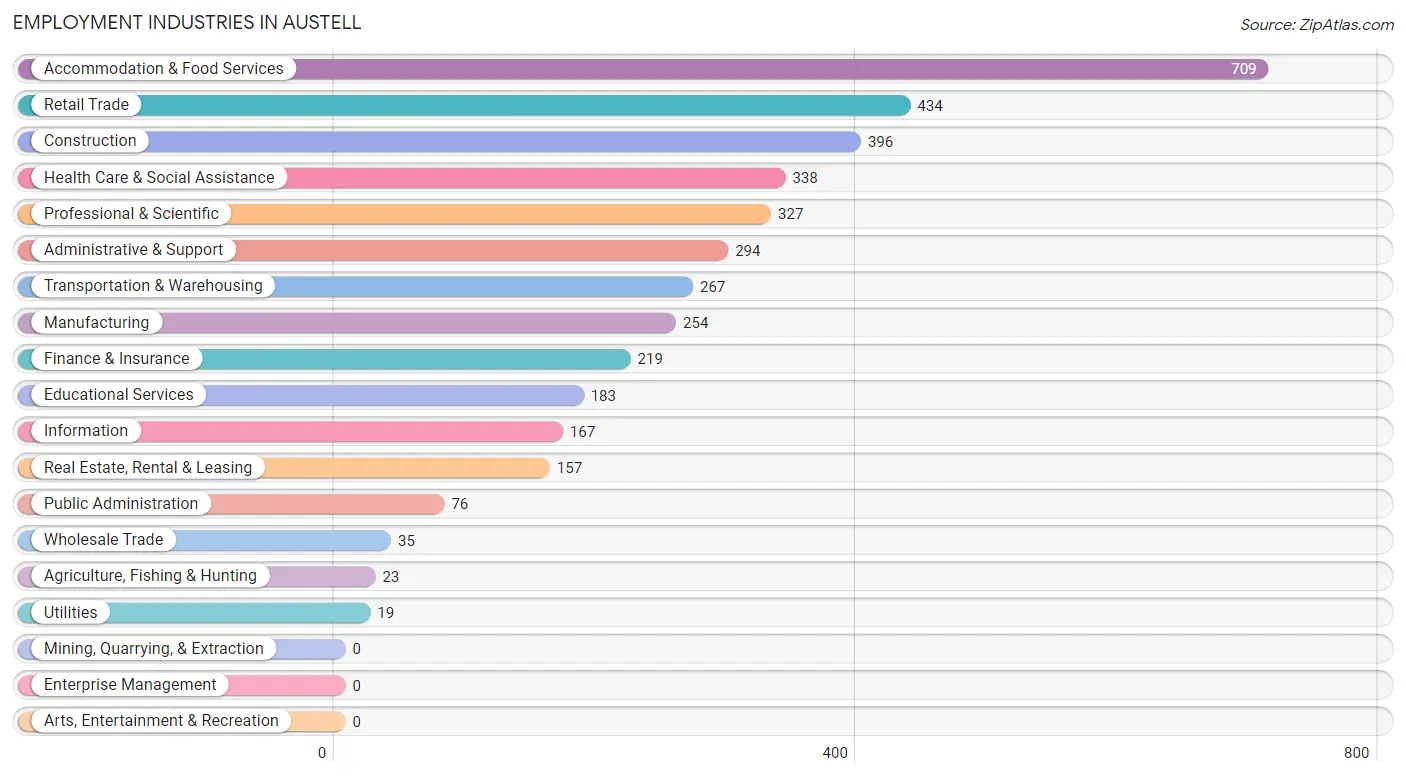
Employment Industries in Austell
The major employment industries in Austell include Accommodation & Food Services (709 | 16.8%), Retail Trade (434 | 10.3%), Construction (396 | 9.4%), Health Care & Social Assistance (338 | 8.0%), and Professional & Scientific (327 | 7.8%).
Employment Industries by Sex in Austell
The Austell industries that see more men than women are Agriculture, Fishing & Hunting (100.0%), Construction (100.0%), and Transportation & Warehousing (78.6%), whereas the industries that tend to have a higher number of women are Wholesale Trade (100.0%), Utilities (100.0%), and Health Care & Social Assistance (96.5%).
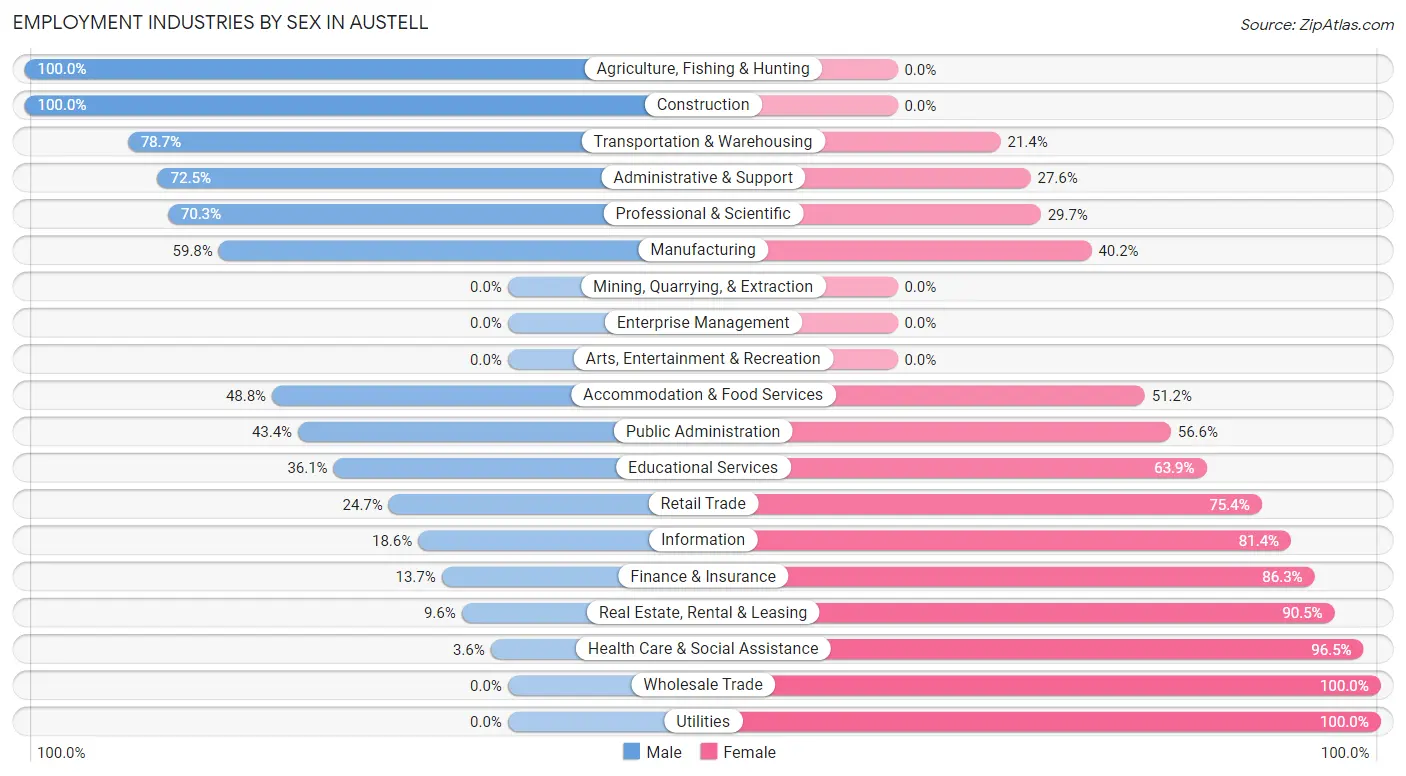
| Industry | Male | Female |
| Agriculture, Fishing & Hunting | 23 (100.0%) | 0 (0.0%) |
| Mining, Quarrying, & Extraction | 0 (0.0%) | 0 (0.0%) |
| Construction | 396 (100.0%) | 0 (0.0%) |
| Manufacturing | 152 (59.8%) | 102 (40.2%) |
| Wholesale Trade | 0 (0.0%) | 35 (100.0%) |
| Retail Trade | 107 (24.6%) | 327 (75.3%) |
| Transportation & Warehousing | 210 (78.6%) | 57 (21.3%) |
| Utilities | 0 (0.0%) | 19 (100.0%) |
| Information | 31 (18.6%) | 136 (81.4%) |
| Finance & Insurance | 30 (13.7%) | 189 (86.3%) |
| Real Estate, Rental & Leasing | 15 (9.6%) | 142 (90.4%) |
| Professional & Scientific | 230 (70.3%) | 97 (29.7%) |
| Enterprise Management | 0 (0.0%) | 0 (0.0%) |
| Administrative & Support | 213 (72.5%) | 81 (27.6%) |
| Educational Services | 66 (36.1%) | 117 (63.9%) |
| Health Care & Social Assistance | 12 (3.5%) | 326 (96.5%) |
| Arts, Entertainment & Recreation | 0 (0.0%) | 0 (0.0%) |
| Accommodation & Food Services | 346 (48.8%) | 363 (51.2%) |
| Public Administration | 33 (43.4%) | 43 (56.6%) |
| Total | 2,090 (49.6%) | 2,121 (50.4%) |
Education in Austell
School Enrollment in Austell
The most common levels of schooling among the 2,578 students in Austell are elementary school (720 | 27.9%), high school (652 | 25.3%), and college / undergraduate (454 | 17.6%).
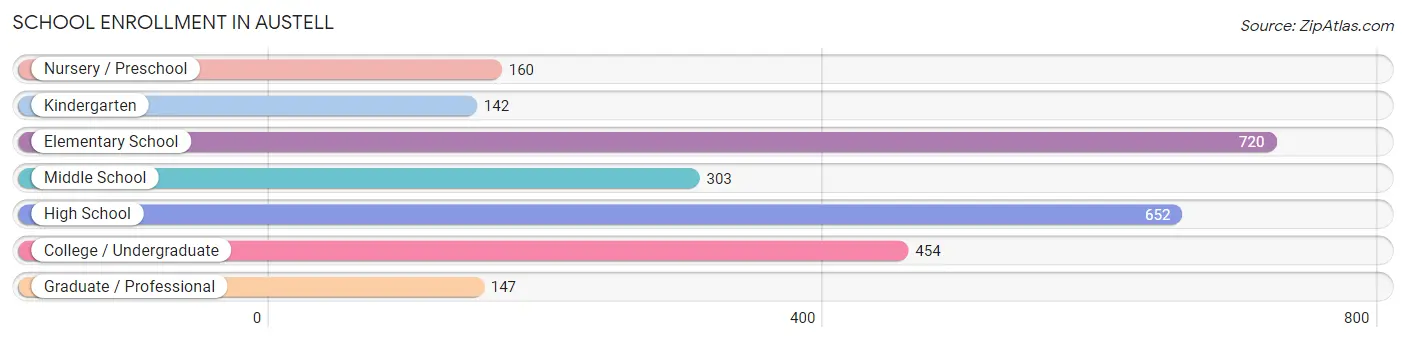
| School Level | # Students | % Students |
| Nursery / Preschool | 160 | 6.2% |
| Kindergarten | 142 | 5.5% |
| Elementary School | 720 | 27.9% |
| Middle School | 303 | 11.7% |
| High School | 652 | 25.3% |
| College / Undergraduate | 454 | 17.6% |
| Graduate / Professional | 147 | 5.7% |
| Total | 2,578 | 100.0% |
School Enrollment by Age by Funding Source in Austell
Out of a total of 2,578 students who are enrolled in schools in Austell, 229 (8.9%) attend a private institution, while the remaining 2,349 (91.1%) are enrolled in public schools. The age group of 3 to 4 year olds has the highest likelihood of being enrolled in private schools, with 62 (41.1% in the age bracket) enrolled. Conversely, the age group of 15 to 17 year olds has the lowest likelihood of being enrolled in a private school, with 479 (100.0% in the age bracket) attending a public institution.
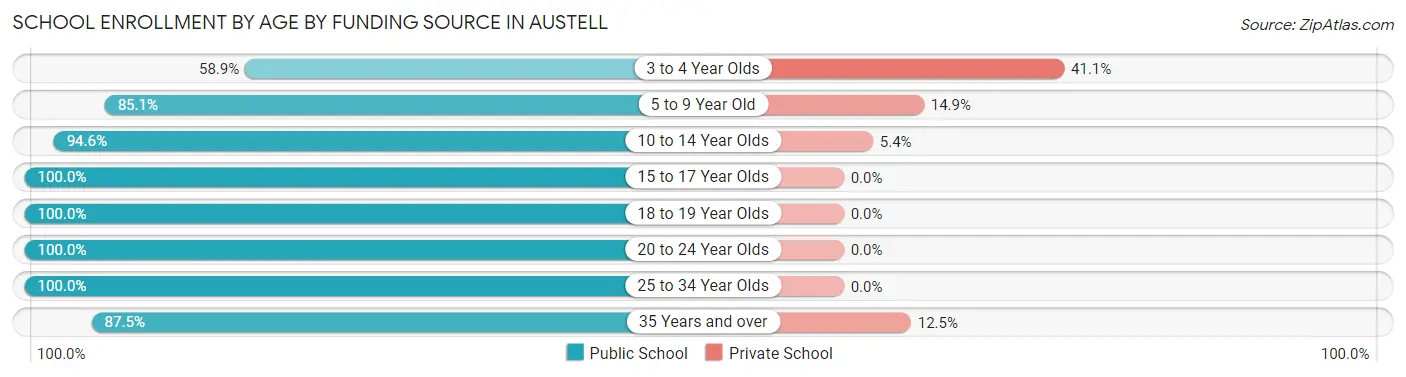
| Age Bracket | Public School | Private School |
| 3 to 4 Year Olds | 89 (58.9%) | 62 (41.1%) |
| 5 to 9 Year Old | 678 (85.1%) | 119 (14.9%) |
| 10 to 14 Year Olds | 470 (94.6%) | 27 (5.4%) |
| 15 to 17 Year Olds | 479 (100.0%) | 0 (0.0%) |
| 18 to 19 Year Olds | 234 (100.0%) | 0 (0.0%) |
| 20 to 24 Year Olds | 118 (100.0%) | 0 (0.0%) |
| 25 to 34 Year Olds | 134 (100.0%) | 0 (0.0%) |
| 35 Years and over | 147 (87.5%) | 21 (12.5%) |
| Total | 2,349 (91.1%) | 229 (8.9%) |
Educational Attainment by Field of Study in Austell
Business (286 | 24.7%), science & technology (168 | 14.5%), psychology (152 | 13.1%), education (126 | 10.9%), and bio, nature & agricultural (97 | 8.4%) are the most common fields of study among 1,160 individuals in Austell who have obtained a bachelor's degree or higher.
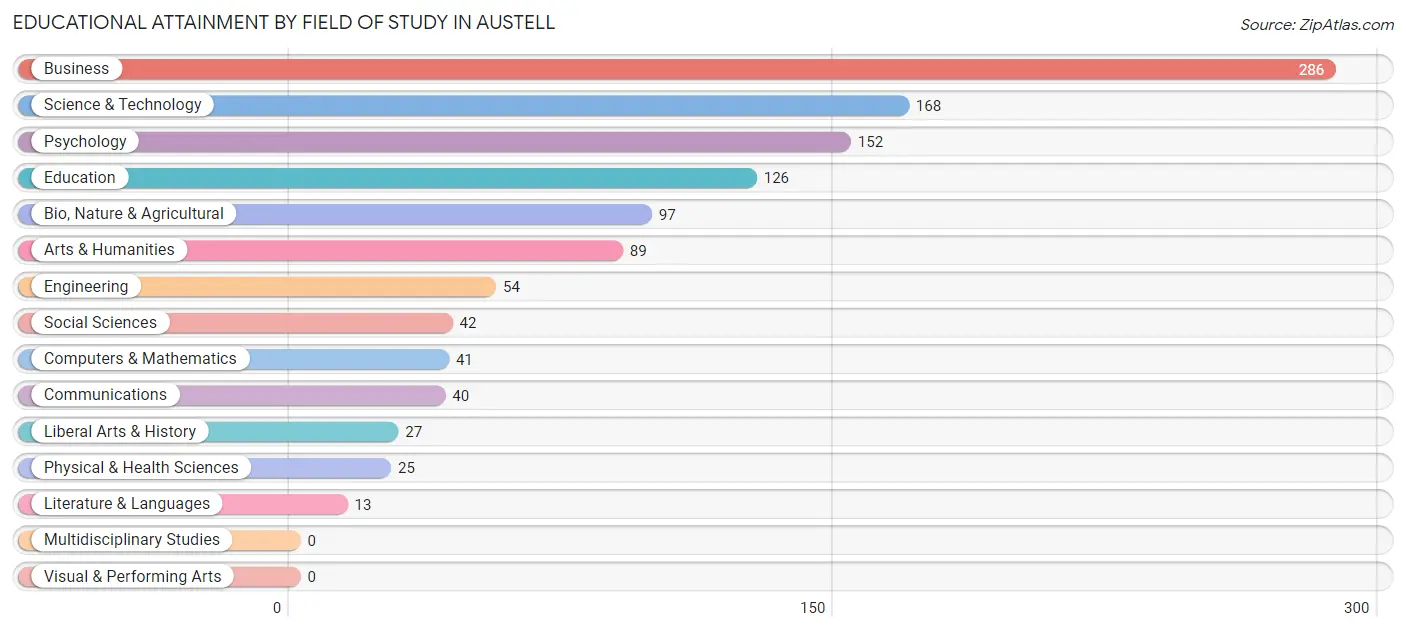
| Field of Study | # Graduates | % Graduates |
| Computers & Mathematics | 41 | 3.5% |
| Bio, Nature & Agricultural | 97 | 8.4% |
| Physical & Health Sciences | 25 | 2.2% |
| Psychology | 152 | 13.1% |
| Social Sciences | 42 | 3.6% |
| Engineering | 54 | 4.7% |
| Multidisciplinary Studies | 0 | 0.0% |
| Science & Technology | 168 | 14.5% |
| Business | 286 | 24.7% |
| Education | 126 | 10.9% |
| Literature & Languages | 13 | 1.1% |
| Liberal Arts & History | 27 | 2.3% |
| Visual & Performing Arts | 0 | 0.0% |
| Communications | 40 | 3.5% |
| Arts & Humanities | 89 | 7.7% |
| Total | 1,160 | 100.0% |
Transportation & Commute in Austell
Vehicle Availability by Sex in Austell
The most prevalent vehicle ownership categories in Austell are males with 2 vehicles (937, accounting for 47.0%) and females with 2 vehicles (938, making up 48.7%).
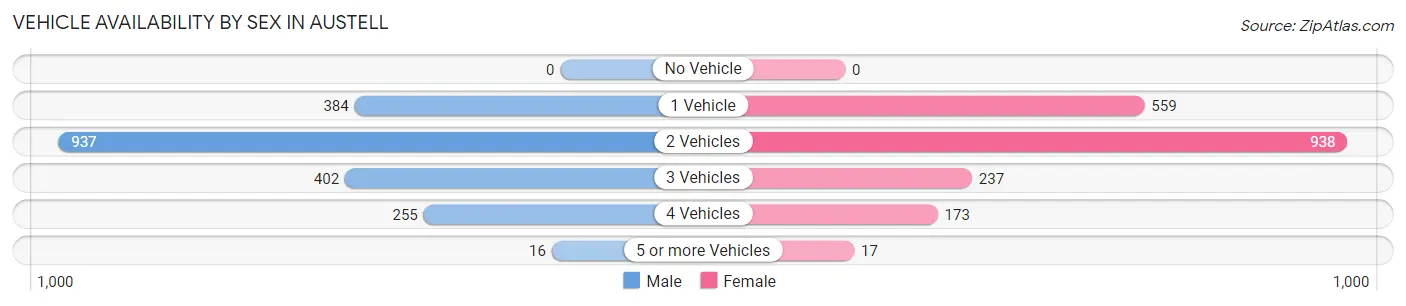
| Vehicles Available | Male | Female |
| No Vehicle | 0 (0.0%) | 0 (0.0%) |
| 1 Vehicle | 384 (19.3%) | 559 (29.0%) |
| 2 Vehicles | 937 (47.0%) | 938 (48.7%) |
| 3 Vehicles | 402 (20.2%) | 237 (12.3%) |
| 4 Vehicles | 255 (12.8%) | 173 (9.0%) |
| 5 or more Vehicles | 16 (0.8%) | 17 (0.9%) |
| Total | 1,994 (100.0%) | 1,924 (100.0%) |
Commute Time in Austell
The most frequently occuring commute durations in Austell are 45 to 59 minutes (849 commuters, 24.0%), 30 to 34 minutes (633 commuters, 17.9%), and 10 to 14 minutes (560 commuters, 15.8%).
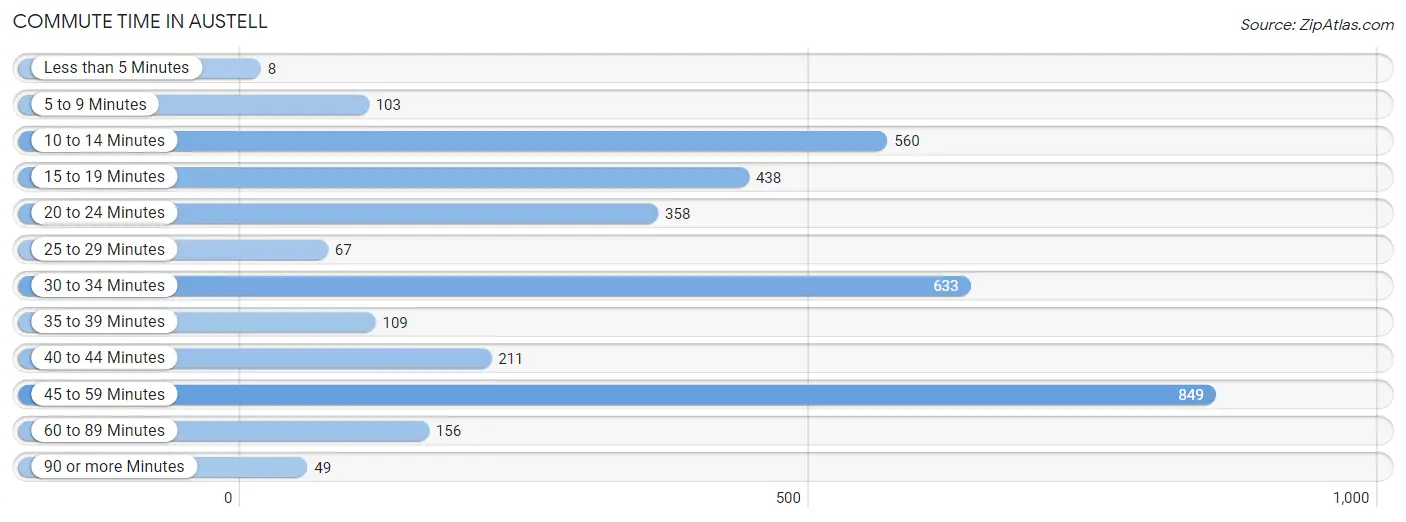
| Commute Time | # Commuters | % Commuters |
| Less than 5 Minutes | 8 | 0.2% |
| 5 to 9 Minutes | 103 | 2.9% |
| 10 to 14 Minutes | 560 | 15.8% |
| 15 to 19 Minutes | 438 | 12.4% |
| 20 to 24 Minutes | 358 | 10.1% |
| 25 to 29 Minutes | 67 | 1.9% |
| 30 to 34 Minutes | 633 | 17.9% |
| 35 to 39 Minutes | 109 | 3.1% |
| 40 to 44 Minutes | 211 | 6.0% |
| 45 to 59 Minutes | 849 | 24.0% |
| 60 to 89 Minutes | 156 | 4.4% |
| 90 or more Minutes | 49 | 1.4% |
Commute Time by Sex in Austell
The most common commute times in Austell are 45 to 59 minutes (495 commuters, 28.2%) for males and 45 to 59 minutes (354 commuters, 19.8%) for females.
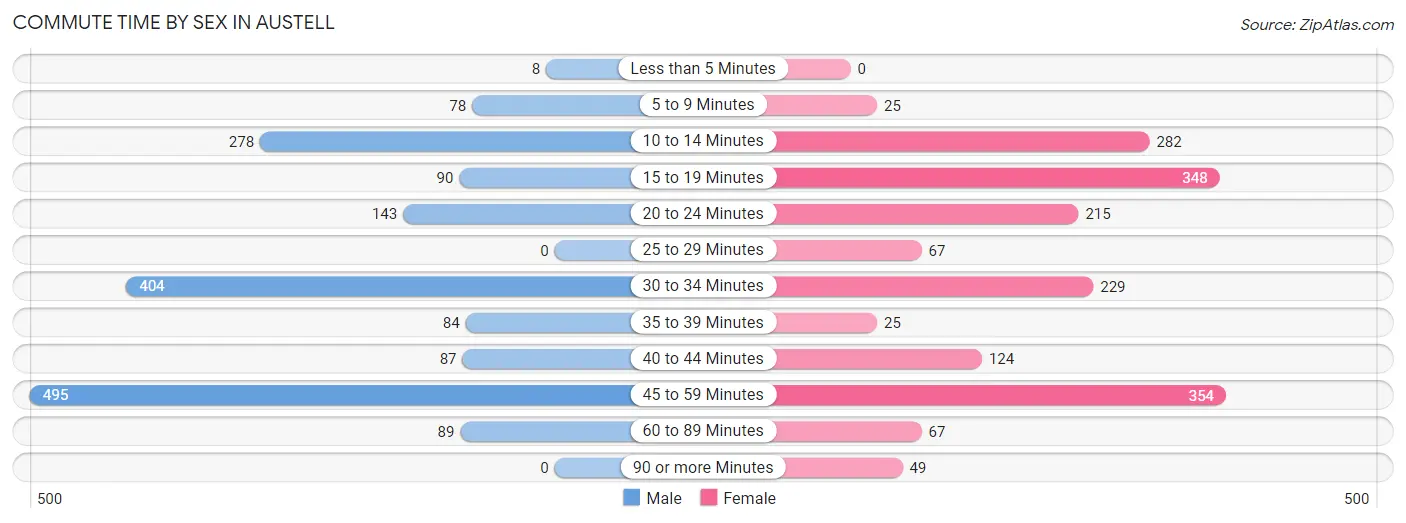
| Commute Time | Male | Female |
| Less than 5 Minutes | 8 (0.5%) | 0 (0.0%) |
| 5 to 9 Minutes | 78 (4.4%) | 25 (1.4%) |
| 10 to 14 Minutes | 278 (15.8%) | 282 (15.8%) |
| 15 to 19 Minutes | 90 (5.1%) | 348 (19.5%) |
| 20 to 24 Minutes | 143 (8.1%) | 215 (12.0%) |
| 25 to 29 Minutes | 0 (0.0%) | 67 (3.7%) |
| 30 to 34 Minutes | 404 (23.0%) | 229 (12.8%) |
| 35 to 39 Minutes | 84 (4.8%) | 25 (1.4%) |
| 40 to 44 Minutes | 87 (5.0%) | 124 (7.0%) |
| 45 to 59 Minutes | 495 (28.2%) | 354 (19.8%) |
| 60 to 89 Minutes | 89 (5.1%) | 67 (3.7%) |
| 90 or more Minutes | 0 (0.0%) | 49 (2.8%) |
Time of Departure to Work by Sex in Austell
The most frequent times of departure to work in Austell are 6:00 AM to 6:29 AM (300, 17.1%) for males and 7:30 AM to 7:59 AM (367, 20.6%) for females.
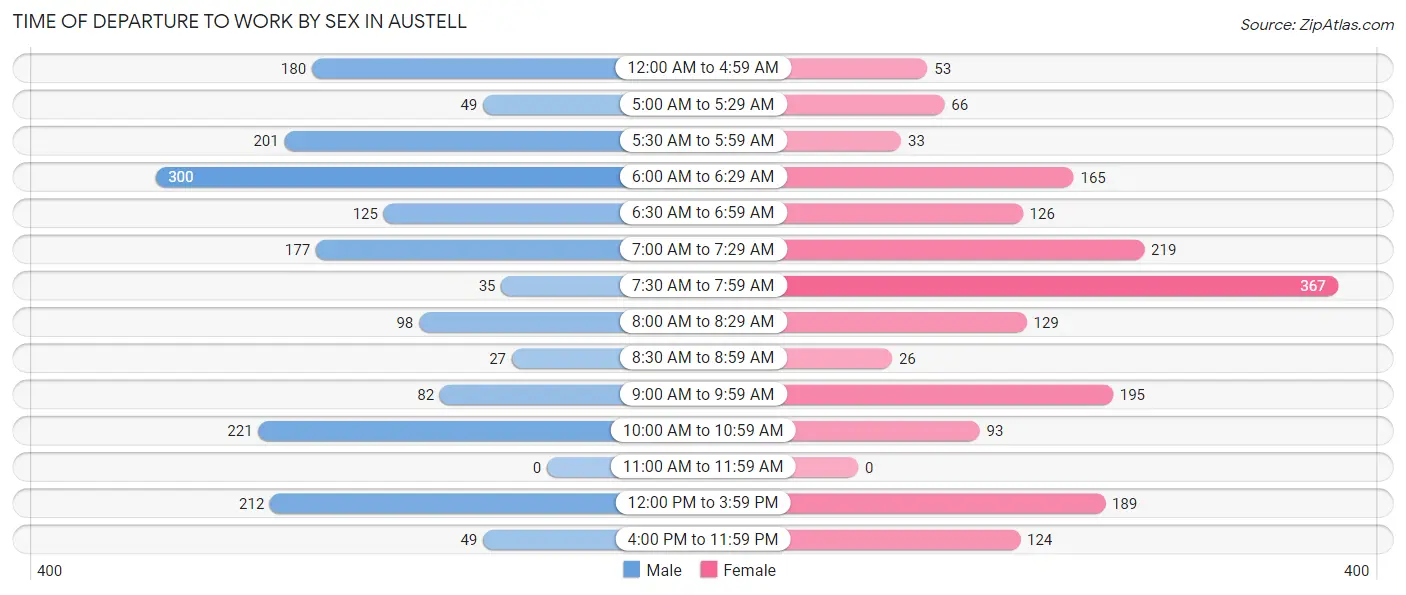
| Time of Departure | Male | Female |
| 12:00 AM to 4:59 AM | 180 (10.2%) | 53 (3.0%) |
| 5:00 AM to 5:29 AM | 49 (2.8%) | 66 (3.7%) |
| 5:30 AM to 5:59 AM | 201 (11.5%) | 33 (1.8%) |
| 6:00 AM to 6:29 AM | 300 (17.1%) | 165 (9.2%) |
| 6:30 AM to 6:59 AM | 125 (7.1%) | 126 (7.1%) |
| 7:00 AM to 7:29 AM | 177 (10.1%) | 219 (12.3%) |
| 7:30 AM to 7:59 AM | 35 (2.0%) | 367 (20.6%) |
| 8:00 AM to 8:29 AM | 98 (5.6%) | 129 (7.2%) |
| 8:30 AM to 8:59 AM | 27 (1.5%) | 26 (1.5%) |
| 9:00 AM to 9:59 AM | 82 (4.7%) | 195 (10.9%) |
| 10:00 AM to 10:59 AM | 221 (12.6%) | 93 (5.2%) |
| 11:00 AM to 11:59 AM | 0 (0.0%) | 0 (0.0%) |
| 12:00 PM to 3:59 PM | 212 (12.1%) | 189 (10.6%) |
| 4:00 PM to 11:59 PM | 49 (2.8%) | 124 (7.0%) |
| Total | 1,756 (100.0%) | 1,785 (100.0%) |
Housing Occupancy in Austell
Occupancy by Ownership in Austell
Of the total 2,844 dwellings in Austell, owner-occupied units account for 1,714 (60.3%), while renter-occupied units make up 1,130 (39.7%).
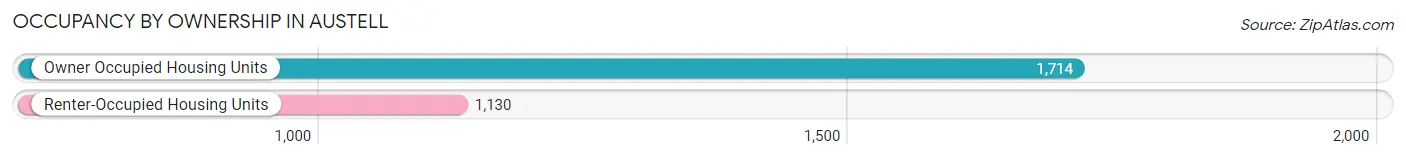
| Occupancy | # Housing Units | % Housing Units |
| Owner Occupied Housing Units | 1,714 | 60.3% |
| Renter-Occupied Housing Units | 1,130 | 39.7% |
| Total Occupied Housing Units | 2,844 | 100.0% |
Occupancy by Household Size in Austell
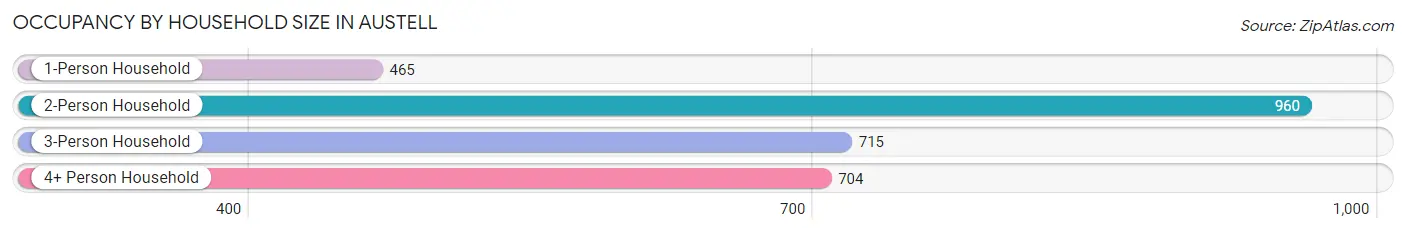
| Household Size | # Housing Units | % Housing Units |
| 1-Person Household | 465 | 16.4% |
| 2-Person Household | 960 | 33.8% |
| 3-Person Household | 715 | 25.1% |
| 4+ Person Household | 704 | 24.7% |
| Total Housing Units | 2,844 | 100.0% |
Occupancy by Ownership by Household Size in Austell
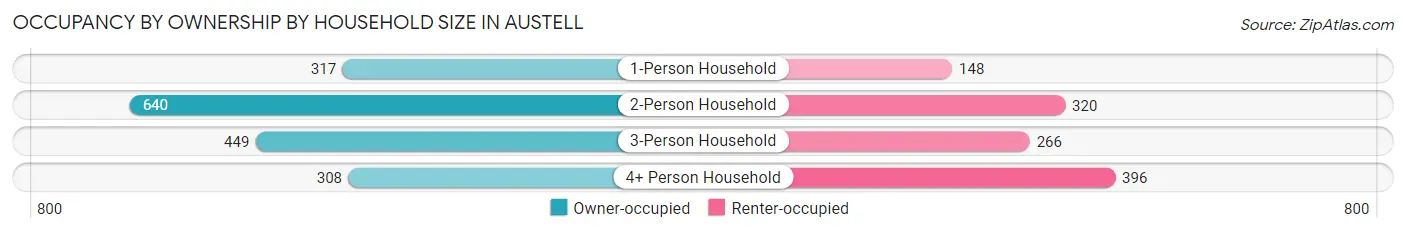
| Household Size | Owner-occupied | Renter-occupied |
| 1-Person Household | 317 (68.2%) | 148 (31.8%) |
| 2-Person Household | 640 (66.7%) | 320 (33.3%) |
| 3-Person Household | 449 (62.8%) | 266 (37.2%) |
| 4+ Person Household | 308 (43.8%) | 396 (56.2%) |
| Total Housing Units | 1,714 (60.3%) | 1,130 (39.7%) |
Occupancy by Educational Attainment in Austell
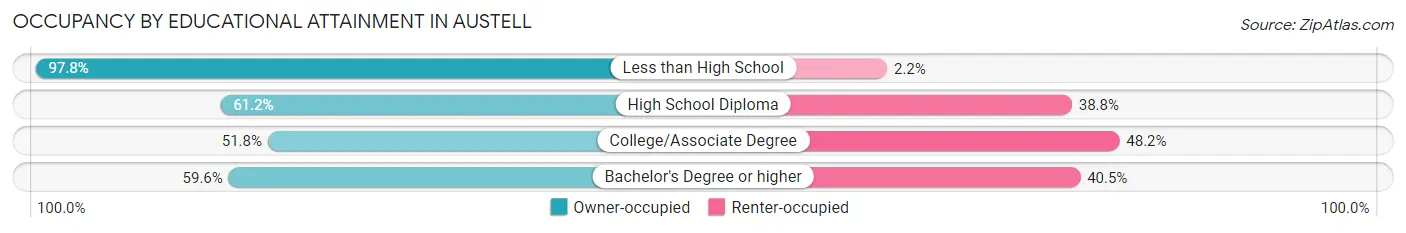
| Household Size | Owner-occupied | Renter-occupied |
| Less than High School | 227 (97.8%) | 5 (2.2%) |
| High School Diploma | 445 (61.2%) | 282 (38.8%) |
| College/Associate Degree | 537 (51.8%) | 500 (48.2%) |
| Bachelor's Degree or higher | 505 (59.6%) | 343 (40.5%) |
Occupancy by Age of Householder in Austell
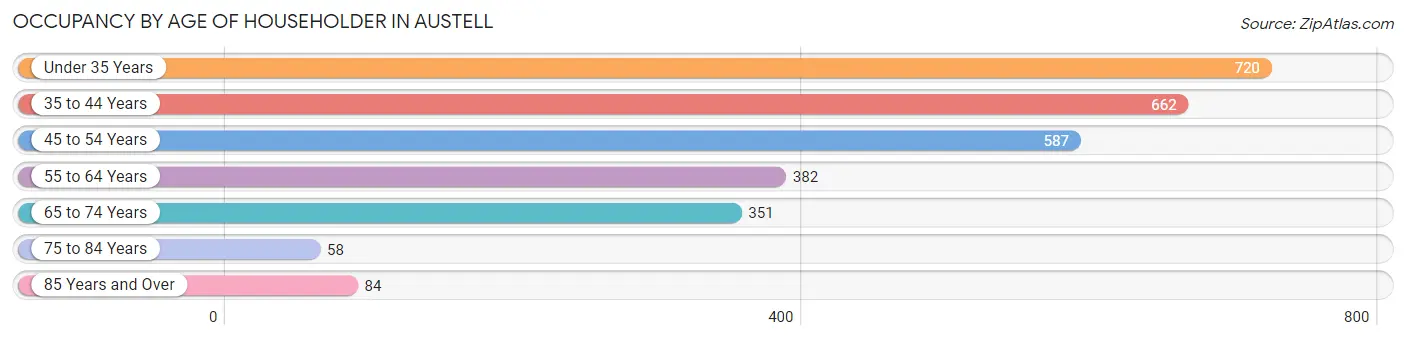
| Age Bracket | # Households | % Households |
| Under 35 Years | 720 | 25.3% |
| 35 to 44 Years | 662 | 23.3% |
| 45 to 54 Years | 587 | 20.6% |
| 55 to 64 Years | 382 | 13.4% |
| 65 to 74 Years | 351 | 12.3% |
| 75 to 84 Years | 58 | 2.0% |
| 85 Years and Over | 84 | 2.9% |
| Total | 2,844 | 100.0% |
Housing Finances in Austell
Median Income by Occupancy in Austell
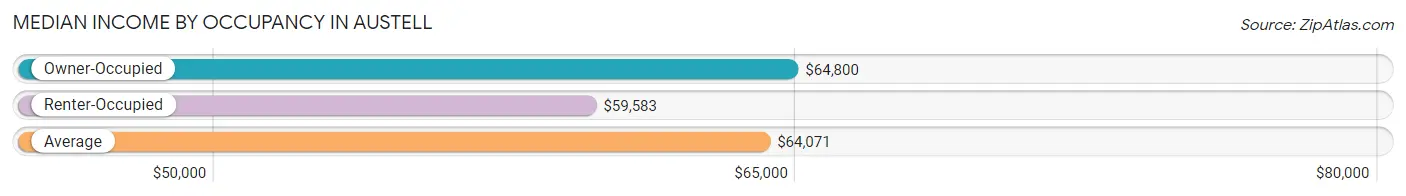
| Occupancy Type | # Households | Median Income |
| Owner-Occupied | 1,714 (60.3%) | $64,800 |
| Renter-Occupied | 1,130 (39.7%) | $59,583 |
| Average | 2,844 (100.0%) | $64,071 |
Occupancy by Householder Income Bracket in Austell
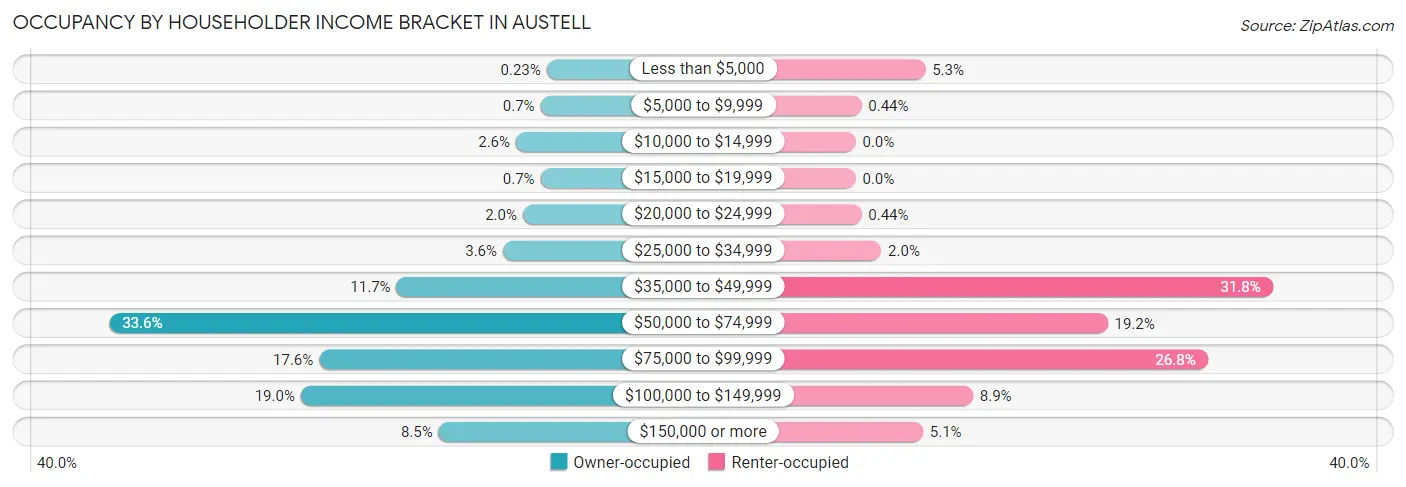
| Income Bracket | Owner-occupied | Renter-occupied |
| Less than $5,000 | 4 (0.2%) | 60 (5.3%) |
| $5,000 to $9,999 | 12 (0.7%) | 5 (0.4%) |
| $10,000 to $14,999 | 44 (2.6%) | 0 (0.0%) |
| $15,000 to $19,999 | 12 (0.7%) | 0 (0.0%) |
| $20,000 to $24,999 | 35 (2.0%) | 5 (0.4%) |
| $25,000 to $34,999 | 61 (3.6%) | 22 (1.9%) |
| $35,000 to $49,999 | 200 (11.7%) | 359 (31.8%) |
| $50,000 to $74,999 | 575 (33.6%) | 217 (19.2%) |
| $75,000 to $99,999 | 301 (17.6%) | 303 (26.8%) |
| $100,000 to $149,999 | 325 (19.0%) | 101 (8.9%) |
| $150,000 or more | 145 (8.5%) | 58 (5.1%) |
| Total | 1,714 (100.0%) | 1,130 (100.0%) |
Monthly Housing Cost Tiers in Austell
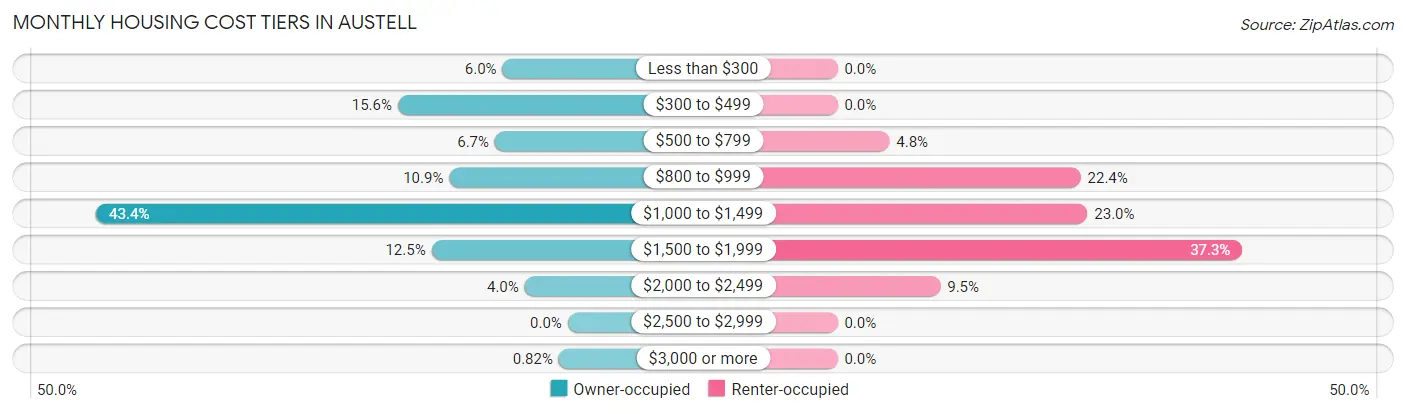
| Monthly Cost | Owner-occupied | Renter-occupied |
| Less than $300 | 103 (6.0%) | 0 (0.0%) |
| $300 to $499 | 268 (15.6%) | 0 (0.0%) |
| $500 to $799 | 115 (6.7%) | 54 (4.8%) |
| $800 to $999 | 187 (10.9%) | 253 (22.4%) |
| $1,000 to $1,499 | 744 (43.4%) | 260 (23.0%) |
| $1,500 to $1,999 | 215 (12.5%) | 421 (37.3%) |
| $2,000 to $2,499 | 68 (4.0%) | 107 (9.5%) |
| $2,500 to $2,999 | 0 (0.0%) | 0 (0.0%) |
| $3,000 or more | 14 (0.8%) | 0 (0.0%) |
| Total | 1,714 (100.0%) | 1,130 (100.0%) |
Physical Housing Characteristics in Austell
Housing Structures in Austell
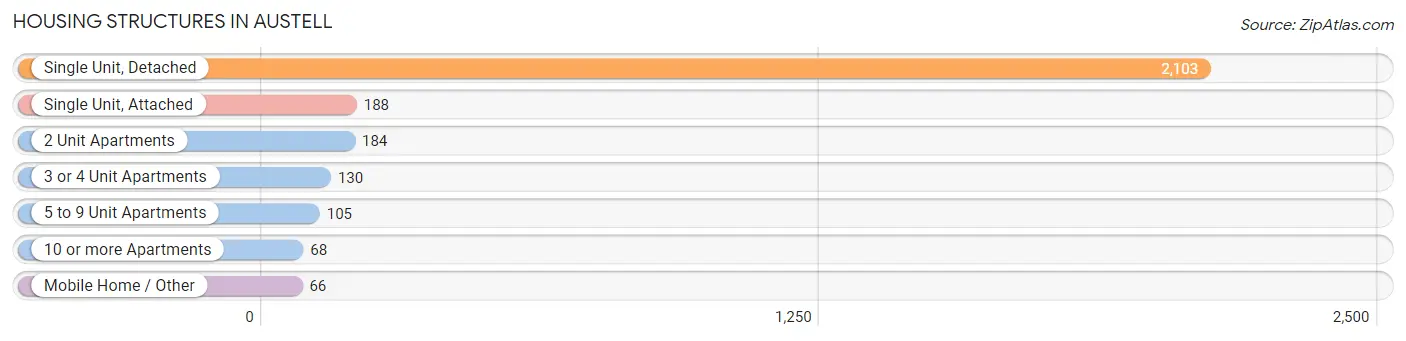
| Structure Type | # Housing Units | % Housing Units |
| Single Unit, Detached | 2,103 | 74.0% |
| Single Unit, Attached | 188 | 6.6% |
| 2 Unit Apartments | 184 | 6.5% |
| 3 or 4 Unit Apartments | 130 | 4.6% |
| 5 to 9 Unit Apartments | 105 | 3.7% |
| 10 or more Apartments | 68 | 2.4% |
| Mobile Home / Other | 66 | 2.3% |
| Total | 2,844 | 100.0% |
Housing Structures by Occupancy in Austell
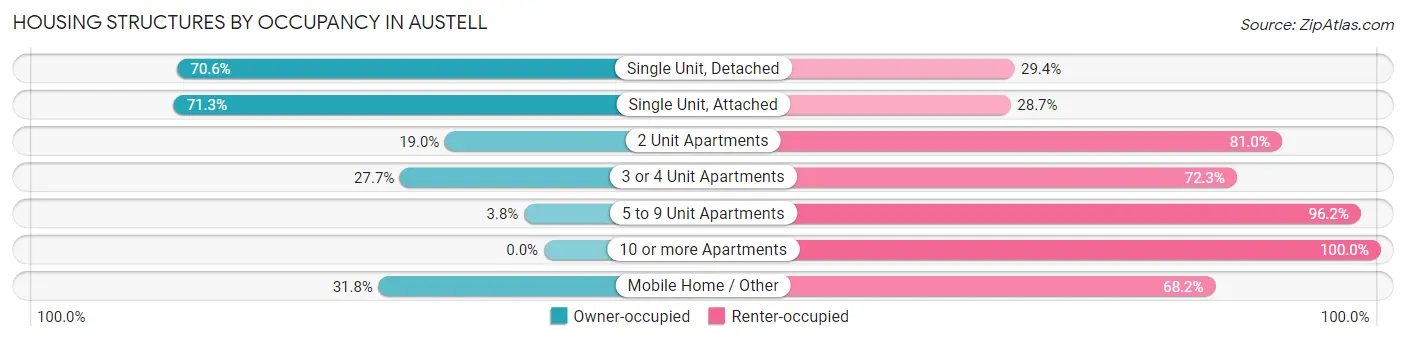
| Structure Type | Owner-occupied | Renter-occupied |
| Single Unit, Detached | 1,484 (70.6%) | 619 (29.4%) |
| Single Unit, Attached | 134 (71.3%) | 54 (28.7%) |
| 2 Unit Apartments | 35 (19.0%) | 149 (81.0%) |
| 3 or 4 Unit Apartments | 36 (27.7%) | 94 (72.3%) |
| 5 to 9 Unit Apartments | 4 (3.8%) | 101 (96.2%) |
| 10 or more Apartments | 0 (0.0%) | 68 (100.0%) |
| Mobile Home / Other | 21 (31.8%) | 45 (68.2%) |
| Total | 1,714 (60.3%) | 1,130 (39.7%) |
Housing Structures by Number of Rooms in Austell
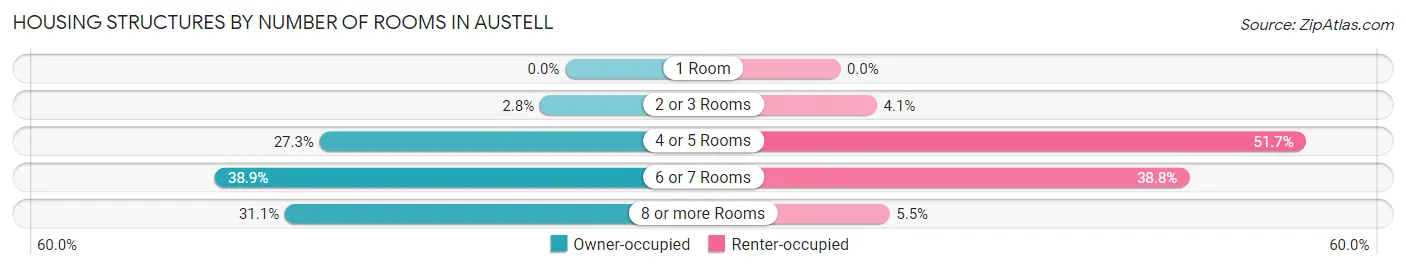
| Number of Rooms | Owner-occupied | Renter-occupied |
| 1 Room | 0 (0.0%) | 0 (0.0%) |
| 2 or 3 Rooms | 48 (2.8%) | 46 (4.1%) |
| 4 or 5 Rooms | 467 (27.3%) | 584 (51.7%) |
| 6 or 7 Rooms | 666 (38.9%) | 438 (38.8%) |
| 8 or more Rooms | 533 (31.1%) | 62 (5.5%) |
| Total | 1,714 (100.0%) | 1,130 (100.0%) |
Housing Structure by Heating Type in Austell
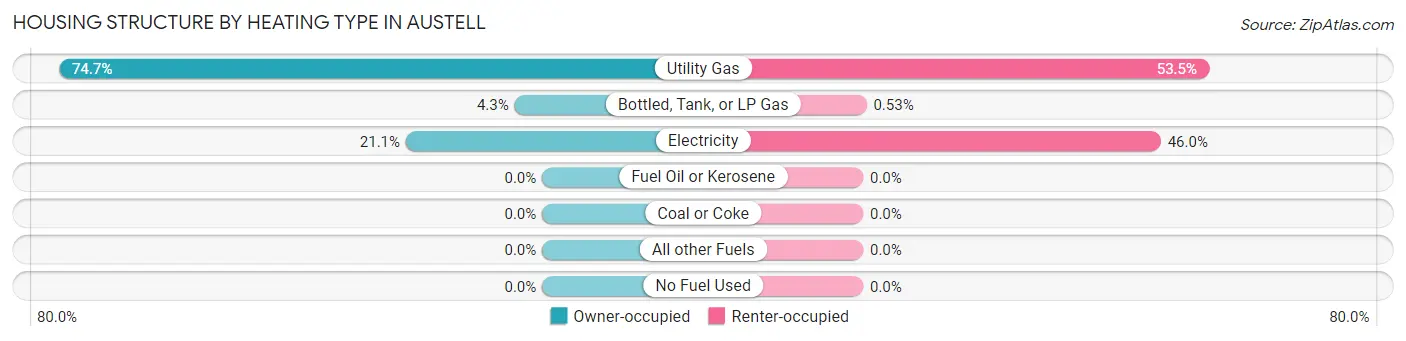
| Heating Type | Owner-occupied | Renter-occupied |
| Utility Gas | 1,280 (74.7%) | 604 (53.4%) |
| Bottled, Tank, or LP Gas | 73 (4.3%) | 6 (0.5%) |
| Electricity | 361 (21.1%) | 520 (46.0%) |
| Fuel Oil or Kerosene | 0 (0.0%) | 0 (0.0%) |
| Coal or Coke | 0 (0.0%) | 0 (0.0%) |
| All other Fuels | 0 (0.0%) | 0 (0.0%) |
| No Fuel Used | 0 (0.0%) | 0 (0.0%) |
| Total | 1,714 (100.0%) | 1,130 (100.0%) |
Household Vehicle Usage in Austell
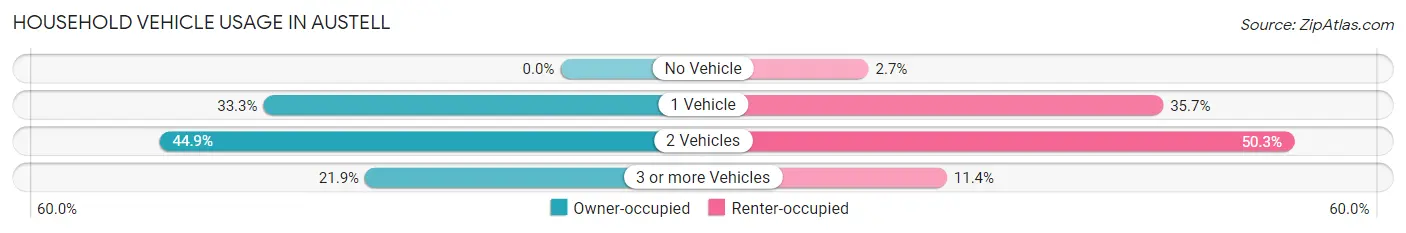
| Vehicles per Household | Owner-occupied | Renter-occupied |
| No Vehicle | 0 (0.0%) | 30 (2.6%) |
| 1 Vehicle | 570 (33.3%) | 403 (35.7%) |
| 2 Vehicles | 769 (44.9%) | 568 (50.3%) |
| 3 or more Vehicles | 375 (21.9%) | 129 (11.4%) |
| Total | 1,714 (100.0%) | 1,130 (100.0%) |
Real Estate & Mortgages in Austell
Real Estate and Mortgage Overview in Austell
| Characteristic | Without Mortgage | With Mortgage |
| Housing Units | 452 | 1,262 |
| Median Property Value | $145,000 | $220,800 |
| Median Household Income | $79,615 | $109 |
| Monthly Housing Costs | $371 | $14 |
| Real Estate Taxes | $1,062 | $44 |
Property Value by Mortgage Status in Austell
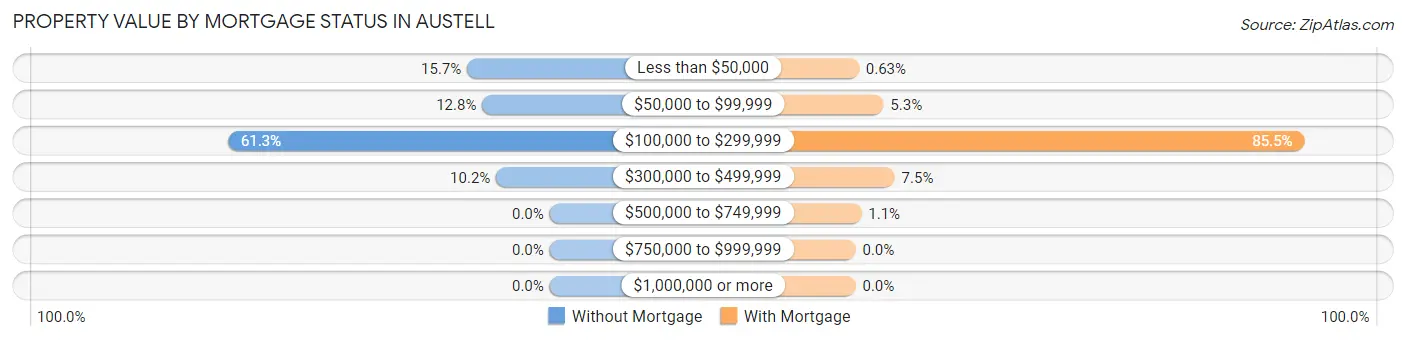
| Property Value | Without Mortgage | With Mortgage |
| Less than $50,000 | 71 (15.7%) | 8 (0.6%) |
| $50,000 to $99,999 | 58 (12.8%) | 67 (5.3%) |
| $100,000 to $299,999 | 277 (61.3%) | 1,079 (85.5%) |
| $300,000 to $499,999 | 46 (10.2%) | 94 (7.4%) |
| $500,000 to $749,999 | 0 (0.0%) | 14 (1.1%) |
| $750,000 to $999,999 | 0 (0.0%) | 0 (0.0%) |
| $1,000,000 or more | 0 (0.0%) | 0 (0.0%) |
| Total | 452 (100.0%) | 1,262 (100.0%) |
Household Income by Mortgage Status in Austell
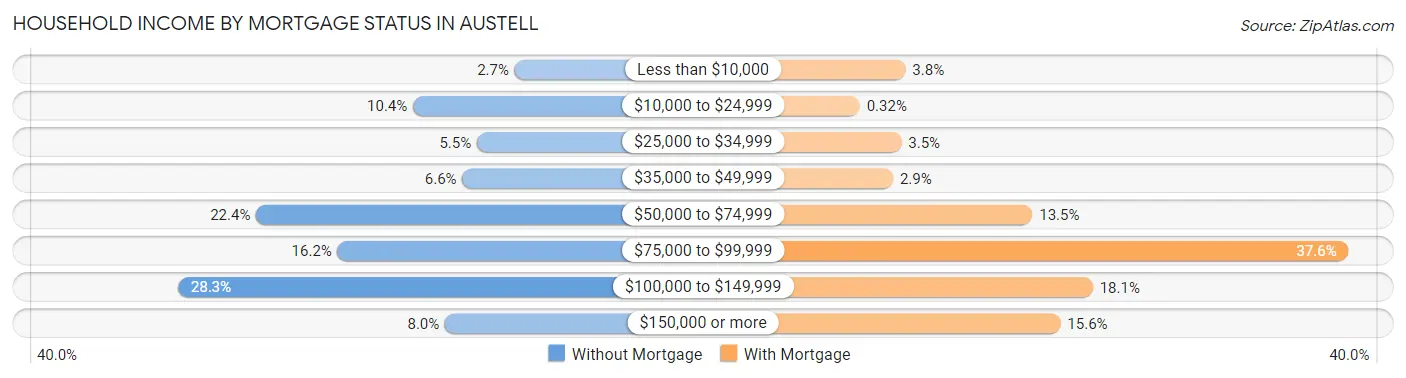
| Household Income | Without Mortgage | With Mortgage |
| Less than $10,000 | 12 (2.6%) | 48 (3.8%) |
| $10,000 to $24,999 | 47 (10.4%) | 4 (0.3%) |
| $25,000 to $34,999 | 25 (5.5%) | 44 (3.5%) |
| $35,000 to $49,999 | 30 (6.6%) | 36 (2.9%) |
| $50,000 to $74,999 | 101 (22.4%) | 170 (13.5%) |
| $75,000 to $99,999 | 73 (16.2%) | 474 (37.6%) |
| $100,000 to $149,999 | 128 (28.3%) | 228 (18.1%) |
| $150,000 or more | 36 (8.0%) | 197 (15.6%) |
| Total | 452 (100.0%) | 1,262 (100.0%) |
Property Value to Household Income Ratio in Austell
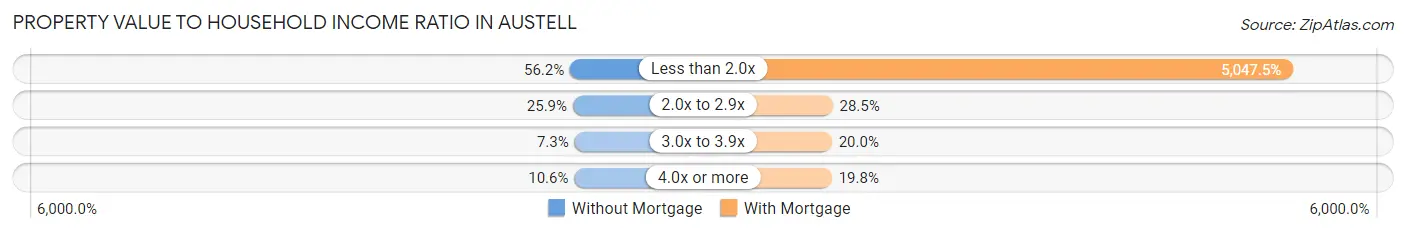
| Value-to-Income Ratio | Without Mortgage | With Mortgage |
| Less than 2.0x | 254 (56.2%) | 63,700 (5,047.5%) |
| 2.0x to 2.9x | 117 (25.9%) | 359 (28.4%) |
| 3.0x to 3.9x | 33 (7.3%) | 252 (20.0%) |
| 4.0x or more | 48 (10.6%) | 250 (19.8%) |
| Total | 452 (100.0%) | 1,262 (100.0%) |
Real Estate Taxes by Mortgage Status in Austell
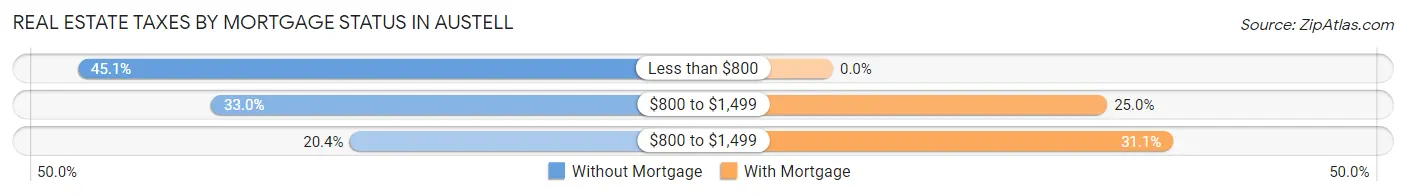
| Property Taxes | Without Mortgage | With Mortgage |
| Less than $800 | 204 (45.1%) | 0 (0.0%) |
| $800 to $1,499 | 149 (33.0%) | 316 (25.0%) |
| $800 to $1,499 | 92 (20.3%) | 392 (31.1%) |
| Total | 452 (100.0%) | 1,262 (100.0%) |
Health & Disability in Austell
Health Insurance Coverage by Age in Austell
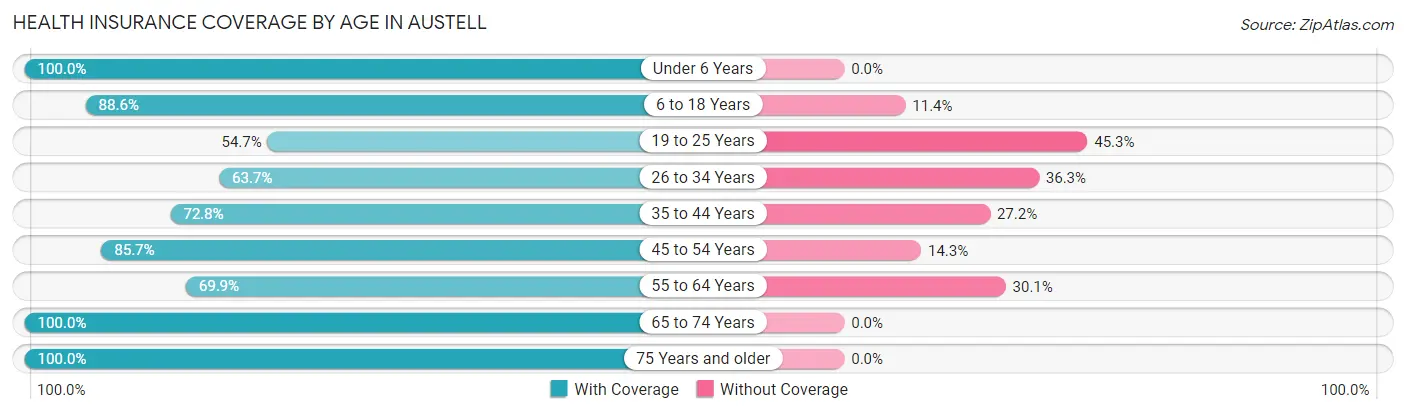
| Age Bracket | With Coverage | Without Coverage |
| Under 6 Years | 527 (100.0%) | 0 (0.0%) |
| 6 to 18 Years | 1,587 (88.6%) | 204 (11.4%) |
| 19 to 25 Years | 461 (54.7%) | 382 (45.3%) |
| 26 to 34 Years | 671 (63.7%) | 382 (36.3%) |
| 35 to 44 Years | 705 (72.8%) | 263 (27.2%) |
| 45 to 54 Years | 1,322 (85.7%) | 221 (14.3%) |
| 55 to 64 Years | 465 (69.9%) | 200 (30.1%) |
| 65 to 74 Years | 530 (100.0%) | 0 (0.0%) |
| 75 Years and older | 189 (100.0%) | 0 (0.0%) |
| Total | 6,457 (79.6%) | 1,652 (20.4%) |
Health Insurance Coverage by Citizenship Status in Austell
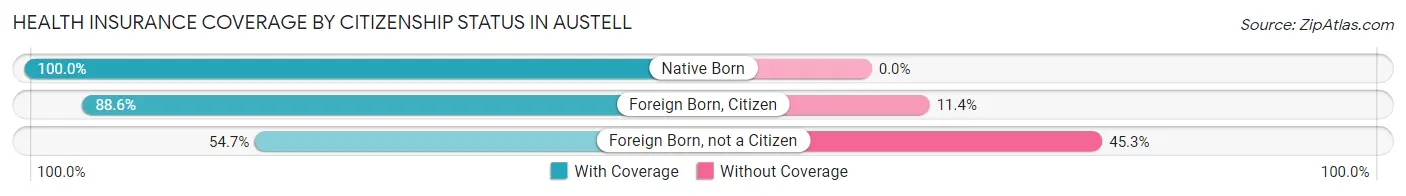
| Citizenship Status | With Coverage | Without Coverage |
| Native Born | 527 (100.0%) | 0 (0.0%) |
| Foreign Born, Citizen | 1,587 (88.6%) | 204 (11.4%) |
| Foreign Born, not a Citizen | 461 (54.7%) | 382 (45.3%) |
Health Insurance Coverage by Household Income in Austell
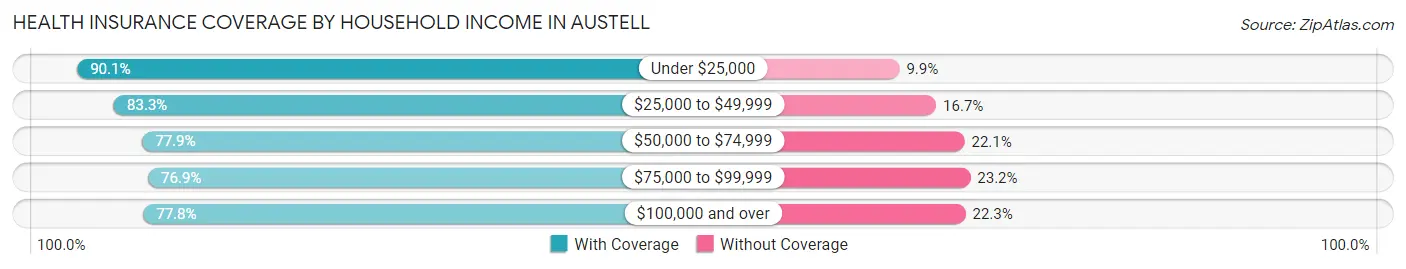
| Household Income | With Coverage | Without Coverage |
| Under $25,000 | 402 (90.1%) | 44 (9.9%) |
| $25,000 to $49,999 | 1,607 (83.3%) | 323 (16.7%) |
| $50,000 to $74,999 | 1,516 (77.9%) | 429 (22.1%) |
| $75,000 to $99,999 | 1,218 (76.8%) | 367 (23.2%) |
| $100,000 and over | 1,709 (77.7%) | 489 (22.3%) |
Public vs Private Health Insurance Coverage by Age in Austell
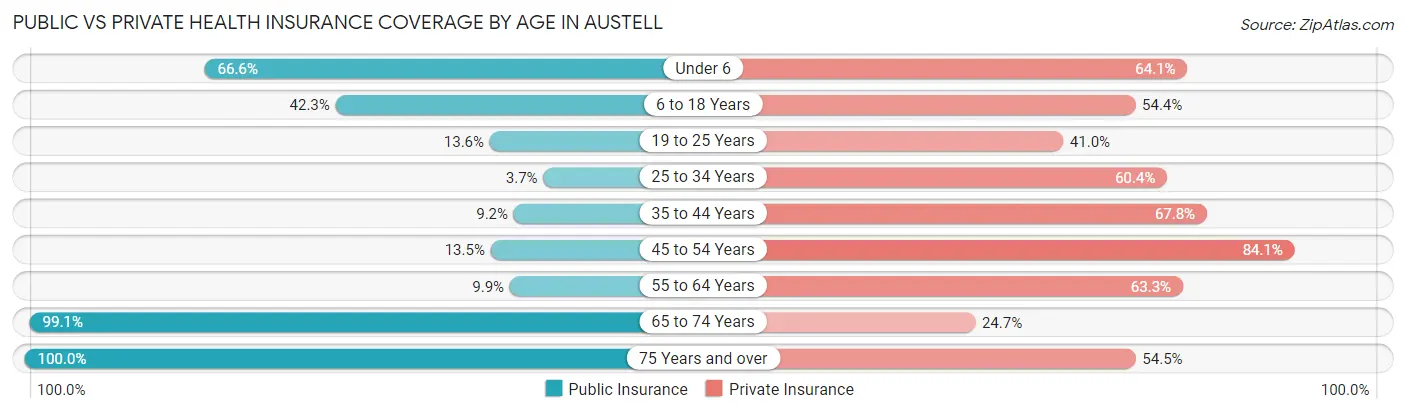
| Age Bracket | Public Insurance | Private Insurance |
| Under 6 | 351 (66.6%) | 338 (64.1%) |
| 6 to 18 Years | 757 (42.3%) | 975 (54.4%) |
| 19 to 25 Years | 115 (13.6%) | 346 (41.0%) |
| 25 to 34 Years | 39 (3.7%) | 636 (60.4%) |
| 35 to 44 Years | 89 (9.2%) | 656 (67.8%) |
| 45 to 54 Years | 208 (13.5%) | 1,297 (84.1%) |
| 55 to 64 Years | 66 (9.9%) | 421 (63.3%) |
| 65 to 74 Years | 525 (99.1%) | 131 (24.7%) |
| 75 Years and over | 189 (100.0%) | 103 (54.5%) |
| Total | 2,339 (28.8%) | 4,903 (60.5%) |
Disability Status by Sex by Age in Austell
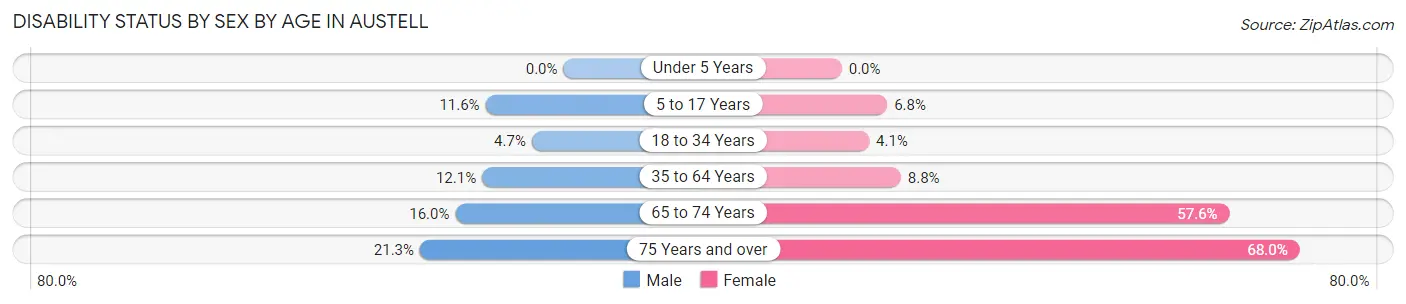
| Age Bracket | Male | Female |
| Under 5 Years | 0 (0.0%) | 0 (0.0%) |
| 5 to 17 Years | 96 (11.6%) | 66 (6.8%) |
| 18 to 34 Years | 41 (4.7%) | 48 (4.1%) |
| 35 to 64 Years | 151 (12.1%) | 169 (8.8%) |
| 65 to 74 Years | 51 (16.0%) | 122 (57.6%) |
| 75 Years and over | 13 (21.3%) | 87 (68.0%) |
Disability Class by Sex by Age in Austell
Disability Class: Hearing Difficulty
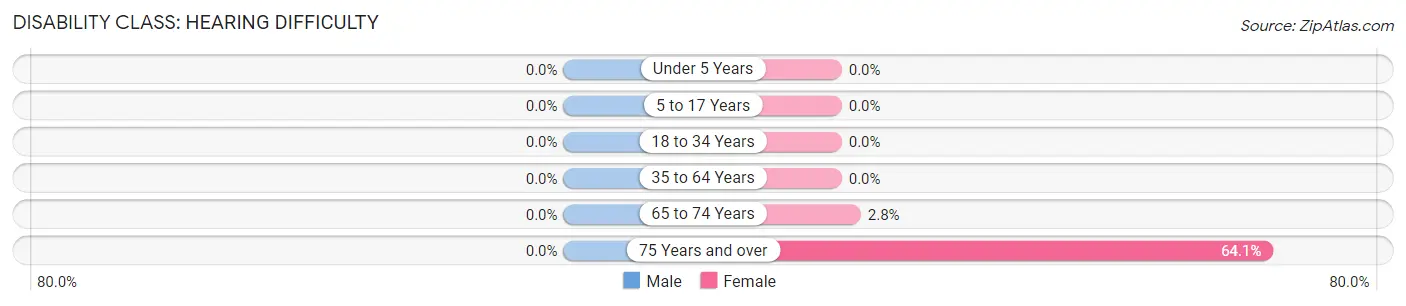
| Age Bracket | Male | Female |
| Under 5 Years | 0 (0.0%) | 0 (0.0%) |
| 5 to 17 Years | 0 (0.0%) | 0 (0.0%) |
| 18 to 34 Years | 0 (0.0%) | 0 (0.0%) |
| 35 to 64 Years | 0 (0.0%) | 0 (0.0%) |
| 65 to 74 Years | 0 (0.0%) | 6 (2.8%) |
| 75 Years and over | 0 (0.0%) | 82 (64.1%) |
Disability Class: Vision Difficulty
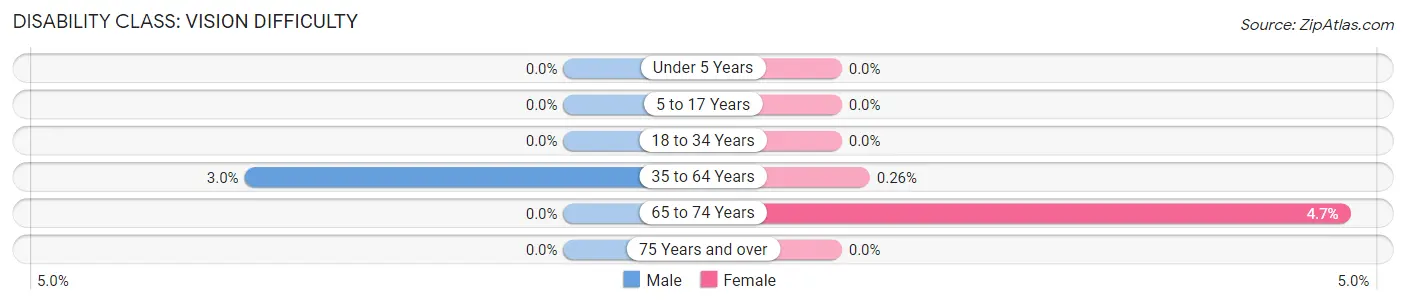
| Age Bracket | Male | Female |
| Under 5 Years | 0 (0.0%) | 0 (0.0%) |
| 5 to 17 Years | 0 (0.0%) | 0 (0.0%) |
| 18 to 34 Years | 0 (0.0%) | 0 (0.0%) |
| 35 to 64 Years | 37 (3.0%) | 5 (0.3%) |
| 65 to 74 Years | 0 (0.0%) | 10 (4.7%) |
| 75 Years and over | 0 (0.0%) | 0 (0.0%) |
Disability Class: Cognitive Difficulty
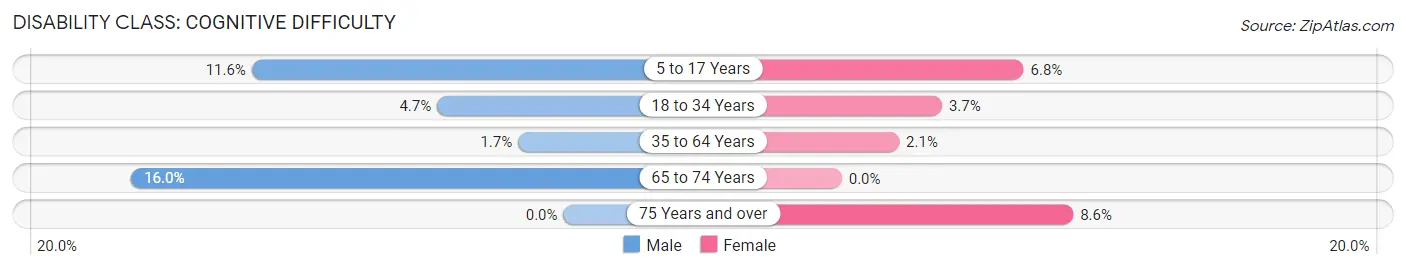
| Age Bracket | Male | Female |
| 5 to 17 Years | 96 (11.6%) | 66 (6.8%) |
| 18 to 34 Years | 41 (4.7%) | 44 (3.7%) |
| 35 to 64 Years | 21 (1.7%) | 41 (2.1%) |
| 65 to 74 Years | 51 (16.0%) | 0 (0.0%) |
| 75 Years and over | 0 (0.0%) | 11 (8.6%) |
Disability Class: Ambulatory Difficulty
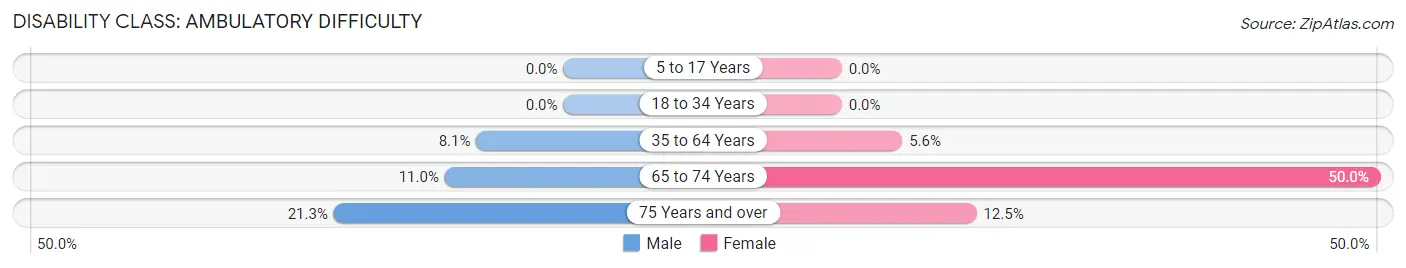
| Age Bracket | Male | Female |
| 5 to 17 Years | 0 (0.0%) | 0 (0.0%) |
| 18 to 34 Years | 0 (0.0%) | 0 (0.0%) |
| 35 to 64 Years | 101 (8.1%) | 108 (5.6%) |
| 65 to 74 Years | 35 (11.0%) | 106 (50.0%) |
| 75 Years and over | 13 (21.3%) | 16 (12.5%) |
Disability Class: Self-Care Difficulty
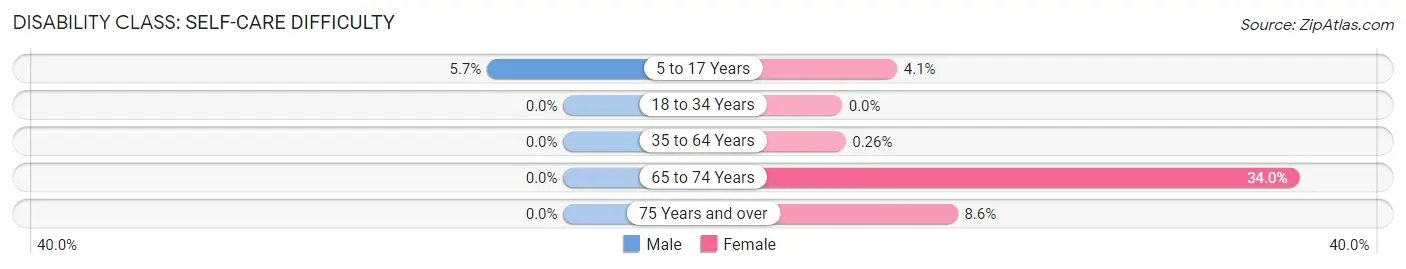
| Age Bracket | Male | Female |
| 5 to 17 Years | 47 (5.7%) | 40 (4.1%) |
| 18 to 34 Years | 0 (0.0%) | 0 (0.0%) |
| 35 to 64 Years | 0 (0.0%) | 5 (0.3%) |
| 65 to 74 Years | 0 (0.0%) | 72 (34.0%) |
| 75 Years and over | 0 (0.0%) | 11 (8.6%) |
Technology Access in Austell
Computing Device Access in Austell
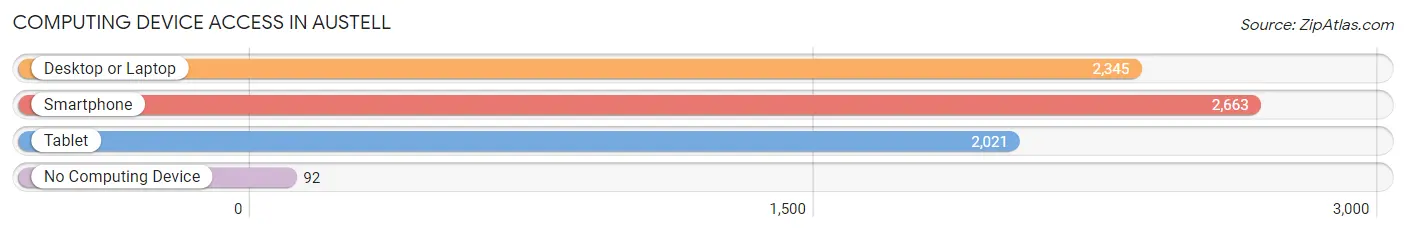
| Device Type | # Households | % Households |
| Desktop or Laptop | 2,345 | 82.5% |
| Smartphone | 2,663 | 93.6% |
| Tablet | 2,021 | 71.1% |
| No Computing Device | 92 | 3.2% |
| Total | 2,844 | 100.0% |
Internet Access in Austell
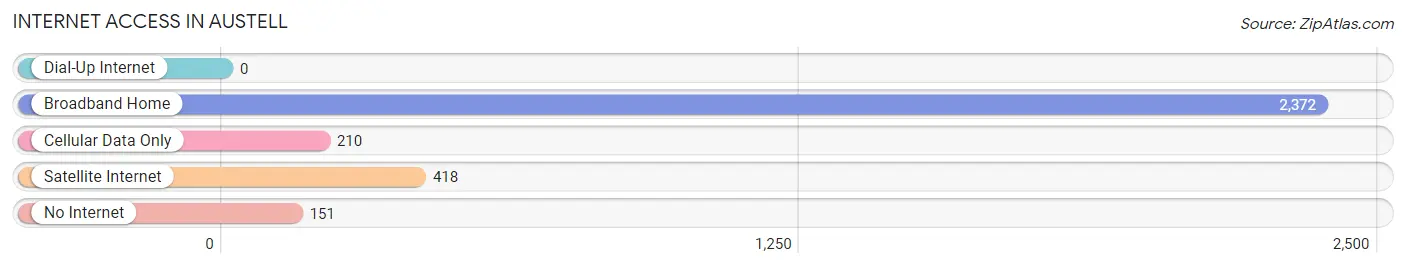
| Internet Type | # Households | % Households |
| Dial-Up Internet | 0 | 0.0% |
| Broadband Home | 2,372 | 83.4% |
| Cellular Data Only | 210 | 7.4% |
| Satellite Internet | 418 | 14.7% |
| No Internet | 151 | 5.3% |
| Total | 2,844 | 100.0% |
Austell Summary
History
The city of Austell, Georgia is located in Cobb County, approximately 20 miles northwest of Atlanta. It was founded in 1884 by General Alfred Austell, a prominent banker and railroad executive. The city was named after him and was originally a small farming community. In the late 19th century, the city began to grow as the railroad industry expanded and the area became a popular destination for tourists.
The city experienced a period of growth in the early 20th century, as the population increased and businesses began to move into the area. The city was incorporated in 1908 and the first mayor was elected in 1909. The city continued to grow throughout the 20th century, and by the year 2000, the population had grown to over 8,000 people.
Geography
Austell is located in the northwestern part of Cobb County, Georgia. It is situated on the banks of the Chattahoochee River, and is bordered by the cities of Powder Springs, Mableton, and Smyrna. The city covers an area of approximately 4.5 square miles, and has a population density of 1,845 people per square mile.
The city is located in the foothills of the Appalachian Mountains, and the terrain is mostly hilly. The climate is humid subtropical, with hot summers and mild winters. The average annual temperature is around 61 degrees Fahrenheit, and the average annual precipitation is around 50 inches.
Economy
The economy of Austell is largely based on the service industry. The city is home to several large companies, including the Coca-Cola Company, Georgia Power, and the Georgia-Pacific Corporation. The city also has a number of small businesses, including restaurants, retail stores, and professional services.
The city is also home to several educational institutions, including the Georgia Institute of Technology, Georgia State University, and the University of Georgia. The city is also home to several parks and recreational facilities, including the Cobb County Aquatic Center, the Cobb County Public Library, and the Cobb County Museum of History.
Demographics
As of the 2010 census, the population of Austell was 8,619. The racial makeup of the city was 79.3% White, 14.2% African American, 0.3% Native American, 1.7% Asian, 0.1% Pacific Islander, and 4.4% from other races. The median household income was $45,845, and the median family income was $51,845.
The city is home to a diverse population, with a variety of religious backgrounds. The largest religious group is Christianity, with over 70% of the population identifying as Christian. Other religious groups include Judaism, Islam, Buddhism, and Hinduism.
Conclusion
Austell, Georgia is a small city located in Cobb County, approximately 20 miles northwest of Atlanta. It was founded in 1884 by General Alfred Austell, and has since grown to become a thriving city with a population of over 8,000 people. The city is home to several large companies, educational institutions, and recreational facilities, and has a diverse population with a variety of religious backgrounds. The economy of the city is largely based on the service industry, and the median household income is $45,845.
Common Questions
What is Per Capita Income in Austell?
Per Capita income in Austell is $28,245.
What is the Median Family Income in Austell?
Median Family Income in Austell is $61,334.
What is the Median Household income in Austell?
Median Household Income in Austell is $64,071.
What is Income or Wage Gap in Austell?
Income or Wage Gap in Austell is 6.3%.
Women in Austell earn 93.7 cents for every dollar earned by a man.
What is Inequality or Gini Index in Austell?
Inequality or Gini Index in Austell is 0.32.
What is the Total Population of Austell?
Total Population of Austell is 8,109.
What is the Total Male Population of Austell?
Total Male Population of Austell is 3,589.
What is the Total Female Population of Austell?
Total Female Population of Austell is 4,520.
What is the Ratio of Males per 100 Females in Austell?
There are 79.40 Males per 100 Females in Austell.
What is the Ratio of Females per 100 Males in Austell?
There are 125.94 Females per 100 Males in Austell.
What is the Median Population Age in Austell?
Median Population Age in Austell is 33.8 Years.
What is the Average Family Size in Austell
Average Family Size in Austell is 3.3 People.
What is the Average Household Size in Austell
Average Household Size in Austell is 2.9 People.
How Large is the Labor Force in Austell?
There are 4,456 People in the Labor Forcein in Austell.
What is the Percentage of People in the Labor Force in Austell?
70.3% of People are in the Labor Force in Austell.
What is the Unemployment Rate in Austell?
Unemployment Rate in Austell is 5.6%.