Savannah, GA Map & Demographics
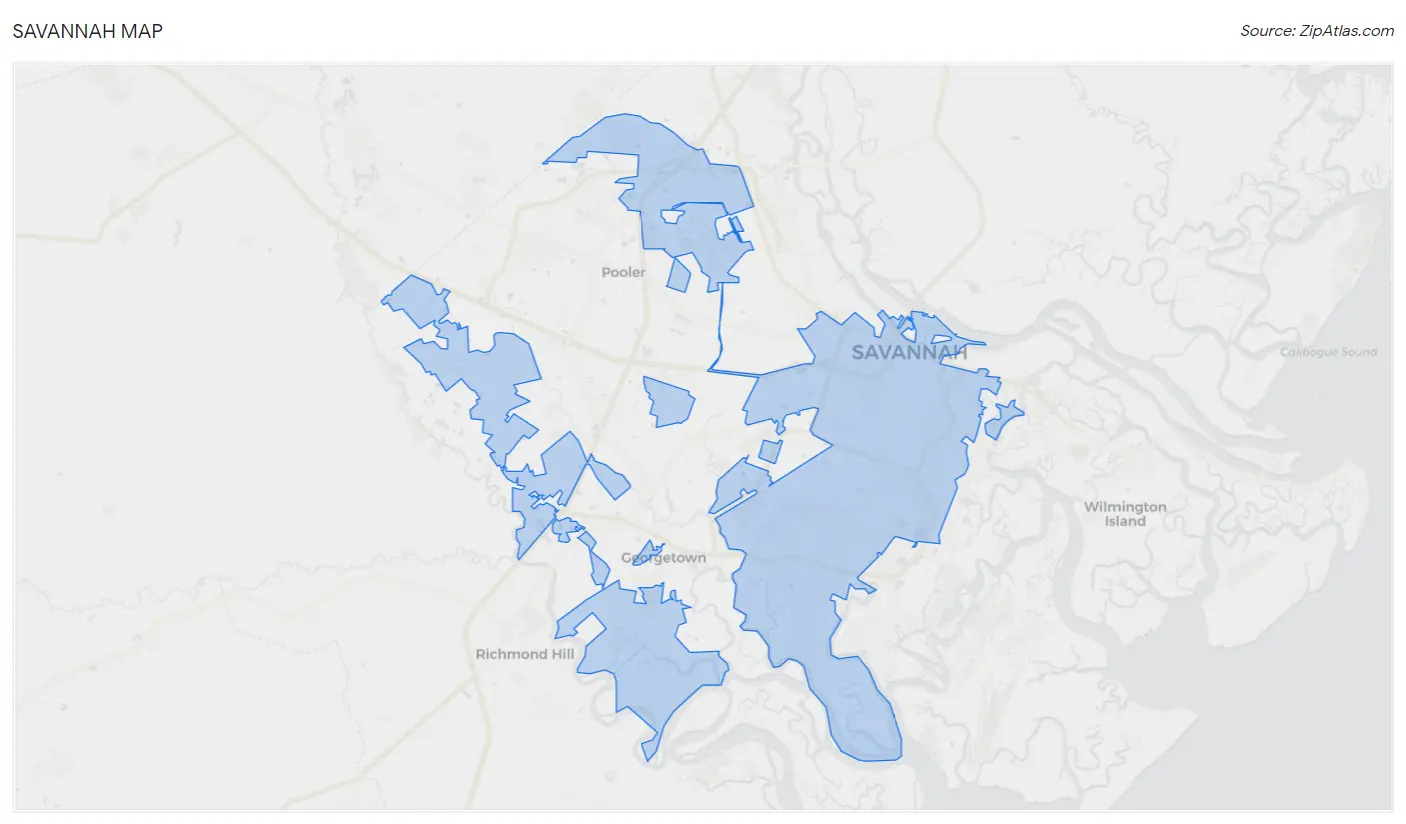
Savannah Map
Savannah Overview
$30,978
PER CAPITA INCOME
$68,116
AVG FAMILY INCOME
$54,748
AVG HOUSEHOLD INCOME
16.9%
WAGE / INCOME GAP [ % ]
83.1¢/ $1
WAGE / INCOME GAP [ $ ]
$12,160
FAMILY INCOME DEFICIT
0.49
INEQUALITY / GINI INDEX
147,583
TOTAL POPULATION
70,226
MALE POPULATION
77,357
FEMALE POPULATION
90.78
MALES / 100 FEMALES
110.15
FEMALES / 100 MALES
33.5
MEDIAN AGE
3.2
AVG FAMILY SIZE
2.4
AVG HOUSEHOLD SIZE
77,127
LABOR FORCE [ PEOPLE ]
64.2%
PERCENT IN LABOR FORCE
7.2%
UNEMPLOYMENT RATE
Savannah Area Codes
Income in Savannah
Income Overview in Savannah
Per Capita Income in Savannah is $30,978, while median incomes of families and households are $68,116 and $54,748 respectively.
| Characteristic | Number | Measure |
| Per Capita Income | 147,583 | $30,978 |
| Median Family Income | 31,632 | $68,116 |
| Mean Family Income | 31,632 | $90,170 |
| Median Household Income | 57,673 | $54,748 |
| Mean Household Income | 57,673 | $75,494 |
| Income Deficit | 31,632 | $12,160 |
| Wage / Income Gap (%) | 147,583 | 16.90% |
| Wage / Income Gap ($) | 147,583 | 83.10¢ per $1 |
| Gini / Inequality Index | 147,583 | 0.49 |
Earnings by Sex in Savannah
Average Earnings in Savannah are $30,588, $33,511 for men and $27,848 for women, a difference of 16.9%.
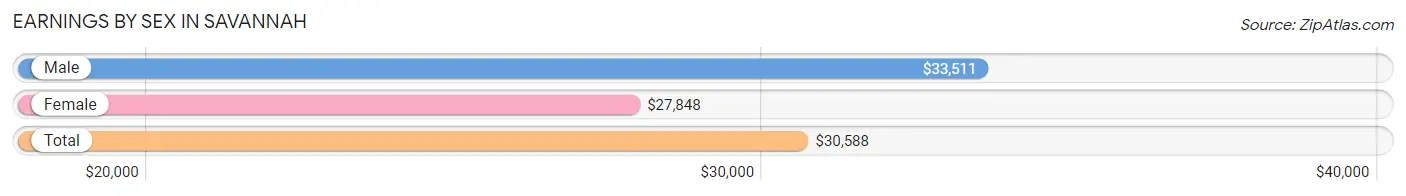
| Sex | Number | Average Earnings |
| Male | 39,826 (48.1%) | $33,511 |
| Female | 42,986 (51.9%) | $27,848 |
| Total | 82,812 (100.0%) | $30,588 |
Earnings by Sex by Income Bracket in Savannah
The most common earnings brackets in Savannah are $25,000 to $29,999 for men (3,774 | 9.5%) and $25,000 to $29,999 for women (3,540 | 8.2%).
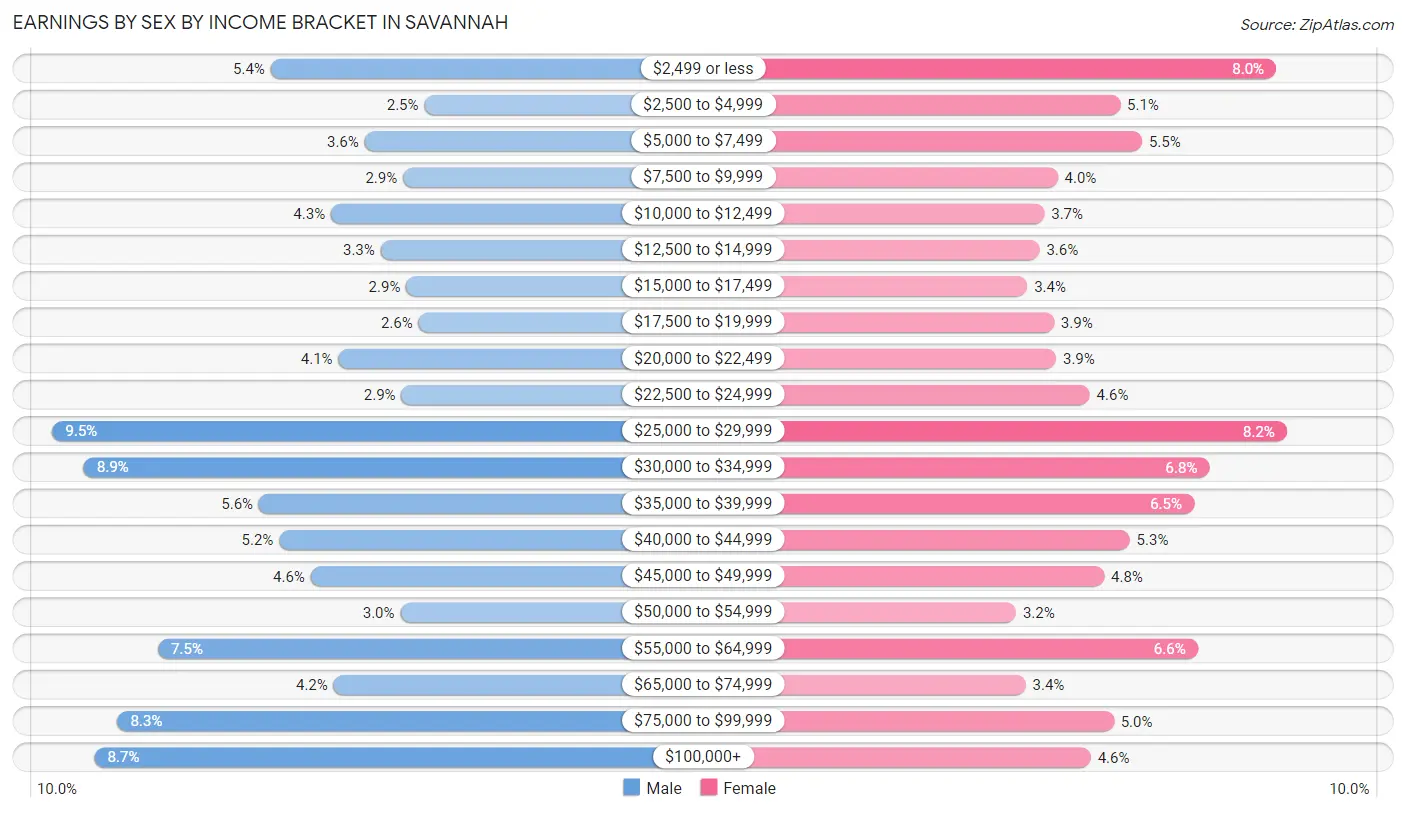
| Income | Male | Female |
| $2,499 or less | 2,146 (5.4%) | 3,455 (8.0%) |
| $2,500 to $4,999 | 999 (2.5%) | 2,199 (5.1%) |
| $5,000 to $7,499 | 1,446 (3.6%) | 2,379 (5.5%) |
| $7,500 to $9,999 | 1,158 (2.9%) | 1,698 (4.0%) |
| $10,000 to $12,499 | 1,696 (4.3%) | 1,592 (3.7%) |
| $12,500 to $14,999 | 1,325 (3.3%) | 1,553 (3.6%) |
| $15,000 to $17,499 | 1,135 (2.9%) | 1,455 (3.4%) |
| $17,500 to $19,999 | 1,044 (2.6%) | 1,667 (3.9%) |
| $20,000 to $22,499 | 1,639 (4.1%) | 1,686 (3.9%) |
| $22,500 to $24,999 | 1,169 (2.9%) | 1,955 (4.5%) |
| $25,000 to $29,999 | 3,774 (9.5%) | 3,540 (8.2%) |
| $30,000 to $34,999 | 3,539 (8.9%) | 2,917 (6.8%) |
| $35,000 to $39,999 | 2,236 (5.6%) | 2,796 (6.5%) |
| $40,000 to $44,999 | 2,083 (5.2%) | 2,278 (5.3%) |
| $45,000 to $49,999 | 1,846 (4.6%) | 2,073 (4.8%) |
| $50,000 to $54,999 | 1,178 (3.0%) | 1,364 (3.2%) |
| $55,000 to $64,999 | 2,985 (7.5%) | 2,824 (6.6%) |
| $65,000 to $74,999 | 1,678 (4.2%) | 1,441 (3.4%) |
| $75,000 to $99,999 | 3,290 (8.3%) | 2,151 (5.0%) |
| $100,000+ | 3,460 (8.7%) | 1,963 (4.6%) |
| Total | 39,826 (100.0%) | 42,986 (100.0%) |
Earnings by Sex by Educational Attainment in Savannah
Average earnings in Savannah are $39,133 for men and $33,938 for women, a difference of 13.3%. Men with an educational attainment of graduate degree enjoy the highest average annual earnings of $67,796, while those with less than high school education earn the least with $25,464. Women with an educational attainment of graduate degree earn the most with the average annual earnings of $51,353, while those with less than high school education have the smallest earnings of $21,720.
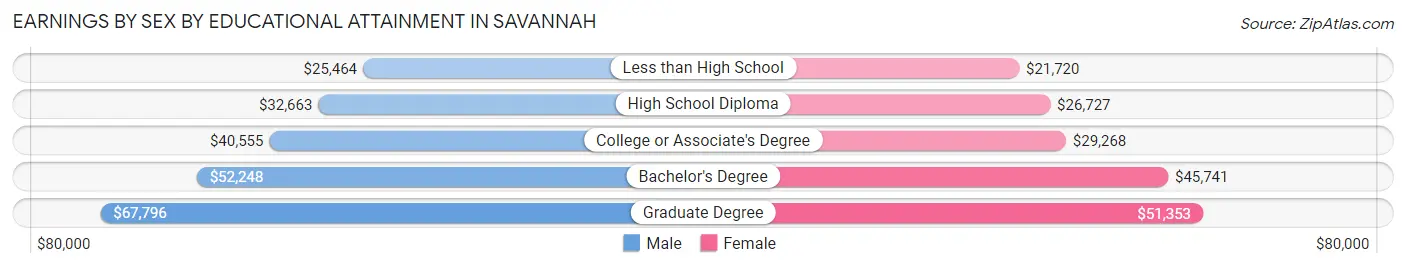
| Educational Attainment | Male Income | Female Income |
| Less than High School | $25,464 | $21,720 |
| High School Diploma | $32,663 | $26,727 |
| College or Associate's Degree | $40,555 | $29,268 |
| Bachelor's Degree | $52,248 | $45,741 |
| Graduate Degree | $67,796 | $51,353 |
| Total | $39,133 | $33,938 |
Family Income in Savannah
Family Income Brackets in Savannah
According to the Savannah family income data, there are 6,105 families falling into the $50,000 to $74,999 income range, which is the most common income bracket and makes up 19.3% of all families. Conversely, the $10,000 to $14,999 income bracket is the least frequent group with only 759 families (2.4%) belonging to this category.
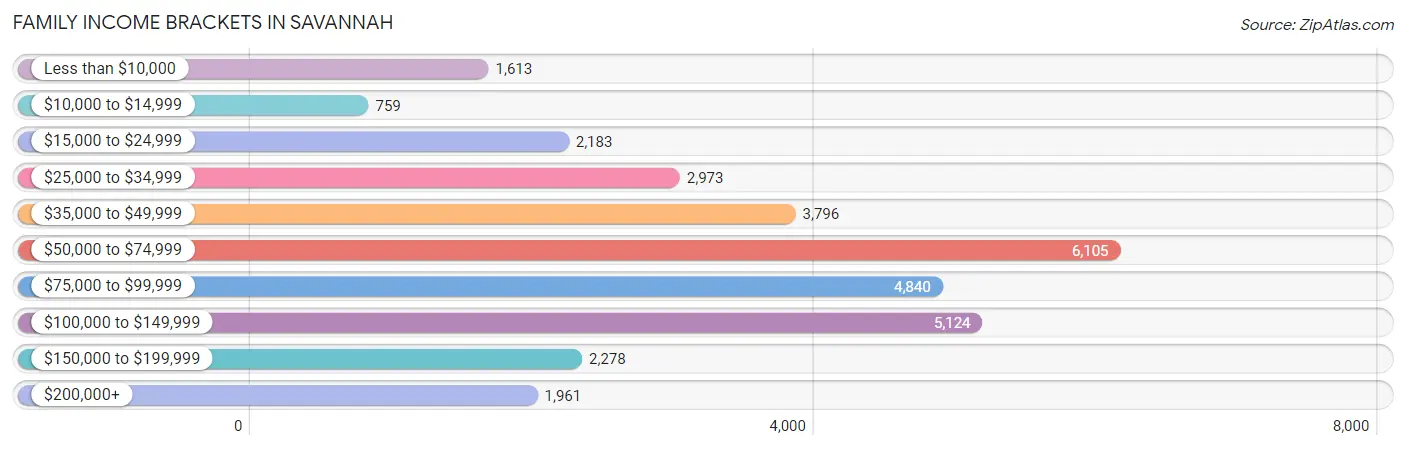
| Income Bracket | # Families | % Families |
| Less than $10,000 | 1,613 | 5.1% |
| $10,000 to $14,999 | 759 | 2.4% |
| $15,000 to $24,999 | 2,183 | 6.9% |
| $25,000 to $34,999 | 2,973 | 9.4% |
| $35,000 to $49,999 | 3,796 | 12.0% |
| $50,000 to $74,999 | 6,105 | 19.3% |
| $75,000 to $99,999 | 4,840 | 15.3% |
| $100,000 to $149,999 | 5,124 | 16.2% |
| $150,000 to $199,999 | 2,278 | 7.2% |
| $200,000+ | 1,961 | 6.2% |
Family Income by Famaliy Size in Savannah
7+ person families (407 | 1.3%) account for the highest median family income in Savannah with $93,688 per family, while 2-person families (16,543 | 52.3%) have the highest median income of $32,374 per family member.
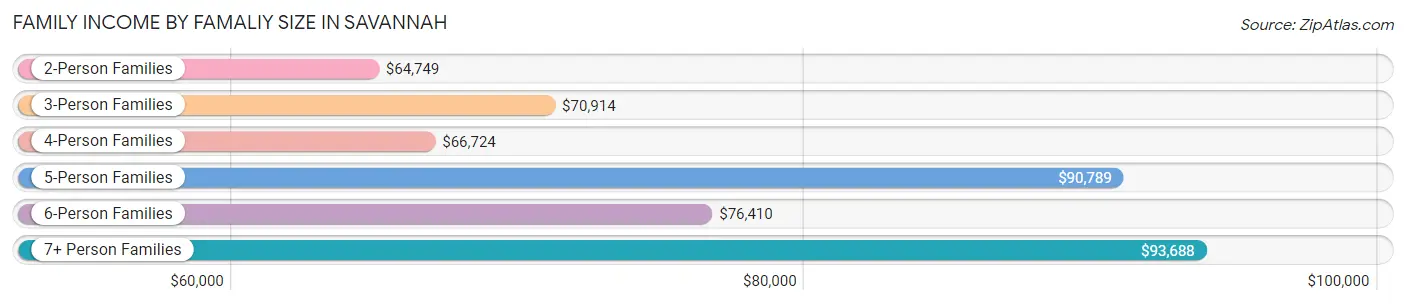
| Income Bracket | # Families | Median Income |
| 2-Person Families | 16,543 (52.3%) | $64,749 |
| 3-Person Families | 6,815 (21.5%) | $70,914 |
| 4-Person Families | 4,954 (15.7%) | $66,724 |
| 5-Person Families | 2,200 (7.0%) | $90,789 |
| 6-Person Families | 713 (2.2%) | $76,410 |
| 7+ Person Families | 407 (1.3%) | $93,688 |
| Total | 31,632 (100.0%) | $68,116 |
Family Income by Number of Earners in Savannah
The median family income in Savannah is $68,116, with families comprising 3+ earners (3,060) having the highest median family income of $116,102, while families with no earners (4,369) have the lowest median family income of $34,986, accounting for 9.7% and 13.8% of families, respectively.
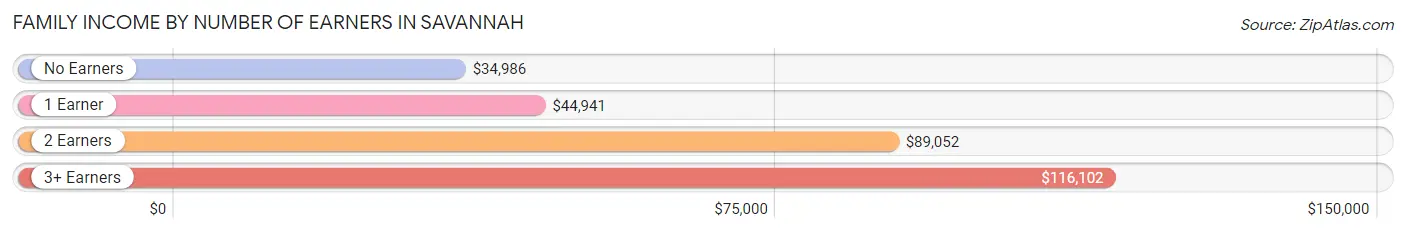
| Number of Earners | # Families | Median Income |
| No Earners | 4,369 (13.8%) | $34,986 |
| 1 Earner | 11,861 (37.5%) | $44,941 |
| 2 Earners | 12,342 (39.0%) | $89,052 |
| 3+ Earners | 3,060 (9.7%) | $116,102 |
| Total | 31,632 (100.0%) | $68,116 |
Household Income in Savannah
Household Income Brackets in Savannah
With 10,785 households falling in the category, the $50,000 to $74,999 income range is the most frequent in Savannah, accounting for 18.7% of all households. In contrast, only 2,884 households (5.0%) fall into the $200,000+ income bracket, making it the least populous group.
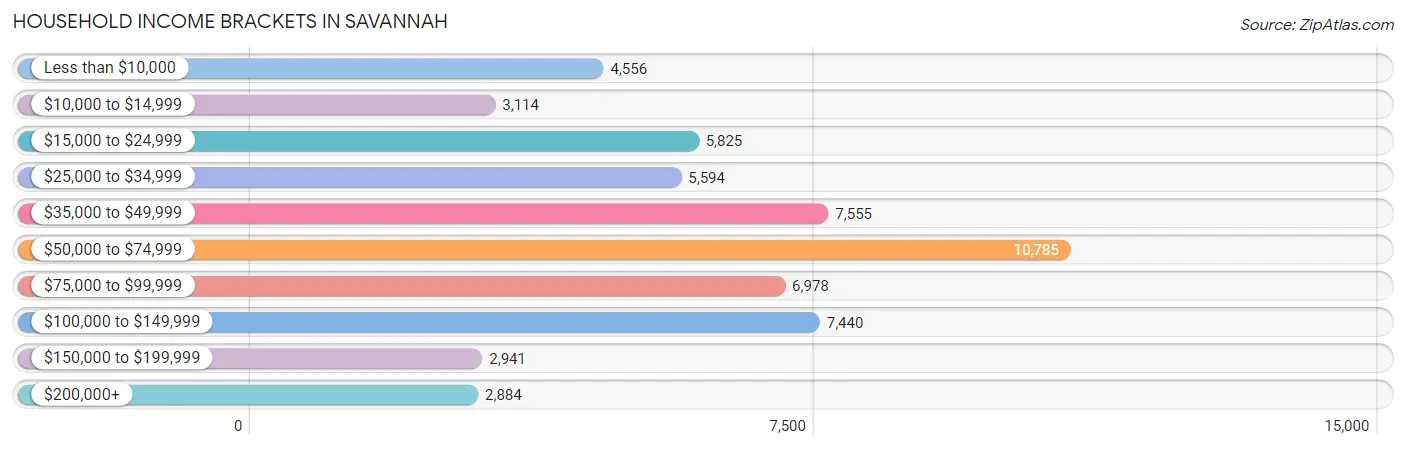
| Income Bracket | # Households | % Households |
| Less than $10,000 | 4,556 | 7.9% |
| $10,000 to $14,999 | 3,114 | 5.4% |
| $15,000 to $24,999 | 5,825 | 10.1% |
| $25,000 to $34,999 | 5,594 | 9.7% |
| $35,000 to $49,999 | 7,555 | 13.1% |
| $50,000 to $74,999 | 10,785 | 18.7% |
| $75,000 to $99,999 | 6,978 | 12.1% |
| $100,000 to $149,999 | 7,440 | 12.9% |
| $150,000 to $199,999 | 2,941 | 5.1% |
| $200,000+ | 2,884 | 5.0% |
Household Income by Householder Age in Savannah
The median household income in Savannah is $54,748, with the highest median household income of $62,045 found in the 45 to 64 years age bracket for the primary householder. A total of 18,342 households (31.8%) fall into this category. Meanwhile, the 15 to 24 years age bracket for the primary householder has the lowest median household income of $25,713, with 4,333 households (7.5%) in this group.
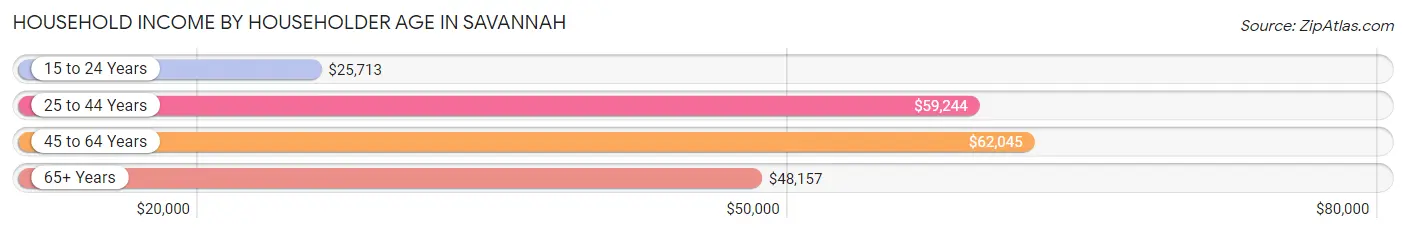
| Income Bracket | # Households | Median Income |
| 15 to 24 Years | 4,333 (7.5%) | $25,713 |
| 25 to 44 Years | 20,612 (35.7%) | $59,244 |
| 45 to 64 Years | 18,342 (31.8%) | $62,045 |
| 65+ Years | 14,386 (24.9%) | $48,157 |
| Total | 57,673 (100.0%) | $54,748 |
Poverty in Savannah
Income Below Poverty by Sex and Age in Savannah
With 17.9% poverty level for males and 19.9% for females among the residents of Savannah, under 5 year old males and 5 year old females are the most vulnerable to poverty, with 1,599 males (36.2%) and 382 females (42.6%) in their respective age groups living below the poverty level.
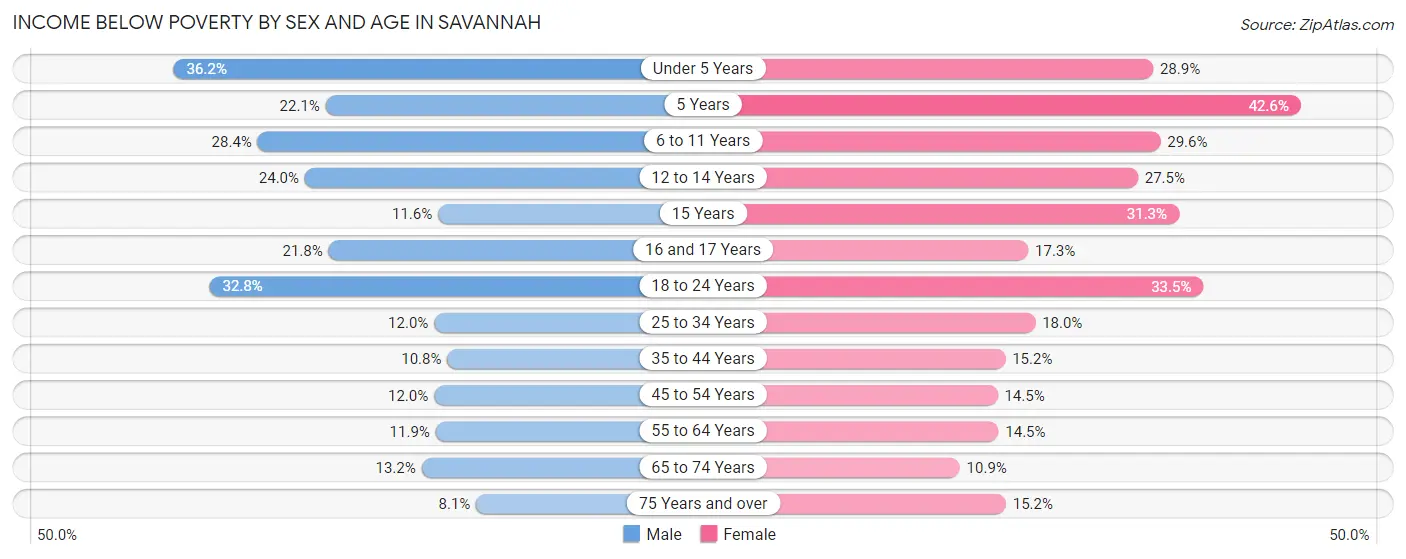
| Age Bracket | Male | Female |
| Under 5 Years | 1,599 (36.2%) | 1,356 (28.9%) |
| 5 Years | 178 (22.1%) | 382 (42.6%) |
| 6 to 11 Years | 1,510 (28.4%) | 1,331 (29.6%) |
| 12 to 14 Years | 592 (24.0%) | 594 (27.5%) |
| 15 Years | 79 (11.6%) | 305 (31.3%) |
| 16 and 17 Years | 234 (21.8%) | 177 (17.3%) |
| 18 to 24 Years | 2,478 (32.8%) | 2,809 (33.5%) |
| 25 to 34 Years | 1,499 (12.0%) | 2,471 (17.9%) |
| 35 to 44 Years | 805 (10.8%) | 1,256 (15.2%) |
| 45 to 54 Years | 763 (12.0%) | 1,074 (14.4%) |
| 55 to 64 Years | 863 (11.8%) | 1,332 (14.5%) |
| 65 to 74 Years | 686 (13.2%) | 754 (10.9%) |
| 75 Years and over | 293 (8.1%) | 809 (15.2%) |
| Total | 11,579 (17.9%) | 14,650 (19.9%) |
Income Above Poverty by Sex and Age in Savannah
According to the poverty statistics in Savannah, males aged 75 years and over and females aged 65 to 74 years are the age groups that are most secure financially, with 91.9% of males and 89.1% of females in these age groups living above the poverty line.
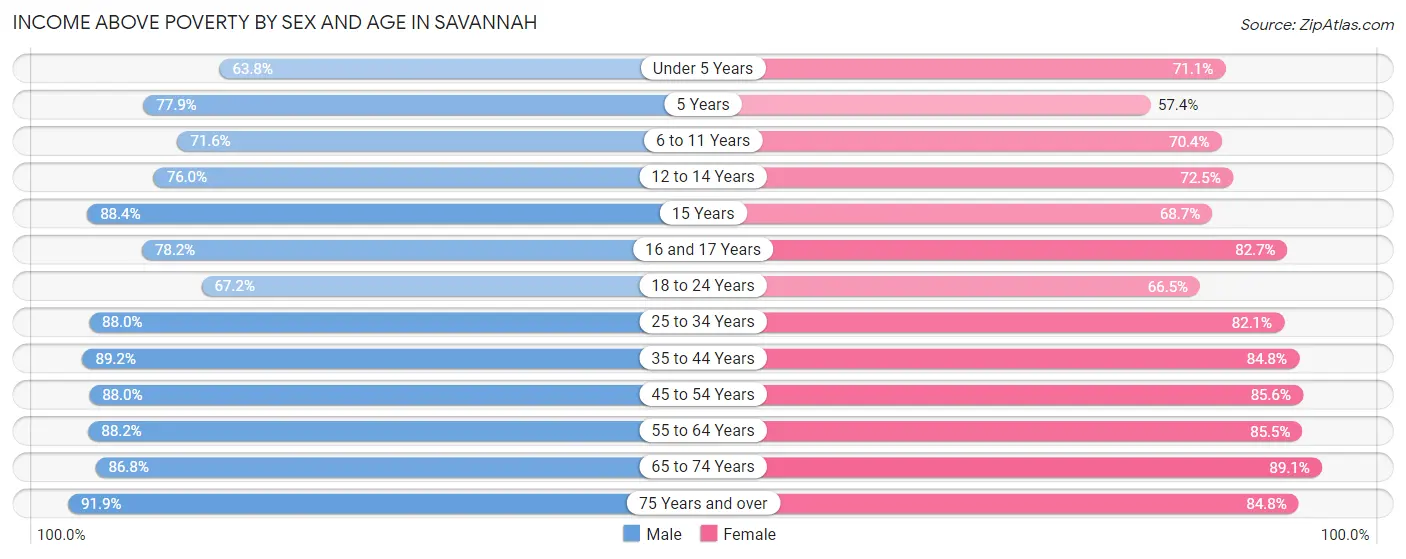
| Age Bracket | Male | Female |
| Under 5 Years | 2,821 (63.8%) | 3,340 (71.1%) |
| 5 Years | 629 (77.9%) | 515 (57.4%) |
| 6 to 11 Years | 3,813 (71.6%) | 3,171 (70.4%) |
| 12 to 14 Years | 1,876 (76.0%) | 1,568 (72.5%) |
| 15 Years | 600 (88.4%) | 670 (68.7%) |
| 16 and 17 Years | 840 (78.2%) | 847 (82.7%) |
| 18 to 24 Years | 5,067 (67.2%) | 5,567 (66.5%) |
| 25 to 34 Years | 10,998 (88.0%) | 11,292 (82.1%) |
| 35 to 44 Years | 6,671 (89.2%) | 7,026 (84.8%) |
| 45 to 54 Years | 5,597 (88.0%) | 6,357 (85.6%) |
| 55 to 64 Years | 6,420 (88.1%) | 7,833 (85.5%) |
| 65 to 74 Years | 4,525 (86.8%) | 6,141 (89.1%) |
| 75 Years and over | 3,327 (91.9%) | 4,506 (84.8%) |
| Total | 53,184 (82.1%) | 58,833 (80.1%) |
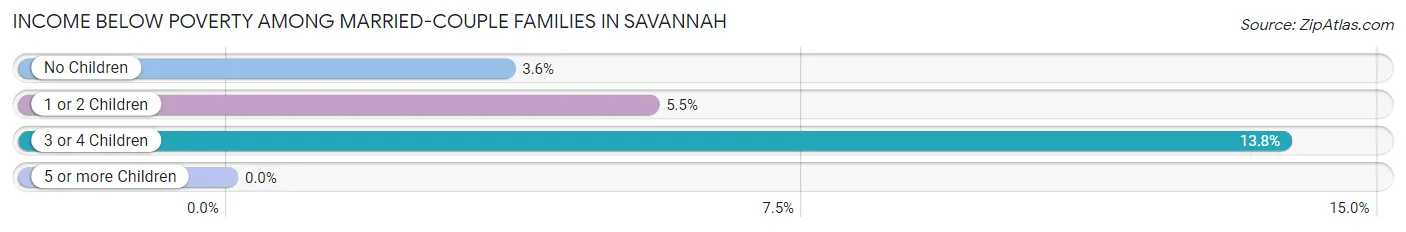
Income Below Poverty Among Married-Couple Families in Savannah
The poverty statistics for married-couple families in Savannah show that 4.8% or 847 of the total 17,677 families live below the poverty line. Families with 3 or 4 children have the highest poverty rate of 13.8%, comprising of 162 families. On the other hand, families with 5 or more children have the lowest poverty rate of 0.0%, which includes 0 families.
| Children | Above Poverty | Below Poverty |
| No Children | 11,224 (96.4%) | 422 (3.6%) |
| 1 or 2 Children | 4,519 (94.5%) | 263 (5.5%) |
| 3 or 4 Children | 1,015 (86.2%) | 162 (13.8%) |
| 5 or more Children | 72 (100.0%) | 0 (0.0%) |
| Total | 16,830 (95.2%) | 847 (4.8%) |
Income Below Poverty Among Single-Parent Households in Savannah
According to the poverty data in Savannah, 9.8% or 247 single-father households and 25.2% or 2,885 single-mother households are living below the poverty line. Among single-father households, those with 3 or 4 children have the highest poverty rate, with 21 households (26.6%) experiencing poverty. Likewise, among single-mother households, those with 5 or more children have the highest poverty rate, with 105 households (68.6%) falling below the poverty line.
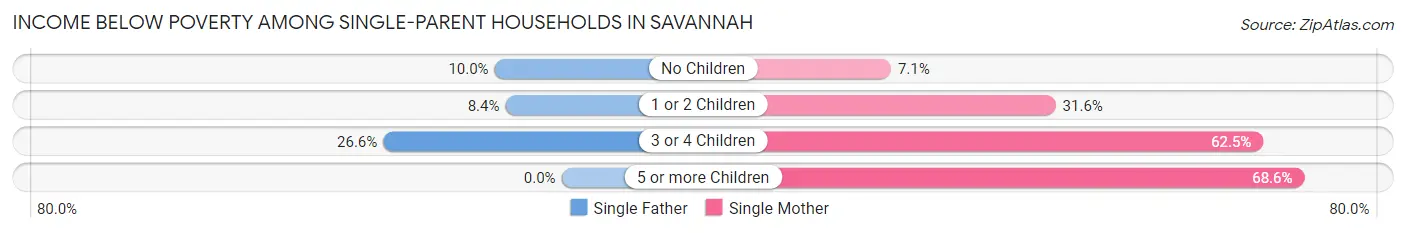
| Children | Single Father | Single Mother |
| No Children | 137 (10.0%) | 336 (7.0%) |
| 1 or 2 Children | 89 (8.4%) | 1,662 (31.6%) |
| 3 or 4 Children | 21 (26.6%) | 782 (62.5%) |
| 5 or more Children | 0 (0.0%) | 105 (68.6%) |
| Total | 247 (9.8%) | 2,885 (25.2%) |
Income Below Poverty Among Married-Couple vs Single-Parent Households in Savannah
The poverty data for Savannah shows that 847 of the married-couple family households (4.8%) and 3,132 of the single-parent households (22.4%) are living below the poverty level. Within the married-couple family households, those with 3 or 4 children have the highest poverty rate, with 162 households (13.8%) falling below the poverty line. Among the single-parent households, those with 5 or more children have the highest poverty rate, with 105 household (63.6%) living below poverty.
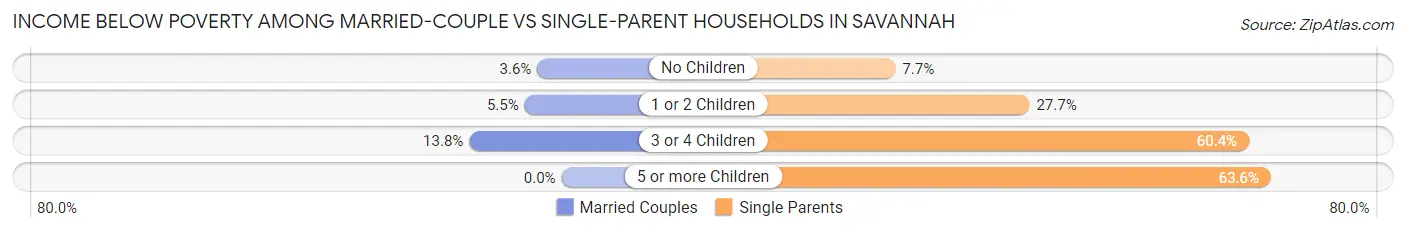
| Children | Married-Couple Families | Single-Parent Households |
| No Children | 422 (3.6%) | 473 (7.7%) |
| 1 or 2 Children | 263 (5.5%) | 1,751 (27.7%) |
| 3 or 4 Children | 162 (13.8%) | 803 (60.4%) |
| 5 or more Children | 0 (0.0%) | 105 (63.6%) |
| Total | 847 (4.8%) | 3,132 (22.4%) |
Race in Savannah
The most populous races in Savannah are Black / African American (77,831 | 52.7%), White / Caucasian (56,514 | 38.3%), and Hispanic or Latino (9,514 | 6.5%).
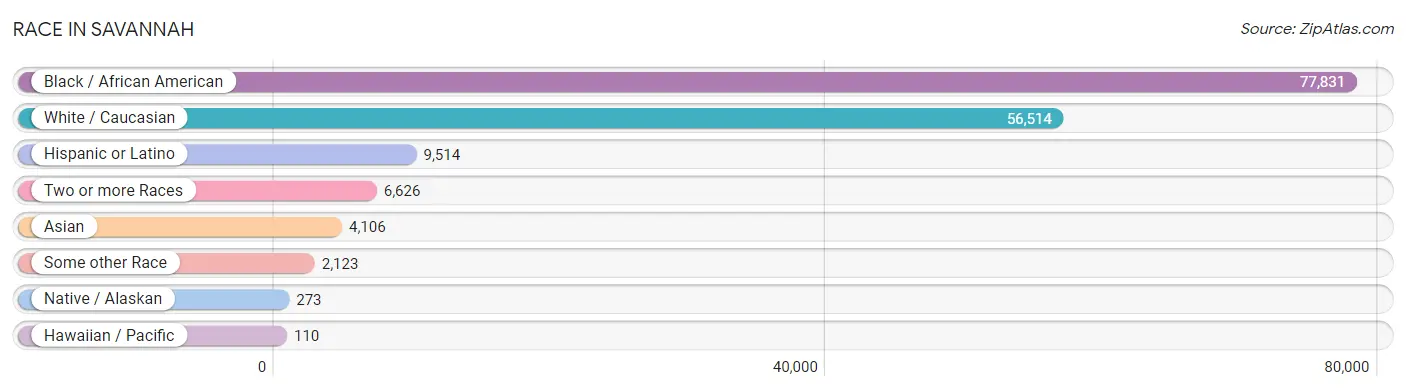
| Race | # Population | % Population |
| Asian | 4,106 | 2.8% |
| Black / African American | 77,831 | 52.7% |
| Hawaiian / Pacific | 110 | 0.1% |
| Hispanic or Latino | 9,514 | 6.5% |
| Native / Alaskan | 273 | 0.2% |
| White / Caucasian | 56,514 | 38.3% |
| Two or more Races | 6,626 | 4.5% |
| Some other Race | 2,123 | 1.4% |
| Total | 147,583 | 100.0% |
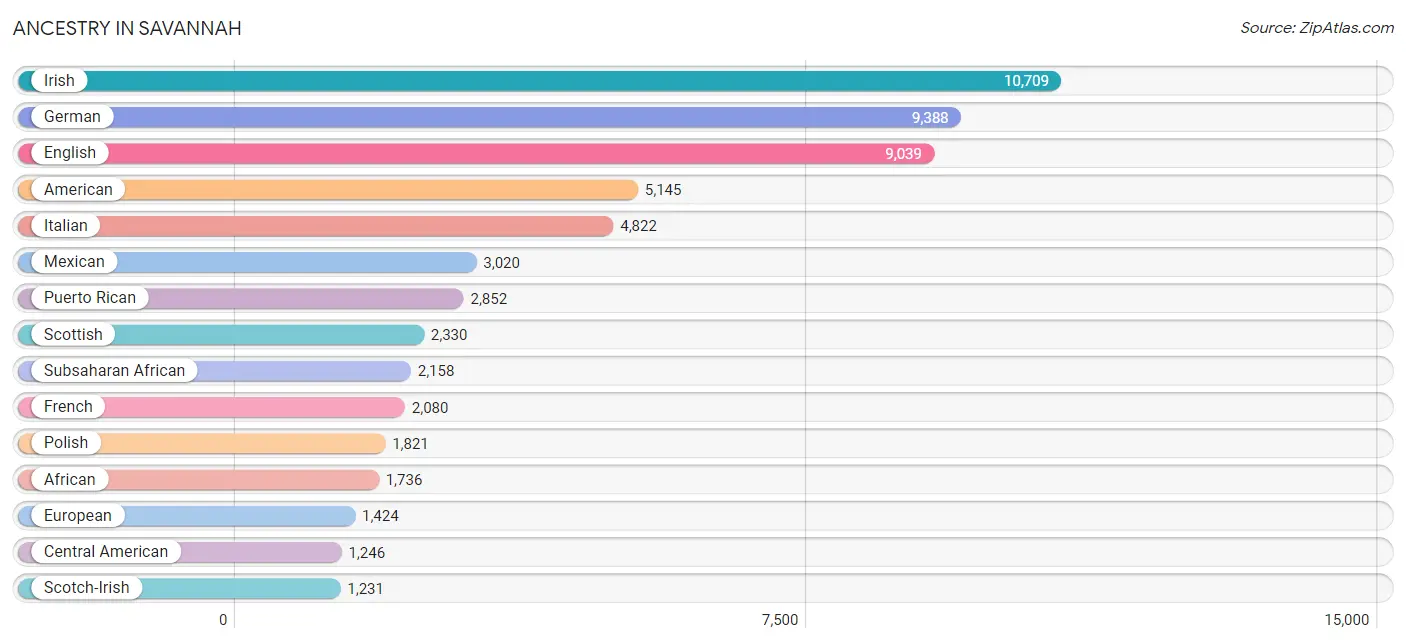
Ancestry in Savannah
The most populous ancestries reported in Savannah are Irish (10,709 | 7.3%), German (9,388 | 6.4%), English (9,039 | 6.1%), American (5,145 | 3.5%), and Italian (4,822 | 3.3%), together accounting for 26.5% of all Savannah residents.
| Ancestry | # Population | % Population |
| African | 1,736 | 1.2% |
| Alsatian | 1 | 0.0% |
| American | 5,145 | 3.5% |
| Apache | 7 | 0.0% |
| Arab | 432 | 0.3% |
| Argentinean | 140 | 0.1% |
| Armenian | 15 | 0.0% |
| Australian | 52 | 0.0% |
| Austrian | 249 | 0.2% |
| Bahamian | 49 | 0.0% |
| Bangladeshi | 21 | 0.0% |
| Barbadian | 69 | 0.1% |
| Basque | 13 | 0.0% |
| Belgian | 36 | 0.0% |
| Bhutanese | 161 | 0.1% |
| Blackfeet | 26 | 0.0% |
| Bolivian | 22 | 0.0% |
| Brazilian | 27 | 0.0% |
| British | 605 | 0.4% |
| British West Indian | 35 | 0.0% |
| Bulgarian | 13 | 0.0% |
| Burmese | 592 | 0.4% |
| Cajun | 40 | 0.0% |
| Canadian | 139 | 0.1% |
| Cape Verdean | 19 | 0.0% |
| Central American | 1,246 | 0.8% |
| Central American Indian | 21 | 0.0% |
| Cherokee | 282 | 0.2% |
| Chickasaw | 6 | 0.0% |
| Chilean | 7 | 0.0% |
| Chippewa | 4 | 0.0% |
| Choctaw | 63 | 0.0% |
| Colombian | 269 | 0.2% |
| Costa Rican | 17 | 0.0% |
| Cree | 4 | 0.0% |
| Creek | 30 | 0.0% |
| Croatian | 30 | 0.0% |
| Crow | 6 | 0.0% |
| Cuban | 675 | 0.5% |
| Cypriot | 10 | 0.0% |
| Czech | 281 | 0.2% |
| Czechoslovakian | 62 | 0.0% |
| Danish | 132 | 0.1% |
| Dominican | 292 | 0.2% |
| Dutch | 995 | 0.7% |
| Eastern European | 314 | 0.2% |
| Ecuadorian | 58 | 0.0% |
| Egyptian | 20 | 0.0% |
| English | 9,039 | 6.1% |
| Estonian | 18 | 0.0% |
| Ethiopian | 20 | 0.0% |
| European | 1,424 | 1.0% |
| Filipino | 15 | 0.0% |
| Finnish | 114 | 0.1% |
| French | 2,080 | 1.4% |
| French Canadian | 516 | 0.4% |
| German | 9,388 | 6.4% |
| Ghanaian | 69 | 0.1% |
| Greek | 428 | 0.3% |
| Guamanian / Chamorro | 44 | 0.0% |
| Guatemalan | 157 | 0.1% |
| Guyanese | 41 | 0.0% |
| Haitian | 277 | 0.2% |
| Honduran | 780 | 0.5% |
| Hungarian | 276 | 0.2% |
| Indian (Asian) | 1,007 | 0.7% |
| Indonesian | 146 | 0.1% |
| Inupiat | 3 | 0.0% |
| Iranian | 158 | 0.1% |
| Irish | 10,709 | 7.3% |
| Iroquois | 9 | 0.0% |
| Israeli | 23 | 0.0% |
| Italian | 4,822 | 3.3% |
| Jamaican | 1,031 | 0.7% |
| Japanese | 69 | 0.1% |
| Kenyan | 12 | 0.0% |
| Korean | 1,032 | 0.7% |
| Laotian | 61 | 0.0% |
| Latvian | 12 | 0.0% |
| Lebanese | 165 | 0.1% |
| Liberian | 25 | 0.0% |
| Lithuanian | 254 | 0.2% |
| Malaysian | 59 | 0.0% |
| Menominee | 8 | 0.0% |
| Mexican | 3,020 | 2.1% |
| Mexican American Indian | 29 | 0.0% |
| Moroccan | 23 | 0.0% |
| Native Hawaiian | 60 | 0.0% |
| Navajo | 75 | 0.1% |
| Nicaraguan | 26 | 0.0% |
| Nigerian | 102 | 0.1% |
| Northern European | 120 | 0.1% |
| Norwegian | 378 | 0.3% |
| Pakistani | 261 | 0.2% |
| Palestinian | 39 | 0.0% |
| Panamanian | 124 | 0.1% |
| Pennsylvania German | 26 | 0.0% |
| Peruvian | 78 | 0.1% |
| Polish | 1,821 | 1.2% |
| Portuguese | 251 | 0.2% |
| Potawatomi | 47 | 0.0% |
| Pueblo | 9 | 0.0% |
| Puerto Rican | 2,852 | 1.9% |
| Puget Sound Salish | 1 | 0.0% |
| Romanian | 58 | 0.0% |
| Russian | 635 | 0.4% |
| Salvadoran | 142 | 0.1% |
| Scandinavian | 484 | 0.3% |
| Scotch-Irish | 1,231 | 0.8% |
| Scottish | 2,330 | 1.6% |
| Serbian | 46 | 0.0% |
| Sioux | 14 | 0.0% |
| Slavic | 77 | 0.1% |
| Slovak | 75 | 0.1% |
| South African | 69 | 0.1% |
| South American | 657 | 0.4% |
| South American Indian | 22 | 0.0% |
| Spaniard | 136 | 0.1% |
| Spanish | 384 | 0.3% |
| Sri Lankan | 1,114 | 0.7% |
| Subsaharan African | 2,158 | 1.5% |
| Sudanese | 6 | 0.0% |
| Swedish | 688 | 0.5% |
| Swiss | 150 | 0.1% |
| Syrian | 14 | 0.0% |
| Thai | 611 | 0.4% |
| Tongan | 10 | 0.0% |
| Trinidadian and Tobagonian | 73 | 0.1% |
| Turkish | 49 | 0.0% |
| Ugandan | 17 | 0.0% |
| Ukrainian | 244 | 0.2% |
| Uruguayan | 7 | 0.0% |
| Venezuelan | 53 | 0.0% |
| Vietnamese | 4 | 0.0% |
| Welsh | 694 | 0.5% |
| West Indian | 203 | 0.1% |
| Yugoslavian | 21 | 0.0% |
| Zimbabwean | 11 | 0.0% | View All 138 Rows |
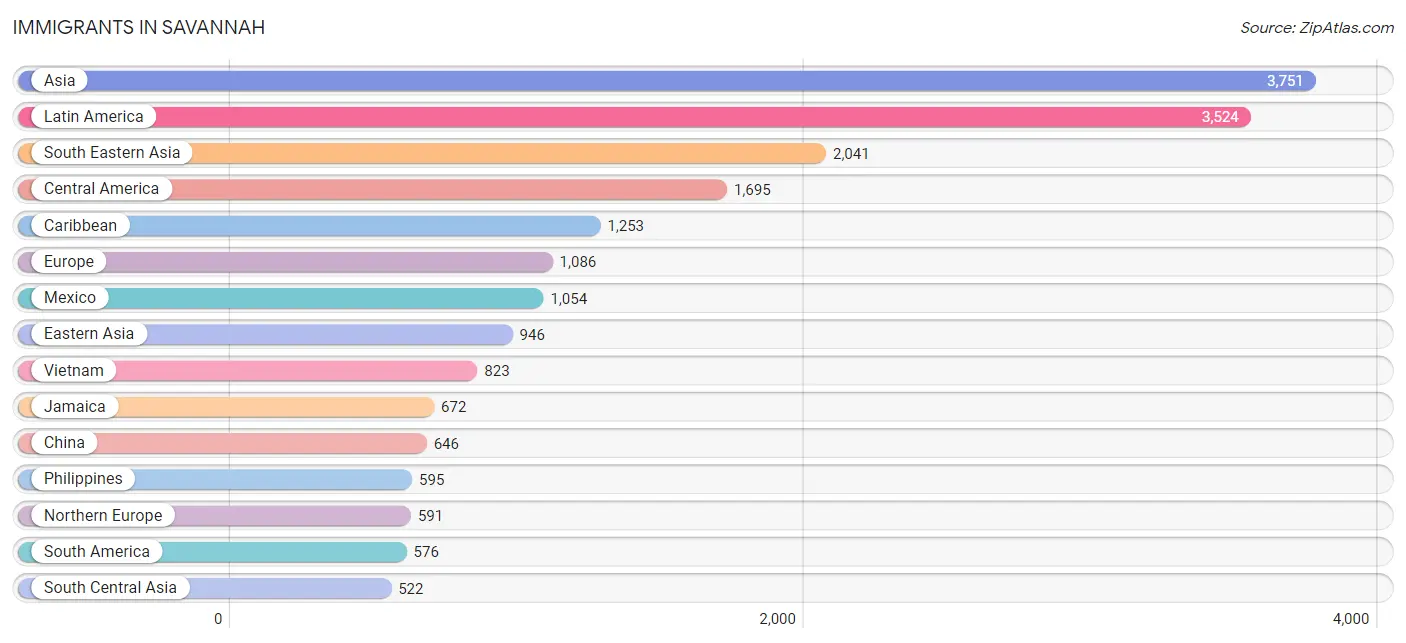
Immigrants in Savannah
The most numerous immigrant groups reported in Savannah came from Asia (3,751 | 2.5%), Latin America (3,524 | 2.4%), South Eastern Asia (2,041 | 1.4%), Central America (1,695 | 1.1%), and Caribbean (1,253 | 0.9%), together accounting for 8.3% of all Savannah residents.
| Immigration Origin | # Population | % Population |
| Africa | 459 | 0.3% |
| Argentina | 24 | 0.0% |
| Asia | 3,751 | 2.5% |
| Australia | 27 | 0.0% |
| Austria | 28 | 0.0% |
| Bahamas | 26 | 0.0% |
| Bangladesh | 4 | 0.0% |
| Barbados | 34 | 0.0% |
| Belarus | 6 | 0.0% |
| Belgium | 31 | 0.0% |
| Bolivia | 11 | 0.0% |
| Brazil | 28 | 0.0% |
| Cambodia | 88 | 0.1% |
| Cameroon | 19 | 0.0% |
| Canada | 238 | 0.2% |
| Caribbean | 1,253 | 0.9% |
| Central America | 1,695 | 1.1% |
| China | 646 | 0.4% |
| Colombia | 181 | 0.1% |
| Congo | 15 | 0.0% |
| Costa Rica | 13 | 0.0% |
| Cuba | 220 | 0.2% |
| Denmark | 15 | 0.0% |
| Dominica | 19 | 0.0% |
| Dominican Republic | 63 | 0.0% |
| Eastern Africa | 133 | 0.1% |
| Eastern Asia | 946 | 0.6% |
| Eastern Europe | 88 | 0.1% |
| Ecuador | 33 | 0.0% |
| El Salvador | 58 | 0.0% |
| England | 148 | 0.1% |
| Ethiopia | 21 | 0.0% |
| Europe | 1,086 | 0.7% |
| France | 86 | 0.1% |
| Germany | 189 | 0.1% |
| Ghana | 45 | 0.0% |
| Greece | 9 | 0.0% |
| Grenada | 17 | 0.0% |
| Guatemala | 96 | 0.1% |
| Guyana | 70 | 0.1% |
| Haiti | 88 | 0.1% |
| Honduras | 344 | 0.2% |
| Hong Kong | 94 | 0.1% |
| India | 460 | 0.3% |
| Indonesia | 115 | 0.1% |
| Iran | 15 | 0.0% |
| Ireland | 132 | 0.1% |
| Israel | 44 | 0.0% |
| Italy | 32 | 0.0% |
| Jamaica | 672 | 0.5% |
| Japan | 10 | 0.0% |
| Kenya | 14 | 0.0% |
| Korea | 290 | 0.2% |
| Laos | 81 | 0.1% |
| Latin America | 3,524 | 2.4% |
| Lebanon | 34 | 0.0% |
| Liberia | 24 | 0.0% |
| Malaysia | 40 | 0.0% |
| Mexico | 1,054 | 0.7% |
| Micronesia | 70 | 0.1% |
| Middle Africa | 70 | 0.1% |
| Morocco | 28 | 0.0% |
| Nepal | 39 | 0.0% |
| Netherlands | 18 | 0.0% |
| Nigeria | 23 | 0.0% |
| Northern Africa | 28 | 0.0% |
| Northern Europe | 591 | 0.4% |
| Oceania | 101 | 0.1% |
| Panama | 74 | 0.1% |
| Peru | 60 | 0.0% |
| Philippines | 595 | 0.4% |
| Romania | 40 | 0.0% |
| Russia | 19 | 0.0% |
| Saudi Arabia | 83 | 0.1% |
| Scotland | 118 | 0.1% |
| South Africa | 84 | 0.1% |
| South America | 576 | 0.4% |
| South Central Asia | 522 | 0.4% |
| South Eastern Asia | 2,041 | 1.4% |
| Southern Europe | 41 | 0.0% |
| Sri Lanka | 4 | 0.0% |
| Sweden | 23 | 0.0% |
| Switzerland | 14 | 0.0% |
| Syria | 14 | 0.0% |
| Taiwan | 61 | 0.0% |
| Thailand | 223 | 0.2% |
| Trinidad and Tobago | 83 | 0.1% |
| Turkey | 26 | 0.0% |
| Uganda | 34 | 0.0% |
| Uruguay | 73 | 0.1% |
| Venezuela | 96 | 0.1% |
| Vietnam | 823 | 0.6% |
| West Indies | 31 | 0.0% |
| Western Africa | 144 | 0.1% |
| Western Asia | 242 | 0.2% |
| Western Europe | 366 | 0.3% |
| Yemen | 20 | 0.0% |
| Zaire | 32 | 0.0% |
| Zimbabwe | 54 | 0.0% | View All 99 Rows |
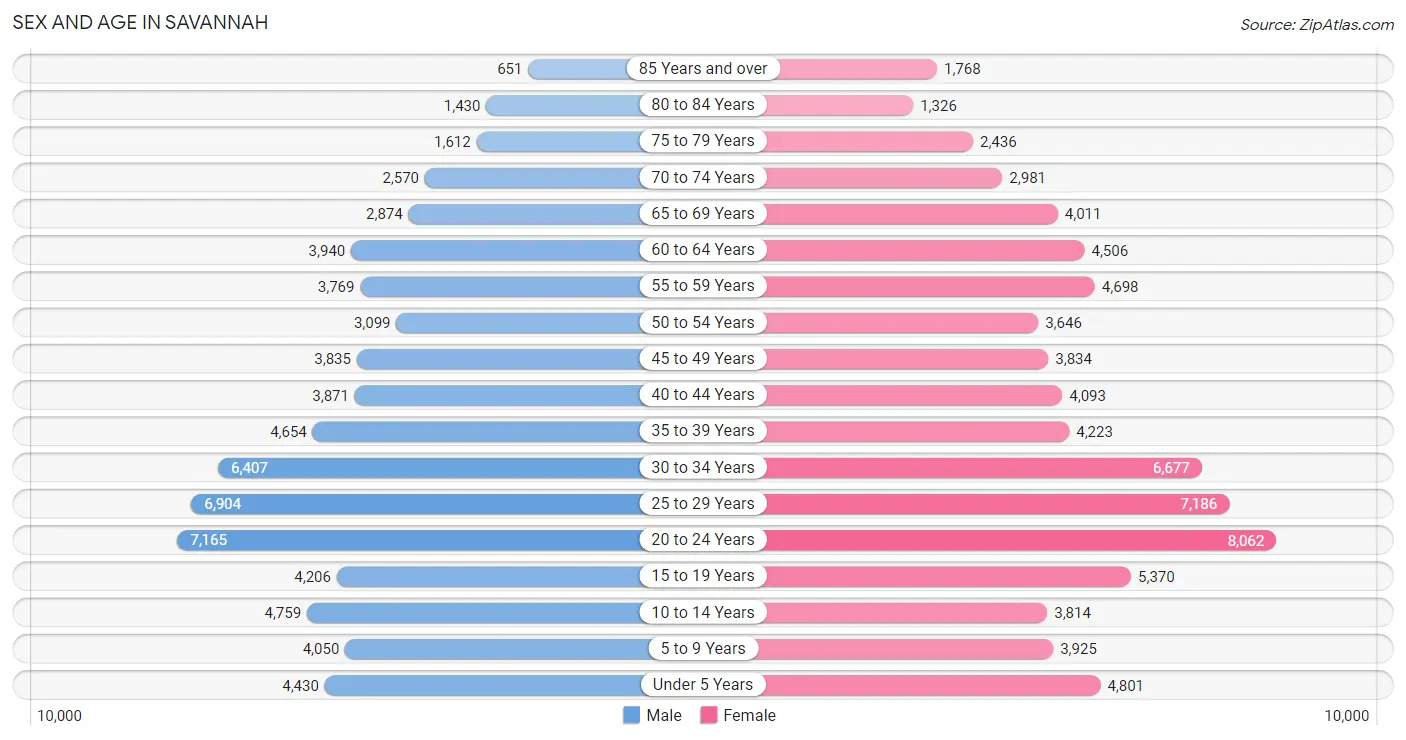
Sex and Age in Savannah
Sex and Age in Savannah
The most populous age groups in Savannah are 20 to 24 Years (7,165 | 10.2%) for men and 20 to 24 Years (8,062 | 10.4%) for women.
| Age Bracket | Male | Female |
| Under 5 Years | 4,430 (6.3%) | 4,801 (6.2%) |
| 5 to 9 Years | 4,050 (5.8%) | 3,925 (5.1%) |
| 10 to 14 Years | 4,759 (6.8%) | 3,814 (4.9%) |
| 15 to 19 Years | 4,206 (6.0%) | 5,370 (6.9%) |
| 20 to 24 Years | 7,165 (10.2%) | 8,062 (10.4%) |
| 25 to 29 Years | 6,904 (9.8%) | 7,186 (9.3%) |
| 30 to 34 Years | 6,407 (9.1%) | 6,677 (8.6%) |
| 35 to 39 Years | 4,654 (6.6%) | 4,223 (5.5%) |
| 40 to 44 Years | 3,871 (5.5%) | 4,093 (5.3%) |
| 45 to 49 Years | 3,835 (5.5%) | 3,834 (5.0%) |
| 50 to 54 Years | 3,099 (4.4%) | 3,646 (4.7%) |
| 55 to 59 Years | 3,769 (5.4%) | 4,698 (6.1%) |
| 60 to 64 Years | 3,940 (5.6%) | 4,506 (5.8%) |
| 65 to 69 Years | 2,874 (4.1%) | 4,011 (5.2%) |
| 70 to 74 Years | 2,570 (3.7%) | 2,981 (3.8%) |
| 75 to 79 Years | 1,612 (2.3%) | 2,436 (3.2%) |
| 80 to 84 Years | 1,430 (2.0%) | 1,326 (1.7%) |
| 85 Years and over | 651 (0.9%) | 1,768 (2.3%) |
| Total | 70,226 (100.0%) | 77,357 (100.0%) |
Families and Households in Savannah
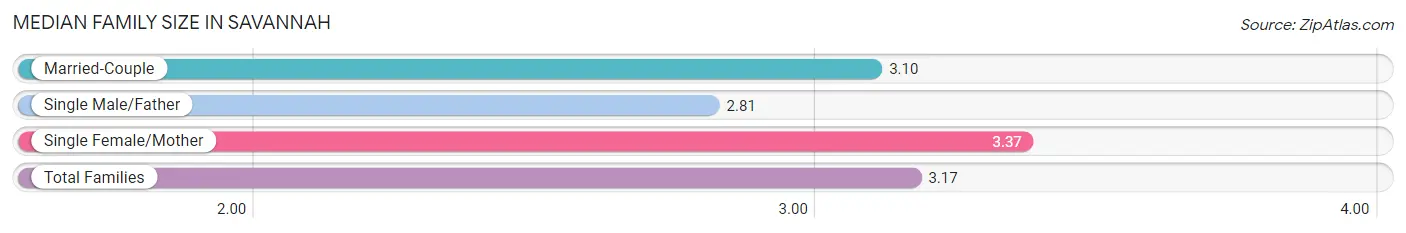
Median Family Size in Savannah
The median family size in Savannah is 3.17 persons per family, with single female/mother families (11,430 | 36.1%) accounting for the largest median family size of 3.37 persons per family. On the other hand, single male/father families (2,525 | 8.0%) represent the smallest median family size with 2.81 persons per family.
| Family Type | # Families | Family Size |
| Married-Couple | 17,677 (55.9%) | 3.10 |
| Single Male/Father | 2,525 (8.0%) | 2.81 |
| Single Female/Mother | 11,430 (36.1%) | 3.37 |
| Total Families | 31,632 (100.0%) | 3.17 |
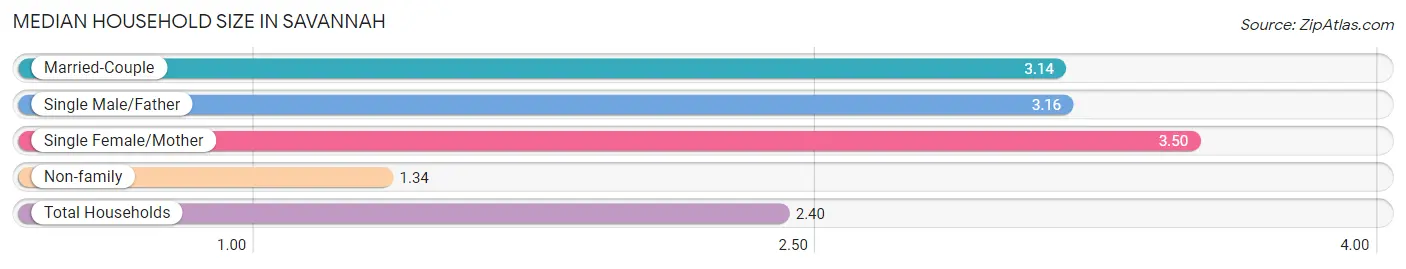
Median Household Size in Savannah
The median household size in Savannah is 2.40 persons per household, with single female/mother households (11,430 | 19.8%) accounting for the largest median household size of 3.5 persons per household. non-family households (26,041 | 45.2%) represent the smallest median household size with 1.34 persons per household.
| Household Type | # Households | Household Size |
| Married-Couple | 17,677 (30.6%) | 3.14 |
| Single Male/Father | 2,525 (4.4%) | 3.16 |
| Single Female/Mother | 11,430 (19.8%) | 3.50 |
| Non-family | 26,041 (45.2%) | 1.34 |
| Total Households | 57,673 (100.0%) | 2.40 |
Household Size by Marriage Status in Savannah
Out of a total of 57,673 households in Savannah, 31,632 (54.8%) are family households, while 26,041 (45.2%) are nonfamily households. The most numerous type of family households are 2-person households, comprising 15,225, and the most common type of nonfamily households are 1-person households, comprising 19,906.
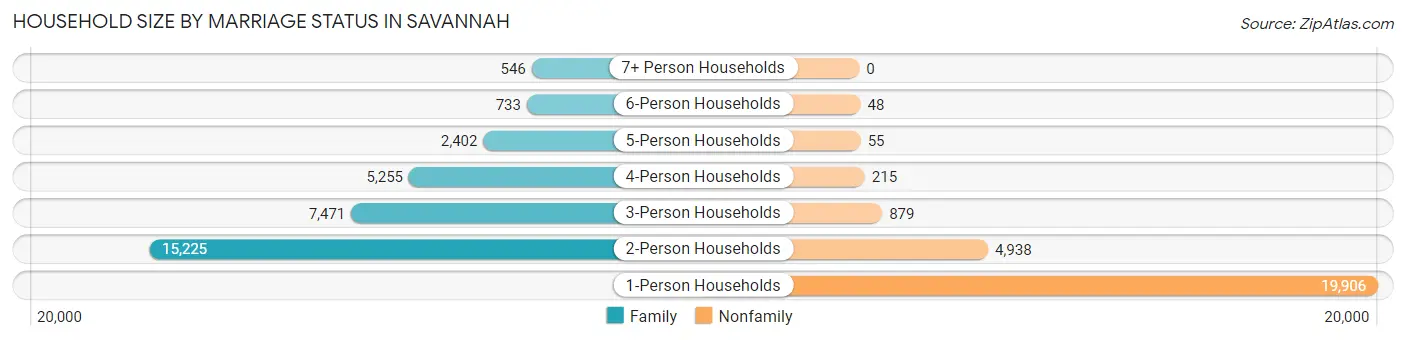
| Household Size | Family Households | Nonfamily Households |
| 1-Person Households | - | 19,906 (34.5%) |
| 2-Person Households | 15,225 (26.4%) | 4,938 (8.6%) |
| 3-Person Households | 7,471 (13.0%) | 879 (1.5%) |
| 4-Person Households | 5,255 (9.1%) | 215 (0.4%) |
| 5-Person Households | 2,402 (4.2%) | 55 (0.1%) |
| 6-Person Households | 733 (1.3%) | 48 (0.1%) |
| 7+ Person Households | 546 (0.9%) | 0 (0.0%) |
| Total | 31,632 (54.8%) | 26,041 (45.2%) |
Female Fertility in Savannah
Fertility by Age in Savannah
Average fertility rate in Savannah is 50.0 births per 1,000 women. Women in the age bracket of 20 to 34 years have the highest fertility rate with 71.0 births per 1,000 women. Women in the age bracket of 20 to 34 years acount for 77.0% of all women with births.
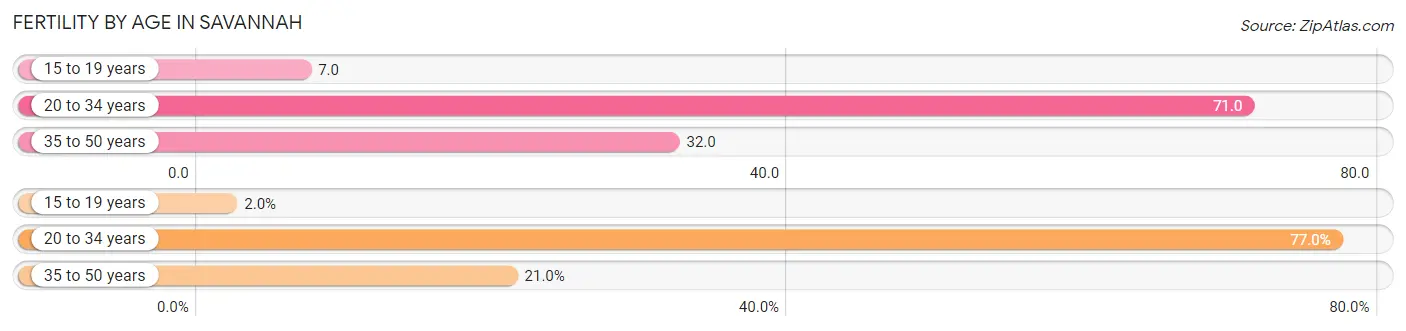
| Age Bracket | Women with Births | Births / 1,000 Women |
| 15 to 19 years | 40 (2.0%) | 7.0 |
| 20 to 34 years | 1,550 (77.0%) | 71.0 |
| 35 to 50 years | 423 (21.0%) | 32.0 |
| Total | 2,013 (100.0%) | 50.0 |
Fertility by Age by Marriage Status in Savannah
48.7% of women with births (2,013) in Savannah are married. The highest percentage of unmarried women with births falls into 15 to 19 years age bracket with 77.5% of them unmarried at the time of birth, while the lowest percentage of unmarried women with births belong to 35 to 50 years age bracket with 27.4% of them unmarried.
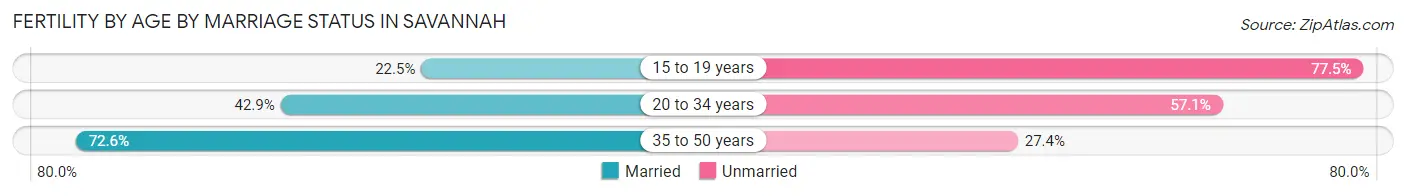
| Age Bracket | Married | Unmarried |
| 15 to 19 years | 9 (22.5%) | 31 (77.5%) |
| 20 to 34 years | 665 (42.9%) | 885 (57.1%) |
| 35 to 50 years | 307 (72.6%) | 116 (27.4%) |
| Total | 980 (48.7%) | 1,033 (51.3%) |
Fertility by Education in Savannah
Average fertility rate in Savannah is 50.0 births per 1,000 women. Women with the education attainment of graduate degree have the highest fertility rate of 67.0 births per 1,000 women, while women with the education attainment of bachelor's degree have the lowest fertility at 42.0 births per 1,000 women. Women with the education attainment of college or associate's degree represent 39.7% of all women with births.
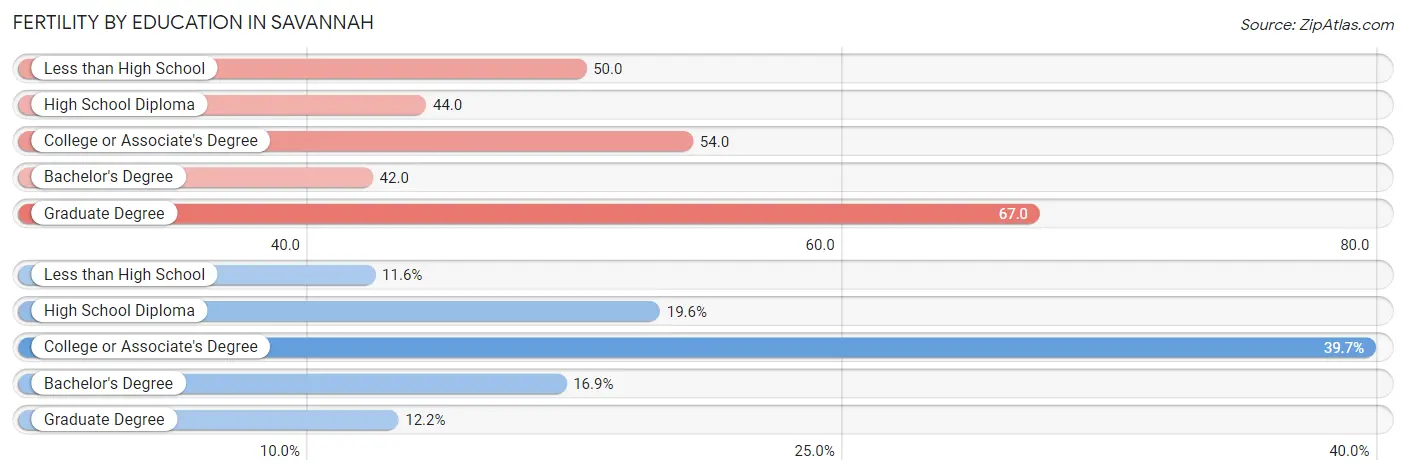
| Educational Attainment | Women with Births | Births / 1,000 Women |
| Less than High School | 233 (11.6%) | 50.0 |
| High School Diploma | 394 (19.6%) | 44.0 |
| College or Associate's Degree | 799 (39.7%) | 54.0 |
| Bachelor's Degree | 341 (16.9%) | 42.0 |
| Graduate Degree | 246 (12.2%) | 67.0 |
| Total | 2,013 (100.0%) | 50.0 |
Fertility by Education by Marriage Status in Savannah
51.3% of women with births in Savannah are unmarried. Women with the educational attainment of graduate degree are most likely to be married with 100.0% of them married at childbirth, while women with the educational attainment of less than high school are least likely to be married with 92.3% of them unmarried at childbirth.
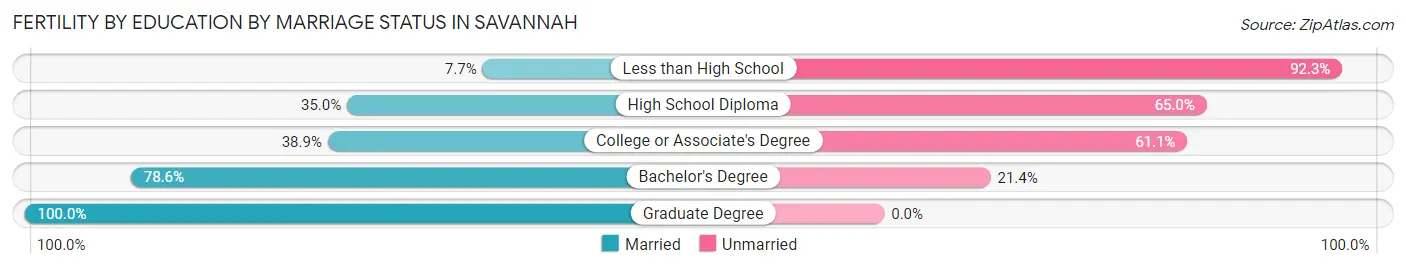
| Educational Attainment | Married | Unmarried |
| Less than High School | 18 (7.7%) | 215 (92.3%) |
| High School Diploma | 138 (35.0%) | 256 (65.0%) |
| College or Associate's Degree | 311 (38.9%) | 488 (61.1%) |
| Bachelor's Degree | 268 (78.6%) | 73 (21.4%) |
| Graduate Degree | 246 (100.0%) | 0 (0.0%) |
| Total | 980 (48.7%) | 1,033 (51.3%) |
Employment Characteristics in Savannah
Employment by Class of Employer in Savannah
Among the 69,945 employed individuals in Savannah, private company employees (47,081 | 67.3%), not-for-profit organizations (5,409 | 7.7%), and local government employees (4,669 | 6.7%) make up the most common classes of employment.
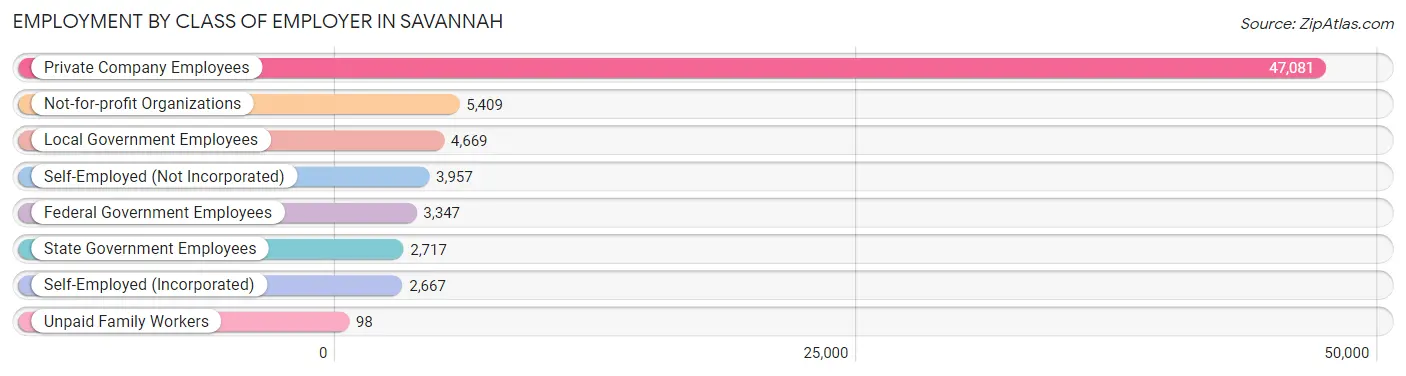
| Employer Class | # Employees | % Employees |
| Private Company Employees | 47,081 | 67.3% |
| Self-Employed (Incorporated) | 2,667 | 3.8% |
| Self-Employed (Not Incorporated) | 3,957 | 5.7% |
| Not-for-profit Organizations | 5,409 | 7.7% |
| Local Government Employees | 4,669 | 6.7% |
| State Government Employees | 2,717 | 3.9% |
| Federal Government Employees | 3,347 | 4.8% |
| Unpaid Family Workers | 98 | 0.1% |
| Total | 69,945 | 100.0% |
Employment Status by Age in Savannah
According to the labor force statistics for Savannah, out of the total population over 16 years of age (120,135), 64.2% or 77,127 individuals are in the labor force, with 7.2% or 5,553 of them unemployed. The age group with the highest labor force participation rate is 25 to 29 years, with 84.1% or 11,850 individuals in the labor force. Within the labor force, the 16 to 19 years age range has the highest percentage of unemployed individuals, with 18.1% or 655 of them being unemployed.
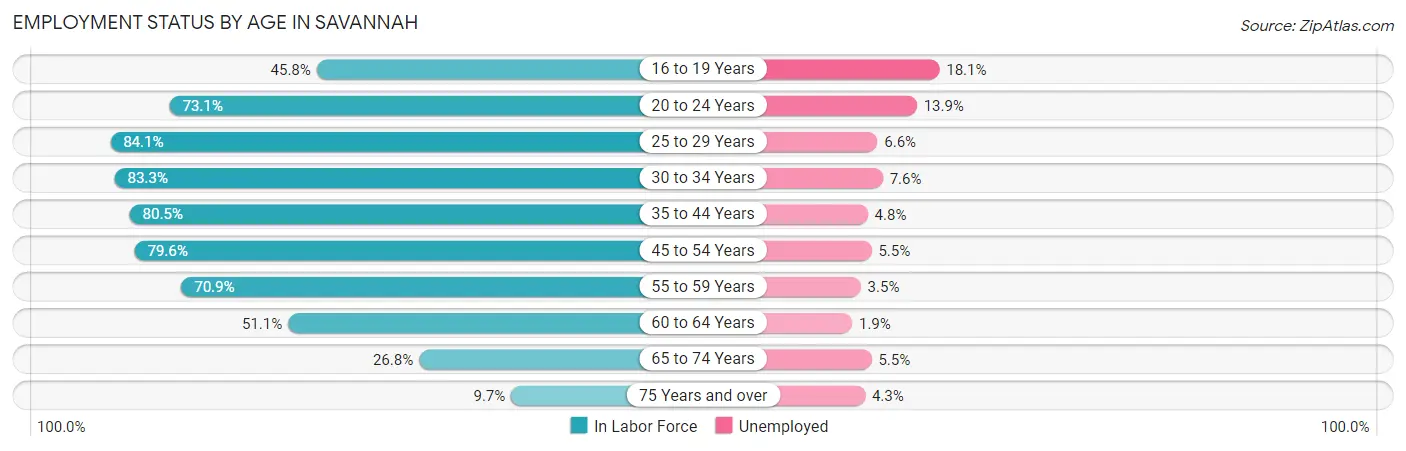
| Age Bracket | In Labor Force | Unemployed |
| 16 to 19 Years | 3,621 (45.8%) | 655 (18.1%) |
| 20 to 24 Years | 11,131 (73.1%) | 1,547 (13.9%) |
| 25 to 29 Years | 11,850 (84.1%) | 782 (6.6%) |
| 30 to 34 Years | 10,899 (83.3%) | 828 (7.6%) |
| 35 to 44 Years | 13,557 (80.5%) | 651 (4.8%) |
| 45 to 54 Years | 11,474 (79.6%) | 631 (5.5%) |
| 55 to 59 Years | 6,003 (70.9%) | 210 (3.5%) |
| 60 to 64 Years | 4,316 (51.1%) | 82 (1.9%) |
| 65 to 74 Years | 3,333 (26.8%) | 183 (5.5%) |
| 75 Years and over | 895 (9.7%) | 38 (4.3%) |
| Total | 77,127 (64.2%) | 5,553 (7.2%) |
Employment Status by Educational Attainment in Savannah
According to labor force statistics for Savannah, 77.1% of individuals (58,089) out of the total population between 25 and 64 years of age (75,342) are in the labor force, with 5.5% or 3,195 of them being unemployed. The group with the highest labor force participation rate are those with the educational attainment of bachelor's degree or higher, with 87.3% or 20,770 individuals in the labor force. Within the labor force, individuals with less than high school education have the highest percentage of unemployment, with 13.1% or 507 of them being unemployed.
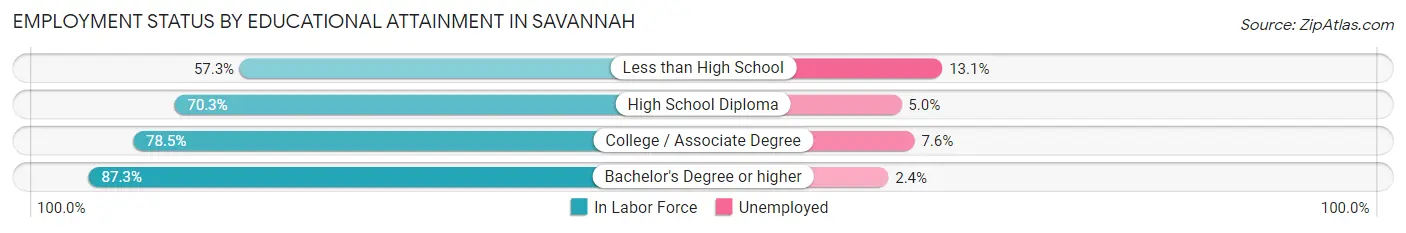
| Educational Attainment | In Labor Force | Unemployed |
| Less than High School | 3,872 (57.3%) | 885 (13.1%) |
| High School Diploma | 14,638 (70.3%) | 1,041 (5.0%) |
| College / Associate Degree | 18,818 (78.5%) | 1,822 (7.6%) |
| Bachelor's Degree or higher | 20,770 (87.3%) | 571 (2.4%) |
| Total | 58,089 (77.1%) | 4,144 (5.5%) |
Employment Occupations by Sex in Savannah
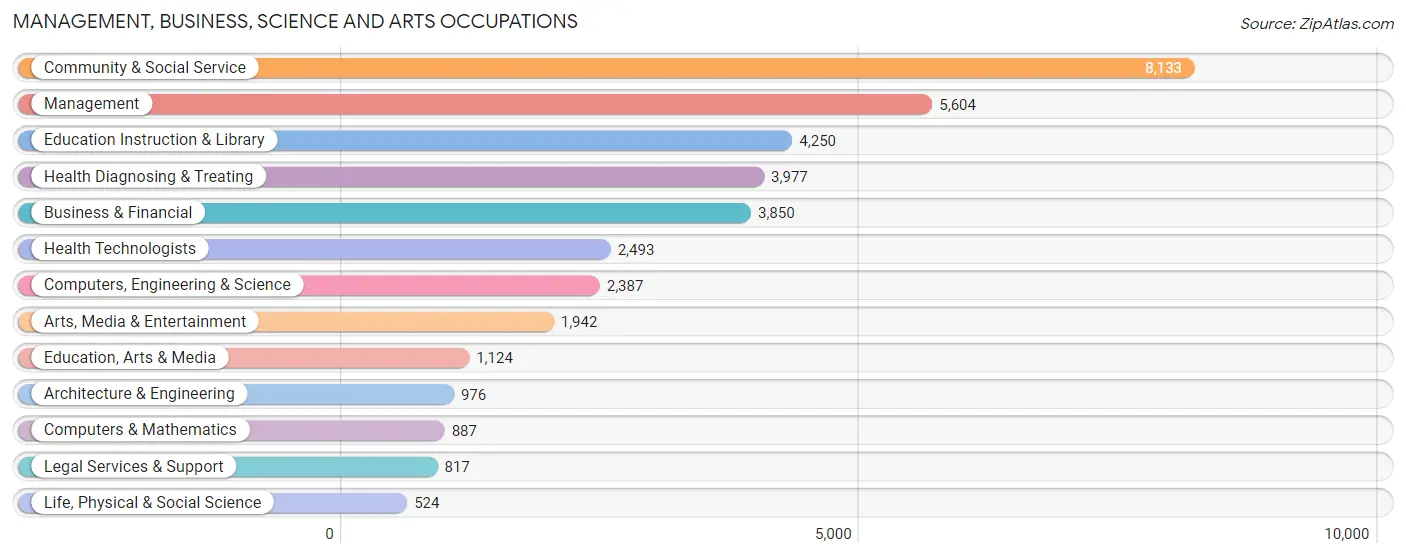
Management, Business, Science and Arts Occupations
The most common Management, Business, Science and Arts occupations in Savannah are Community & Social Service (8,133 | 11.6%), Management (5,604 | 8.0%), Education Instruction & Library (4,250 | 6.1%), Health Diagnosing & Treating (3,977 | 5.7%), and Business & Financial (3,850 | 5.5%).
Management, Business, Science and Arts Occupations by Sex
Within the Management, Business, Science and Arts occupations in Savannah, the most male-oriented occupations are Architecture & Engineering (78.7%), Computers & Mathematics (67.9%), and Computers, Engineering & Science (66.1%), while the most female-oriented occupations are Health Technologists (81.9%), Health Diagnosing & Treating (80.8%), and Education, Arts & Media (80.0%).
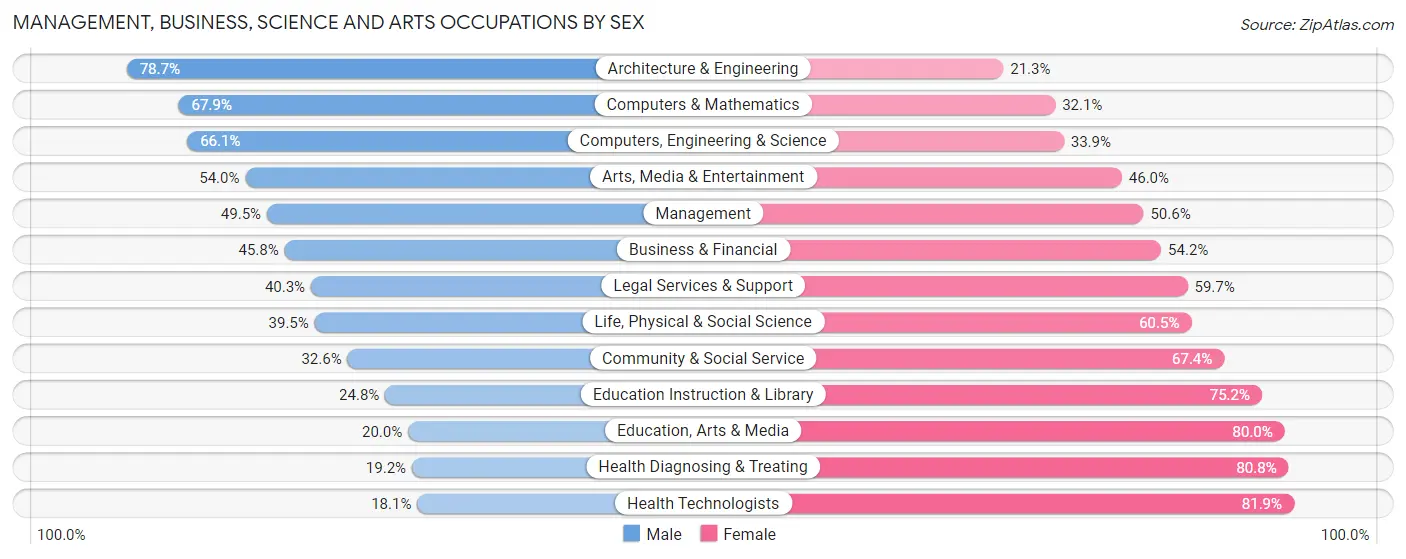
| Occupation | Male | Female |
| Management | 2,771 (49.4%) | 2,833 (50.5%) |
| Business & Financial | 1,762 (45.8%) | 2,088 (54.2%) |
| Computers, Engineering & Science | 1,577 (66.1%) | 810 (33.9%) |
| Computers & Mathematics | 602 (67.9%) | 285 (32.1%) |
| Architecture & Engineering | 768 (78.7%) | 208 (21.3%) |
| Life, Physical & Social Science | 207 (39.5%) | 317 (60.5%) |
| Community & Social Service | 2,655 (32.6%) | 5,478 (67.4%) |
| Education, Arts & Media | 225 (20.0%) | 899 (80.0%) |
| Legal Services & Support | 329 (40.3%) | 488 (59.7%) |
| Education Instruction & Library | 1,053 (24.8%) | 3,197 (75.2%) |
| Arts, Media & Entertainment | 1,048 (54.0%) | 894 (46.0%) |
| Health Diagnosing & Treating | 764 (19.2%) | 3,213 (80.8%) |
| Health Technologists | 451 (18.1%) | 2,042 (81.9%) |
| Total (Category) | 9,529 (39.8%) | 14,422 (60.2%) |
| Total (Overall) | 32,370 (46.3%) | 37,536 (53.7%) |
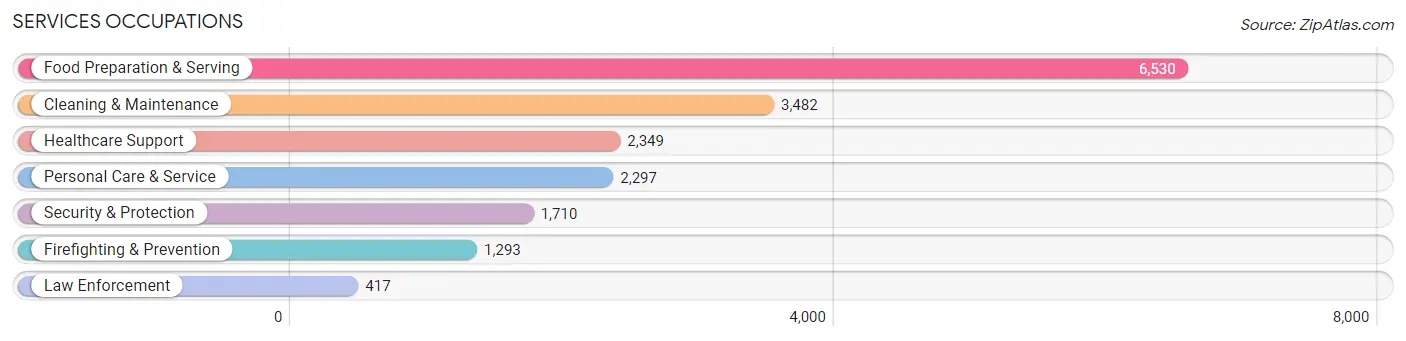
Services Occupations
The most common Services occupations in Savannah are Food Preparation & Serving (6,530 | 9.3%), Cleaning & Maintenance (3,482 | 5.0%), Healthcare Support (2,349 | 3.4%), Personal Care & Service (2,297 | 3.3%), and Security & Protection (1,710 | 2.5%).
Services Occupations by Sex
Within the Services occupations in Savannah, the most male-oriented occupations are Law Enforcement (84.7%), Cleaning & Maintenance (57.1%), and Security & Protection (55.4%), while the most female-oriented occupations are Healthcare Support (89.8%), Personal Care & Service (60.0%), and Firefighting & Prevention (54.0%).
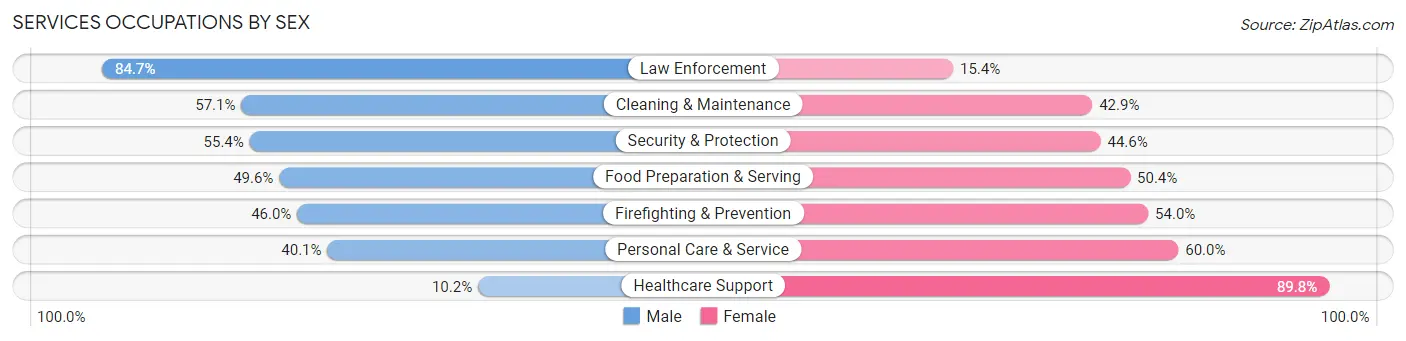
| Occupation | Male | Female |
| Healthcare Support | 240 (10.2%) | 2,109 (89.8%) |
| Security & Protection | 948 (55.4%) | 762 (44.6%) |
| Firefighting & Prevention | 595 (46.0%) | 698 (54.0%) |
| Law Enforcement | 353 (84.7%) | 64 (15.3%) |
| Food Preparation & Serving | 3,238 (49.6%) | 3,292 (50.4%) |
| Cleaning & Maintenance | 1,988 (57.1%) | 1,494 (42.9%) |
| Personal Care & Service | 920 (40.1%) | 1,377 (60.0%) |
| Total (Category) | 7,334 (44.8%) | 9,034 (55.2%) |
| Total (Overall) | 32,370 (46.3%) | 37,536 (53.7%) |
Sales and Office Occupations
The most common Sales and Office occupations in Savannah are Sales & Related (7,808 | 11.2%), and Office & Administration (7,156 | 10.2%).
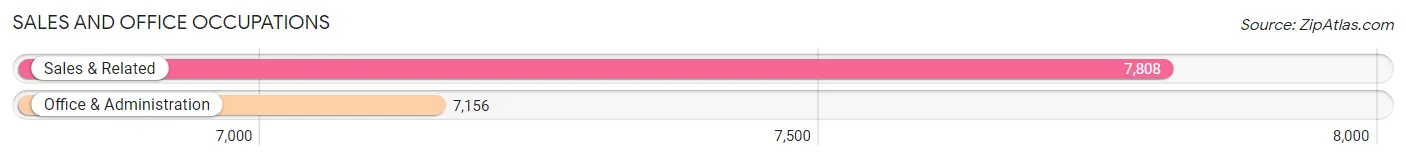
Sales and Office Occupations by Sex
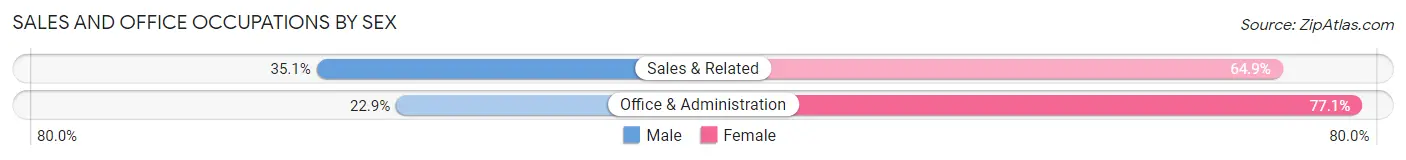
| Occupation | Male | Female |
| Sales & Related | 2,739 (35.1%) | 5,069 (64.9%) |
| Office & Administration | 1,636 (22.9%) | 5,520 (77.1%) |
| Total (Category) | 4,375 (29.2%) | 10,589 (70.8%) |
| Total (Overall) | 32,370 (46.3%) | 37,536 (53.7%) |
Natural Resources, Construction and Maintenance Occupations
The most common Natural Resources, Construction and Maintenance occupations in Savannah are Construction & Extraction (2,331 | 3.3%), Installation, Maintenance & Repair (1,613 | 2.3%), and Farming, Fishing & Forestry (134 | 0.2%).
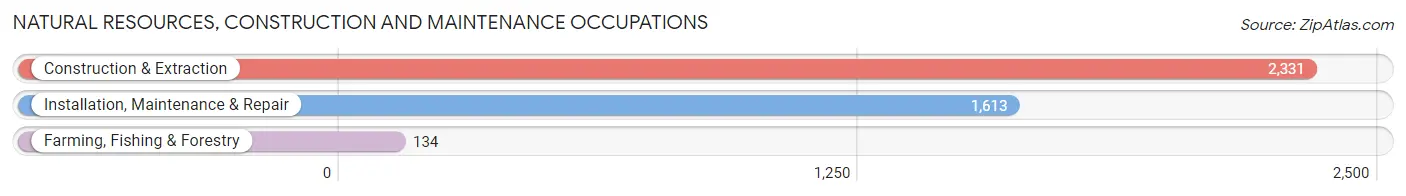
Natural Resources, Construction and Maintenance Occupations by Sex
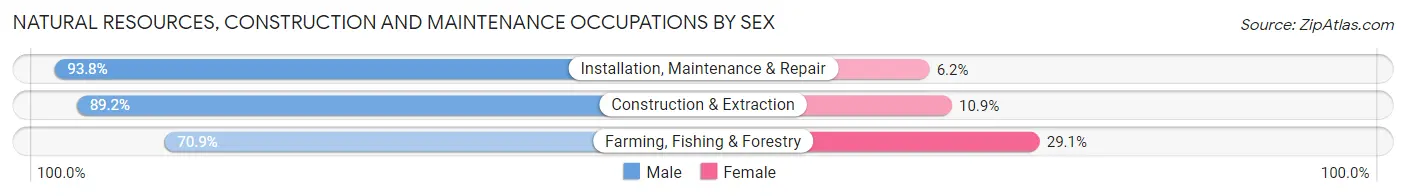
| Occupation | Male | Female |
| Farming, Fishing & Forestry | 95 (70.9%) | 39 (29.1%) |
| Construction & Extraction | 2,078 (89.1%) | 253 (10.8%) |
| Installation, Maintenance & Repair | 1,513 (93.8%) | 100 (6.2%) |
| Total (Category) | 3,686 (90.4%) | 392 (9.6%) |
| Total (Overall) | 32,370 (46.3%) | 37,536 (53.7%) |
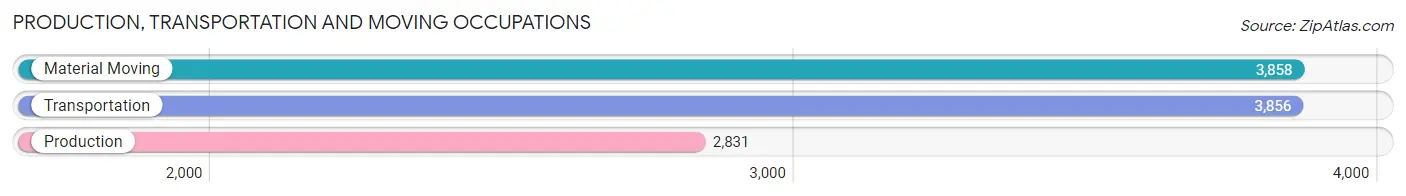
Production, Transportation and Moving Occupations
The most common Production, Transportation and Moving occupations in Savannah are Material Moving (3,858 | 5.5%), Transportation (3,856 | 5.5%), and Production (2,831 | 4.1%).
Production, Transportation and Moving Occupations by Sex
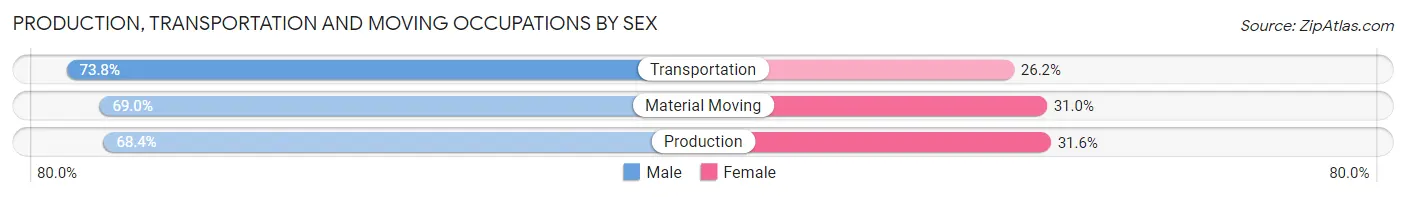
| Occupation | Male | Female |
| Production | 1,937 (68.4%) | 894 (31.6%) |
| Transportation | 2,847 (73.8%) | 1,009 (26.2%) |
| Material Moving | 2,662 (69.0%) | 1,196 (31.0%) |
| Total (Category) | 7,446 (70.6%) | 3,099 (29.4%) |
| Total (Overall) | 32,370 (46.3%) | 37,536 (53.7%) |
Employment Industries by Sex in Savannah
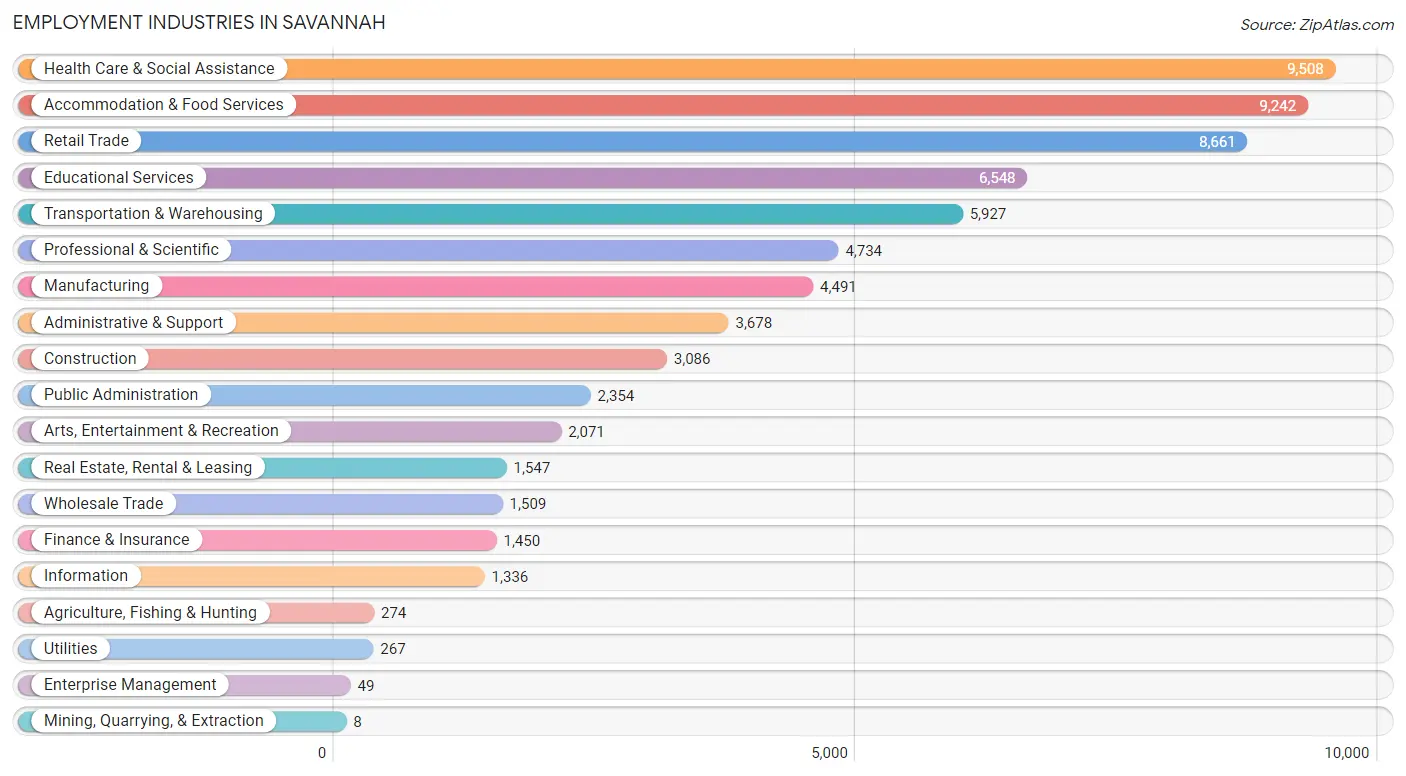
Employment Industries in Savannah
The major employment industries in Savannah include Health Care & Social Assistance (9,508 | 13.6%), Accommodation & Food Services (9,242 | 13.2%), Retail Trade (8,661 | 12.4%), Educational Services (6,548 | 9.4%), and Transportation & Warehousing (5,927 | 8.5%).
Employment Industries by Sex in Savannah
The Savannah industries that see more men than women are Mining, Quarrying, & Extraction (100.0%), Construction (86.5%), and Utilities (83.9%), whereas the industries that tend to have a higher number of women are Health Care & Social Assistance (84.2%), Educational Services (67.6%), and Finance & Insurance (66.1%).
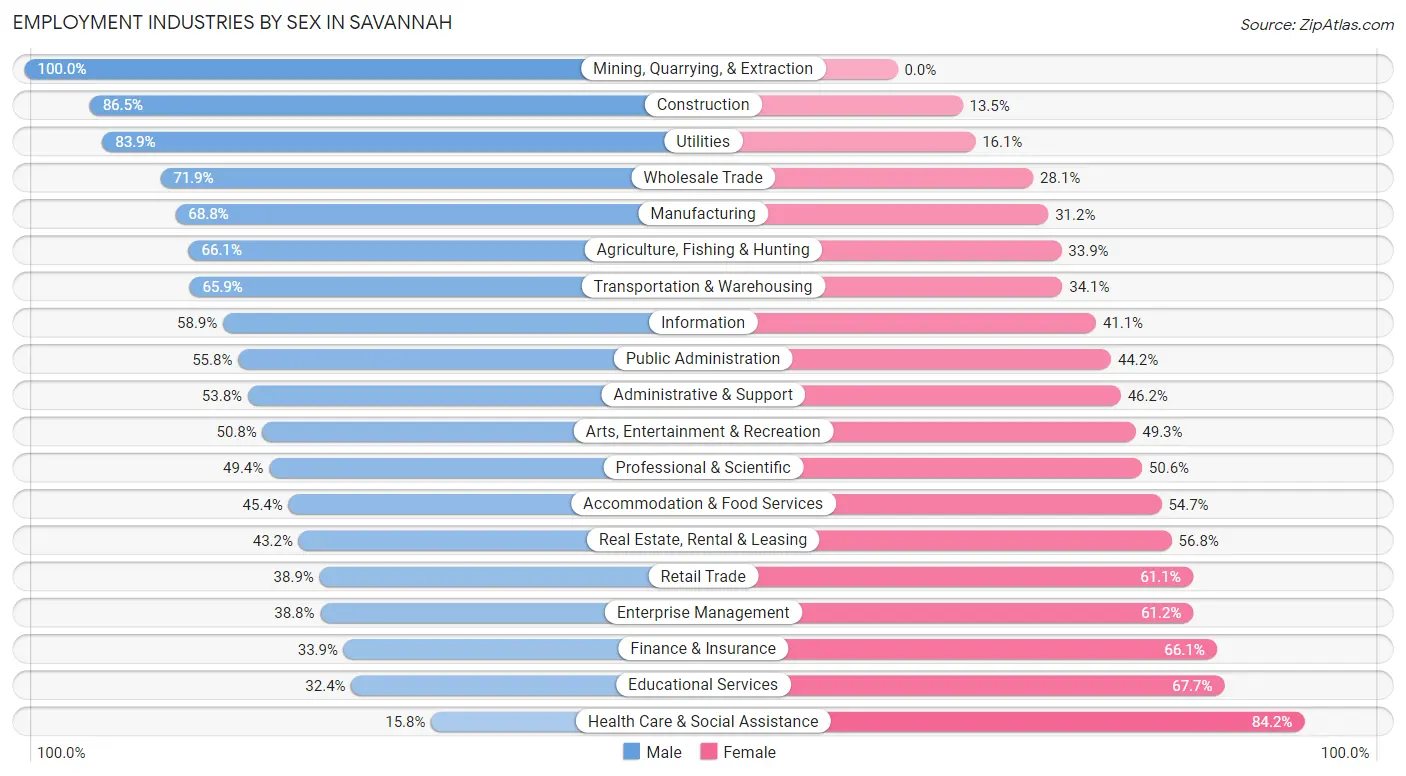
| Industry | Male | Female |
| Agriculture, Fishing & Hunting | 181 (66.1%) | 93 (33.9%) |
| Mining, Quarrying, & Extraction | 8 (100.0%) | 0 (0.0%) |
| Construction | 2,670 (86.5%) | 416 (13.5%) |
| Manufacturing | 3,089 (68.8%) | 1,402 (31.2%) |
| Wholesale Trade | 1,085 (71.9%) | 424 (28.1%) |
| Retail Trade | 3,372 (38.9%) | 5,289 (61.1%) |
| Transportation & Warehousing | 3,904 (65.9%) | 2,023 (34.1%) |
| Utilities | 224 (83.9%) | 43 (16.1%) |
| Information | 787 (58.9%) | 549 (41.1%) |
| Finance & Insurance | 492 (33.9%) | 958 (66.1%) |
| Real Estate, Rental & Leasing | 669 (43.2%) | 878 (56.8%) |
| Professional & Scientific | 2,338 (49.4%) | 2,396 (50.6%) |
| Enterprise Management | 19 (38.8%) | 30 (61.2%) |
| Administrative & Support | 1,978 (53.8%) | 1,700 (46.2%) |
| Educational Services | 2,118 (32.4%) | 4,430 (67.6%) |
| Health Care & Social Assistance | 1,504 (15.8%) | 8,004 (84.2%) |
| Arts, Entertainment & Recreation | 1,051 (50.7%) | 1,020 (49.2%) |
| Accommodation & Food Services | 4,191 (45.4%) | 5,051 (54.6%) |
| Public Administration | 1,313 (55.8%) | 1,041 (44.2%) |
| Total | 32,370 (46.3%) | 37,536 (53.7%) |
Education in Savannah
School Enrollment in Savannah
The most common levels of schooling among the 39,938 students in Savannah are college / undergraduate (14,263 | 35.7%), middle school (7,095 | 17.8%), and elementary school (6,282 | 15.7%).
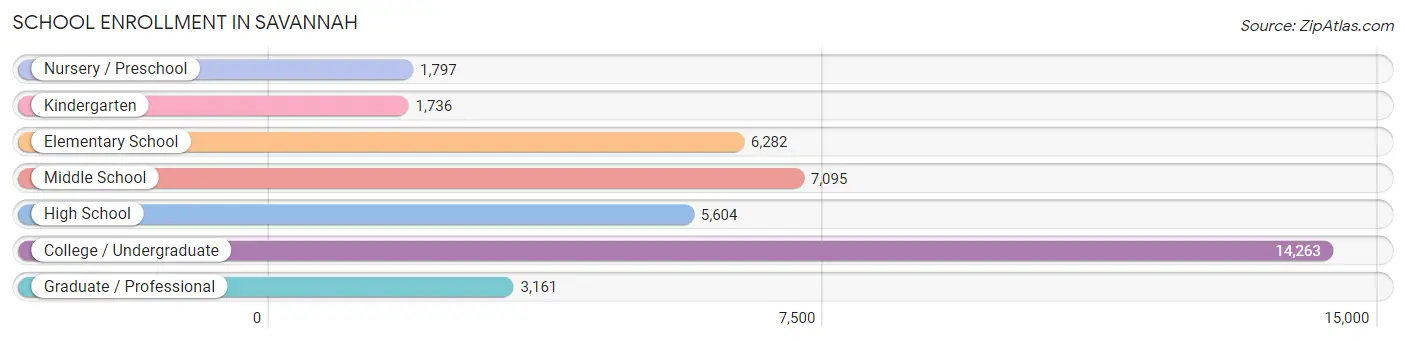
| School Level | # Students | % Students |
| Nursery / Preschool | 1,797 | 4.5% |
| Kindergarten | 1,736 | 4.3% |
| Elementary School | 6,282 | 15.7% |
| Middle School | 7,095 | 17.8% |
| High School | 5,604 | 14.0% |
| College / Undergraduate | 14,263 | 35.7% |
| Graduate / Professional | 3,161 | 7.9% |
| Total | 39,938 | 100.0% |
School Enrollment by Age by Funding Source in Savannah
Out of a total of 39,938 students who are enrolled in schools in Savannah, 11,263 (28.2%) attend a private institution, while the remaining 28,675 (71.8%) are enrolled in public schools. The age group of 20 to 24 year olds has the highest likelihood of being enrolled in private schools, with 4,375 (53.9% in the age bracket) enrolled. Conversely, the age group of 5 to 9 year old has the lowest likelihood of being enrolled in a private school, with 6,998 (91.6% in the age bracket) attending a public institution.
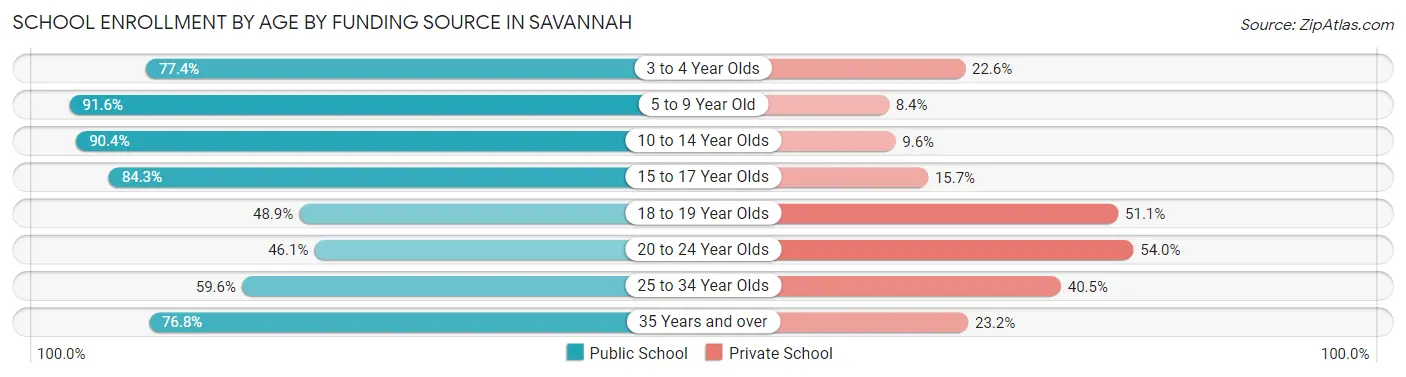
| Age Bracket | Public School | Private School |
| 3 to 4 Year Olds | 1,054 (77.4%) | 308 (22.6%) |
| 5 to 9 Year Old | 6,998 (91.6%) | 642 (8.4%) |
| 10 to 14 Year Olds | 7,626 (90.4%) | 812 (9.6%) |
| 15 to 17 Year Olds | 2,921 (84.3%) | 544 (15.7%) |
| 18 to 19 Year Olds | 2,157 (48.9%) | 2,256 (51.1%) |
| 20 to 24 Year Olds | 3,735 (46.1%) | 4,375 (53.9%) |
| 25 to 34 Year Olds | 2,769 (59.6%) | 1,881 (40.5%) |
| 35 Years and over | 1,429 (76.8%) | 431 (23.2%) |
| Total | 28,675 (71.8%) | 11,263 (28.2%) |
Educational Attainment by Field of Study in Savannah
Business (6,507 | 20.0%), science & technology (3,434 | 10.5%), education (3,373 | 10.4%), visual & performing arts (3,083 | 9.5%), and social sciences (2,411 | 7.4%) are the most common fields of study among 32,566 individuals in Savannah who have obtained a bachelor's degree or higher.
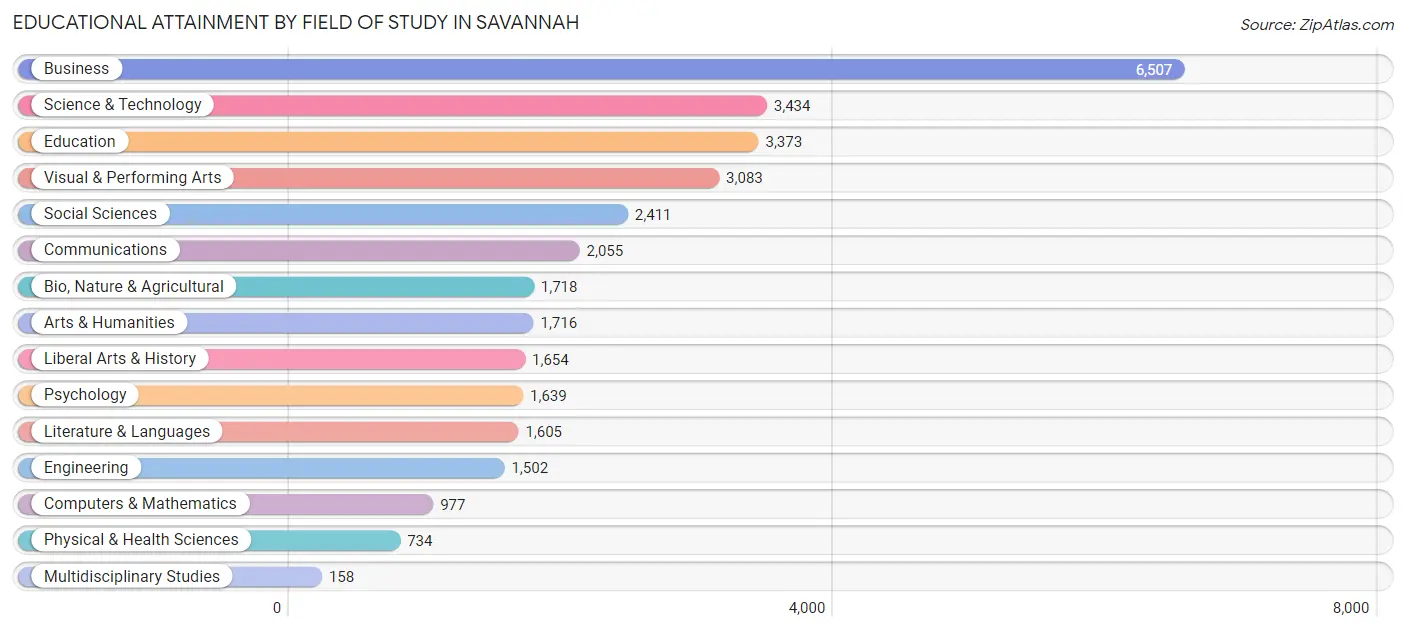
| Field of Study | # Graduates | % Graduates |
| Computers & Mathematics | 977 | 3.0% |
| Bio, Nature & Agricultural | 1,718 | 5.3% |
| Physical & Health Sciences | 734 | 2.2% |
| Psychology | 1,639 | 5.0% |
| Social Sciences | 2,411 | 7.4% |
| Engineering | 1,502 | 4.6% |
| Multidisciplinary Studies | 158 | 0.5% |
| Science & Technology | 3,434 | 10.5% |
| Business | 6,507 | 20.0% |
| Education | 3,373 | 10.4% |
| Literature & Languages | 1,605 | 4.9% |
| Liberal Arts & History | 1,654 | 5.1% |
| Visual & Performing Arts | 3,083 | 9.5% |
| Communications | 2,055 | 6.3% |
| Arts & Humanities | 1,716 | 5.3% |
| Total | 32,566 | 100.0% |
Transportation & Commute in Savannah
Vehicle Availability by Sex in Savannah
The most prevalent vehicle ownership categories in Savannah are males with 2 vehicles (13,804, accounting for 42.9%) and females with 2 vehicles (14,803, making up 38.5%).
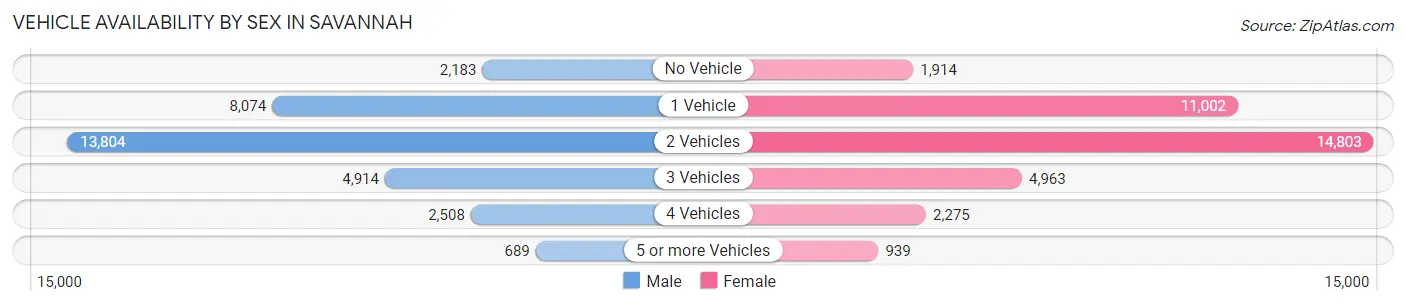
| Vehicles Available | Male | Female |
| No Vehicle | 2,183 (6.8%) | 1,914 (5.3%) |
| 1 Vehicle | 8,074 (25.1%) | 11,002 (30.6%) |
| 2 Vehicles | 13,804 (42.9%) | 14,803 (41.2%) |
| 3 Vehicles | 4,914 (15.3%) | 4,963 (13.8%) |
| 4 Vehicles | 2,508 (7.8%) | 2,275 (6.3%) |
| 5 or more Vehicles | 689 (2.1%) | 939 (2.6%) |
| Total | 32,172 (100.0%) | 35,896 (100.0%) |
Commute Time in Savannah
The most frequently occuring commute durations in Savannah are 15 to 19 minutes (13,359 commuters, 21.0%), 10 to 14 minutes (11,639 commuters, 18.3%), and 20 to 24 minutes (10,702 commuters, 16.8%).
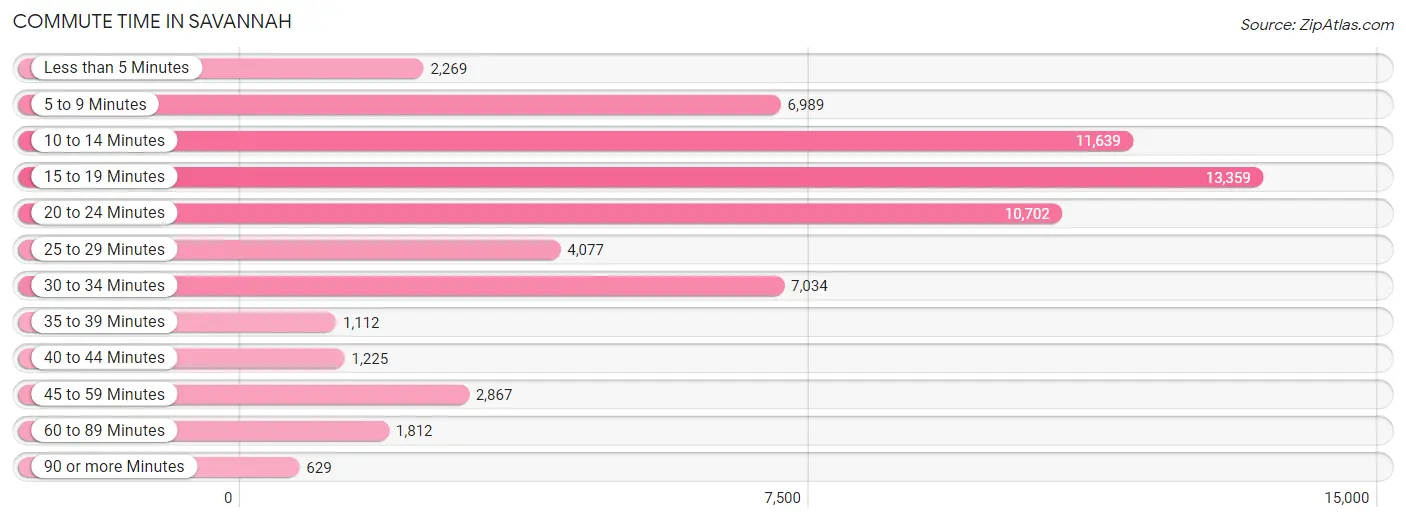
| Commute Time | # Commuters | % Commuters |
| Less than 5 Minutes | 2,269 | 3.6% |
| 5 to 9 Minutes | 6,989 | 11.0% |
| 10 to 14 Minutes | 11,639 | 18.3% |
| 15 to 19 Minutes | 13,359 | 21.0% |
| 20 to 24 Minutes | 10,702 | 16.8% |
| 25 to 29 Minutes | 4,077 | 6.4% |
| 30 to 34 Minutes | 7,034 | 11.0% |
| 35 to 39 Minutes | 1,112 | 1.8% |
| 40 to 44 Minutes | 1,225 | 1.9% |
| 45 to 59 Minutes | 2,867 | 4.5% |
| 60 to 89 Minutes | 1,812 | 2.8% |
| 90 or more Minutes | 629 | 1.0% |
Commute Time by Sex in Savannah
The most common commute times in Savannah are 15 to 19 minutes (6,459 commuters, 21.5%) for males and 10 to 14 minutes (7,277 commuters, 21.6%) for females.
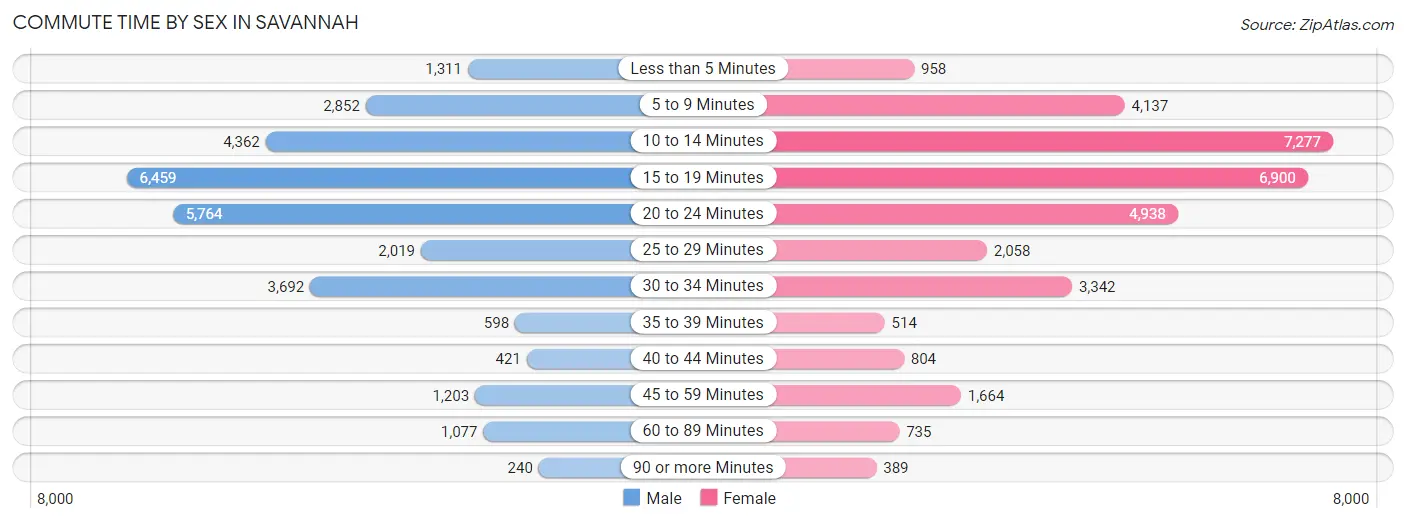
| Commute Time | Male | Female |
| Less than 5 Minutes | 1,311 (4.4%) | 958 (2.8%) |
| 5 to 9 Minutes | 2,852 (9.5%) | 4,137 (12.3%) |
| 10 to 14 Minutes | 4,362 (14.5%) | 7,277 (21.6%) |
| 15 to 19 Minutes | 6,459 (21.5%) | 6,900 (20.5%) |
| 20 to 24 Minutes | 5,764 (19.2%) | 4,938 (14.6%) |
| 25 to 29 Minutes | 2,019 (6.7%) | 2,058 (6.1%) |
| 30 to 34 Minutes | 3,692 (12.3%) | 3,342 (9.9%) |
| 35 to 39 Minutes | 598 (2.0%) | 514 (1.5%) |
| 40 to 44 Minutes | 421 (1.4%) | 804 (2.4%) |
| 45 to 59 Minutes | 1,203 (4.0%) | 1,664 (4.9%) |
| 60 to 89 Minutes | 1,077 (3.6%) | 735 (2.2%) |
| 90 or more Minutes | 240 (0.8%) | 389 (1.1%) |
Time of Departure to Work by Sex in Savannah
The most frequent times of departure to work in Savannah are 7:00 AM to 7:29 AM (3,891, 13.0%) for males and 7:00 AM to 7:29 AM (4,207, 12.5%) for females.
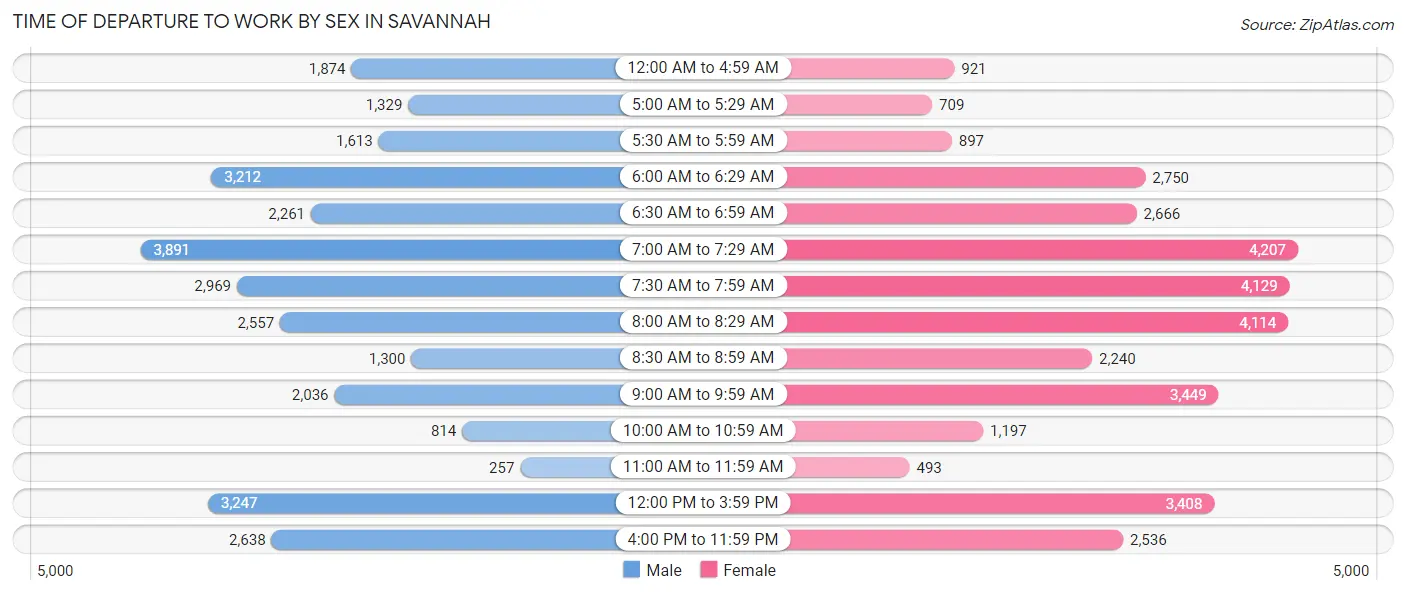
| Time of Departure | Male | Female |
| 12:00 AM to 4:59 AM | 1,874 (6.2%) | 921 (2.7%) |
| 5:00 AM to 5:29 AM | 1,329 (4.4%) | 709 (2.1%) |
| 5:30 AM to 5:59 AM | 1,613 (5.4%) | 897 (2.7%) |
| 6:00 AM to 6:29 AM | 3,212 (10.7%) | 2,750 (8.2%) |
| 6:30 AM to 6:59 AM | 2,261 (7.5%) | 2,666 (7.9%) |
| 7:00 AM to 7:29 AM | 3,891 (13.0%) | 4,207 (12.5%) |
| 7:30 AM to 7:59 AM | 2,969 (9.9%) | 4,129 (12.2%) |
| 8:00 AM to 8:29 AM | 2,557 (8.5%) | 4,114 (12.2%) |
| 8:30 AM to 8:59 AM | 1,300 (4.3%) | 2,240 (6.6%) |
| 9:00 AM to 9:59 AM | 2,036 (6.8%) | 3,449 (10.2%) |
| 10:00 AM to 10:59 AM | 814 (2.7%) | 1,197 (3.5%) |
| 11:00 AM to 11:59 AM | 257 (0.9%) | 493 (1.5%) |
| 12:00 PM to 3:59 PM | 3,247 (10.8%) | 3,408 (10.1%) |
| 4:00 PM to 11:59 PM | 2,638 (8.8%) | 2,536 (7.5%) |
| Total | 29,998 (100.0%) | 33,716 (100.0%) |
Housing Occupancy in Savannah
Occupancy by Ownership in Savannah
Of the total 57,673 dwellings in Savannah, owner-occupied units account for 26,468 (45.9%), while renter-occupied units make up 31,205 (54.1%).
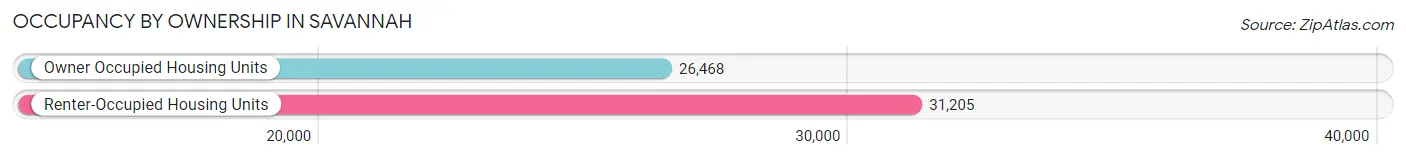
| Occupancy | # Housing Units | % Housing Units |
| Owner Occupied Housing Units | 26,468 | 45.9% |
| Renter-Occupied Housing Units | 31,205 | 54.1% |
| Total Occupied Housing Units | 57,673 | 100.0% |
Occupancy by Household Size in Savannah
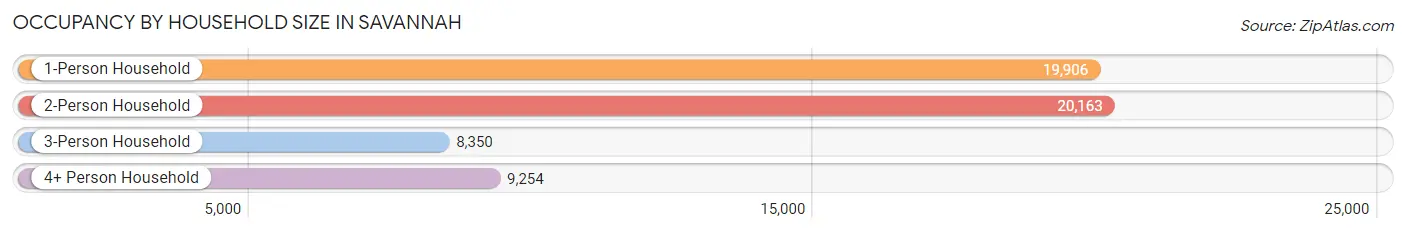
| Household Size | # Housing Units | % Housing Units |
| 1-Person Household | 19,906 | 34.5% |
| 2-Person Household | 20,163 | 35.0% |
| 3-Person Household | 8,350 | 14.5% |
| 4+ Person Household | 9,254 | 16.1% |
| Total Housing Units | 57,673 | 100.0% |
Occupancy by Ownership by Household Size in Savannah
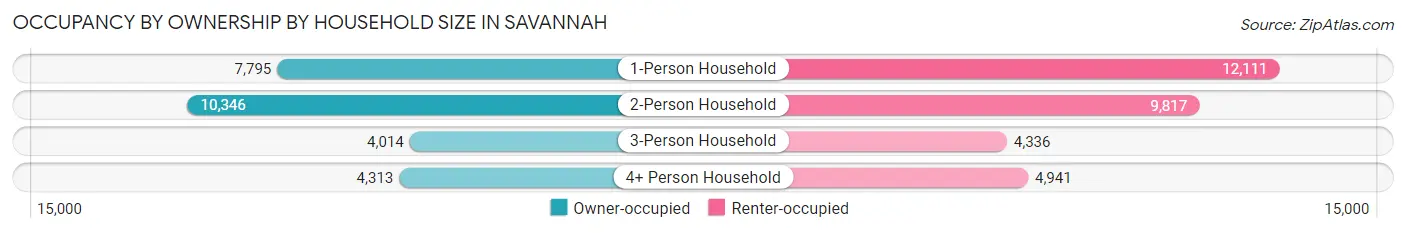
| Household Size | Owner-occupied | Renter-occupied |
| 1-Person Household | 7,795 (39.2%) | 12,111 (60.8%) |
| 2-Person Household | 10,346 (51.3%) | 9,817 (48.7%) |
| 3-Person Household | 4,014 (48.1%) | 4,336 (51.9%) |
| 4+ Person Household | 4,313 (46.6%) | 4,941 (53.4%) |
| Total Housing Units | 26,468 (45.9%) | 31,205 (54.1%) |
Occupancy by Educational Attainment in Savannah
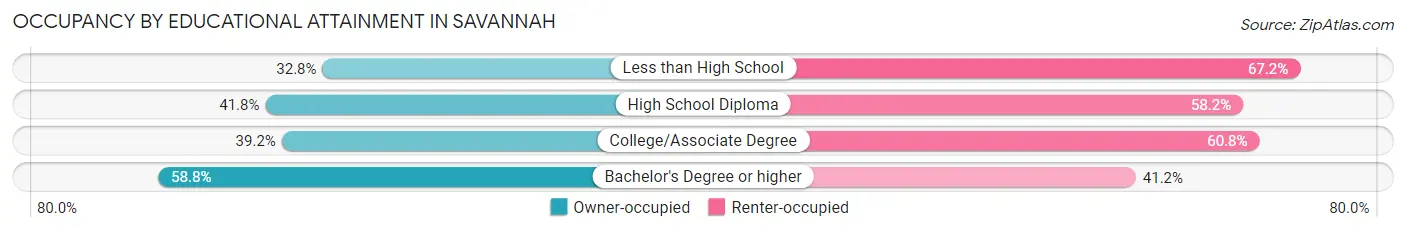
| Household Size | Owner-occupied | Renter-occupied |
| Less than High School | 1,520 (32.8%) | 3,119 (67.2%) |
| High School Diploma | 5,531 (41.8%) | 7,695 (58.2%) |
| College/Associate Degree | 8,003 (39.2%) | 12,397 (60.8%) |
| Bachelor's Degree or higher | 11,414 (58.8%) | 7,994 (41.2%) |
Occupancy by Age of Householder in Savannah
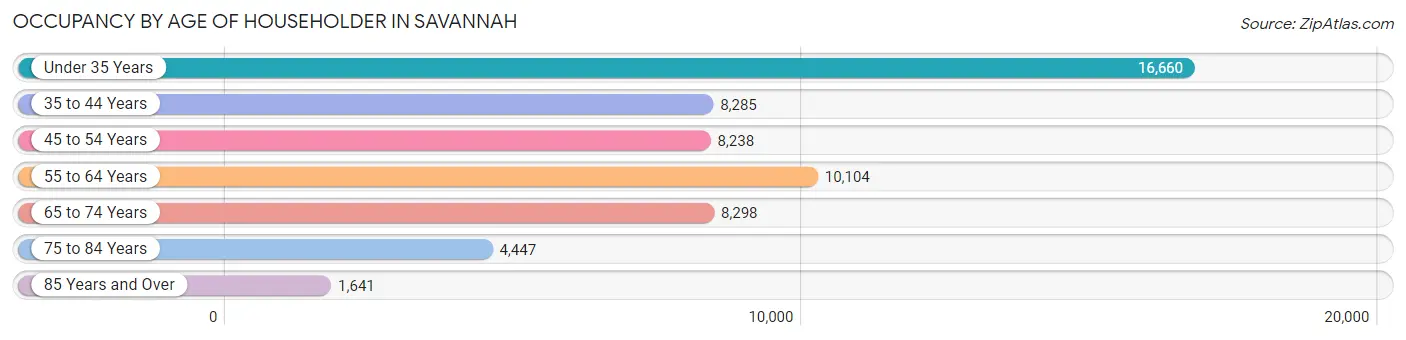
| Age Bracket | # Households | % Households |
| Under 35 Years | 16,660 | 28.9% |
| 35 to 44 Years | 8,285 | 14.4% |
| 45 to 54 Years | 8,238 | 14.3% |
| 55 to 64 Years | 10,104 | 17.5% |
| 65 to 74 Years | 8,298 | 14.4% |
| 75 to 84 Years | 4,447 | 7.7% |
| 85 Years and Over | 1,641 | 2.9% |
| Total | 57,673 | 100.0% |
Housing Finances in Savannah
Median Income by Occupancy in Savannah
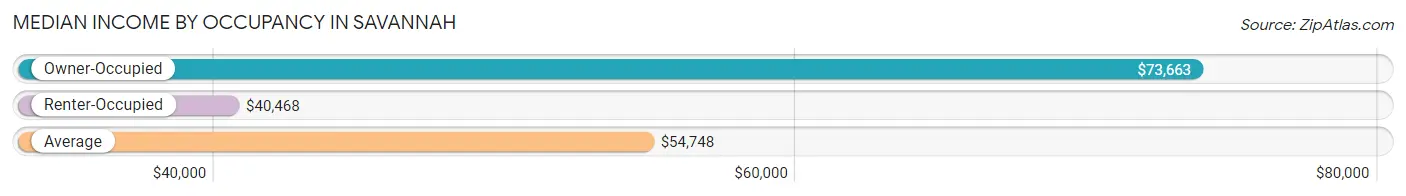
| Occupancy Type | # Households | Median Income |
| Owner-Occupied | 26,468 (45.9%) | $73,663 |
| Renter-Occupied | 31,205 (54.1%) | $40,468 |
| Average | 57,673 (100.0%) | $54,748 |
Occupancy by Householder Income Bracket in Savannah
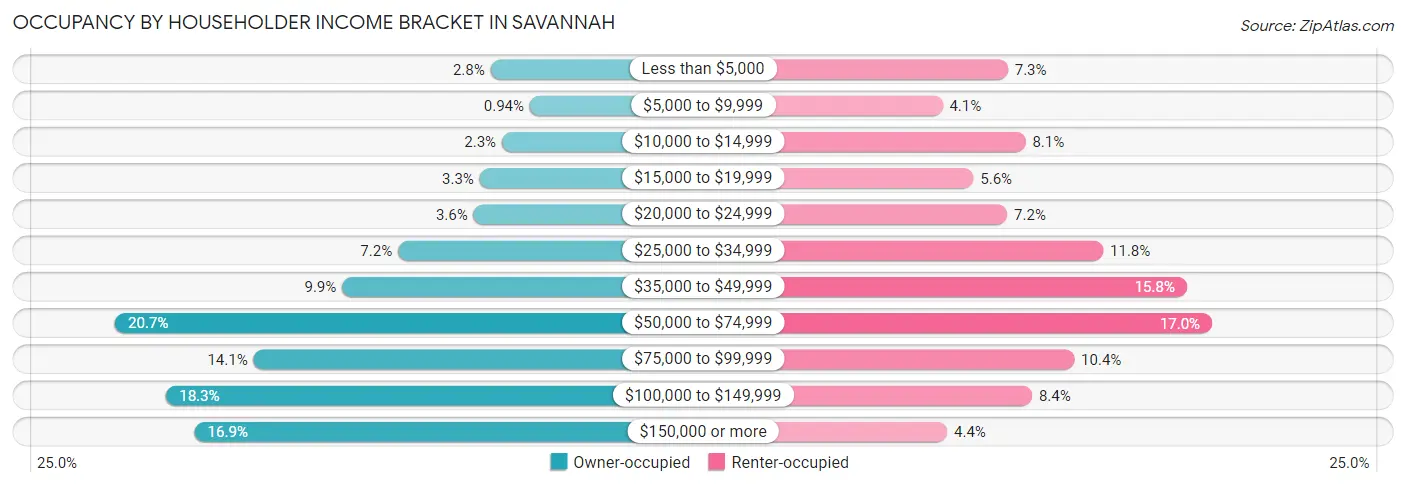
| Income Bracket | Owner-occupied | Renter-occupied |
| Less than $5,000 | 743 (2.8%) | 2,262 (7.2%) |
| $5,000 to $9,999 | 250 (0.9%) | 1,291 (4.1%) |
| $10,000 to $14,999 | 600 (2.3%) | 2,523 (8.1%) |
| $15,000 to $19,999 | 881 (3.3%) | 1,750 (5.6%) |
| $20,000 to $24,999 | 957 (3.6%) | 2,254 (7.2%) |
| $25,000 to $34,999 | 1,910 (7.2%) | 3,680 (11.8%) |
| $35,000 to $49,999 | 2,616 (9.9%) | 4,921 (15.8%) |
| $50,000 to $74,999 | 5,476 (20.7%) | 5,297 (17.0%) |
| $75,000 to $99,999 | 3,731 (14.1%) | 3,248 (10.4%) |
| $100,000 to $149,999 | 4,831 (18.2%) | 2,620 (8.4%) |
| $150,000 or more | 4,473 (16.9%) | 1,359 (4.4%) |
| Total | 26,468 (100.0%) | 31,205 (100.0%) |
Monthly Housing Cost Tiers in Savannah
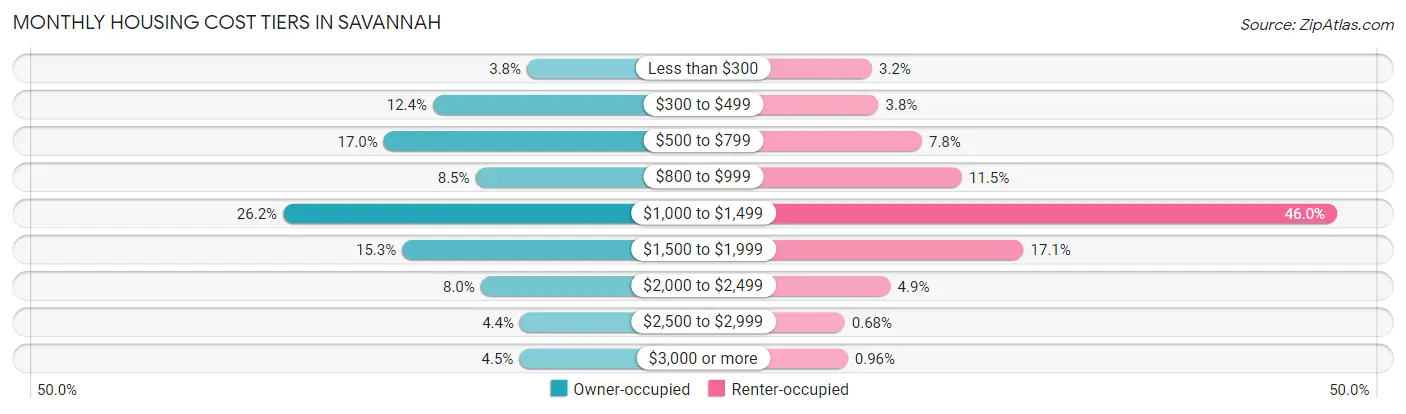
| Monthly Cost | Owner-occupied | Renter-occupied |
| Less than $300 | 996 (3.8%) | 994 (3.2%) |
| $300 to $499 | 3,287 (12.4%) | 1,183 (3.8%) |
| $500 to $799 | 4,487 (17.0%) | 2,431 (7.8%) |
| $800 to $999 | 2,249 (8.5%) | 3,578 (11.5%) |
| $1,000 to $1,499 | 6,939 (26.2%) | 14,348 (46.0%) |
| $1,500 to $1,999 | 4,037 (15.2%) | 5,347 (17.1%) |
| $2,000 to $2,499 | 2,124 (8.0%) | 1,529 (4.9%) |
| $2,500 to $2,999 | 1,167 (4.4%) | 211 (0.7%) |
| $3,000 or more | 1,182 (4.5%) | 299 (1.0%) |
| Total | 26,468 (100.0%) | 31,205 (100.0%) |
Physical Housing Characteristics in Savannah
Housing Structures in Savannah
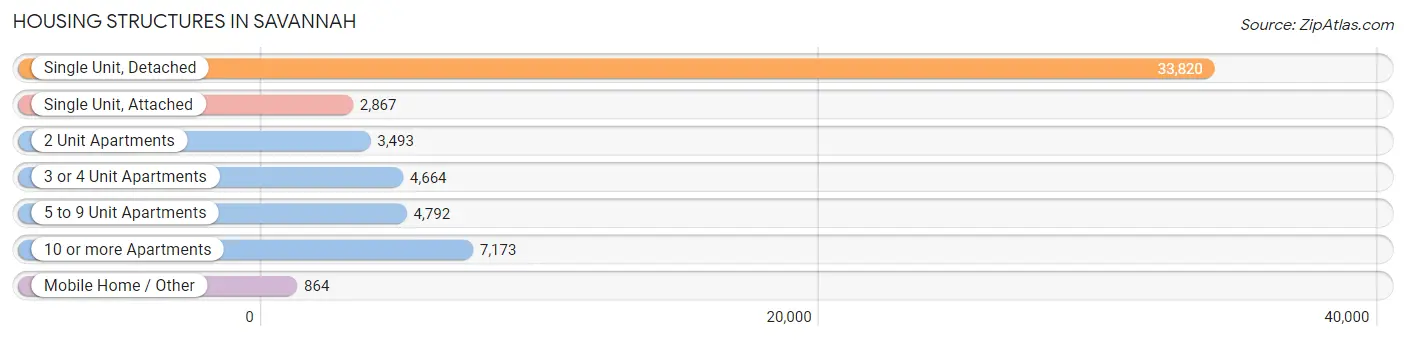
| Structure Type | # Housing Units | % Housing Units |
| Single Unit, Detached | 33,820 | 58.6% |
| Single Unit, Attached | 2,867 | 5.0% |
| 2 Unit Apartments | 3,493 | 6.1% |
| 3 or 4 Unit Apartments | 4,664 | 8.1% |
| 5 to 9 Unit Apartments | 4,792 | 8.3% |
| 10 or more Apartments | 7,173 | 12.4% |
| Mobile Home / Other | 864 | 1.5% |
| Total | 57,673 | 100.0% |
Housing Structures by Occupancy in Savannah
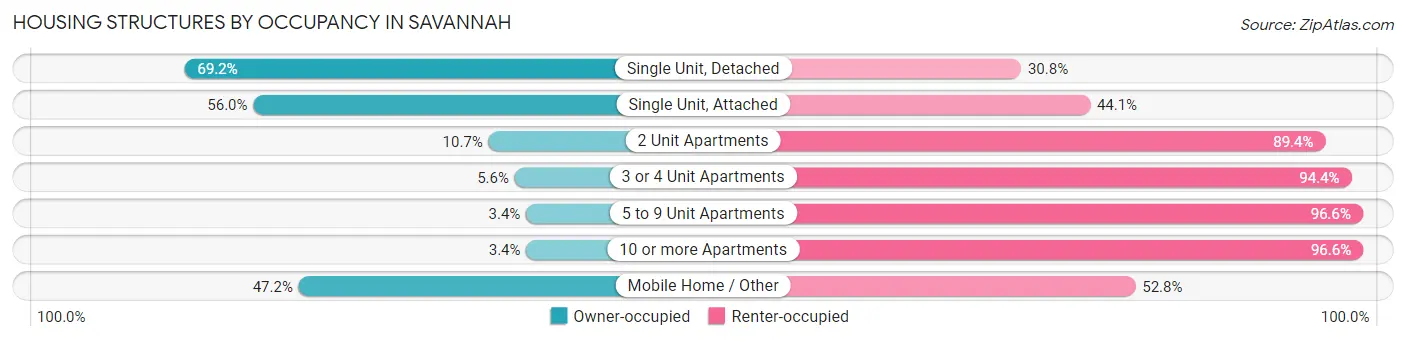
| Structure Type | Owner-occupied | Renter-occupied |
| Single Unit, Detached | 23,415 (69.2%) | 10,405 (30.8%) |
| Single Unit, Attached | 1,604 (55.9%) | 1,263 (44.1%) |
| 2 Unit Apartments | 372 (10.6%) | 3,121 (89.3%) |
| 3 or 4 Unit Apartments | 262 (5.6%) | 4,402 (94.4%) |
| 5 to 9 Unit Apartments | 164 (3.4%) | 4,628 (96.6%) |
| 10 or more Apartments | 243 (3.4%) | 6,930 (96.6%) |
| Mobile Home / Other | 408 (47.2%) | 456 (52.8%) |
| Total | 26,468 (45.9%) | 31,205 (54.1%) |
Housing Structures by Number of Rooms in Savannah
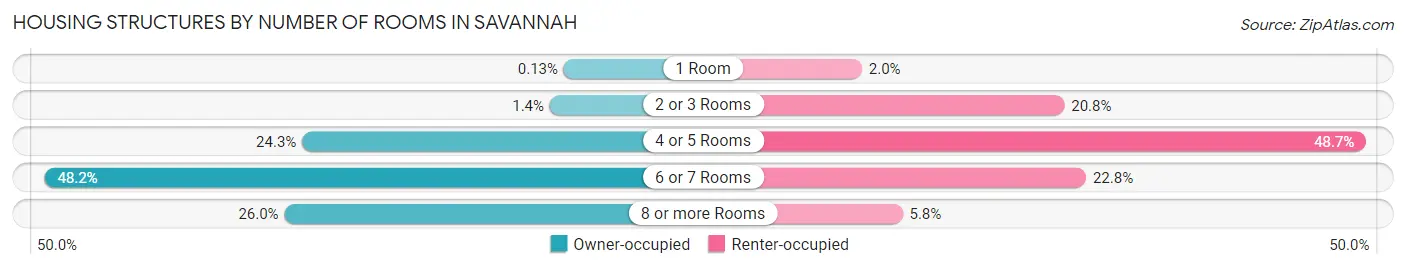
| Number of Rooms | Owner-occupied | Renter-occupied |
| 1 Room | 34 (0.1%) | 635 (2.0%) |
| 2 or 3 Rooms | 375 (1.4%) | 6,475 (20.7%) |
| 4 or 5 Rooms | 6,440 (24.3%) | 15,186 (48.7%) |
| 6 or 7 Rooms | 12,746 (48.2%) | 7,103 (22.8%) |
| 8 or more Rooms | 6,873 (26.0%) | 1,806 (5.8%) |
| Total | 26,468 (100.0%) | 31,205 (100.0%) |
Housing Structure by Heating Type in Savannah
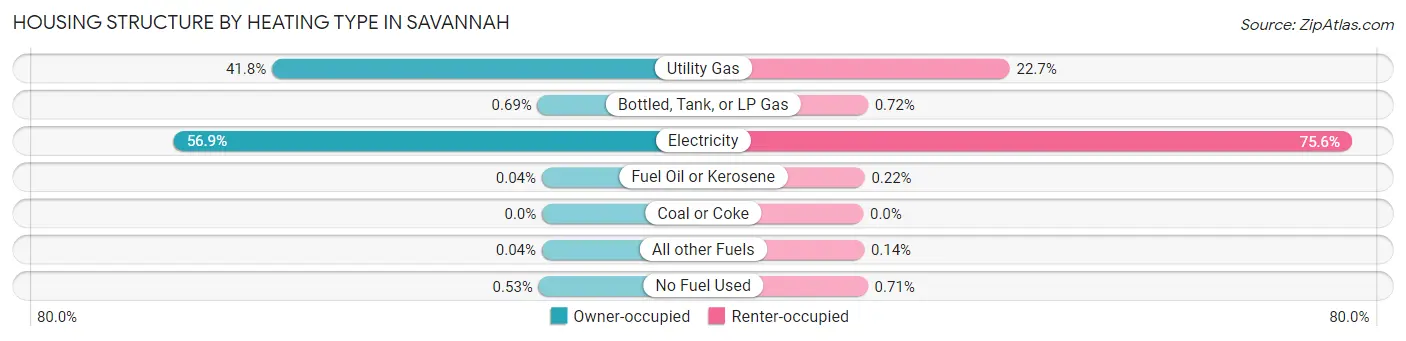
| Heating Type | Owner-occupied | Renter-occupied |
| Utility Gas | 11,054 (41.8%) | 7,069 (22.7%) |
| Bottled, Tank, or LP Gas | 183 (0.7%) | 226 (0.7%) |
| Electricity | 15,070 (56.9%) | 23,575 (75.5%) |
| Fuel Oil or Kerosene | 11 (0.0%) | 69 (0.2%) |
| Coal or Coke | 0 (0.0%) | 0 (0.0%) |
| All other Fuels | 10 (0.0%) | 44 (0.1%) |
| No Fuel Used | 140 (0.5%) | 222 (0.7%) |
| Total | 26,468 (100.0%) | 31,205 (100.0%) |
Household Vehicle Usage in Savannah
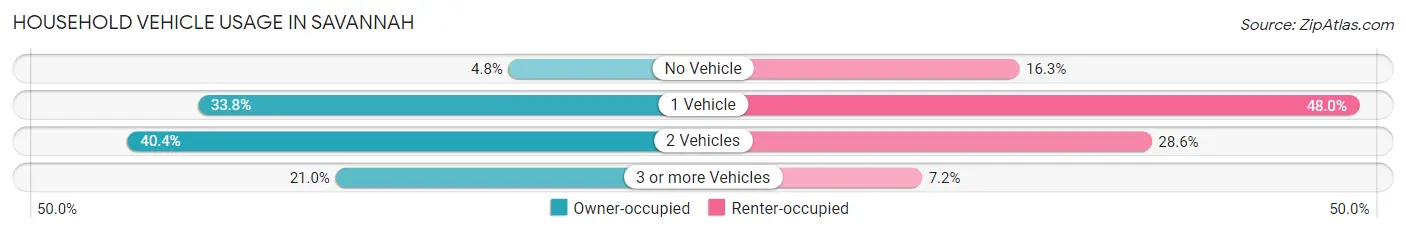
| Vehicles per Household | Owner-occupied | Renter-occupied |
| No Vehicle | 1,274 (4.8%) | 5,075 (16.3%) |
| 1 Vehicle | 8,954 (33.8%) | 14,965 (48.0%) |
| 2 Vehicles | 10,692 (40.4%) | 8,928 (28.6%) |
| 3 or more Vehicles | 5,548 (21.0%) | 2,237 (7.2%) |
| Total | 26,468 (100.0%) | 31,205 (100.0%) |
Real Estate & Mortgages in Savannah
Real Estate and Mortgage Overview in Savannah
| Characteristic | Without Mortgage | With Mortgage |
| Housing Units | 9,641 | 16,827 |
| Median Property Value | $168,200 | $223,300 |
| Median Household Income | $56,036 | $3,404 |
| Monthly Housing Costs | $549 | $1,142 |
| Real Estate Taxes | $1,578 | $786 |
Property Value by Mortgage Status in Savannah
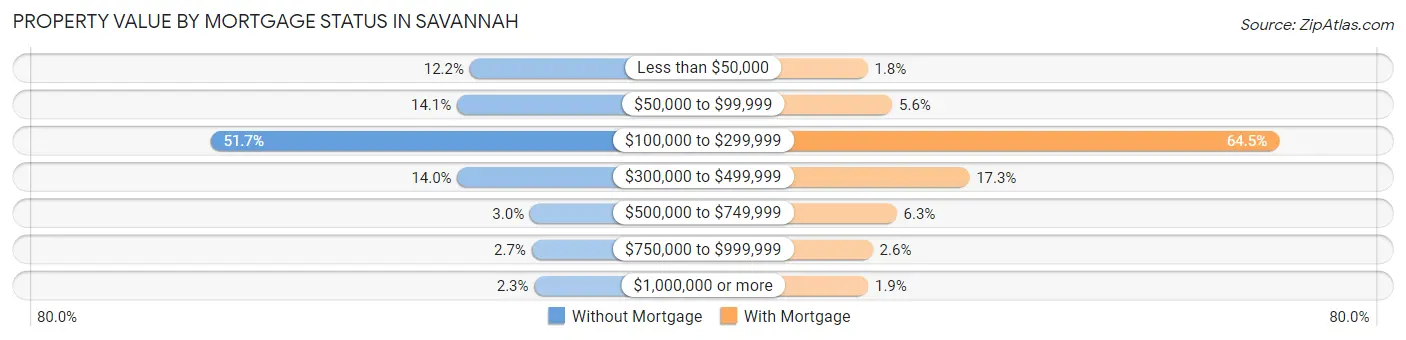
| Property Value | Without Mortgage | With Mortgage |
| Less than $50,000 | 1,172 (12.2%) | 308 (1.8%) |
| $50,000 to $99,999 | 1,359 (14.1%) | 937 (5.6%) |
| $100,000 to $299,999 | 4,981 (51.7%) | 10,857 (64.5%) |
| $300,000 to $499,999 | 1,354 (14.0%) | 2,915 (17.3%) |
| $500,000 to $749,999 | 288 (3.0%) | 1,052 (6.2%) |
| $750,000 to $999,999 | 263 (2.7%) | 439 (2.6%) |
| $1,000,000 or more | 224 (2.3%) | 319 (1.9%) |
| Total | 9,641 (100.0%) | 16,827 (100.0%) |
Household Income by Mortgage Status in Savannah
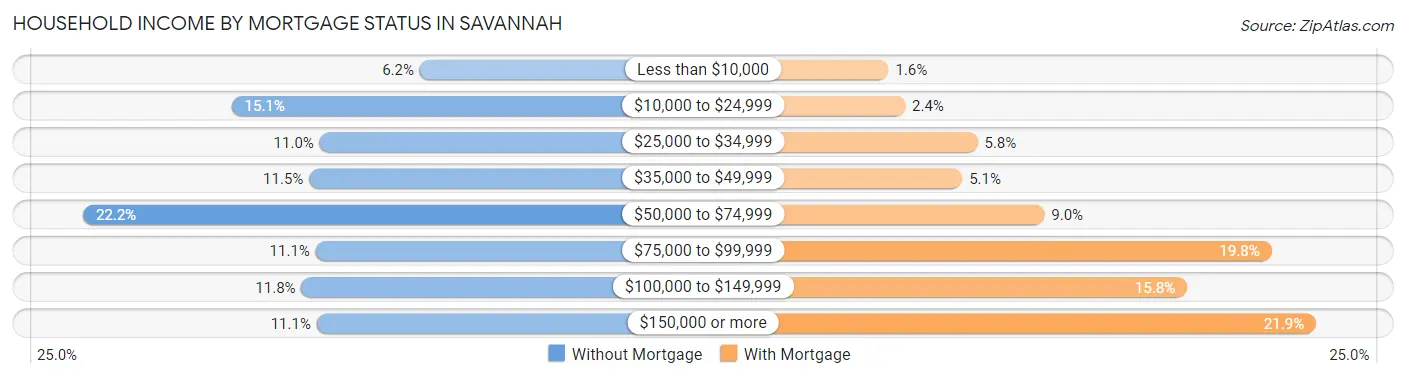
| Household Income | Without Mortgage | With Mortgage |
| Less than $10,000 | 596 (6.2%) | 265 (1.6%) |
| $10,000 to $24,999 | 1,460 (15.1%) | 397 (2.4%) |
| $25,000 to $34,999 | 1,056 (11.0%) | 978 (5.8%) |
| $35,000 to $49,999 | 1,104 (11.5%) | 854 (5.1%) |
| $50,000 to $74,999 | 2,142 (22.2%) | 1,512 (9.0%) |
| $75,000 to $99,999 | 1,074 (11.1%) | 3,334 (19.8%) |
| $100,000 to $149,999 | 1,140 (11.8%) | 2,657 (15.8%) |
| $150,000 or more | 1,069 (11.1%) | 3,691 (21.9%) |
| Total | 9,641 (100.0%) | 16,827 (100.0%) |
Property Value to Household Income Ratio in Savannah
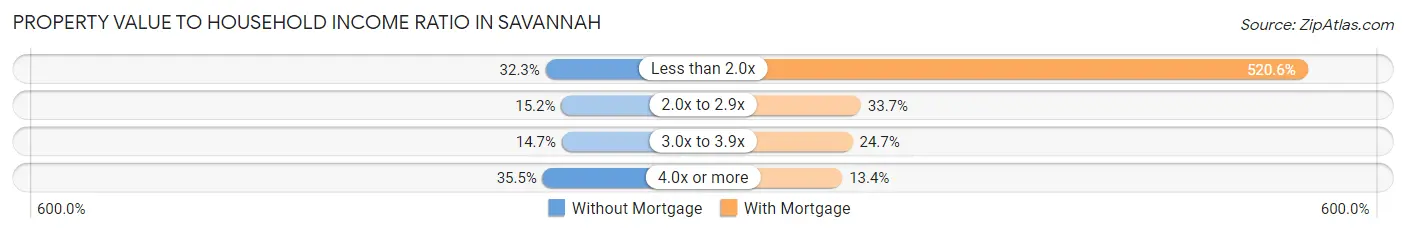
| Value-to-Income Ratio | Without Mortgage | With Mortgage |
| Less than 2.0x | 3,109 (32.3%) | 87,593 (520.5%) |
| 2.0x to 2.9x | 1,464 (15.2%) | 5,674 (33.7%) |
| 3.0x to 3.9x | 1,412 (14.6%) | 4,148 (24.6%) |
| 4.0x or more | 3,418 (35.4%) | 2,249 (13.4%) |
| Total | 9,641 (100.0%) | 16,827 (100.0%) |
Real Estate Taxes by Mortgage Status in Savannah
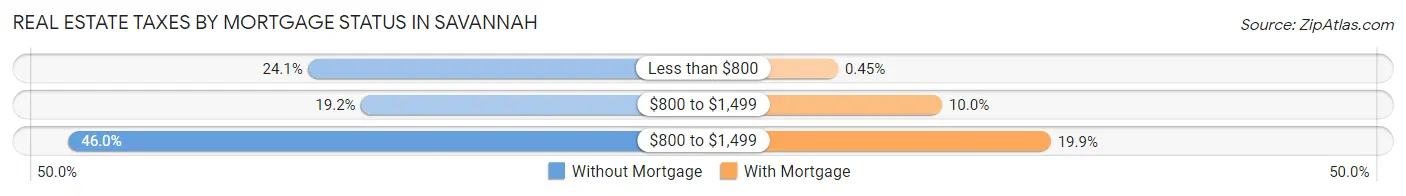
| Property Taxes | Without Mortgage | With Mortgage |
| Less than $800 | 2,321 (24.1%) | 75 (0.4%) |
| $800 to $1,499 | 1,855 (19.2%) | 1,674 (10.0%) |
| $800 to $1,499 | 4,435 (46.0%) | 3,346 (19.9%) |
| Total | 9,641 (100.0%) | 16,827 (100.0%) |
Health & Disability in Savannah
Health Insurance Coverage by Age in Savannah
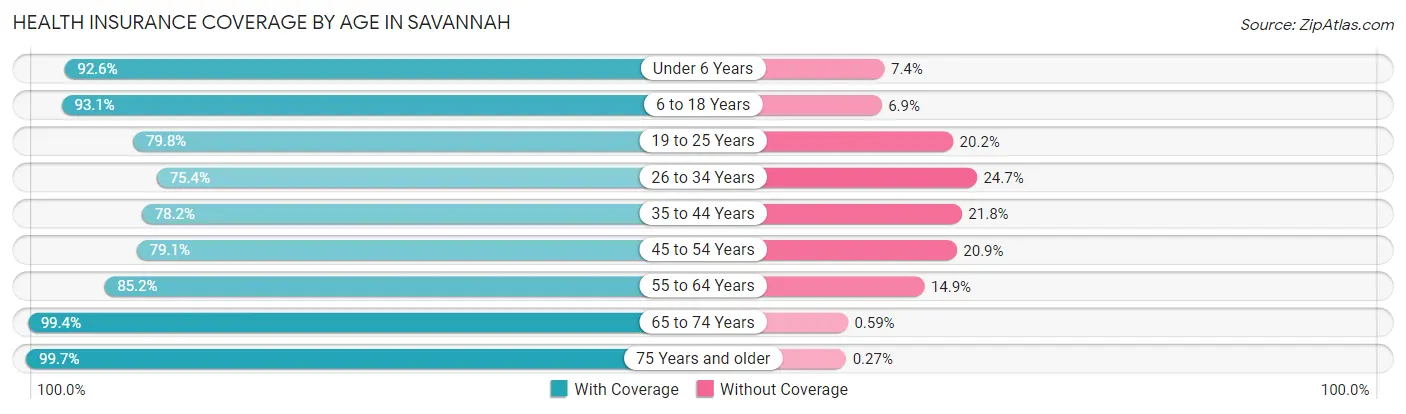
| Age Bracket | With Coverage | Without Coverage |
| Under 6 Years | 10,152 (92.6%) | 812 (7.4%) |
| 6 to 18 Years | 20,000 (93.1%) | 1,477 (6.9%) |
| 19 to 25 Years | 16,395 (79.8%) | 4,153 (20.2%) |
| 26 to 34 Years | 16,622 (75.3%) | 5,439 (24.6%) |
| 35 to 44 Years | 12,232 (78.2%) | 3,417 (21.8%) |
| 45 to 54 Years | 10,887 (79.1%) | 2,876 (20.9%) |
| 55 to 64 Years | 14,002 (85.2%) | 2,442 (14.8%) |
| 65 to 74 Years | 12,035 (99.4%) | 71 (0.6%) |
| 75 Years and older | 8,911 (99.7%) | 24 (0.3%) |
| Total | 121,236 (85.4%) | 20,711 (14.6%) |
Health Insurance Coverage by Citizenship Status in Savannah
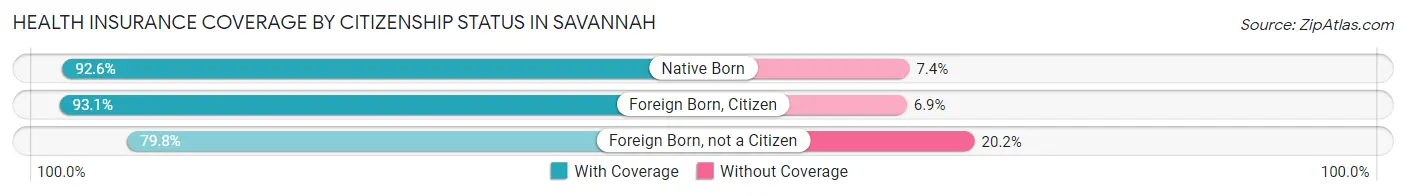
| Citizenship Status | With Coverage | Without Coverage |
| Native Born | 10,152 (92.6%) | 812 (7.4%) |
| Foreign Born, Citizen | 20,000 (93.1%) | 1,477 (6.9%) |
| Foreign Born, not a Citizen | 16,395 (79.8%) | 4,153 (20.2%) |
Health Insurance Coverage by Household Income in Savannah
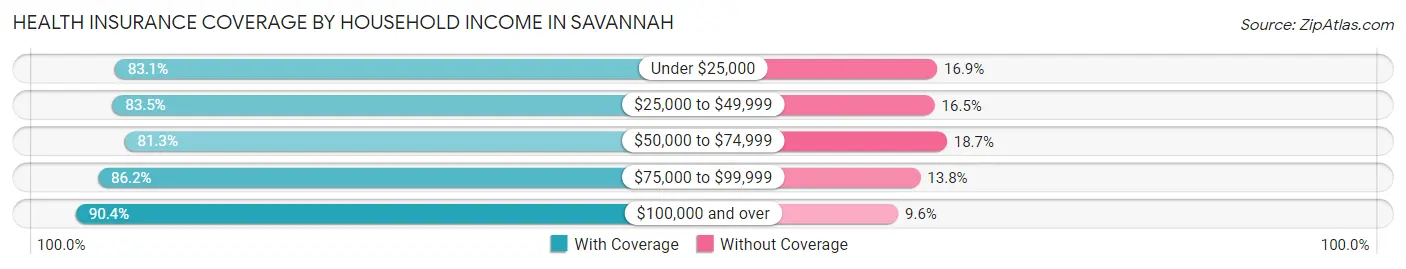
| Household Income | With Coverage | Without Coverage |
| Under $25,000 | 20,957 (83.1%) | 4,269 (16.9%) |
| $25,000 to $49,999 | 23,359 (83.5%) | 4,604 (16.5%) |
| $50,000 to $74,999 | 20,937 (81.3%) | 4,826 (18.7%) |
| $75,000 to $99,999 | 16,688 (86.2%) | 2,669 (13.8%) |
| $100,000 and over | 35,165 (90.4%) | 3,738 (9.6%) |
Public vs Private Health Insurance Coverage by Age in Savannah
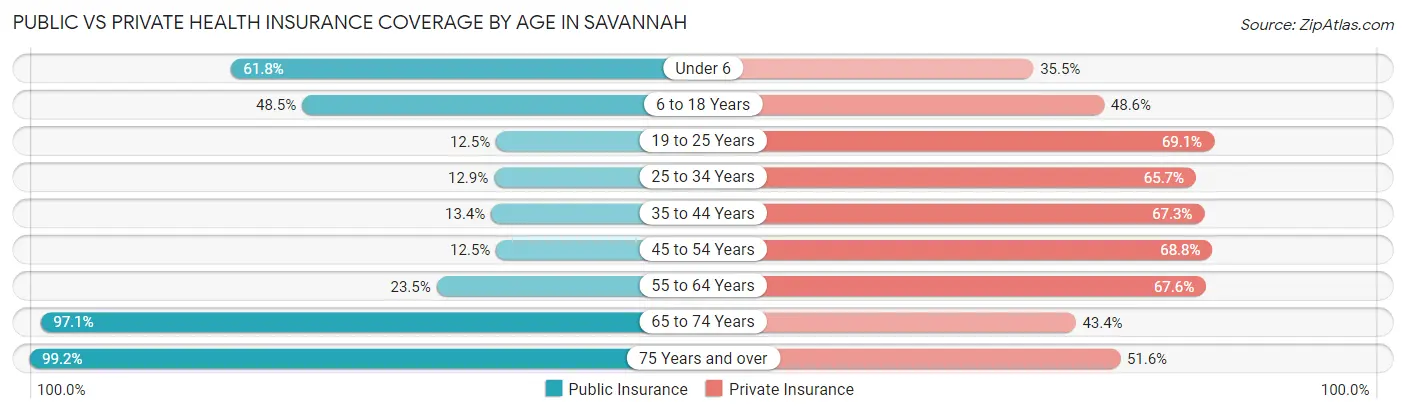
| Age Bracket | Public Insurance | Private Insurance |
| Under 6 | 6,775 (61.8%) | 3,895 (35.5%) |
| 6 to 18 Years | 10,418 (48.5%) | 10,447 (48.6%) |
| 19 to 25 Years | 2,568 (12.5%) | 14,193 (69.1%) |
| 25 to 34 Years | 2,836 (12.9%) | 14,496 (65.7%) |
| 35 to 44 Years | 2,099 (13.4%) | 10,526 (67.3%) |
| 45 to 54 Years | 1,716 (12.5%) | 9,464 (68.8%) |
| 55 to 64 Years | 3,869 (23.5%) | 11,114 (67.6%) |
| 65 to 74 Years | 11,753 (97.1%) | 5,250 (43.4%) |
| 75 Years and over | 8,860 (99.2%) | 4,613 (51.6%) |
| Total | 50,894 (35.8%) | 83,998 (59.2%) |
Disability Status by Sex by Age in Savannah
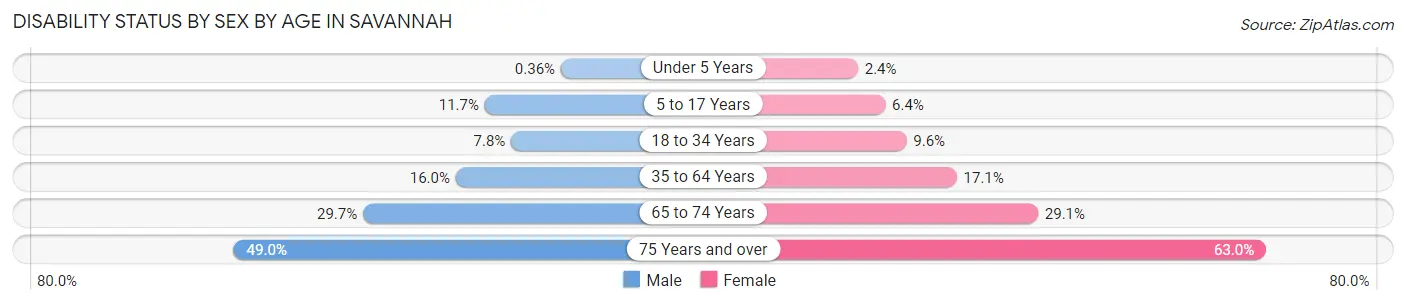
| Age Bracket | Male | Female |
| Under 5 Years | 16 (0.4%) | 114 (2.4%) |
| 5 to 17 Years | 1,230 (11.7%) | 630 (6.4%) |
| 18 to 34 Years | 1,577 (7.7%) | 2,409 (9.6%) |
| 35 to 64 Years | 3,350 (16.0%) | 4,241 (17.1%) |
| 65 to 74 Years | 1,550 (29.7%) | 2,007 (29.1%) |
| 75 Years and over | 1,772 (48.9%) | 3,348 (63.0%) |
Disability Class by Sex by Age in Savannah
Disability Class: Hearing Difficulty
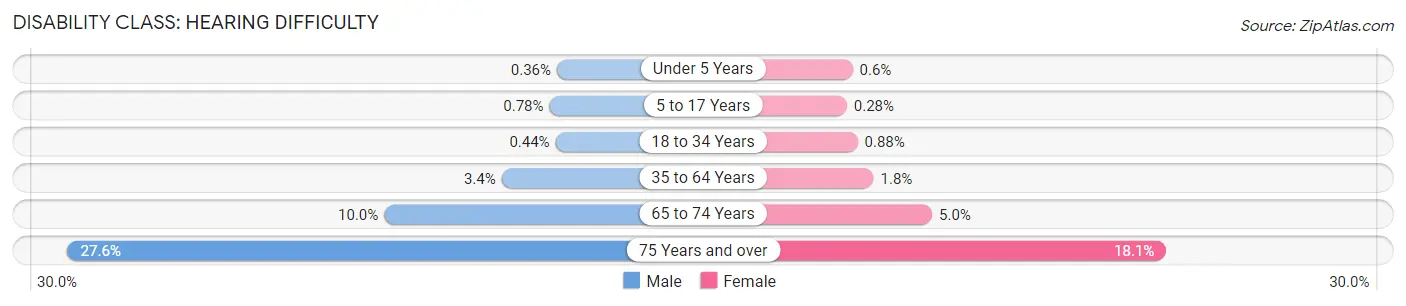
| Age Bracket | Male | Female |
| Under 5 Years | 16 (0.4%) | 29 (0.6%) |
| 5 to 17 Years | 82 (0.8%) | 27 (0.3%) |
| 18 to 34 Years | 90 (0.4%) | 220 (0.9%) |
| 35 to 64 Years | 722 (3.4%) | 440 (1.8%) |
| 65 to 74 Years | 520 (10.0%) | 347 (5.0%) |
| 75 Years and over | 999 (27.6%) | 960 (18.1%) |
Disability Class: Vision Difficulty
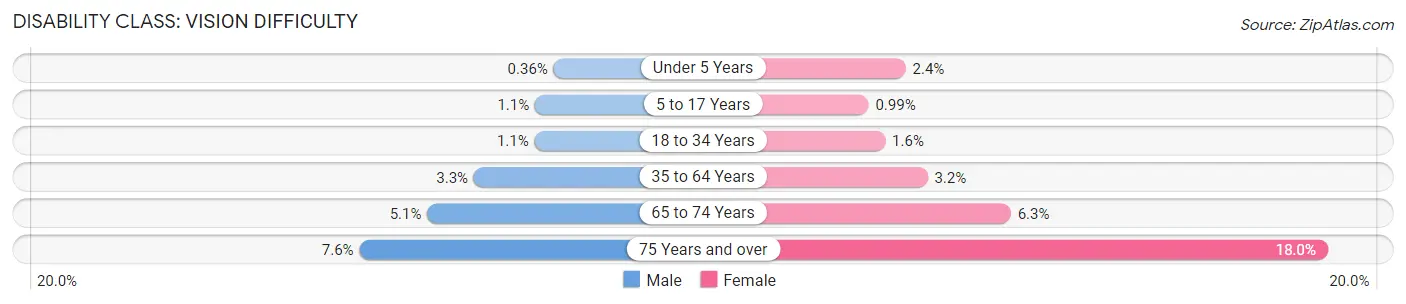
| Age Bracket | Male | Female |
| Under 5 Years | 16 (0.4%) | 114 (2.4%) |
| 5 to 17 Years | 111 (1.1%) | 97 (1.0%) |
| 18 to 34 Years | 218 (1.1%) | 404 (1.6%) |
| 35 to 64 Years | 696 (3.3%) | 790 (3.2%) |
| 65 to 74 Years | 263 (5.1%) | 432 (6.3%) |
| 75 Years and over | 274 (7.6%) | 959 (18.0%) |
Disability Class: Cognitive Difficulty
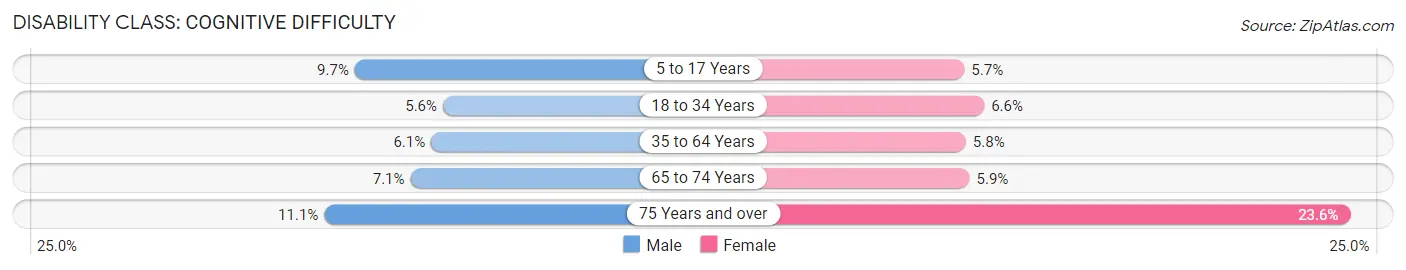
| Age Bracket | Male | Female |
| 5 to 17 Years | 1,020 (9.7%) | 557 (5.7%) |
| 18 to 34 Years | 1,139 (5.6%) | 1,661 (6.6%) |
| 35 to 64 Years | 1,288 (6.1%) | 1,433 (5.8%) |
| 65 to 74 Years | 370 (7.1%) | 409 (5.9%) |
| 75 Years and over | 402 (11.1%) | 1,254 (23.6%) |
Disability Class: Ambulatory Difficulty
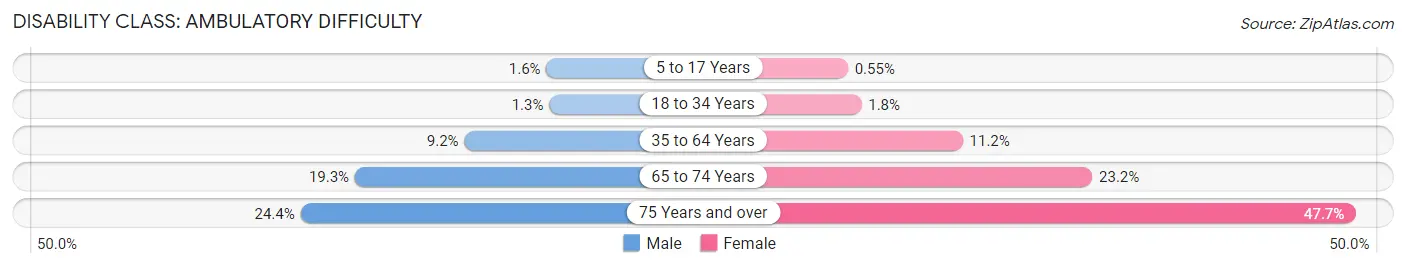
| Age Bracket | Male | Female |
| 5 to 17 Years | 165 (1.6%) | 54 (0.5%) |
| 18 to 34 Years | 265 (1.3%) | 456 (1.8%) |
| 35 to 64 Years | 1,927 (9.2%) | 2,789 (11.2%) |
| 65 to 74 Years | 1,008 (19.3%) | 1,602 (23.2%) |
| 75 Years and over | 883 (24.4%) | 2,537 (47.7%) |
Disability Class: Self-Care Difficulty
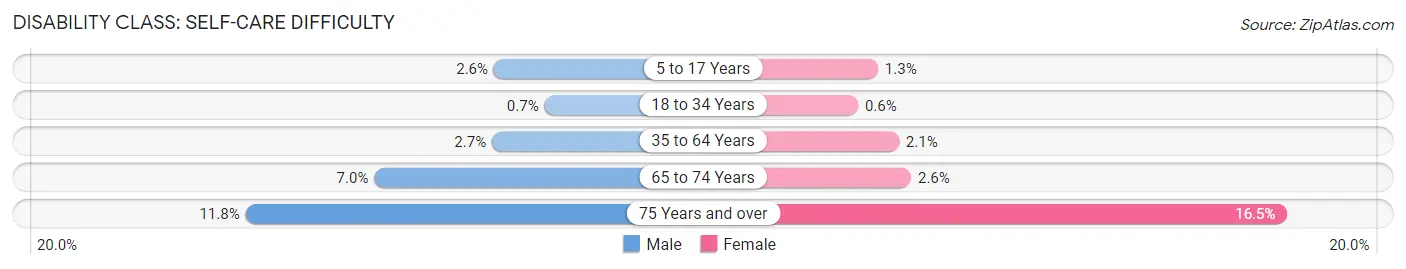
| Age Bracket | Male | Female |
| 5 to 17 Years | 272 (2.6%) | 131 (1.3%) |
| 18 to 34 Years | 142 (0.7%) | 152 (0.6%) |
| 35 to 64 Years | 555 (2.6%) | 528 (2.1%) |
| 65 to 74 Years | 366 (7.0%) | 177 (2.6%) |
| 75 Years and over | 427 (11.8%) | 879 (16.5%) |
Technology Access in Savannah
Computing Device Access in Savannah
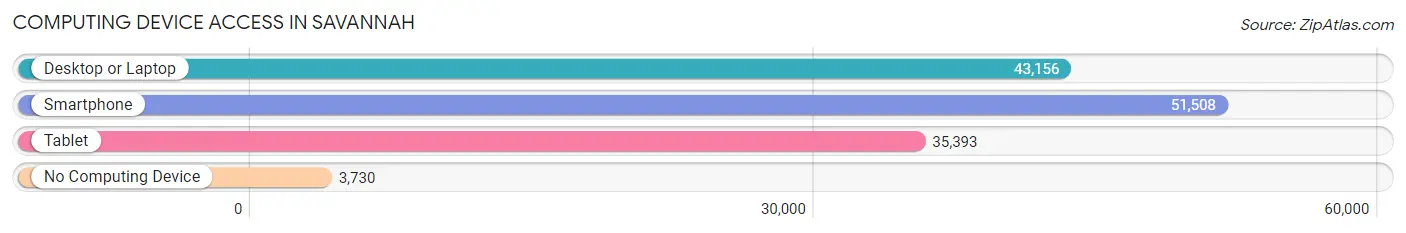
| Device Type | # Households | % Households |
| Desktop or Laptop | 43,156 | 74.8% |
| Smartphone | 51,508 | 89.3% |
| Tablet | 35,393 | 61.4% |
| No Computing Device | 3,730 | 6.5% |
| Total | 57,673 | 100.0% |
Internet Access in Savannah
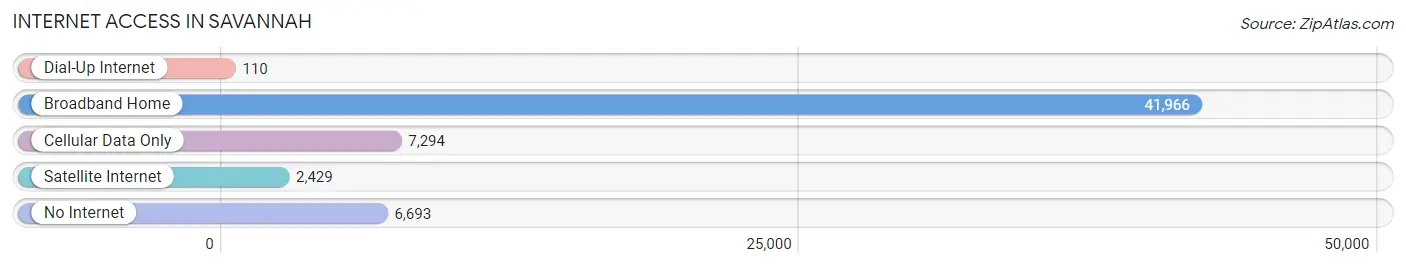
| Internet Type | # Households | % Households |
| Dial-Up Internet | 110 | 0.2% |
| Broadband Home | 41,966 | 72.8% |
| Cellular Data Only | 7,294 | 12.7% |
| Satellite Internet | 2,429 | 4.2% |
| No Internet | 6,693 | 11.6% |
| Total | 57,673 | 100.0% |
Savannah Summary
Savannah, Georgia is a city located in the southeastern United States, in the state of Georgia. It is the oldest city in the state and the county seat of Chatham County. Savannah is located along the Savannah River, approximately 20 miles (32 km) upriver from the Atlantic Ocean. The city is known for its unique architecture, cobblestone streets, and lush gardens.
History
Savannah was founded in 1733 by James Oglethorpe, a British general and philanthropist. Oglethorpe had been granted a charter by King George II to establish a colony in the New World. He chose the site of Savannah for its strategic location, which was close to the mouth of the Savannah River and provided access to the Atlantic Ocean.
The city was laid out in a grid pattern, with 24 squares, each containing a public park. Oglethorpe also established a system of government for the colony, which included a bicameral legislature and a court system.
Savannah quickly grew into a prosperous port city, and by the mid-1800s it was the fourth largest city in the United States. The city was a major center for the cotton trade, and it was also a major port for the slave trade.
In 1861, Savannah was the first Confederate city to be captured by Union forces during the Civil War. After the war, the city was rebuilt and continued to grow. In the late 19th century, Savannah became a major tourist destination, and it remains a popular destination today.
Geography
Savannah is located in the southeastern United States, in the state of Georgia. It is situated along the Savannah River, approximately 20 miles (32 km) upriver from the Atlantic Ocean. The city is located in Chatham County, and it is bordered by the cities of Thunderbolt, Garden City, and Pooler.
The city has a total area of 108.3 square miles (280.7 km2), of which 106.3 square miles (275.3 km2) is land and 2.0 square miles (5.4 km2) is water. The city is located at an elevation of 50 feet (15 m) above sea level.
Economy
Savannah is a major economic center in the southeastern United States. The city is home to several major industries, including tourism, manufacturing, shipping, and logistics.
The city is a major tourist destination, and it is home to several historic sites, including the Savannah Historic District, which is a National Historic Landmark. The city is also home to several museums, including the Telfair Museum of Art and the Savannah History Museum.
The city is also a major port, and it is home to the Port of Savannah, which is the fourth largest port in the United States. The port is a major hub for the import and export of goods, and it is also a major center for the shipping and logistics industry.
Demographics
As of the 2010 census, the population of Savannah was 136,286. The city has a population density of 1,269 people per square mile (489/km2). The racial makeup of the city is 54.2% African American, 37.2% White, 2.2% Asian, 0.2% Native American, 0.1% Pacific Islander, and 5.9% from other races.
The median household income in Savannah is $41,945, and the median family income is $50,945. The city has a poverty rate of 22.3%. The largest employers in the city are the Savannah-Chatham County Public School System, Memorial University Medical Center, and Gulfstream Aerospace.
Conclusion
Savannah, Georgia is a city with a rich history and a vibrant economy. It is a major tourist destination, and it is home to several historic sites and museums. The city is also a major port, and it is home to the Port of Savannah, which is the fourth largest port in the United States. The city has a diverse population, with a median household income of $41,945 and a poverty rate of 22.3%. Savannah is a city with a unique culture and a bright future.
Common Questions
What is Per Capita Income in Savannah?
Per Capita income in Savannah is $30,978.
What is the Median Family Income in Savannah?
Median Family Income in Savannah is $68,116.
What is the Median Household income in Savannah?
Median Household Income in Savannah is $54,748.
What is Income or Wage Gap in Savannah?
Income or Wage Gap in Savannah is 16.9%.
Women in Savannah earn 83.1 cents for every dollar earned by a man.
What is Family Income Deficit in Savannah?
Family Income Deficit in Savannah is $12,160.
Families that are below poverty line in Savannah earn $12,160 less on average than the poverty threshold level.
What is Inequality or Gini Index in Savannah?
Inequality or Gini Index in Savannah is 0.49.
What is the Total Population of Savannah?
Total Population of Savannah is 147,583.
What is the Total Male Population of Savannah?
Total Male Population of Savannah is 70,226.
What is the Total Female Population of Savannah?
Total Female Population of Savannah is 77,357.
What is the Ratio of Males per 100 Females in Savannah?
There are 90.78 Males per 100 Females in Savannah.
What is the Ratio of Females per 100 Males in Savannah?
There are 110.15 Females per 100 Males in Savannah.
What is the Median Population Age in Savannah?
Median Population Age in Savannah is 33.5 Years.
What is the Average Family Size in Savannah
Average Family Size in Savannah is 3.2 People.
What is the Average Household Size in Savannah
Average Household Size in Savannah is 2.4 People.
How Large is the Labor Force in Savannah?
There are 77,127 People in the Labor Forcein in Savannah.
What is the Percentage of People in the Labor Force in Savannah?
64.2% of People are in the Labor Force in Savannah.
What is the Unemployment Rate in Savannah?
Unemployment Rate in Savannah is 7.2%.