Irondale, GA Map & Demographics
Irondale Map
Irondale Overview
$20,236
PER CAPITA INCOME
$55,406
AVG FAMILY INCOME
$53,598
AVG HOUSEHOLD INCOME
25.6%
WAGE / INCOME GAP [ % ]
74.4¢/ $1
WAGE / INCOME GAP [ $ ]
$12,323
FAMILY INCOME DEFICIT
0.42
INEQUALITY / GINI INDEX
8,305
TOTAL POPULATION
3,736
MALE POPULATION
4,569
FEMALE POPULATION
81.77
MALES / 100 FEMALES
122.30
FEMALES / 100 MALES
32.8
MEDIAN AGE
3.6
AVG FAMILY SIZE
3.0
AVG HOUSEHOLD SIZE
3,530
LABOR FORCE [ PEOPLE ]
57.5%
PERCENT IN LABOR FORCE
5.9%
UNEMPLOYMENT RATE
Income in Irondale
Income Overview in Irondale
Per Capita Income in Irondale is $20,236, while median incomes of families and households are $55,406 and $53,598 respectively.
| Characteristic | Number | Measure |
| Per Capita Income | 8,305 | $20,236 |
| Median Family Income | 2,035 | $55,406 |
| Mean Family Income | 2,035 | $65,397 |
| Median Household Income | 2,755 | $53,598 |
| Mean Household Income | 2,755 | $60,882 |
| Income Deficit | 2,035 | $12,323 |
| Wage / Income Gap (%) | 8,305 | 25.62% |
| Wage / Income Gap ($) | 8,305 | 74.38¢ per $1 |
| Gini / Inequality Index | 8,305 | 0.42 |
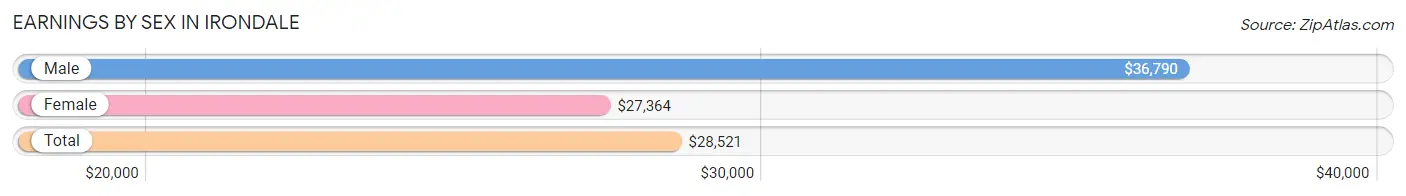
Earnings by Sex in Irondale
Average Earnings in Irondale are $28,521, $36,790 for men and $27,364 for women, a difference of 25.6%.
| Sex | Number | Average Earnings |
| Male | 1,589 (45.1%) | $36,790 |
| Female | 1,931 (54.9%) | $27,364 |
| Total | 3,520 (100.0%) | $28,521 |
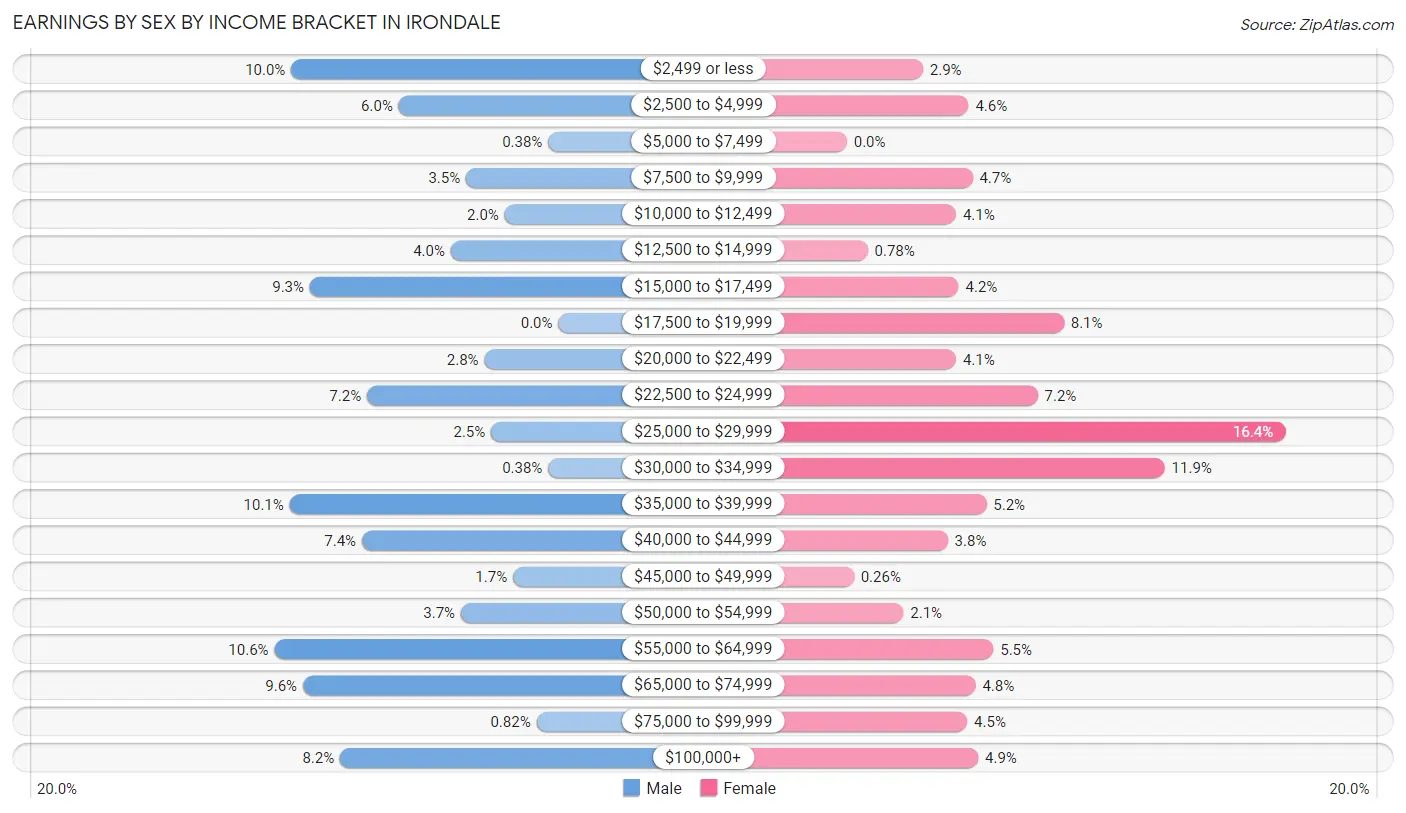
Earnings by Sex by Income Bracket in Irondale
The most common earnings brackets in Irondale are $55,000 to $64,999 for men (169 | 10.6%) and $25,000 to $29,999 for women (317 | 16.4%).
| Income | Male | Female |
| $2,499 or less | 159 (10.0%) | 55 (2.9%) |
| $2,500 to $4,999 | 95 (6.0%) | 88 (4.6%) |
| $5,000 to $7,499 | 6 (0.4%) | 0 (0.0%) |
| $7,500 to $9,999 | 55 (3.5%) | 91 (4.7%) |
| $10,000 to $12,499 | 32 (2.0%) | 79 (4.1%) |
| $12,500 to $14,999 | 64 (4.0%) | 15 (0.8%) |
| $15,000 to $17,499 | 148 (9.3%) | 81 (4.2%) |
| $17,500 to $19,999 | 0 (0.0%) | 157 (8.1%) |
| $20,000 to $22,499 | 44 (2.8%) | 79 (4.1%) |
| $22,500 to $24,999 | 114 (7.2%) | 138 (7.1%) |
| $25,000 to $29,999 | 40 (2.5%) | 317 (16.4%) |
| $30,000 to $34,999 | 6 (0.4%) | 230 (11.9%) |
| $35,000 to $39,999 | 160 (10.1%) | 101 (5.2%) |
| $40,000 to $44,999 | 117 (7.4%) | 73 (3.8%) |
| $45,000 to $49,999 | 27 (1.7%) | 5 (0.3%) |
| $50,000 to $54,999 | 58 (3.6%) | 41 (2.1%) |
| $55,000 to $64,999 | 169 (10.6%) | 106 (5.5%) |
| $65,000 to $74,999 | 152 (9.6%) | 93 (4.8%) |
| $75,000 to $99,999 | 13 (0.8%) | 87 (4.5%) |
| $100,000+ | 130 (8.2%) | 95 (4.9%) |
| Total | 1,589 (100.0%) | 1,931 (100.0%) |
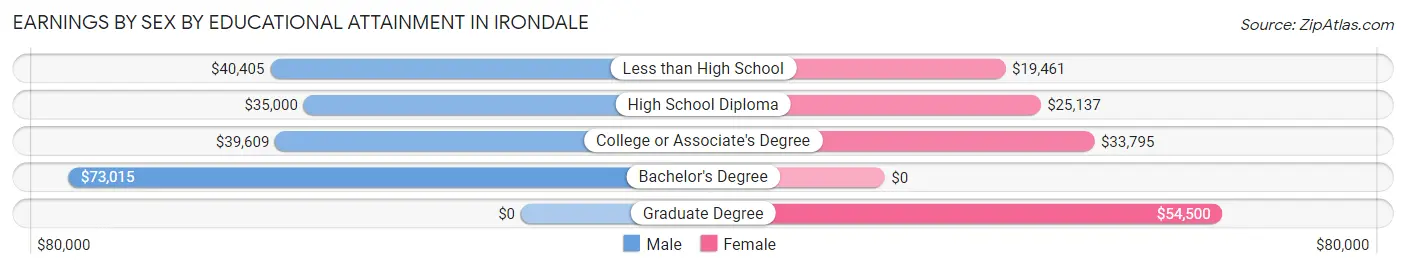
Earnings by Sex by Educational Attainment in Irondale
Average earnings in Irondale are $41,293 for men and $28,690 for women, a difference of 30.5%. Men with an educational attainment of bachelor's degree enjoy the highest average annual earnings of $73,015, while those with high school diploma education earn the least with $35,000. Women with an educational attainment of graduate degree earn the most with the average annual earnings of $54,500, while those with less than high school education have the smallest earnings of $19,461.
| Educational Attainment | Male Income | Female Income |
| Less than High School | $40,405 | $19,461 |
| High School Diploma | $35,000 | $25,137 |
| College or Associate's Degree | $39,609 | $33,795 |
| Bachelor's Degree | $73,015 | $0 |
| Graduate Degree | - | - |
| Total | $41,293 | $28,690 |
Family Income in Irondale
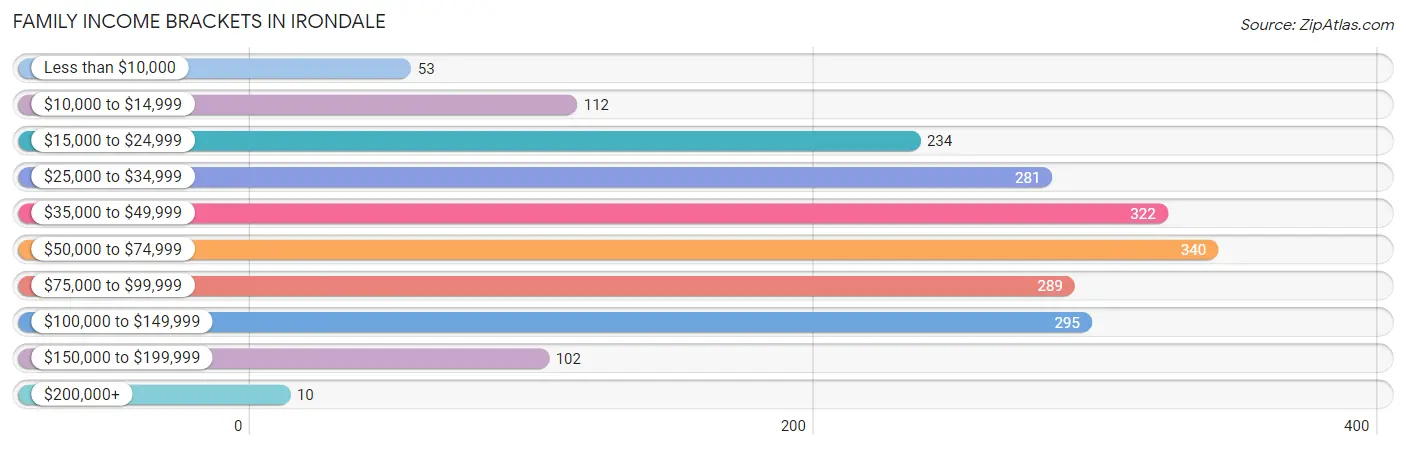
Family Income Brackets in Irondale
According to the Irondale family income data, there are 340 families falling into the $50,000 to $74,999 income range, which is the most common income bracket and makes up 16.7% of all families. Conversely, the $200,000+ income bracket is the least frequent group with only 10 families (0.5%) belonging to this category.
| Income Bracket | # Families | % Families |
| Less than $10,000 | 53 | 2.6% |
| $10,000 to $14,999 | 112 | 5.5% |
| $15,000 to $24,999 | 234 | 11.5% |
| $25,000 to $34,999 | 281 | 13.8% |
| $35,000 to $49,999 | 322 | 15.8% |
| $50,000 to $74,999 | 340 | 16.7% |
| $75,000 to $99,999 | 289 | 14.2% |
| $100,000 to $149,999 | 295 | 14.5% |
| $150,000 to $199,999 | 102 | 5.0% |
| $200,000+ | 10 | 0.5% |
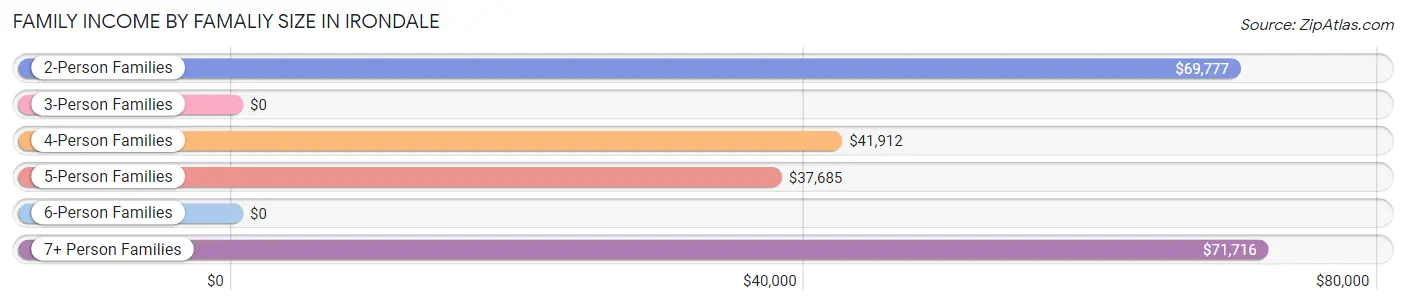
Family Income by Famaliy Size in Irondale
7+ person families (162 | 8.0%) account for the highest median family income in Irondale with $71,716 per family, while 2-person families (717 | 35.2%) have the highest median income of $34,888 per family member.
| Income Bracket | # Families | Median Income |
| 2-Person Families | 717 (35.2%) | $69,777 |
| 3-Person Families | 533 (26.2%) | $0 |
| 4-Person Families | 280 (13.8%) | $41,912 |
| 5-Person Families | 322 (15.8%) | $37,685 |
| 6-Person Families | 21 (1.0%) | $0 |
| 7+ Person Families | 162 (8.0%) | $71,716 |
| Total | 2,035 (100.0%) | $55,406 |
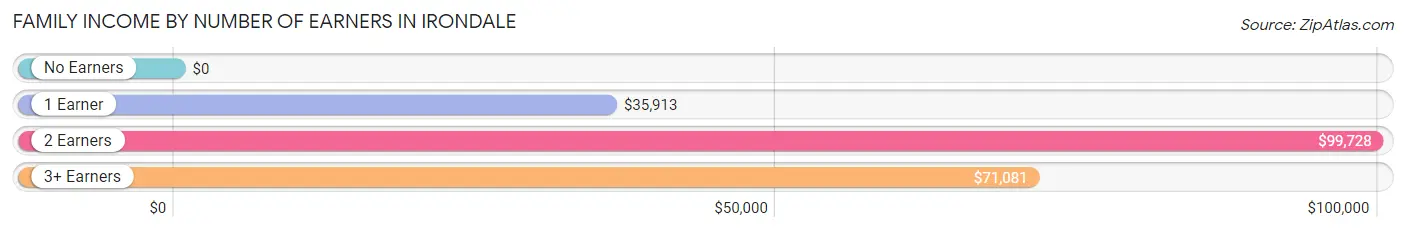
Family Income by Number of Earners in Irondale
| Number of Earners | # Families | Median Income |
| No Earners | 294 (14.4%) | $0 |
| 1 Earner | 999 (49.1%) | $35,913 |
| 2 Earners | 416 (20.4%) | $99,728 |
| 3+ Earners | 326 (16.0%) | $71,081 |
| Total | 2,035 (100.0%) | $55,406 |
Household Income in Irondale
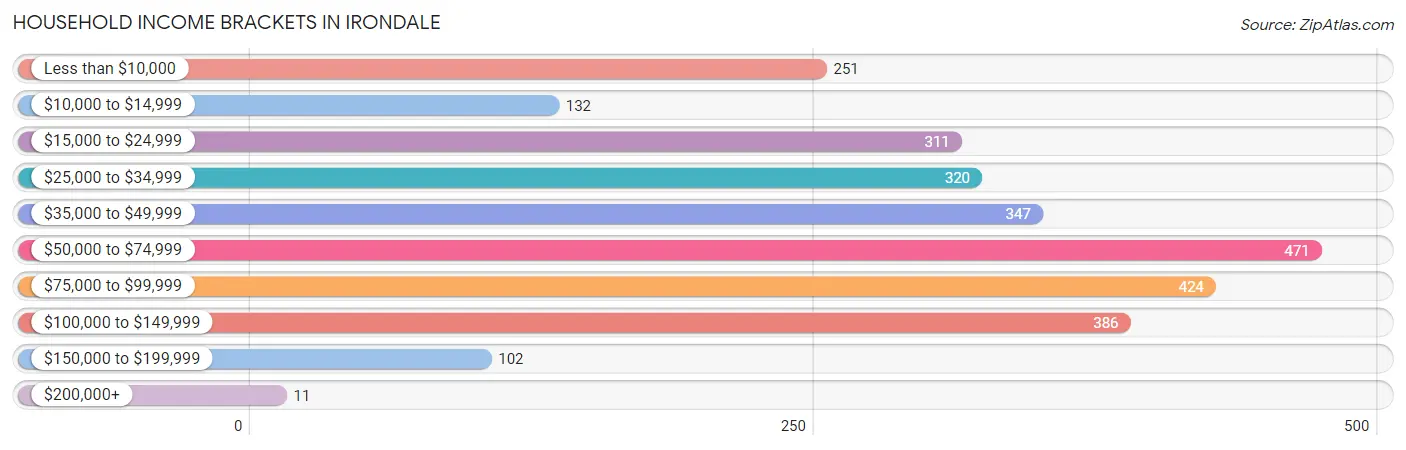
Household Income Brackets in Irondale
With 471 households falling in the category, the $50,000 to $74,999 income range is the most frequent in Irondale, accounting for 17.1% of all households. In contrast, only 11 households (0.4%) fall into the $200,000+ income bracket, making it the least populous group.
| Income Bracket | # Households | % Households |
| Less than $10,000 | 251 | 9.1% |
| $10,000 to $14,999 | 132 | 4.8% |
| $15,000 to $24,999 | 311 | 11.3% |
| $25,000 to $34,999 | 320 | 11.6% |
| $35,000 to $49,999 | 347 | 12.6% |
| $50,000 to $74,999 | 471 | 17.1% |
| $75,000 to $99,999 | 424 | 15.4% |
| $100,000 to $149,999 | 386 | 14.0% |
| $150,000 to $199,999 | 102 | 3.7% |
| $200,000+ | 11 | 0.4% |
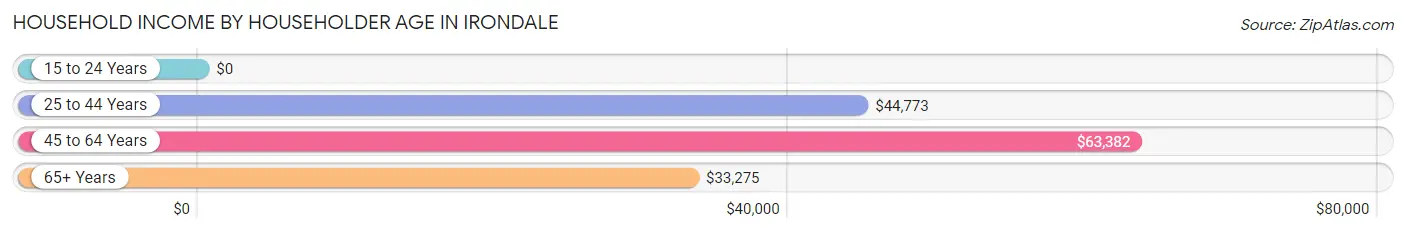
Household Income by Householder Age in Irondale
The median household income in Irondale is $53,598, with the highest median household income of $63,382 found in the 45 to 64 years age bracket for the primary householder. A total of 1,336 households (48.5%) fall into this category. Meanwhile, the 15 to 24 years age bracket for the primary householder has the lowest median household income of $0, with 78 households (2.8%) in this group.
| Income Bracket | # Households | Median Income |
| 15 to 24 Years | 78 (2.8%) | $0 |
| 25 to 44 Years | 952 (34.6%) | $44,773 |
| 45 to 64 Years | 1,336 (48.5%) | $63,382 |
| 65+ Years | 389 (14.1%) | $33,275 |
| Total | 2,755 (100.0%) | $53,598 |
Poverty in Irondale
Income Below Poverty by Sex and Age in Irondale
With 18.7% poverty level for males and 24.6% for females among the residents of Irondale, 6 to 11 year old males and 12 to 14 year old females are the most vulnerable to poverty, with 262 males (62.2%) and 212 females (85.5%) in their respective age groups living below the poverty level.
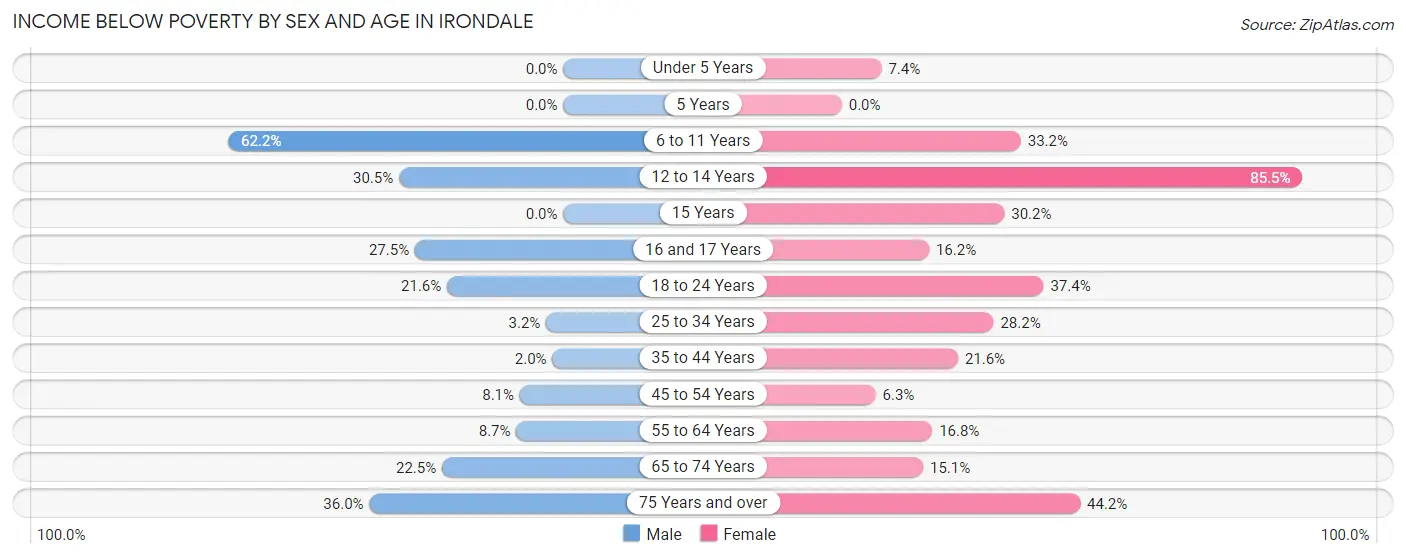
| Age Bracket | Male | Female |
| Under 5 Years | 0 (0.0%) | 25 (7.4%) |
| 5 Years | 0 (0.0%) | 0 (0.0%) |
| 6 to 11 Years | 262 (62.2%) | 106 (33.2%) |
| 12 to 14 Years | 111 (30.5%) | 212 (85.5%) |
| 15 Years | 0 (0.0%) | 38 (30.2%) |
| 16 and 17 Years | 57 (27.5%) | 50 (16.2%) |
| 18 to 24 Years | 71 (21.6%) | 161 (37.4%) |
| 25 to 34 Years | 11 (3.2%) | 187 (28.2%) |
| 35 to 44 Years | 8 (2.0%) | 133 (21.6%) |
| 45 to 54 Years | 46 (8.1%) | 34 (6.3%) |
| 55 to 64 Years | 38 (8.7%) | 103 (16.8%) |
| 65 to 74 Years | 84 (22.5%) | 27 (15.1%) |
| 75 Years and over | 9 (36.0%) | 46 (44.2%) |
| Total | 697 (18.7%) | 1,122 (24.6%) |
Income Above Poverty by Sex and Age in Irondale
According to the poverty statistics in Irondale, males aged under 5 years and females aged 5 years are the age groups that are most secure financially, with 100.0% of males and 100.0% of females in these age groups living above the poverty line.
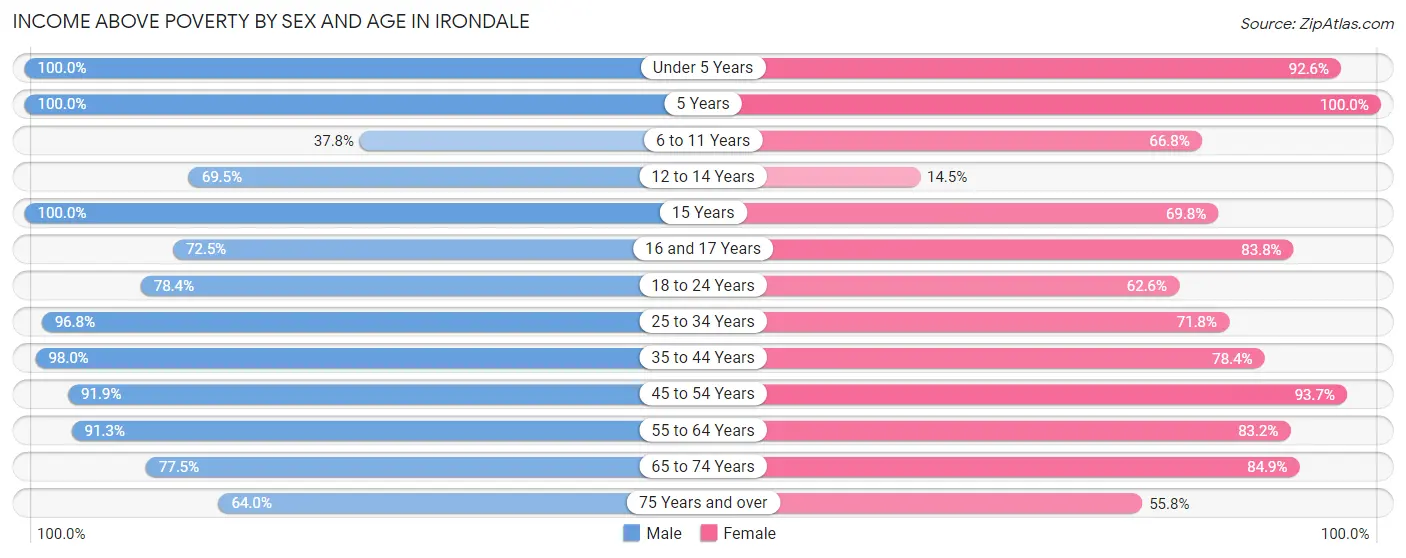
| Age Bracket | Male | Female |
| Under 5 Years | 198 (100.0%) | 314 (92.6%) |
| 5 Years | 39 (100.0%) | 79 (100.0%) |
| 6 to 11 Years | 159 (37.8%) | 213 (66.8%) |
| 12 to 14 Years | 253 (69.5%) | 36 (14.5%) |
| 15 Years | 32 (100.0%) | 88 (69.8%) |
| 16 and 17 Years | 150 (72.5%) | 259 (83.8%) |
| 18 to 24 Years | 258 (78.4%) | 269 (62.6%) |
| 25 to 34 Years | 334 (96.8%) | 477 (71.8%) |
| 35 to 44 Years | 389 (98.0%) | 484 (78.4%) |
| 45 to 54 Years | 524 (91.9%) | 507 (93.7%) |
| 55 to 64 Years | 398 (91.3%) | 511 (83.2%) |
| 65 to 74 Years | 289 (77.5%) | 152 (84.9%) |
| 75 Years and over | 16 (64.0%) | 58 (55.8%) |
| Total | 3,039 (81.3%) | 3,447 (75.4%) |
Income Below Poverty Among Married-Couple Families in Irondale
The poverty statistics for married-couple families in Irondale show that 4.6% or 52 of the total 1,122 families live below the poverty line. Families with 3 or 4 children have the highest poverty rate of 12.0%, comprising of 17 families. On the other hand, families with no children have the lowest poverty rate of 0.0%, which includes 0 families.
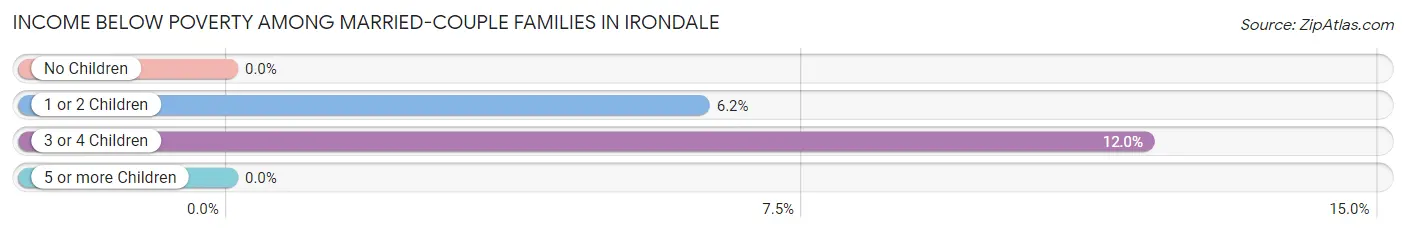
| Children | Above Poverty | Below Poverty |
| No Children | 412 (100.0%) | 0 (0.0%) |
| 1 or 2 Children | 533 (93.8%) | 35 (6.2%) |
| 3 or 4 Children | 125 (88.0%) | 17 (12.0%) |
| 5 or more Children | 0 (0.0%) | 0 (0.0%) |
| Total | 1,070 (95.4%) | 52 (4.6%) |
Income Below Poverty Among Single-Parent Households in Irondale
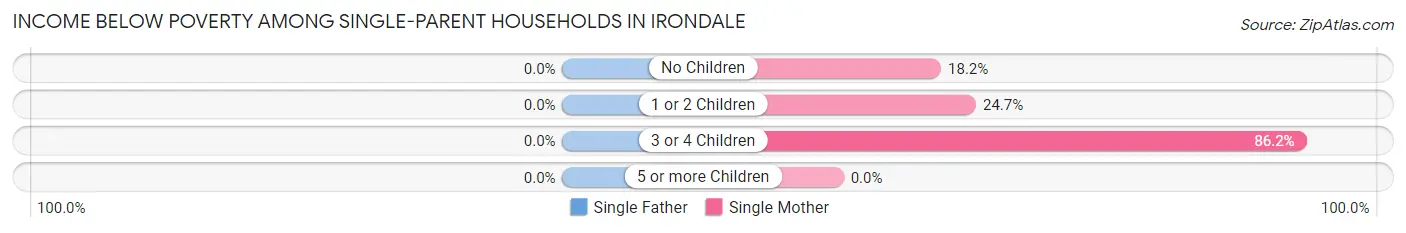
| Children | Single Father | Single Mother |
| No Children | 0 (0.0%) | 57 (18.1%) |
| 1 or 2 Children | 0 (0.0%) | 55 (24.7%) |
| 3 or 4 Children | 0 (0.0%) | 156 (86.2%) |
| 5 or more Children | 0 (0.0%) | 0 (0.0%) |
| Total | 0 (0.0%) | 268 (37.3%) |
Income Below Poverty Among Married-Couple vs Single-Parent Households in Irondale
The poverty data for Irondale shows that 52 of the married-couple family households (4.6%) and 268 of the single-parent households (29.3%) are living below the poverty level. Within the married-couple family households, those with 3 or 4 children have the highest poverty rate, with 17 households (12.0%) falling below the poverty line. Among the single-parent households, those with 3 or 4 children have the highest poverty rate, with 156 household (86.2%) living below poverty.
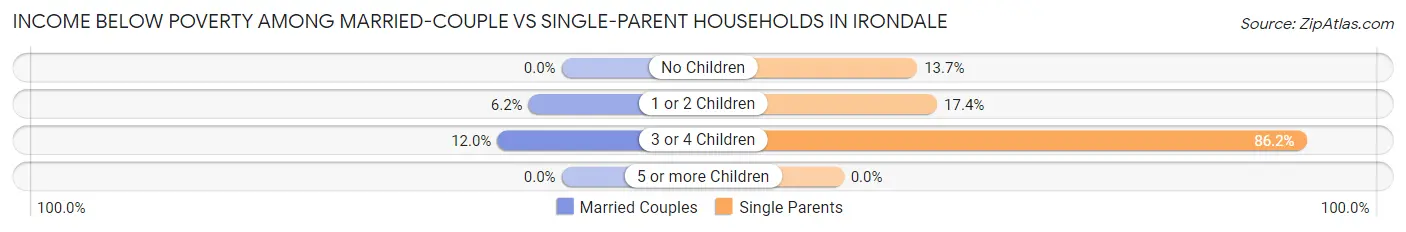
| Children | Married-Couple Families | Single-Parent Households |
| No Children | 0 (0.0%) | 57 (13.7%) |
| 1 or 2 Children | 35 (6.2%) | 55 (17.4%) |
| 3 or 4 Children | 17 (12.0%) | 156 (86.2%) |
| 5 or more Children | 0 (0.0%) | 0 (0.0%) |
| Total | 52 (4.6%) | 268 (29.3%) |
Race in Irondale
The most populous races in Irondale are Black / African American (5,401 | 65.0%), Hispanic or Latino (1,565 | 18.8%), and White / Caucasian (1,259 | 15.2%).
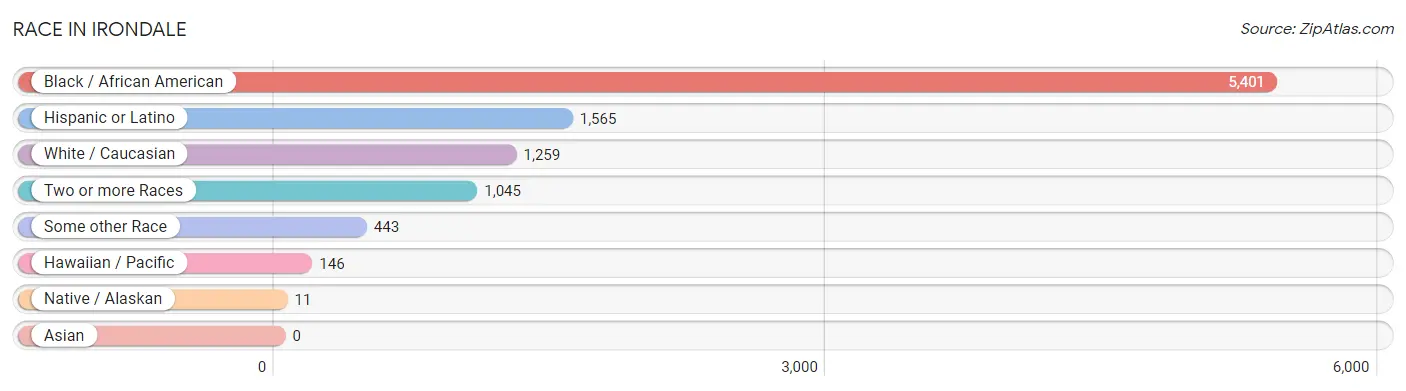
| Race | # Population | % Population |
| Asian | 0 | 0.0% |
| Black / African American | 5,401 | 65.0% |
| Hawaiian / Pacific | 146 | 1.8% |
| Hispanic or Latino | 1,565 | 18.8% |
| Native / Alaskan | 11 | 0.1% |
| White / Caucasian | 1,259 | 15.2% |
| Two or more Races | 1,045 | 12.6% |
| Some other Race | 443 | 5.3% |
| Total | 8,305 | 100.0% |
Ancestry in Irondale
The most populous ancestries reported in Irondale are Mexican (967 | 11.6%), American (597 | 7.2%), Irish (326 | 3.9%), Puerto Rican (300 | 3.6%), and German (147 | 1.8%), together accounting for 28.1% of all Irondale residents.
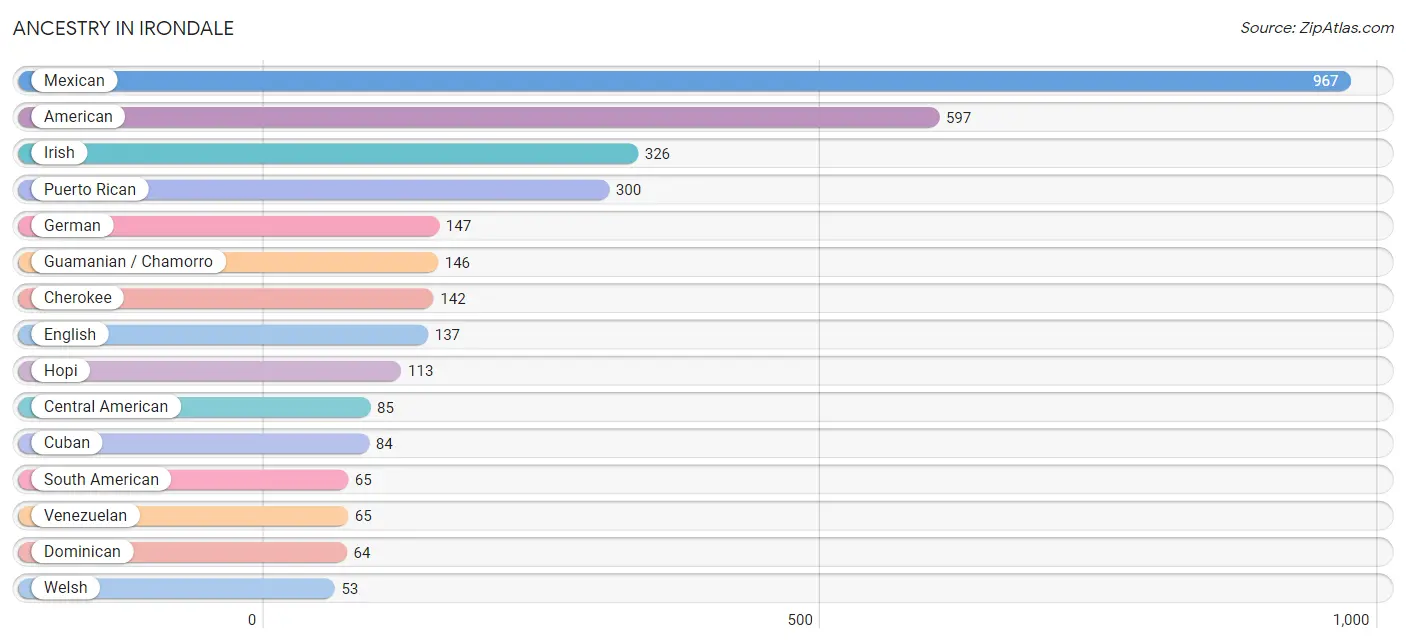
| Ancestry | # Population | % Population |
| American | 597 | 7.2% |
| Central American | 85 | 1.0% |
| Cherokee | 142 | 1.7% |
| Cuban | 84 | 1.0% |
| Dominican | 64 | 0.8% |
| English | 137 | 1.7% |
| French | 28 | 0.3% |
| German | 147 | 1.8% |
| Guamanian / Chamorro | 146 | 1.8% |
| Hopi | 113 | 1.4% |
| Irish | 326 | 3.9% |
| Italian | 20 | 0.2% |
| Jamaican | 52 | 0.6% |
| Mexican | 967 | 11.6% |
| Mexican American Indian | 22 | 0.3% |
| Panamanian | 35 | 0.4% |
| Polish | 3 | 0.0% |
| Puerto Rican | 300 | 3.6% |
| Salvadoran | 50 | 0.6% |
| Scotch-Irish | 25 | 0.3% |
| Scottish | 7 | 0.1% |
| South American | 65 | 0.8% |
| Trinidadian and Tobagonian | 10 | 0.1% |
| Venezuelan | 65 | 0.8% |
| Welsh | 53 | 0.6% | View All 25 Rows |
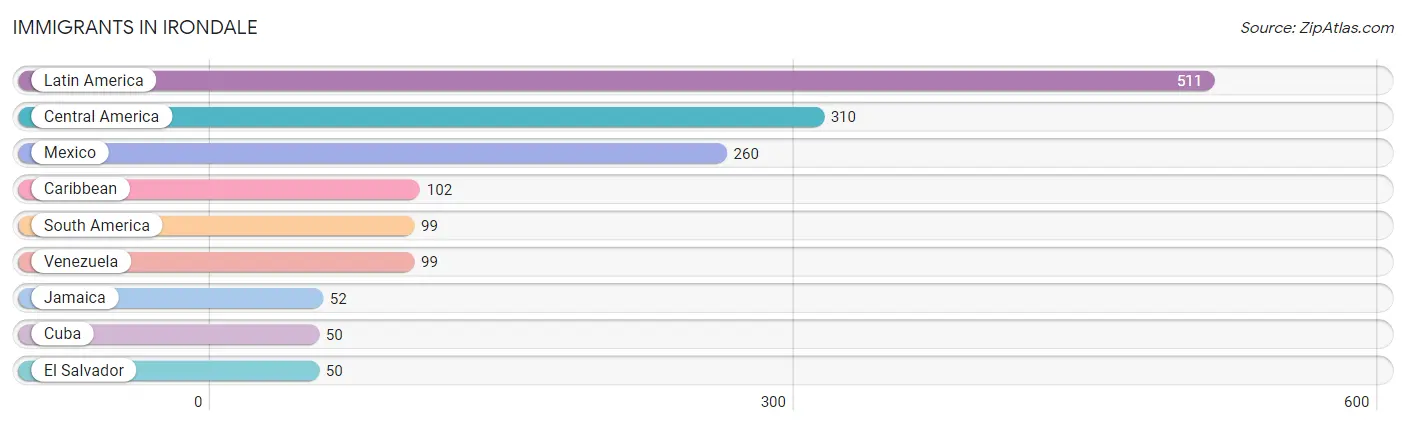
Immigrants in Irondale
The most numerous immigrant groups reported in Irondale came from Latin America (511 | 6.1%), Central America (310 | 3.7%), Mexico (260 | 3.1%), Caribbean (102 | 1.2%), and South America (99 | 1.2%), together accounting for 15.4% of all Irondale residents.
| Immigration Origin | # Population | % Population |
| Caribbean | 102 | 1.2% |
| Central America | 310 | 3.7% |
| Cuba | 50 | 0.6% |
| El Salvador | 50 | 0.6% |
| Jamaica | 52 | 0.6% |
| Latin America | 511 | 6.1% |
| Mexico | 260 | 3.1% |
| South America | 99 | 1.2% |
| Venezuela | 99 | 1.2% | View All 9 Rows |
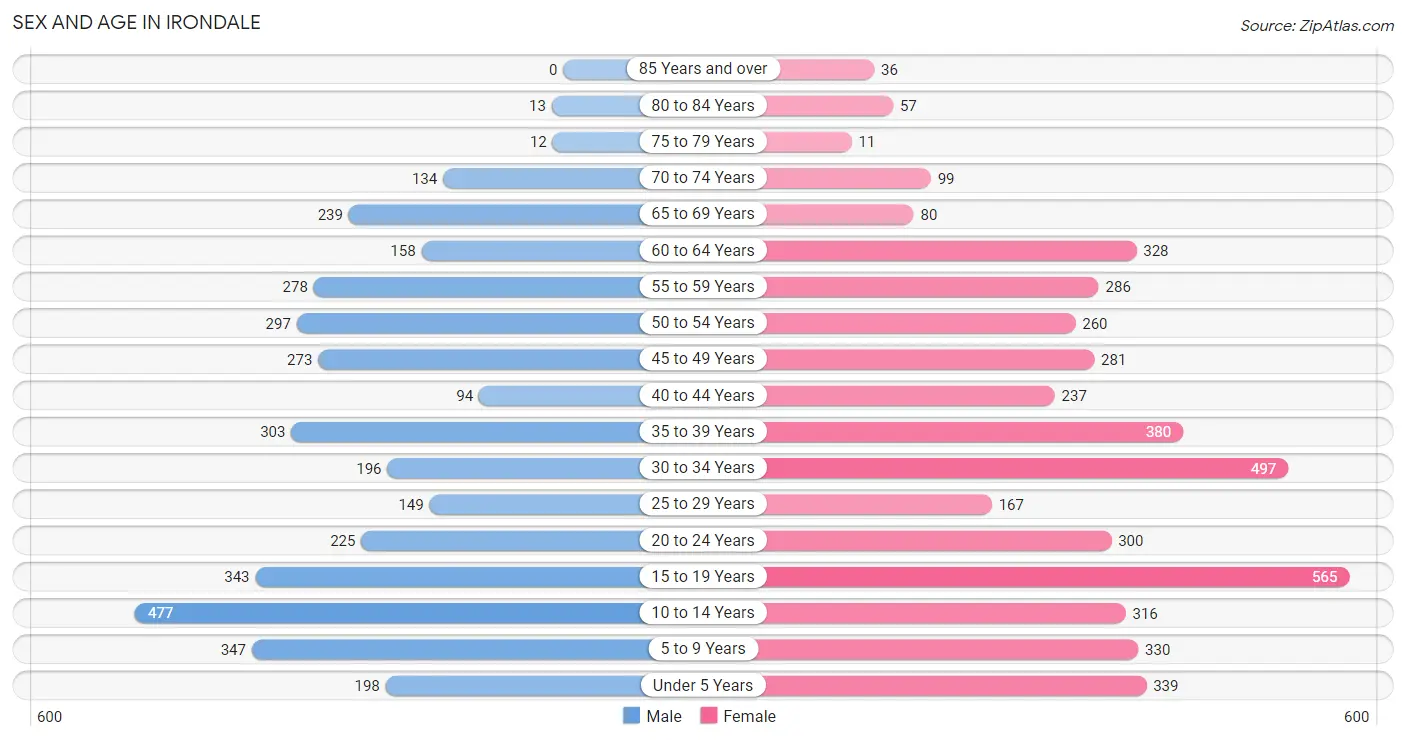
Sex and Age in Irondale
Sex and Age in Irondale
The most populous age groups in Irondale are 10 to 14 Years (477 | 12.8%) for men and 15 to 19 Years (565 | 12.4%) for women.
| Age Bracket | Male | Female |
| Under 5 Years | 198 (5.3%) | 339 (7.4%) |
| 5 to 9 Years | 347 (9.3%) | 330 (7.2%) |
| 10 to 14 Years | 477 (12.8%) | 316 (6.9%) |
| 15 to 19 Years | 343 (9.2%) | 565 (12.4%) |
| 20 to 24 Years | 225 (6.0%) | 300 (6.6%) |
| 25 to 29 Years | 149 (4.0%) | 167 (3.7%) |
| 30 to 34 Years | 196 (5.2%) | 497 (10.9%) |
| 35 to 39 Years | 303 (8.1%) | 380 (8.3%) |
| 40 to 44 Years | 94 (2.5%) | 237 (5.2%) |
| 45 to 49 Years | 273 (7.3%) | 281 (6.1%) |
| 50 to 54 Years | 297 (8.0%) | 260 (5.7%) |
| 55 to 59 Years | 278 (7.4%) | 286 (6.3%) |
| 60 to 64 Years | 158 (4.2%) | 328 (7.2%) |
| 65 to 69 Years | 239 (6.4%) | 80 (1.8%) |
| 70 to 74 Years | 134 (3.6%) | 99 (2.2%) |
| 75 to 79 Years | 12 (0.3%) | 11 (0.2%) |
| 80 to 84 Years | 13 (0.4%) | 57 (1.3%) |
| 85 Years and over | 0 (0.0%) | 36 (0.8%) |
| Total | 3,736 (100.0%) | 4,569 (100.0%) |
Families and Households in Irondale
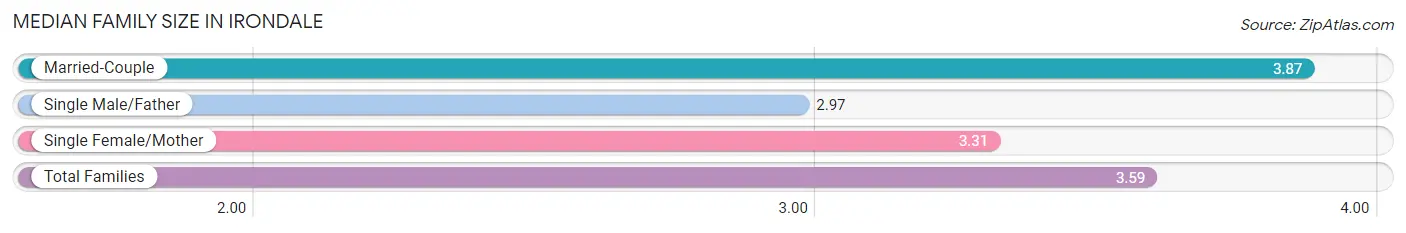
Median Family Size in Irondale
The median family size in Irondale is 3.59 persons per family, with married-couple families (1,122 | 55.1%) accounting for the largest median family size of 3.87 persons per family. On the other hand, single male/father families (195 | 9.6%) represent the smallest median family size with 2.97 persons per family.
| Family Type | # Families | Family Size |
| Married-Couple | 1,122 (55.1%) | 3.87 |
| Single Male/Father | 195 (9.6%) | 2.97 |
| Single Female/Mother | 718 (35.3%) | 3.31 |
| Total Families | 2,035 (100.0%) | 3.59 |
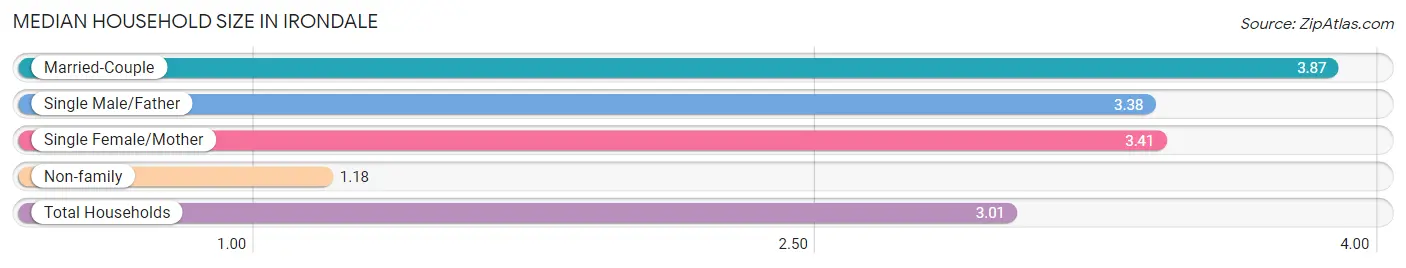
Median Household Size in Irondale
The median household size in Irondale is 3.01 persons per household, with married-couple households (1,122 | 40.7%) accounting for the largest median household size of 3.87 persons per household. non-family households (720 | 26.1%) represent the smallest median household size with 1.18 persons per household.
| Household Type | # Households | Household Size |
| Married-Couple | 1,122 (40.7%) | 3.87 |
| Single Male/Father | 195 (7.1%) | 3.38 |
| Single Female/Mother | 718 (26.1%) | 3.41 |
| Non-family | 720 (26.1%) | 1.18 |
| Total Households | 2,755 (100.0%) | 3.01 |
Household Size by Marriage Status in Irondale
Out of a total of 2,755 households in Irondale, 2,035 (73.9%) are family households, while 720 (26.1%) are nonfamily households. The most numerous type of family households are 2-person households, comprising 676, and the most common type of nonfamily households are 1-person households, comprising 657.
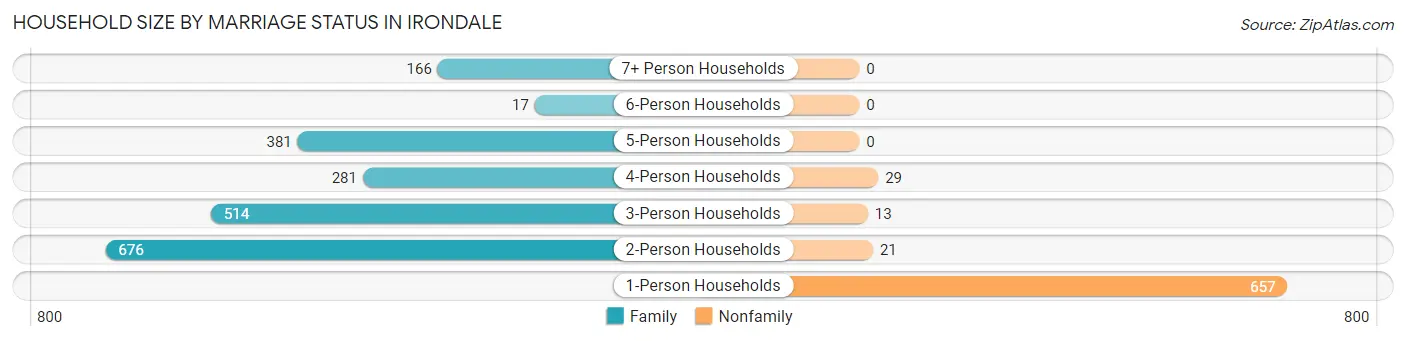
| Household Size | Family Households | Nonfamily Households |
| 1-Person Households | - | 657 (23.8%) |
| 2-Person Households | 676 (24.5%) | 21 (0.8%) |
| 3-Person Households | 514 (18.7%) | 13 (0.5%) |
| 4-Person Households | 281 (10.2%) | 29 (1.1%) |
| 5-Person Households | 381 (13.8%) | 0 (0.0%) |
| 6-Person Households | 17 (0.6%) | 0 (0.0%) |
| 7+ Person Households | 166 (6.0%) | 0 (0.0%) |
| Total | 2,035 (73.9%) | 720 (26.1%) |
Female Fertility in Irondale
Fertility by Age in Irondale
Average fertility rate in Irondale is 89.0 births per 1,000 women. Women in the age bracket of 20 to 34 years have the highest fertility rate with 171.0 births per 1,000 women. Women in the age bracket of 20 to 34 years acount for 75.0% of all women with births.
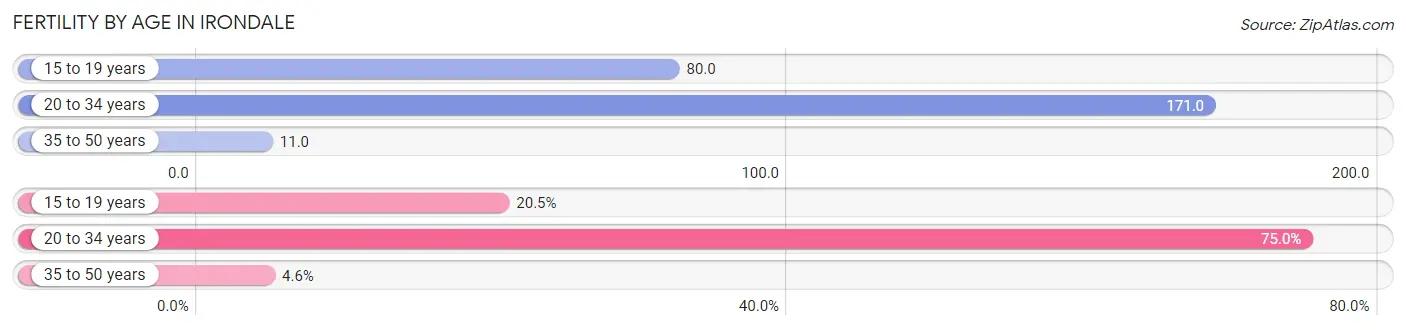
| Age Bracket | Women with Births | Births / 1,000 Women |
| 15 to 19 years | 45 (20.4%) | 80.0 |
| 20 to 34 years | 165 (75.0%) | 171.0 |
| 35 to 50 years | 10 (4.5%) | 11.0 |
| Total | 220 (100.0%) | 89.0 |
Fertility by Age by Marriage Status in Irondale
58.2% of women with births (220) in Irondale are married. The highest percentage of unmarried women with births falls into 15 to 19 years age bracket with 100.0% of them unmarried at the time of birth, while the lowest percentage of unmarried women with births belong to 20 to 34 years age bracket with 22.4% of them unmarried.
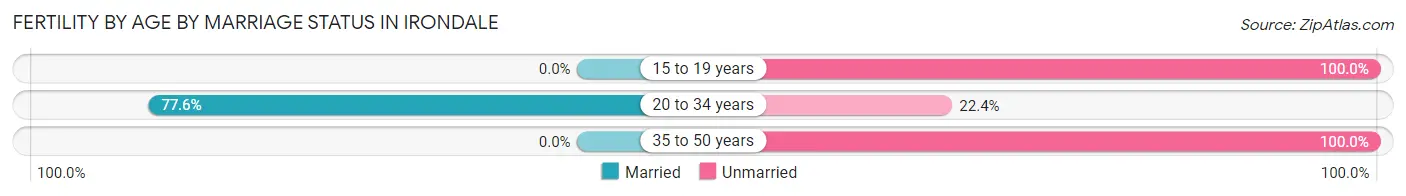
| Age Bracket | Married | Unmarried |
| 15 to 19 years | 0 (0.0%) | 45 (100.0%) |
| 20 to 34 years | 128 (77.6%) | 37 (22.4%) |
| 35 to 50 years | 0 (0.0%) | 10 (100.0%) |
| Total | 128 (58.2%) | 92 (41.8%) |
Fertility by Education in Irondale
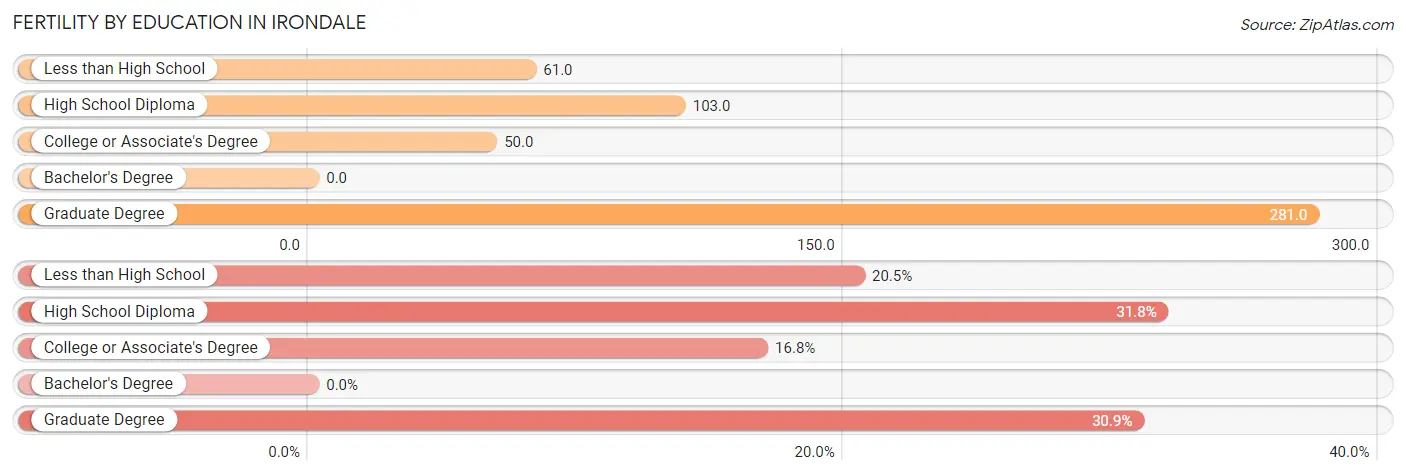
| Educational Attainment | Women with Births | Births / 1,000 Women |
| Less than High School | 45 (20.4%) | 61.0 |
| High School Diploma | 70 (31.8%) | 103.0 |
| College or Associate's Degree | 37 (16.8%) | 50.0 |
| Bachelor's Degree | 0 (0.0%) | 0.0 |
| Graduate Degree | 68 (30.9%) | 281.0 |
| Total | 220 (100.0%) | 89.0 |
Fertility by Education by Marriage Status in Irondale
41.8% of women with births in Irondale are unmarried. Women with the educational attainment of graduate degree are most likely to be married with 100.0% of them married at childbirth, while women with the educational attainment of less than high school are least likely to be married with 100.0% of them unmarried at childbirth.
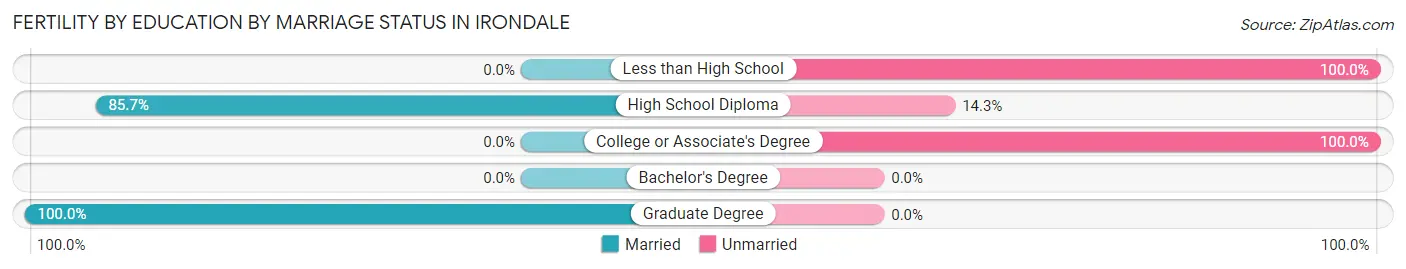
| Educational Attainment | Married | Unmarried |
| Less than High School | 0 (0.0%) | 45 (100.0%) |
| High School Diploma | 60 (85.7%) | 10 (14.3%) |
| College or Associate's Degree | 0 (0.0%) | 37 (100.0%) |
| Bachelor's Degree | 0 (0.0%) | 0 (0.0%) |
| Graduate Degree | 68 (100.0%) | 0 (0.0%) |
| Total | 128 (58.2%) | 92 (41.8%) |
Employment Characteristics in Irondale
Employment by Class of Employer in Irondale
Among the 3,201 employed individuals in Irondale, private company employees (1,952 | 61.0%), not-for-profit organizations (316 | 9.9%), and local government employees (251 | 7.8%) make up the most common classes of employment.
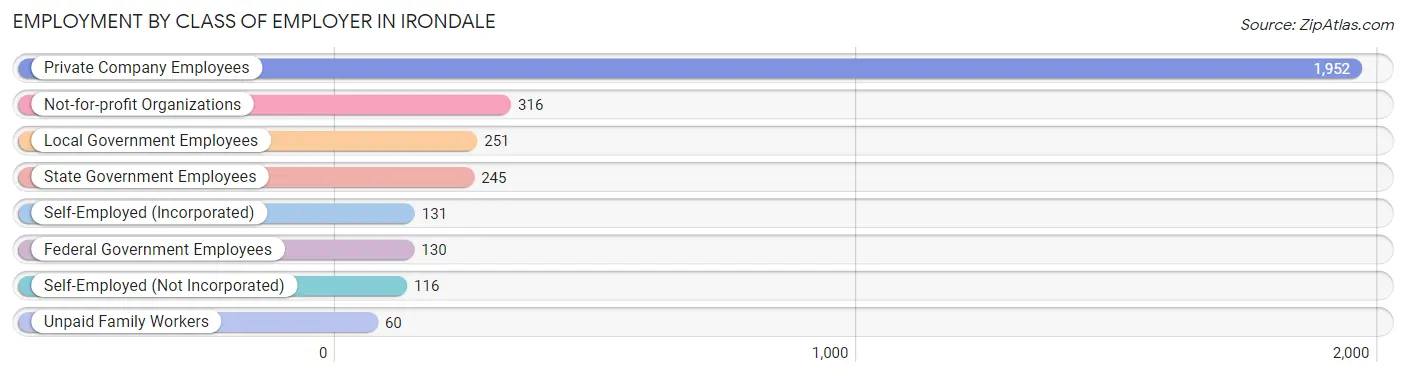
| Employer Class | # Employees | % Employees |
| Private Company Employees | 1,952 | 61.0% |
| Self-Employed (Incorporated) | 131 | 4.1% |
| Self-Employed (Not Incorporated) | 116 | 3.6% |
| Not-for-profit Organizations | 316 | 9.9% |
| Local Government Employees | 251 | 7.8% |
| State Government Employees | 245 | 7.6% |
| Federal Government Employees | 130 | 4.1% |
| Unpaid Family Workers | 60 | 1.9% |
| Total | 3,201 | 100.0% |
Employment Status by Age in Irondale
According to the labor force statistics for Irondale, out of the total population over 16 years of age (6,140), 57.5% or 3,530 individuals are in the labor force, with 5.9% or 208 of them unemployed. The age group with the highest labor force participation rate is 35 to 44 years, with 83.6% or 848 individuals in the labor force. Within the labor force, the 65 to 74 years age range has the highest percentage of unemployed individuals, with 37.2% or 32 of them being unemployed.
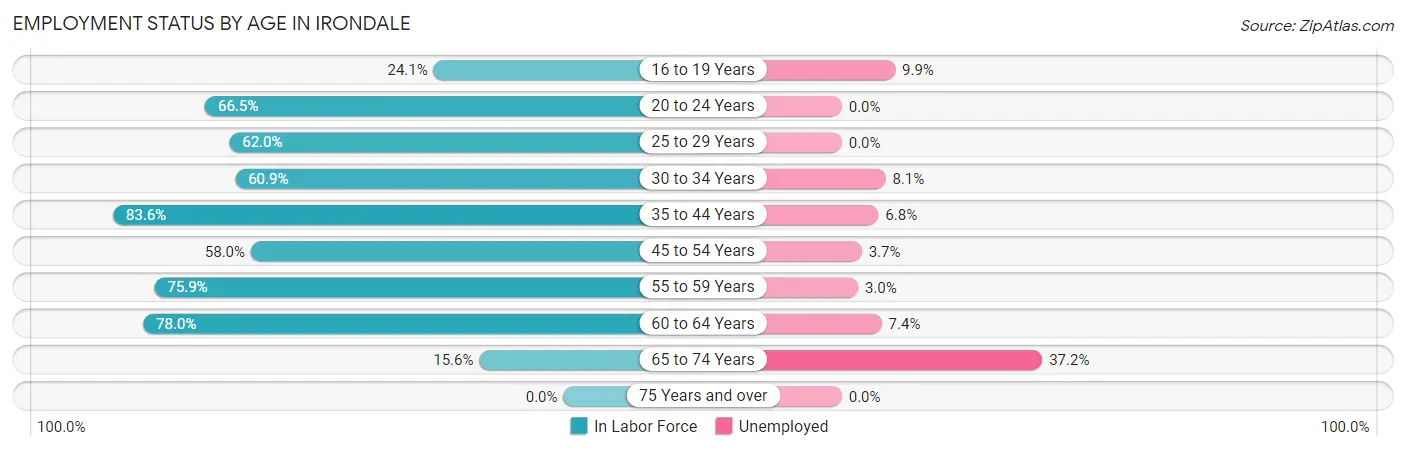
| Age Bracket | In Labor Force | Unemployed |
| 16 to 19 Years | 181 (24.1%) | 18 (9.9%) |
| 20 to 24 Years | 349 (66.5%) | 0 (0.0%) |
| 25 to 29 Years | 196 (62.0%) | 0 (0.0%) |
| 30 to 34 Years | 422 (60.9%) | 34 (8.1%) |
| 35 to 44 Years | 848 (83.6%) | 58 (6.8%) |
| 45 to 54 Years | 644 (58.0%) | 24 (3.7%) |
| 55 to 59 Years | 428 (75.9%) | 13 (3.0%) |
| 60 to 64 Years | 379 (78.0%) | 28 (7.4%) |
| 65 to 74 Years | 86 (15.6%) | 32 (37.2%) |
| 75 Years and over | 0 (0.0%) | 0 (0.0%) |
| Total | 3,530 (57.5%) | 208 (5.9%) |
Employment Status by Educational Attainment in Irondale
According to labor force statistics for Irondale, 69.7% of individuals (2,916) out of the total population between 25 and 64 years of age (4,184) are in the labor force, with 5.4% or 157 of them being unemployed. The group with the highest labor force participation rate are those with the educational attainment of less than high school, with 89.3% or 418 individuals in the labor force. Within the labor force, individuals with high school diploma education have the highest percentage of unemployment, with 11.9% or 88 of them being unemployed.
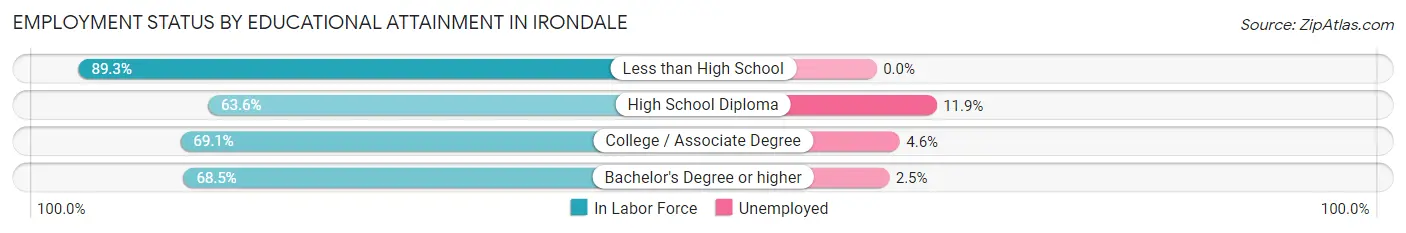
| Educational Attainment | In Labor Force | Unemployed |
| Less than High School | 418 (89.3%) | 0 (0.0%) |
| High School Diploma | 740 (63.6%) | 139 (11.9%) |
| College / Associate Degree | 1,191 (69.1%) | 79 (4.6%) |
| Bachelor's Degree or higher | 568 (68.5%) | 21 (2.5%) |
| Total | 2,916 (69.7%) | 226 (5.4%) |
Employment Occupations by Sex in Irondale
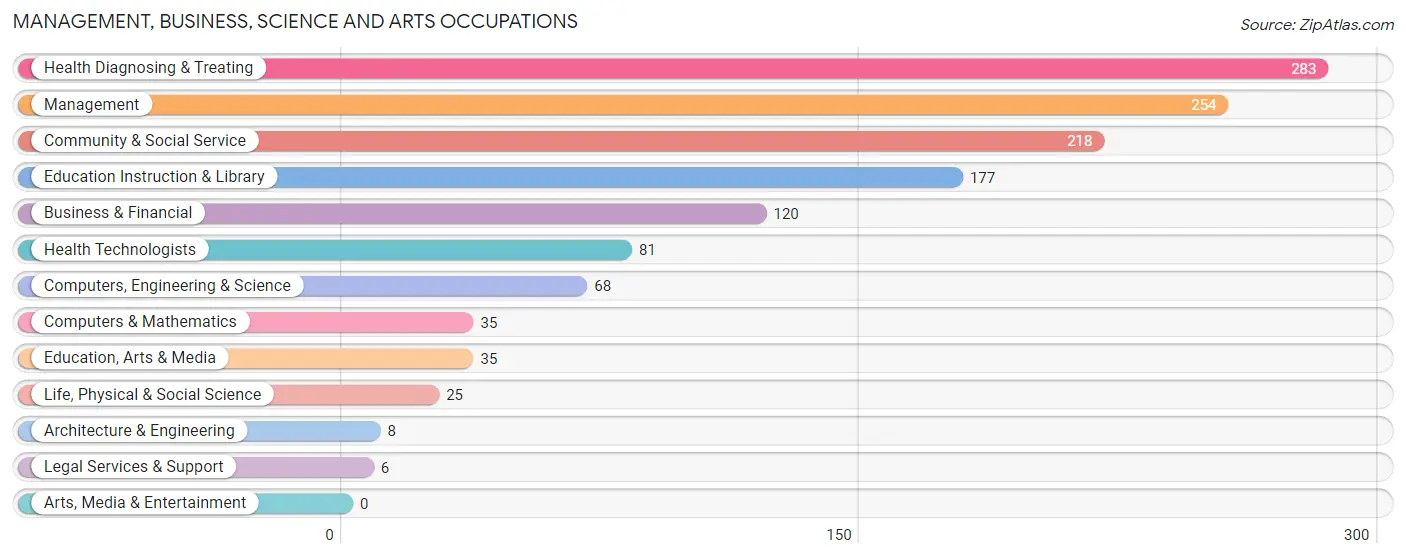
Management, Business, Science and Arts Occupations
The most common Management, Business, Science and Arts occupations in Irondale are Health Diagnosing & Treating (283 | 8.5%), Management (254 | 7.6%), Community & Social Service (218 | 6.6%), Education Instruction & Library (177 | 5.3%), and Business & Financial (120 | 3.6%).
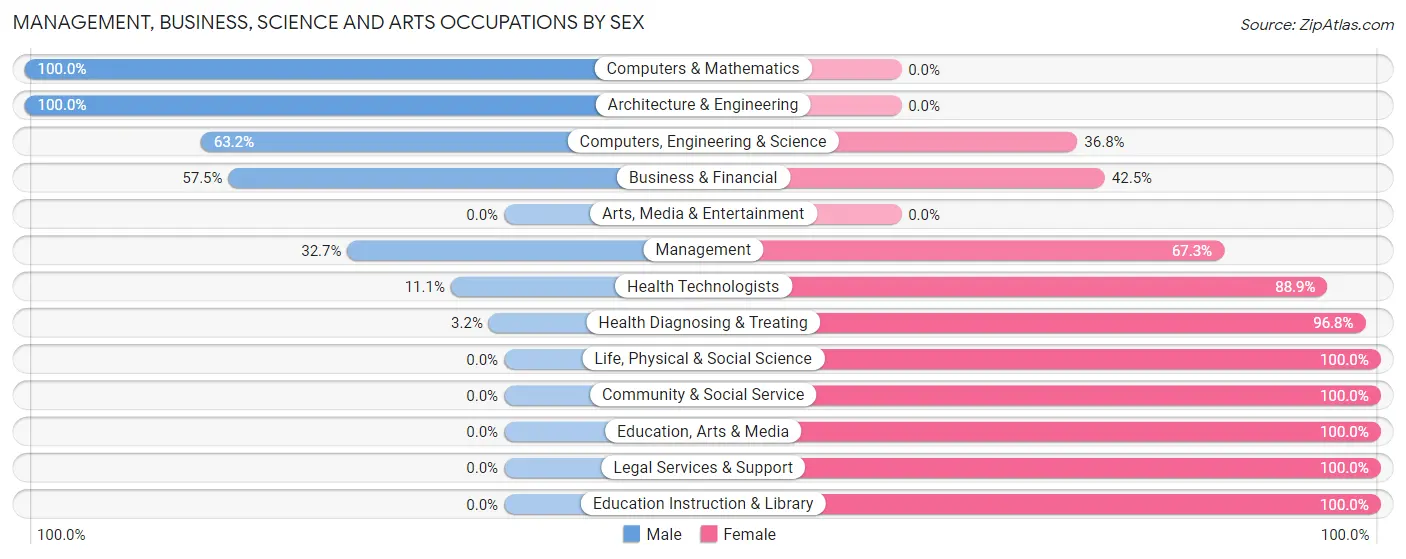
Management, Business, Science and Arts Occupations by Sex
Within the Management, Business, Science and Arts occupations in Irondale, the most male-oriented occupations are Computers & Mathematics (100.0%), Architecture & Engineering (100.0%), and Computers, Engineering & Science (63.2%), while the most female-oriented occupations are Life, Physical & Social Science (100.0%), Community & Social Service (100.0%), and Education, Arts & Media (100.0%).
| Occupation | Male | Female |
| Management | 83 (32.7%) | 171 (67.3%) |
| Business & Financial | 69 (57.5%) | 51 (42.5%) |
| Computers, Engineering & Science | 43 (63.2%) | 25 (36.8%) |
| Computers & Mathematics | 35 (100.0%) | 0 (0.0%) |
| Architecture & Engineering | 8 (100.0%) | 0 (0.0%) |
| Life, Physical & Social Science | 0 (0.0%) | 25 (100.0%) |
| Community & Social Service | 0 (0.0%) | 218 (100.0%) |
| Education, Arts & Media | 0 (0.0%) | 35 (100.0%) |
| Legal Services & Support | 0 (0.0%) | 6 (100.0%) |
| Education Instruction & Library | 0 (0.0%) | 177 (100.0%) |
| Arts, Media & Entertainment | 0 (0.0%) | 0 (0.0%) |
| Health Diagnosing & Treating | 9 (3.2%) | 274 (96.8%) |
| Health Technologists | 9 (11.1%) | 72 (88.9%) |
| Total (Category) | 204 (21.6%) | 739 (78.4%) |
| Total (Overall) | 1,487 (44.7%) | 1,839 (55.3%) |
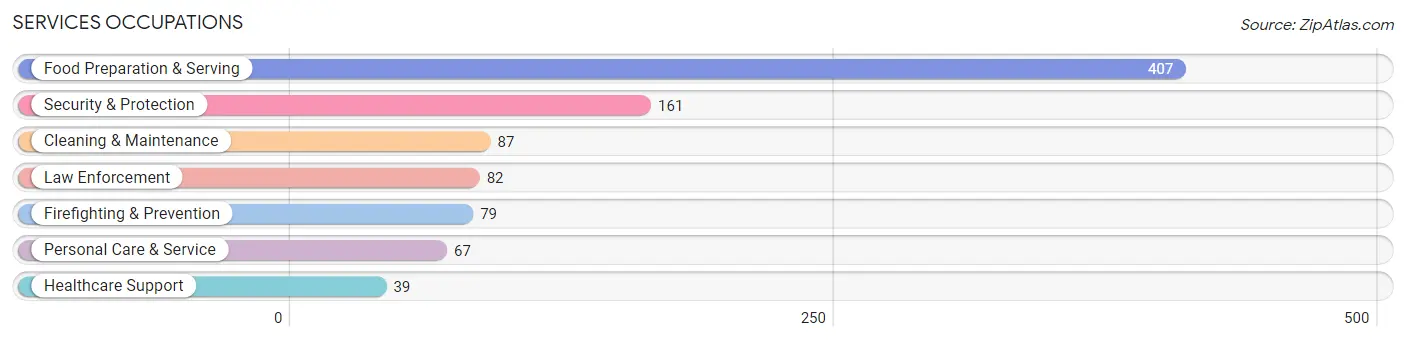
Services Occupations
The most common Services occupations in Irondale are Food Preparation & Serving (407 | 12.2%), Security & Protection (161 | 4.8%), Cleaning & Maintenance (87 | 2.6%), Law Enforcement (82 | 2.5%), and Firefighting & Prevention (79 | 2.4%).
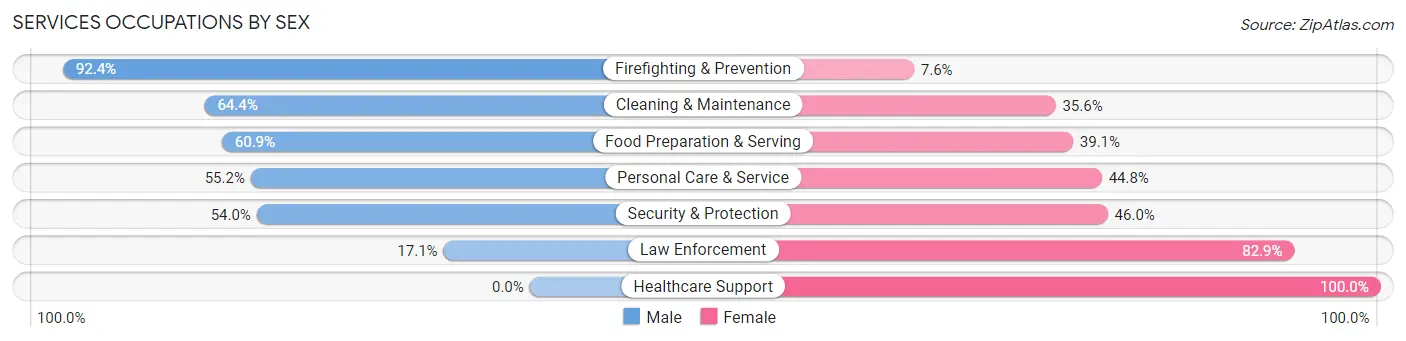
Services Occupations by Sex
Within the Services occupations in Irondale, the most male-oriented occupations are Firefighting & Prevention (92.4%), Cleaning & Maintenance (64.4%), and Food Preparation & Serving (60.9%), while the most female-oriented occupations are Healthcare Support (100.0%), Law Enforcement (82.9%), and Security & Protection (46.0%).
| Occupation | Male | Female |
| Healthcare Support | 0 (0.0%) | 39 (100.0%) |
| Security & Protection | 87 (54.0%) | 74 (46.0%) |
| Firefighting & Prevention | 73 (92.4%) | 6 (7.6%) |
| Law Enforcement | 14 (17.1%) | 68 (82.9%) |
| Food Preparation & Serving | 248 (60.9%) | 159 (39.1%) |
| Cleaning & Maintenance | 56 (64.4%) | 31 (35.6%) |
| Personal Care & Service | 37 (55.2%) | 30 (44.8%) |
| Total (Category) | 428 (56.2%) | 333 (43.8%) |
| Total (Overall) | 1,487 (44.7%) | 1,839 (55.3%) |
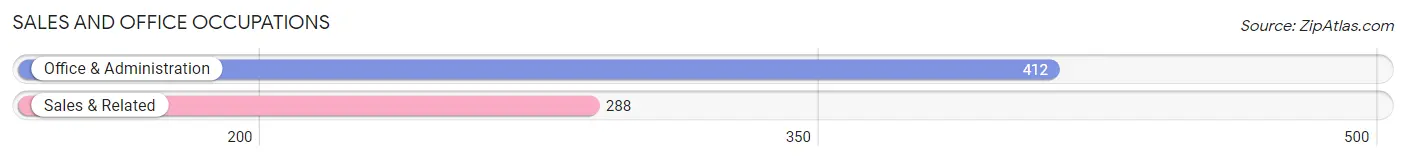
Sales and Office Occupations
The most common Sales and Office occupations in Irondale are Office & Administration (412 | 12.4%), and Sales & Related (288 | 8.7%).
Sales and Office Occupations by Sex
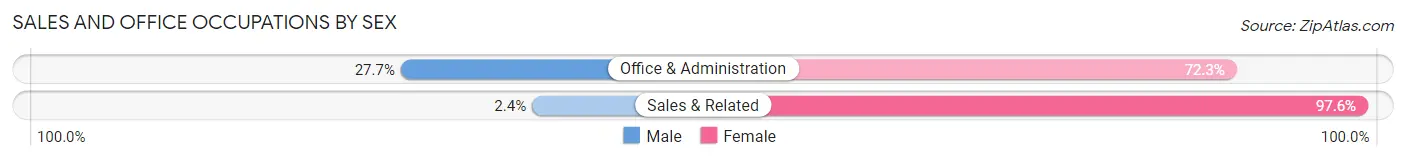
| Occupation | Male | Female |
| Sales & Related | 7 (2.4%) | 281 (97.6%) |
| Office & Administration | 114 (27.7%) | 298 (72.3%) |
| Total (Category) | 121 (17.3%) | 579 (82.7%) |
| Total (Overall) | 1,487 (44.7%) | 1,839 (55.3%) |
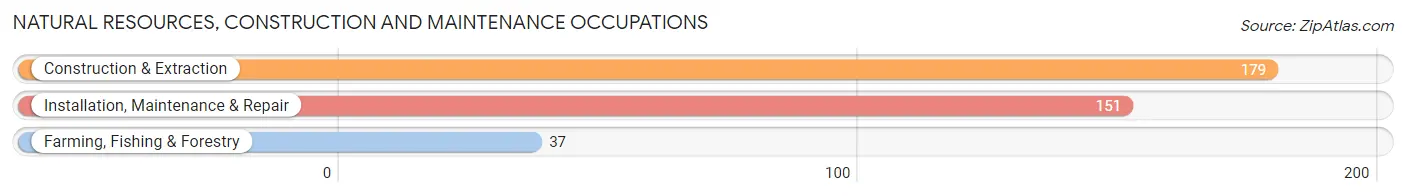
Natural Resources, Construction and Maintenance Occupations
The most common Natural Resources, Construction and Maintenance occupations in Irondale are Construction & Extraction (179 | 5.4%), Installation, Maintenance & Repair (151 | 4.5%), and Farming, Fishing & Forestry (37 | 1.1%).
Natural Resources, Construction and Maintenance Occupations by Sex
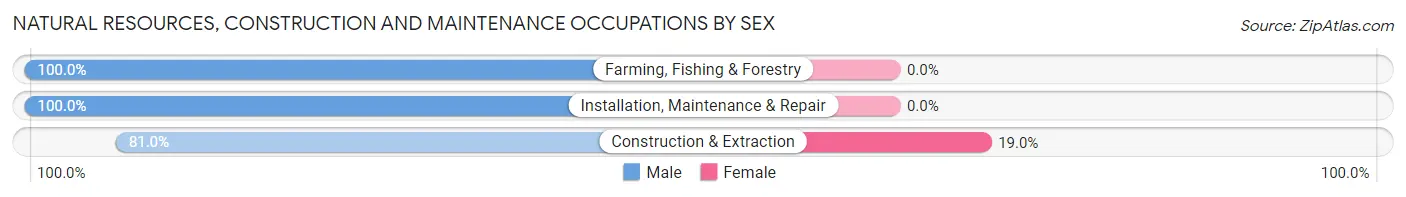
| Occupation | Male | Female |
| Farming, Fishing & Forestry | 37 (100.0%) | 0 (0.0%) |
| Construction & Extraction | 145 (81.0%) | 34 (19.0%) |
| Installation, Maintenance & Repair | 151 (100.0%) | 0 (0.0%) |
| Total (Category) | 333 (90.7%) | 34 (9.3%) |
| Total (Overall) | 1,487 (44.7%) | 1,839 (55.3%) |
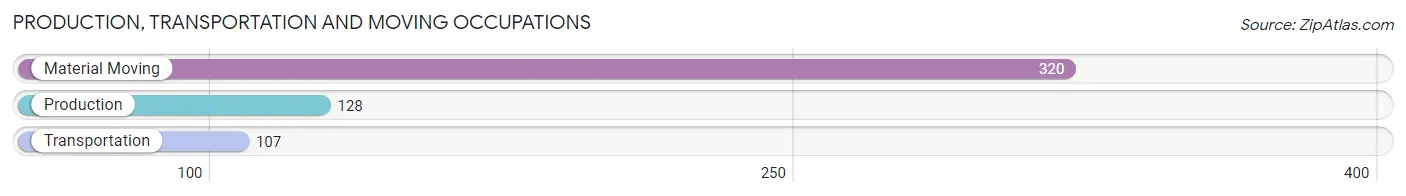
Production, Transportation and Moving Occupations
The most common Production, Transportation and Moving occupations in Irondale are Material Moving (320 | 9.6%), Production (128 | 3.8%), and Transportation (107 | 3.2%).
Production, Transportation and Moving Occupations by Sex
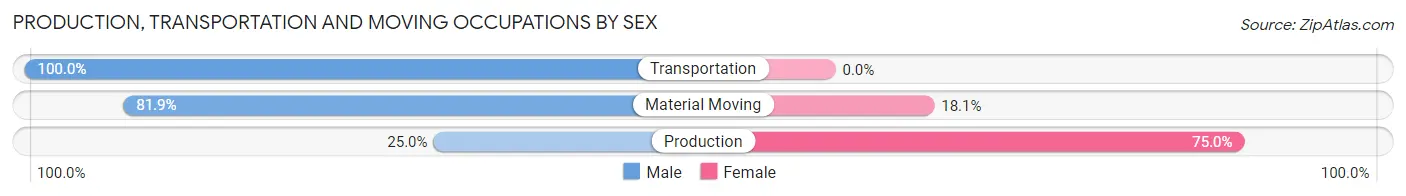
| Occupation | Male | Female |
| Production | 32 (25.0%) | 96 (75.0%) |
| Transportation | 107 (100.0%) | 0 (0.0%) |
| Material Moving | 262 (81.9%) | 58 (18.1%) |
| Total (Category) | 401 (72.3%) | 154 (27.8%) |
| Total (Overall) | 1,487 (44.7%) | 1,839 (55.3%) |
Employment Industries by Sex in Irondale
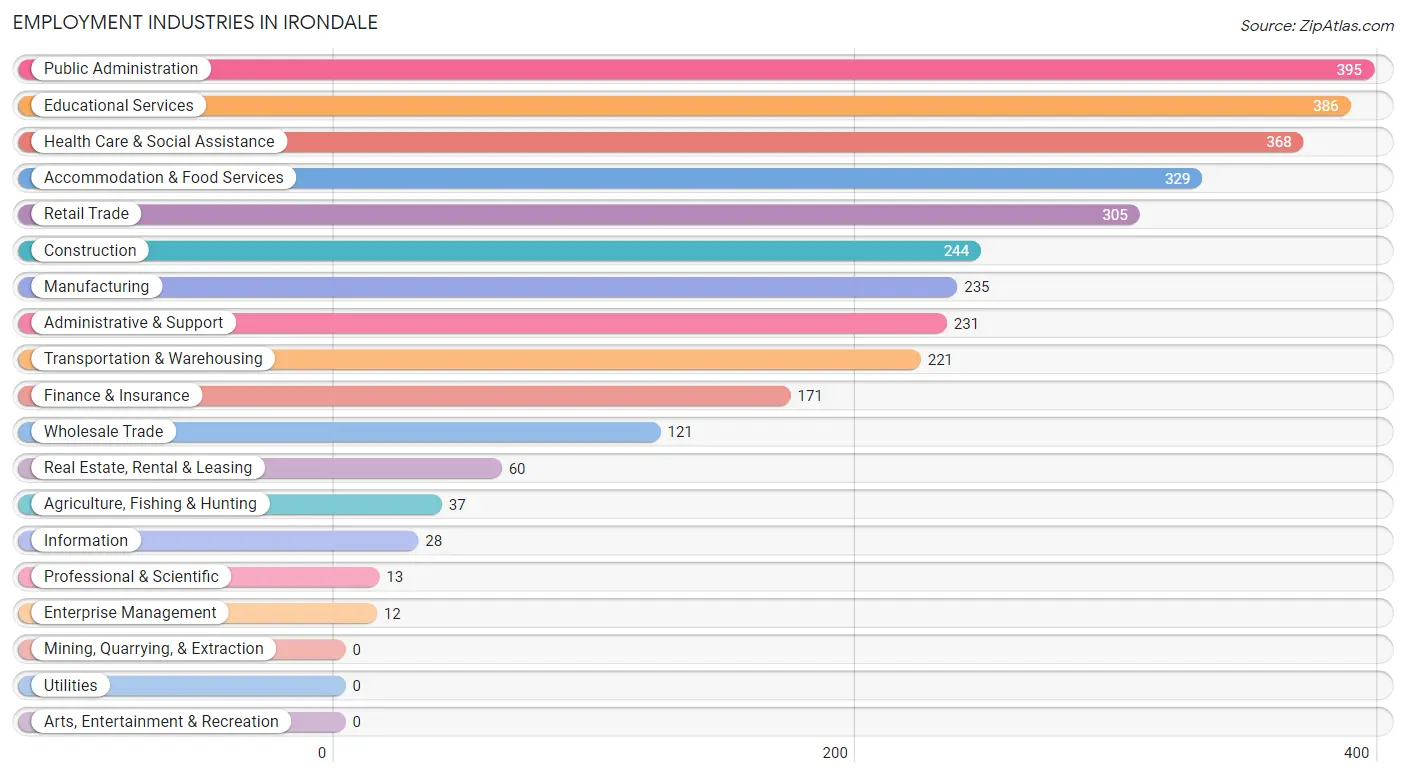
Employment Industries in Irondale
The major employment industries in Irondale include Public Administration (395 | 11.9%), Educational Services (386 | 11.6%), Health Care & Social Assistance (368 | 11.1%), Accommodation & Food Services (329 | 9.9%), and Retail Trade (305 | 9.2%).
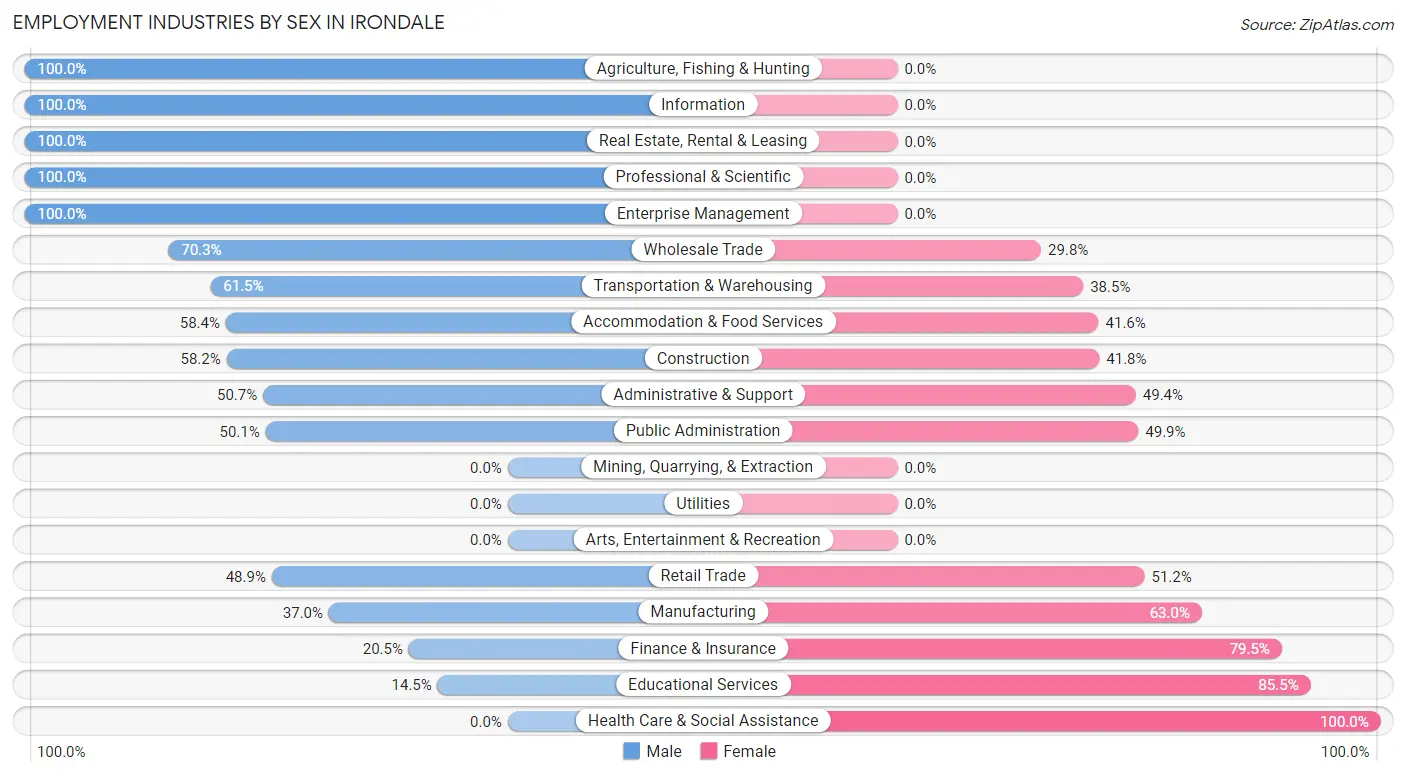
Employment Industries by Sex in Irondale
The Irondale industries that see more men than women are Agriculture, Fishing & Hunting (100.0%), Information (100.0%), and Real Estate, Rental & Leasing (100.0%), whereas the industries that tend to have a higher number of women are Health Care & Social Assistance (100.0%), Educational Services (85.5%), and Finance & Insurance (79.5%).
| Industry | Male | Female |
| Agriculture, Fishing & Hunting | 37 (100.0%) | 0 (0.0%) |
| Mining, Quarrying, & Extraction | 0 (0.0%) | 0 (0.0%) |
| Construction | 142 (58.2%) | 102 (41.8%) |
| Manufacturing | 87 (37.0%) | 148 (63.0%) |
| Wholesale Trade | 85 (70.3%) | 36 (29.7%) |
| Retail Trade | 149 (48.8%) | 156 (51.1%) |
| Transportation & Warehousing | 136 (61.5%) | 85 (38.5%) |
| Utilities | 0 (0.0%) | 0 (0.0%) |
| Information | 28 (100.0%) | 0 (0.0%) |
| Finance & Insurance | 35 (20.5%) | 136 (79.5%) |
| Real Estate, Rental & Leasing | 60 (100.0%) | 0 (0.0%) |
| Professional & Scientific | 13 (100.0%) | 0 (0.0%) |
| Enterprise Management | 12 (100.0%) | 0 (0.0%) |
| Administrative & Support | 117 (50.6%) | 114 (49.3%) |
| Educational Services | 56 (14.5%) | 330 (85.5%) |
| Health Care & Social Assistance | 0 (0.0%) | 368 (100.0%) |
| Arts, Entertainment & Recreation | 0 (0.0%) | 0 (0.0%) |
| Accommodation & Food Services | 192 (58.4%) | 137 (41.6%) |
| Public Administration | 198 (50.1%) | 197 (49.9%) |
| Total | 1,487 (44.7%) | 1,839 (55.3%) |
Education in Irondale
School Enrollment in Irondale
The most common levels of schooling among the 3,019 students in Irondale are high school (839 | 27.8%), middle school (703 | 23.3%), and college / undergraduate (504 | 16.7%).
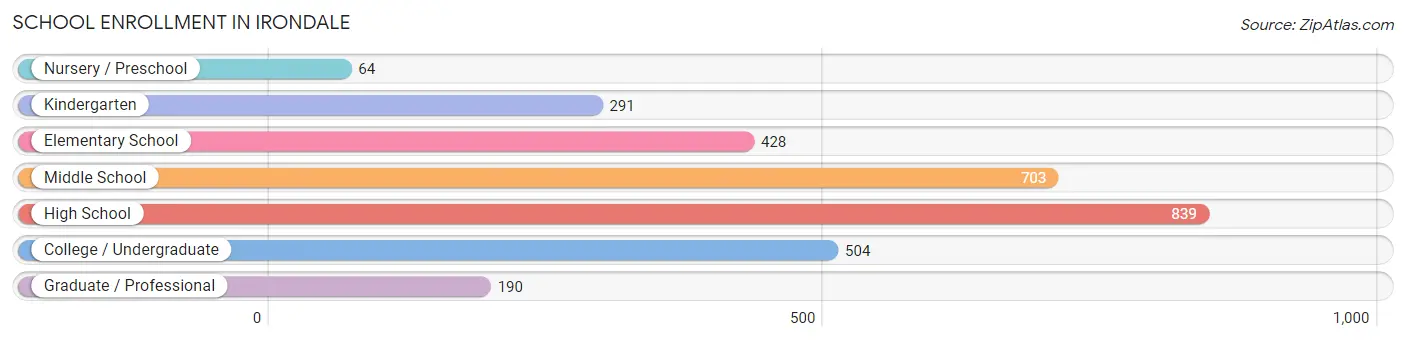
| School Level | # Students | % Students |
| Nursery / Preschool | 64 | 2.1% |
| Kindergarten | 291 | 9.6% |
| Elementary School | 428 | 14.2% |
| Middle School | 703 | 23.3% |
| High School | 839 | 27.8% |
| College / Undergraduate | 504 | 16.7% |
| Graduate / Professional | 190 | 6.3% |
| Total | 3,019 | 100.0% |
School Enrollment by Age by Funding Source in Irondale
Out of a total of 3,019 students who are enrolled in schools in Irondale, 320 (10.6%) attend a private institution, while the remaining 2,699 (89.4%) are enrolled in public schools. The age group of 25 to 34 year olds has the highest likelihood of being enrolled in private schools, with 211 (69.9% in the age bracket) enrolled. Conversely, the age group of 3 to 4 year olds has the lowest likelihood of being enrolled in a private school, with 64 (100.0% in the age bracket) attending a public institution.
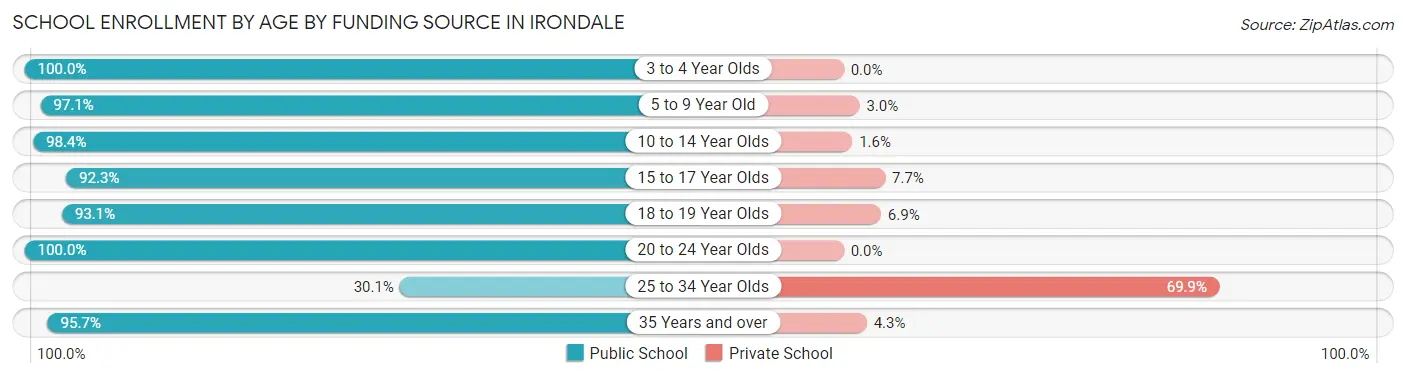
| Age Bracket | Public School | Private School |
| 3 to 4 Year Olds | 64 (100.0%) | 0 (0.0%) |
| 5 to 9 Year Old | 657 (97.1%) | 20 (2.9%) |
| 10 to 14 Year Olds | 745 (98.4%) | 12 (1.6%) |
| 15 to 17 Year Olds | 622 (92.3%) | 52 (7.7%) |
| 18 to 19 Year Olds | 201 (93.1%) | 15 (6.9%) |
| 20 to 24 Year Olds | 96 (100.0%) | 0 (0.0%) |
| 25 to 34 Year Olds | 91 (30.1%) | 211 (69.9%) |
| 35 Years and over | 223 (95.7%) | 10 (4.3%) |
| Total | 2,699 (89.4%) | 320 (10.6%) |
Educational Attainment by Field of Study in Irondale
Business (353 | 36.1%), education (104 | 10.6%), social sciences (101 | 10.3%), arts & humanities (97 | 9.9%), and science & technology (73 | 7.5%) are the most common fields of study among 977 individuals in Irondale who have obtained a bachelor's degree or higher.
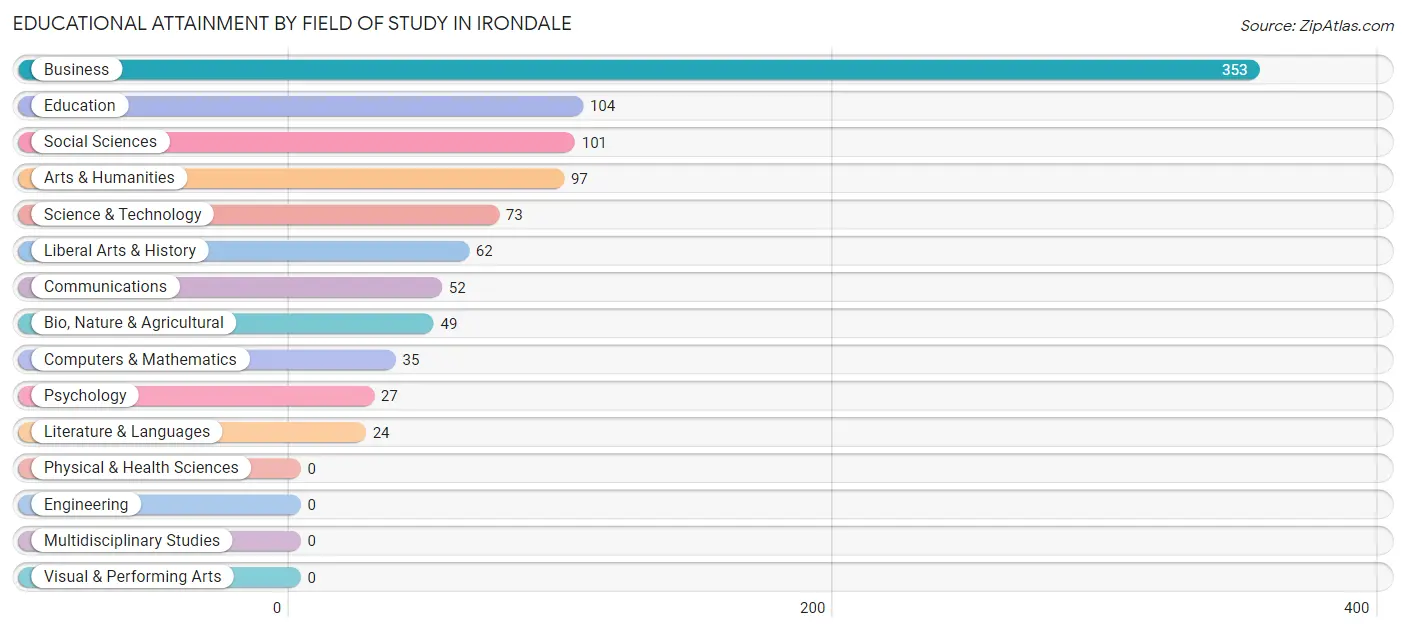
| Field of Study | # Graduates | % Graduates |
| Computers & Mathematics | 35 | 3.6% |
| Bio, Nature & Agricultural | 49 | 5.0% |
| Physical & Health Sciences | 0 | 0.0% |
| Psychology | 27 | 2.8% |
| Social Sciences | 101 | 10.3% |
| Engineering | 0 | 0.0% |
| Multidisciplinary Studies | 0 | 0.0% |
| Science & Technology | 73 | 7.5% |
| Business | 353 | 36.1% |
| Education | 104 | 10.6% |
| Literature & Languages | 24 | 2.5% |
| Liberal Arts & History | 62 | 6.4% |
| Visual & Performing Arts | 0 | 0.0% |
| Communications | 52 | 5.3% |
| Arts & Humanities | 97 | 9.9% |
| Total | 977 | 100.0% |
Transportation & Commute in Irondale
Vehicle Availability by Sex in Irondale
The most prevalent vehicle ownership categories in Irondale are males with 2 vehicles (395, accounting for 27.3%) and females with 2 vehicles (561, making up 22.5%).
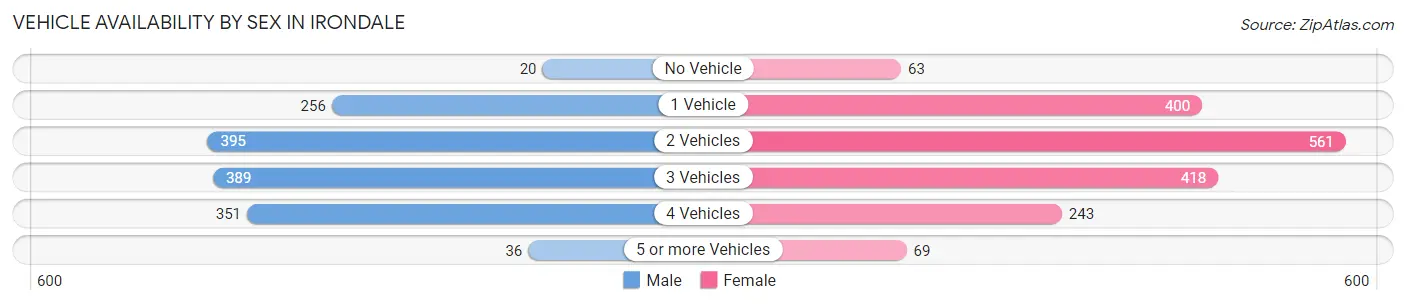
| Vehicles Available | Male | Female |
| No Vehicle | 20 (1.4%) | 63 (3.6%) |
| 1 Vehicle | 256 (17.7%) | 400 (22.8%) |
| 2 Vehicles | 395 (27.3%) | 561 (32.0%) |
| 3 Vehicles | 389 (26.9%) | 418 (23.8%) |
| 4 Vehicles | 351 (24.3%) | 243 (13.9%) |
| 5 or more Vehicles | 36 (2.5%) | 69 (3.9%) |
| Total | 1,447 (100.0%) | 1,754 (100.0%) |
Commute Time in Irondale
The most frequently occuring commute durations in Irondale are 30 to 34 minutes (584 commuters, 20.3%), 20 to 24 minutes (462 commuters, 16.1%), and 45 to 59 minutes (412 commuters, 14.3%).
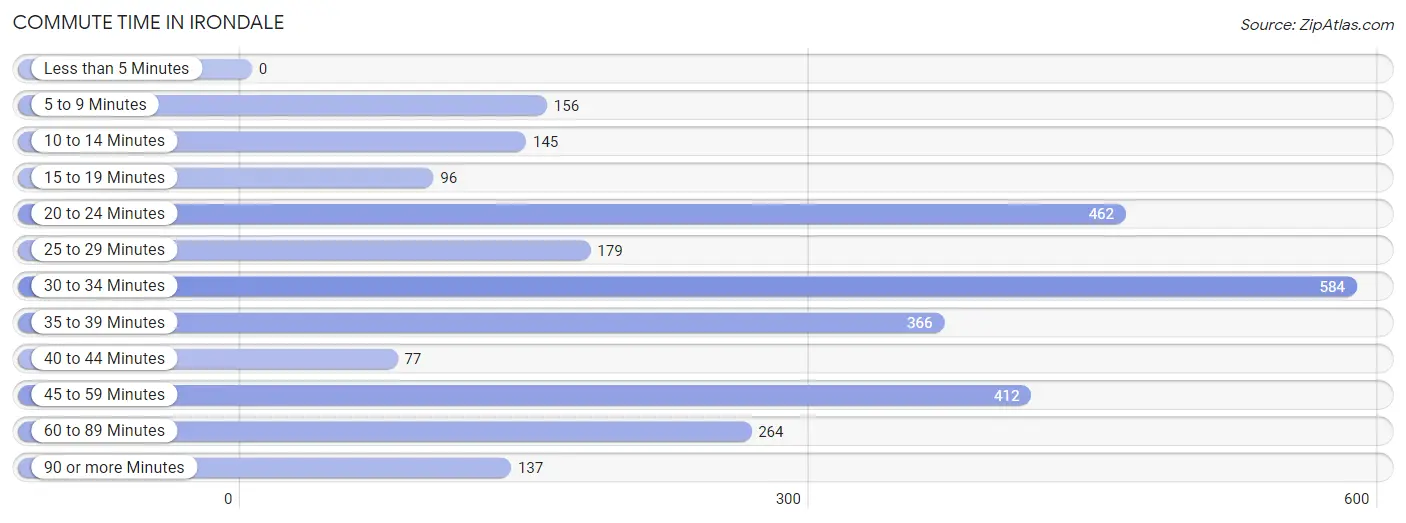
| Commute Time | # Commuters | % Commuters |
| Less than 5 Minutes | 0 | 0.0% |
| 5 to 9 Minutes | 156 | 5.4% |
| 10 to 14 Minutes | 145 | 5.0% |
| 15 to 19 Minutes | 96 | 3.3% |
| 20 to 24 Minutes | 462 | 16.1% |
| 25 to 29 Minutes | 179 | 6.2% |
| 30 to 34 Minutes | 584 | 20.3% |
| 35 to 39 Minutes | 366 | 12.7% |
| 40 to 44 Minutes | 77 | 2.7% |
| 45 to 59 Minutes | 412 | 14.3% |
| 60 to 89 Minutes | 264 | 9.2% |
| 90 or more Minutes | 137 | 4.8% |
Commute Time by Sex in Irondale
The most common commute times in Irondale are 30 to 34 minutes (261 commuters, 19.9%) for males and 30 to 34 minutes (323 commuters, 20.6%) for females.
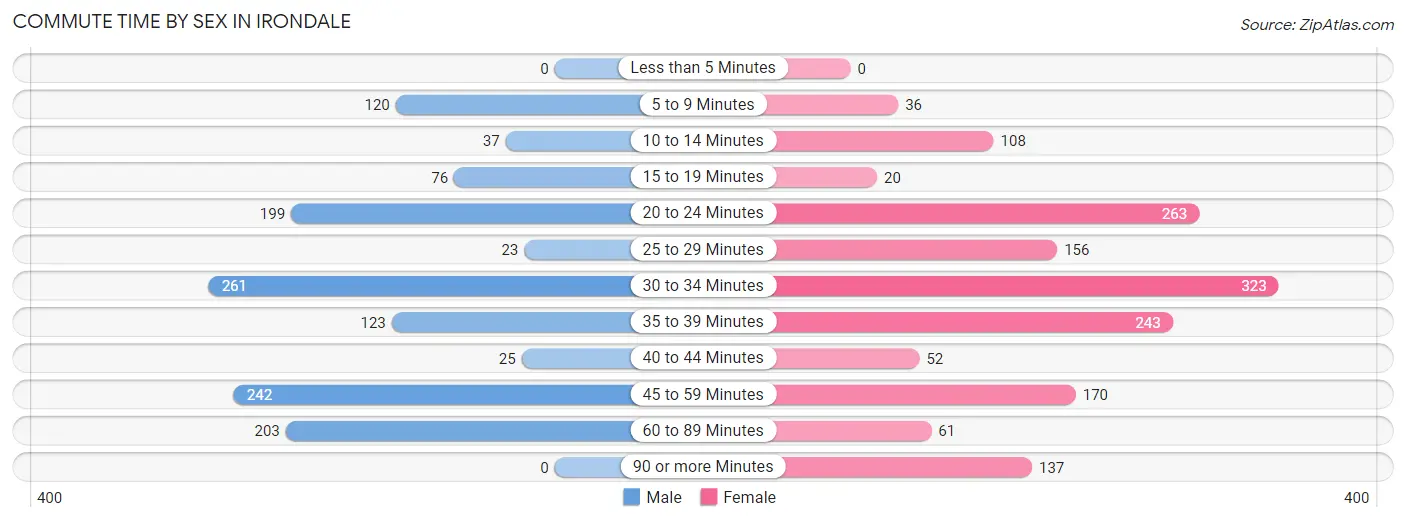
| Commute Time | Male | Female |
| Less than 5 Minutes | 0 (0.0%) | 0 (0.0%) |
| 5 to 9 Minutes | 120 (9.2%) | 36 (2.3%) |
| 10 to 14 Minutes | 37 (2.8%) | 108 (6.9%) |
| 15 to 19 Minutes | 76 (5.8%) | 20 (1.3%) |
| 20 to 24 Minutes | 199 (15.2%) | 263 (16.8%) |
| 25 to 29 Minutes | 23 (1.8%) | 156 (9.9%) |
| 30 to 34 Minutes | 261 (19.9%) | 323 (20.6%) |
| 35 to 39 Minutes | 123 (9.4%) | 243 (15.5%) |
| 40 to 44 Minutes | 25 (1.9%) | 52 (3.3%) |
| 45 to 59 Minutes | 242 (18.5%) | 170 (10.8%) |
| 60 to 89 Minutes | 203 (15.5%) | 61 (3.9%) |
| 90 or more Minutes | 0 (0.0%) | 137 (8.7%) |
Time of Departure to Work by Sex in Irondale
The most frequent times of departure to work in Irondale are 7:00 AM to 7:29 AM (242, 18.5%) for males and 4:00 PM to 11:59 PM (244, 15.5%) for females.
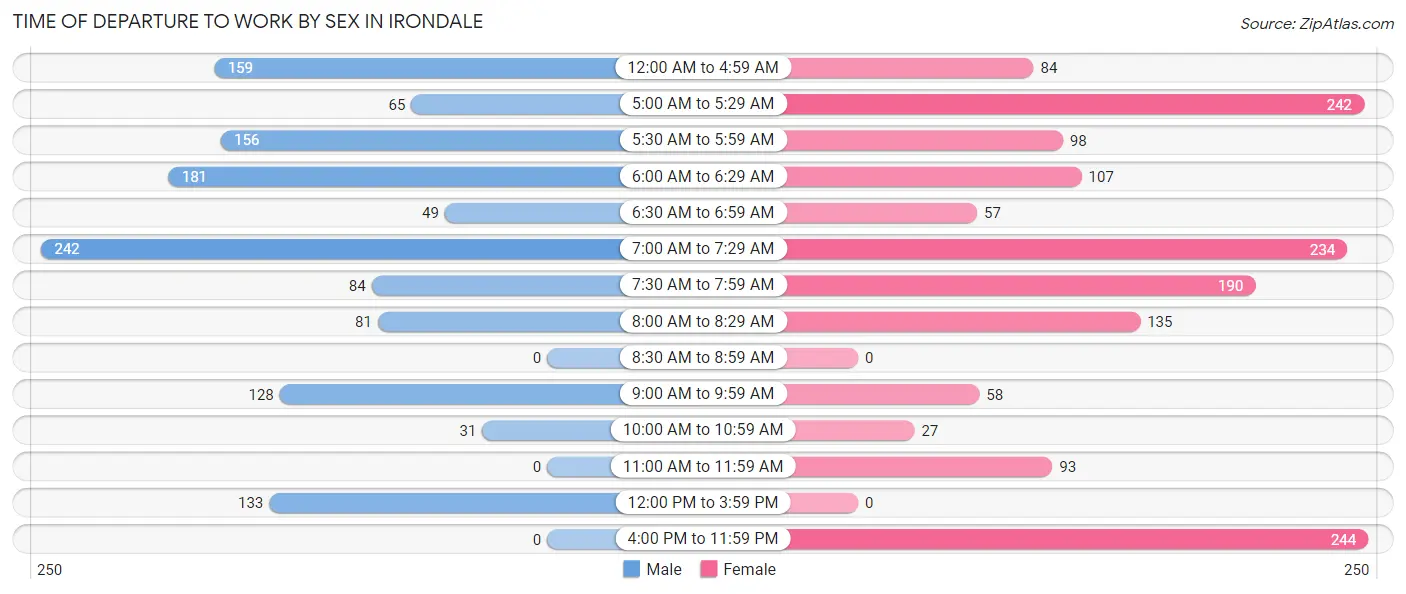
| Time of Departure | Male | Female |
| 12:00 AM to 4:59 AM | 159 (12.1%) | 84 (5.3%) |
| 5:00 AM to 5:29 AM | 65 (5.0%) | 242 (15.4%) |
| 5:30 AM to 5:59 AM | 156 (11.9%) | 98 (6.2%) |
| 6:00 AM to 6:29 AM | 181 (13.8%) | 107 (6.8%) |
| 6:30 AM to 6:59 AM | 49 (3.7%) | 57 (3.6%) |
| 7:00 AM to 7:29 AM | 242 (18.5%) | 234 (14.9%) |
| 7:30 AM to 7:59 AM | 84 (6.4%) | 190 (12.1%) |
| 8:00 AM to 8:29 AM | 81 (6.2%) | 135 (8.6%) |
| 8:30 AM to 8:59 AM | 0 (0.0%) | 0 (0.0%) |
| 9:00 AM to 9:59 AM | 128 (9.8%) | 58 (3.7%) |
| 10:00 AM to 10:59 AM | 31 (2.4%) | 27 (1.7%) |
| 11:00 AM to 11:59 AM | 0 (0.0%) | 93 (5.9%) |
| 12:00 PM to 3:59 PM | 133 (10.2%) | 0 (0.0%) |
| 4:00 PM to 11:59 PM | 0 (0.0%) | 244 (15.5%) |
| Total | 1,309 (100.0%) | 1,569 (100.0%) |
Housing Occupancy in Irondale
Occupancy by Ownership in Irondale
Of the total 2,755 dwellings in Irondale, owner-occupied units account for 1,780 (64.6%), while renter-occupied units make up 975 (35.4%).
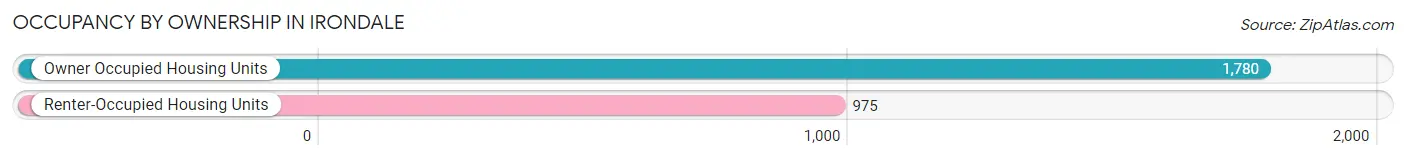
| Occupancy | # Housing Units | % Housing Units |
| Owner Occupied Housing Units | 1,780 | 64.6% |
| Renter-Occupied Housing Units | 975 | 35.4% |
| Total Occupied Housing Units | 2,755 | 100.0% |
Occupancy by Household Size in Irondale
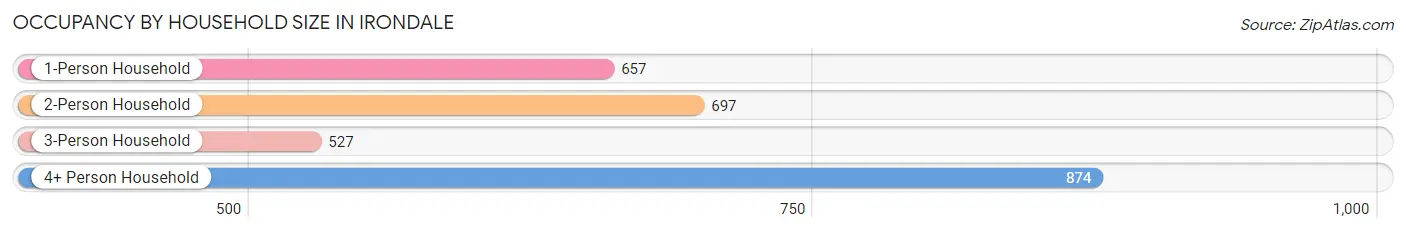
| Household Size | # Housing Units | % Housing Units |
| 1-Person Household | 657 | 23.8% |
| 2-Person Household | 697 | 25.3% |
| 3-Person Household | 527 | 19.1% |
| 4+ Person Household | 874 | 31.7% |
| Total Housing Units | 2,755 | 100.0% |
Occupancy by Ownership by Household Size in Irondale
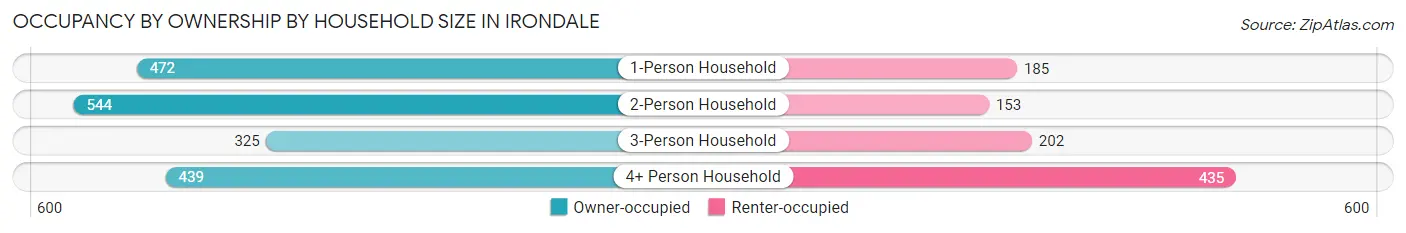
| Household Size | Owner-occupied | Renter-occupied |
| 1-Person Household | 472 (71.8%) | 185 (28.2%) |
| 2-Person Household | 544 (78.0%) | 153 (22.0%) |
| 3-Person Household | 325 (61.7%) | 202 (38.3%) |
| 4+ Person Household | 439 (50.2%) | 435 (49.8%) |
| Total Housing Units | 1,780 (64.6%) | 975 (35.4%) |
Occupancy by Educational Attainment in Irondale
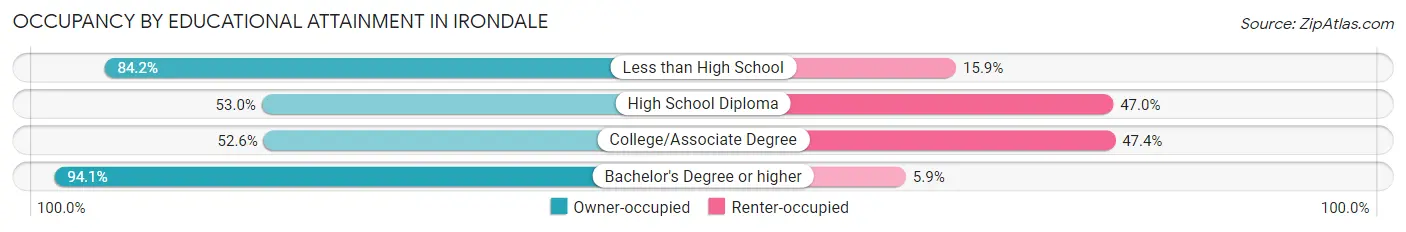
| Household Size | Owner-occupied | Renter-occupied |
| Less than High School | 292 (84.2%) | 55 (15.9%) |
| High School Diploma | 389 (53.0%) | 345 (47.0%) |
| College/Associate Degree | 604 (52.6%) | 544 (47.4%) |
| Bachelor's Degree or higher | 495 (94.1%) | 31 (5.9%) |
Occupancy by Age of Householder in Irondale
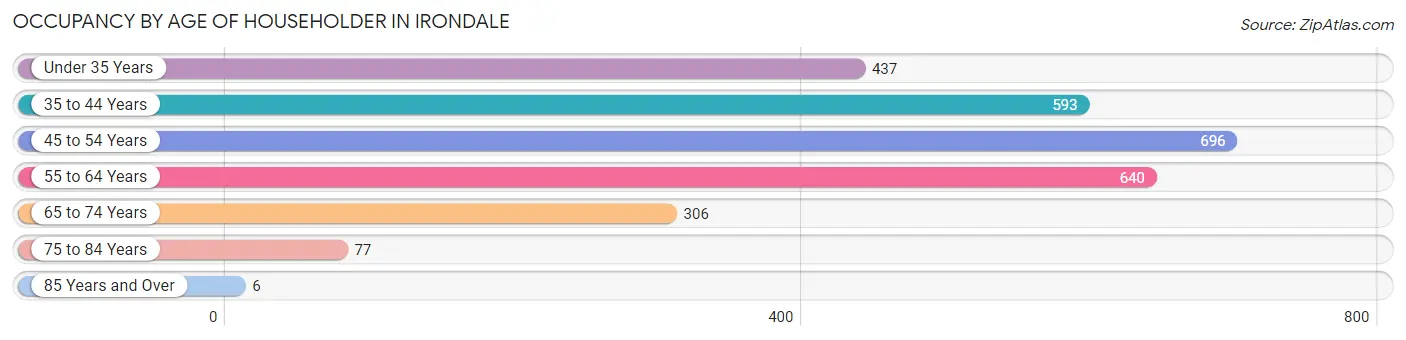
| Age Bracket | # Households | % Households |
| Under 35 Years | 437 | 15.9% |
| 35 to 44 Years | 593 | 21.5% |
| 45 to 54 Years | 696 | 25.3% |
| 55 to 64 Years | 640 | 23.2% |
| 65 to 74 Years | 306 | 11.1% |
| 75 to 84 Years | 77 | 2.8% |
| 85 Years and Over | 6 | 0.2% |
| Total | 2,755 | 100.0% |
Housing Finances in Irondale
Median Income by Occupancy in Irondale
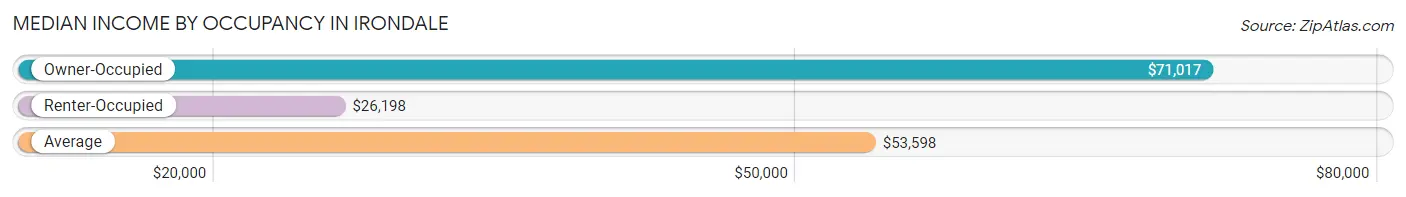
| Occupancy Type | # Households | Median Income |
| Owner-Occupied | 1,780 (64.6%) | $71,017 |
| Renter-Occupied | 975 (35.4%) | $26,198 |
| Average | 2,755 (100.0%) | $53,598 |
Occupancy by Householder Income Bracket in Irondale
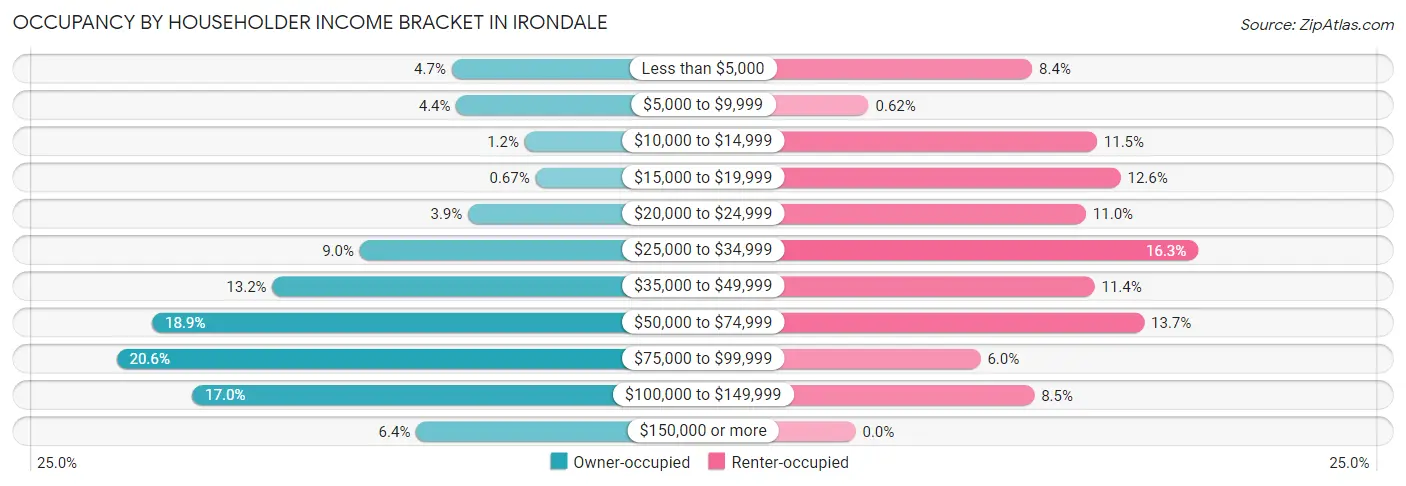
| Income Bracket | Owner-occupied | Renter-occupied |
| Less than $5,000 | 83 (4.7%) | 82 (8.4%) |
| $5,000 to $9,999 | 79 (4.4%) | 6 (0.6%) |
| $10,000 to $14,999 | 21 (1.2%) | 112 (11.5%) |
| $15,000 to $19,999 | 12 (0.7%) | 123 (12.6%) |
| $20,000 to $24,999 | 69 (3.9%) | 107 (11.0%) |
| $25,000 to $34,999 | 161 (9.0%) | 159 (16.3%) |
| $35,000 to $49,999 | 235 (13.2%) | 111 (11.4%) |
| $50,000 to $74,999 | 337 (18.9%) | 134 (13.7%) |
| $75,000 to $99,999 | 367 (20.6%) | 58 (5.9%) |
| $100,000 to $149,999 | 303 (17.0%) | 83 (8.5%) |
| $150,000 or more | 113 (6.4%) | 0 (0.0%) |
| Total | 1,780 (100.0%) | 975 (100.0%) |
Monthly Housing Cost Tiers in Irondale
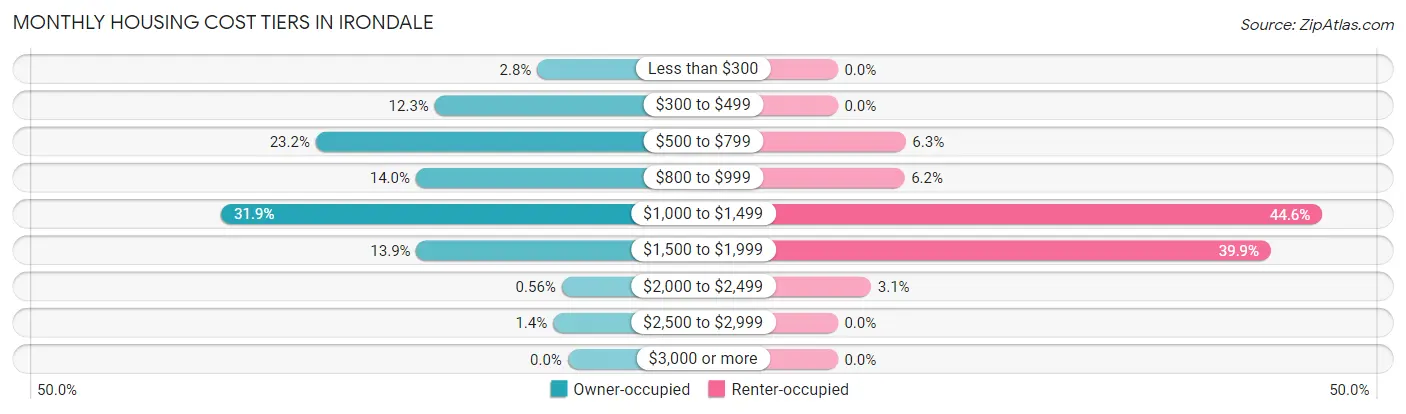
| Monthly Cost | Owner-occupied | Renter-occupied |
| Less than $300 | 50 (2.8%) | 0 (0.0%) |
| $300 to $499 | 218 (12.2%) | 0 (0.0%) |
| $500 to $799 | 413 (23.2%) | 61 (6.3%) |
| $800 to $999 | 249 (14.0%) | 60 (6.1%) |
| $1,000 to $1,499 | 568 (31.9%) | 435 (44.6%) |
| $1,500 to $1,999 | 248 (13.9%) | 389 (39.9%) |
| $2,000 to $2,499 | 10 (0.6%) | 30 (3.1%) |
| $2,500 to $2,999 | 24 (1.3%) | 0 (0.0%) |
| $3,000 or more | 0 (0.0%) | 0 (0.0%) |
| Total | 1,780 (100.0%) | 975 (100.0%) |
Physical Housing Characteristics in Irondale
Housing Structures in Irondale
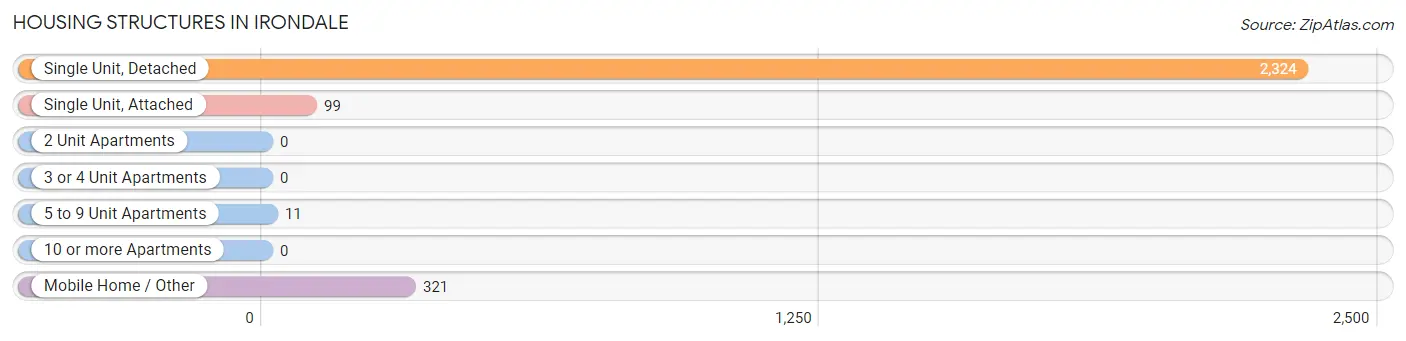
| Structure Type | # Housing Units | % Housing Units |
| Single Unit, Detached | 2,324 | 84.4% |
| Single Unit, Attached | 99 | 3.6% |
| 2 Unit Apartments | 0 | 0.0% |
| 3 or 4 Unit Apartments | 0 | 0.0% |
| 5 to 9 Unit Apartments | 11 | 0.4% |
| 10 or more Apartments | 0 | 0.0% |
| Mobile Home / Other | 321 | 11.7% |
| Total | 2,755 | 100.0% |
Housing Structures by Occupancy in Irondale
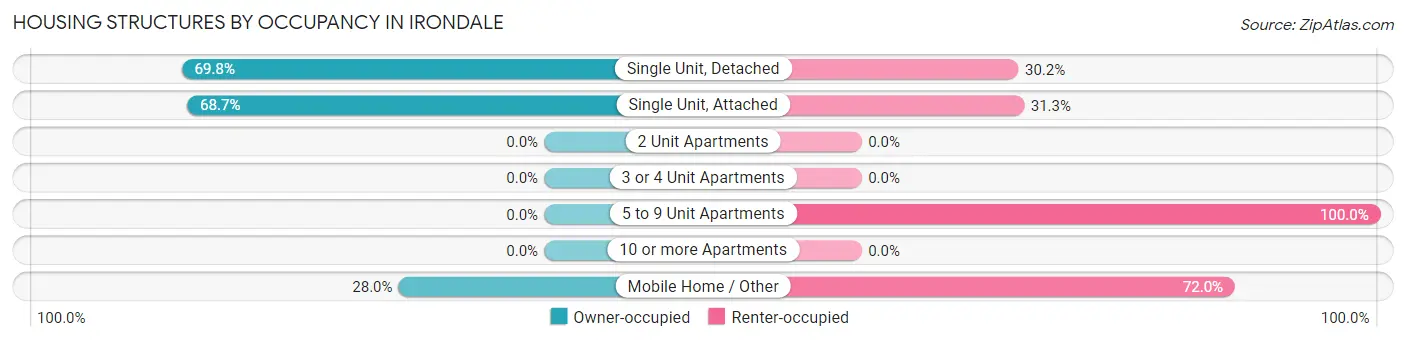
| Structure Type | Owner-occupied | Renter-occupied |
| Single Unit, Detached | 1,622 (69.8%) | 702 (30.2%) |
| Single Unit, Attached | 68 (68.7%) | 31 (31.3%) |
| 2 Unit Apartments | 0 (0.0%) | 0 (0.0%) |
| 3 or 4 Unit Apartments | 0 (0.0%) | 0 (0.0%) |
| 5 to 9 Unit Apartments | 0 (0.0%) | 11 (100.0%) |
| 10 or more Apartments | 0 (0.0%) | 0 (0.0%) |
| Mobile Home / Other | 90 (28.0%) | 231 (72.0%) |
| Total | 1,780 (64.6%) | 975 (35.4%) |
Housing Structures by Number of Rooms in Irondale
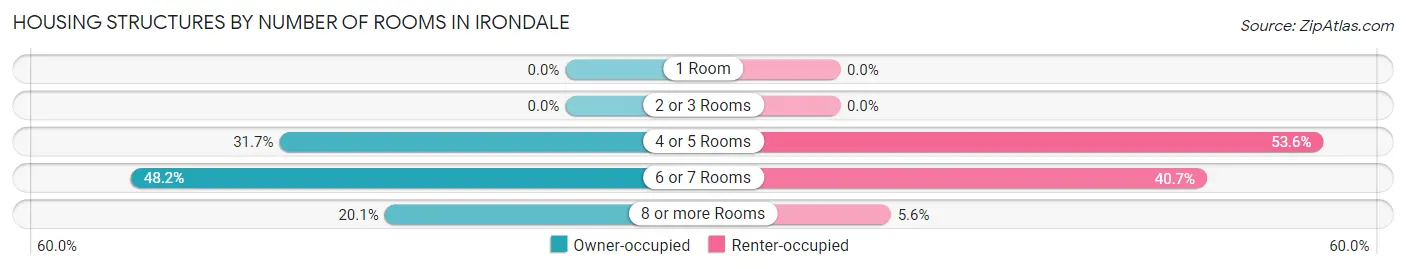
| Number of Rooms | Owner-occupied | Renter-occupied |
| 1 Room | 0 (0.0%) | 0 (0.0%) |
| 2 or 3 Rooms | 0 (0.0%) | 0 (0.0%) |
| 4 or 5 Rooms | 565 (31.7%) | 523 (53.6%) |
| 6 or 7 Rooms | 858 (48.2%) | 397 (40.7%) |
| 8 or more Rooms | 357 (20.1%) | 55 (5.6%) |
| Total | 1,780 (100.0%) | 975 (100.0%) |
Housing Structure by Heating Type in Irondale
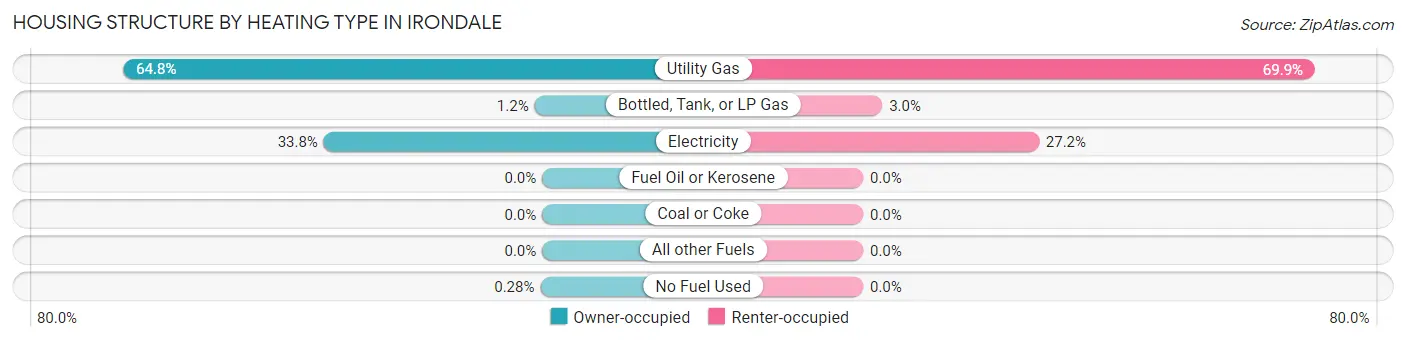
| Heating Type | Owner-occupied | Renter-occupied |
| Utility Gas | 1,153 (64.8%) | 681 (69.9%) |
| Bottled, Tank, or LP Gas | 21 (1.2%) | 29 (3.0%) |
| Electricity | 601 (33.8%) | 265 (27.2%) |
| Fuel Oil or Kerosene | 0 (0.0%) | 0 (0.0%) |
| Coal or Coke | 0 (0.0%) | 0 (0.0%) |
| All other Fuels | 0 (0.0%) | 0 (0.0%) |
| No Fuel Used | 5 (0.3%) | 0 (0.0%) |
| Total | 1,780 (100.0%) | 975 (100.0%) |
Household Vehicle Usage in Irondale
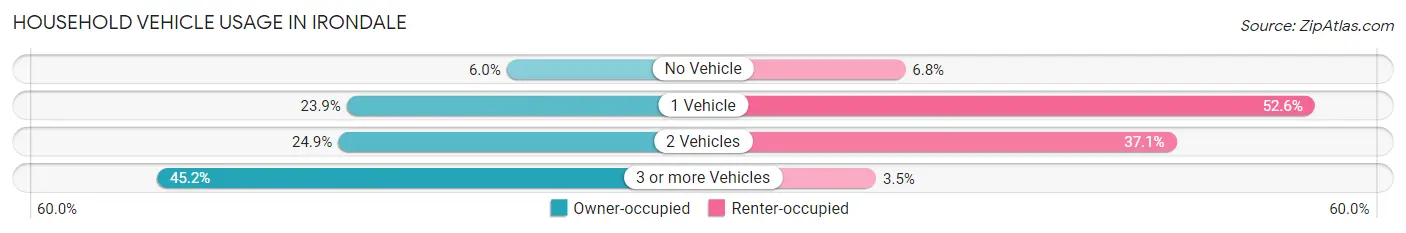
| Vehicles per Household | Owner-occupied | Renter-occupied |
| No Vehicle | 107 (6.0%) | 66 (6.8%) |
| 1 Vehicle | 426 (23.9%) | 513 (52.6%) |
| 2 Vehicles | 443 (24.9%) | 362 (37.1%) |
| 3 or more Vehicles | 804 (45.2%) | 34 (3.5%) |
| Total | 1,780 (100.0%) | 975 (100.0%) |
Real Estate & Mortgages in Irondale
Real Estate and Mortgage Overview in Irondale
| Characteristic | Without Mortgage | With Mortgage |
| Housing Units | 546 | 1,234 |
| Median Property Value | $150,600 | $158,400 |
| Median Household Income | $70,463 | $77 |
| Monthly Housing Costs | $513 | $0 |
| Real Estate Taxes | $1,213 | $94 |
Property Value by Mortgage Status in Irondale
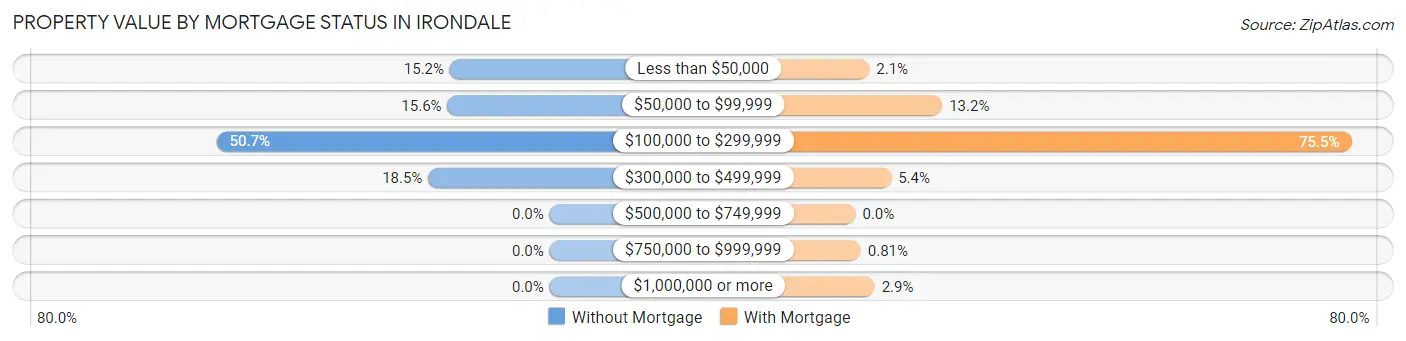
| Property Value | Without Mortgage | With Mortgage |
| Less than $50,000 | 83 (15.2%) | 26 (2.1%) |
| $50,000 to $99,999 | 85 (15.6%) | 163 (13.2%) |
| $100,000 to $299,999 | 277 (50.7%) | 932 (75.5%) |
| $300,000 to $499,999 | 101 (18.5%) | 67 (5.4%) |
| $500,000 to $749,999 | 0 (0.0%) | 0 (0.0%) |
| $750,000 to $999,999 | 0 (0.0%) | 10 (0.8%) |
| $1,000,000 or more | 0 (0.0%) | 36 (2.9%) |
| Total | 546 (100.0%) | 1,234 (100.0%) |
Household Income by Mortgage Status in Irondale
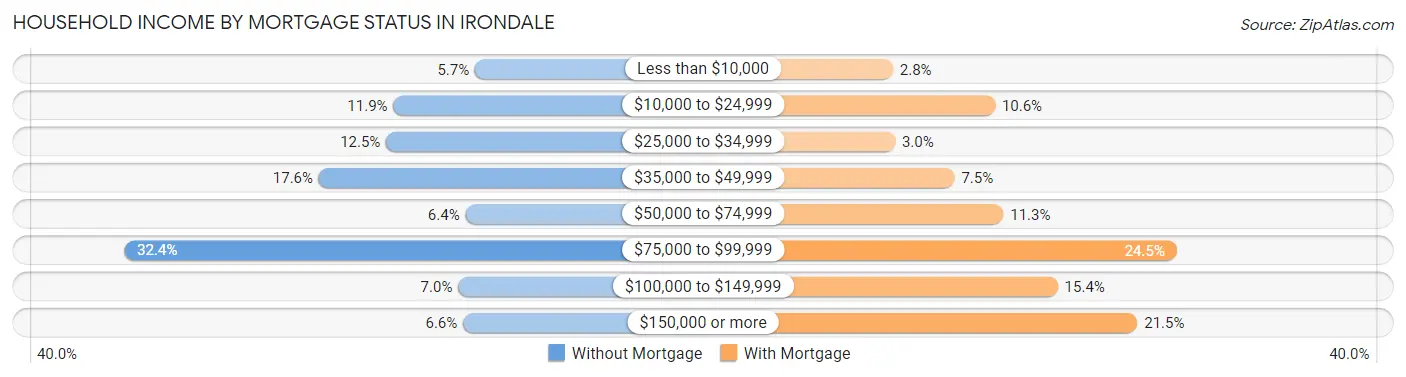
| Household Income | Without Mortgage | With Mortgage |
| Less than $10,000 | 31 (5.7%) | 35 (2.8%) |
| $10,000 to $24,999 | 65 (11.9%) | 131 (10.6%) |
| $25,000 to $34,999 | 68 (12.4%) | 37 (3.0%) |
| $35,000 to $49,999 | 96 (17.6%) | 93 (7.5%) |
| $50,000 to $74,999 | 35 (6.4%) | 139 (11.3%) |
| $75,000 to $99,999 | 177 (32.4%) | 302 (24.5%) |
| $100,000 to $149,999 | 38 (7.0%) | 190 (15.4%) |
| $150,000 or more | 36 (6.6%) | 265 (21.5%) |
| Total | 546 (100.0%) | 1,234 (100.0%) |
Property Value to Household Income Ratio in Irondale
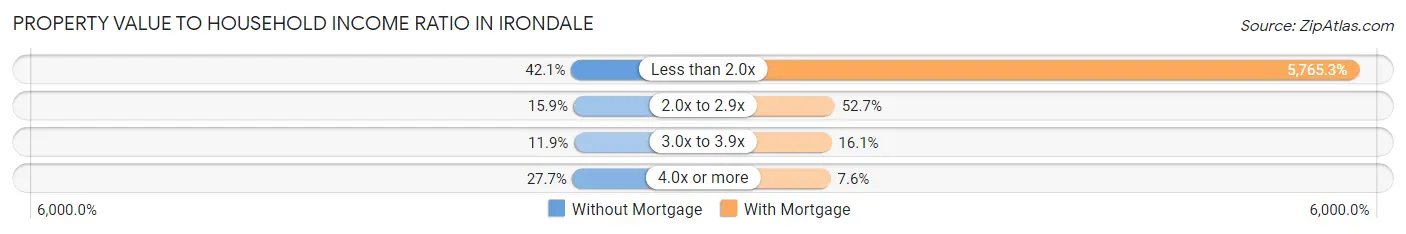
| Value-to-Income Ratio | Without Mortgage | With Mortgage |
| Less than 2.0x | 230 (42.1%) | 71,144 (5,765.3%) |
| 2.0x to 2.9x | 87 (15.9%) | 650 (52.7%) |
| 3.0x to 3.9x | 65 (11.9%) | 198 (16.1%) |
| 4.0x or more | 151 (27.7%) | 94 (7.6%) |
| Total | 546 (100.0%) | 1,234 (100.0%) |
Real Estate Taxes by Mortgage Status in Irondale
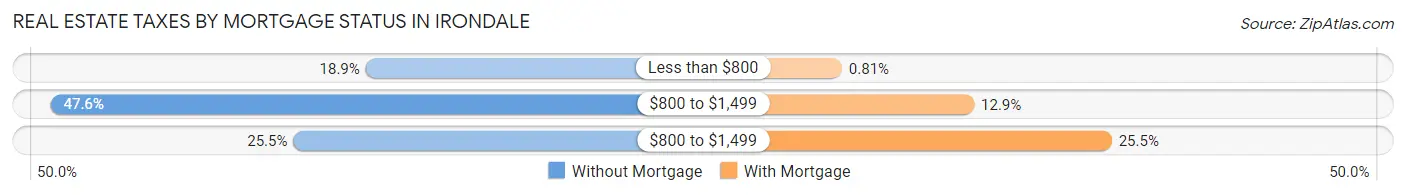
| Property Taxes | Without Mortgage | With Mortgage |
| Less than $800 | 103 (18.9%) | 10 (0.8%) |
| $800 to $1,499 | 260 (47.6%) | 159 (12.9%) |
| $800 to $1,499 | 139 (25.5%) | 314 (25.5%) |
| Total | 546 (100.0%) | 1,234 (100.0%) |
Health & Disability in Irondale
Health Insurance Coverage by Age in Irondale
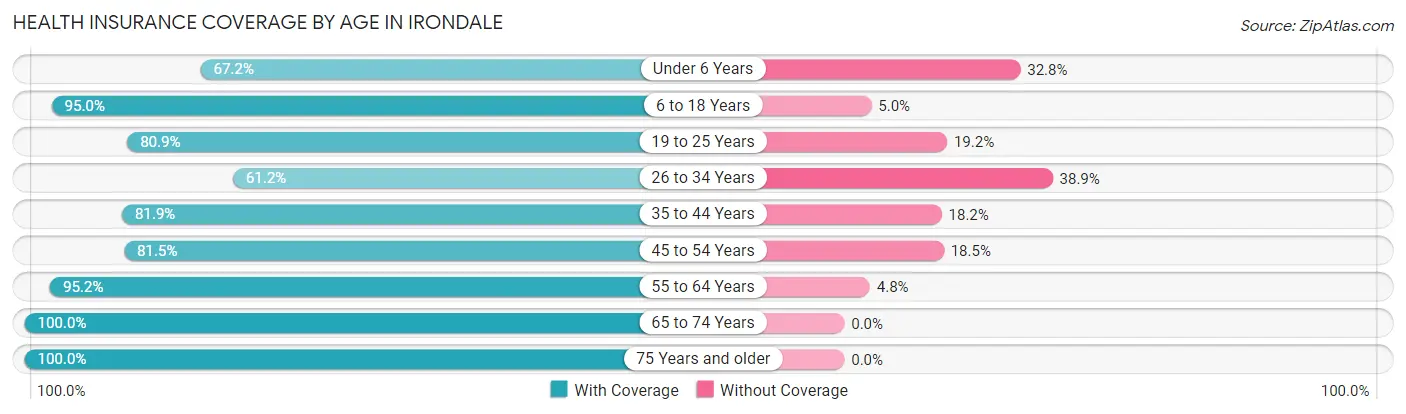
| Age Bracket | With Coverage | Without Coverage |
| Under 6 Years | 440 (67.2%) | 215 (32.8%) |
| 6 to 18 Years | 2,129 (95.0%) | 113 (5.0%) |
| 19 to 25 Years | 439 (80.8%) | 104 (19.2%) |
| 26 to 34 Years | 617 (61.2%) | 392 (38.9%) |
| 35 to 44 Years | 830 (81.9%) | 184 (18.1%) |
| 45 to 54 Years | 905 (81.5%) | 206 (18.5%) |
| 55 to 64 Years | 1,000 (95.2%) | 50 (4.8%) |
| 65 to 74 Years | 552 (100.0%) | 0 (0.0%) |
| 75 Years and older | 129 (100.0%) | 0 (0.0%) |
| Total | 7,041 (84.8%) | 1,264 (15.2%) |
Health Insurance Coverage by Citizenship Status in Irondale
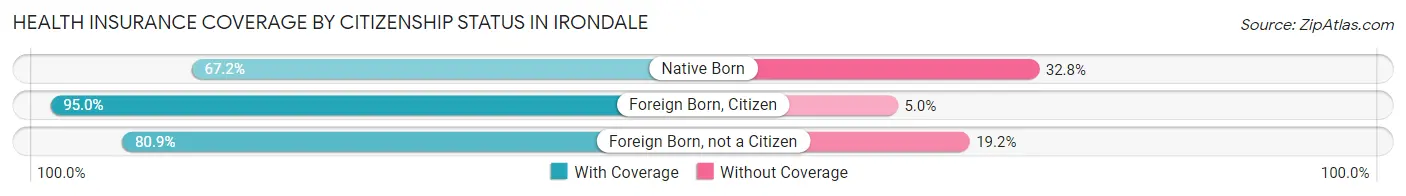
| Citizenship Status | With Coverage | Without Coverage |
| Native Born | 440 (67.2%) | 215 (32.8%) |
| Foreign Born, Citizen | 2,129 (95.0%) | 113 (5.0%) |
| Foreign Born, not a Citizen | 439 (80.8%) | 104 (19.2%) |
Health Insurance Coverage by Household Income in Irondale
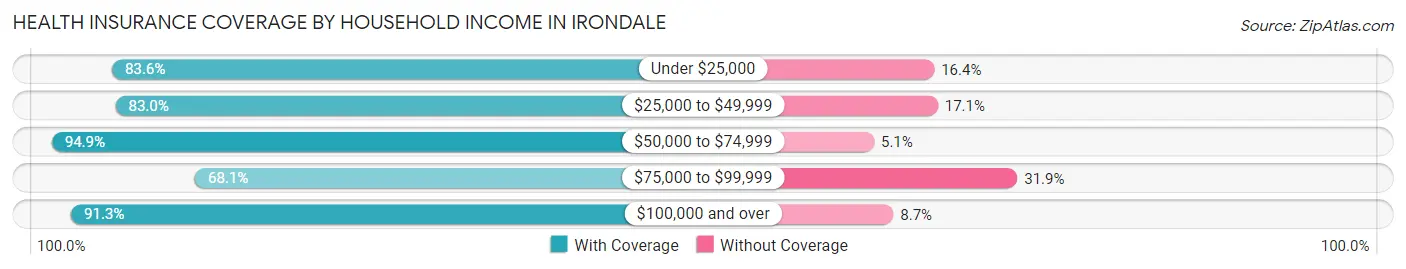
| Household Income | With Coverage | Without Coverage |
| Under $25,000 | 1,353 (83.6%) | 265 (16.4%) |
| $25,000 to $49,999 | 1,926 (83.0%) | 396 (17.1%) |
| $50,000 to $74,999 | 1,583 (94.9%) | 85 (5.1%) |
| $75,000 to $99,999 | 829 (68.1%) | 389 (31.9%) |
| $100,000 and over | 1,350 (91.3%) | 129 (8.7%) |
Public vs Private Health Insurance Coverage by Age in Irondale
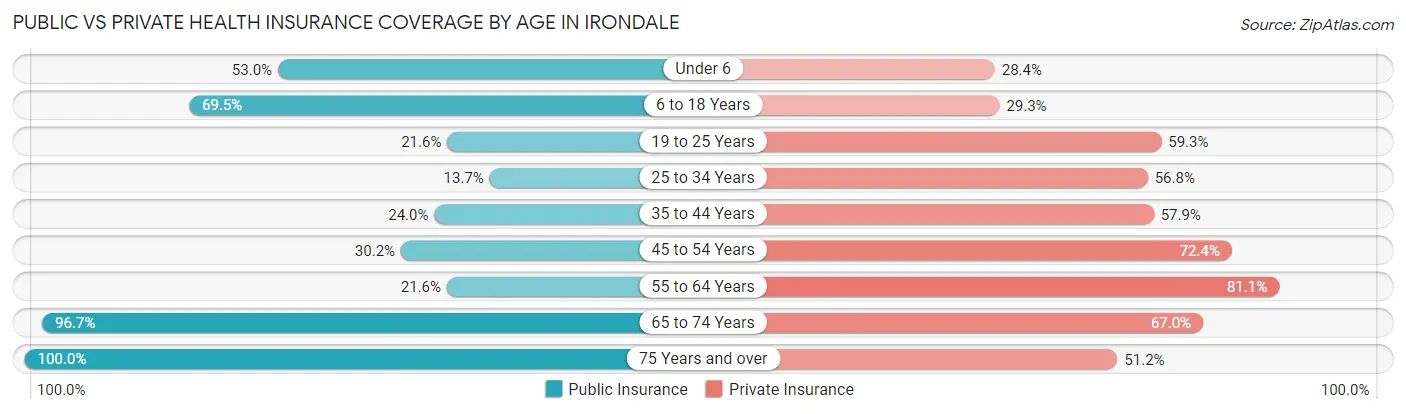
| Age Bracket | Public Insurance | Private Insurance |
| Under 6 | 347 (53.0%) | 186 (28.4%) |
| 6 to 18 Years | 1,558 (69.5%) | 656 (29.3%) |
| 19 to 25 Years | 117 (21.5%) | 322 (59.3%) |
| 25 to 34 Years | 138 (13.7%) | 573 (56.8%) |
| 35 to 44 Years | 243 (24.0%) | 587 (57.9%) |
| 45 to 54 Years | 335 (30.1%) | 804 (72.4%) |
| 55 to 64 Years | 227 (21.6%) | 852 (81.1%) |
| 65 to 74 Years | 534 (96.7%) | 370 (67.0%) |
| 75 Years and over | 129 (100.0%) | 66 (51.2%) |
| Total | 3,628 (43.7%) | 4,416 (53.2%) |
Disability Status by Sex by Age in Irondale
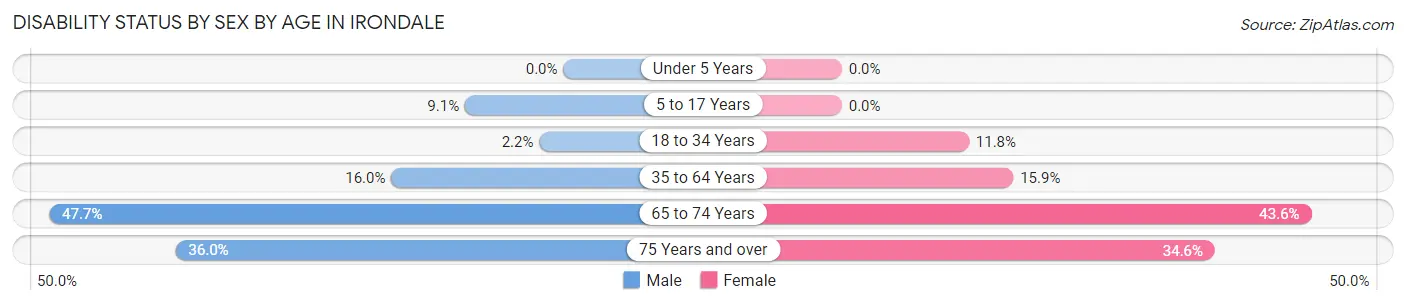
| Age Bracket | Male | Female |
| Under 5 Years | 0 (0.0%) | 0 (0.0%) |
| 5 to 17 Years | 97 (9.1%) | 0 (0.0%) |
| 18 to 34 Years | 15 (2.2%) | 129 (11.8%) |
| 35 to 64 Years | 224 (16.0%) | 282 (15.9%) |
| 65 to 74 Years | 178 (47.7%) | 78 (43.6%) |
| 75 Years and over | 9 (36.0%) | 36 (34.6%) |
Disability Class by Sex by Age in Irondale
Disability Class: Hearing Difficulty
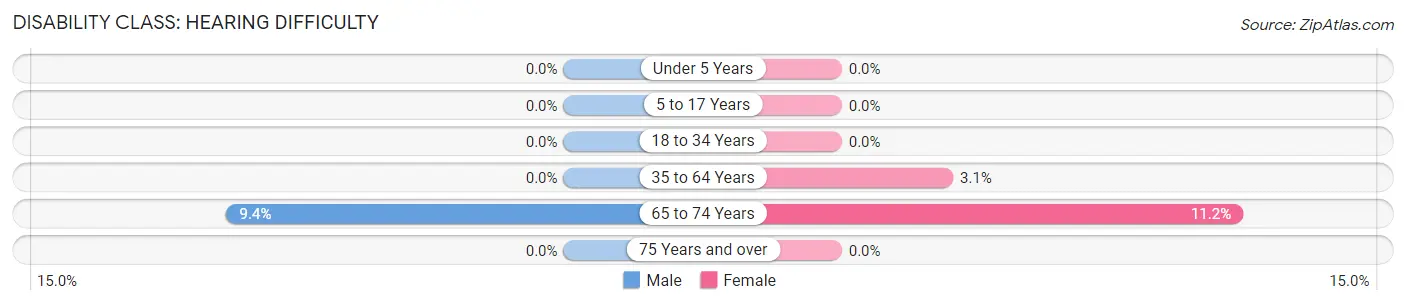
| Age Bracket | Male | Female |
| Under 5 Years | 0 (0.0%) | 0 (0.0%) |
| 5 to 17 Years | 0 (0.0%) | 0 (0.0%) |
| 18 to 34 Years | 0 (0.0%) | 0 (0.0%) |
| 35 to 64 Years | 0 (0.0%) | 55 (3.1%) |
| 65 to 74 Years | 35 (9.4%) | 20 (11.2%) |
| 75 Years and over | 0 (0.0%) | 0 (0.0%) |
Disability Class: Vision Difficulty
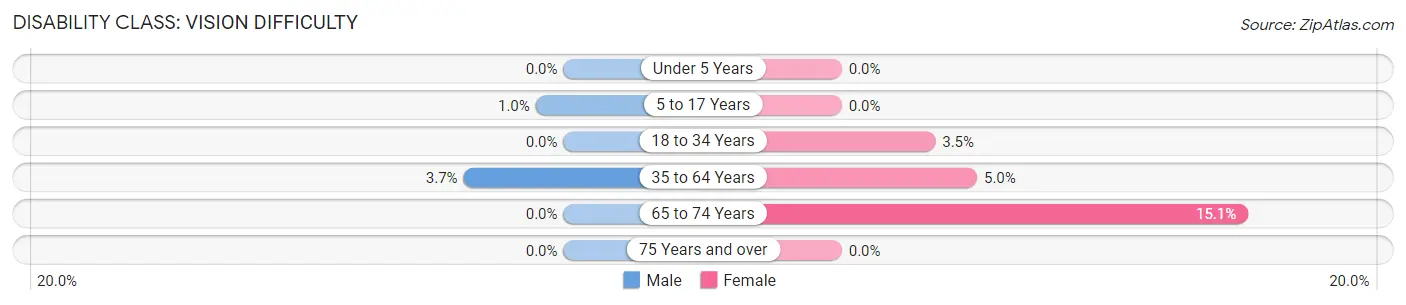
| Age Bracket | Male | Female |
| Under 5 Years | 0 (0.0%) | 0 (0.0%) |
| 5 to 17 Years | 11 (1.0%) | 0 (0.0%) |
| 18 to 34 Years | 0 (0.0%) | 38 (3.5%) |
| 35 to 64 Years | 52 (3.7%) | 89 (5.0%) |
| 65 to 74 Years | 0 (0.0%) | 27 (15.1%) |
| 75 Years and over | 0 (0.0%) | 0 (0.0%) |
Disability Class: Cognitive Difficulty
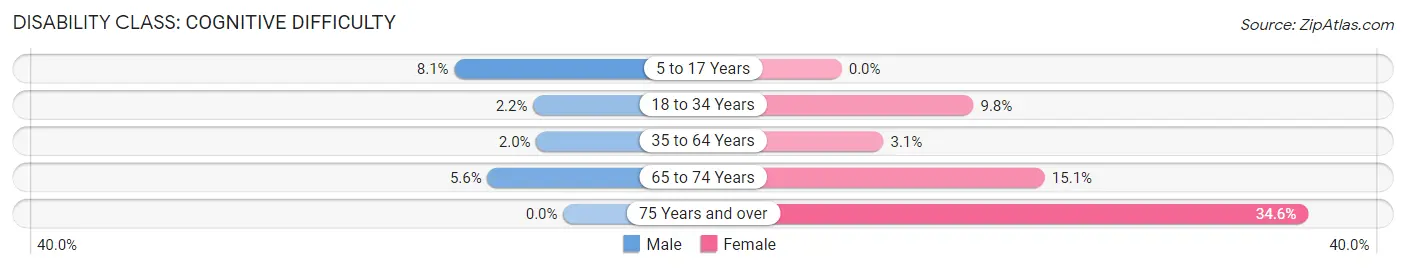
| Age Bracket | Male | Female |
| 5 to 17 Years | 86 (8.1%) | 0 (0.0%) |
| 18 to 34 Years | 15 (2.2%) | 107 (9.8%) |
| 35 to 64 Years | 28 (2.0%) | 55 (3.1%) |
| 65 to 74 Years | 21 (5.6%) | 27 (15.1%) |
| 75 Years and over | 0 (0.0%) | 36 (34.6%) |
Disability Class: Ambulatory Difficulty
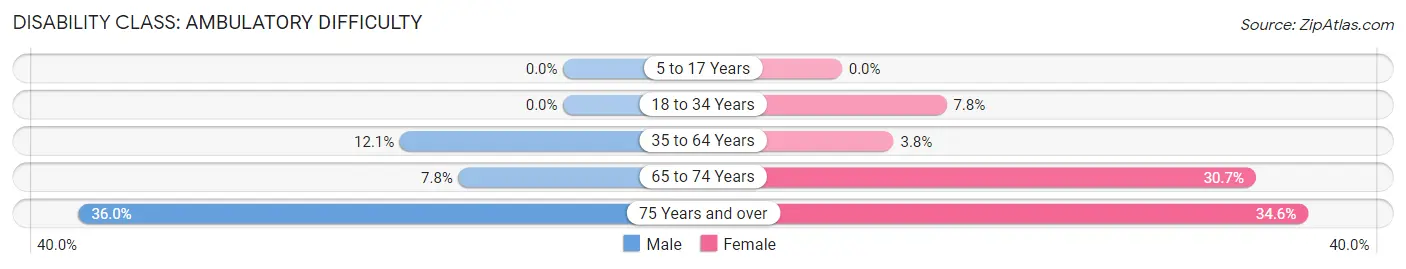
| Age Bracket | Male | Female |
| 5 to 17 Years | 0 (0.0%) | 0 (0.0%) |
| 18 to 34 Years | 0 (0.0%) | 85 (7.8%) |
| 35 to 64 Years | 170 (12.1%) | 68 (3.8%) |
| 65 to 74 Years | 29 (7.8%) | 55 (30.7%) |
| 75 Years and over | 9 (36.0%) | 36 (34.6%) |
Disability Class: Self-Care Difficulty
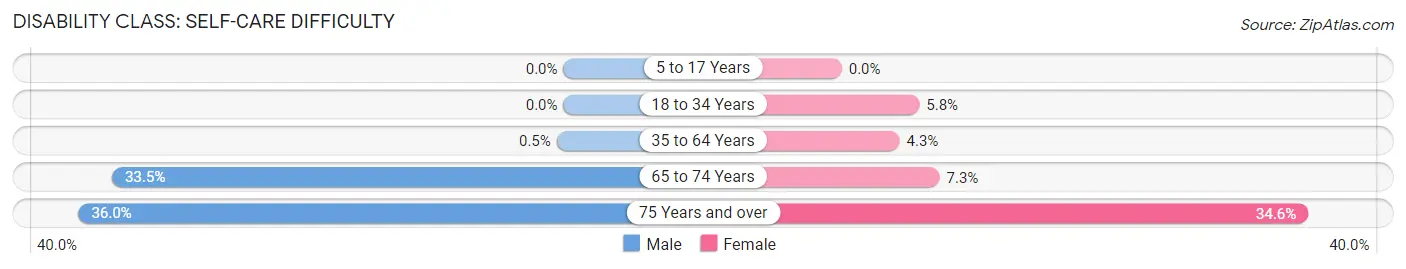
| Age Bracket | Male | Female |
| 5 to 17 Years | 0 (0.0%) | 0 (0.0%) |
| 18 to 34 Years | 0 (0.0%) | 63 (5.8%) |
| 35 to 64 Years | 7 (0.5%) | 76 (4.3%) |
| 65 to 74 Years | 125 (33.5%) | 13 (7.3%) |
| 75 Years and over | 9 (36.0%) | 36 (34.6%) |
Technology Access in Irondale
Computing Device Access in Irondale
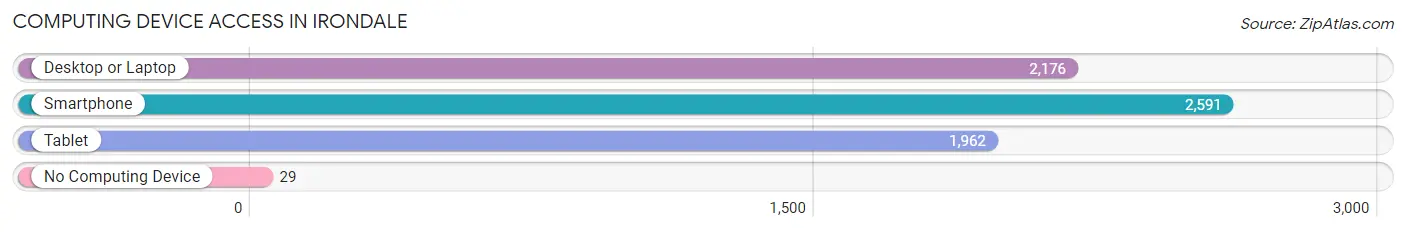
| Device Type | # Households | % Households |
| Desktop or Laptop | 2,176 | 79.0% |
| Smartphone | 2,591 | 94.1% |
| Tablet | 1,962 | 71.2% |
| No Computing Device | 29 | 1.1% |
| Total | 2,755 | 100.0% |
Internet Access in Irondale
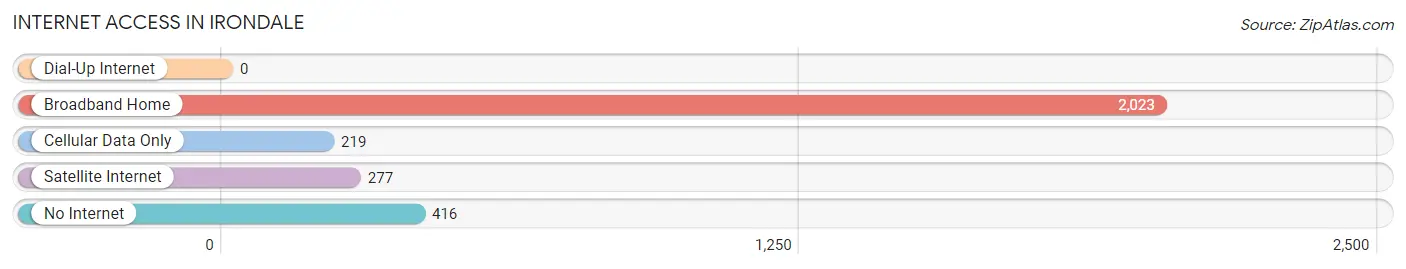
| Internet Type | # Households | % Households |
| Dial-Up Internet | 0 | 0.0% |
| Broadband Home | 2,023 | 73.4% |
| Cellular Data Only | 219 | 8.0% |
| Satellite Internet | 277 | 10.1% |
| No Internet | 416 | 15.1% |
| Total | 2,755 | 100.0% |
Irondale Summary
Irondale, Georgia is a small town located in the northwest corner of Georgia, in the foothills of the Appalachian Mountains. It is situated in the Chattahoochee National Forest, and is part of the larger metropolitan area of Atlanta. The town has a population of just over 1,000 people, and is known for its rural charm and small-town atmosphere.
History
The area that is now Irondale was first settled in the early 1800s by settlers from North Carolina. The town was originally known as Iron Hill, and was named for the iron ore deposits that were found in the area. The town was incorporated in 1887, and the name was changed to Irondale.
The town was a major center for the iron industry in the late 19th and early 20th centuries. The iron ore was used to make tools, weapons, and other items. The town was also home to several sawmills and gristmills, which provided lumber and grain for the local economy.
In the early 20th century, the iron industry began to decline, and the town began to focus more on agriculture. The town was home to several large farms, which grew cotton, corn, and other crops. The town also had several small businesses, including a general store, a blacksmith shop, and a post office.
Geography
Irondale is located in the northwest corner of Georgia, in the foothills of the Appalachian Mountains. The town is situated in the Chattahoochee National Forest, and is part of the larger metropolitan area of Atlanta. The town is located at an elevation of 1,000 feet, and is surrounded by rolling hills and forests.
The town is located near several major highways, including Interstate 75, US Highway 411, and Georgia State Route 20. The nearest major cities are Chattanooga, Tennessee, and Atlanta, Georgia.
Economy
The economy of Irondale is largely based on agriculture and tourism. The town is home to several large farms, which grow cotton, corn, and other crops. The town also has several small businesses, including a general store, a blacksmith shop, and a post office.
The town is also a popular tourist destination, due to its rural charm and small-town atmosphere. The town is home to several historic sites, including the Iron Hill Museum, which showcases the town’s history and the iron industry. The town also has several outdoor recreation areas, including hiking trails, fishing spots, and camping sites.
Demographics
As of the 2010 census, the population of Irondale was 1,072. The town has a population that is predominantly white (94.2%), with a small African American population (3.3%). The median household income is $37,500, and the median home value is $117,000. The town has a poverty rate of 16.3%.
Common Questions
What is Per Capita Income in Irondale?
Per Capita income in Irondale is $20,236.
What is the Median Family Income in Irondale?
Median Family Income in Irondale is $55,406.
What is the Median Household income in Irondale?
Median Household Income in Irondale is $53,598.
What is Income or Wage Gap in Irondale?
Income or Wage Gap in Irondale is 25.6%.
Women in Irondale earn 74.4 cents for every dollar earned by a man.
What is Family Income Deficit in Irondale?
Family Income Deficit in Irondale is $12,323.
Families that are below poverty line in Irondale earn $12,323 less on average than the poverty threshold level.
What is Inequality or Gini Index in Irondale?
Inequality or Gini Index in Irondale is 0.42.
What is the Total Population of Irondale?
Total Population of Irondale is 8,305.
What is the Total Male Population of Irondale?
Total Male Population of Irondale is 3,736.
What is the Total Female Population of Irondale?
Total Female Population of Irondale is 4,569.
What is the Ratio of Males per 100 Females in Irondale?
There are 81.77 Males per 100 Females in Irondale.
What is the Ratio of Females per 100 Males in Irondale?
There are 122.30 Females per 100 Males in Irondale.
What is the Median Population Age in Irondale?
Median Population Age in Irondale is 32.8 Years.
What is the Average Family Size in Irondale
Average Family Size in Irondale is 3.6 People.
What is the Average Household Size in Irondale
Average Household Size in Irondale is 3.0 People.
How Large is the Labor Force in Irondale?
There are 3,530 People in the Labor Forcein in Irondale.
What is the Percentage of People in the Labor Force in Irondale?
57.5% of People are in the Labor Force in Irondale.
What is the Unemployment Rate in Irondale?
Unemployment Rate in Irondale is 5.9%.