Moultrie, GA Map & Demographics
Moultrie Map
Moultrie Overview
$25,651
PER CAPITA INCOME
$50,915
AVG FAMILY INCOME
$41,228
AVG HOUSEHOLD INCOME
10.3%
WAGE / INCOME GAP [ % ]
89.7¢/ $1
WAGE / INCOME GAP [ $ ]
$11,434
FAMILY INCOME DEFICIT
0.52
INEQUALITY / GINI INDEX
14,533
TOTAL POPULATION
7,480
MALE POPULATION
7,053
FEMALE POPULATION
106.05
MALES / 100 FEMALES
94.29
FEMALES / 100 MALES
35.9
MEDIAN AGE
3.3
AVG FAMILY SIZE
2.4
AVG HOUSEHOLD SIZE
6,686
LABOR FORCE [ PEOPLE ]
58.4%
PERCENT IN LABOR FORCE
8.3%
UNEMPLOYMENT RATE
Moultrie Area Codes
Income in Moultrie
Income Overview in Moultrie
Per Capita Income in Moultrie is $25,651, while median incomes of families and households are $50,915 and $41,228 respectively.
| Characteristic | Number | Measure |
| Per Capita Income | 14,533 | $25,651 |
| Median Family Income | 3,226 | $50,915 |
| Mean Family Income | 3,226 | $79,833 |
| Median Household Income | 5,745 | $41,228 |
| Mean Household Income | 5,745 | $61,882 |
| Income Deficit | 3,226 | $11,434 |
| Wage / Income Gap (%) | 14,533 | 10.34% |
| Wage / Income Gap ($) | 14,533 | 89.66¢ per $1 |
| Gini / Inequality Index | 14,533 | 0.52 |
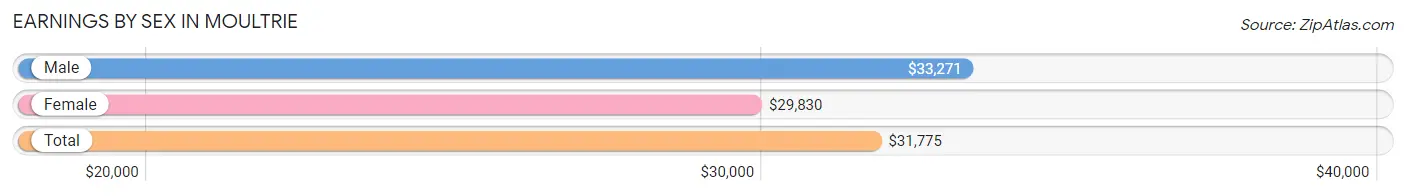
Earnings by Sex in Moultrie
Average Earnings in Moultrie are $31,775, $33,271 for men and $29,830 for women, a difference of 10.3%.
| Sex | Number | Average Earnings |
| Male | 3,847 (56.1%) | $33,271 |
| Female | 3,009 (43.9%) | $29,830 |
| Total | 6,856 (100.0%) | $31,775 |
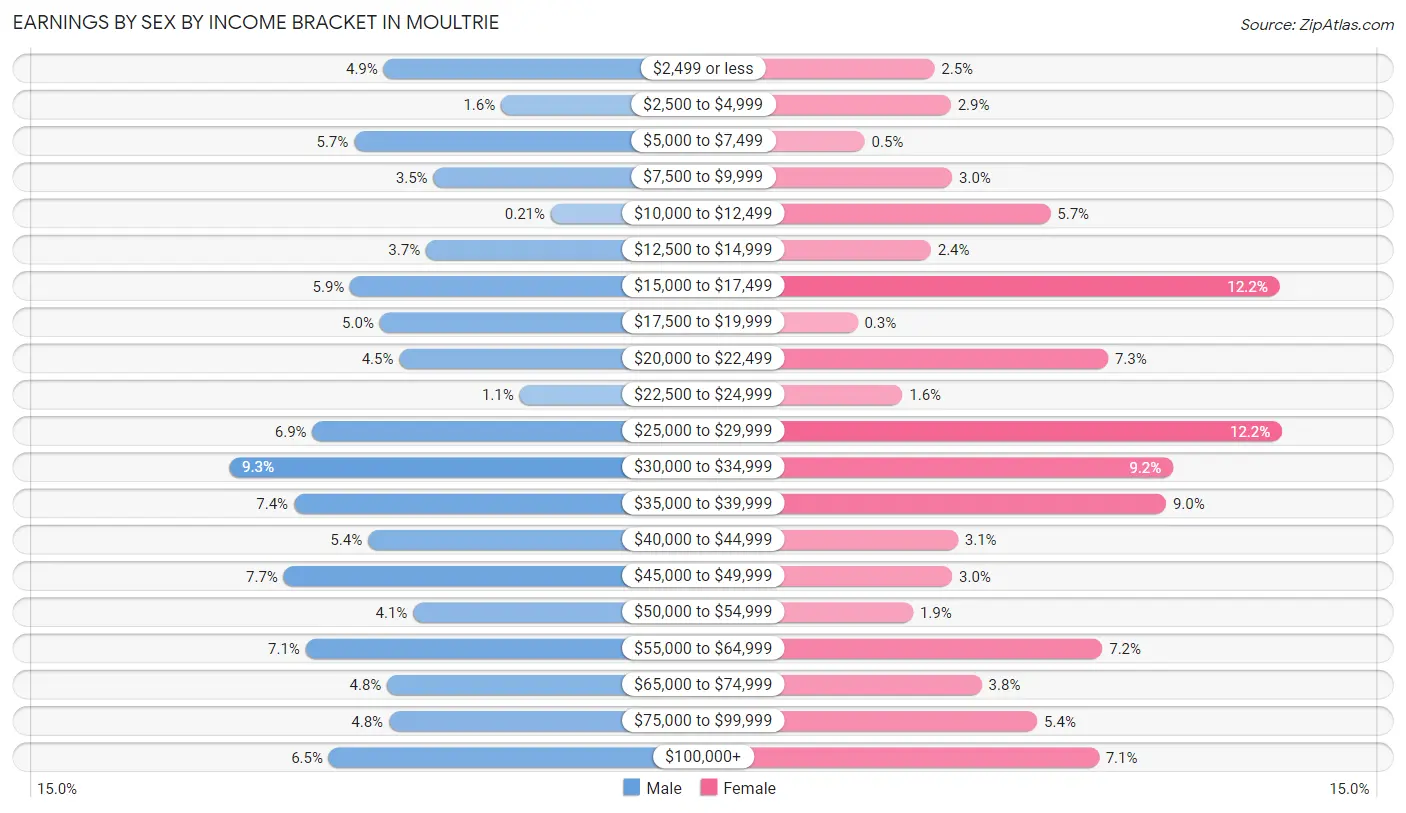
Earnings by Sex by Income Bracket in Moultrie
The most common earnings brackets in Moultrie are $30,000 to $34,999 for men (356 | 9.2%) and $25,000 to $29,999 for women (368 | 12.2%).
| Income | Male | Female |
| $2,499 or less | 189 (4.9%) | 74 (2.5%) |
| $2,500 to $4,999 | 62 (1.6%) | 88 (2.9%) |
| $5,000 to $7,499 | 221 (5.7%) | 15 (0.5%) |
| $7,500 to $9,999 | 135 (3.5%) | 89 (3.0%) |
| $10,000 to $12,499 | 8 (0.2%) | 172 (5.7%) |
| $12,500 to $14,999 | 143 (3.7%) | 71 (2.4%) |
| $15,000 to $17,499 | 225 (5.9%) | 366 (12.2%) |
| $17,500 to $19,999 | 193 (5.0%) | 9 (0.3%) |
| $20,000 to $22,499 | 172 (4.5%) | 221 (7.3%) |
| $22,500 to $24,999 | 42 (1.1%) | 47 (1.6%) |
| $25,000 to $29,999 | 266 (6.9%) | 368 (12.2%) |
| $30,000 to $34,999 | 356 (9.2%) | 276 (9.2%) |
| $35,000 to $39,999 | 286 (7.4%) | 270 (9.0%) |
| $40,000 to $44,999 | 206 (5.3%) | 94 (3.1%) |
| $45,000 to $49,999 | 297 (7.7%) | 89 (3.0%) |
| $50,000 to $54,999 | 157 (4.1%) | 56 (1.9%) |
| $55,000 to $64,999 | 273 (7.1%) | 216 (7.2%) |
| $65,000 to $74,999 | 185 (4.8%) | 114 (3.8%) |
| $75,000 to $99,999 | 183 (4.8%) | 161 (5.3%) |
| $100,000+ | 248 (6.5%) | 213 (7.1%) |
| Total | 3,847 (100.0%) | 3,009 (100.0%) |
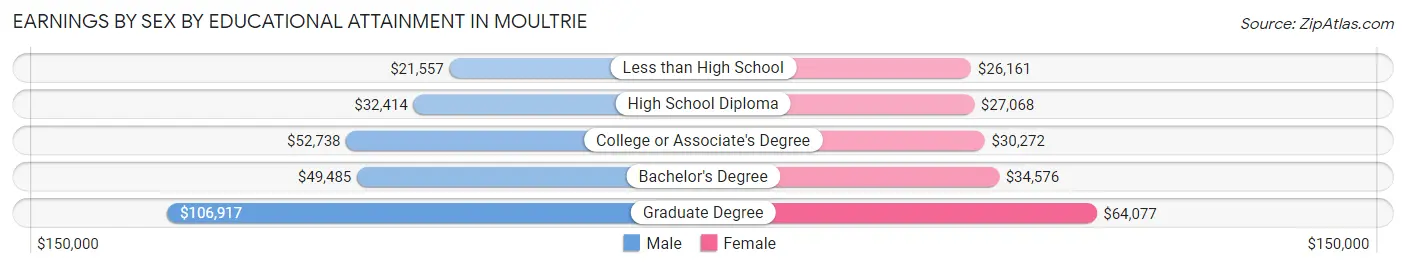
Earnings by Sex by Educational Attainment in Moultrie
Average earnings in Moultrie are $38,494 for men and $31,654 for women, a difference of 17.8%. Men with an educational attainment of graduate degree enjoy the highest average annual earnings of $106,917, while those with less than high school education earn the least with $21,557. Women with an educational attainment of graduate degree earn the most with the average annual earnings of $64,077, while those with less than high school education have the smallest earnings of $26,161.
| Educational Attainment | Male Income | Female Income |
| Less than High School | $21,557 | $26,161 |
| High School Diploma | $32,414 | $27,068 |
| College or Associate's Degree | $52,738 | $30,272 |
| Bachelor's Degree | $49,485 | $34,576 |
| Graduate Degree | $106,917 | $64,077 |
| Total | $38,494 | $31,654 |
Family Income in Moultrie
Family Income Brackets in Moultrie
According to the Moultrie family income data, there are 526 families falling into the $35,000 to $49,999 income range, which is the most common income bracket and makes up 16.3% of all families. Conversely, the $10,000 to $14,999 income bracket is the least frequent group with only 155 families (4.8%) belonging to this category.
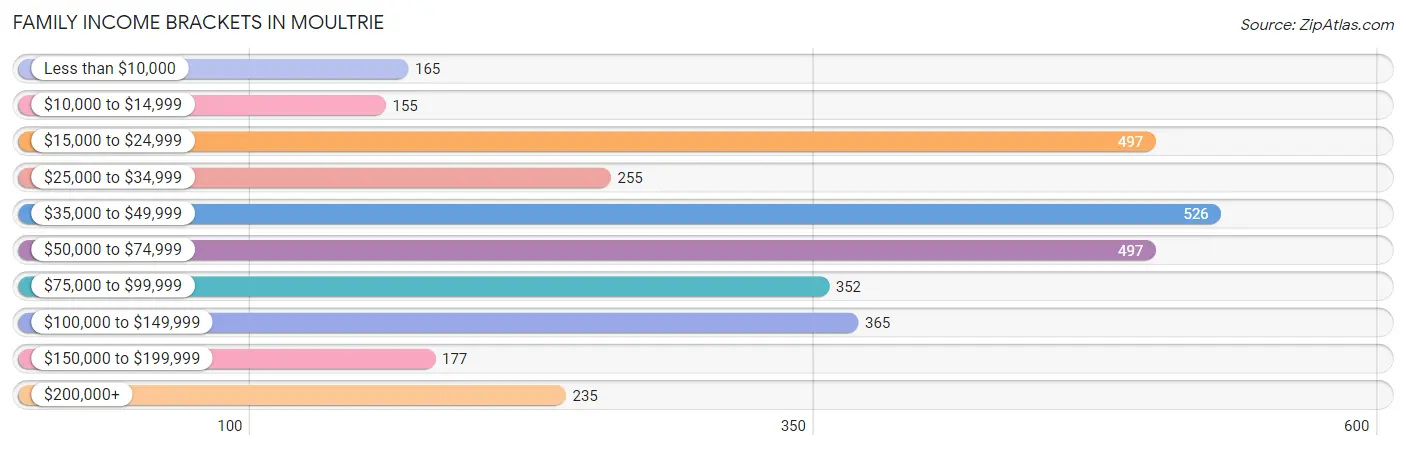
| Income Bracket | # Families | % Families |
| Less than $10,000 | 165 | 5.1% |
| $10,000 to $14,999 | 155 | 4.8% |
| $15,000 to $24,999 | 497 | 15.4% |
| $25,000 to $34,999 | 255 | 7.9% |
| $35,000 to $49,999 | 526 | 16.3% |
| $50,000 to $74,999 | 497 | 15.4% |
| $75,000 to $99,999 | 352 | 10.9% |
| $100,000 to $149,999 | 365 | 11.3% |
| $150,000 to $199,999 | 177 | 5.5% |
| $200,000+ | 235 | 7.3% |
Family Income by Famaliy Size in Moultrie
5-person families (301 | 9.3%) account for the highest median family income in Moultrie with $73,911 per family, while 2-person families (1,538 | 47.7%) have the highest median income of $23,518 per family member.
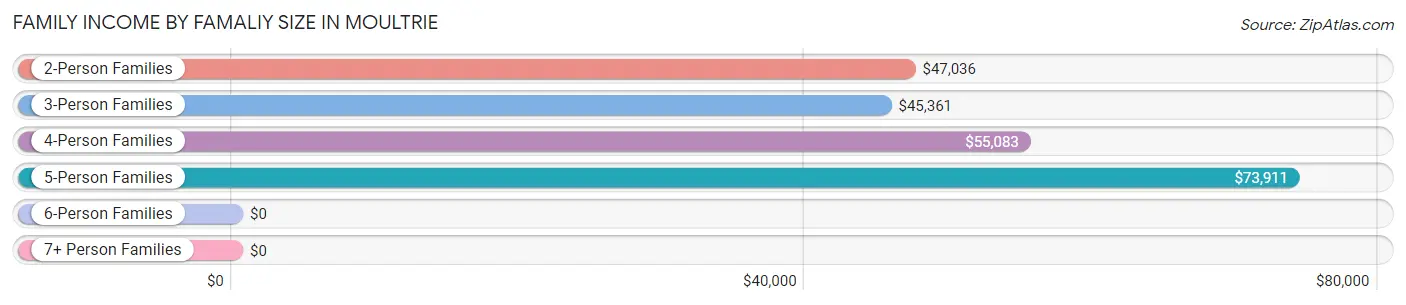
| Income Bracket | # Families | Median Income |
| 2-Person Families | 1,538 (47.7%) | $47,036 |
| 3-Person Families | 639 (19.8%) | $45,361 |
| 4-Person Families | 521 (16.2%) | $55,083 |
| 5-Person Families | 301 (9.3%) | $73,911 |
| 6-Person Families | 144 (4.5%) | $0 |
| 7+ Person Families | 83 (2.6%) | $0 |
| Total | 3,226 (100.0%) | $50,915 |
Family Income by Number of Earners in Moultrie
The median family income in Moultrie is $50,915, with families comprising 3+ earners (249) having the highest median family income of $140,179, while families with no earners (591) have the lowest median family income of $24,649, accounting for 7.7% and 18.3% of families, respectively.
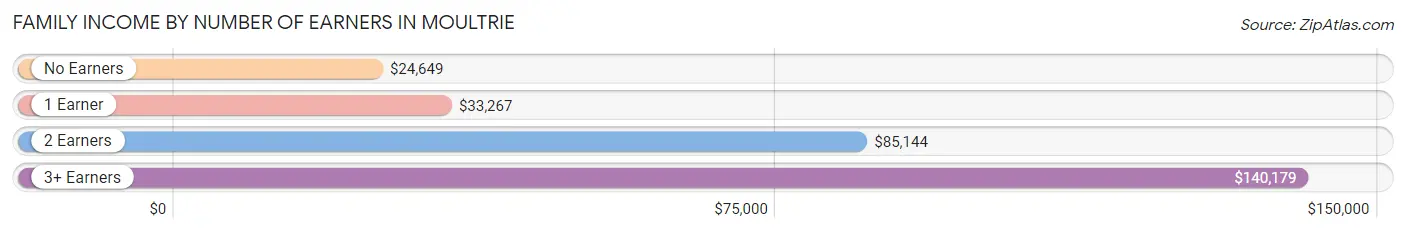
| Number of Earners | # Families | Median Income |
| No Earners | 591 (18.3%) | $24,649 |
| 1 Earner | 1,191 (36.9%) | $33,267 |
| 2 Earners | 1,195 (37.0%) | $85,144 |
| 3+ Earners | 249 (7.7%) | $140,179 |
| Total | 3,226 (100.0%) | $50,915 |
Household Income in Moultrie
Household Income Brackets in Moultrie
With 1,218 households falling in the category, the $15,000 to $24,999 income range is the most frequent in Moultrie, accounting for 21.2% of all households. In contrast, only 236 households (4.1%) fall into the $200,000+ income bracket, making it the least populous group.
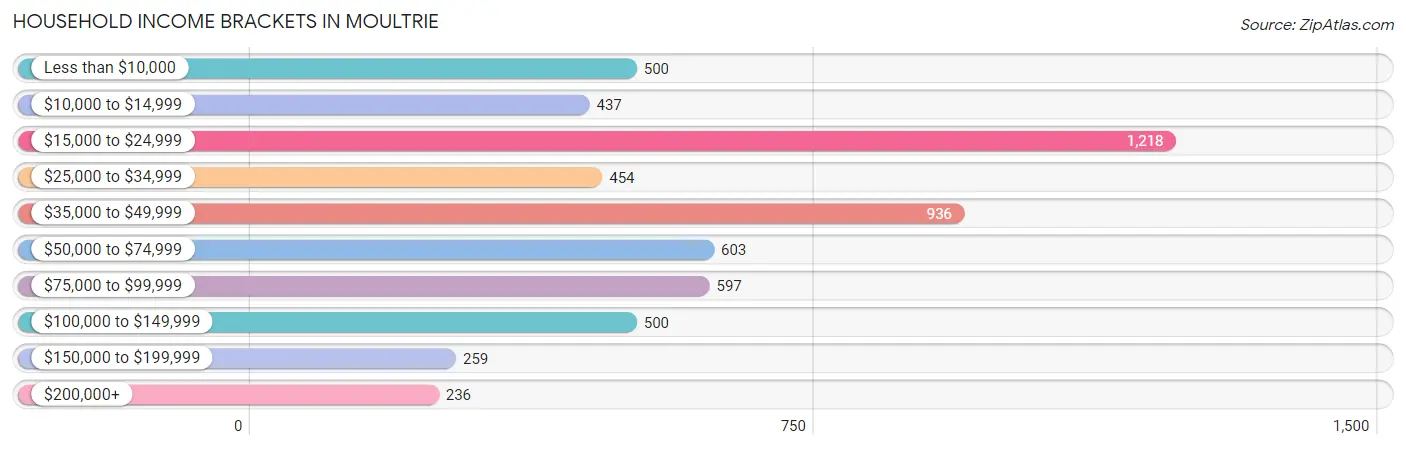
| Income Bracket | # Households | % Households |
| Less than $10,000 | 500 | 8.7% |
| $10,000 to $14,999 | 437 | 7.6% |
| $15,000 to $24,999 | 1,218 | 21.2% |
| $25,000 to $34,999 | 454 | 7.9% |
| $35,000 to $49,999 | 936 | 16.3% |
| $50,000 to $74,999 | 603 | 10.5% |
| $75,000 to $99,999 | 597 | 10.4% |
| $100,000 to $149,999 | 500 | 8.7% |
| $150,000 to $199,999 | 259 | 4.5% |
| $200,000+ | 236 | 4.1% |
Household Income by Householder Age in Moultrie
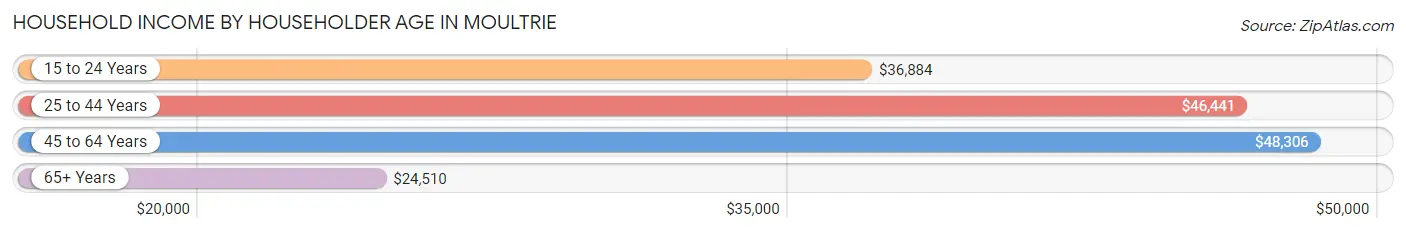
The median household income in Moultrie is $41,228, with the highest median household income of $48,306 found in the 45 to 64 years age bracket for the primary householder. A total of 1,562 households (27.2%) fall into this category. Meanwhile, the 65+ years age bracket for the primary householder has the lowest median household income of $24,510, with 1,759 households (30.6%) in this group.
| Income Bracket | # Households | Median Income |
| 15 to 24 Years | 451 (7.9%) | $36,884 |
| 25 to 44 Years | 1,973 (34.3%) | $46,441 |
| 45 to 64 Years | 1,562 (27.2%) | $48,306 |
| 65+ Years | 1,759 (30.6%) | $24,510 |
| Total | 5,745 (100.0%) | $41,228 |
Poverty in Moultrie
Income Below Poverty by Sex and Age in Moultrie
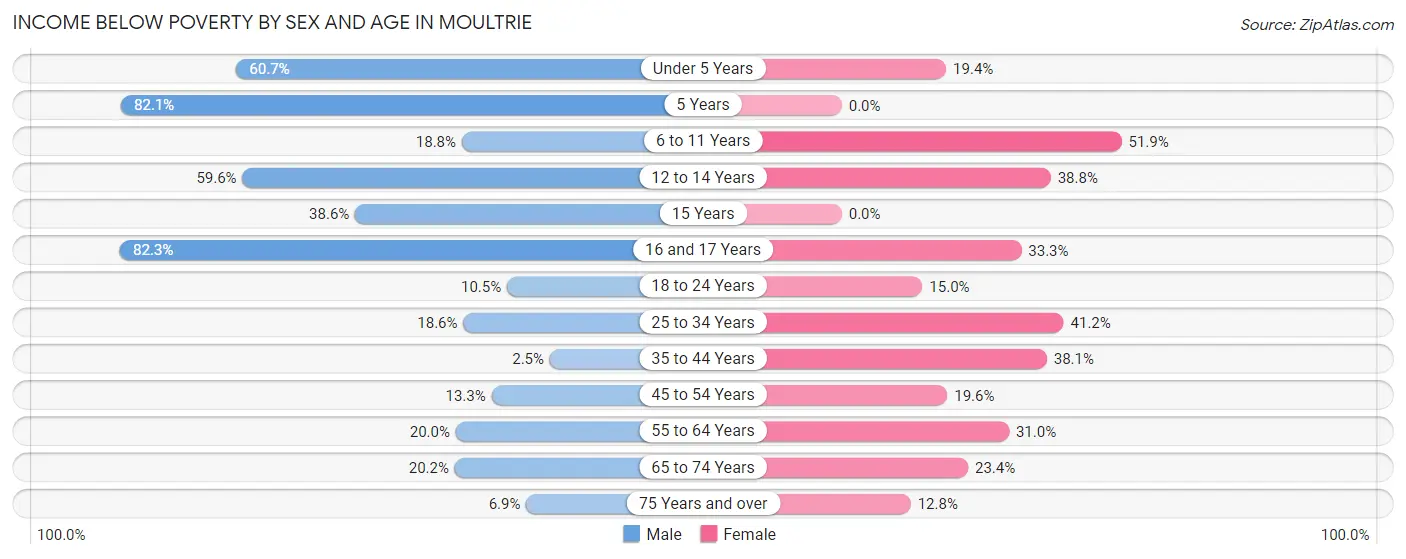
With 21.5% poverty level for males and 28.5% for females among the residents of Moultrie, 16 and 17 year old males and 6 to 11 year old females are the most vulnerable to poverty, with 167 males (82.3%) and 284 females (51.9%) in their respective age groups living below the poverty level.
| Age Bracket | Male | Female |
| Under 5 Years | 267 (60.7%) | 105 (19.4%) |
| 5 Years | 101 (82.1%) | 0 (0.0%) |
| 6 to 11 Years | 137 (18.8%) | 284 (51.9%) |
| 12 to 14 Years | 134 (59.6%) | 102 (38.8%) |
| 15 Years | 51 (38.6%) | 0 (0.0%) |
| 16 and 17 Years | 167 (82.3%) | 21 (33.3%) |
| 18 to 24 Years | 109 (10.4%) | 121 (15.0%) |
| 25 to 34 Years | 167 (18.6%) | 331 (41.2%) |
| 35 to 44 Years | 22 (2.5%) | 425 (38.1%) |
| 45 to 54 Years | 114 (13.3%) | 164 (19.6%) |
| 55 to 64 Years | 107 (20.0%) | 189 (31.0%) |
| 65 to 74 Years | 138 (20.2%) | 158 (23.4%) |
| 75 Years and over | 29 (6.9%) | 74 (12.8%) |
| Total | 1,543 (21.5%) | 1,974 (28.5%) |
Income Above Poverty by Sex and Age in Moultrie
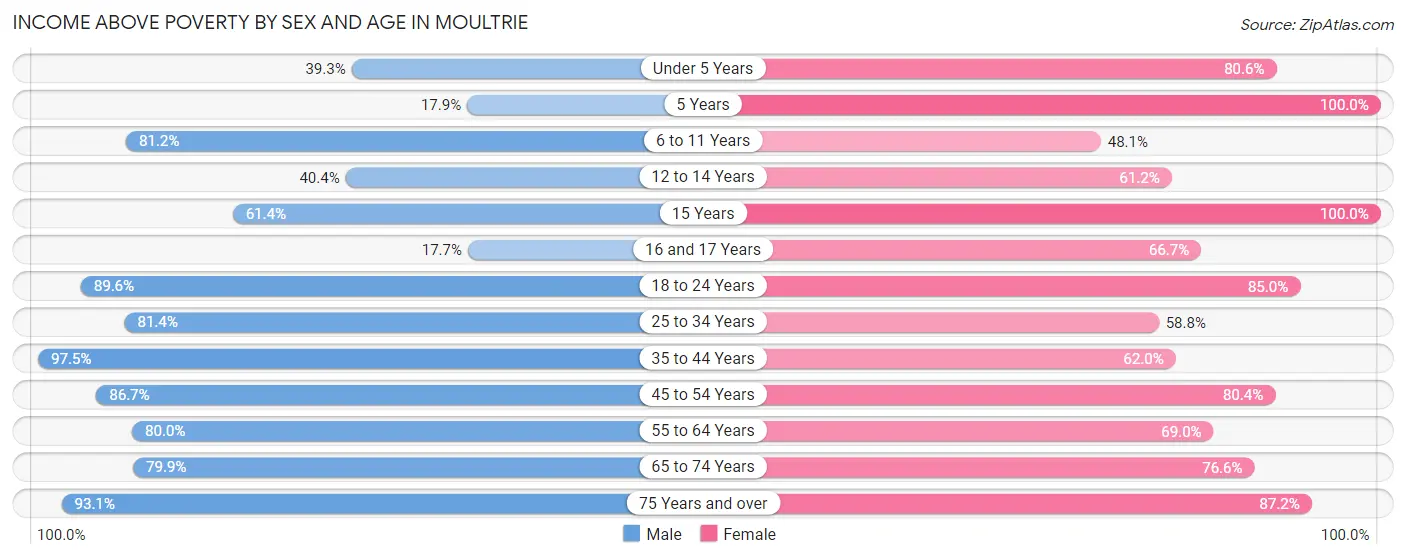
According to the poverty statistics in Moultrie, males aged 35 to 44 years and females aged 5 years are the age groups that are most secure financially, with 97.5% of males and 100.0% of females in these age groups living above the poverty line.
| Age Bracket | Male | Female |
| Under 5 Years | 173 (39.3%) | 437 (80.6%) |
| 5 Years | 22 (17.9%) | 18 (100.0%) |
| 6 to 11 Years | 590 (81.2%) | 263 (48.1%) |
| 12 to 14 Years | 91 (40.4%) | 161 (61.2%) |
| 15 Years | 81 (61.4%) | 68 (100.0%) |
| 16 and 17 Years | 36 (17.7%) | 42 (66.7%) |
| 18 to 24 Years | 934 (89.5%) | 688 (85.0%) |
| 25 to 34 Years | 733 (81.4%) | 473 (58.8%) |
| 35 to 44 Years | 857 (97.5%) | 692 (62.0%) |
| 45 to 54 Years | 741 (86.7%) | 673 (80.4%) |
| 55 to 64 Years | 429 (80.0%) | 420 (69.0%) |
| 65 to 74 Years | 547 (79.8%) | 516 (76.6%) |
| 75 Years and over | 393 (93.1%) | 504 (87.2%) |
| Total | 5,627 (78.5%) | 4,955 (71.5%) |
Income Below Poverty Among Married-Couple Families in Moultrie
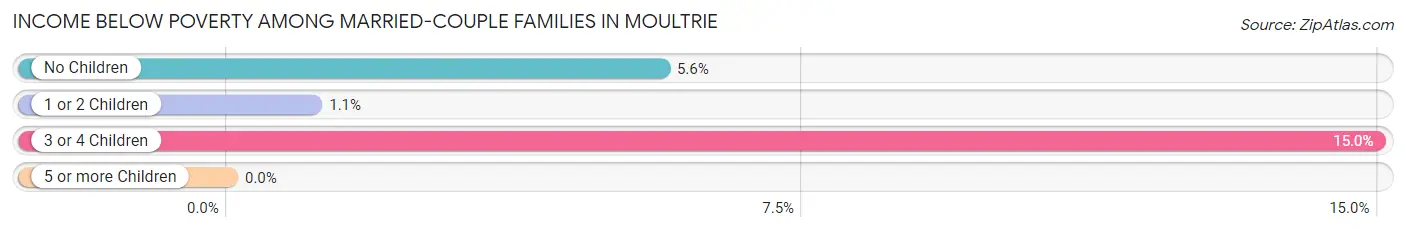
The poverty statistics for married-couple families in Moultrie show that 5.5% or 88 of the total 1,595 families live below the poverty line. Families with 3 or 4 children have the highest poverty rate of 15.0%, comprising of 31 families. On the other hand, families with 5 or more children have the lowest poverty rate of 0.0%, which includes 0 families.
| Children | Above Poverty | Below Poverty |
| No Children | 870 (94.4%) | 52 (5.6%) |
| 1 or 2 Children | 448 (98.9%) | 5 (1.1%) |
| 3 or 4 Children | 176 (85.0%) | 31 (15.0%) |
| 5 or more Children | 13 (100.0%) | 0 (0.0%) |
| Total | 1,507 (94.5%) | 88 (5.5%) |
Income Below Poverty Among Single-Parent Households in Moultrie
According to the poverty data in Moultrie, 13.5% or 60 single-father households and 44.5% or 529 single-mother households are living below the poverty line. Among single-father households, those with 3 or 4 children have the highest poverty rate, with 20 households (50.0%) experiencing poverty. Likewise, among single-mother households, those with 5 or more children have the highest poverty rate, with 59 households (100.0%) falling below the poverty line.
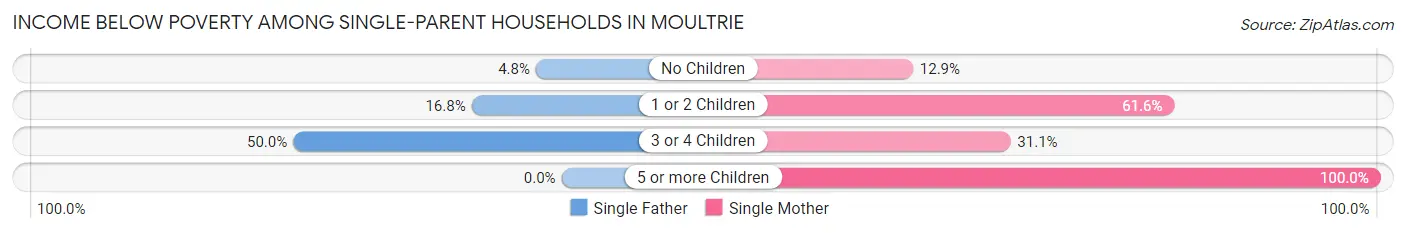
| Children | Single Father | Single Mother |
| No Children | 11 (4.8%) | 49 (12.9%) |
| 1 or 2 Children | 29 (16.8%) | 380 (61.6%) |
| 3 or 4 Children | 20 (50.0%) | 41 (31.1%) |
| 5 or more Children | 0 (0.0%) | 59 (100.0%) |
| Total | 60 (13.5%) | 529 (44.5%) |
Income Below Poverty Among Married-Couple vs Single-Parent Households in Moultrie
The poverty data for Moultrie shows that 88 of the married-couple family households (5.5%) and 589 of the single-parent households (36.1%) are living below the poverty level. Within the married-couple family households, those with 3 or 4 children have the highest poverty rate, with 31 households (15.0%) falling below the poverty line. Among the single-parent households, those with 5 or more children have the highest poverty rate, with 59 household (100.0%) living below poverty.
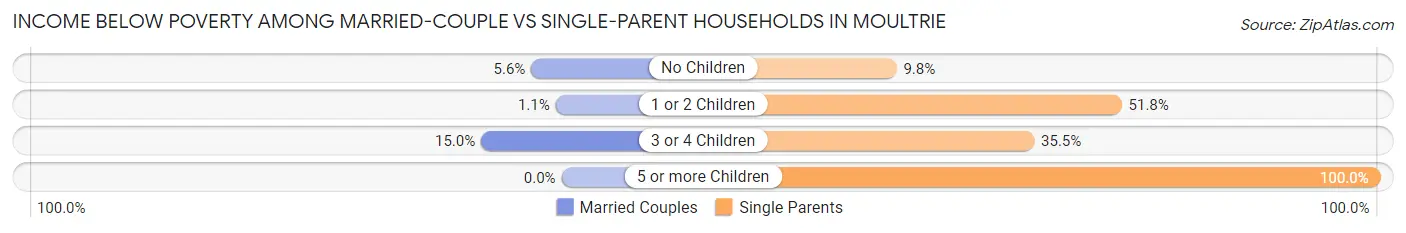
| Children | Married-Couple Families | Single-Parent Households |
| No Children | 52 (5.6%) | 60 (9.8%) |
| 1 or 2 Children | 5 (1.1%) | 409 (51.8%) |
| 3 or 4 Children | 31 (15.0%) | 61 (35.5%) |
| 5 or more Children | 0 (0.0%) | 59 (100.0%) |
| Total | 88 (5.5%) | 589 (36.1%) |
Race in Moultrie
The most populous races in Moultrie are Black / African American (6,806 | 46.8%), White / Caucasian (6,717 | 46.2%), and Hispanic or Latino (1,492 | 10.3%).
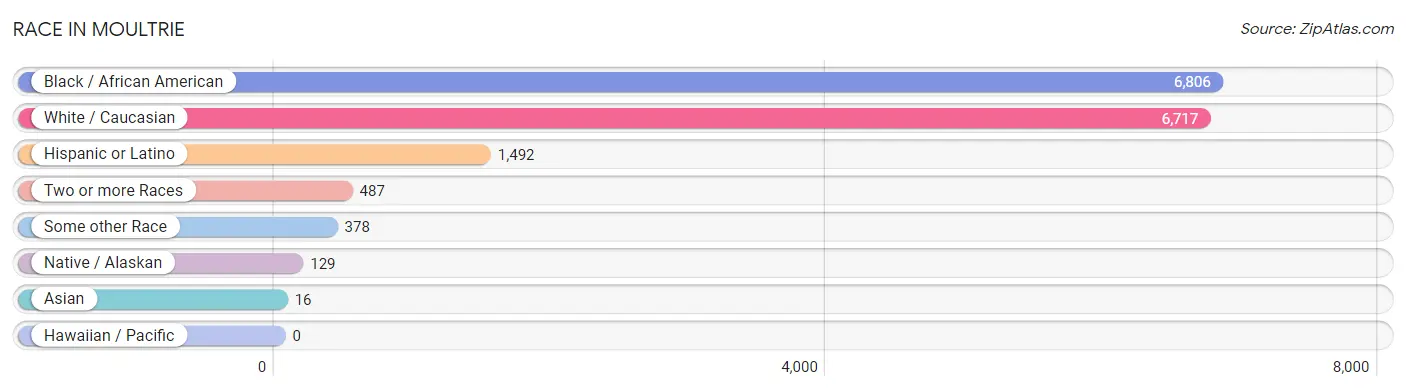
| Race | # Population | % Population |
| Asian | 16 | 0.1% |
| Black / African American | 6,806 | 46.8% |
| Hawaiian / Pacific | 0 | 0.0% |
| Hispanic or Latino | 1,492 | 10.3% |
| Native / Alaskan | 129 | 0.9% |
| White / Caucasian | 6,717 | 46.2% |
| Two or more Races | 487 | 3.4% |
| Some other Race | 378 | 2.6% |
| Total | 14,533 | 100.0% |
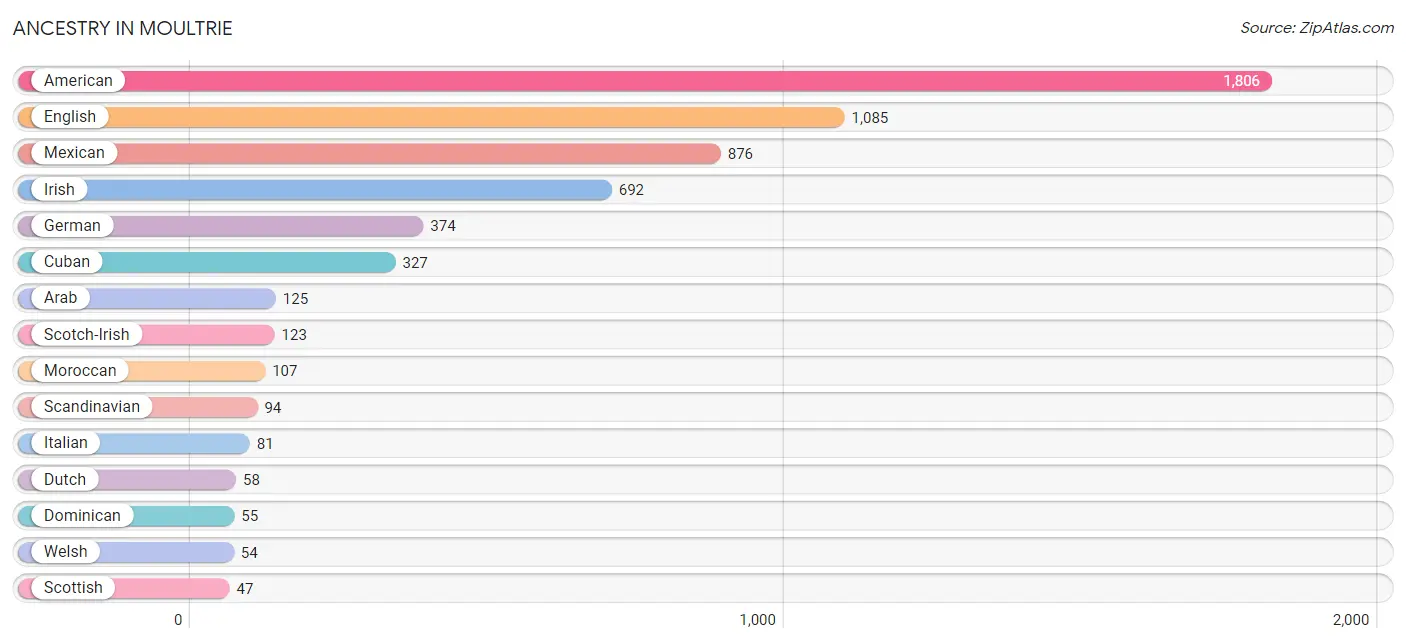
Ancestry in Moultrie
The most populous ancestries reported in Moultrie are American (1,806 | 12.4%), English (1,085 | 7.5%), Mexican (876 | 6.0%), Irish (692 | 4.8%), and German (374 | 2.6%), together accounting for 33.3% of all Moultrie residents.
| Ancestry | # Population | % Population |
| African | 18 | 0.1% |
| American | 1,806 | 12.4% |
| Arab | 125 | 0.9% |
| Austrian | 5 | 0.0% |
| Brazilian | 6 | 0.0% |
| British | 37 | 0.3% |
| Canadian | 16 | 0.1% |
| Central American | 31 | 0.2% |
| Cherokee | 44 | 0.3% |
| Cuban | 327 | 2.2% |
| Dominican | 55 | 0.4% |
| Dutch | 58 | 0.4% |
| Ecuadorian | 7 | 0.1% |
| English | 1,085 | 7.5% |
| European | 35 | 0.2% |
| Finnish | 35 | 0.2% |
| French | 29 | 0.2% |
| German | 374 | 2.6% |
| Irish | 692 | 4.8% |
| Italian | 81 | 0.6% |
| Lebanese | 18 | 0.1% |
| Lithuanian | 17 | 0.1% |
| Mexican | 876 | 6.0% |
| Mexican American Indian | 22 | 0.2% |
| Moroccan | 107 | 0.7% |
| Nicaraguan | 31 | 0.2% |
| Northern European | 7 | 0.1% |
| Norwegian | 21 | 0.1% |
| Polish | 38 | 0.3% |
| Portuguese | 22 | 0.2% |
| Puerto Rican | 6 | 0.0% |
| Russian | 4 | 0.0% |
| Scandinavian | 94 | 0.6% |
| Scotch-Irish | 123 | 0.9% |
| Scottish | 47 | 0.3% |
| South American | 7 | 0.1% |
| Spanish | 47 | 0.3% |
| Sri Lankan | 16 | 0.1% |
| Subsaharan African | 18 | 0.1% |
| Swedish | 31 | 0.2% |
| Swiss | 8 | 0.1% |
| Syrian | 9 | 0.1% |
| Welsh | 54 | 0.4% | View All 43 Rows |
Immigrants in Moultrie
The most numerous immigrant groups reported in Moultrie came from Latin America (857 | 5.9%), Central America (452 | 3.1%), Mexico (421 | 2.9%), Caribbean (398 | 2.7%), and Cuba (344 | 2.4%), together accounting for 17.0% of all Moultrie residents.
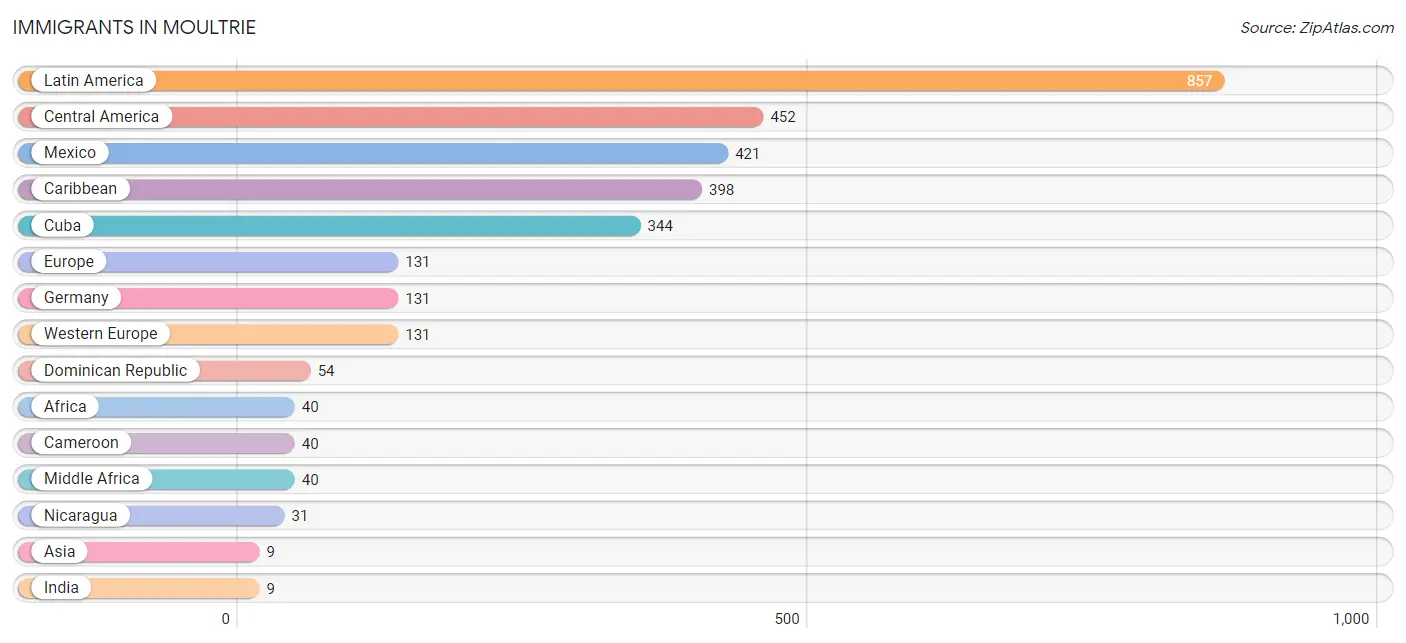
| Immigration Origin | # Population | % Population |
| Africa | 40 | 0.3% |
| Asia | 9 | 0.1% |
| Cameroon | 40 | 0.3% |
| Caribbean | 398 | 2.7% |
| Central America | 452 | 3.1% |
| Cuba | 344 | 2.4% |
| Dominican Republic | 54 | 0.4% |
| Ecuador | 7 | 0.1% |
| Europe | 131 | 0.9% |
| Germany | 131 | 0.9% |
| India | 9 | 0.1% |
| Latin America | 857 | 5.9% |
| Mexico | 421 | 2.9% |
| Middle Africa | 40 | 0.3% |
| Nicaragua | 31 | 0.2% |
| South America | 7 | 0.1% |
| South Central Asia | 9 | 0.1% |
| Western Europe | 131 | 0.9% | View All 18 Rows |
Sex and Age in Moultrie
Sex and Age in Moultrie
The most populous age groups in Moultrie are 20 to 24 Years (717 | 9.6%) for men and 35 to 39 Years (789 | 11.2%) for women.
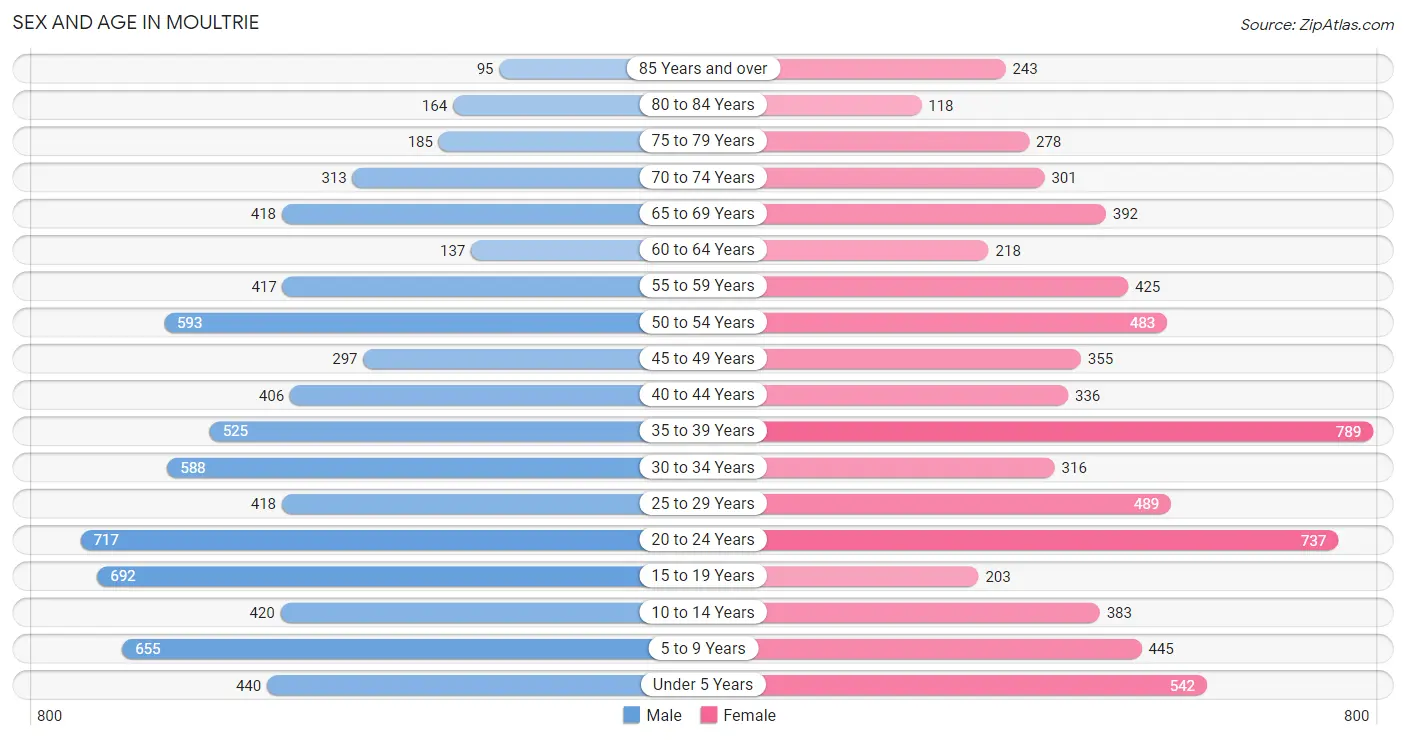
| Age Bracket | Male | Female |
| Under 5 Years | 440 (5.9%) | 542 (7.7%) |
| 5 to 9 Years | 655 (8.8%) | 445 (6.3%) |
| 10 to 14 Years | 420 (5.6%) | 383 (5.4%) |
| 15 to 19 Years | 692 (9.2%) | 203 (2.9%) |
| 20 to 24 Years | 717 (9.6%) | 737 (10.4%) |
| 25 to 29 Years | 418 (5.6%) | 489 (6.9%) |
| 30 to 34 Years | 588 (7.9%) | 316 (4.5%) |
| 35 to 39 Years | 525 (7.0%) | 789 (11.2%) |
| 40 to 44 Years | 406 (5.4%) | 336 (4.8%) |
| 45 to 49 Years | 297 (4.0%) | 355 (5.0%) |
| 50 to 54 Years | 593 (7.9%) | 483 (6.9%) |
| 55 to 59 Years | 417 (5.6%) | 425 (6.0%) |
| 60 to 64 Years | 137 (1.8%) | 218 (3.1%) |
| 65 to 69 Years | 418 (5.6%) | 392 (5.6%) |
| 70 to 74 Years | 313 (4.2%) | 301 (4.3%) |
| 75 to 79 Years | 185 (2.5%) | 278 (3.9%) |
| 80 to 84 Years | 164 (2.2%) | 118 (1.7%) |
| 85 Years and over | 95 (1.3%) | 243 (3.5%) |
| Total | 7,480 (100.0%) | 7,053 (100.0%) |
Families and Households in Moultrie
Median Family Size in Moultrie
The median family size in Moultrie is 3.26 persons per family, with married-couple families (1,595 | 49.4%) accounting for the largest median family size of 3.28 persons per family. On the other hand, single male/father families (443 | 13.7%) represent the smallest median family size with 3.09 persons per family.
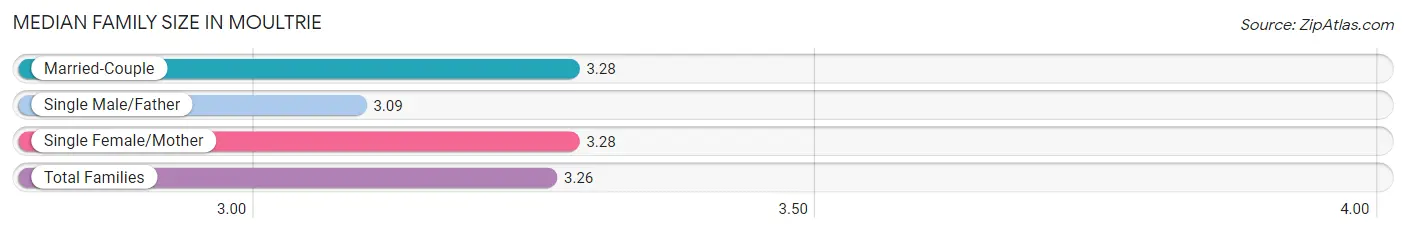
| Family Type | # Families | Family Size |
| Married-Couple | 1,595 (49.4%) | 3.28 |
| Single Male/Father | 443 (13.7%) | 3.09 |
| Single Female/Mother | 1,188 (36.8%) | 3.28 |
| Total Families | 3,226 (100.0%) | 3.26 |
Median Household Size in Moultrie
The median household size in Moultrie is 2.44 persons per household, with single female/mother households (1,188 | 20.7%) accounting for the largest median household size of 3.38 persons per household. non-family households (2,519 | 43.9%) represent the smallest median household size with 1.28 persons per household.
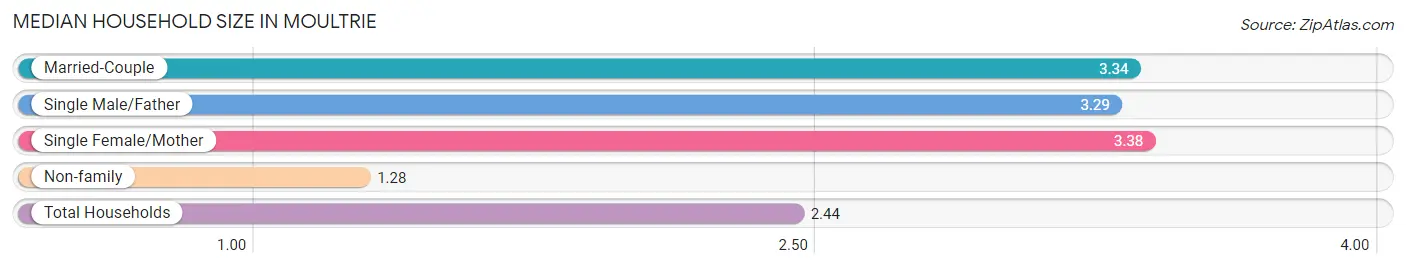
| Household Type | # Households | Household Size |
| Married-Couple | 1,595 (27.8%) | 3.34 |
| Single Male/Father | 443 (7.7%) | 3.29 |
| Single Female/Mother | 1,188 (20.7%) | 3.38 |
| Non-family | 2,519 (43.9%) | 1.28 |
| Total Households | 5,745 (100.0%) | 2.44 |
Household Size by Marriage Status in Moultrie
Out of a total of 5,745 households in Moultrie, 3,226 (56.1%) are family households, while 2,519 (43.9%) are nonfamily households. The most numerous type of family households are 2-person households, comprising 1,449, and the most common type of nonfamily households are 1-person households, comprising 1,979.
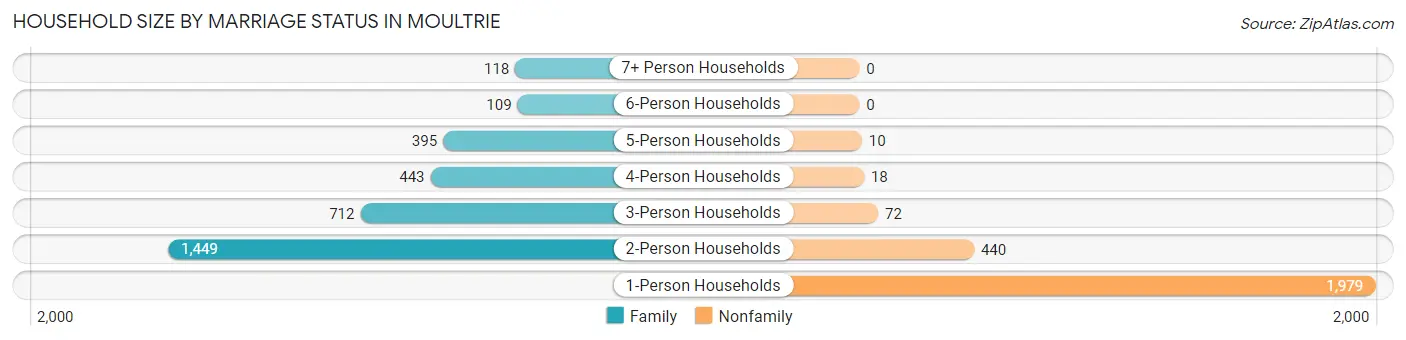
| Household Size | Family Households | Nonfamily Households |
| 1-Person Households | - | 1,979 (34.4%) |
| 2-Person Households | 1,449 (25.2%) | 440 (7.7%) |
| 3-Person Households | 712 (12.4%) | 72 (1.3%) |
| 4-Person Households | 443 (7.7%) | 18 (0.3%) |
| 5-Person Households | 395 (6.9%) | 10 (0.2%) |
| 6-Person Households | 109 (1.9%) | 0 (0.0%) |
| 7+ Person Households | 118 (2.1%) | 0 (0.0%) |
| Total | 3,226 (56.1%) | 2,519 (43.9%) |
Female Fertility in Moultrie
Fertility by Age in Moultrie
Average fertility rate in Moultrie is 66.0 births per 1,000 women. Women in the age bracket of 20 to 34 years have the highest fertility rate with 130.0 births per 1,000 women. Women in the age bracket of 20 to 34 years acount for 90.9% of all women with births.
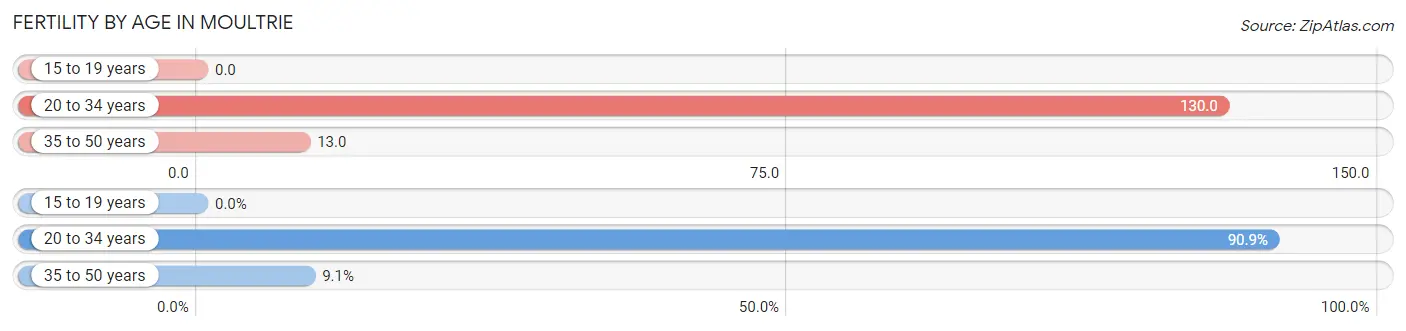
| Age Bracket | Women with Births | Births / 1,000 Women |
| 15 to 19 years | 0 (0.0%) | 0.0 |
| 20 to 34 years | 200 (90.9%) | 130.0 |
| 35 to 50 years | 20 (9.1%) | 13.0 |
| Total | 220 (100.0%) | 66.0 |
Fertility by Age by Marriage Status in Moultrie
61.8% of women with births (220) in Moultrie are married. The highest percentage of unmarried women with births falls into 20 to 34 years age bracket with 39.0% of them unmarried at the time of birth, while the lowest percentage of unmarried women with births belong to 35 to 50 years age bracket with 30.0% of them unmarried.
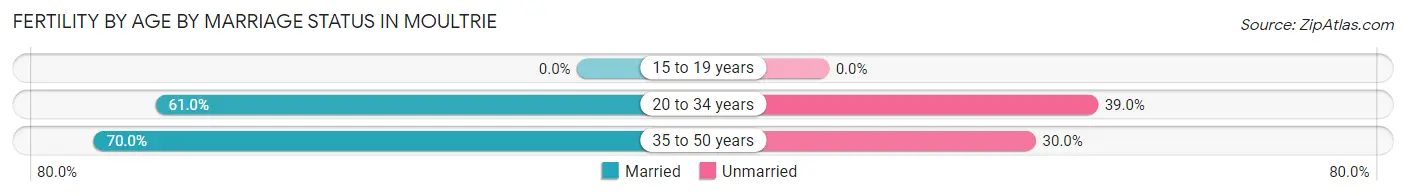
| Age Bracket | Married | Unmarried |
| 15 to 19 years | 0 (0.0%) | 0 (0.0%) |
| 20 to 34 years | 122 (61.0%) | 78 (39.0%) |
| 35 to 50 years | 14 (70.0%) | 6 (30.0%) |
| Total | 136 (61.8%) | 84 (38.2%) |
Fertility by Education in Moultrie
Average fertility rate in Moultrie is 66.0 births per 1,000 women. Women with the education attainment of graduate degree have the highest fertility rate of 187.0 births per 1,000 women, while women with the education attainment of less than high school have the lowest fertility at 10.0 births per 1,000 women. Women with the education attainment of college or associate's degree represent 45.5% of all women with births.
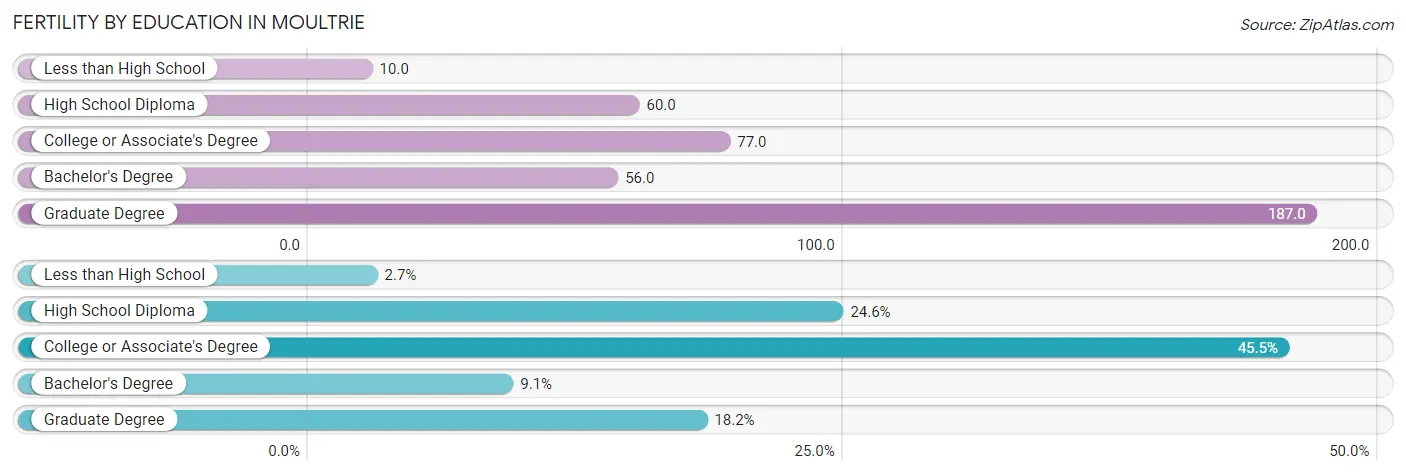
| Educational Attainment | Women with Births | Births / 1,000 Women |
| Less than High School | 6 (2.7%) | 10.0 |
| High School Diploma | 54 (24.5%) | 60.0 |
| College or Associate's Degree | 100 (45.5%) | 77.0 |
| Bachelor's Degree | 20 (9.1%) | 56.0 |
| Graduate Degree | 40 (18.2%) | 187.0 |
| Total | 220 (100.0%) | 66.0 |
Fertility by Education by Marriage Status in Moultrie
38.2% of women with births in Moultrie are unmarried. Women with the educational attainment of graduate degree are most likely to be married with 100.0% of them married at childbirth, while women with the educational attainment of less than high school are least likely to be married with 100.0% of them unmarried at childbirth.
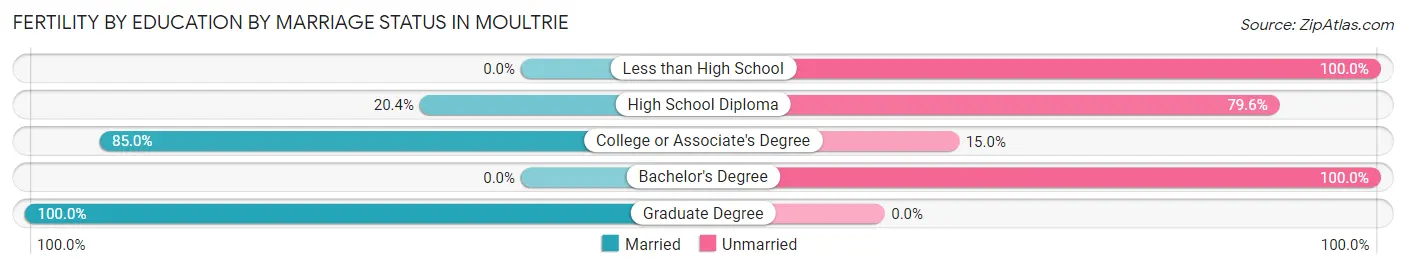
| Educational Attainment | Married | Unmarried |
| Less than High School | 0 (0.0%) | 6 (100.0%) |
| High School Diploma | 11 (20.4%) | 43 (79.6%) |
| College or Associate's Degree | 85 (85.0%) | 15 (15.0%) |
| Bachelor's Degree | 0 (0.0%) | 20 (100.0%) |
| Graduate Degree | 40 (100.0%) | 0 (0.0%) |
| Total | 136 (61.8%) | 84 (38.2%) |
Employment Characteristics in Moultrie
Employment by Class of Employer in Moultrie
Among the 5,975 employed individuals in Moultrie, private company employees (4,590 | 76.8%), local government employees (482 | 8.1%), and self-employed (not incorporated) (287 | 4.8%) make up the most common classes of employment.
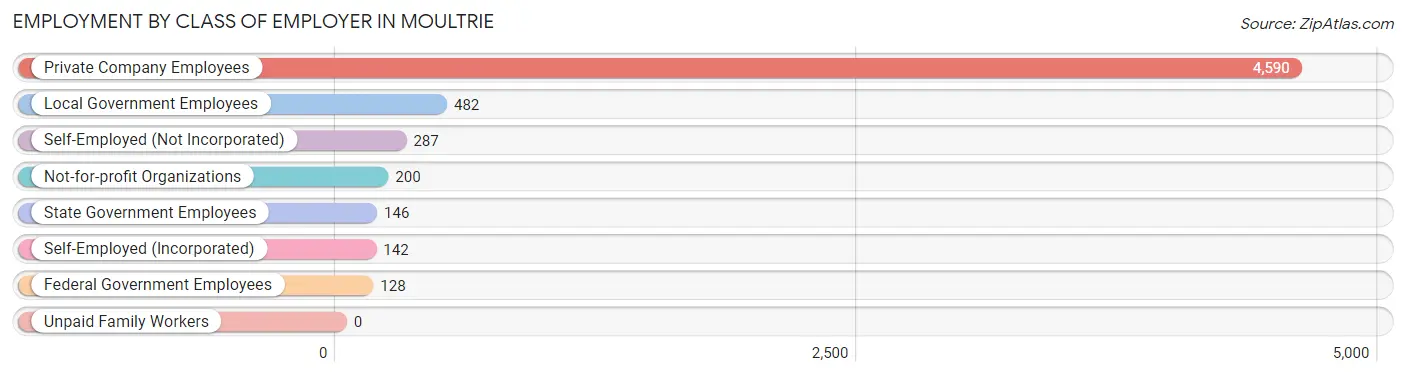
| Employer Class | # Employees | % Employees |
| Private Company Employees | 4,590 | 76.8% |
| Self-Employed (Incorporated) | 142 | 2.4% |
| Self-Employed (Not Incorporated) | 287 | 4.8% |
| Not-for-profit Organizations | 200 | 3.4% |
| Local Government Employees | 482 | 8.1% |
| State Government Employees | 146 | 2.4% |
| Federal Government Employees | 128 | 2.1% |
| Unpaid Family Workers | 0 | 0.0% |
| Total | 5,975 | 100.0% |
Employment Status by Age in Moultrie
According to the labor force statistics for Moultrie, out of the total population over 16 years of age (11,448), 58.4% or 6,686 individuals are in the labor force, with 8.3% or 555 of them unemployed. The age group with the highest labor force participation rate is 25 to 29 years, with 87.3% or 792 individuals in the labor force. Within the labor force, the 16 to 19 years age range has the highest percentage of unemployed individuals, with 41.6% or 112 of them being unemployed.
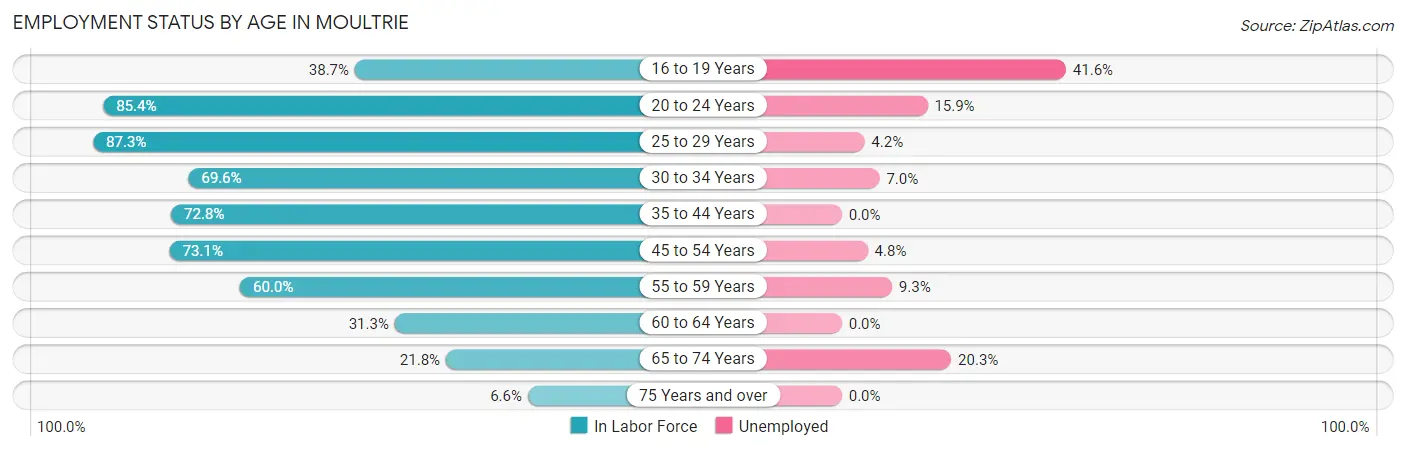
| Age Bracket | In Labor Force | Unemployed |
| 16 to 19 Years | 269 (38.7%) | 112 (41.6%) |
| 20 to 24 Years | 1,242 (85.4%) | 197 (15.9%) |
| 25 to 29 Years | 792 (87.3%) | 33 (4.2%) |
| 30 to 34 Years | 629 (69.6%) | 44 (7.0%) |
| 35 to 44 Years | 1,497 (72.8%) | 0 (0.0%) |
| 45 to 54 Years | 1,263 (73.1%) | 61 (4.8%) |
| 55 to 59 Years | 505 (60.0%) | 47 (9.3%) |
| 60 to 64 Years | 111 (31.3%) | 0 (0.0%) |
| 65 to 74 Years | 310 (21.8%) | 63 (20.3%) |
| 75 Years and over | 71 (6.6%) | 0 (0.0%) |
| Total | 6,686 (58.4%) | 555 (8.3%) |
Employment Status by Educational Attainment in Moultrie
According to labor force statistics for Moultrie, 70.6% of individuals (4,795) out of the total population between 25 and 64 years of age (6,792) are in the labor force, with 3.9% or 187 of them being unemployed. The group with the highest labor force participation rate are those with the educational attainment of bachelor's degree or higher, with 83.1% or 1,141 individuals in the labor force. Within the labor force, individuals with high school diploma education have the highest percentage of unemployment, with 8.7% or 158 of them being unemployed.
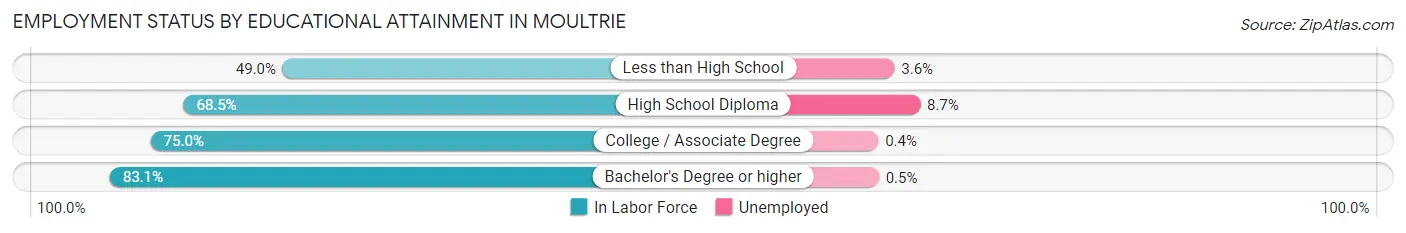
| Educational Attainment | In Labor Force | Unemployed |
| Less than High School | 448 (49.0%) | 33 (3.6%) |
| High School Diploma | 1,812 (68.5%) | 230 (8.7%) |
| College / Associate Degree | 1,395 (75.0%) | 7 (0.4%) |
| Bachelor's Degree or higher | 1,141 (83.1%) | 7 (0.5%) |
| Total | 4,795 (70.6%) | 265 (3.9%) |
Employment Occupations by Sex in Moultrie
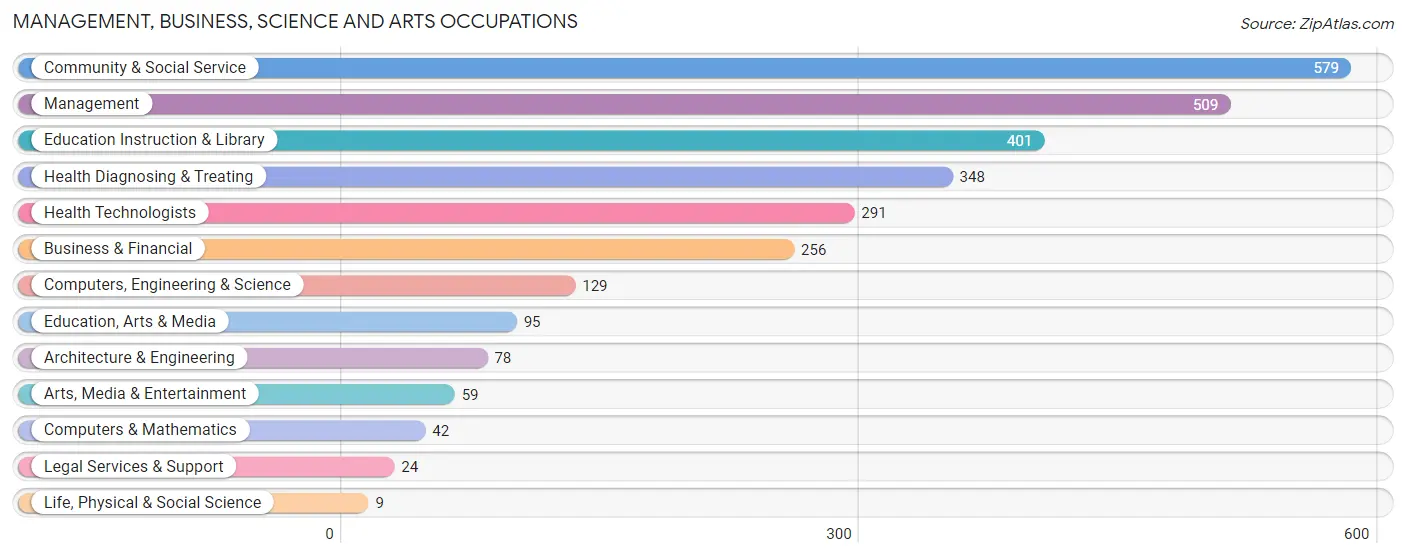
Management, Business, Science and Arts Occupations
The most common Management, Business, Science and Arts occupations in Moultrie are Community & Social Service (579 | 9.4%), Management (509 | 8.3%), Education Instruction & Library (401 | 6.5%), Health Diagnosing & Treating (348 | 5.7%), and Health Technologists (291 | 4.7%).
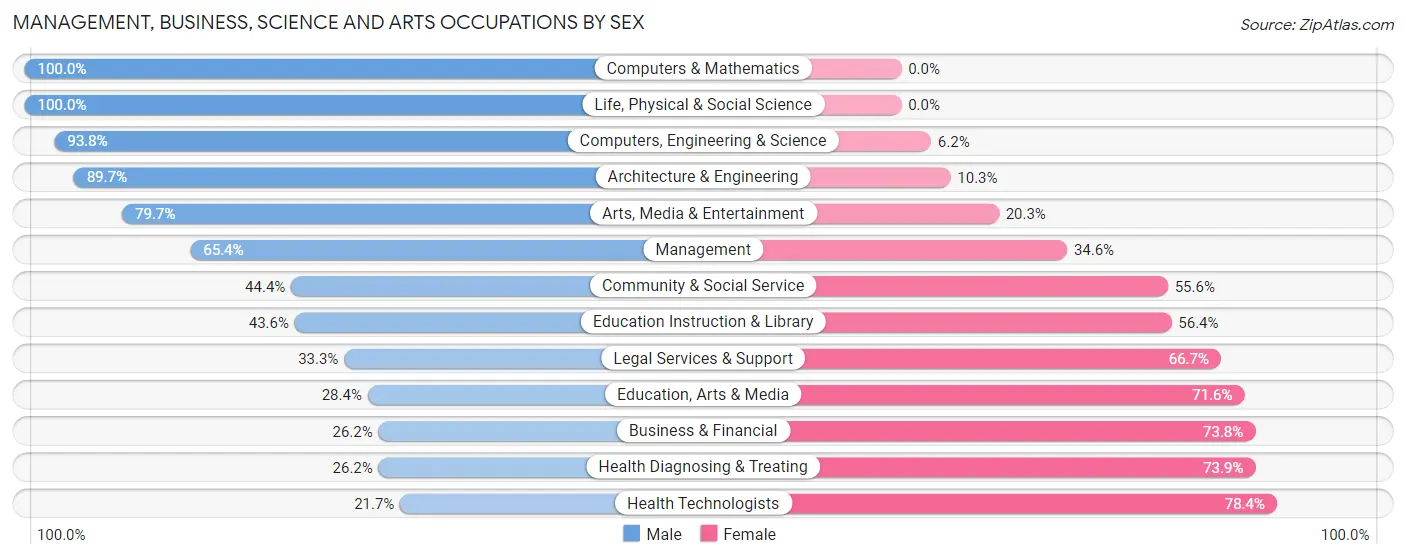
Management, Business, Science and Arts Occupations by Sex
Within the Management, Business, Science and Arts occupations in Moultrie, the most male-oriented occupations are Computers & Mathematics (100.0%), Life, Physical & Social Science (100.0%), and Computers, Engineering & Science (93.8%), while the most female-oriented occupations are Health Technologists (78.3%), Health Diagnosing & Treating (73.9%), and Business & Financial (73.8%).
| Occupation | Male | Female |
| Management | 333 (65.4%) | 176 (34.6%) |
| Business & Financial | 67 (26.2%) | 189 (73.8%) |
| Computers, Engineering & Science | 121 (93.8%) | 8 (6.2%) |
| Computers & Mathematics | 42 (100.0%) | 0 (0.0%) |
| Architecture & Engineering | 70 (89.7%) | 8 (10.3%) |
| Life, Physical & Social Science | 9 (100.0%) | 0 (0.0%) |
| Community & Social Service | 257 (44.4%) | 322 (55.6%) |
| Education, Arts & Media | 27 (28.4%) | 68 (71.6%) |
| Legal Services & Support | 8 (33.3%) | 16 (66.7%) |
| Education Instruction & Library | 175 (43.6%) | 226 (56.4%) |
| Arts, Media & Entertainment | 47 (79.7%) | 12 (20.3%) |
| Health Diagnosing & Treating | 91 (26.2%) | 257 (73.9%) |
| Health Technologists | 63 (21.6%) | 228 (78.3%) |
| Total (Category) | 869 (47.7%) | 952 (52.3%) |
| Total (Overall) | 3,300 (53.8%) | 2,833 (46.2%) |
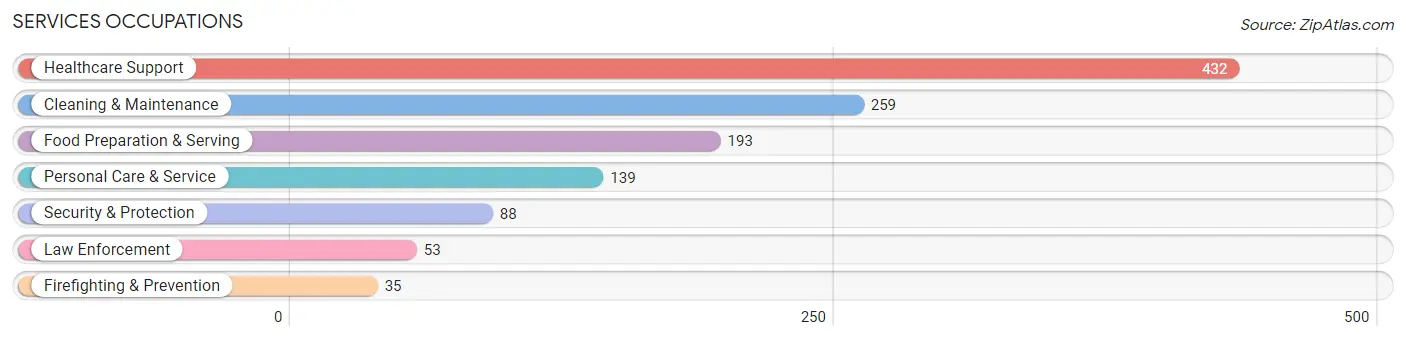
Services Occupations
The most common Services occupations in Moultrie are Healthcare Support (432 | 7.0%), Cleaning & Maintenance (259 | 4.2%), Food Preparation & Serving (193 | 3.2%), Personal Care & Service (139 | 2.3%), and Security & Protection (88 | 1.4%).
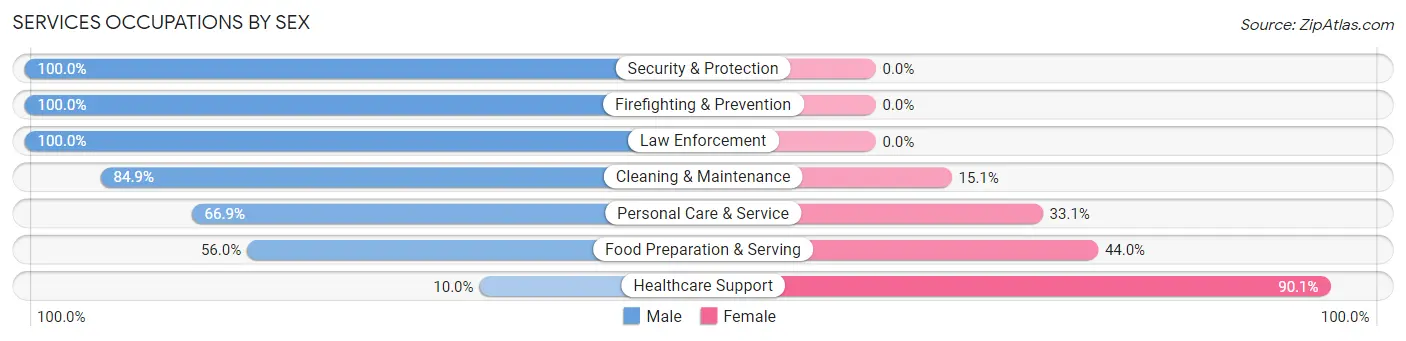
Services Occupations by Sex
Within the Services occupations in Moultrie, the most male-oriented occupations are Security & Protection (100.0%), Firefighting & Prevention (100.0%), and Law Enforcement (100.0%), while the most female-oriented occupations are Healthcare Support (90.0%), Food Preparation & Serving (44.0%), and Personal Care & Service (33.1%).
| Occupation | Male | Female |
| Healthcare Support | 43 (10.0%) | 389 (90.0%) |
| Security & Protection | 88 (100.0%) | 0 (0.0%) |
| Firefighting & Prevention | 35 (100.0%) | 0 (0.0%) |
| Law Enforcement | 53 (100.0%) | 0 (0.0%) |
| Food Preparation & Serving | 108 (56.0%) | 85 (44.0%) |
| Cleaning & Maintenance | 220 (84.9%) | 39 (15.1%) |
| Personal Care & Service | 93 (66.9%) | 46 (33.1%) |
| Total (Category) | 552 (49.7%) | 559 (50.3%) |
| Total (Overall) | 3,300 (53.8%) | 2,833 (46.2%) |
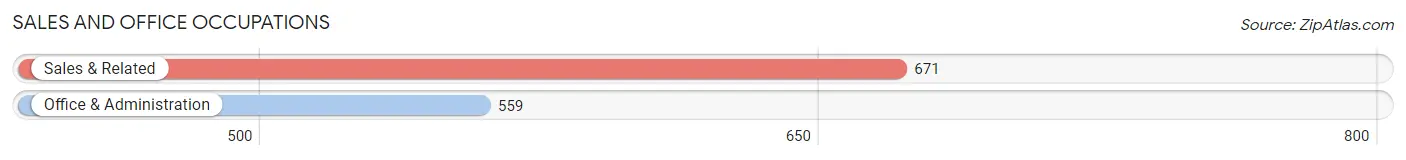
Sales and Office Occupations
The most common Sales and Office occupations in Moultrie are Sales & Related (671 | 10.9%), and Office & Administration (559 | 9.1%).
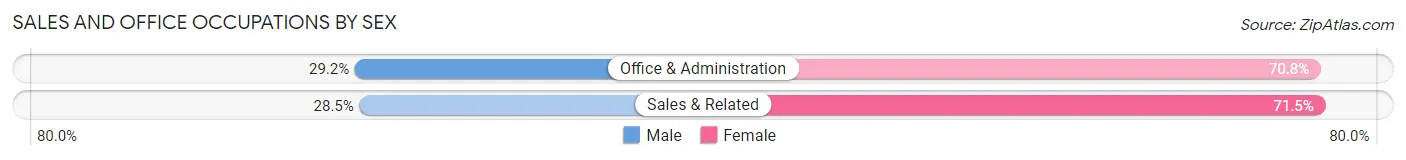
Sales and Office Occupations by Sex
| Occupation | Male | Female |
| Sales & Related | 191 (28.5%) | 480 (71.5%) |
| Office & Administration | 163 (29.2%) | 396 (70.8%) |
| Total (Category) | 354 (28.8%) | 876 (71.2%) |
| Total (Overall) | 3,300 (53.8%) | 2,833 (46.2%) |
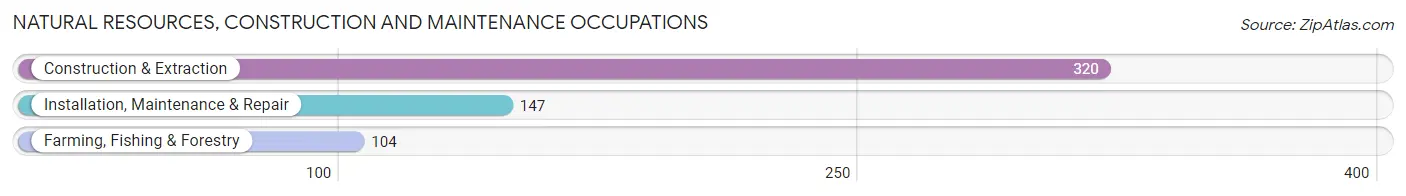
Natural Resources, Construction and Maintenance Occupations
The most common Natural Resources, Construction and Maintenance occupations in Moultrie are Construction & Extraction (320 | 5.2%), Installation, Maintenance & Repair (147 | 2.4%), and Farming, Fishing & Forestry (104 | 1.7%).
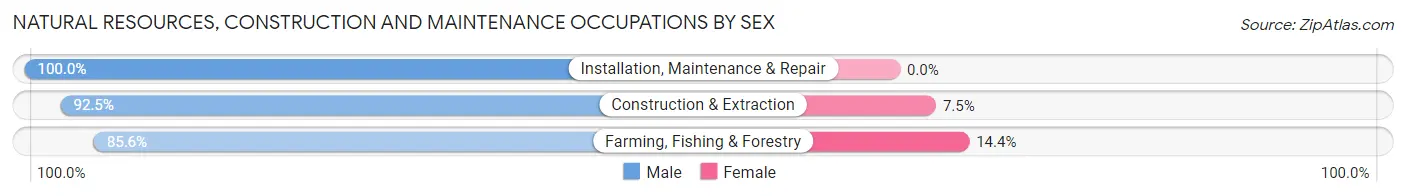
Natural Resources, Construction and Maintenance Occupations by Sex
| Occupation | Male | Female |
| Farming, Fishing & Forestry | 89 (85.6%) | 15 (14.4%) |
| Construction & Extraction | 296 (92.5%) | 24 (7.5%) |
| Installation, Maintenance & Repair | 147 (100.0%) | 0 (0.0%) |
| Total (Category) | 532 (93.2%) | 39 (6.8%) |
| Total (Overall) | 3,300 (53.8%) | 2,833 (46.2%) |
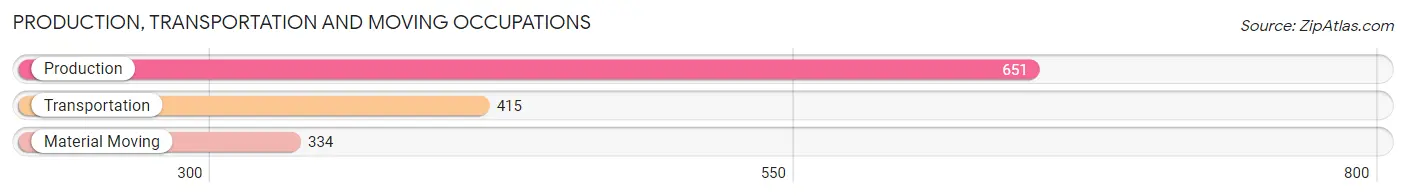
Production, Transportation and Moving Occupations
The most common Production, Transportation and Moving occupations in Moultrie are Production (651 | 10.6%), Transportation (415 | 6.8%), and Material Moving (334 | 5.4%).
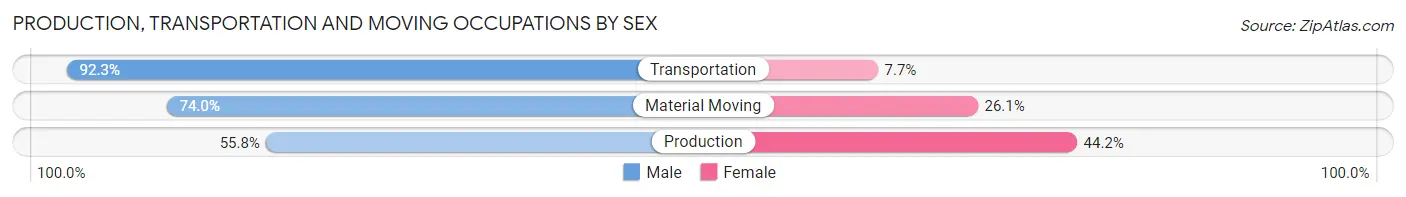
Production, Transportation and Moving Occupations by Sex
| Occupation | Male | Female |
| Production | 363 (55.8%) | 288 (44.2%) |
| Transportation | 383 (92.3%) | 32 (7.7%) |
| Material Moving | 247 (74.0%) | 87 (26.1%) |
| Total (Category) | 993 (70.9%) | 407 (29.1%) |
| Total (Overall) | 3,300 (53.8%) | 2,833 (46.2%) |
Employment Industries by Sex in Moultrie
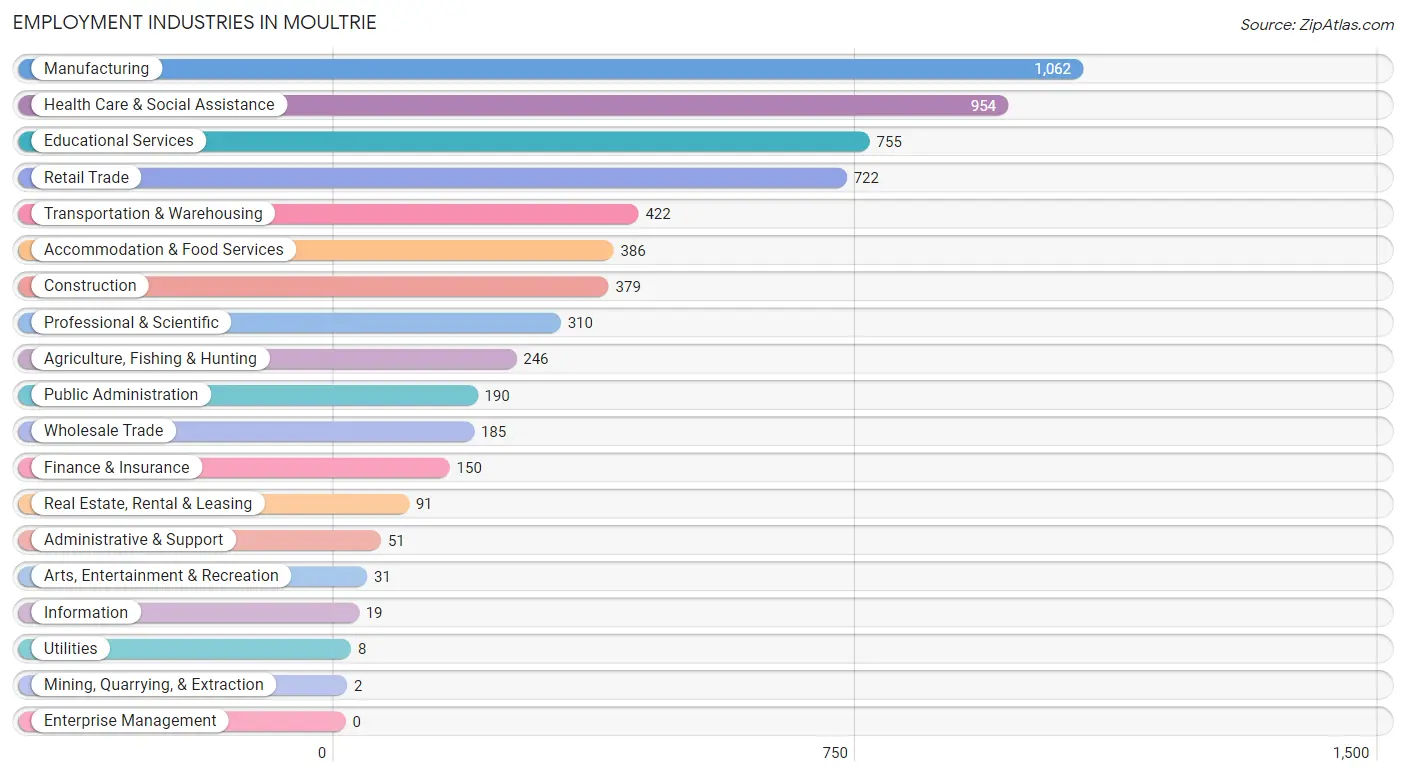
Employment Industries in Moultrie
The major employment industries in Moultrie include Manufacturing (1,062 | 17.3%), Health Care & Social Assistance (954 | 15.6%), Educational Services (755 | 12.3%), Retail Trade (722 | 11.8%), and Transportation & Warehousing (422 | 6.9%).
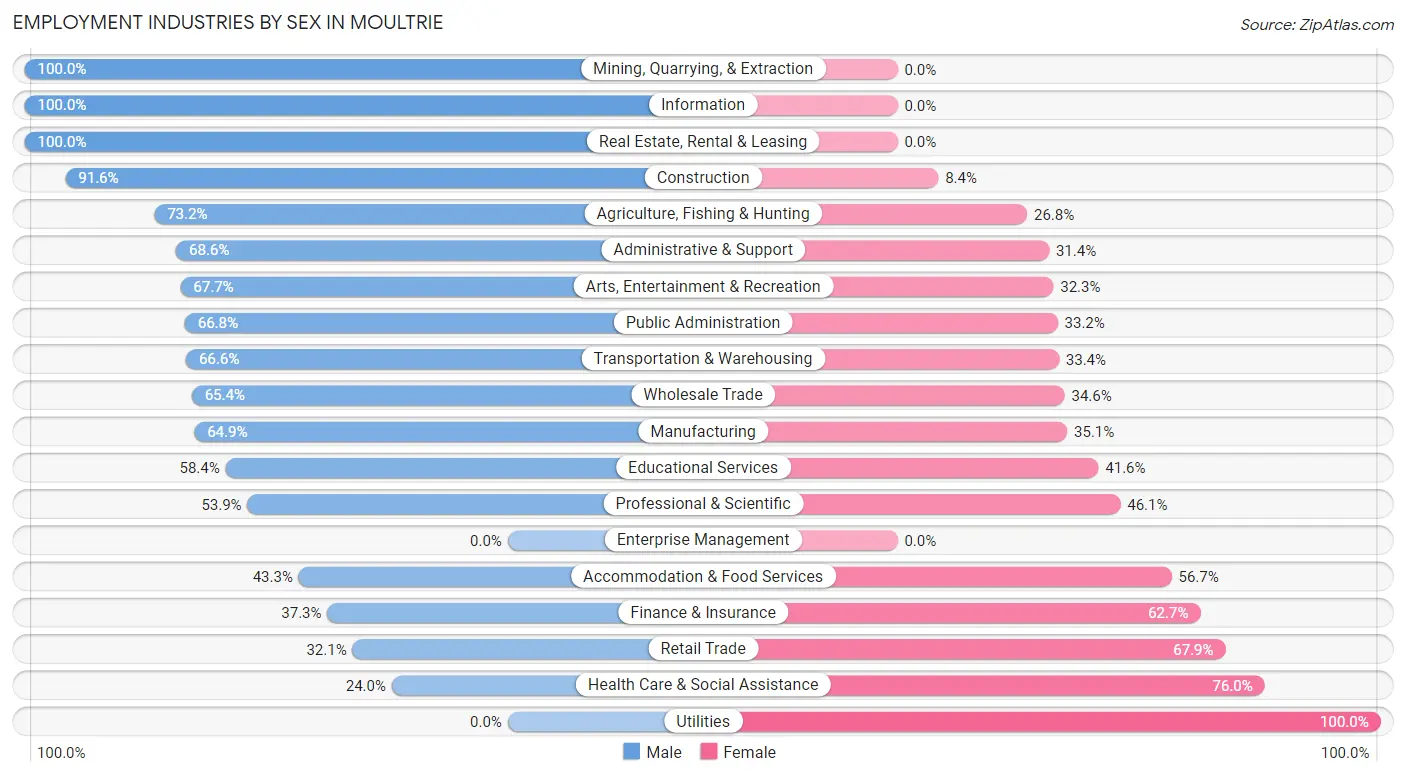
Employment Industries by Sex in Moultrie
The Moultrie industries that see more men than women are Mining, Quarrying, & Extraction (100.0%), Information (100.0%), and Real Estate, Rental & Leasing (100.0%), whereas the industries that tend to have a higher number of women are Utilities (100.0%), Health Care & Social Assistance (76.0%), and Retail Trade (67.9%).
| Industry | Male | Female |
| Agriculture, Fishing & Hunting | 180 (73.2%) | 66 (26.8%) |
| Mining, Quarrying, & Extraction | 2 (100.0%) | 0 (0.0%) |
| Construction | 347 (91.6%) | 32 (8.4%) |
| Manufacturing | 689 (64.9%) | 373 (35.1%) |
| Wholesale Trade | 121 (65.4%) | 64 (34.6%) |
| Retail Trade | 232 (32.1%) | 490 (67.9%) |
| Transportation & Warehousing | 281 (66.6%) | 141 (33.4%) |
| Utilities | 0 (0.0%) | 8 (100.0%) |
| Information | 19 (100.0%) | 0 (0.0%) |
| Finance & Insurance | 56 (37.3%) | 94 (62.7%) |
| Real Estate, Rental & Leasing | 91 (100.0%) | 0 (0.0%) |
| Professional & Scientific | 167 (53.9%) | 143 (46.1%) |
| Enterprise Management | 0 (0.0%) | 0 (0.0%) |
| Administrative & Support | 35 (68.6%) | 16 (31.4%) |
| Educational Services | 441 (58.4%) | 314 (41.6%) |
| Health Care & Social Assistance | 229 (24.0%) | 725 (76.0%) |
| Arts, Entertainment & Recreation | 21 (67.7%) | 10 (32.3%) |
| Accommodation & Food Services | 167 (43.3%) | 219 (56.7%) |
| Public Administration | 127 (66.8%) | 63 (33.2%) |
| Total | 3,300 (53.8%) | 2,833 (46.2%) |
Education in Moultrie
School Enrollment in Moultrie
The most common levels of schooling among the 3,514 students in Moultrie are high school (844 | 24.0%), elementary school (755 | 21.5%), and middle school (673 | 19.2%).
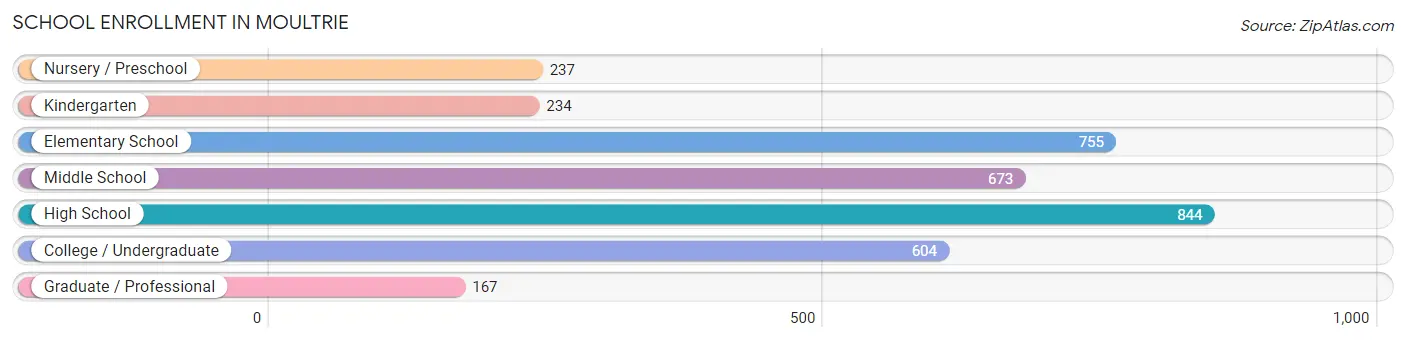
| School Level | # Students | % Students |
| Nursery / Preschool | 237 | 6.7% |
| Kindergarten | 234 | 6.7% |
| Elementary School | 755 | 21.5% |
| Middle School | 673 | 19.2% |
| High School | 844 | 24.0% |
| College / Undergraduate | 604 | 17.2% |
| Graduate / Professional | 167 | 4.8% |
| Total | 3,514 | 100.0% |
School Enrollment by Age by Funding Source in Moultrie
Out of a total of 3,514 students who are enrolled in schools in Moultrie, 165 (4.7%) attend a private institution, while the remaining 3,349 (95.3%) are enrolled in public schools. The age group of 3 to 4 year olds has the highest likelihood of being enrolled in private schools, with 18 (18.8% in the age bracket) enrolled. Conversely, the age group of 10 to 14 year olds has the lowest likelihood of being enrolled in a private school, with 781 (100.0% in the age bracket) attending a public institution.
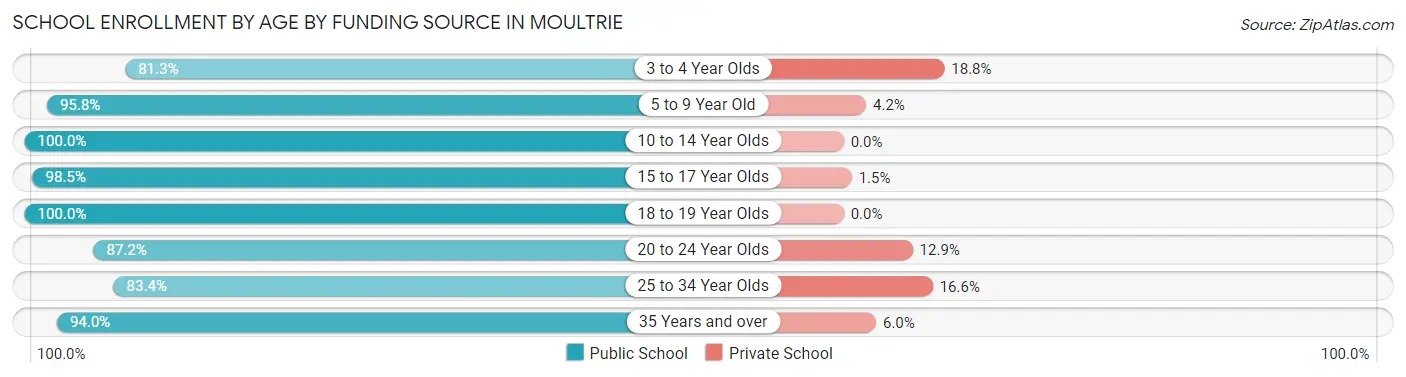
| Age Bracket | Public School | Private School |
| 3 to 4 Year Olds | 78 (81.2%) | 18 (18.8%) |
| 5 to 9 Year Old | 1,054 (95.8%) | 46 (4.2%) |
| 10 to 14 Year Olds | 781 (100.0%) | 0 (0.0%) |
| 15 to 17 Year Olds | 459 (98.5%) | 7 (1.5%) |
| 18 to 19 Year Olds | 303 (100.0%) | 0 (0.0%) |
| 20 to 24 Year Olds | 312 (87.2%) | 46 (12.9%) |
| 25 to 34 Year Olds | 176 (83.4%) | 35 (16.6%) |
| 35 Years and over | 187 (94.0%) | 12 (6.0%) |
| Total | 3,349 (95.3%) | 165 (4.7%) |
Educational Attainment by Field of Study in Moultrie
Education (350 | 18.9%), business (347 | 18.8%), science & technology (231 | 12.5%), bio, nature & agricultural (214 | 11.6%), and arts & humanities (156 | 8.4%) are the most common fields of study among 1,851 individuals in Moultrie who have obtained a bachelor's degree or higher.
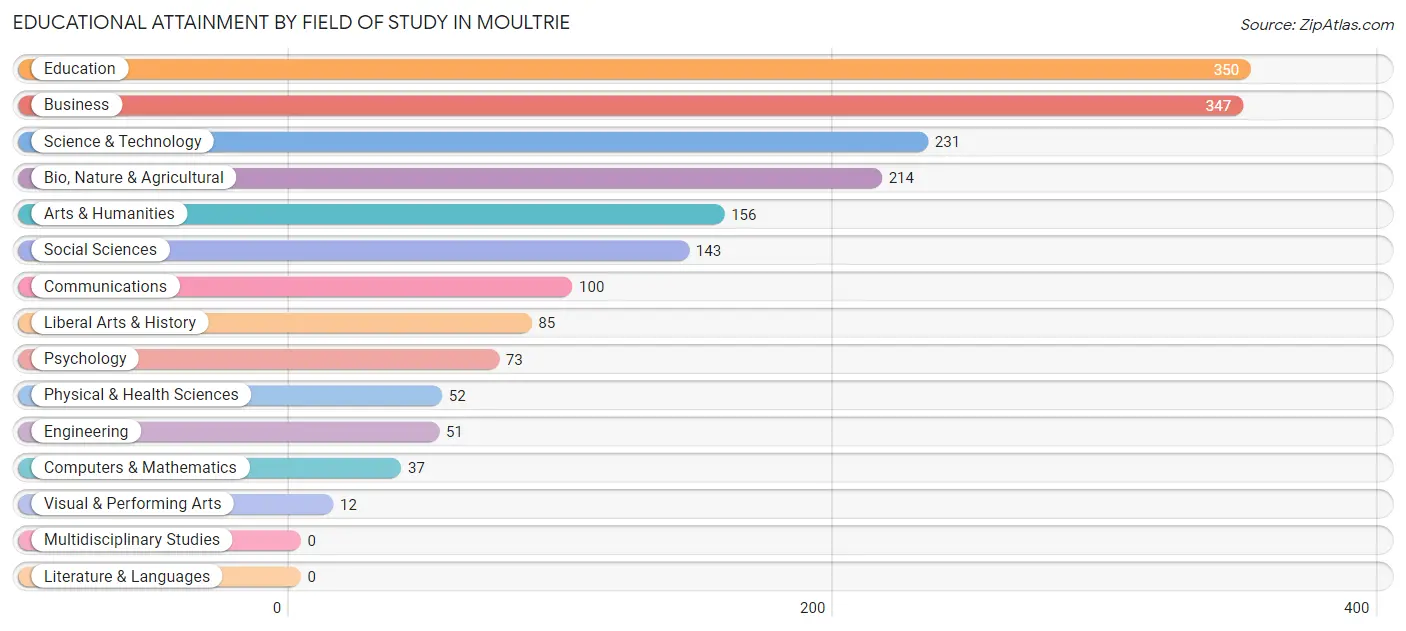
| Field of Study | # Graduates | % Graduates |
| Computers & Mathematics | 37 | 2.0% |
| Bio, Nature & Agricultural | 214 | 11.6% |
| Physical & Health Sciences | 52 | 2.8% |
| Psychology | 73 | 3.9% |
| Social Sciences | 143 | 7.7% |
| Engineering | 51 | 2.8% |
| Multidisciplinary Studies | 0 | 0.0% |
| Science & Technology | 231 | 12.5% |
| Business | 347 | 18.8% |
| Education | 350 | 18.9% |
| Literature & Languages | 0 | 0.0% |
| Liberal Arts & History | 85 | 4.6% |
| Visual & Performing Arts | 12 | 0.6% |
| Communications | 100 | 5.4% |
| Arts & Humanities | 156 | 8.4% |
| Total | 1,851 | 100.0% |
Transportation & Commute in Moultrie
Vehicle Availability by Sex in Moultrie
The most prevalent vehicle ownership categories in Moultrie are males with 2 vehicles (1,247, accounting for 38.8%) and females with 2 vehicles (1,266, making up 45.7%).
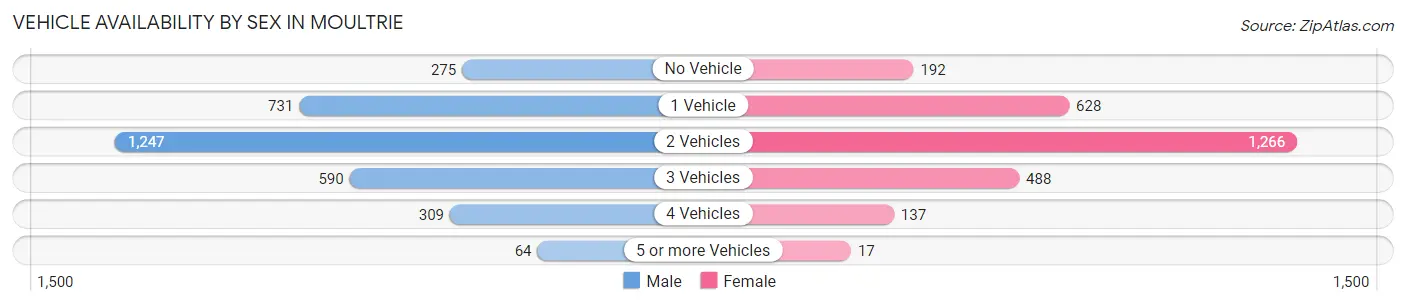
| Vehicles Available | Male | Female |
| No Vehicle | 275 (8.6%) | 192 (7.0%) |
| 1 Vehicle | 731 (22.7%) | 628 (23.0%) |
| 2 Vehicles | 1,247 (38.8%) | 1,266 (46.4%) |
| 3 Vehicles | 590 (18.3%) | 488 (17.9%) |
| 4 Vehicles | 309 (9.6%) | 137 (5.0%) |
| 5 or more Vehicles | 64 (2.0%) | 17 (0.6%) |
| Total | 3,216 (100.0%) | 2,728 (100.0%) |
Commute Time in Moultrie
The most frequently occuring commute durations in Moultrie are 10 to 14 minutes (1,249 commuters, 21.6%), 5 to 9 minutes (1,068 commuters, 18.5%), and 15 to 19 minutes (1,012 commuters, 17.5%).
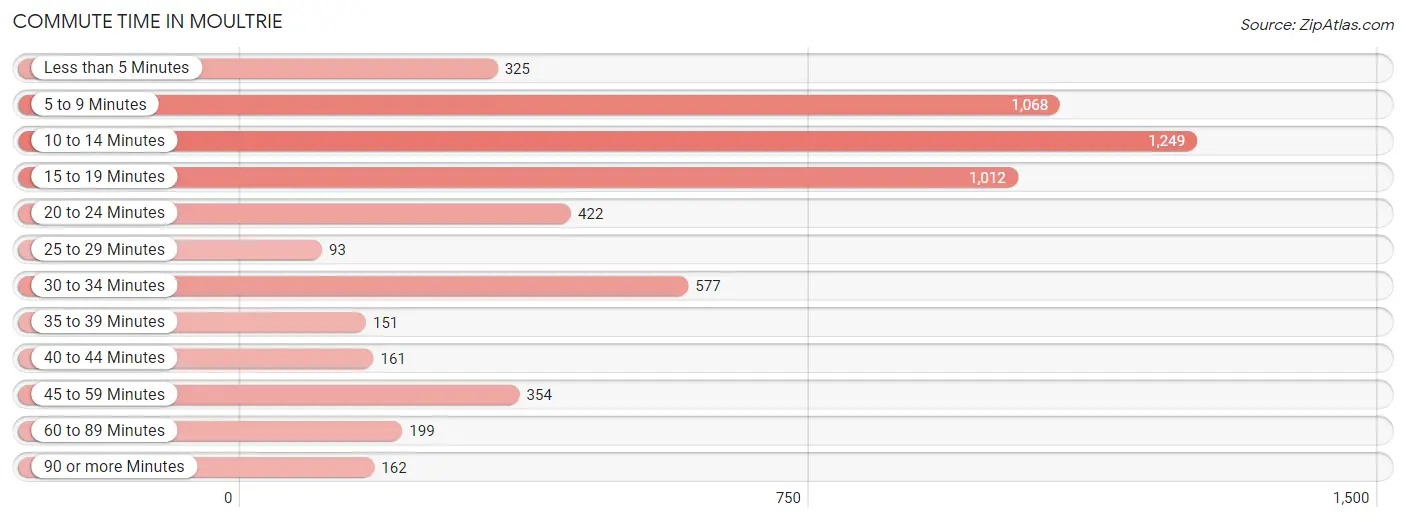
| Commute Time | # Commuters | % Commuters |
| Less than 5 Minutes | 325 | 5.6% |
| 5 to 9 Minutes | 1,068 | 18.5% |
| 10 to 14 Minutes | 1,249 | 21.6% |
| 15 to 19 Minutes | 1,012 | 17.5% |
| 20 to 24 Minutes | 422 | 7.3% |
| 25 to 29 Minutes | 93 | 1.6% |
| 30 to 34 Minutes | 577 | 10.0% |
| 35 to 39 Minutes | 151 | 2.6% |
| 40 to 44 Minutes | 161 | 2.8% |
| 45 to 59 Minutes | 354 | 6.1% |
| 60 to 89 Minutes | 199 | 3.5% |
| 90 or more Minutes | 162 | 2.8% |
Commute Time by Sex in Moultrie
The most common commute times in Moultrie are 10 to 14 minutes (654 commuters, 20.9%) for males and 5 to 9 minutes (601 commuters, 22.8%) for females.
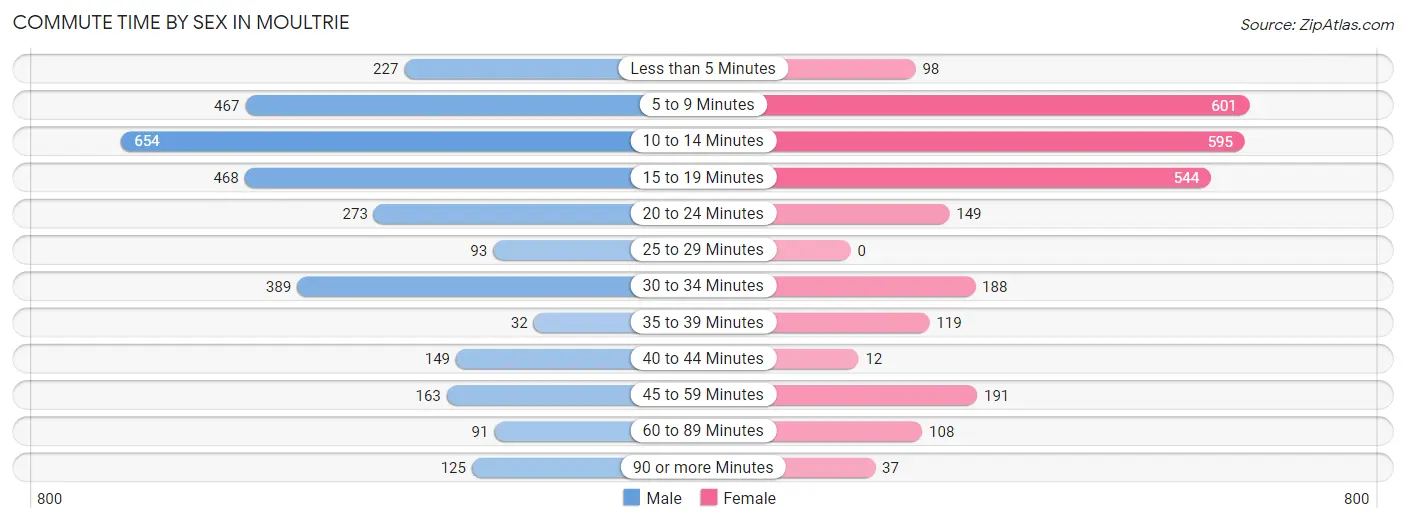
| Commute Time | Male | Female |
| Less than 5 Minutes | 227 (7.2%) | 98 (3.7%) |
| 5 to 9 Minutes | 467 (14.9%) | 601 (22.8%) |
| 10 to 14 Minutes | 654 (20.9%) | 595 (22.5%) |
| 15 to 19 Minutes | 468 (14.9%) | 544 (20.6%) |
| 20 to 24 Minutes | 273 (8.7%) | 149 (5.6%) |
| 25 to 29 Minutes | 93 (3.0%) | 0 (0.0%) |
| 30 to 34 Minutes | 389 (12.4%) | 188 (7.1%) |
| 35 to 39 Minutes | 32 (1.0%) | 119 (4.5%) |
| 40 to 44 Minutes | 149 (4.8%) | 12 (0.4%) |
| 45 to 59 Minutes | 163 (5.2%) | 191 (7.2%) |
| 60 to 89 Minutes | 91 (2.9%) | 108 (4.1%) |
| 90 or more Minutes | 125 (4.0%) | 37 (1.4%) |
Time of Departure to Work by Sex in Moultrie
The most frequent times of departure to work in Moultrie are 7:00 AM to 7:29 AM (568, 18.1%) for males and 7:00 AM to 7:29 AM (488, 18.5%) for females.
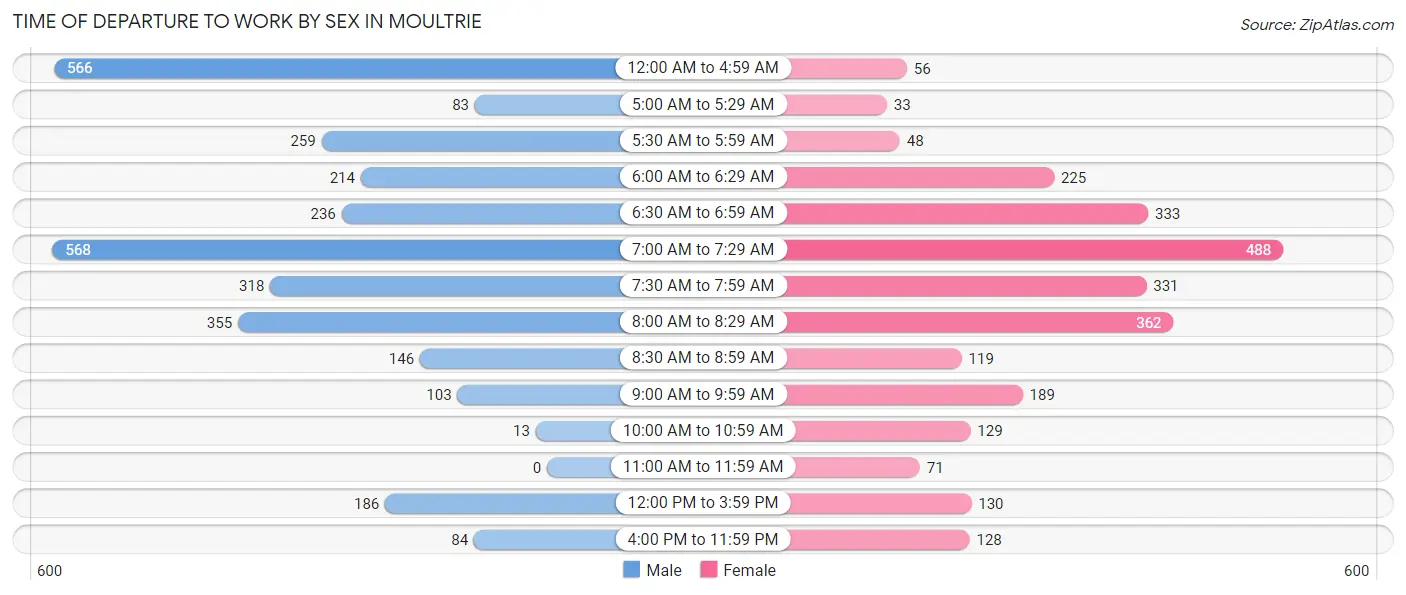
| Time of Departure | Male | Female |
| 12:00 AM to 4:59 AM | 566 (18.1%) | 56 (2.1%) |
| 5:00 AM to 5:29 AM | 83 (2.6%) | 33 (1.3%) |
| 5:30 AM to 5:59 AM | 259 (8.3%) | 48 (1.8%) |
| 6:00 AM to 6:29 AM | 214 (6.8%) | 225 (8.5%) |
| 6:30 AM to 6:59 AM | 236 (7.5%) | 333 (12.6%) |
| 7:00 AM to 7:29 AM | 568 (18.1%) | 488 (18.5%) |
| 7:30 AM to 7:59 AM | 318 (10.2%) | 331 (12.5%) |
| 8:00 AM to 8:29 AM | 355 (11.3%) | 362 (13.7%) |
| 8:30 AM to 8:59 AM | 146 (4.7%) | 119 (4.5%) |
| 9:00 AM to 9:59 AM | 103 (3.3%) | 189 (7.1%) |
| 10:00 AM to 10:59 AM | 13 (0.4%) | 129 (4.9%) |
| 11:00 AM to 11:59 AM | 0 (0.0%) | 71 (2.7%) |
| 12:00 PM to 3:59 PM | 186 (5.9%) | 130 (4.9%) |
| 4:00 PM to 11:59 PM | 84 (2.7%) | 128 (4.8%) |
| Total | 3,131 (100.0%) | 2,642 (100.0%) |
Housing Occupancy in Moultrie
Occupancy by Ownership in Moultrie
Of the total 5,745 dwellings in Moultrie, owner-occupied units account for 2,618 (45.6%), while renter-occupied units make up 3,127 (54.4%).
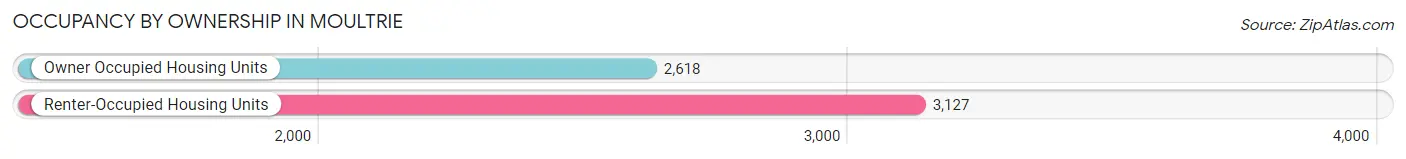
| Occupancy | # Housing Units | % Housing Units |
| Owner Occupied Housing Units | 2,618 | 45.6% |
| Renter-Occupied Housing Units | 3,127 | 54.4% |
| Total Occupied Housing Units | 5,745 | 100.0% |
Occupancy by Household Size in Moultrie
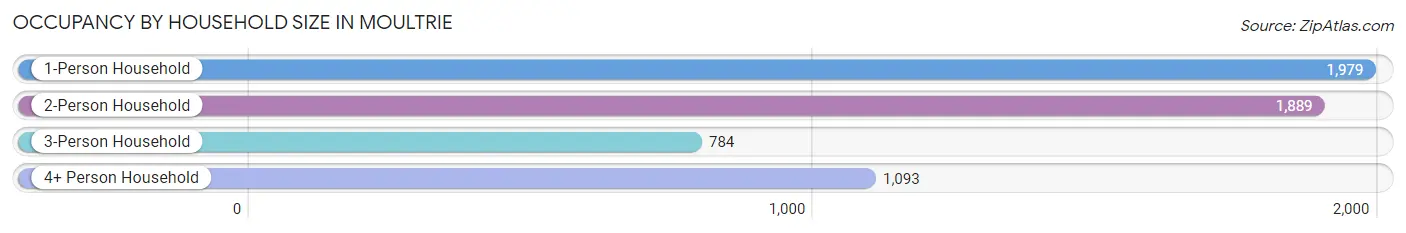
| Household Size | # Housing Units | % Housing Units |
| 1-Person Household | 1,979 | 34.4% |
| 2-Person Household | 1,889 | 32.9% |
| 3-Person Household | 784 | 13.7% |
| 4+ Person Household | 1,093 | 19.0% |
| Total Housing Units | 5,745 | 100.0% |
Occupancy by Ownership by Household Size in Moultrie
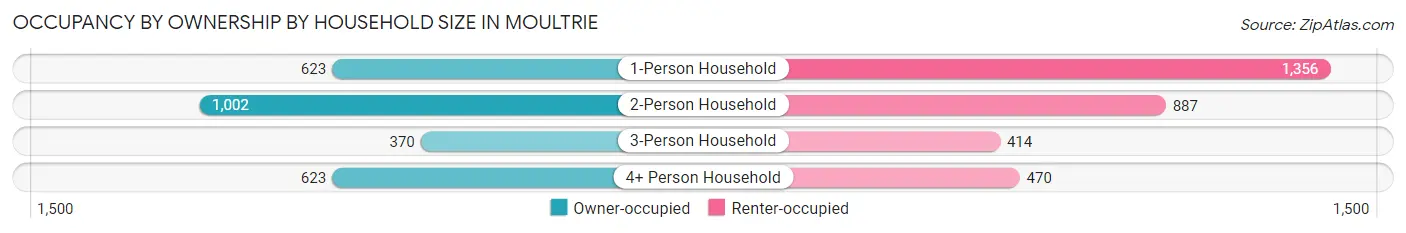
| Household Size | Owner-occupied | Renter-occupied |
| 1-Person Household | 623 (31.5%) | 1,356 (68.5%) |
| 2-Person Household | 1,002 (53.0%) | 887 (47.0%) |
| 3-Person Household | 370 (47.2%) | 414 (52.8%) |
| 4+ Person Household | 623 (57.0%) | 470 (43.0%) |
| Total Housing Units | 2,618 (45.6%) | 3,127 (54.4%) |
Occupancy by Educational Attainment in Moultrie
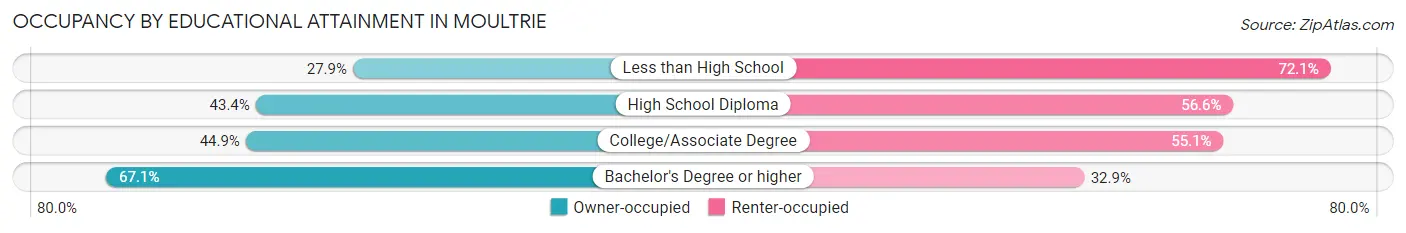
| Household Size | Owner-occupied | Renter-occupied |
| Less than High School | 309 (27.9%) | 797 (72.1%) |
| High School Diploma | 781 (43.4%) | 1,020 (56.6%) |
| College/Associate Degree | 762 (44.9%) | 934 (55.1%) |
| Bachelor's Degree or higher | 766 (67.1%) | 376 (32.9%) |
Occupancy by Age of Householder in Moultrie
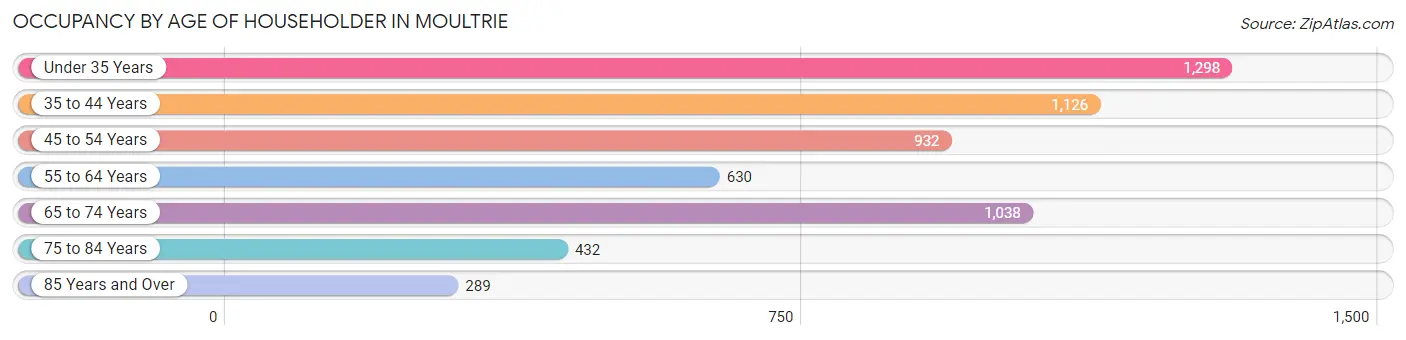
| Age Bracket | # Households | % Households |
| Under 35 Years | 1,298 | 22.6% |
| 35 to 44 Years | 1,126 | 19.6% |
| 45 to 54 Years | 932 | 16.2% |
| 55 to 64 Years | 630 | 11.0% |
| 65 to 74 Years | 1,038 | 18.1% |
| 75 to 84 Years | 432 | 7.5% |
| 85 Years and Over | 289 | 5.0% |
| Total | 5,745 | 100.0% |
Housing Finances in Moultrie
Median Income by Occupancy in Moultrie
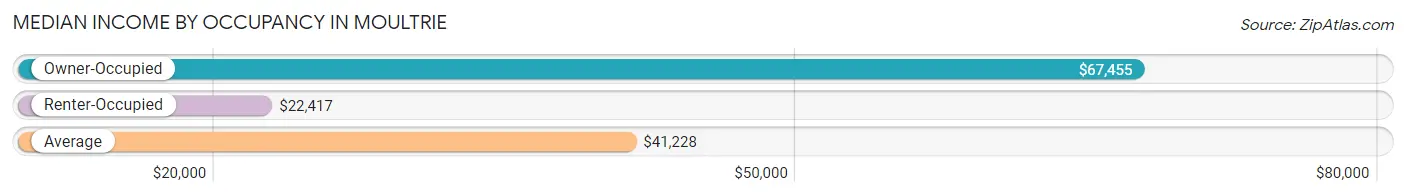
| Occupancy Type | # Households | Median Income |
| Owner-Occupied | 2,618 (45.6%) | $67,455 |
| Renter-Occupied | 3,127 (54.4%) | $22,417 |
| Average | 5,745 (100.0%) | $41,228 |
Occupancy by Householder Income Bracket in Moultrie
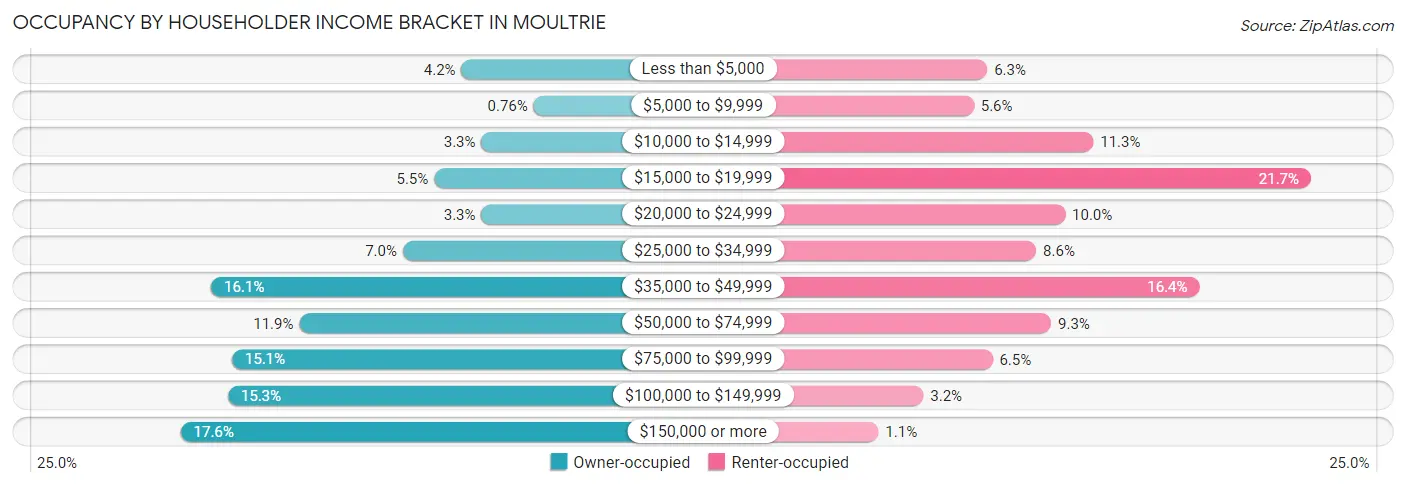
| Income Bracket | Owner-occupied | Renter-occupied |
| Less than $5,000 | 110 (4.2%) | 196 (6.3%) |
| $5,000 to $9,999 | 20 (0.8%) | 176 (5.6%) |
| $10,000 to $14,999 | 85 (3.3%) | 354 (11.3%) |
| $15,000 to $19,999 | 144 (5.5%) | 678 (21.7%) |
| $20,000 to $24,999 | 85 (3.3%) | 312 (10.0%) |
| $25,000 to $34,999 | 183 (7.0%) | 269 (8.6%) |
| $35,000 to $49,999 | 422 (16.1%) | 512 (16.4%) |
| $50,000 to $74,999 | 312 (11.9%) | 291 (9.3%) |
| $75,000 to $99,999 | 396 (15.1%) | 204 (6.5%) |
| $100,000 to $149,999 | 401 (15.3%) | 101 (3.2%) |
| $150,000 or more | 460 (17.6%) | 34 (1.1%) |
| Total | 2,618 (100.0%) | 3,127 (100.0%) |
Monthly Housing Cost Tiers in Moultrie
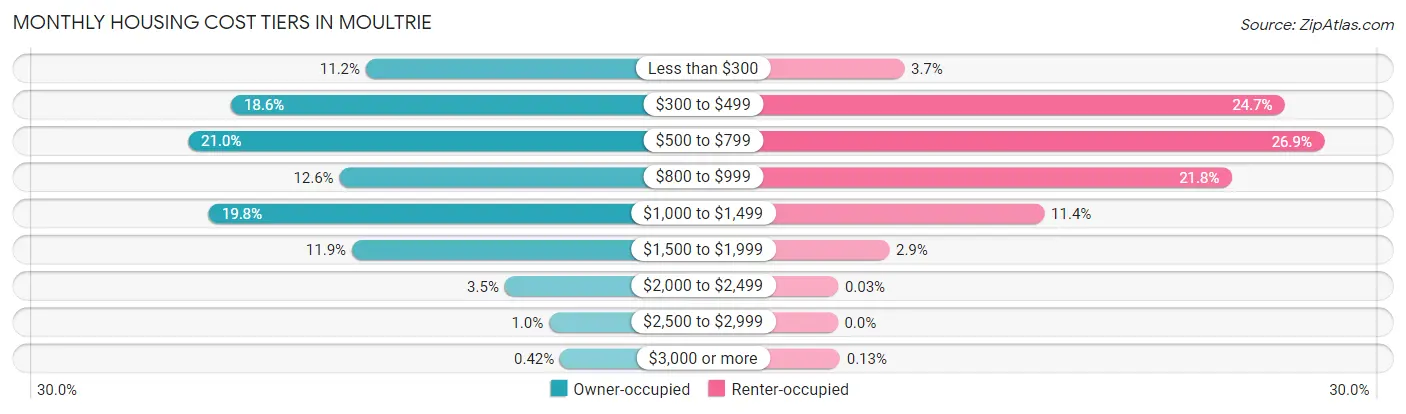
| Monthly Cost | Owner-occupied | Renter-occupied |
| Less than $300 | 292 (11.2%) | 115 (3.7%) |
| $300 to $499 | 487 (18.6%) | 772 (24.7%) |
| $500 to $799 | 549 (21.0%) | 840 (26.9%) |
| $800 to $999 | 330 (12.6%) | 680 (21.7%) |
| $1,000 to $1,499 | 519 (19.8%) | 357 (11.4%) |
| $1,500 to $1,999 | 312 (11.9%) | 89 (2.9%) |
| $2,000 to $2,499 | 91 (3.5%) | 1 (0.0%) |
| $2,500 to $2,999 | 27 (1.0%) | 0 (0.0%) |
| $3,000 or more | 11 (0.4%) | 4 (0.1%) |
| Total | 2,618 (100.0%) | 3,127 (100.0%) |
Physical Housing Characteristics in Moultrie
Housing Structures in Moultrie
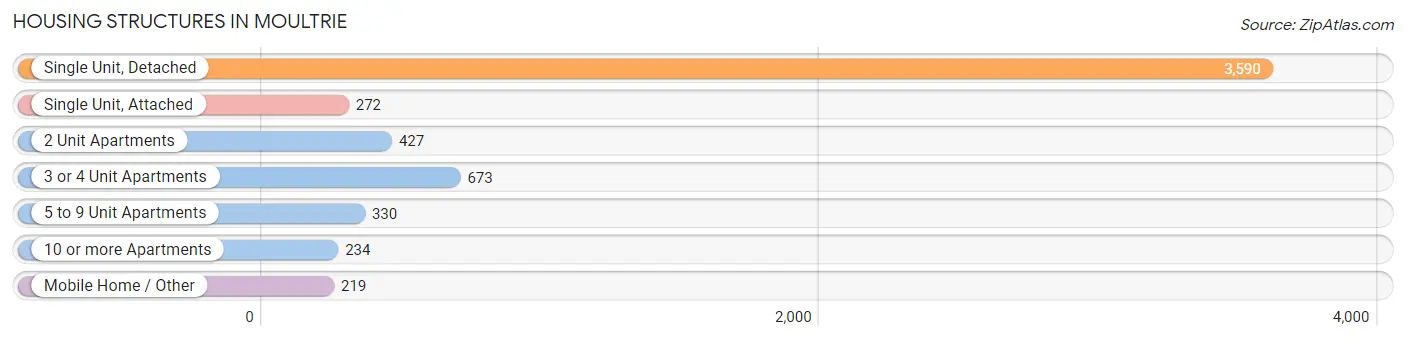
| Structure Type | # Housing Units | % Housing Units |
| Single Unit, Detached | 3,590 | 62.5% |
| Single Unit, Attached | 272 | 4.7% |
| 2 Unit Apartments | 427 | 7.4% |
| 3 or 4 Unit Apartments | 673 | 11.7% |
| 5 to 9 Unit Apartments | 330 | 5.7% |
| 10 or more Apartments | 234 | 4.1% |
| Mobile Home / Other | 219 | 3.8% |
| Total | 5,745 | 100.0% |
Housing Structures by Occupancy in Moultrie
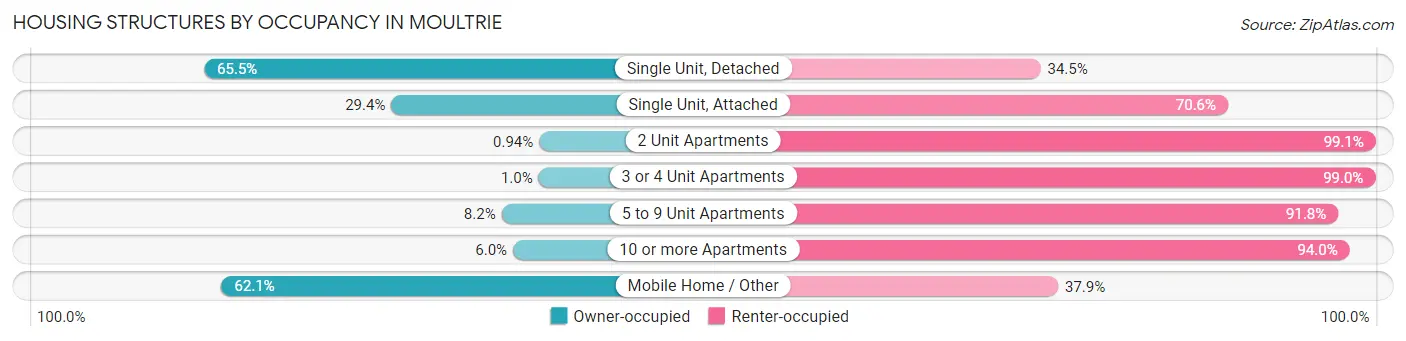
| Structure Type | Owner-occupied | Renter-occupied |
| Single Unit, Detached | 2,350 (65.5%) | 1,240 (34.5%) |
| Single Unit, Attached | 80 (29.4%) | 192 (70.6%) |
| 2 Unit Apartments | 4 (0.9%) | 423 (99.1%) |
| 3 or 4 Unit Apartments | 7 (1.0%) | 666 (99.0%) |
| 5 to 9 Unit Apartments | 27 (8.2%) | 303 (91.8%) |
| 10 or more Apartments | 14 (6.0%) | 220 (94.0%) |
| Mobile Home / Other | 136 (62.1%) | 83 (37.9%) |
| Total | 2,618 (45.6%) | 3,127 (54.4%) |
Housing Structures by Number of Rooms in Moultrie
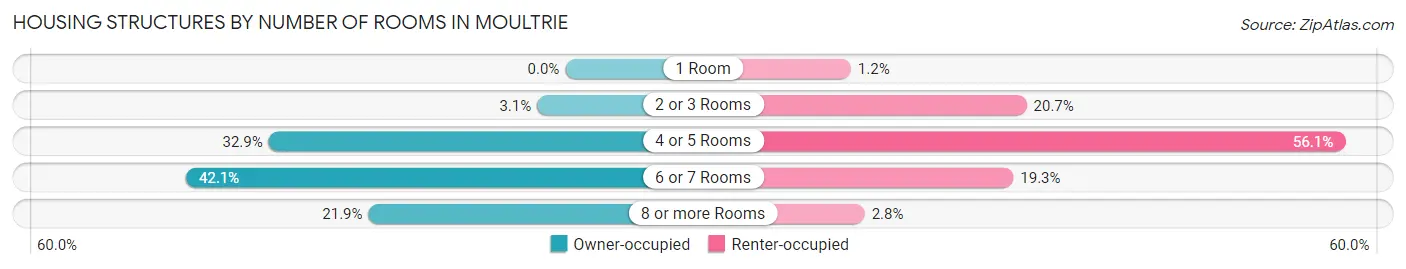
| Number of Rooms | Owner-occupied | Renter-occupied |
| 1 Room | 0 (0.0%) | 38 (1.2%) |
| 2 or 3 Rooms | 82 (3.1%) | 648 (20.7%) |
| 4 or 5 Rooms | 862 (32.9%) | 1,753 (56.1%) |
| 6 or 7 Rooms | 1,102 (42.1%) | 602 (19.3%) |
| 8 or more Rooms | 572 (21.8%) | 86 (2.8%) |
| Total | 2,618 (100.0%) | 3,127 (100.0%) |
Housing Structure by Heating Type in Moultrie
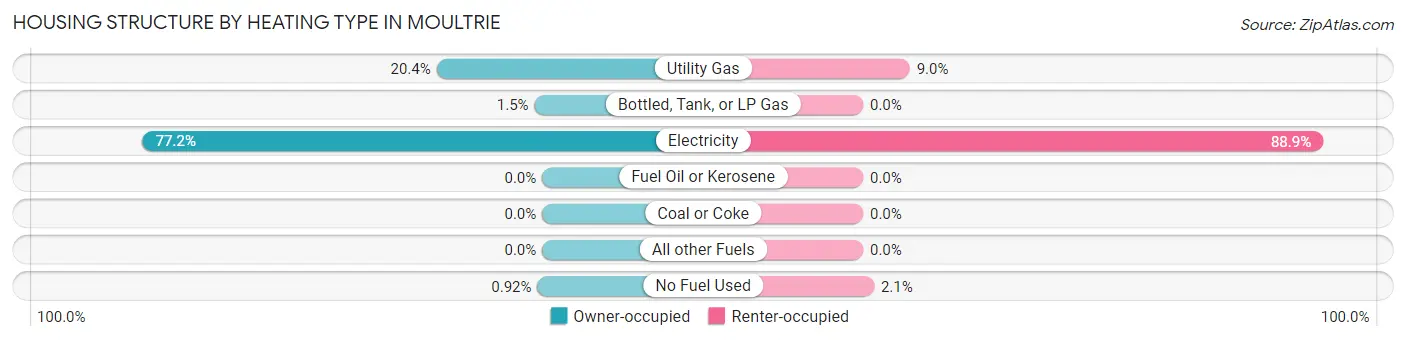
| Heating Type | Owner-occupied | Renter-occupied |
| Utility Gas | 534 (20.4%) | 282 (9.0%) |
| Bottled, Tank, or LP Gas | 39 (1.5%) | 0 (0.0%) |
| Electricity | 2,021 (77.2%) | 2,779 (88.9%) |
| Fuel Oil or Kerosene | 0 (0.0%) | 0 (0.0%) |
| Coal or Coke | 0 (0.0%) | 0 (0.0%) |
| All other Fuels | 0 (0.0%) | 0 (0.0%) |
| No Fuel Used | 24 (0.9%) | 66 (2.1%) |
| Total | 2,618 (100.0%) | 3,127 (100.0%) |
Household Vehicle Usage in Moultrie
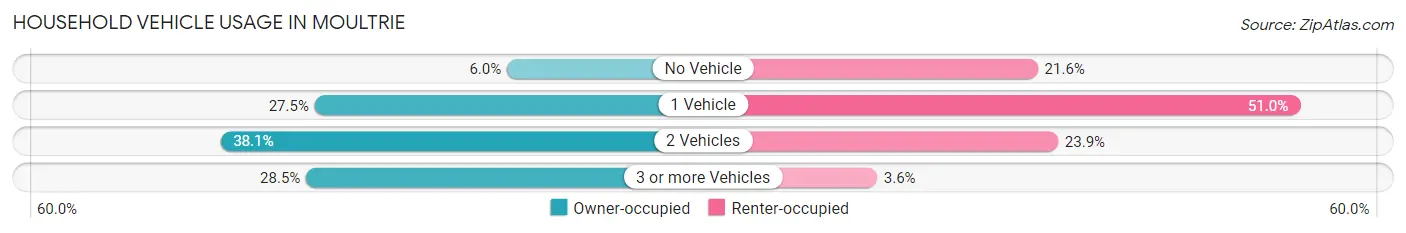
| Vehicles per Household | Owner-occupied | Renter-occupied |
| No Vehicle | 156 (6.0%) | 675 (21.6%) |
| 1 Vehicle | 720 (27.5%) | 1,594 (51.0%) |
| 2 Vehicles | 997 (38.1%) | 746 (23.9%) |
| 3 or more Vehicles | 745 (28.5%) | 112 (3.6%) |
| Total | 2,618 (100.0%) | 3,127 (100.0%) |
Real Estate & Mortgages in Moultrie
Real Estate and Mortgage Overview in Moultrie
| Characteristic | Without Mortgage | With Mortgage |
| Housing Units | 1,202 | 1,416 |
| Median Property Value | $100,300 | $144,100 |
| Median Household Income | $63,293 | $264 |
| Monthly Housing Costs | $419 | $0 |
| Real Estate Taxes | $1,023 | $62 |
Property Value by Mortgage Status in Moultrie
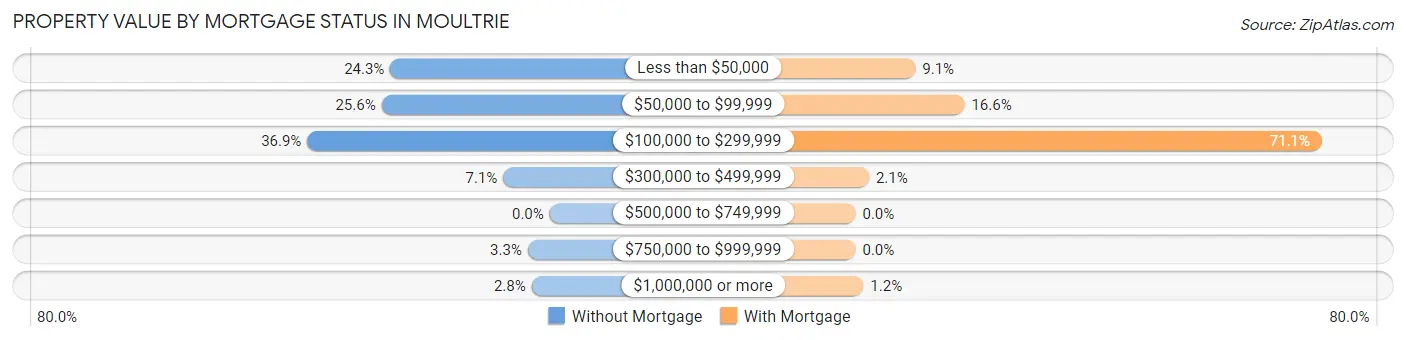
| Property Value | Without Mortgage | With Mortgage |
| Less than $50,000 | 292 (24.3%) | 129 (9.1%) |
| $50,000 to $99,999 | 308 (25.6%) | 235 (16.6%) |
| $100,000 to $299,999 | 444 (36.9%) | 1,006 (71.1%) |
| $300,000 to $499,999 | 85 (7.1%) | 29 (2.1%) |
| $500,000 to $749,999 | 0 (0.0%) | 0 (0.0%) |
| $750,000 to $999,999 | 40 (3.3%) | 0 (0.0%) |
| $1,000,000 or more | 33 (2.8%) | 17 (1.2%) |
| Total | 1,202 (100.0%) | 1,416 (100.0%) |
Household Income by Mortgage Status in Moultrie
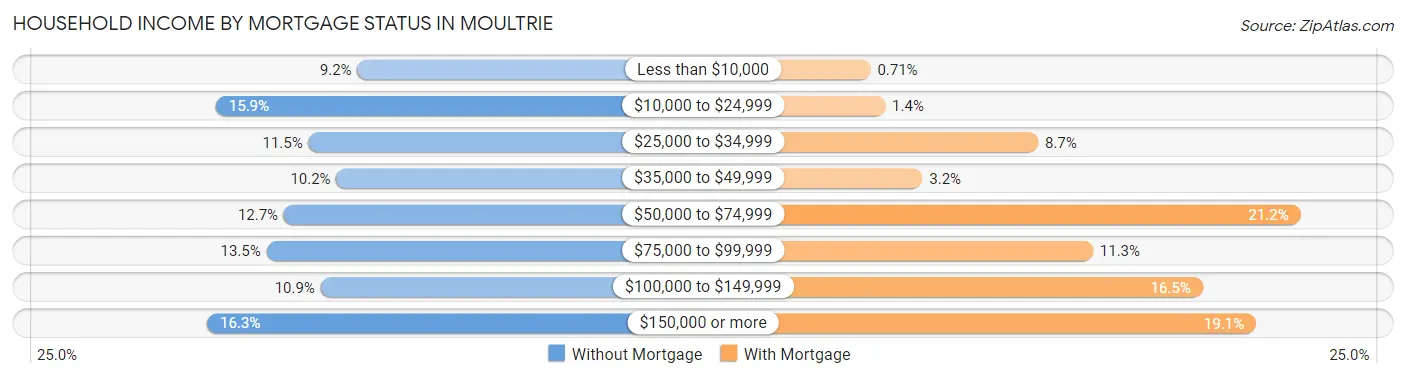
| Household Income | Without Mortgage | With Mortgage |
| Less than $10,000 | 110 (9.1%) | 10 (0.7%) |
| $10,000 to $24,999 | 191 (15.9%) | 20 (1.4%) |
| $25,000 to $34,999 | 138 (11.5%) | 123 (8.7%) |
| $35,000 to $49,999 | 122 (10.2%) | 45 (3.2%) |
| $50,000 to $74,999 | 152 (12.7%) | 300 (21.2%) |
| $75,000 to $99,999 | 162 (13.5%) | 160 (11.3%) |
| $100,000 to $149,999 | 131 (10.9%) | 234 (16.5%) |
| $150,000 or more | 196 (16.3%) | 270 (19.1%) |
| Total | 1,202 (100.0%) | 1,416 (100.0%) |
Property Value to Household Income Ratio in Moultrie
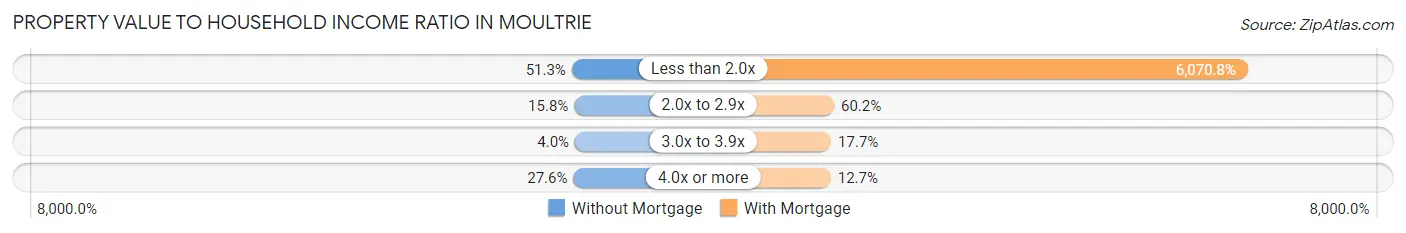
| Value-to-Income Ratio | Without Mortgage | With Mortgage |
| Less than 2.0x | 616 (51.2%) | 85,962 (6,070.8%) |
| 2.0x to 2.9x | 190 (15.8%) | 852 (60.2%) |
| 3.0x to 3.9x | 48 (4.0%) | 250 (17.7%) |
| 4.0x or more | 332 (27.6%) | 180 (12.7%) |
| Total | 1,202 (100.0%) | 1,416 (100.0%) |
Real Estate Taxes by Mortgage Status in Moultrie
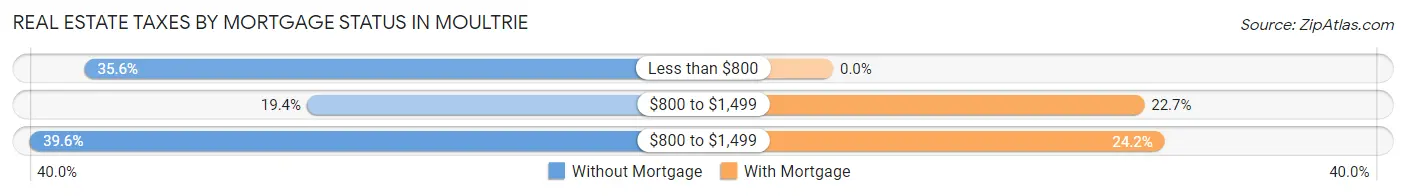
| Property Taxes | Without Mortgage | With Mortgage |
| Less than $800 | 428 (35.6%) | 0 (0.0%) |
| $800 to $1,499 | 233 (19.4%) | 322 (22.7%) |
| $800 to $1,499 | 476 (39.6%) | 343 (24.2%) |
| Total | 1,202 (100.0%) | 1,416 (100.0%) |
Health & Disability in Moultrie
Health Insurance Coverage by Age in Moultrie
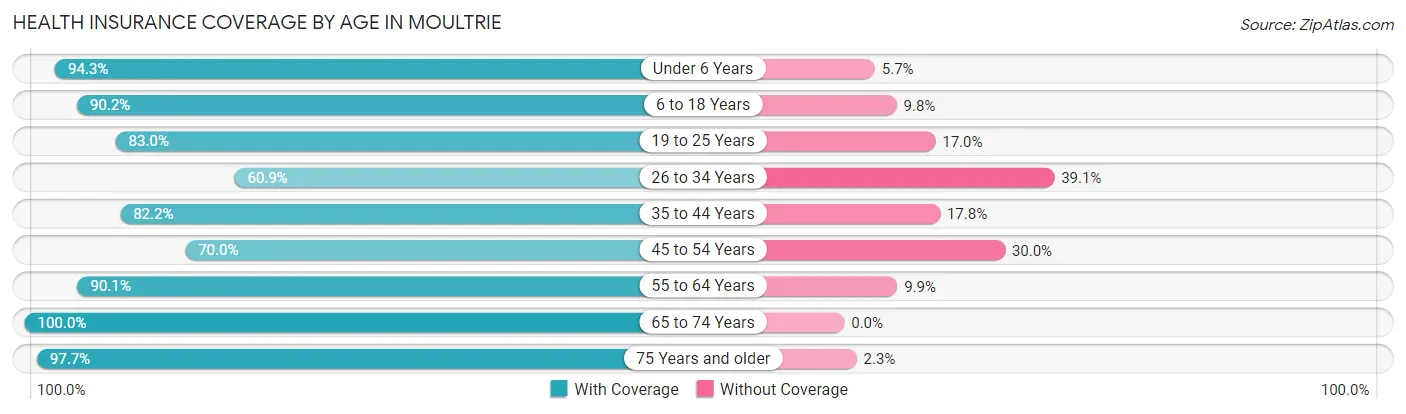
| Age Bracket | With Coverage | Without Coverage |
| Under 6 Years | 1,059 (94.3%) | 64 (5.7%) |
| 6 to 18 Years | 2,163 (90.2%) | 234 (9.8%) |
| 19 to 25 Years | 1,531 (83.0%) | 313 (17.0%) |
| 26 to 34 Years | 939 (60.9%) | 604 (39.1%) |
| 35 to 44 Years | 1,640 (82.2%) | 356 (17.8%) |
| 45 to 54 Years | 1,185 (70.0%) | 507 (30.0%) |
| 55 to 64 Years | 1,032 (90.1%) | 113 (9.9%) |
| 65 to 74 Years | 1,359 (100.0%) | 0 (0.0%) |
| 75 Years and older | 977 (97.7%) | 23 (2.3%) |
| Total | 11,885 (84.3%) | 2,214 (15.7%) |
Health Insurance Coverage by Citizenship Status in Moultrie
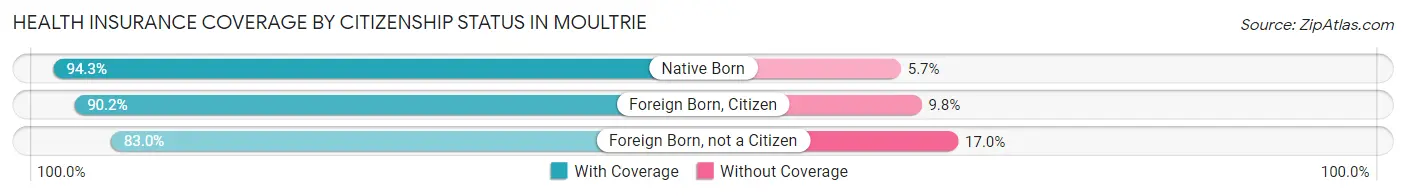
| Citizenship Status | With Coverage | Without Coverage |
| Native Born | 1,059 (94.3%) | 64 (5.7%) |
| Foreign Born, Citizen | 2,163 (90.2%) | 234 (9.8%) |
| Foreign Born, not a Citizen | 1,531 (83.0%) | 313 (17.0%) |
Health Insurance Coverage by Household Income in Moultrie
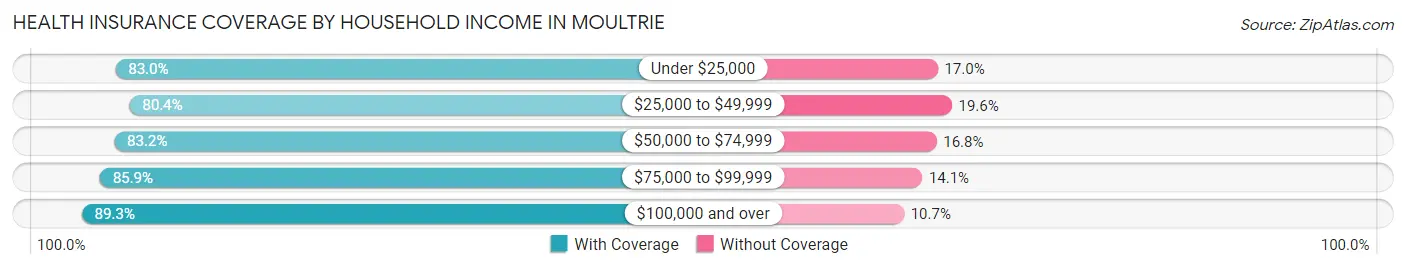
| Household Income | With Coverage | Without Coverage |
| Under $25,000 | 3,479 (83.0%) | 712 (17.0%) |
| $25,000 to $49,999 | 2,370 (80.4%) | 579 (19.6%) |
| $50,000 to $74,999 | 1,455 (83.2%) | 293 (16.8%) |
| $75,000 to $99,999 | 1,672 (85.9%) | 274 (14.1%) |
| $100,000 and over | 2,854 (89.3%) | 341 (10.7%) |
Public vs Private Health Insurance Coverage by Age in Moultrie
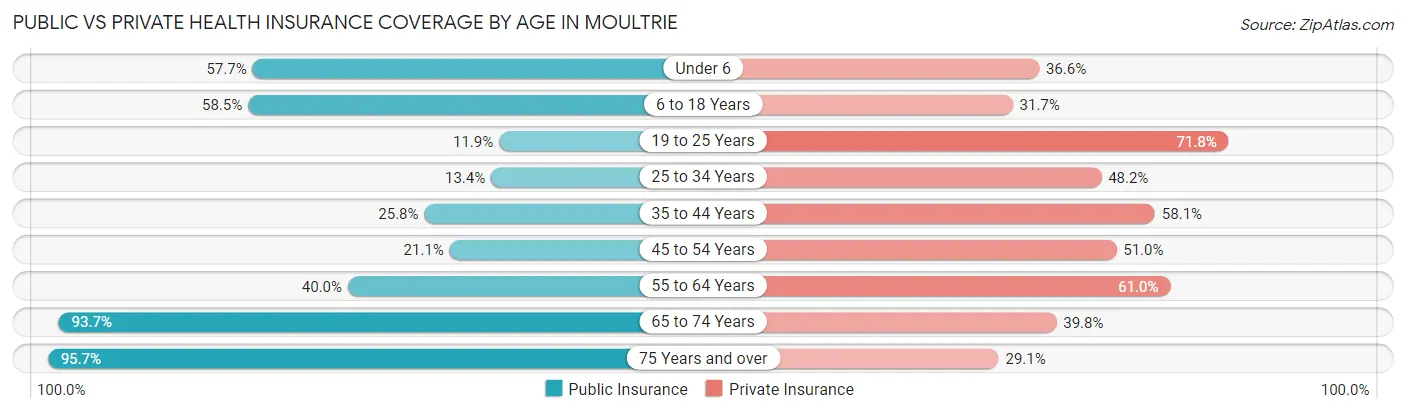
| Age Bracket | Public Insurance | Private Insurance |
| Under 6 | 648 (57.7%) | 411 (36.6%) |
| 6 to 18 Years | 1,403 (58.5%) | 760 (31.7%) |
| 19 to 25 Years | 220 (11.9%) | 1,324 (71.8%) |
| 25 to 34 Years | 207 (13.4%) | 743 (48.1%) |
| 35 to 44 Years | 515 (25.8%) | 1,160 (58.1%) |
| 45 to 54 Years | 357 (21.1%) | 862 (50.9%) |
| 55 to 64 Years | 458 (40.0%) | 698 (61.0%) |
| 65 to 74 Years | 1,273 (93.7%) | 541 (39.8%) |
| 75 Years and over | 957 (95.7%) | 291 (29.1%) |
| Total | 6,038 (42.8%) | 6,790 (48.2%) |
Disability Status by Sex by Age in Moultrie
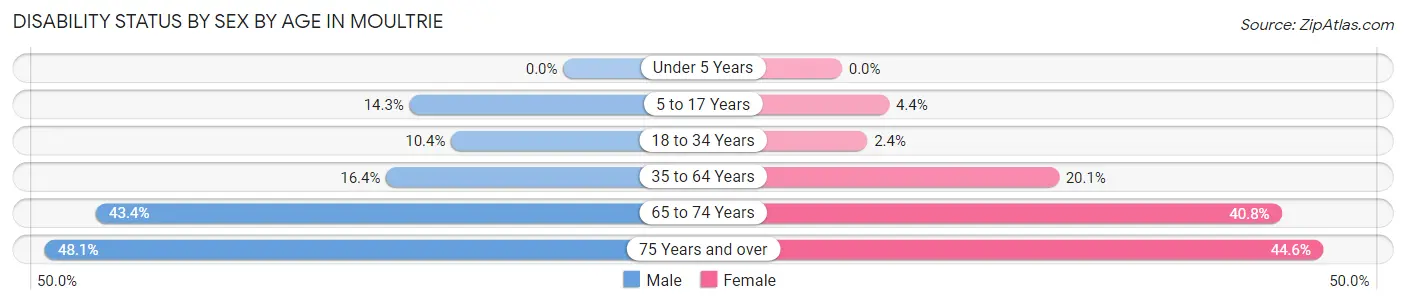
| Age Bracket | Male | Female |
| Under 5 Years | 0 (0.0%) | 0 (0.0%) |
| 5 to 17 Years | 201 (14.3%) | 42 (4.4%) |
| 18 to 34 Years | 202 (10.4%) | 38 (2.4%) |
| 35 to 64 Years | 373 (16.4%) | 516 (20.1%) |
| 65 to 74 Years | 297 (43.4%) | 275 (40.8%) |
| 75 Years and over | 203 (48.1%) | 258 (44.6%) |
Disability Class by Sex by Age in Moultrie
Disability Class: Hearing Difficulty
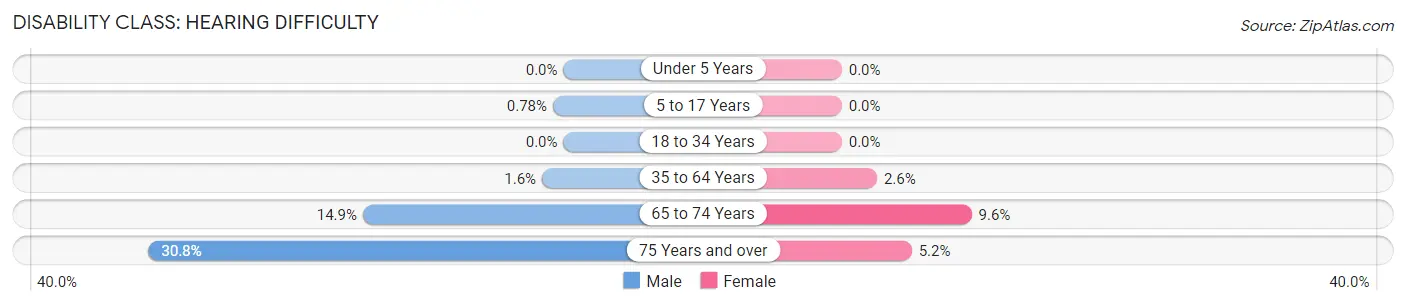
| Age Bracket | Male | Female |
| Under 5 Years | 0 (0.0%) | 0 (0.0%) |
| 5 to 17 Years | 11 (0.8%) | 0 (0.0%) |
| 18 to 34 Years | 0 (0.0%) | 0 (0.0%) |
| 35 to 64 Years | 36 (1.6%) | 67 (2.6%) |
| 65 to 74 Years | 102 (14.9%) | 65 (9.6%) |
| 75 Years and over | 130 (30.8%) | 30 (5.2%) |
Disability Class: Vision Difficulty
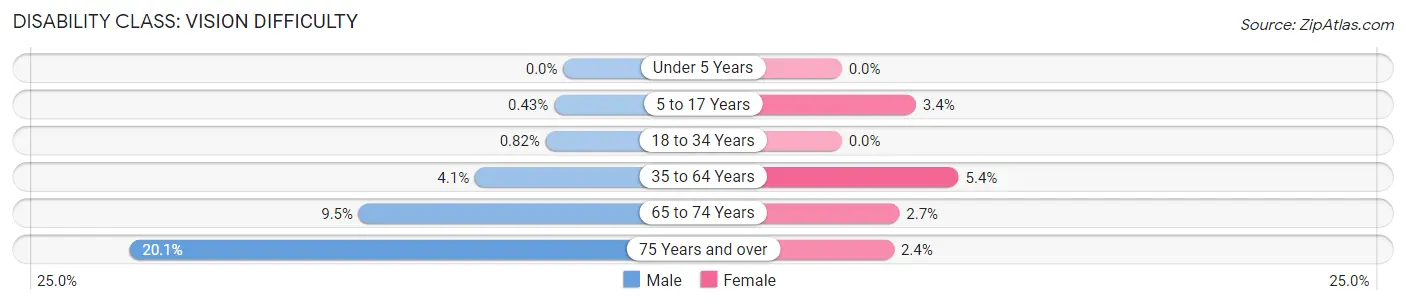
| Age Bracket | Male | Female |
| Under 5 Years | 0 (0.0%) | 0 (0.0%) |
| 5 to 17 Years | 6 (0.4%) | 33 (3.4%) |
| 18 to 34 Years | 16 (0.8%) | 0 (0.0%) |
| 35 to 64 Years | 93 (4.1%) | 139 (5.4%) |
| 65 to 74 Years | 65 (9.5%) | 18 (2.7%) |
| 75 Years and over | 85 (20.1%) | 14 (2.4%) |
Disability Class: Cognitive Difficulty
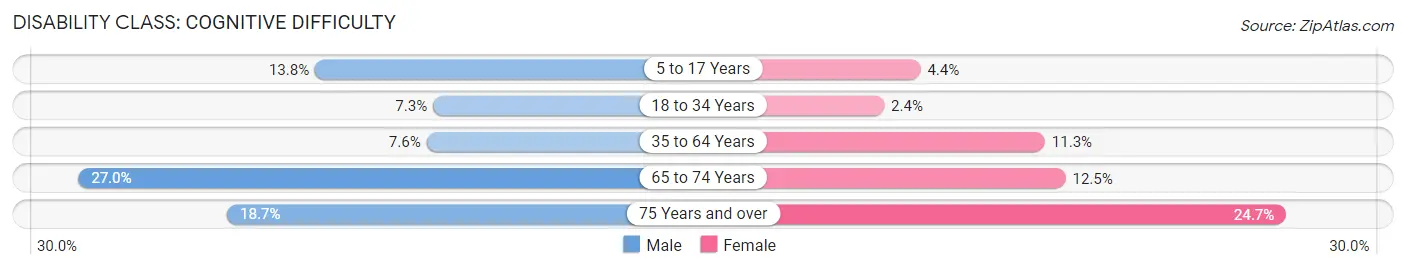
| Age Bracket | Male | Female |
| 5 to 17 Years | 195 (13.8%) | 42 (4.4%) |
| 18 to 34 Years | 141 (7.3%) | 38 (2.4%) |
| 35 to 64 Years | 173 (7.6%) | 290 (11.3%) |
| 65 to 74 Years | 185 (27.0%) | 84 (12.5%) |
| 75 Years and over | 79 (18.7%) | 143 (24.7%) |
Disability Class: Ambulatory Difficulty
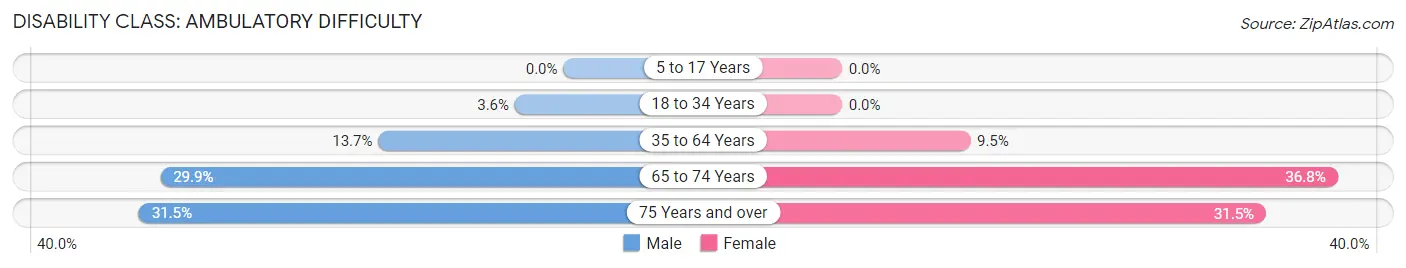
| Age Bracket | Male | Female |
| 5 to 17 Years | 0 (0.0%) | 0 (0.0%) |
| 18 to 34 Years | 70 (3.6%) | 0 (0.0%) |
| 35 to 64 Years | 312 (13.7%) | 244 (9.5%) |
| 65 to 74 Years | 205 (29.9%) | 248 (36.8%) |
| 75 Years and over | 133 (31.5%) | 182 (31.5%) |
Disability Class: Self-Care Difficulty
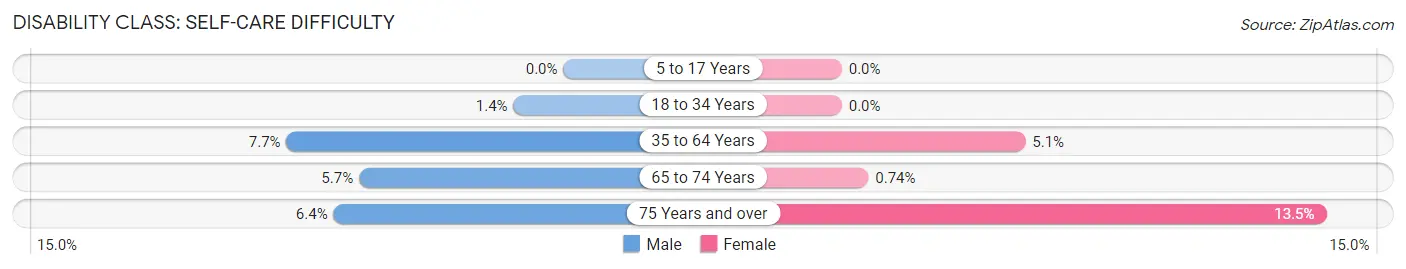
| Age Bracket | Male | Female |
| 5 to 17 Years | 0 (0.0%) | 0 (0.0%) |
| 18 to 34 Years | 27 (1.4%) | 0 (0.0%) |
| 35 to 64 Years | 175 (7.7%) | 131 (5.1%) |
| 65 to 74 Years | 39 (5.7%) | 5 (0.7%) |
| 75 Years and over | 27 (6.4%) | 78 (13.5%) |
Technology Access in Moultrie
Computing Device Access in Moultrie
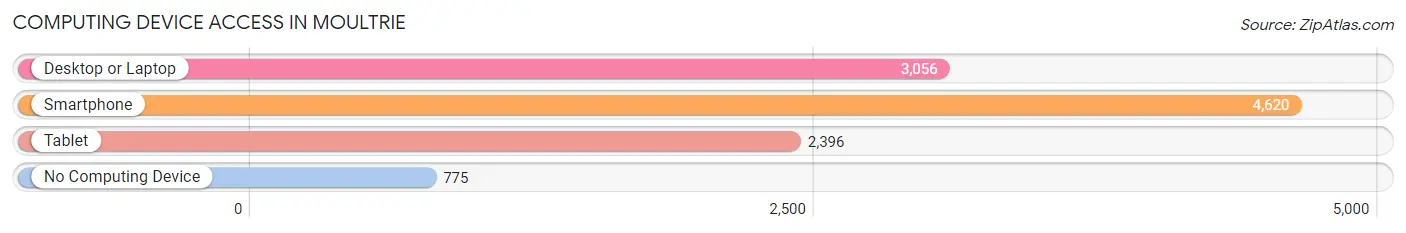
| Device Type | # Households | % Households |
| Desktop or Laptop | 3,056 | 53.2% |
| Smartphone | 4,620 | 80.4% |
| Tablet | 2,396 | 41.7% |
| No Computing Device | 775 | 13.5% |
| Total | 5,745 | 100.0% |
Internet Access in Moultrie
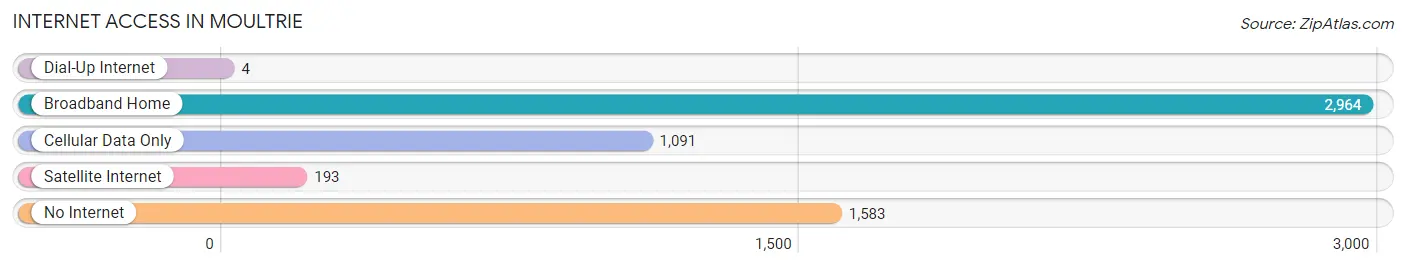
| Internet Type | # Households | % Households |
| Dial-Up Internet | 4 | 0.1% |
| Broadband Home | 2,964 | 51.6% |
| Cellular Data Only | 1,091 | 19.0% |
| Satellite Internet | 193 | 3.4% |
| No Internet | 1,583 | 27.6% |
| Total | 5,745 | 100.0% |
Moultrie Summary
Moultrie, Georgia is a city located in Colquitt County in the southwestern part of the state. It is the county seat and the largest city in the county. The city was founded in 1856 and named after General William Moultrie, a Revolutionary War hero. The city has a population of 14,268 as of the 2020 census.
Geography
Moultrie is located in the southwestern part of Georgia, about 50 miles north of the Florida border. The city is situated in the center of Colquitt County, which is bordered by Thomas, Grady, Mitchell, and Worth counties. The city is located at the intersection of U.S. Highway 319 and Georgia State Route 37. The city is located in the Coastal Plain region of Georgia, and the terrain is mostly flat. The city is located at an elevation of about 200 feet above sea level.
Climate
Moultrie has a humid subtropical climate, with hot, humid summers and mild winters. The average annual temperature is around 70 degrees Fahrenheit, with temperatures ranging from the mid-50s in the winter to the mid-90s in the summer. The average annual precipitation is around 50 inches, with most of the precipitation occurring in the summer months.
Demographics
As of the 2020 census, Moultrie had a population of 14,268. The racial makeup of the city was 57.3% White, 37.2% African American, 0.7% Native American, 0.7% Asian, 0.1% Pacific Islander, 1.7% from other races, and 2.2% from two or more races. Hispanic or Latino of any race were 4.2% of the population.
Economy
Moultrie’s economy is largely based on agriculture and manufacturing. The city is home to several large agricultural companies, including Moultrie Feed and Seed, Moultrie Pecan Company, and Moultrie Cotton Gin. The city is also home to several manufacturing companies, including Georgia-Pacific, Georgia-Pacific Corrugated, and Georgia-Pacific Plywood.
The city is also home to several retail stores, restaurants, and other businesses. The city is home to the Moultrie Mall, which is the largest shopping center in the county. The city is also home to several medical facilities, including Colquitt Regional Medical Center and Moultrie Medical Center.
History
Moultrie was founded in 1856 and named after General William Moultrie, a Revolutionary War hero. The city was originally a small farming community, but it began to grow in the late 19th century when the railroad was built through the city. The city was incorporated in 1872 and became the county seat of Colquitt County in 1876.
In the early 20th century, the city began to grow rapidly, and by the 1950s, it had become a major agricultural center. The city continued to grow throughout the 20th century, and by the 2000s, it had become a major retail and manufacturing center.
Today, Moultrie is a thriving city with a diverse economy and a vibrant culture. The city is home to several large agricultural companies, manufacturing companies, and retail stores. The city is also home to several medical facilities, and it is a popular tourist destination.
Common Questions
What is Per Capita Income in Moultrie?
Per Capita income in Moultrie is $25,651.
What is the Median Family Income in Moultrie?
Median Family Income in Moultrie is $50,915.
What is the Median Household income in Moultrie?
Median Household Income in Moultrie is $41,228.
What is Income or Wage Gap in Moultrie?
Income or Wage Gap in Moultrie is 10.3%.
Women in Moultrie earn 89.7 cents for every dollar earned by a man.
What is Family Income Deficit in Moultrie?
Family Income Deficit in Moultrie is $11,434.
Families that are below poverty line in Moultrie earn $11,434 less on average than the poverty threshold level.
What is Inequality or Gini Index in Moultrie?
Inequality or Gini Index in Moultrie is 0.52.
What is the Total Population of Moultrie?
Total Population of Moultrie is 14,533.
What is the Total Male Population of Moultrie?
Total Male Population of Moultrie is 7,480.
What is the Total Female Population of Moultrie?
Total Female Population of Moultrie is 7,053.
What is the Ratio of Males per 100 Females in Moultrie?
There are 106.05 Males per 100 Females in Moultrie.
What is the Ratio of Females per 100 Males in Moultrie?
There are 94.29 Females per 100 Males in Moultrie.
What is the Median Population Age in Moultrie?
Median Population Age in Moultrie is 35.9 Years.
What is the Average Family Size in Moultrie
Average Family Size in Moultrie is 3.3 People.
What is the Average Household Size in Moultrie
Average Household Size in Moultrie is 2.4 People.
How Large is the Labor Force in Moultrie?
There are 6,686 People in the Labor Forcein in Moultrie.
What is the Percentage of People in the Labor Force in Moultrie?
58.4% of People are in the Labor Force in Moultrie.
What is the Unemployment Rate in Moultrie?
Unemployment Rate in Moultrie is 8.3%.