Dock Junction, GA Map & Demographics
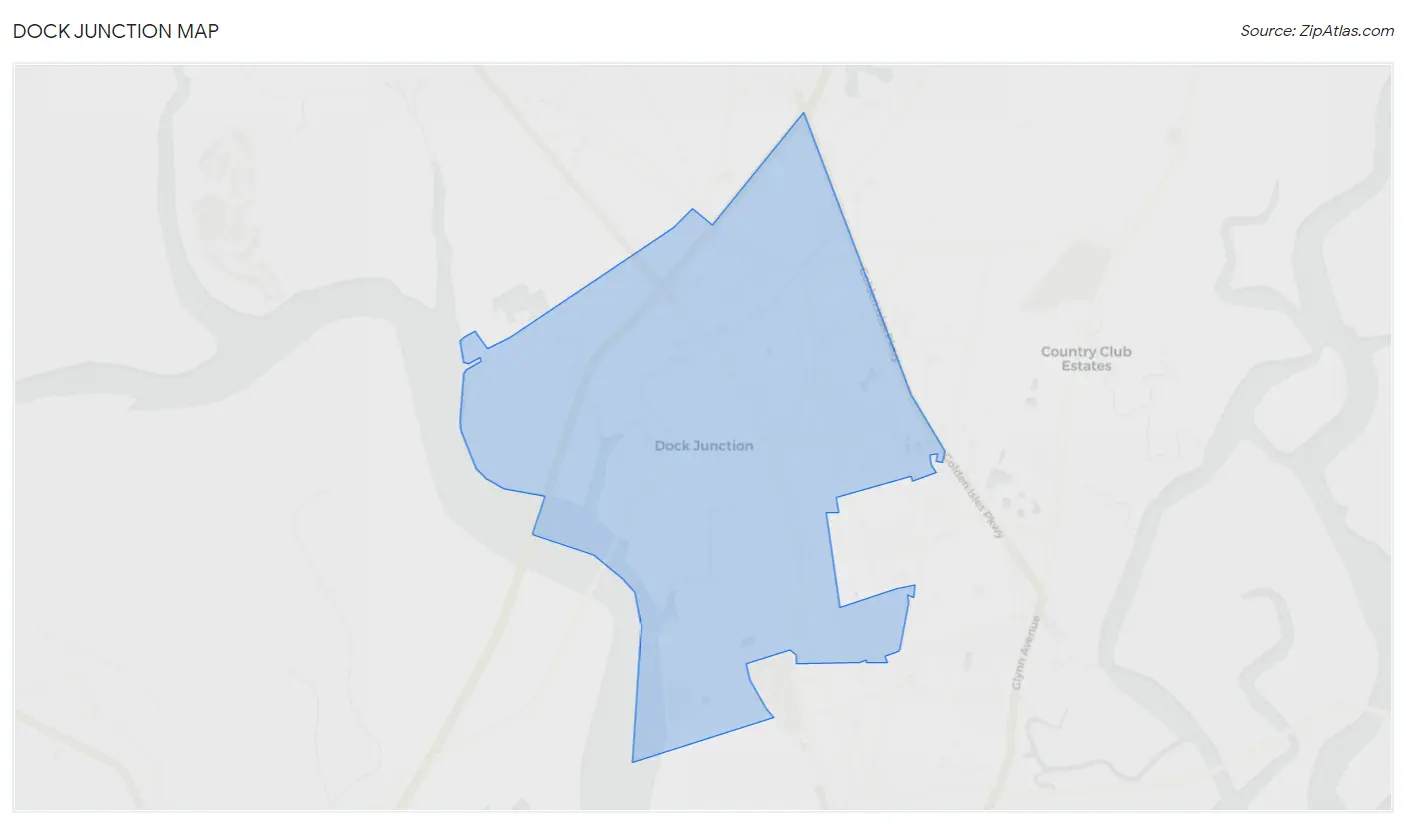
Dock Junction Map
Dock Junction Overview
$25,989
PER CAPITA INCOME
$51,466
AVG FAMILY INCOME
$44,438
AVG HOUSEHOLD INCOME
13.2%
WAGE / INCOME GAP [ % ]
86.8¢/ $1
WAGE / INCOME GAP [ $ ]
0.44
INEQUALITY / GINI INDEX
8,176
TOTAL POPULATION
4,147
MALE POPULATION
4,029
FEMALE POPULATION
102.93
MALES / 100 FEMALES
97.15
FEMALES / 100 MALES
37.6
MEDIAN AGE
3.1
AVG FAMILY SIZE
2.6
AVG HOUSEHOLD SIZE
3,592
LABOR FORCE [ PEOPLE ]
57.9%
PERCENT IN LABOR FORCE
4.6%
UNEMPLOYMENT RATE
Income in Dock Junction
Income Overview in Dock Junction
Per Capita Income in Dock Junction is $25,989, while median incomes of families and households are $51,466 and $44,438 respectively.
| Characteristic | Number | Measure |
| Per Capita Income | 8,176 | $25,989 |
| Median Family Income | 2,043 | $51,466 |
| Mean Family Income | 2,043 | $72,506 |
| Median Household Income | 3,050 | $44,438 |
| Mean Household Income | 3,050 | $66,568 |
| Income Deficit | 2,043 | $0 |
| Wage / Income Gap (%) | 8,176 | 13.20% |
| Wage / Income Gap ($) | 8,176 | 86.80¢ per $1 |
| Gini / Inequality Index | 8,176 | 0.44 |
Earnings by Sex in Dock Junction
Average Earnings in Dock Junction are $30,272, $30,767 for men and $26,705 for women, a difference of 13.2%.
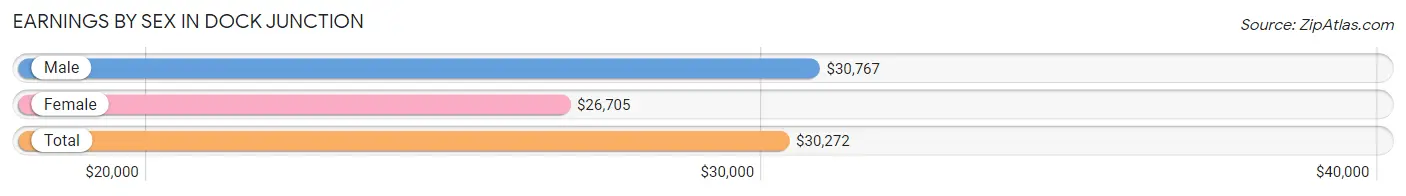
| Sex | Number | Average Earnings |
| Male | 1,922 (51.6%) | $30,767 |
| Female | 1,803 (48.4%) | $26,705 |
| Total | 3,725 (100.0%) | $30,272 |
Earnings by Sex by Income Bracket in Dock Junction
The most common earnings brackets in Dock Junction are $10,000 to $12,499 for men (283 | 14.7%) and $22,500 to $24,999 for women (241 | 13.4%).
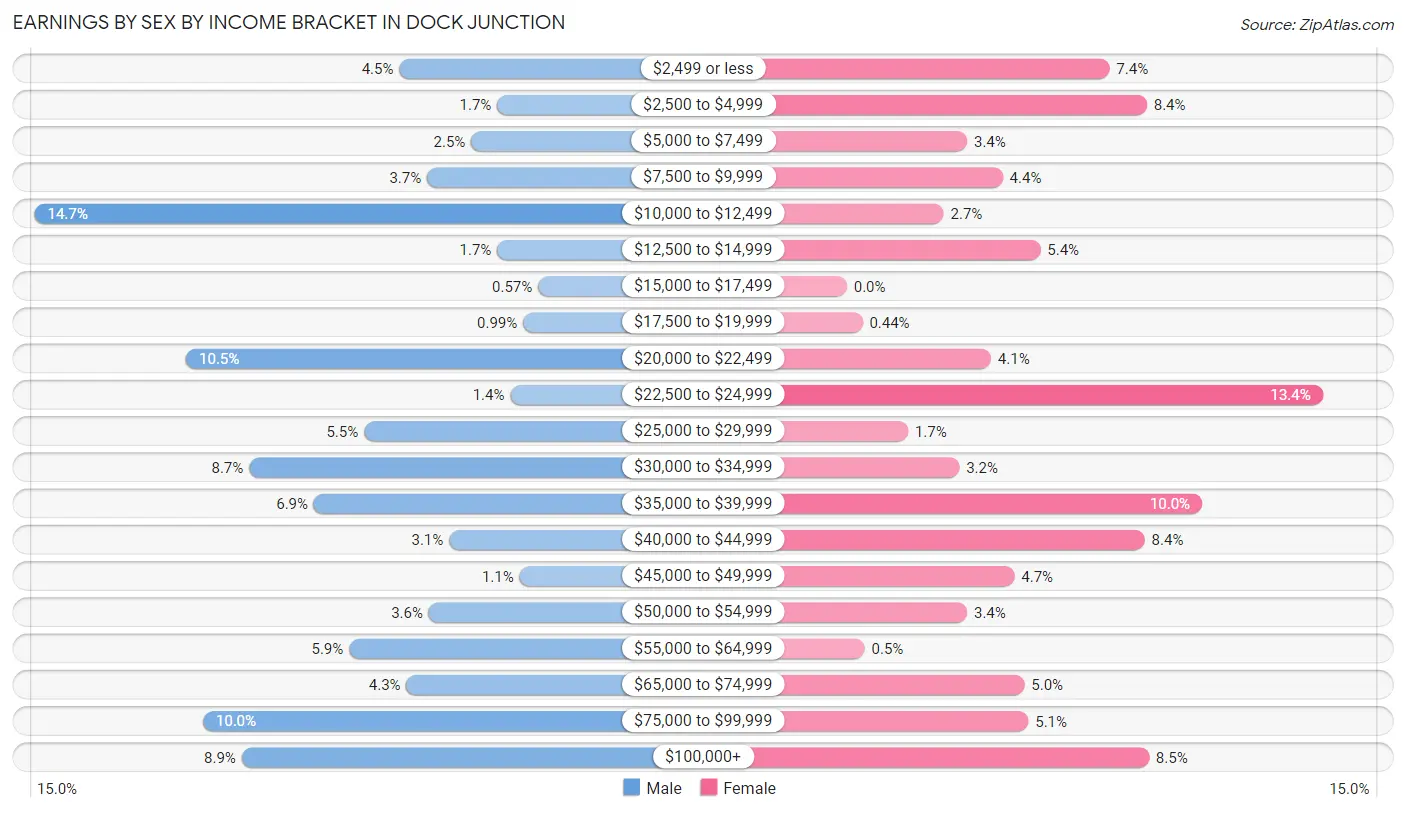
| Income | Male | Female |
| $2,499 or less | 86 (4.5%) | 133 (7.4%) |
| $2,500 to $4,999 | 33 (1.7%) | 152 (8.4%) |
| $5,000 to $7,499 | 47 (2.5%) | 61 (3.4%) |
| $7,500 to $9,999 | 71 (3.7%) | 79 (4.4%) |
| $10,000 to $12,499 | 283 (14.7%) | 49 (2.7%) |
| $12,500 to $14,999 | 33 (1.7%) | 98 (5.4%) |
| $15,000 to $17,499 | 11 (0.6%) | 0 (0.0%) |
| $17,500 to $19,999 | 19 (1.0%) | 8 (0.4%) |
| $20,000 to $22,499 | 201 (10.5%) | 73 (4.1%) |
| $22,500 to $24,999 | 26 (1.3%) | 241 (13.4%) |
| $25,000 to $29,999 | 105 (5.5%) | 31 (1.7%) |
| $30,000 to $34,999 | 167 (8.7%) | 57 (3.2%) |
| $35,000 to $39,999 | 132 (6.9%) | 180 (10.0%) |
| $40,000 to $44,999 | 59 (3.1%) | 151 (8.4%) |
| $45,000 to $49,999 | 21 (1.1%) | 85 (4.7%) |
| $50,000 to $54,999 | 70 (3.6%) | 61 (3.4%) |
| $55,000 to $64,999 | 113 (5.9%) | 9 (0.5%) |
| $65,000 to $74,999 | 82 (4.3%) | 90 (5.0%) |
| $75,000 to $99,999 | 192 (10.0%) | 92 (5.1%) |
| $100,000+ | 171 (8.9%) | 153 (8.5%) |
| Total | 1,922 (100.0%) | 1,803 (100.0%) |
Earnings by Sex by Educational Attainment in Dock Junction
Average earnings in Dock Junction are $31,383 for men and $36,631 for women, a difference of 14.3%. Men with an educational attainment of college or associate's degree enjoy the highest average annual earnings of $38,176, while those with graduate degree education earn the least with $21,635. Women with an educational attainment of graduate degree earn the most with the average annual earnings of $90,179, while those with less than high school education have the smallest earnings of $9,008.
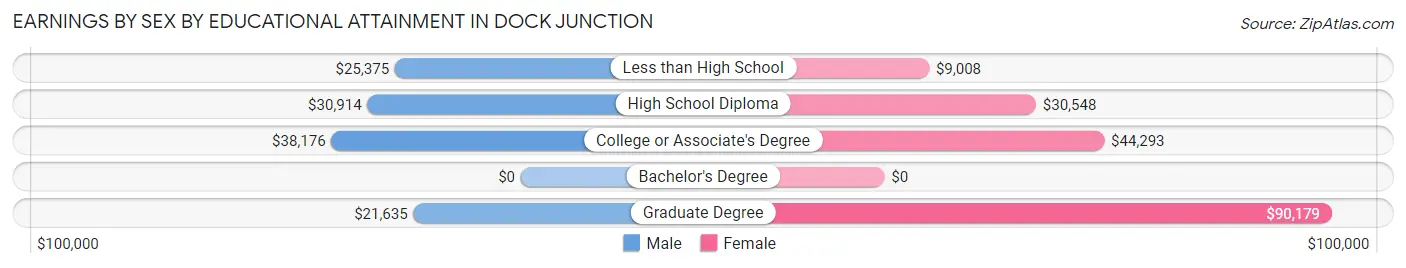
| Educational Attainment | Male Income | Female Income |
| Less than High School | $25,375 | $9,008 |
| High School Diploma | $30,914 | $30,548 |
| College or Associate's Degree | $38,176 | $44,293 |
| Bachelor's Degree | - | - |
| Graduate Degree | $21,635 | $90,179 |
| Total | $31,383 | $36,631 |
Family Income in Dock Junction
Family Income Brackets in Dock Junction
According to the Dock Junction family income data, there are 460 families falling into the $50,000 to $74,999 income range, which is the most common income bracket and makes up 22.5% of all families. Conversely, the less than $10,000 income bracket is the least frequent group with only 72 families (3.5%) belonging to this category.
| Income Bracket | # Families | % Families |
| Less than $10,000 | 72 | 3.5% |
| $10,000 to $14,999 | 274 | 13.4% |
| $15,000 to $24,999 | 159 | 7.8% |
| $25,000 to $34,999 | 165 | 8.1% |
| $35,000 to $49,999 | 321 | 15.7% |
| $50,000 to $74,999 | 460 | 22.5% |
| $75,000 to $99,999 | 206 | 10.1% |
| $100,000 to $149,999 | 133 | 6.5% |
| $150,000 to $199,999 | 112 | 5.5% |
| $200,000+ | 141 | 6.9% |
Family Income by Famaliy Size in Dock Junction
2-person families (927 | 45.4%) account for the highest median family income in Dock Junction with $55,583 per family, while 2-person families (927 | 45.4%) have the highest median income of $27,792 per family member.
| Income Bracket | # Families | Median Income |
| 2-Person Families | 927 (45.4%) | $55,583 |
| 3-Person Families | 728 (35.6%) | $45,714 |
| 4-Person Families | 203 (9.9%) | $31,118 |
| 5-Person Families | 125 (6.1%) | $0 |
| 6-Person Families | 22 (1.1%) | $0 |
| 7+ Person Families | 38 (1.9%) | $0 |
| Total | 2,043 (100.0%) | $51,466 |
Family Income by Number of Earners in Dock Junction
The median family income in Dock Junction is $51,466, with families comprising 3+ earners (210) having the highest median family income of $199,091, while families with 1 earner (1,093) have the lowest median family income of $38,808, accounting for 10.3% and 53.5% of families, respectively.
| Number of Earners | # Families | Median Income |
| No Earners | 369 (18.1%) | $44,191 |
| 1 Earner | 1,093 (53.5%) | $38,808 |
| 2 Earners | 371 (18.2%) | $74,238 |
| 3+ Earners | 210 (10.3%) | $199,091 |
| Total | 2,043 (100.0%) | $51,466 |
Household Income in Dock Junction
Household Income Brackets in Dock Junction
With 747 households falling in the category, the $35,000 to $49,999 income range is the most frequent in Dock Junction, accounting for 24.5% of all households. In contrast, only 98 households (3.2%) fall into the less than $10,000 income bracket, making it the least populous group.
| Income Bracket | # Households | % Households |
| Less than $10,000 | 98 | 3.2% |
| $10,000 to $14,999 | 122 | 4.0% |
| $15,000 to $24,999 | 412 | 13.5% |
| $25,000 to $34,999 | 274 | 9.0% |
| $35,000 to $49,999 | 747 | 24.5% |
| $50,000 to $74,999 | 549 | 18.0% |
| $75,000 to $99,999 | 369 | 12.1% |
| $100,000 to $149,999 | 229 | 7.5% |
| $150,000 to $199,999 | 113 | 3.7% |
| $200,000+ | 140 | 4.6% |
Household Income by Householder Age in Dock Junction
The median household income in Dock Junction is $44,438, with the highest median household income of $54,664 found in the 45 to 64 years age bracket for the primary householder. A total of 1,126 households (36.9%) fall into this category. Meanwhile, the 15 to 24 years age bracket for the primary householder has the lowest median household income of $0, with 4 households (0.1%) in this group.
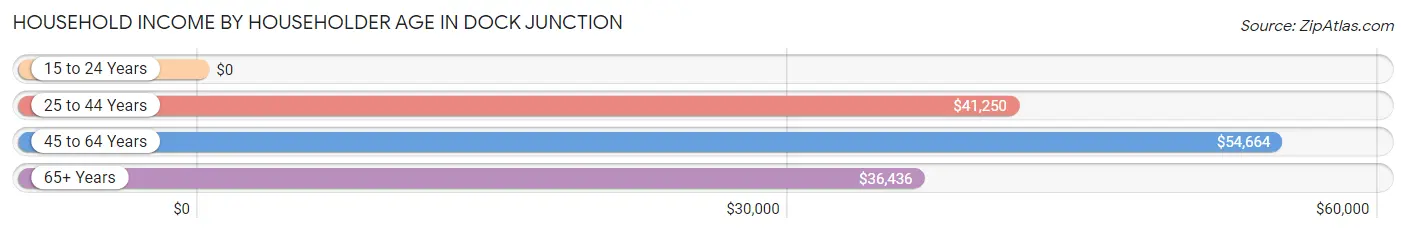
| Income Bracket | # Households | Median Income |
| 15 to 24 Years | 4 (0.1%) | $0 |
| 25 to 44 Years | 993 (32.6%) | $41,250 |
| 45 to 64 Years | 1,126 (36.9%) | $54,664 |
| 65+ Years | 927 (30.4%) | $36,436 |
| Total | 3,050 (100.0%) | $44,438 |
Poverty in Dock Junction
Income Below Poverty by Sex and Age in Dock Junction
With 34.1% poverty level for males and 28.0% for females among the residents of Dock Junction, 16 and 17 year old males and 5 year old females are the most vulnerable to poverty, with 91 males (100.0%) and 271 females (100.0%) in their respective age groups living below the poverty level.
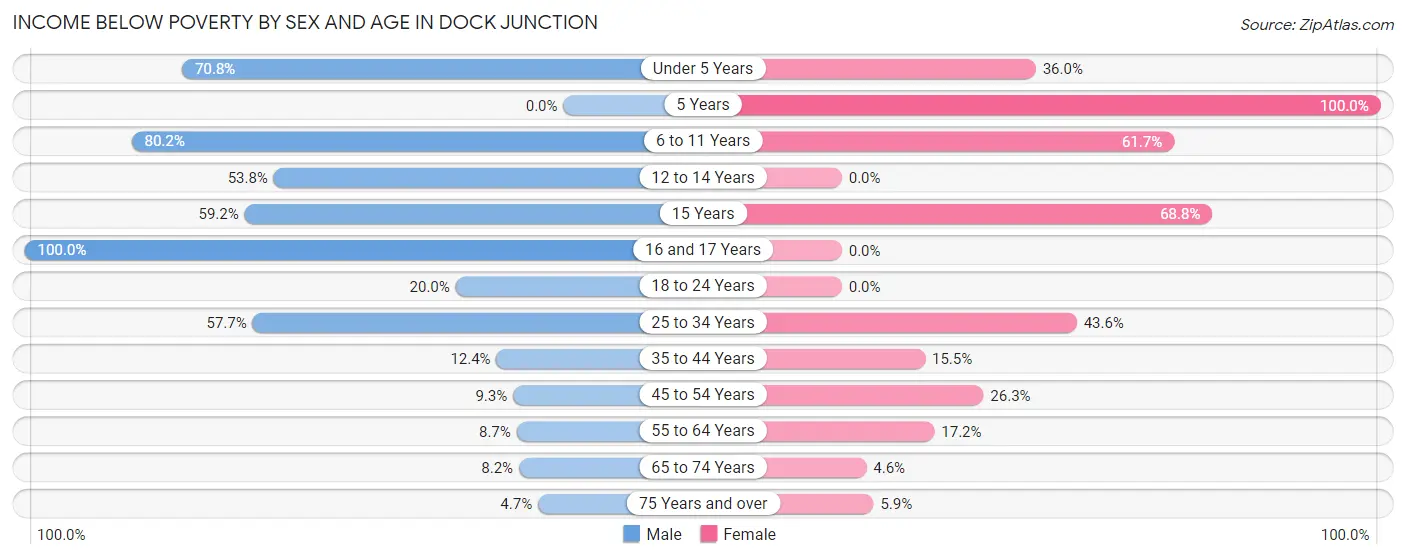
| Age Bracket | Male | Female |
| Under 5 Years | 223 (70.8%) | 63 (36.0%) |
| 5 Years | 0 (0.0%) | 271 (100.0%) |
| 6 to 11 Years | 323 (80.1%) | 201 (61.7%) |
| 12 to 14 Years | 100 (53.8%) | 0 (0.0%) |
| 15 Years | 58 (59.2%) | 33 (68.8%) |
| 16 and 17 Years | 91 (100.0%) | 0 (0.0%) |
| 18 to 24 Years | 25 (20.0%) | 0 (0.0%) |
| 25 to 34 Years | 330 (57.7%) | 242 (43.6%) |
| 35 to 44 Years | 75 (12.4%) | 55 (15.4%) |
| 45 to 54 Years | 46 (9.3%) | 103 (26.3%) |
| 55 to 64 Years | 39 (8.7%) | 89 (17.2%) |
| 65 to 74 Years | 28 (8.2%) | 19 (4.6%) |
| 75 Years and over | 12 (4.7%) | 26 (5.9%) |
| Total | 1,350 (34.1%) | 1,102 (28.0%) |
Income Above Poverty by Sex and Age in Dock Junction
According to the poverty statistics in Dock Junction, males aged 5 years and females aged 12 to 14 years are the age groups that are most secure financially, with 100.0% of males and 100.0% of females in these age groups living above the poverty line.
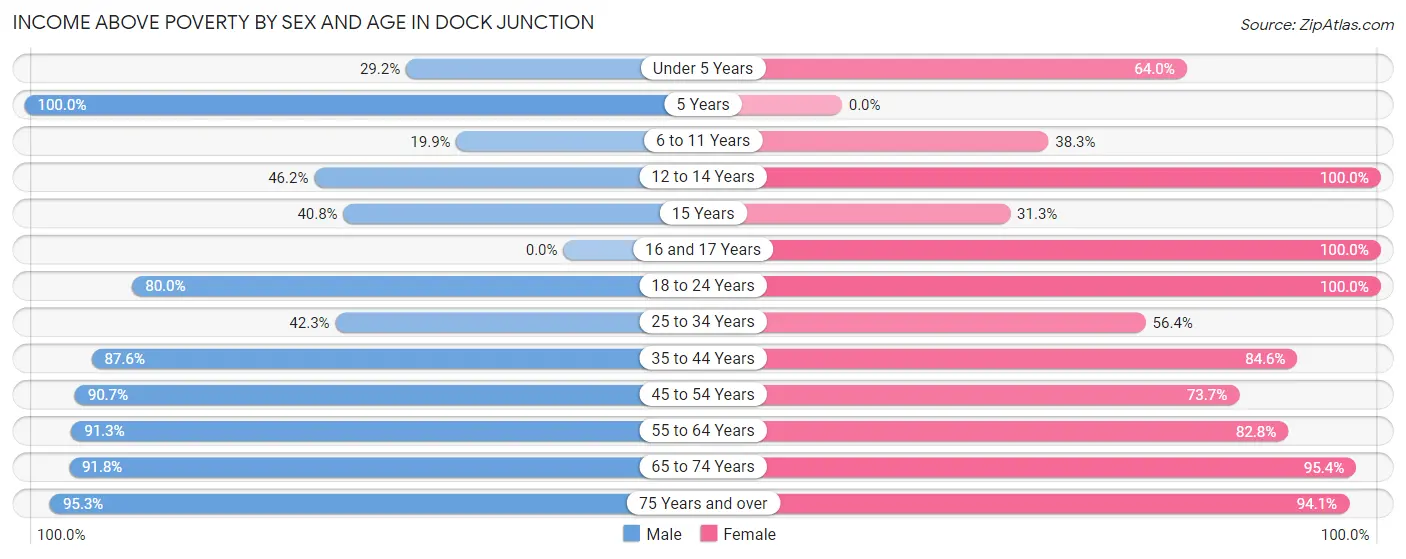
| Age Bracket | Male | Female |
| Under 5 Years | 92 (29.2%) | 112 (64.0%) |
| 5 Years | 33 (100.0%) | 0 (0.0%) |
| 6 to 11 Years | 80 (19.9%) | 125 (38.3%) |
| 12 to 14 Years | 86 (46.2%) | 63 (100.0%) |
| 15 Years | 40 (40.8%) | 15 (31.2%) |
| 16 and 17 Years | 0 (0.0%) | 50 (100.0%) |
| 18 to 24 Years | 100 (80.0%) | 321 (100.0%) |
| 25 to 34 Years | 242 (42.3%) | 313 (56.4%) |
| 35 to 44 Years | 529 (87.6%) | 301 (84.6%) |
| 45 to 54 Years | 447 (90.7%) | 289 (73.7%) |
| 55 to 64 Years | 411 (91.3%) | 429 (82.8%) |
| 65 to 74 Years | 312 (91.8%) | 398 (95.4%) |
| 75 Years and over | 243 (95.3%) | 416 (94.1%) |
| Total | 2,615 (65.9%) | 2,832 (72.0%) |
Income Below Poverty Among Married-Couple Families in Dock Junction
The poverty statistics for married-couple families in Dock Junction show that 10.6% or 117 of the total 1,102 families live below the poverty line. Families with 3 or 4 children have the highest poverty rate of 100.0%, comprising of 47 families. On the other hand, families with 5 or more children have the lowest poverty rate of 0.0%, which includes 0 families.
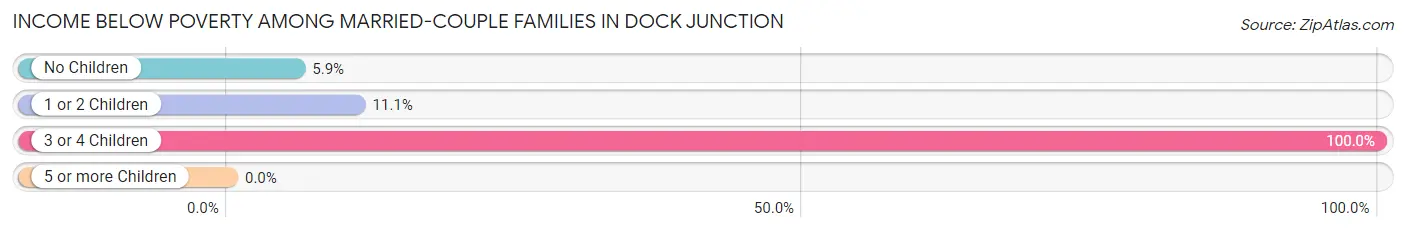
| Children | Above Poverty | Below Poverty |
| No Children | 835 (94.1%) | 52 (5.9%) |
| 1 or 2 Children | 144 (88.9%) | 18 (11.1%) |
| 3 or 4 Children | 0 (0.0%) | 47 (100.0%) |
| 5 or more Children | 6 (100.0%) | 0 (0.0%) |
| Total | 985 (89.4%) | 117 (10.6%) |
Income Below Poverty Among Single-Parent Households in Dock Junction
According to the poverty data in Dock Junction, 60.1% or 255 single-father households and 24.8% or 128 single-mother households are living below the poverty line. Among single-father households, those with 5 or more children have the highest poverty rate, with 32 households (74.4%) experiencing poverty. Likewise, among single-mother households, those with 3 or 4 children have the highest poverty rate, with 71 households (100.0%) falling below the poverty line.
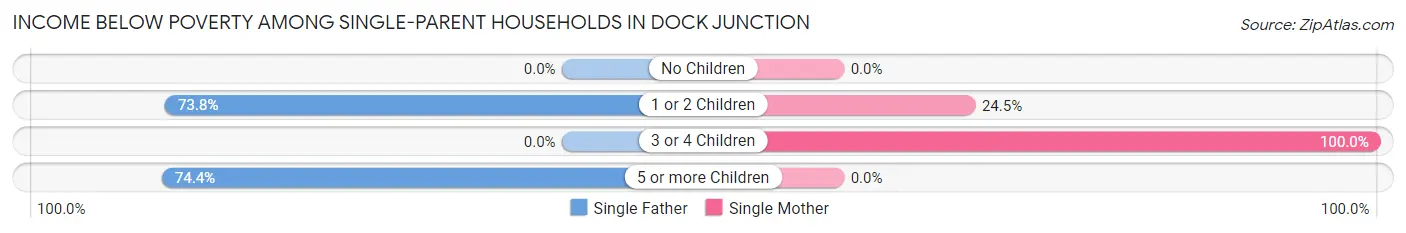
| Children | Single Father | Single Mother |
| No Children | 0 (0.0%) | 0 (0.0%) |
| 1 or 2 Children | 223 (73.8%) | 57 (24.5%) |
| 3 or 4 Children | 0 (0.0%) | 71 (100.0%) |
| 5 or more Children | 32 (74.4%) | 0 (0.0%) |
| Total | 255 (60.1%) | 128 (24.8%) |
Income Below Poverty Among Married-Couple vs Single-Parent Households in Dock Junction
The poverty data for Dock Junction shows that 117 of the married-couple family households (10.6%) and 383 of the single-parent households (40.7%) are living below the poverty level. Within the married-couple family households, those with 3 or 4 children have the highest poverty rate, with 47 households (100.0%) falling below the poverty line. Among the single-parent households, those with 3 or 4 children have the highest poverty rate, with 71 household (83.5%) living below poverty.
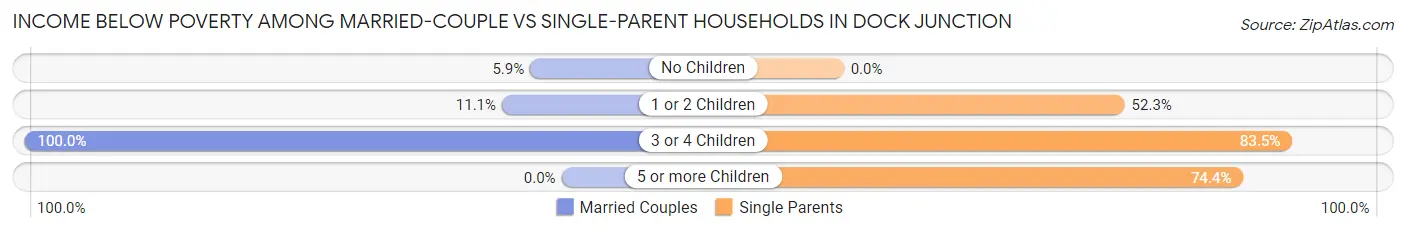
| Children | Married-Couple Families | Single-Parent Households |
| No Children | 52 (5.9%) | 0 (0.0%) |
| 1 or 2 Children | 18 (11.1%) | 280 (52.3%) |
| 3 or 4 Children | 47 (100.0%) | 71 (83.5%) |
| 5 or more Children | 0 (0.0%) | 32 (74.4%) |
| Total | 117 (10.6%) | 383 (40.7%) |
Race in Dock Junction
The most populous races in Dock Junction are White / Caucasian (4,357 | 53.3%), Black / African American (1,867 | 22.8%), and Two or more Races (1,133 | 13.9%).
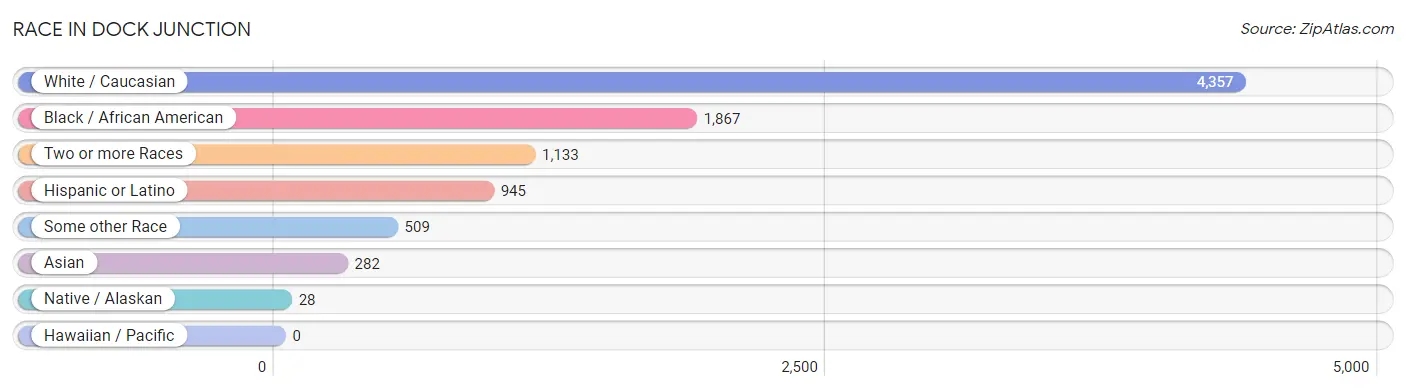
| Race | # Population | % Population |
| Asian | 282 | 3.5% |
| Black / African American | 1,867 | 22.8% |
| Hawaiian / Pacific | 0 | 0.0% |
| Hispanic or Latino | 945 | 11.6% |
| Native / Alaskan | 28 | 0.3% |
| White / Caucasian | 4,357 | 53.3% |
| Two or more Races | 1,133 | 13.9% |
| Some other Race | 509 | 6.2% |
| Total | 8,176 | 100.0% |
Ancestry in Dock Junction
The most populous ancestries reported in Dock Junction are American (990 | 12.1%), Italian (976 | 11.9%), English (840 | 10.3%), Irish (473 | 5.8%), and Mexican (408 | 5.0%), together accounting for 45.1% of all Dock Junction residents.
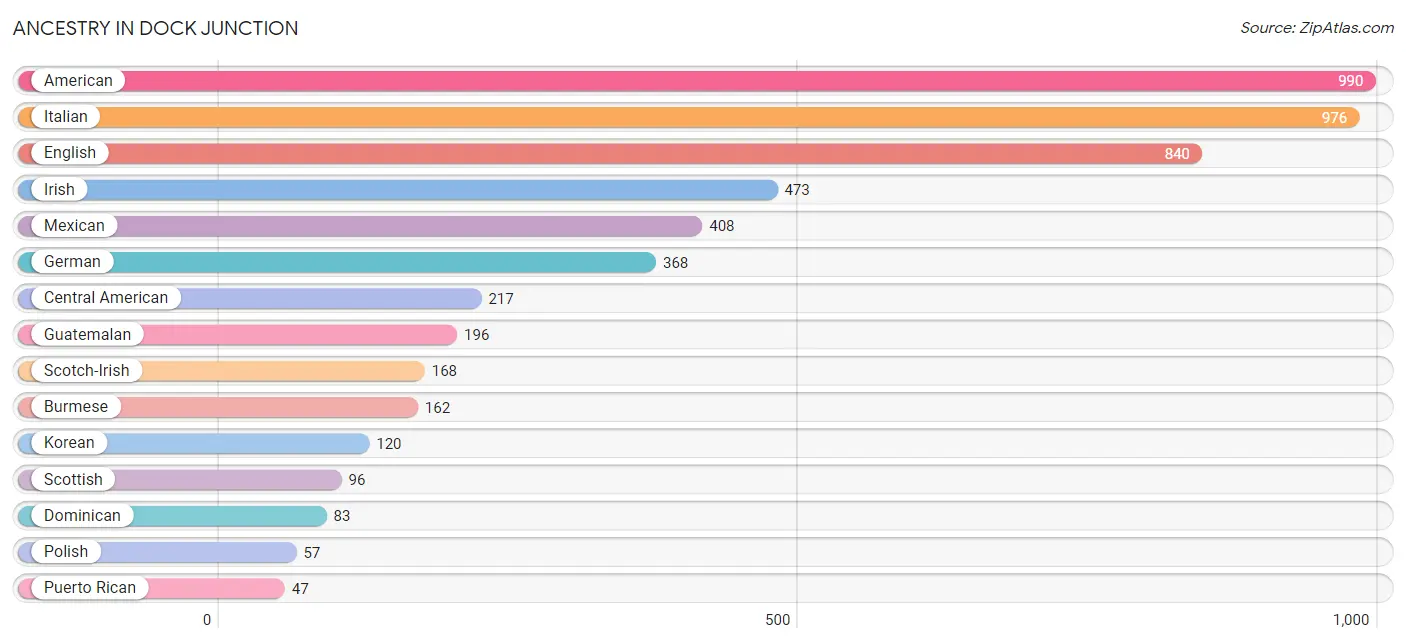
| Ancestry | # Population | % Population |
| American | 990 | 12.1% |
| Blackfeet | 9 | 0.1% |
| Burmese | 162 | 2.0% |
| Central American | 217 | 2.6% |
| Cherokee | 11 | 0.1% |
| Cuban | 8 | 0.1% |
| Czech | 42 | 0.5% |
| Dominican | 83 | 1.0% |
| Dutch | 20 | 0.2% |
| Eastern European | 24 | 0.3% |
| English | 840 | 10.3% |
| European | 38 | 0.5% |
| French | 8 | 0.1% |
| German | 368 | 4.5% |
| Guatemalan | 196 | 2.4% |
| Hungarian | 25 | 0.3% |
| Indian (Asian) | 45 | 0.5% |
| Irish | 473 | 5.8% |
| Italian | 976 | 11.9% |
| Korean | 120 | 1.5% |
| Malaysian | 43 | 0.5% |
| Mexican | 408 | 5.0% |
| Navajo | 17 | 0.2% |
| Norwegian | 40 | 0.5% |
| Polish | 57 | 0.7% |
| Portuguese | 14 | 0.2% |
| Puerto Rican | 47 | 0.6% |
| Russian | 47 | 0.6% |
| Salvadoran | 21 | 0.3% |
| Scotch-Irish | 168 | 2.1% |
| Scottish | 96 | 1.2% |
| Swedish | 9 | 0.1% |
| Welsh | 8 | 0.1% |
| Yugoslavian | 34 | 0.4% | View All 34 Rows |
Immigrants in Dock Junction
The most numerous immigrant groups reported in Dock Junction came from Latin America (490 | 6.0%), Central America (475 | 5.8%), Asia (250 | 3.1%), Mexico (220 | 2.7%), and Guatemala (192 | 2.4%), together accounting for 19.9% of all Dock Junction residents.
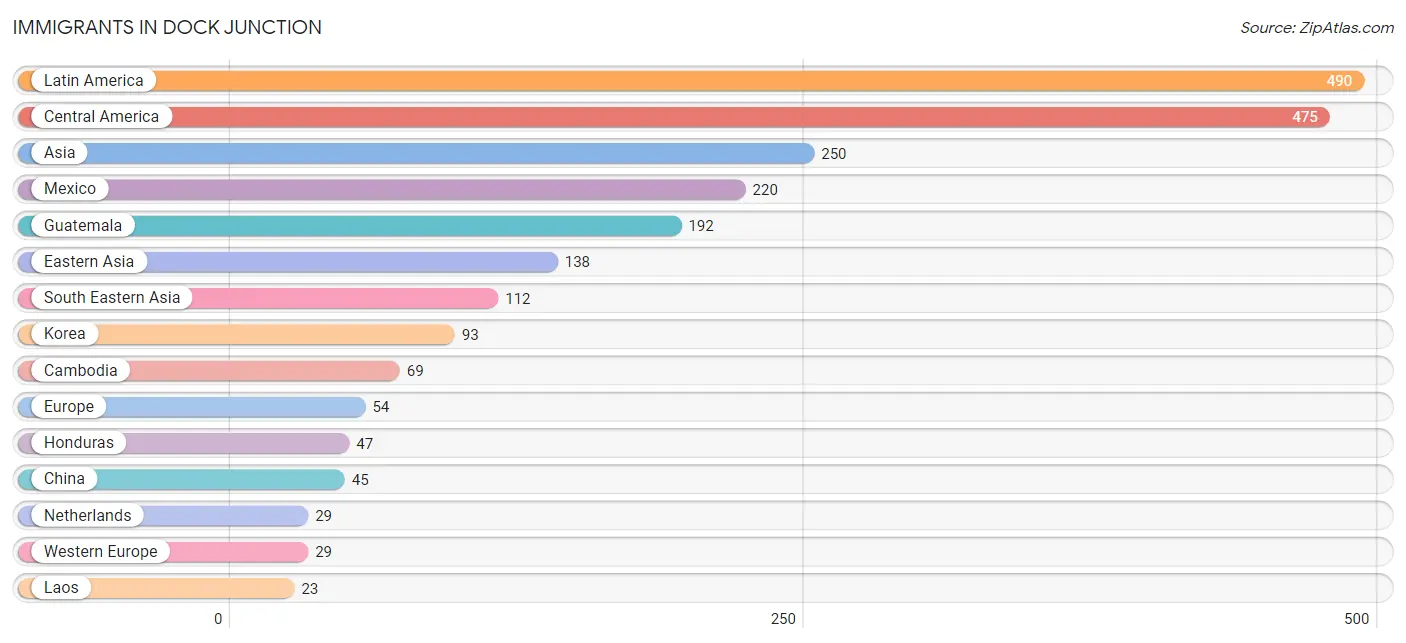
| Immigration Origin | # Population | % Population |
| Asia | 250 | 3.1% |
| Bahamas | 15 | 0.2% |
| Cambodia | 69 | 0.8% |
| Caribbean | 15 | 0.2% |
| Central America | 475 | 5.8% |
| China | 45 | 0.5% |
| Eastern Asia | 138 | 1.7% |
| Eastern Europe | 20 | 0.2% |
| El Salvador | 16 | 0.2% |
| Europe | 54 | 0.7% |
| Guatemala | 192 | 2.4% |
| Honduras | 47 | 0.6% |
| Hungary | 7 | 0.1% |
| Korea | 93 | 1.1% |
| Laos | 23 | 0.3% |
| Latin America | 490 | 6.0% |
| Mexico | 220 | 2.7% |
| Netherlands | 29 | 0.4% |
| Northern Europe | 5 | 0.1% |
| South Eastern Asia | 112 | 1.4% |
| Sweden | 5 | 0.1% |
| Thailand | 20 | 0.2% |
| Western Europe | 29 | 0.4% | View All 23 Rows |
Sex and Age in Dock Junction
Sex and Age in Dock Junction
The most populous age groups in Dock Junction are 50 to 54 Years (407 | 9.8%) for men and 5 to 9 Years (560 | 13.9%) for women.
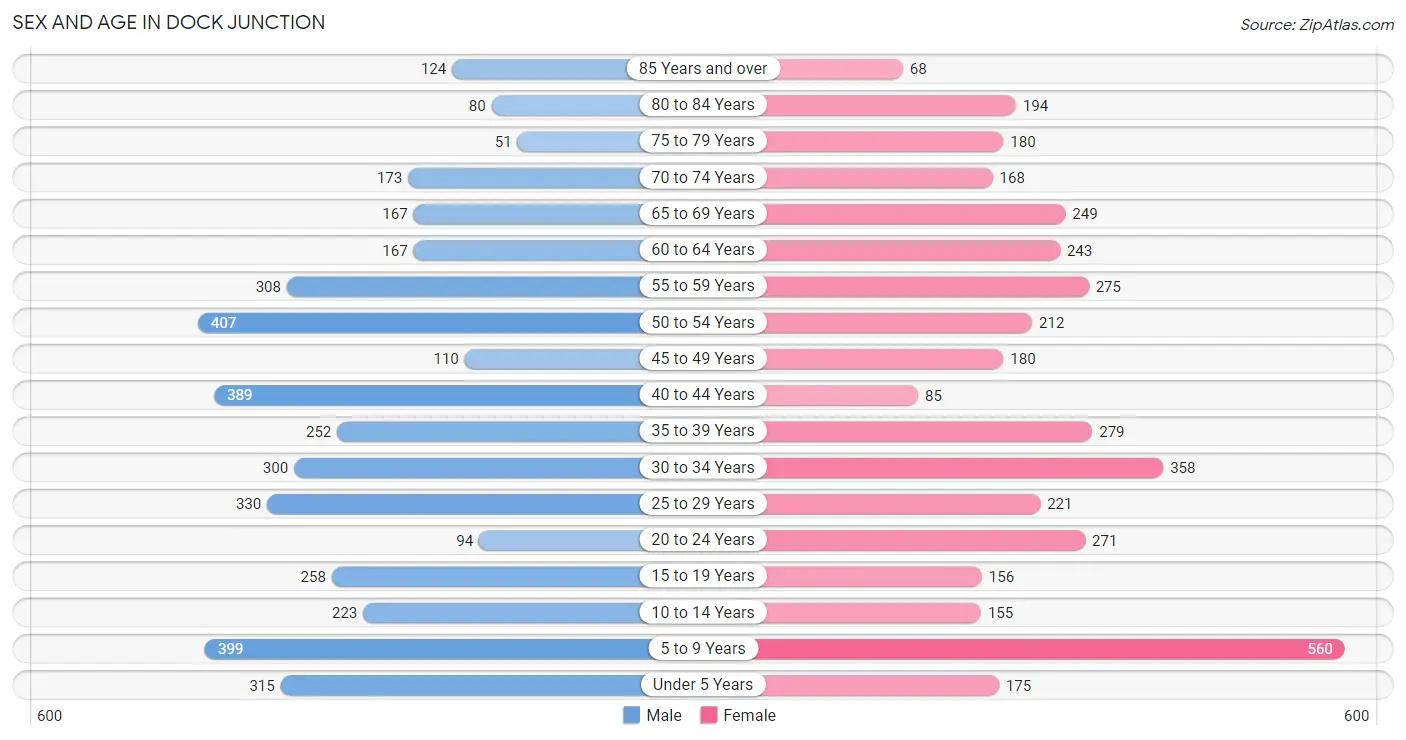
| Age Bracket | Male | Female |
| Under 5 Years | 315 (7.6%) | 175 (4.3%) |
| 5 to 9 Years | 399 (9.6%) | 560 (13.9%) |
| 10 to 14 Years | 223 (5.4%) | 155 (3.8%) |
| 15 to 19 Years | 258 (6.2%) | 156 (3.9%) |
| 20 to 24 Years | 94 (2.3%) | 271 (6.7%) |
| 25 to 29 Years | 330 (8.0%) | 221 (5.5%) |
| 30 to 34 Years | 300 (7.2%) | 358 (8.9%) |
| 35 to 39 Years | 252 (6.1%) | 279 (6.9%) |
| 40 to 44 Years | 389 (9.4%) | 85 (2.1%) |
| 45 to 49 Years | 110 (2.6%) | 180 (4.5%) |
| 50 to 54 Years | 407 (9.8%) | 212 (5.3%) |
| 55 to 59 Years | 308 (7.4%) | 275 (6.8%) |
| 60 to 64 Years | 167 (4.0%) | 243 (6.0%) |
| 65 to 69 Years | 167 (4.0%) | 249 (6.2%) |
| 70 to 74 Years | 173 (4.2%) | 168 (4.2%) |
| 75 to 79 Years | 51 (1.2%) | 180 (4.5%) |
| 80 to 84 Years | 80 (1.9%) | 194 (4.8%) |
| 85 Years and over | 124 (3.0%) | 68 (1.7%) |
| Total | 4,147 (100.0%) | 4,029 (100.0%) |
Families and Households in Dock Junction
Median Family Size in Dock Junction
The median family size in Dock Junction is 3.09 persons per family, with single male/father families (424 | 20.7%) accounting for the largest median family size of 3.68 persons per family. On the other hand, married-couple families (1,102 | 53.9%) represent the smallest median family size with 2.89 persons per family.
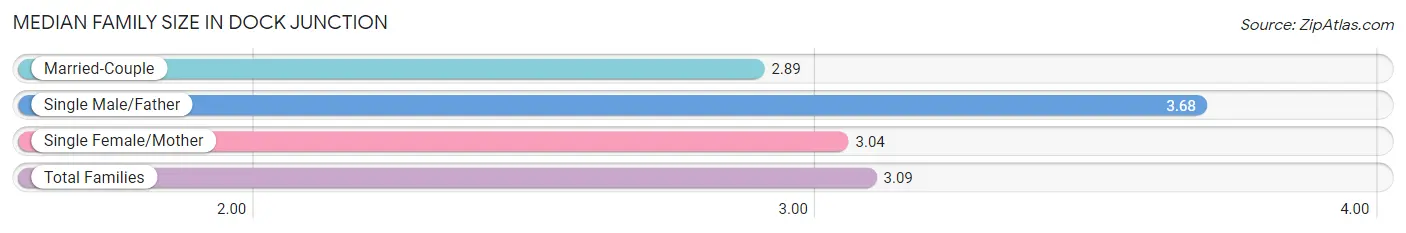
| Family Type | # Families | Family Size |
| Married-Couple | 1,102 (53.9%) | 2.89 |
| Single Male/Father | 424 (20.7%) | 3.68 |
| Single Female/Mother | 517 (25.3%) | 3.04 |
| Total Families | 2,043 (100.0%) | 3.09 |
Median Household Size in Dock Junction
The median household size in Dock Junction is 2.61 persons per household, with single male/father households (424 | 13.9%) accounting for the largest median household size of 4.44 persons per household. non-family households (1,007 | 33.0%) represent the smallest median household size with 1.20 persons per household.
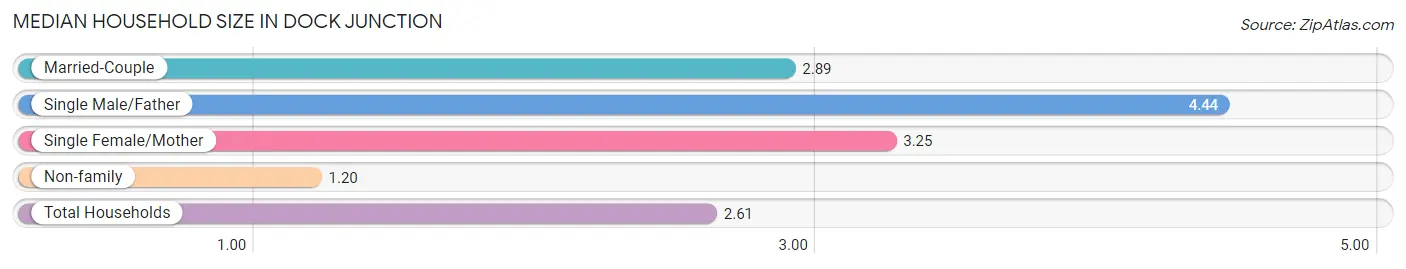
| Household Type | # Households | Household Size |
| Married-Couple | 1,102 (36.1%) | 2.89 |
| Single Male/Father | 424 (13.9%) | 4.44 |
| Single Female/Mother | 517 (17.0%) | 3.25 |
| Non-family | 1,007 (33.0%) | 1.20 |
| Total Households | 3,050 (100.0%) | 2.61 |
Household Size by Marriage Status in Dock Junction
Out of a total of 3,050 households in Dock Junction, 2,043 (67.0%) are family households, while 1,007 (33.0%) are nonfamily households. The most numerous type of family households are 2-person households, comprising 907, and the most common type of nonfamily households are 1-person households, comprising 937.
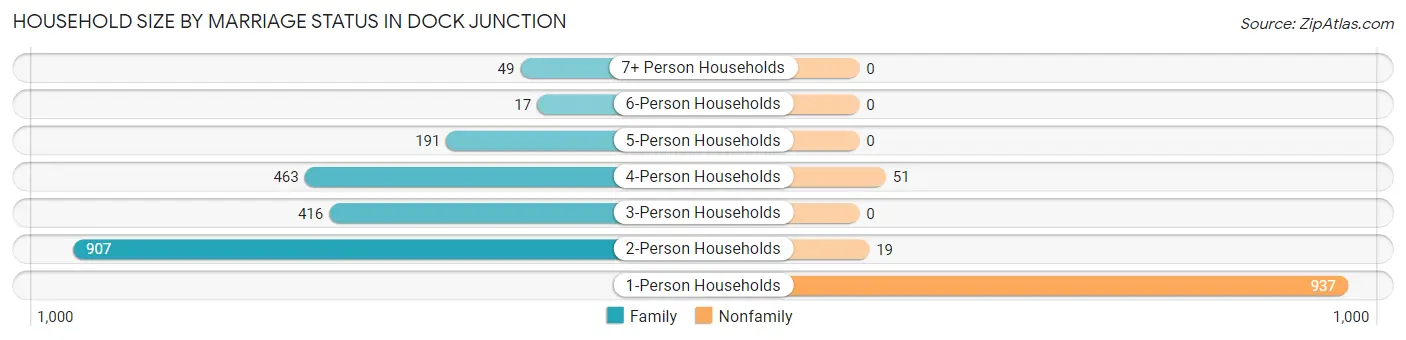
| Household Size | Family Households | Nonfamily Households |
| 1-Person Households | - | 937 (30.7%) |
| 2-Person Households | 907 (29.7%) | 19 (0.6%) |
| 3-Person Households | 416 (13.6%) | 0 (0.0%) |
| 4-Person Households | 463 (15.2%) | 51 (1.7%) |
| 5-Person Households | 191 (6.3%) | 0 (0.0%) |
| 6-Person Households | 17 (0.6%) | 0 (0.0%) |
| 7+ Person Households | 49 (1.6%) | 0 (0.0%) |
| Total | 2,043 (67.0%) | 1,007 (33.0%) |
Female Fertility in Dock Junction
Fertility by Age in Dock Junction
Average fertility rate in Dock Junction is 136.0 births per 1,000 women. Women in the age bracket of 20 to 34 years have the highest fertility rate with 254.0 births per 1,000 women. Women in the age bracket of 20 to 34 years acount for 96.0% of all women with births.
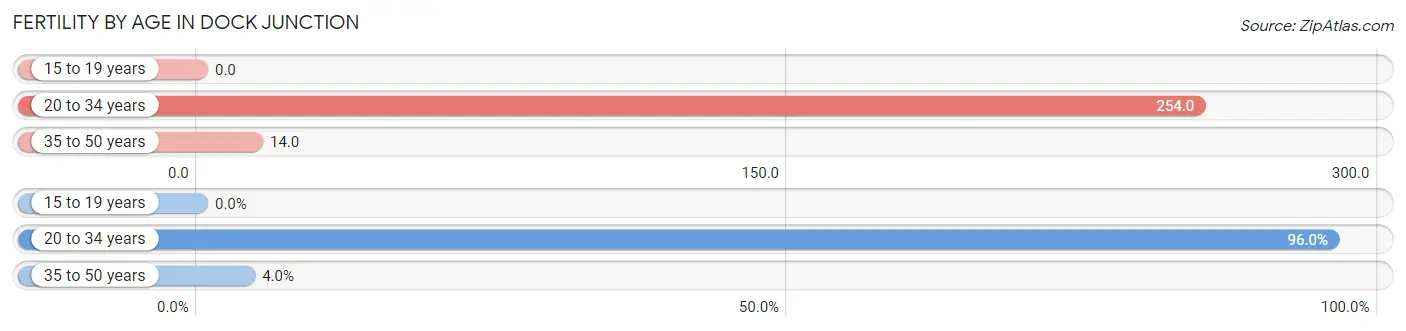
| Age Bracket | Women with Births | Births / 1,000 Women |
| 15 to 19 years | 0 (0.0%) | 0.0 |
| 20 to 34 years | 216 (96.0%) | 254.0 |
| 35 to 50 years | 9 (4.0%) | 14.0 |
| Total | 225 (100.0%) | 136.0 |
Fertility by Age by Marriage Status in Dock Junction

| Age Bracket | Married | Unmarried |
| 15 to 19 years | 0 (0.0%) | 0 (0.0%) |
| 20 to 34 years | 0 (0.0%) | 216 (100.0%) |
| 35 to 50 years | 0 (0.0%) | 9 (100.0%) |
| Total | 0 (0.0%) | 225 (100.0%) |
Fertility by Education in Dock Junction
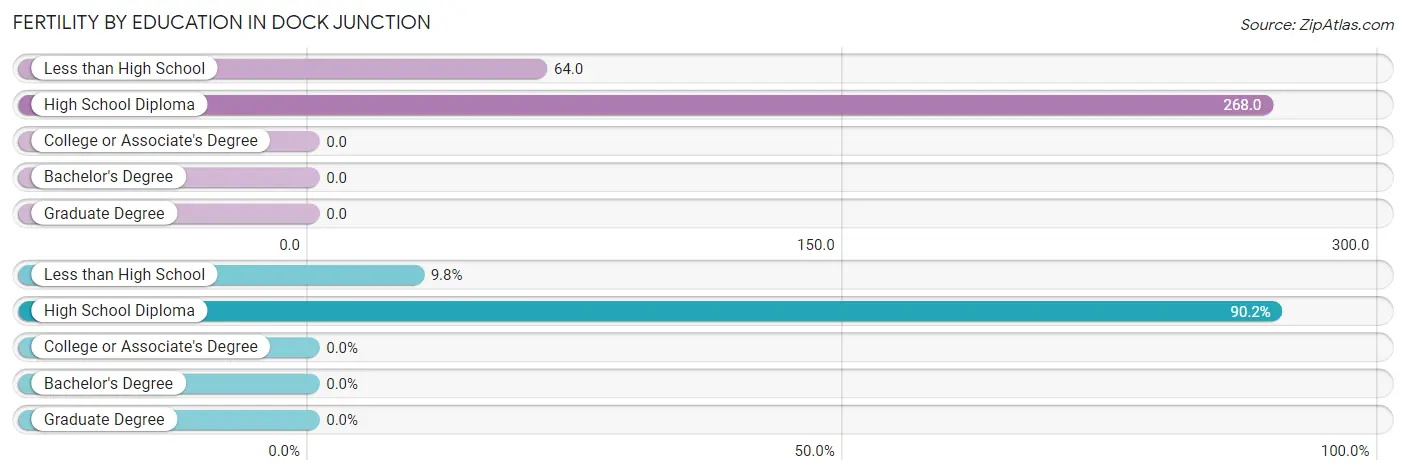
| Educational Attainment | Women with Births | Births / 1,000 Women |
| Less than High School | 22 (9.8%) | 64.0 |
| High School Diploma | 203 (90.2%) | 268.0 |
| College or Associate's Degree | 0 (0.0%) | 0.0 |
| Bachelor's Degree | 0 (0.0%) | 0.0 |
| Graduate Degree | 0 (0.0%) | 0.0 |
| Total | 225 (100.0%) | 136.0 |
Fertility by Education by Marriage Status in Dock Junction
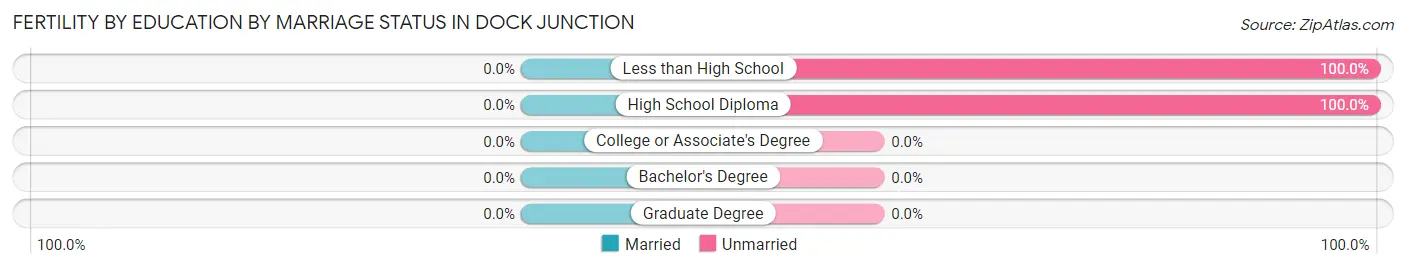
| Educational Attainment | Married | Unmarried |
| Less than High School | 0 (0.0%) | 22 (100.0%) |
| High School Diploma | 0 (0.0%) | 203 (100.0%) |
| College or Associate's Degree | 0 (0.0%) | 0 (0.0%) |
| Bachelor's Degree | 0 (0.0%) | 0 (0.0%) |
| Graduate Degree | 0 (0.0%) | 0 (0.0%) |
| Total | 0 (0.0%) | 225 (100.0%) |
Employment Characteristics in Dock Junction
Employment by Class of Employer in Dock Junction
Among the 3,035 employed individuals in Dock Junction, private company employees (2,436 | 80.3%), self-employed (not incorporated) (241 | 7.9%), and local government employees (151 | 5.0%) make up the most common classes of employment.
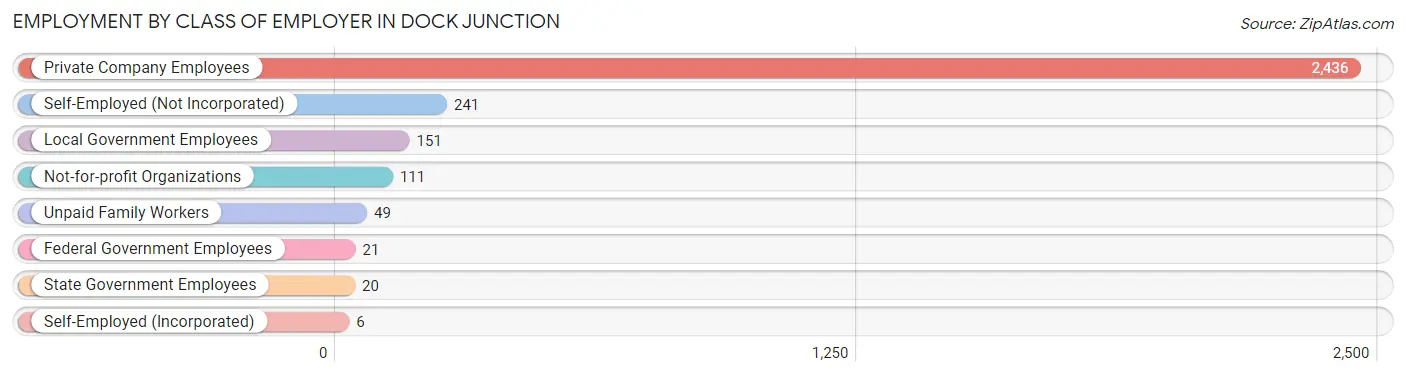
| Employer Class | # Employees | % Employees |
| Private Company Employees | 2,436 | 80.3% |
| Self-Employed (Incorporated) | 6 | 0.2% |
| Self-Employed (Not Incorporated) | 241 | 7.9% |
| Not-for-profit Organizations | 111 | 3.7% |
| Local Government Employees | 151 | 5.0% |
| State Government Employees | 20 | 0.7% |
| Federal Government Employees | 21 | 0.7% |
| Unpaid Family Workers | 49 | 1.6% |
| Total | 3,035 | 100.0% |
Employment Status by Age in Dock Junction
According to the labor force statistics for Dock Junction, out of the total population over 16 years of age (6,203), 57.9% or 3,592 individuals are in the labor force, with 4.6% or 165 of them unemployed. The age group with the highest labor force participation rate is 20 to 24 years, with 81.4% or 297 individuals in the labor force. Within the labor force, the 16 to 19 years age range has the highest percentage of unemployed individuals, with 18.2% or 10 of them being unemployed.
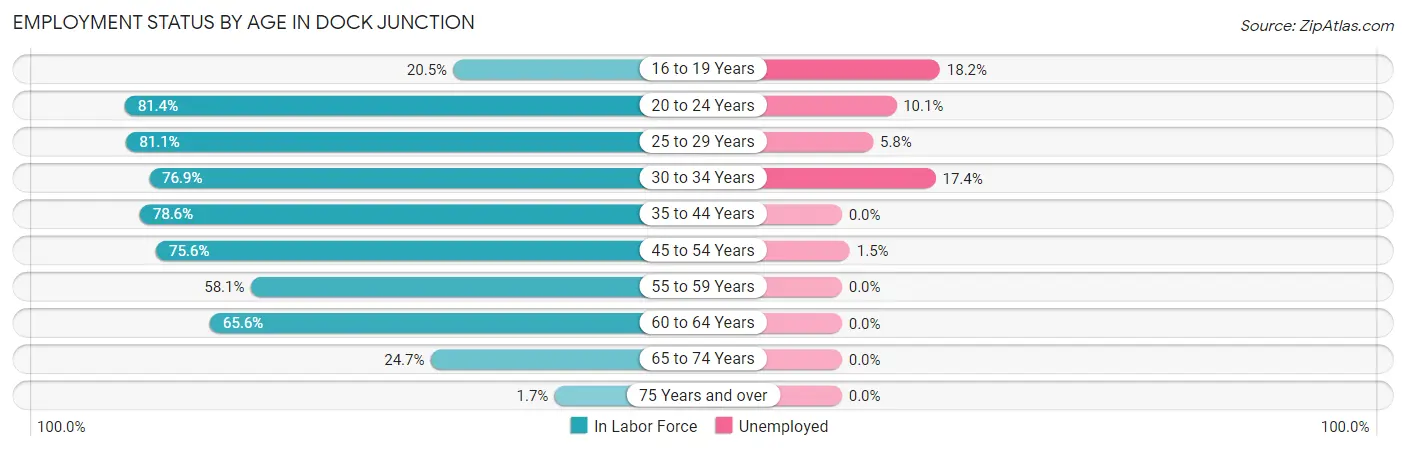
| Age Bracket | In Labor Force | Unemployed |
| 16 to 19 Years | 55 (20.5%) | 10 (18.2%) |
| 20 to 24 Years | 297 (81.4%) | 30 (10.1%) |
| 25 to 29 Years | 447 (81.1%) | 26 (5.8%) |
| 30 to 34 Years | 506 (76.9%) | 88 (17.4%) |
| 35 to 44 Years | 790 (78.6%) | 0 (0.0%) |
| 45 to 54 Years | 687 (75.6%) | 10 (1.5%) |
| 55 to 59 Years | 339 (58.1%) | 0 (0.0%) |
| 60 to 64 Years | 269 (65.6%) | 0 (0.0%) |
| 65 to 74 Years | 187 (24.7%) | 0 (0.0%) |
| 75 Years and over | 12 (1.7%) | 0 (0.0%) |
| Total | 3,592 (57.9%) | 165 (4.6%) |
Employment Status by Educational Attainment in Dock Junction
According to labor force statistics for Dock Junction, 73.8% of individuals (3,038) out of the total population between 25 and 64 years of age (4,116) are in the labor force, with 4.1% or 125 of them being unemployed. The group with the highest labor force participation rate are those with the educational attainment of bachelor's degree or higher, with 97.6% or 442 individuals in the labor force. Within the labor force, individuals with less than high school education have the highest percentage of unemployment, with 26.8% or 98 of them being unemployed.
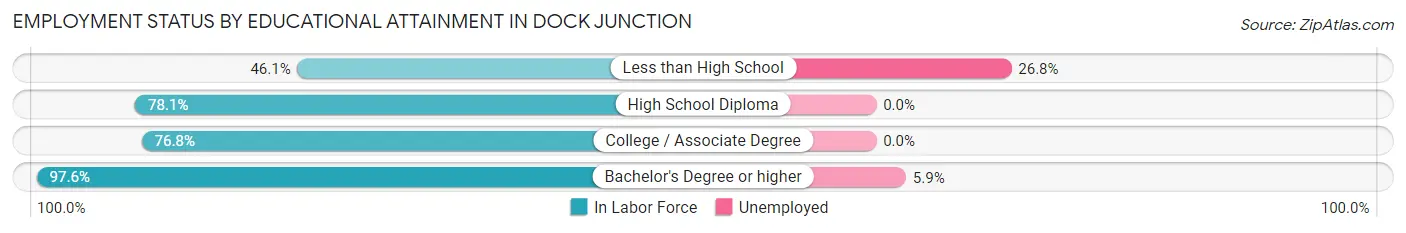
| Educational Attainment | In Labor Force | Unemployed |
| Less than High School | 365 (46.1%) | 212 (26.8%) |
| High School Diploma | 1,509 (78.1%) | 0 (0.0%) |
| College / Associate Degree | 722 (76.8%) | 0 (0.0%) |
| Bachelor's Degree or higher | 442 (97.6%) | 27 (5.9%) |
| Total | 3,038 (73.8%) | 169 (4.1%) |
Employment Occupations by Sex in Dock Junction
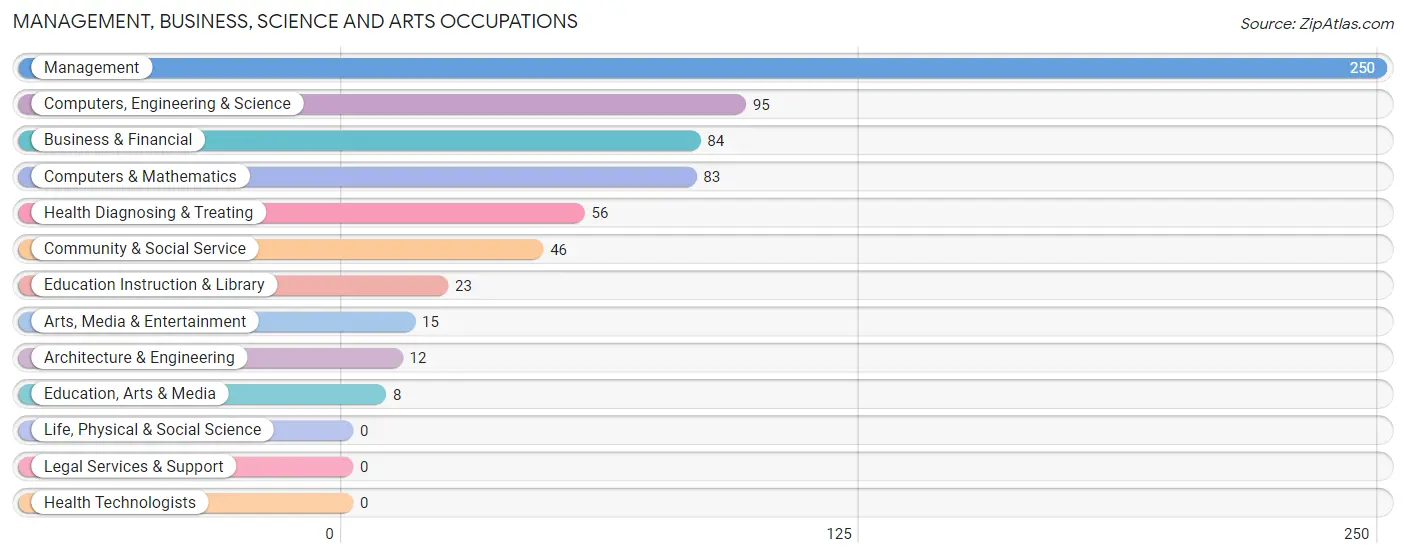
Management, Business, Science and Arts Occupations
The most common Management, Business, Science and Arts occupations in Dock Junction are Management (250 | 7.3%), Computers, Engineering & Science (95 | 2.8%), Business & Financial (84 | 2.5%), Computers & Mathematics (83 | 2.4%), and Health Diagnosing & Treating (56 | 1.6%).
Management, Business, Science and Arts Occupations by Sex
Within the Management, Business, Science and Arts occupations in Dock Junction, the most male-oriented occupations are Architecture & Engineering (100.0%), Arts, Media & Entertainment (100.0%), and Community & Social Service (63.0%), while the most female-oriented occupations are Computers & Mathematics (100.0%), Education, Arts & Media (100.0%), and Health Diagnosing & Treating (100.0%).
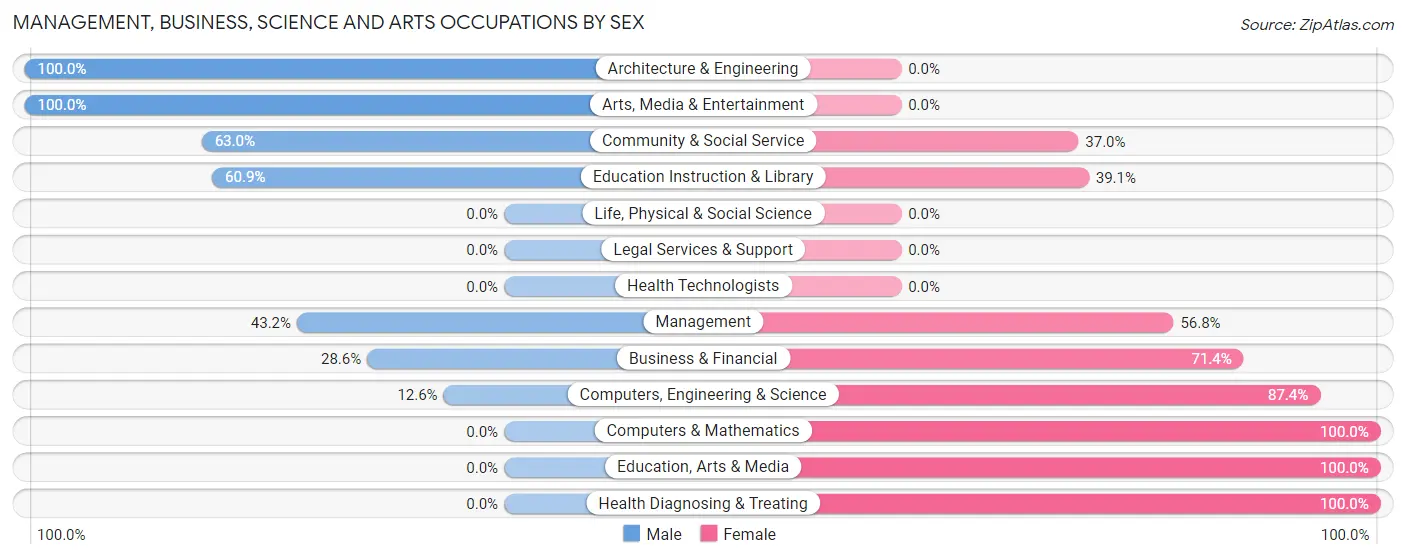
| Occupation | Male | Female |
| Management | 108 (43.2%) | 142 (56.8%) |
| Business & Financial | 24 (28.6%) | 60 (71.4%) |
| Computers, Engineering & Science | 12 (12.6%) | 83 (87.4%) |
| Computers & Mathematics | 0 (0.0%) | 83 (100.0%) |
| Architecture & Engineering | 12 (100.0%) | 0 (0.0%) |
| Life, Physical & Social Science | 0 (0.0%) | 0 (0.0%) |
| Community & Social Service | 29 (63.0%) | 17 (37.0%) |
| Education, Arts & Media | 0 (0.0%) | 8 (100.0%) |
| Legal Services & Support | 0 (0.0%) | 0 (0.0%) |
| Education Instruction & Library | 14 (60.9%) | 9 (39.1%) |
| Arts, Media & Entertainment | 15 (100.0%) | 0 (0.0%) |
| Health Diagnosing & Treating | 0 (0.0%) | 56 (100.0%) |
| Health Technologists | 0 (0.0%) | 0 (0.0%) |
| Total (Category) | 173 (32.6%) | 358 (67.4%) |
| Total (Overall) | 1,791 (52.3%) | 1,634 (47.7%) |
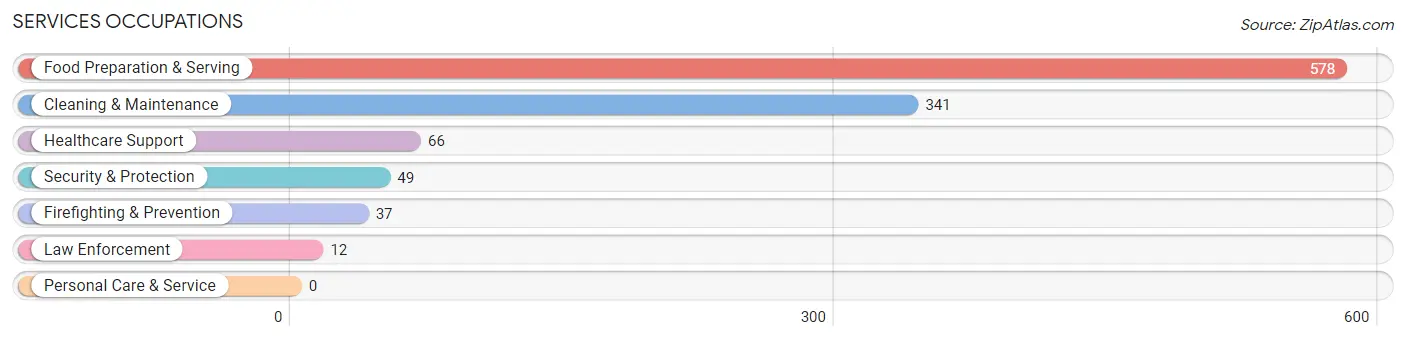
Services Occupations
The most common Services occupations in Dock Junction are Food Preparation & Serving (578 | 16.9%), Cleaning & Maintenance (341 | 10.0%), Healthcare Support (66 | 1.9%), Security & Protection (49 | 1.4%), and Firefighting & Prevention (37 | 1.1%).
Services Occupations by Sex
Within the Services occupations in Dock Junction, the most male-oriented occupations are Security & Protection (100.0%), Firefighting & Prevention (100.0%), and Law Enforcement (100.0%), while the most female-oriented occupations are Healthcare Support (100.0%), Food Preparation & Serving (68.5%), and Cleaning & Maintenance (38.7%).
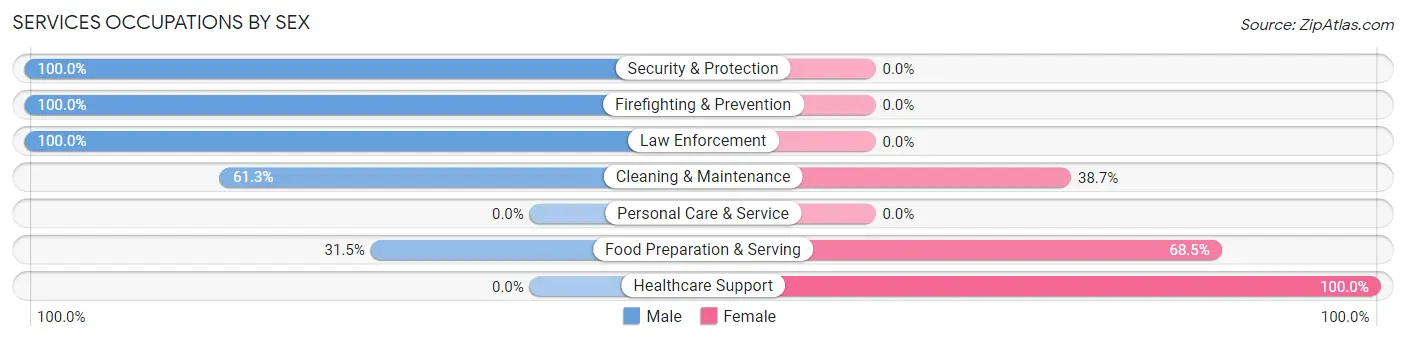
| Occupation | Male | Female |
| Healthcare Support | 0 (0.0%) | 66 (100.0%) |
| Security & Protection | 49 (100.0%) | 0 (0.0%) |
| Firefighting & Prevention | 37 (100.0%) | 0 (0.0%) |
| Law Enforcement | 12 (100.0%) | 0 (0.0%) |
| Food Preparation & Serving | 182 (31.5%) | 396 (68.5%) |
| Cleaning & Maintenance | 209 (61.3%) | 132 (38.7%) |
| Personal Care & Service | 0 (0.0%) | 0 (0.0%) |
| Total (Category) | 440 (42.5%) | 594 (57.5%) |
| Total (Overall) | 1,791 (52.3%) | 1,634 (47.7%) |
Sales and Office Occupations
The most common Sales and Office occupations in Dock Junction are Sales & Related (465 | 13.6%), and Office & Administration (385 | 11.2%).

Sales and Office Occupations by Sex

| Occupation | Male | Female |
| Sales & Related | 203 (43.7%) | 262 (56.3%) |
| Office & Administration | 61 (15.8%) | 324 (84.2%) |
| Total (Category) | 264 (31.1%) | 586 (68.9%) |
| Total (Overall) | 1,791 (52.3%) | 1,634 (47.7%) |
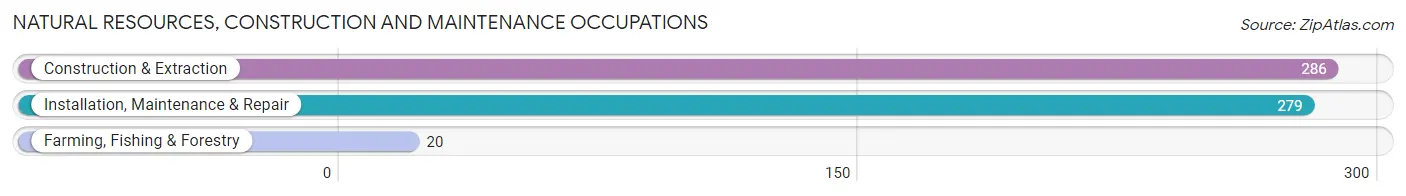
Natural Resources, Construction and Maintenance Occupations
The most common Natural Resources, Construction and Maintenance occupations in Dock Junction are Construction & Extraction (286 | 8.4%), Installation, Maintenance & Repair (279 | 8.2%), and Farming, Fishing & Forestry (20 | 0.6%).
Natural Resources, Construction and Maintenance Occupations by Sex
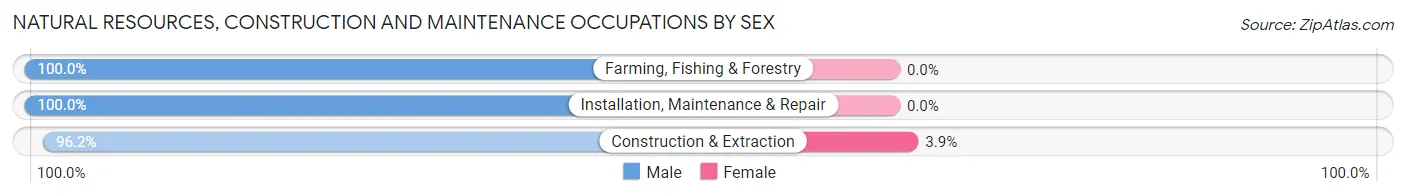
| Occupation | Male | Female |
| Farming, Fishing & Forestry | 20 (100.0%) | 0 (0.0%) |
| Construction & Extraction | 275 (96.2%) | 11 (3.8%) |
| Installation, Maintenance & Repair | 279 (100.0%) | 0 (0.0%) |
| Total (Category) | 574 (98.1%) | 11 (1.9%) |
| Total (Overall) | 1,791 (52.3%) | 1,634 (47.7%) |
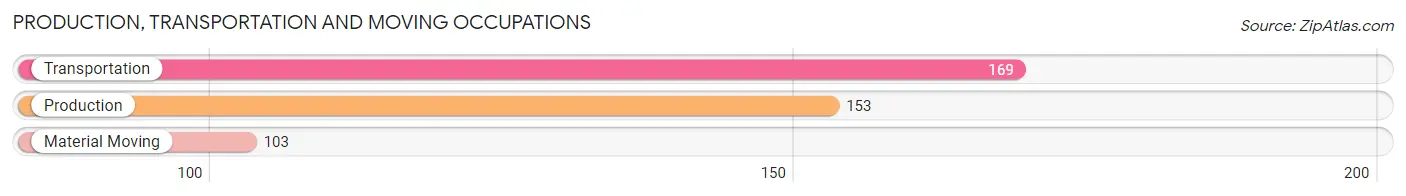
Production, Transportation and Moving Occupations
The most common Production, Transportation and Moving occupations in Dock Junction are Transportation (169 | 4.9%), Production (153 | 4.5%), and Material Moving (103 | 3.0%).
Production, Transportation and Moving Occupations by Sex
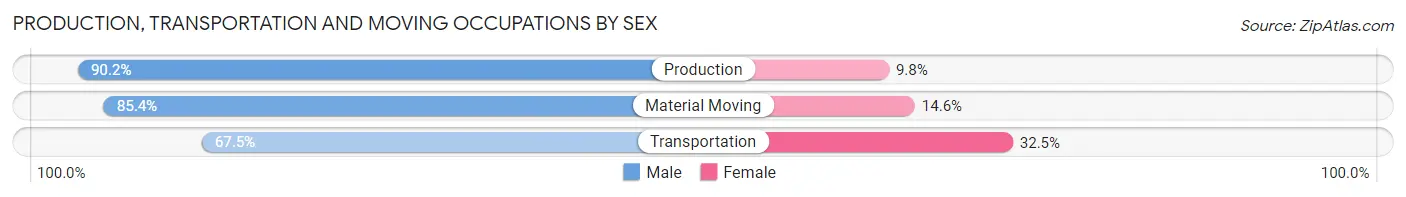
| Occupation | Male | Female |
| Production | 138 (90.2%) | 15 (9.8%) |
| Transportation | 114 (67.5%) | 55 (32.5%) |
| Material Moving | 88 (85.4%) | 15 (14.6%) |
| Total (Category) | 340 (80.0%) | 85 (20.0%) |
| Total (Overall) | 1,791 (52.3%) | 1,634 (47.7%) |
Employment Industries by Sex in Dock Junction
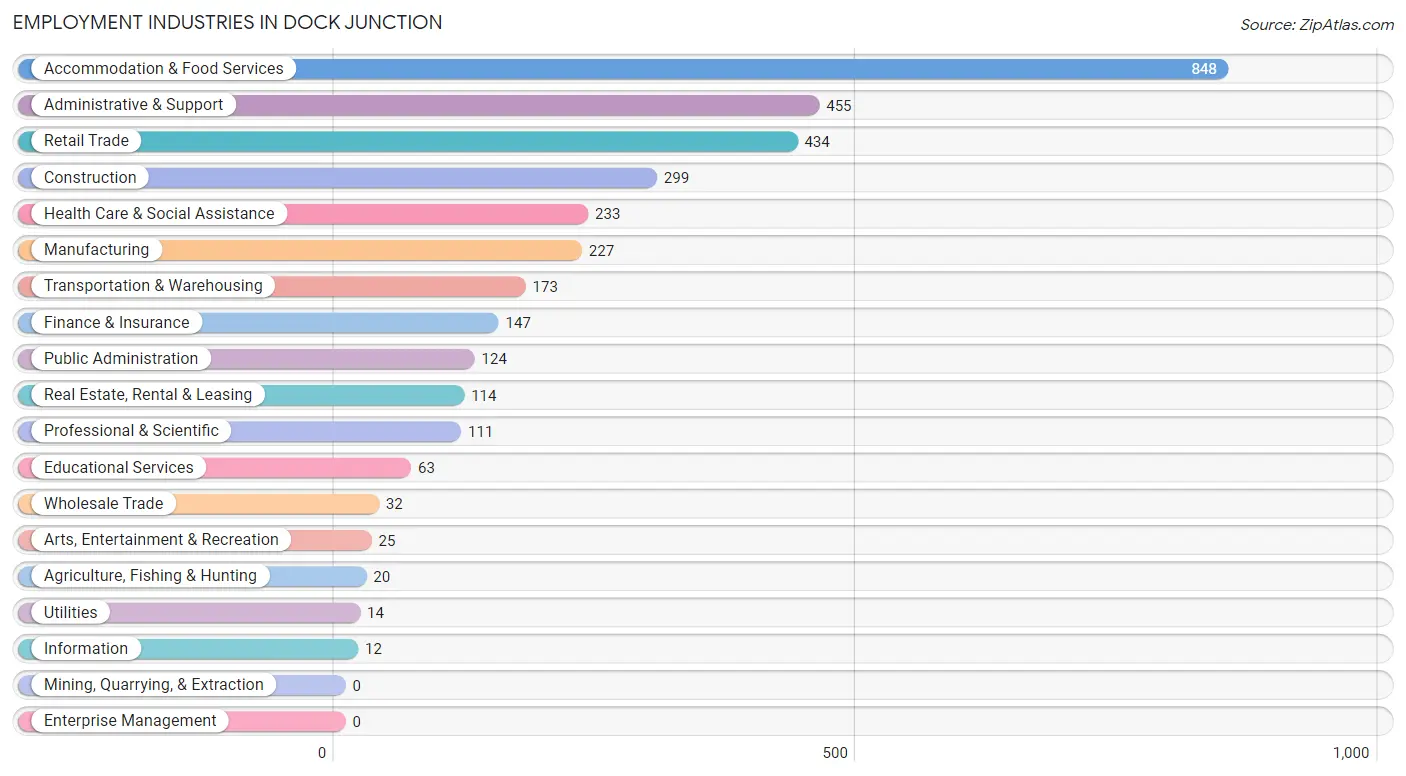
Employment Industries in Dock Junction
The major employment industries in Dock Junction include Accommodation & Food Services (848 | 24.8%), Administrative & Support (455 | 13.3%), Retail Trade (434 | 12.7%), Construction (299 | 8.7%), and Health Care & Social Assistance (233 | 6.8%).
Employment Industries by Sex in Dock Junction
The Dock Junction industries that see more men than women are Agriculture, Fishing & Hunting (100.0%), Wholesale Trade (100.0%), and Utilities (100.0%), whereas the industries that tend to have a higher number of women are Health Care & Social Assistance (100.0%), Finance & Insurance (83.7%), and Accommodation & Food Services (62.6%).
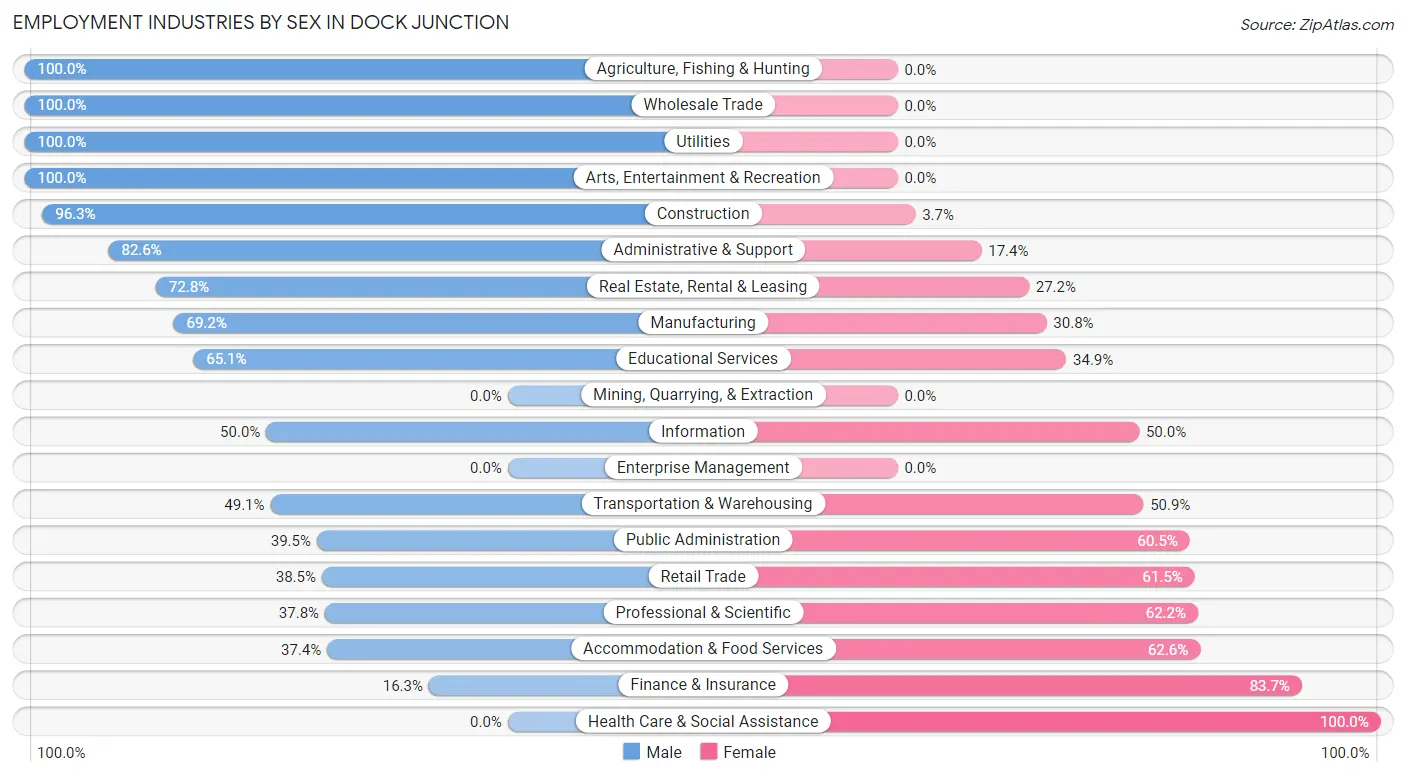
| Industry | Male | Female |
| Agriculture, Fishing & Hunting | 20 (100.0%) | 0 (0.0%) |
| Mining, Quarrying, & Extraction | 0 (0.0%) | 0 (0.0%) |
| Construction | 288 (96.3%) | 11 (3.7%) |
| Manufacturing | 157 (69.2%) | 70 (30.8%) |
| Wholesale Trade | 32 (100.0%) | 0 (0.0%) |
| Retail Trade | 167 (38.5%) | 267 (61.5%) |
| Transportation & Warehousing | 85 (49.1%) | 88 (50.9%) |
| Utilities | 14 (100.0%) | 0 (0.0%) |
| Information | 6 (50.0%) | 6 (50.0%) |
| Finance & Insurance | 24 (16.3%) | 123 (83.7%) |
| Real Estate, Rental & Leasing | 83 (72.8%) | 31 (27.2%) |
| Professional & Scientific | 42 (37.8%) | 69 (62.2%) |
| Enterprise Management | 0 (0.0%) | 0 (0.0%) |
| Administrative & Support | 376 (82.6%) | 79 (17.4%) |
| Educational Services | 41 (65.1%) | 22 (34.9%) |
| Health Care & Social Assistance | 0 (0.0%) | 233 (100.0%) |
| Arts, Entertainment & Recreation | 25 (100.0%) | 0 (0.0%) |
| Accommodation & Food Services | 317 (37.4%) | 531 (62.6%) |
| Public Administration | 49 (39.5%) | 75 (60.5%) |
| Total | 1,791 (52.3%) | 1,634 (47.7%) |
Education in Dock Junction
School Enrollment in Dock Junction
The most common levels of schooling among the 2,010 students in Dock Junction are elementary school (629 | 31.3%), high school (356 | 17.7%), and middle school (322 | 16.0%).
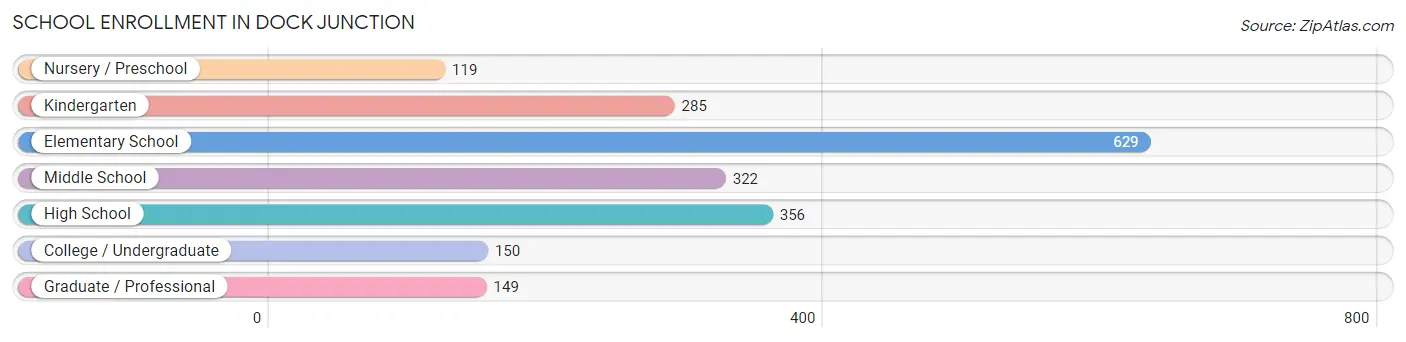
| School Level | # Students | % Students |
| Nursery / Preschool | 119 | 5.9% |
| Kindergarten | 285 | 14.2% |
| Elementary School | 629 | 31.3% |
| Middle School | 322 | 16.0% |
| High School | 356 | 17.7% |
| College / Undergraduate | 150 | 7.5% |
| Graduate / Professional | 149 | 7.4% |
| Total | 2,010 | 100.0% |
School Enrollment by Age by Funding Source in Dock Junction
Out of a total of 2,010 students who are enrolled in schools in Dock Junction, 249 (12.4%) attend a private institution, while the remaining 1,761 (87.6%) are enrolled in public schools. The age group of 18 to 19 year olds has the highest likelihood of being enrolled in private schools, with 54 (65.1% in the age bracket) enrolled. Conversely, the age group of 15 to 17 year olds has the lowest likelihood of being enrolled in a private school, with 266 (100.0% in the age bracket) attending a public institution.
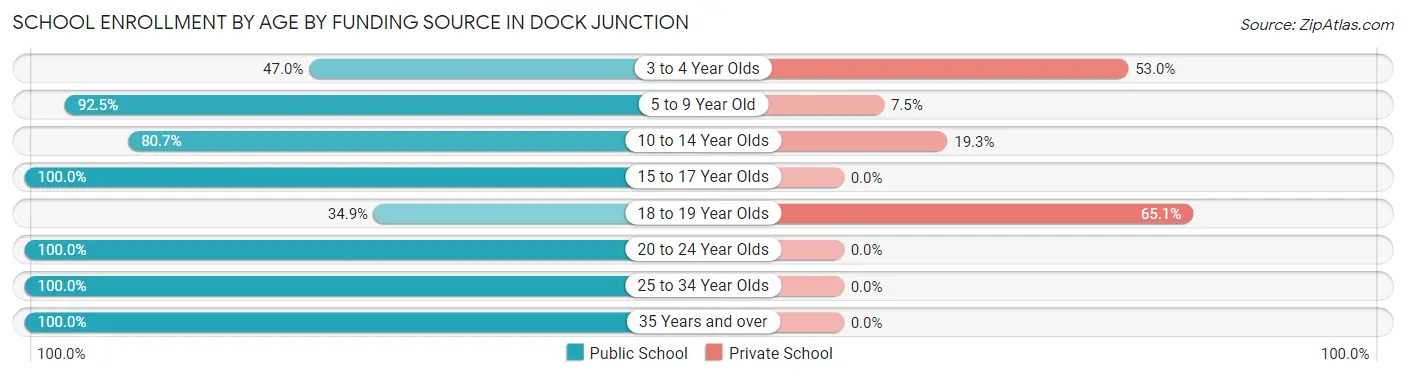
| Age Bracket | Public School | Private School |
| 3 to 4 Year Olds | 47 (47.0%) | 53 (53.0%) |
| 5 to 9 Year Old | 851 (92.5%) | 69 (7.5%) |
| 10 to 14 Year Olds | 305 (80.7%) | 73 (19.3%) |
| 15 to 17 Year Olds | 266 (100.0%) | 0 (0.0%) |
| 18 to 19 Year Olds | 29 (34.9%) | 54 (65.1%) |
| 20 to 24 Year Olds | 56 (100.0%) | 0 (0.0%) |
| 25 to 34 Year Olds | 20 (100.0%) | 0 (0.0%) |
| 35 Years and over | 187 (100.0%) | 0 (0.0%) |
| Total | 1,761 (87.6%) | 249 (12.4%) |
Educational Attainment by Field of Study in Dock Junction
Education (180 | 23.1%), arts & humanities (127 | 16.3%), business (106 | 13.6%), liberal arts & history (100 | 12.9%), and science & technology (59 | 7.6%) are the most common fields of study among 778 individuals in Dock Junction who have obtained a bachelor's degree or higher.
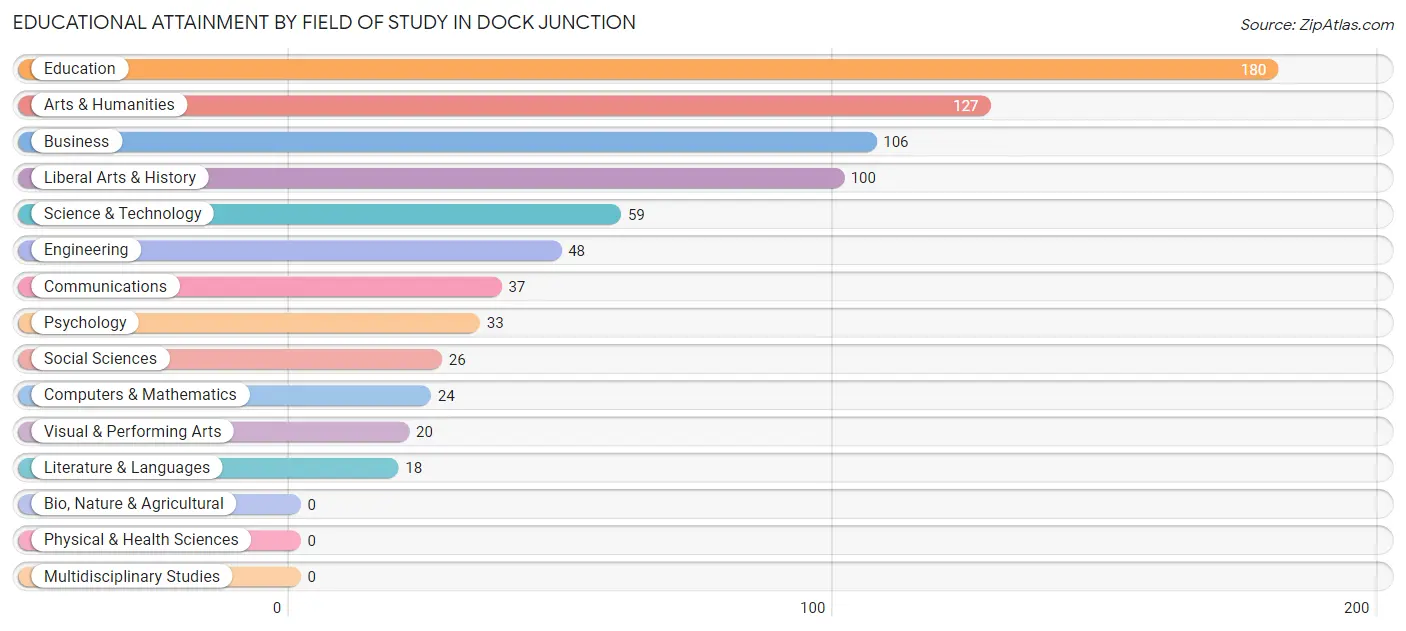
| Field of Study | # Graduates | % Graduates |
| Computers & Mathematics | 24 | 3.1% |
| Bio, Nature & Agricultural | 0 | 0.0% |
| Physical & Health Sciences | 0 | 0.0% |
| Psychology | 33 | 4.2% |
| Social Sciences | 26 | 3.3% |
| Engineering | 48 | 6.2% |
| Multidisciplinary Studies | 0 | 0.0% |
| Science & Technology | 59 | 7.6% |
| Business | 106 | 13.6% |
| Education | 180 | 23.1% |
| Literature & Languages | 18 | 2.3% |
| Liberal Arts & History | 100 | 12.9% |
| Visual & Performing Arts | 20 | 2.6% |
| Communications | 37 | 4.8% |
| Arts & Humanities | 127 | 16.3% |
| Total | 778 | 100.0% |
Transportation & Commute in Dock Junction
Vehicle Availability by Sex in Dock Junction
The most prevalent vehicle ownership categories in Dock Junction are males with 1 vehicle (468, accounting for 30.3%) and females with 1 vehicle (526, making up 31.4%).
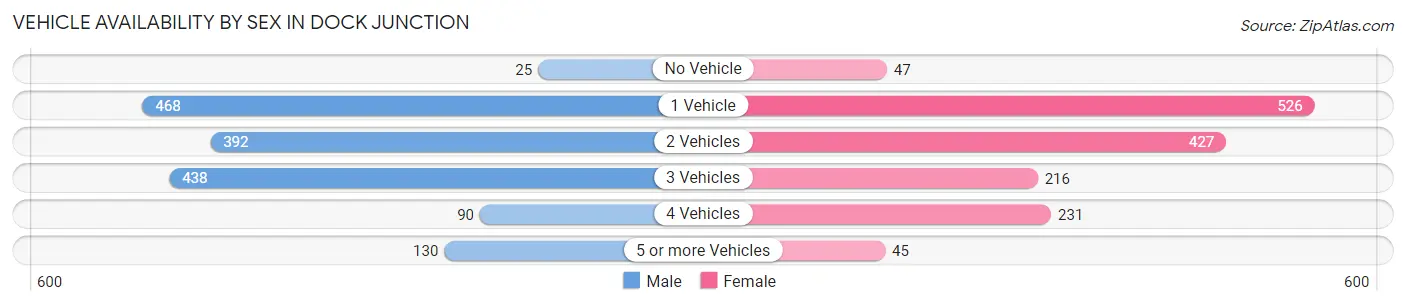
| Vehicles Available | Male | Female |
| No Vehicle | 25 (1.6%) | 47 (3.2%) |
| 1 Vehicle | 468 (30.3%) | 526 (35.2%) |
| 2 Vehicles | 392 (25.4%) | 427 (28.6%) |
| 3 Vehicles | 438 (28.4%) | 216 (14.5%) |
| 4 Vehicles | 90 (5.8%) | 231 (15.5%) |
| 5 or more Vehicles | 130 (8.4%) | 45 (3.0%) |
| Total | 1,543 (100.0%) | 1,492 (100.0%) |
Commute Time in Dock Junction
The most frequently occuring commute durations in Dock Junction are 5 to 9 minutes (708 commuters, 24.4%), 15 to 19 minutes (606 commuters, 20.9%), and 10 to 14 minutes (482 commuters, 16.6%).
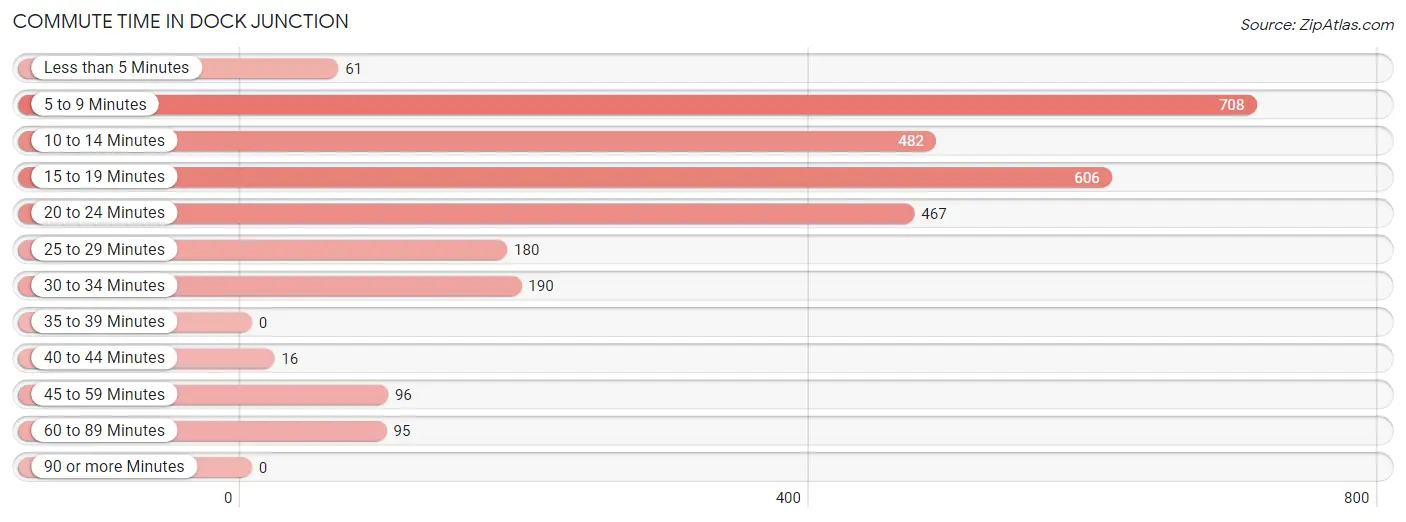
| Commute Time | # Commuters | % Commuters |
| Less than 5 Minutes | 61 | 2.1% |
| 5 to 9 Minutes | 708 | 24.4% |
| 10 to 14 Minutes | 482 | 16.6% |
| 15 to 19 Minutes | 606 | 20.9% |
| 20 to 24 Minutes | 467 | 16.1% |
| 25 to 29 Minutes | 180 | 6.2% |
| 30 to 34 Minutes | 190 | 6.6% |
| 35 to 39 Minutes | 0 | 0.0% |
| 40 to 44 Minutes | 16 | 0.5% |
| 45 to 59 Minutes | 96 | 3.3% |
| 60 to 89 Minutes | 95 | 3.3% |
| 90 or more Minutes | 0 | 0.0% |
Commute Time by Sex in Dock Junction
The most common commute times in Dock Junction are 5 to 9 minutes (317 commuters, 22.5%) for males and 5 to 9 minutes (391 commuters, 26.2%) for females.
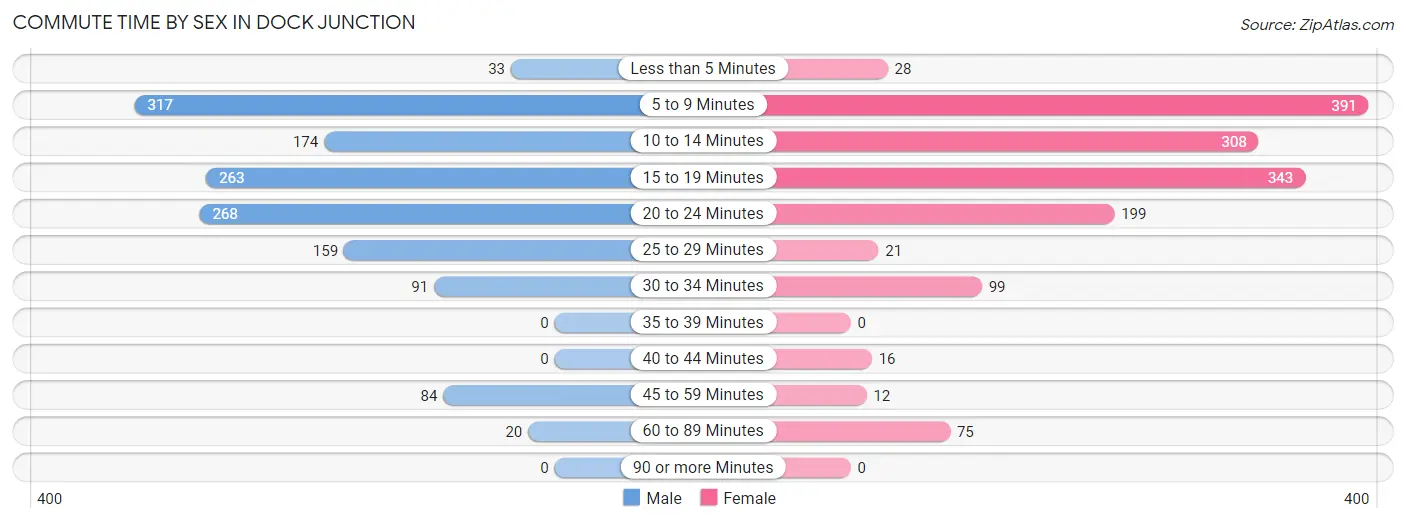
| Commute Time | Male | Female |
| Less than 5 Minutes | 33 (2.3%) | 28 (1.9%) |
| 5 to 9 Minutes | 317 (22.5%) | 391 (26.2%) |
| 10 to 14 Minutes | 174 (12.3%) | 308 (20.6%) |
| 15 to 19 Minutes | 263 (18.7%) | 343 (23.0%) |
| 20 to 24 Minutes | 268 (19.0%) | 199 (13.3%) |
| 25 to 29 Minutes | 159 (11.3%) | 21 (1.4%) |
| 30 to 34 Minutes | 91 (6.5%) | 99 (6.6%) |
| 35 to 39 Minutes | 0 (0.0%) | 0 (0.0%) |
| 40 to 44 Minutes | 0 (0.0%) | 16 (1.1%) |
| 45 to 59 Minutes | 84 (6.0%) | 12 (0.8%) |
| 60 to 89 Minutes | 20 (1.4%) | 75 (5.0%) |
| 90 or more Minutes | 0 (0.0%) | 0 (0.0%) |
Time of Departure to Work by Sex in Dock Junction
The most frequent times of departure to work in Dock Junction are 6:30 AM to 6:59 AM (252, 17.9%) for males and 7:30 AM to 7:59 AM (298, 20.0%) for females.
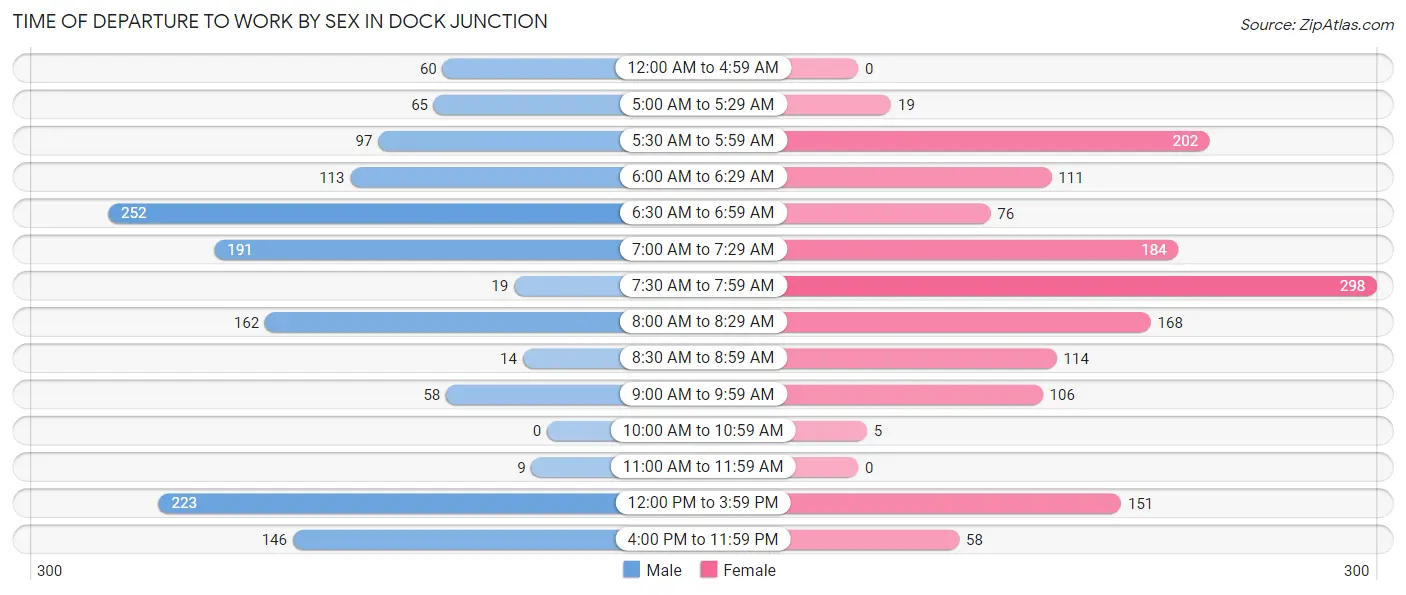
| Time of Departure | Male | Female |
| 12:00 AM to 4:59 AM | 60 (4.3%) | 0 (0.0%) |
| 5:00 AM to 5:29 AM | 65 (4.6%) | 19 (1.3%) |
| 5:30 AM to 5:59 AM | 97 (6.9%) | 202 (13.5%) |
| 6:00 AM to 6:29 AM | 113 (8.0%) | 111 (7.4%) |
| 6:30 AM to 6:59 AM | 252 (17.9%) | 76 (5.1%) |
| 7:00 AM to 7:29 AM | 191 (13.6%) | 184 (12.3%) |
| 7:30 AM to 7:59 AM | 19 (1.3%) | 298 (20.0%) |
| 8:00 AM to 8:29 AM | 162 (11.5%) | 168 (11.3%) |
| 8:30 AM to 8:59 AM | 14 (1.0%) | 114 (7.6%) |
| 9:00 AM to 9:59 AM | 58 (4.1%) | 106 (7.1%) |
| 10:00 AM to 10:59 AM | 0 (0.0%) | 5 (0.3%) |
| 11:00 AM to 11:59 AM | 9 (0.6%) | 0 (0.0%) |
| 12:00 PM to 3:59 PM | 223 (15.8%) | 151 (10.1%) |
| 4:00 PM to 11:59 PM | 146 (10.4%) | 58 (3.9%) |
| Total | 1,409 (100.0%) | 1,492 (100.0%) |
Housing Occupancy in Dock Junction
Occupancy by Ownership in Dock Junction
Of the total 3,050 dwellings in Dock Junction, owner-occupied units account for 1,560 (51.1%), while renter-occupied units make up 1,490 (48.8%).
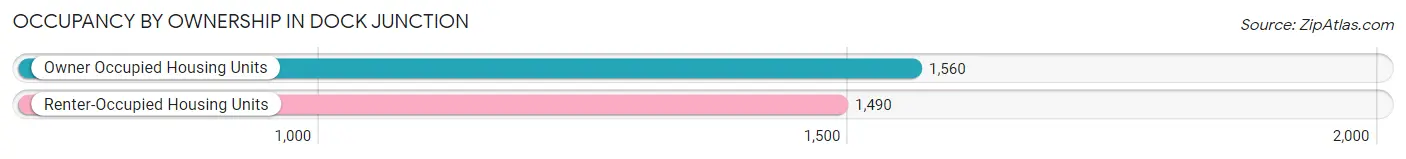
| Occupancy | # Housing Units | % Housing Units |
| Owner Occupied Housing Units | 1,560 | 51.1% |
| Renter-Occupied Housing Units | 1,490 | 48.8% |
| Total Occupied Housing Units | 3,050 | 100.0% |
Occupancy by Household Size in Dock Junction
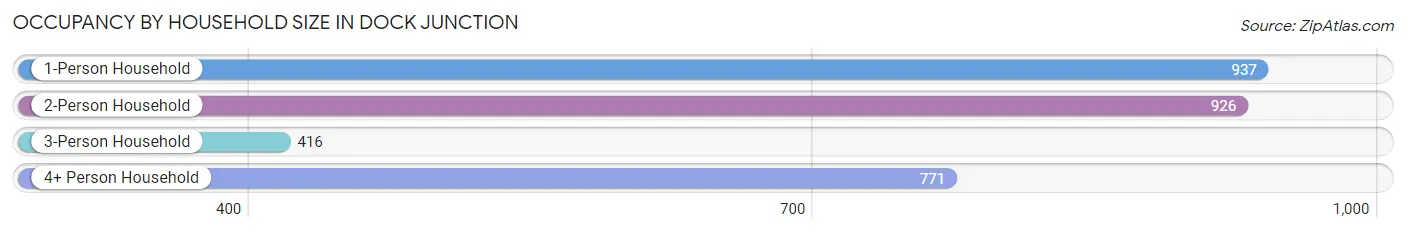
| Household Size | # Housing Units | % Housing Units |
| 1-Person Household | 937 | 30.7% |
| 2-Person Household | 926 | 30.4% |
| 3-Person Household | 416 | 13.6% |
| 4+ Person Household | 771 | 25.3% |
| Total Housing Units | 3,050 | 100.0% |
Occupancy by Ownership by Household Size in Dock Junction
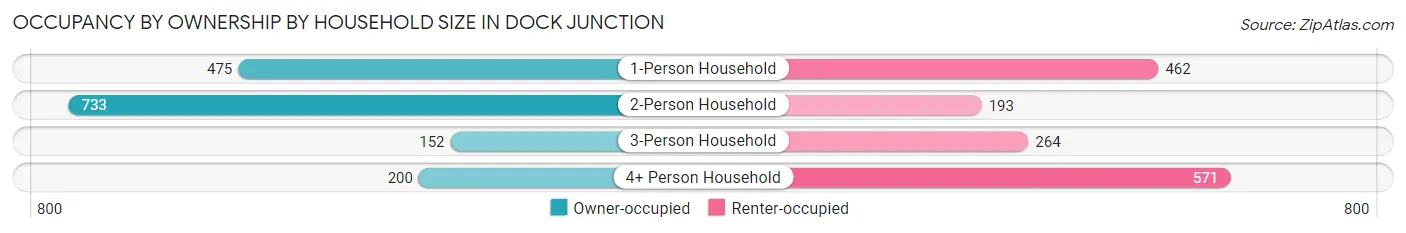
| Household Size | Owner-occupied | Renter-occupied |
| 1-Person Household | 475 (50.7%) | 462 (49.3%) |
| 2-Person Household | 733 (79.2%) | 193 (20.8%) |
| 3-Person Household | 152 (36.5%) | 264 (63.5%) |
| 4+ Person Household | 200 (25.9%) | 571 (74.1%) |
| Total Housing Units | 1,560 (51.1%) | 1,490 (48.8%) |
Occupancy by Educational Attainment in Dock Junction
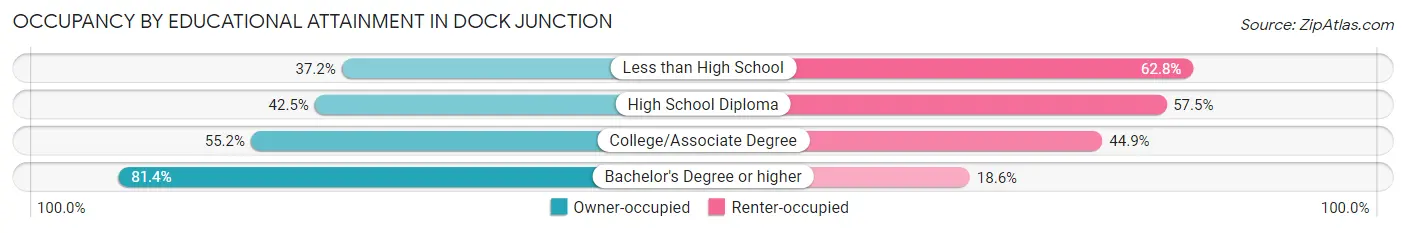
| Household Size | Owner-occupied | Renter-occupied |
| Less than High School | 165 (37.2%) | 279 (62.8%) |
| High School Diploma | 540 (42.5%) | 731 (57.5%) |
| College/Associate Degree | 487 (55.1%) | 396 (44.9%) |
| Bachelor's Degree or higher | 368 (81.4%) | 84 (18.6%) |
Occupancy by Age of Householder in Dock Junction
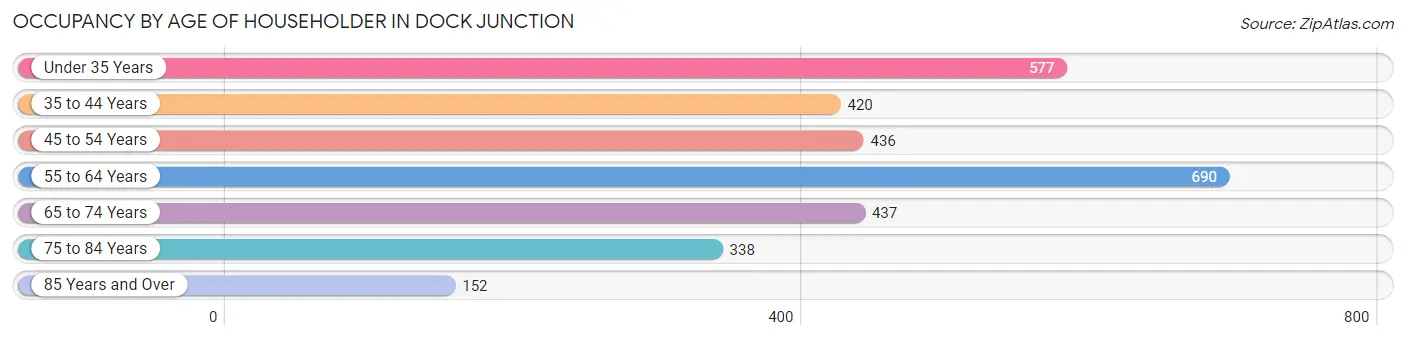
| Age Bracket | # Households | % Households |
| Under 35 Years | 577 | 18.9% |
| 35 to 44 Years | 420 | 13.8% |
| 45 to 54 Years | 436 | 14.3% |
| 55 to 64 Years | 690 | 22.6% |
| 65 to 74 Years | 437 | 14.3% |
| 75 to 84 Years | 338 | 11.1% |
| 85 Years and Over | 152 | 5.0% |
| Total | 3,050 | 100.0% |
Housing Finances in Dock Junction
Median Income by Occupancy in Dock Junction
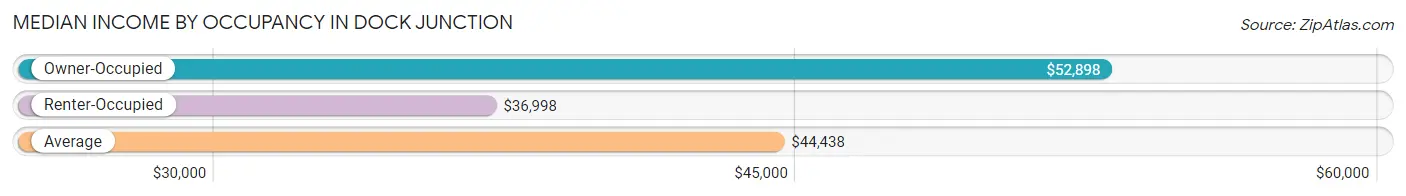
| Occupancy Type | # Households | Median Income |
| Owner-Occupied | 1,560 (51.1%) | $52,898 |
| Renter-Occupied | 1,490 (48.8%) | $36,998 |
| Average | 3,050 (100.0%) | $44,438 |
Occupancy by Householder Income Bracket in Dock Junction
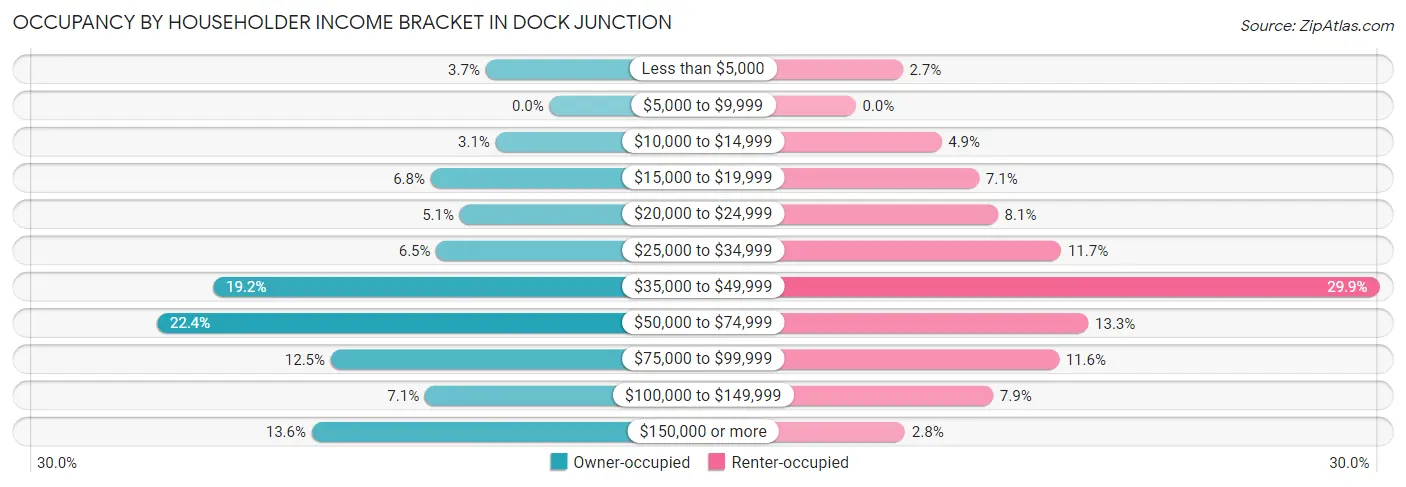
| Income Bracket | Owner-occupied | Renter-occupied |
| Less than $5,000 | 57 (3.6%) | 40 (2.7%) |
| $5,000 to $9,999 | 0 (0.0%) | 0 (0.0%) |
| $10,000 to $14,999 | 48 (3.1%) | 73 (4.9%) |
| $15,000 to $19,999 | 106 (6.8%) | 105 (7.0%) |
| $20,000 to $24,999 | 80 (5.1%) | 121 (8.1%) |
| $25,000 to $34,999 | 101 (6.5%) | 175 (11.7%) |
| $35,000 to $49,999 | 300 (19.2%) | 446 (29.9%) |
| $50,000 to $74,999 | 350 (22.4%) | 198 (13.3%) |
| $75,000 to $99,999 | 195 (12.5%) | 173 (11.6%) |
| $100,000 to $149,999 | 111 (7.1%) | 117 (7.9%) |
| $150,000 or more | 212 (13.6%) | 42 (2.8%) |
| Total | 1,560 (100.0%) | 1,490 (100.0%) |
Monthly Housing Cost Tiers in Dock Junction
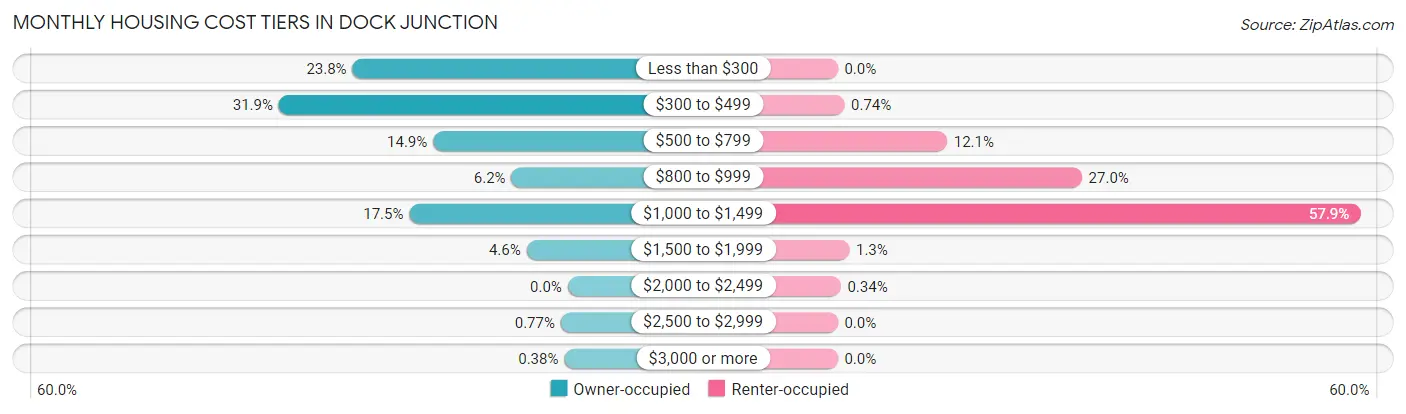
| Monthly Cost | Owner-occupied | Renter-occupied |
| Less than $300 | 371 (23.8%) | 0 (0.0%) |
| $300 to $499 | 498 (31.9%) | 11 (0.7%) |
| $500 to $799 | 232 (14.9%) | 180 (12.1%) |
| $800 to $999 | 97 (6.2%) | 402 (27.0%) |
| $1,000 to $1,499 | 273 (17.5%) | 862 (57.9%) |
| $1,500 to $1,999 | 71 (4.5%) | 19 (1.3%) |
| $2,000 to $2,499 | 0 (0.0%) | 5 (0.3%) |
| $2,500 to $2,999 | 12 (0.8%) | 0 (0.0%) |
| $3,000 or more | 6 (0.4%) | 0 (0.0%) |
| Total | 1,560 (100.0%) | 1,490 (100.0%) |
Physical Housing Characteristics in Dock Junction
Housing Structures in Dock Junction
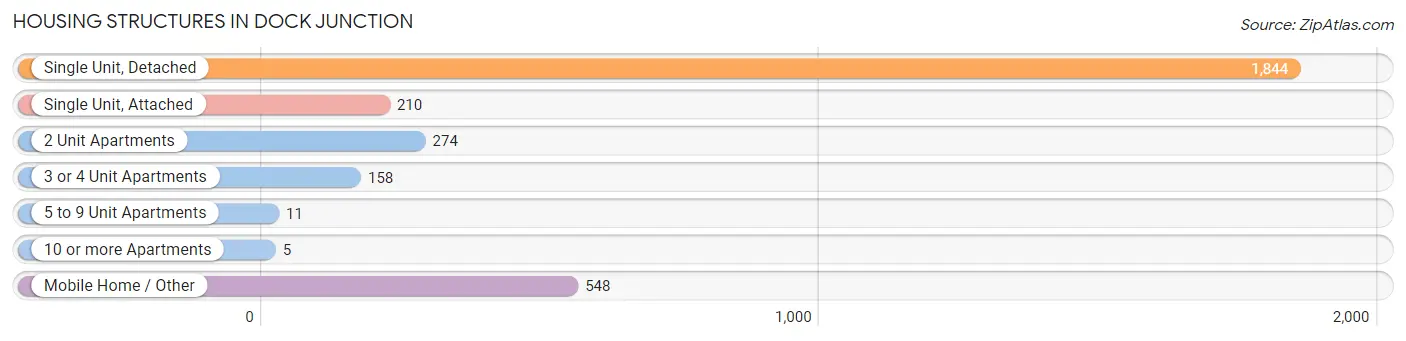
| Structure Type | # Housing Units | % Housing Units |
| Single Unit, Detached | 1,844 | 60.5% |
| Single Unit, Attached | 210 | 6.9% |
| 2 Unit Apartments | 274 | 9.0% |
| 3 or 4 Unit Apartments | 158 | 5.2% |
| 5 to 9 Unit Apartments | 11 | 0.4% |
| 10 or more Apartments | 5 | 0.2% |
| Mobile Home / Other | 548 | 18.0% |
| Total | 3,050 | 100.0% |
Housing Structures by Occupancy in Dock Junction
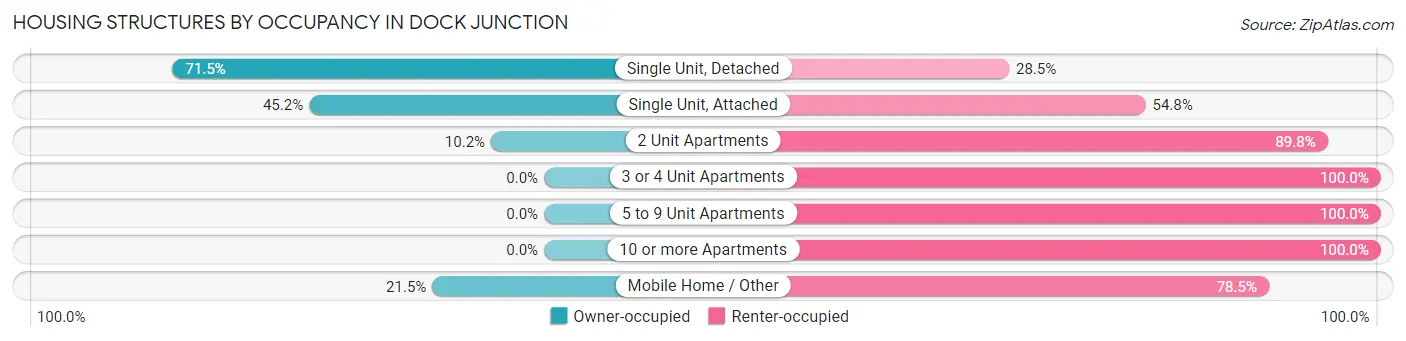
| Structure Type | Owner-occupied | Renter-occupied |
| Single Unit, Detached | 1,319 (71.5%) | 525 (28.5%) |
| Single Unit, Attached | 95 (45.2%) | 115 (54.8%) |
| 2 Unit Apartments | 28 (10.2%) | 246 (89.8%) |
| 3 or 4 Unit Apartments | 0 (0.0%) | 158 (100.0%) |
| 5 to 9 Unit Apartments | 0 (0.0%) | 11 (100.0%) |
| 10 or more Apartments | 0 (0.0%) | 5 (100.0%) |
| Mobile Home / Other | 118 (21.5%) | 430 (78.5%) |
| Total | 1,560 (51.1%) | 1,490 (48.8%) |
Housing Structures by Number of Rooms in Dock Junction
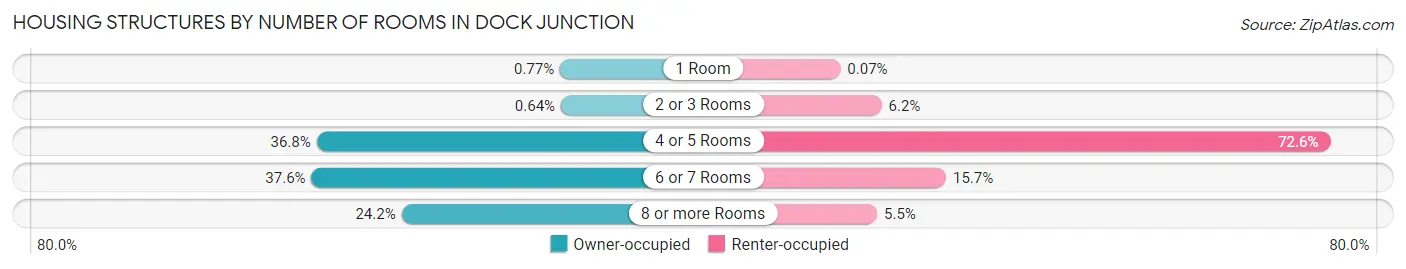
| Number of Rooms | Owner-occupied | Renter-occupied |
| 1 Room | 12 (0.8%) | 1 (0.1%) |
| 2 or 3 Rooms | 10 (0.6%) | 92 (6.2%) |
| 4 or 5 Rooms | 574 (36.8%) | 1,081 (72.6%) |
| 6 or 7 Rooms | 586 (37.6%) | 234 (15.7%) |
| 8 or more Rooms | 378 (24.2%) | 82 (5.5%) |
| Total | 1,560 (100.0%) | 1,490 (100.0%) |
Housing Structure by Heating Type in Dock Junction
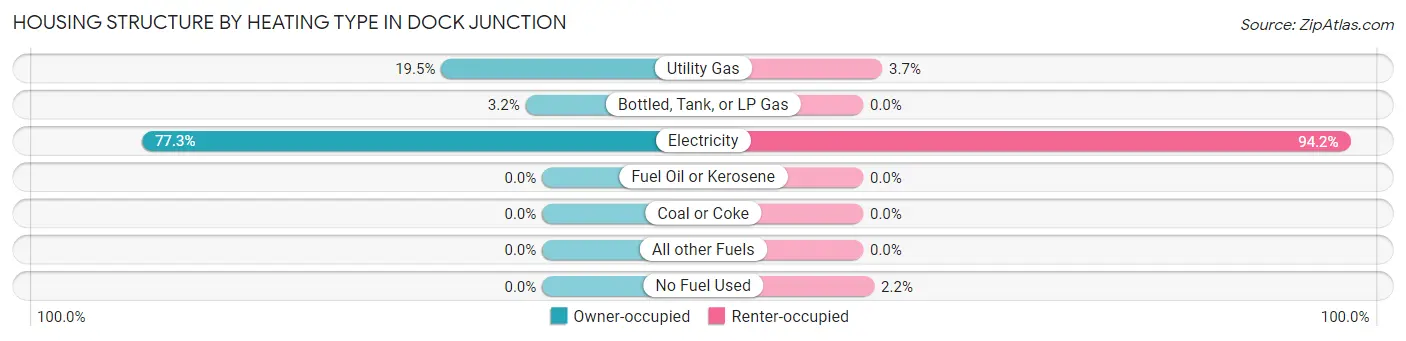
| Heating Type | Owner-occupied | Renter-occupied |
| Utility Gas | 304 (19.5%) | 55 (3.7%) |
| Bottled, Tank, or LP Gas | 50 (3.2%) | 0 (0.0%) |
| Electricity | 1,206 (77.3%) | 1,403 (94.2%) |
| Fuel Oil or Kerosene | 0 (0.0%) | 0 (0.0%) |
| Coal or Coke | 0 (0.0%) | 0 (0.0%) |
| All other Fuels | 0 (0.0%) | 0 (0.0%) |
| No Fuel Used | 0 (0.0%) | 32 (2.1%) |
| Total | 1,560 (100.0%) | 1,490 (100.0%) |
Household Vehicle Usage in Dock Junction
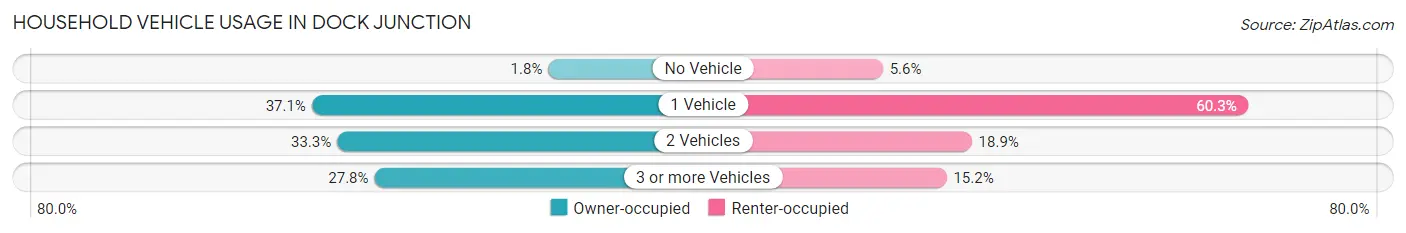
| Vehicles per Household | Owner-occupied | Renter-occupied |
| No Vehicle | 28 (1.8%) | 84 (5.6%) |
| 1 Vehicle | 579 (37.1%) | 898 (60.3%) |
| 2 Vehicles | 520 (33.3%) | 282 (18.9%) |
| 3 or more Vehicles | 433 (27.8%) | 226 (15.2%) |
| Total | 1,560 (100.0%) | 1,490 (100.0%) |
Real Estate & Mortgages in Dock Junction
Real Estate and Mortgage Overview in Dock Junction
| Characteristic | Without Mortgage | With Mortgage |
| Housing Units | 995 | 565 |
| Median Property Value | $134,200 | $115,200 |
| Median Household Income | $46,949 | $128 |
| Monthly Housing Costs | $334 | $6 |
| Real Estate Taxes | $701 | $15 |
Property Value by Mortgage Status in Dock Junction
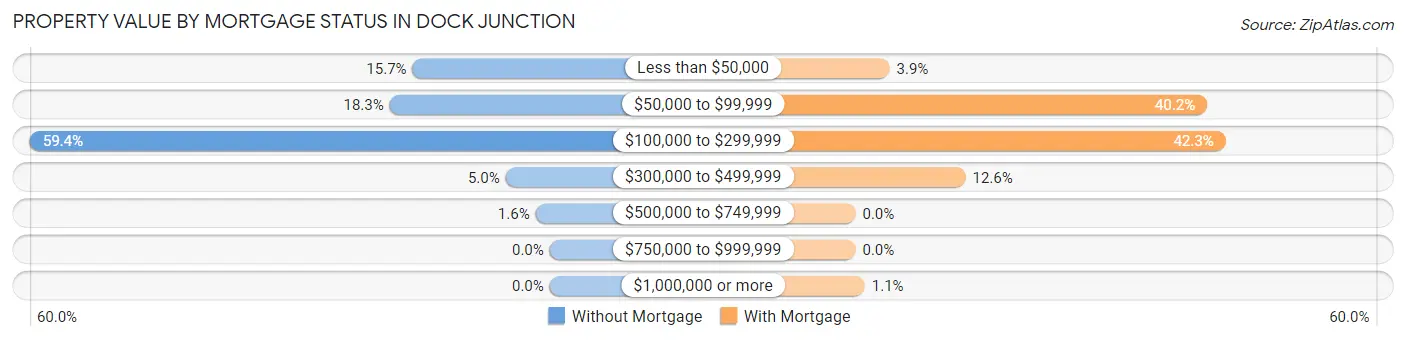
| Property Value | Without Mortgage | With Mortgage |
| Less than $50,000 | 156 (15.7%) | 22 (3.9%) |
| $50,000 to $99,999 | 182 (18.3%) | 227 (40.2%) |
| $100,000 to $299,999 | 591 (59.4%) | 239 (42.3%) |
| $300,000 to $499,999 | 50 (5.0%) | 71 (12.6%) |
| $500,000 to $749,999 | 16 (1.6%) | 0 (0.0%) |
| $750,000 to $999,999 | 0 (0.0%) | 0 (0.0%) |
| $1,000,000 or more | 0 (0.0%) | 6 (1.1%) |
| Total | 995 (100.0%) | 565 (100.0%) |
Household Income by Mortgage Status in Dock Junction
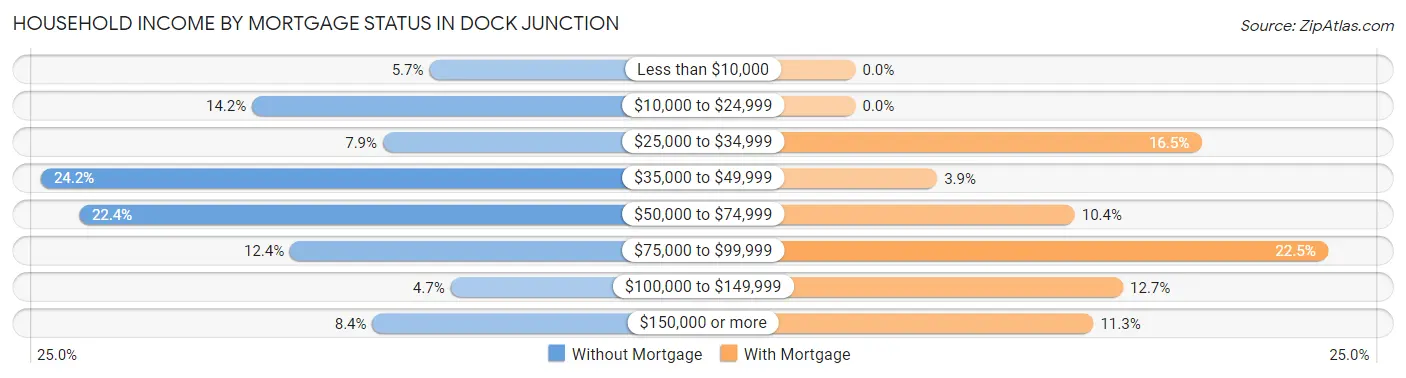
| Household Income | Without Mortgage | With Mortgage |
| Less than $10,000 | 57 (5.7%) | 0 (0.0%) |
| $10,000 to $24,999 | 141 (14.2%) | 0 (0.0%) |
| $25,000 to $34,999 | 79 (7.9%) | 93 (16.5%) |
| $35,000 to $49,999 | 241 (24.2%) | 22 (3.9%) |
| $50,000 to $74,999 | 223 (22.4%) | 59 (10.4%) |
| $75,000 to $99,999 | 123 (12.4%) | 127 (22.5%) |
| $100,000 to $149,999 | 47 (4.7%) | 72 (12.7%) |
| $150,000 or more | 84 (8.4%) | 64 (11.3%) |
| Total | 995 (100.0%) | 565 (100.0%) |
Property Value to Household Income Ratio in Dock Junction
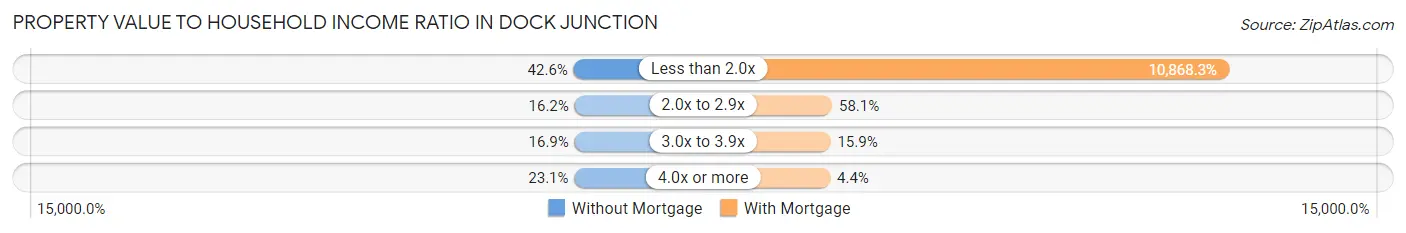
| Value-to-Income Ratio | Without Mortgage | With Mortgage |
| Less than 2.0x | 424 (42.6%) | 61,406 (10,868.3%) |
| 2.0x to 2.9x | 161 (16.2%) | 328 (58.1%) |
| 3.0x to 3.9x | 168 (16.9%) | 90 (15.9%) |
| 4.0x or more | 230 (23.1%) | 25 (4.4%) |
| Total | 995 (100.0%) | 565 (100.0%) |
Real Estate Taxes by Mortgage Status in Dock Junction
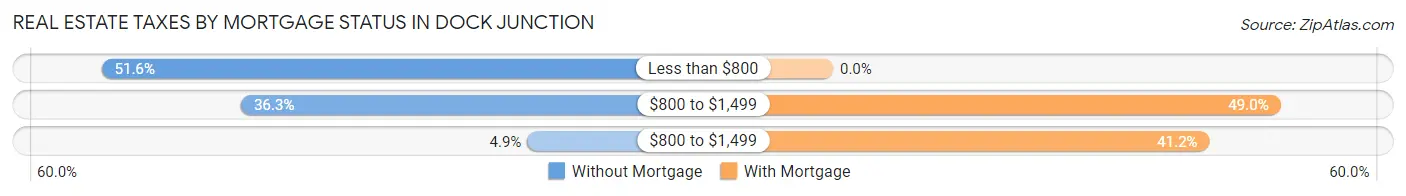
| Property Taxes | Without Mortgage | With Mortgage |
| Less than $800 | 513 (51.6%) | 0 (0.0%) |
| $800 to $1,499 | 361 (36.3%) | 277 (49.0%) |
| $800 to $1,499 | 49 (4.9%) | 233 (41.2%) |
| Total | 995 (100.0%) | 565 (100.0%) |
Health & Disability in Dock Junction
Health Insurance Coverage by Age in Dock Junction
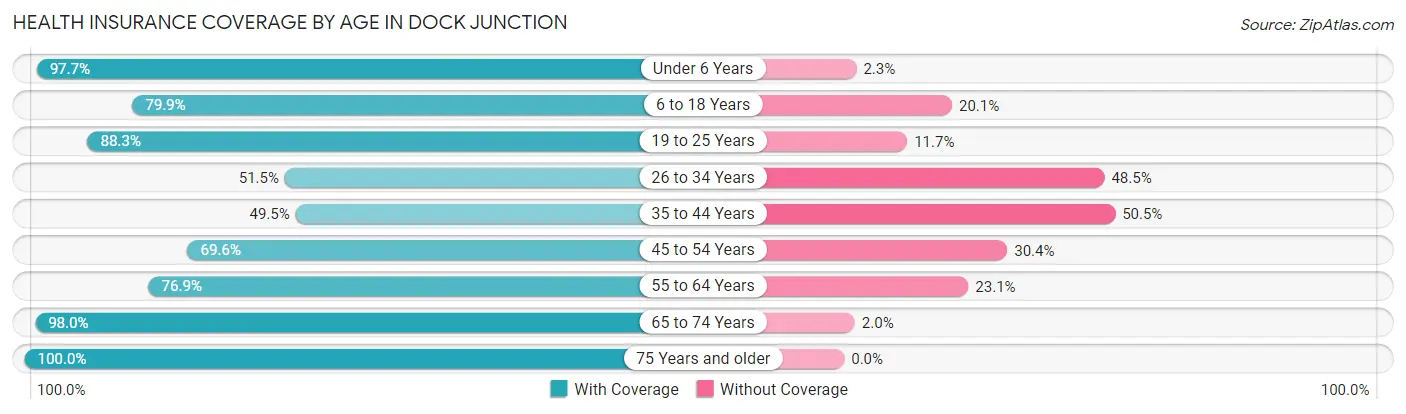
| Age Bracket | With Coverage | Without Coverage |
| Under 6 Years | 776 (97.7%) | 18 (2.3%) |
| 6 to 18 Years | 1,141 (79.9%) | 287 (20.1%) |
| 19 to 25 Years | 549 (88.3%) | 73 (11.7%) |
| 26 to 34 Years | 434 (51.5%) | 409 (48.5%) |
| 35 to 44 Years | 475 (49.5%) | 485 (50.5%) |
| 45 to 54 Years | 616 (69.6%) | 269 (30.4%) |
| 55 to 64 Years | 744 (76.9%) | 224 (23.1%) |
| 65 to 74 Years | 742 (98.0%) | 15 (2.0%) |
| 75 Years and older | 697 (100.0%) | 0 (0.0%) |
| Total | 6,174 (77.6%) | 1,780 (22.4%) |
Health Insurance Coverage by Citizenship Status in Dock Junction
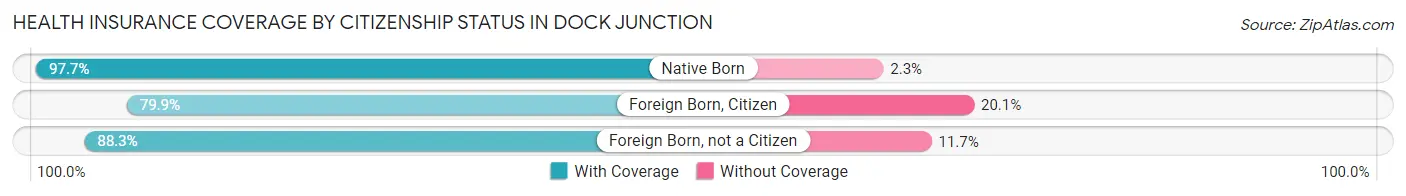
| Citizenship Status | With Coverage | Without Coverage |
| Native Born | 776 (97.7%) | 18 (2.3%) |
| Foreign Born, Citizen | 1,141 (79.9%) | 287 (20.1%) |
| Foreign Born, not a Citizen | 549 (88.3%) | 73 (11.7%) |
Health Insurance Coverage by Household Income in Dock Junction
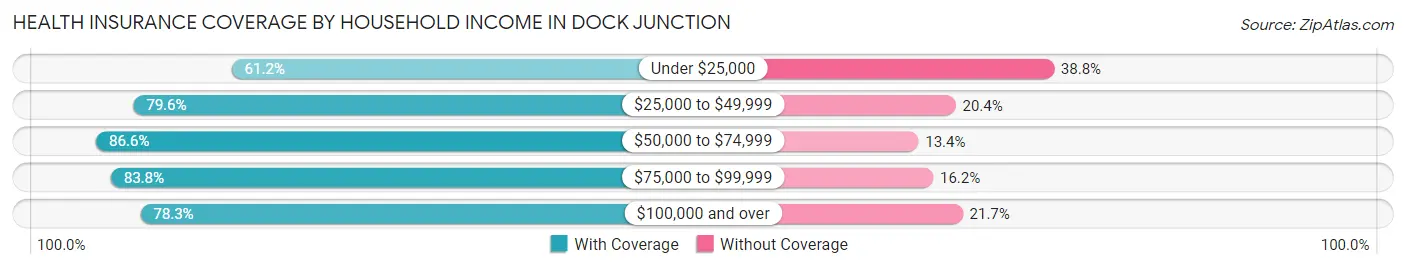
| Household Income | With Coverage | Without Coverage |
| Under $25,000 | 874 (61.2%) | 554 (38.8%) |
| $25,000 to $49,999 | 2,224 (79.6%) | 569 (20.4%) |
| $50,000 to $74,999 | 1,113 (86.6%) | 172 (13.4%) |
| $75,000 to $99,999 | 685 (83.8%) | 132 (16.2%) |
| $100,000 and over | 1,274 (78.3%) | 353 (21.7%) |
Public vs Private Health Insurance Coverage by Age in Dock Junction
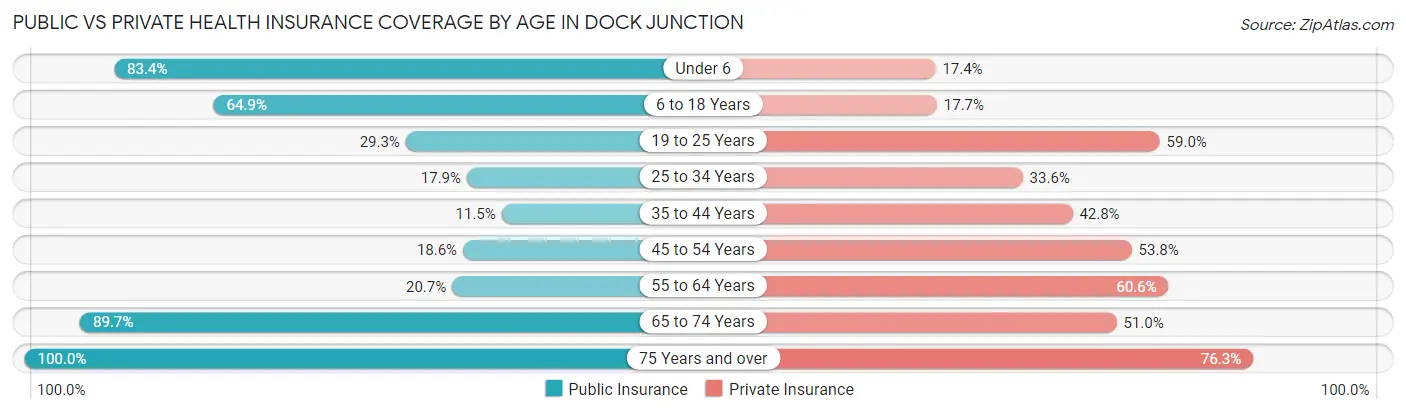
| Age Bracket | Public Insurance | Private Insurance |
| Under 6 | 662 (83.4%) | 138 (17.4%) |
| 6 to 18 Years | 927 (64.9%) | 252 (17.6%) |
| 19 to 25 Years | 182 (29.3%) | 367 (59.0%) |
| 25 to 34 Years | 151 (17.9%) | 283 (33.6%) |
| 35 to 44 Years | 110 (11.5%) | 411 (42.8%) |
| 45 to 54 Years | 165 (18.6%) | 476 (53.8%) |
| 55 to 64 Years | 200 (20.7%) | 587 (60.6%) |
| 65 to 74 Years | 679 (89.7%) | 386 (51.0%) |
| 75 Years and over | 697 (100.0%) | 532 (76.3%) |
| Total | 3,773 (47.4%) | 3,432 (43.1%) |
Disability Status by Sex by Age in Dock Junction
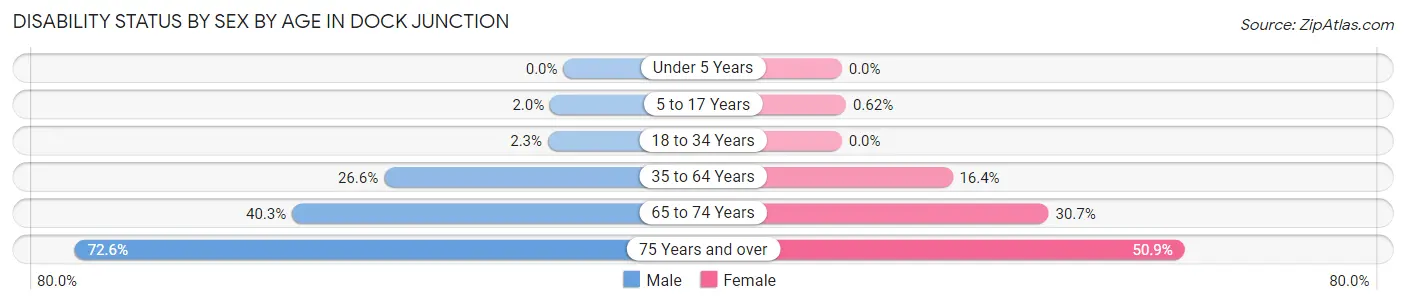
| Age Bracket | Male | Female |
| Under 5 Years | 0 (0.0%) | 0 (0.0%) |
| 5 to 17 Years | 16 (2.0%) | 5 (0.6%) |
| 18 to 34 Years | 16 (2.3%) | 0 (0.0%) |
| 35 to 64 Years | 412 (26.6%) | 208 (16.4%) |
| 65 to 74 Years | 137 (40.3%) | 128 (30.7%) |
| 75 Years and over | 185 (72.6%) | 225 (50.9%) |
Disability Class by Sex by Age in Dock Junction
Disability Class: Hearing Difficulty
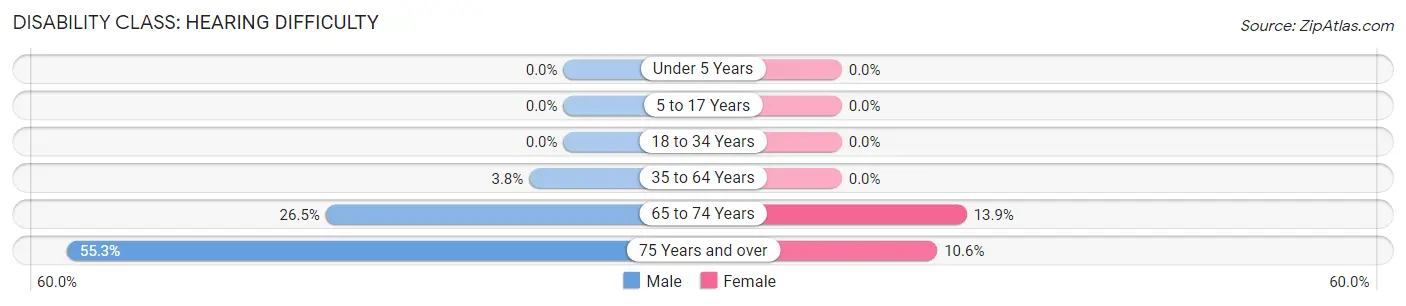
| Age Bracket | Male | Female |
| Under 5 Years | 0 (0.0%) | 0 (0.0%) |
| 5 to 17 Years | 0 (0.0%) | 0 (0.0%) |
| 18 to 34 Years | 0 (0.0%) | 0 (0.0%) |
| 35 to 64 Years | 59 (3.8%) | 0 (0.0%) |
| 65 to 74 Years | 90 (26.5%) | 58 (13.9%) |
| 75 Years and over | 141 (55.3%) | 47 (10.6%) |
Disability Class: Vision Difficulty
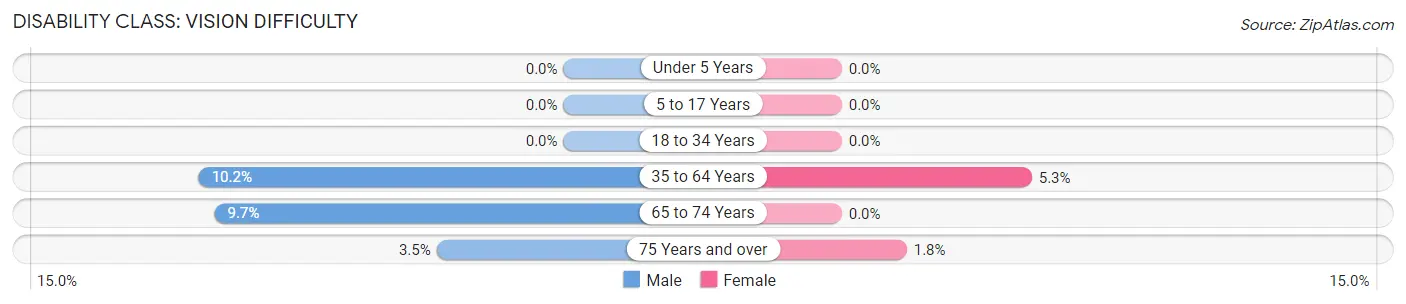
| Age Bracket | Male | Female |
| Under 5 Years | 0 (0.0%) | 0 (0.0%) |
| 5 to 17 Years | 0 (0.0%) | 0 (0.0%) |
| 18 to 34 Years | 0 (0.0%) | 0 (0.0%) |
| 35 to 64 Years | 157 (10.2%) | 67 (5.3%) |
| 65 to 74 Years | 33 (9.7%) | 0 (0.0%) |
| 75 Years and over | 9 (3.5%) | 8 (1.8%) |
Disability Class: Cognitive Difficulty
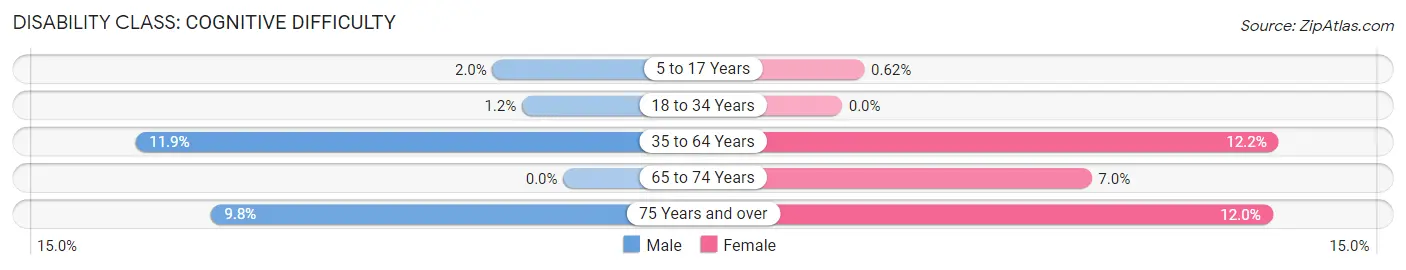
| Age Bracket | Male | Female |
| 5 to 17 Years | 16 (2.0%) | 5 (0.6%) |
| 18 to 34 Years | 8 (1.1%) | 0 (0.0%) |
| 35 to 64 Years | 184 (11.9%) | 154 (12.2%) |
| 65 to 74 Years | 0 (0.0%) | 29 (7.0%) |
| 75 Years and over | 25 (9.8%) | 53 (12.0%) |
Disability Class: Ambulatory Difficulty
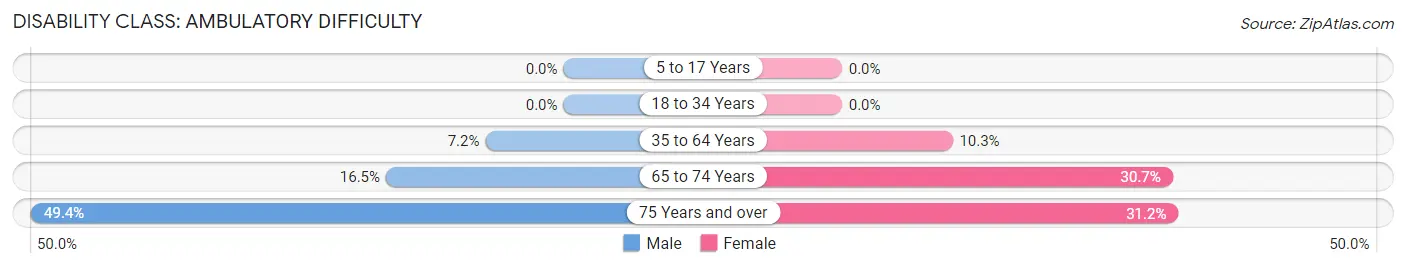
| Age Bracket | Male | Female |
| 5 to 17 Years | 0 (0.0%) | 0 (0.0%) |
| 18 to 34 Years | 0 (0.0%) | 0 (0.0%) |
| 35 to 64 Years | 112 (7.2%) | 130 (10.3%) |
| 65 to 74 Years | 56 (16.5%) | 128 (30.7%) |
| 75 Years and over | 126 (49.4%) | 138 (31.2%) |
Disability Class: Self-Care Difficulty
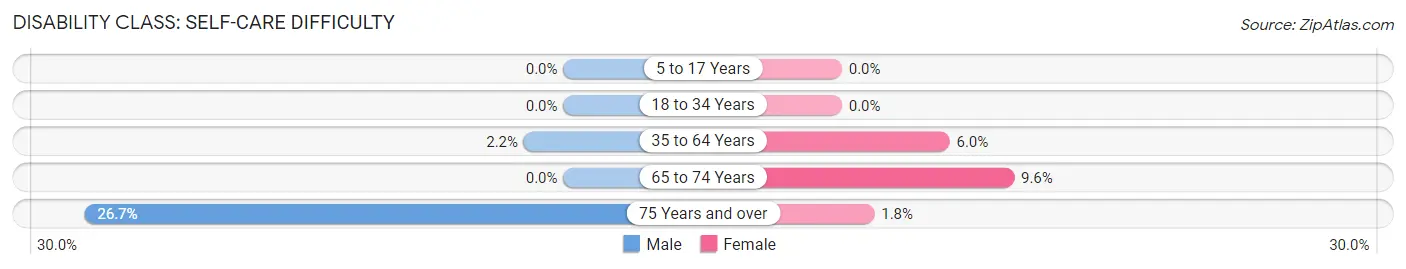
| Age Bracket | Male | Female |
| 5 to 17 Years | 0 (0.0%) | 0 (0.0%) |
| 18 to 34 Years | 0 (0.0%) | 0 (0.0%) |
| 35 to 64 Years | 34 (2.2%) | 76 (6.0%) |
| 65 to 74 Years | 0 (0.0%) | 40 (9.6%) |
| 75 Years and over | 68 (26.7%) | 8 (1.8%) |
Technology Access in Dock Junction
Computing Device Access in Dock Junction
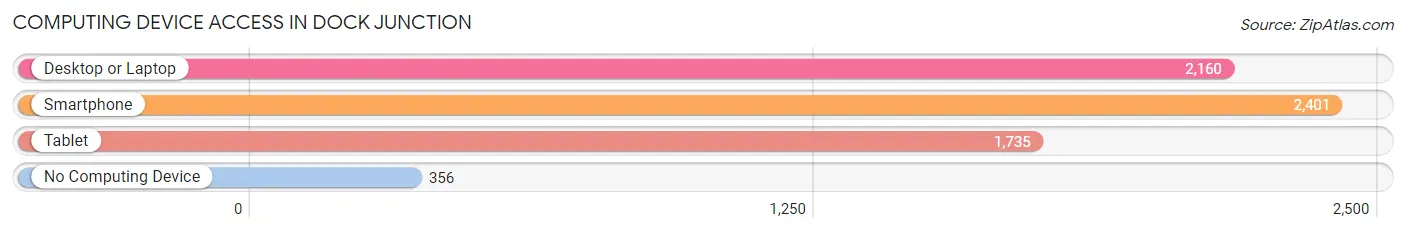
| Device Type | # Households | % Households |
| Desktop or Laptop | 2,160 | 70.8% |
| Smartphone | 2,401 | 78.7% |
| Tablet | 1,735 | 56.9% |
| No Computing Device | 356 | 11.7% |
| Total | 3,050 | 100.0% |
Internet Access in Dock Junction
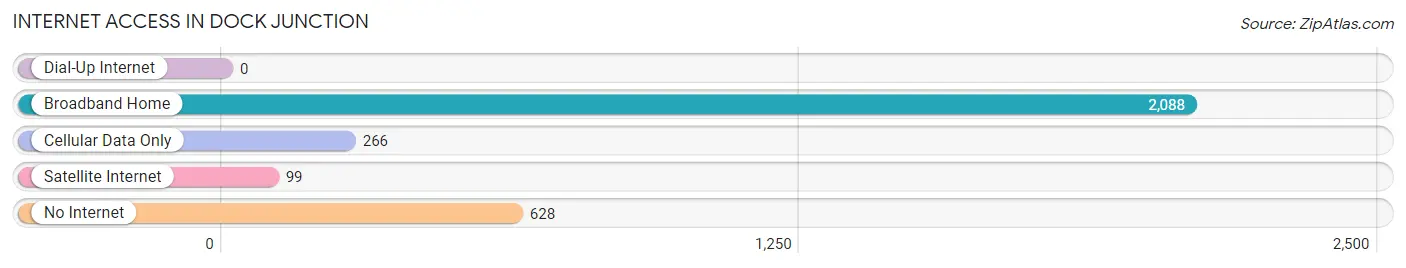
| Internet Type | # Households | % Households |
| Dial-Up Internet | 0 | 0.0% |
| Broadband Home | 2,088 | 68.5% |
| Cellular Data Only | 266 | 8.7% |
| Satellite Internet | 99 | 3.3% |
| No Internet | 628 | 20.6% |
| Total | 3,050 | 100.0% |
Dock Junction Summary
Dock Junction is a small unincorporated community located in Camden County, Georgia, United States. It is situated along the Satilla River, approximately 10 miles south of the county seat of Woodbine. The community is part of the Brunswick, Georgia Metropolitan Statistical Area.
History
The area that is now Dock Junction was first settled in the early 1800s by a group of settlers from North Carolina. The settlement was originally known as “Dock”, after the nearby dock on the Satilla River. The name was later changed to “Dock Junction” when the railroad was built through the area in the late 1800s.
The railroad was a major factor in the growth of the community, as it allowed for the transportation of goods and people to and from the area. The railroad also allowed for the development of the local timber industry, which was a major source of income for the community.
Geography
Dock Junction is located in Camden County, Georgia, approximately 10 miles south of the county seat of Woodbine. The community is situated along the Satilla River, which is a major tributary of the Altamaha River. The area is mostly flat, with some rolling hills in the surrounding area. The climate is humid subtropical, with hot summers and mild winters.
Economy
The economy of Dock Junction is largely based on agriculture and timber. The area is home to several farms, which produce a variety of crops, including corn, soybeans, and cotton. The timber industry is also a major source of income for the community, as the area is home to several large timber companies.
In addition to agriculture and timber, the community is also home to several small businesses, including convenience stores, restaurants, and gas stations. The area is also home to a few manufacturing companies, which produce a variety of products, including furniture and clothing.
Demographics
As of the 2010 census, the population of Dock Junction was 1,845. The racial makeup of the community was 79.3% White, 17.2% African American, 0.7% Native American, 0.3% Asian, 0.1% Pacific Islander, and 2.4% from other races. The median household income was $35,938, and the median family income was $41,250.
Conclusion
Dock Junction is a small unincorporated community located in Camden County, Georgia. The area was first settled in the early 1800s and has since grown to become a major agricultural and timber-producing area. The economy of the community is largely based on agriculture and timber, and the area is also home to several small businesses. The population of Dock Junction is 1,845, and the median household income is $35,938.
Common Questions
What is Per Capita Income in Dock Junction?
Per Capita income in Dock Junction is $25,989.
What is the Median Family Income in Dock Junction?
Median Family Income in Dock Junction is $51,466.
What is the Median Household income in Dock Junction?
Median Household Income in Dock Junction is $44,438.
What is Income or Wage Gap in Dock Junction?
Income or Wage Gap in Dock Junction is 13.2%.
Women in Dock Junction earn 86.8 cents for every dollar earned by a man.
What is Inequality or Gini Index in Dock Junction?
Inequality or Gini Index in Dock Junction is 0.44.
What is the Total Population of Dock Junction?
Total Population of Dock Junction is 8,176.
What is the Total Male Population of Dock Junction?
Total Male Population of Dock Junction is 4,147.
What is the Total Female Population of Dock Junction?
Total Female Population of Dock Junction is 4,029.
What is the Ratio of Males per 100 Females in Dock Junction?
There are 102.93 Males per 100 Females in Dock Junction.
What is the Ratio of Females per 100 Males in Dock Junction?
There are 97.15 Females per 100 Males in Dock Junction.
What is the Median Population Age in Dock Junction?
Median Population Age in Dock Junction is 37.6 Years.
What is the Average Family Size in Dock Junction
Average Family Size in Dock Junction is 3.1 People.
What is the Average Household Size in Dock Junction
Average Household Size in Dock Junction is 2.6 People.
How Large is the Labor Force in Dock Junction?
There are 3,592 People in the Labor Forcein in Dock Junction.
What is the Percentage of People in the Labor Force in Dock Junction?
57.9% of People are in the Labor Force in Dock Junction.
What is the Unemployment Rate in Dock Junction?
Unemployment Rate in Dock Junction is 4.6%.