Raoul, GA Map & Demographics
Raoul Map
Raoul Overview
$14,364
PER CAPITA INCOME
$55,165
AVG FAMILY INCOME
$56,675
AVG HOUSEHOLD INCOME
0.22
INEQUALITY / GINI INDEX
2,529
TOTAL POPULATION
586
MALE POPULATION
1,943
FEMALE POPULATION
30.16
MALES / 100 FEMALES
331.57
FEMALES / 100 MALES
36.8
MEDIAN AGE
4.8
AVG FAMILY SIZE
3.5
AVG HOUSEHOLD SIZE
533
LABOR FORCE [ PEOPLE ]
24.7%
PERCENT IN LABOR FORCE
4.3%
UNEMPLOYMENT RATE
Income in Raoul
Income Overview in Raoul
Per Capita Income in Raoul is $14,364, while median incomes of families and households are $55,165 and $56,675 respectively.
| Characteristic | Number | Measure |
| Per Capita Income | 2,529 | $14,364 |
| Median Family Income | 203 | $55,165 |
| Mean Family Income | 203 | $50,961 |
| Median Household Income | 313 | $56,675 |
| Mean Household Income | 313 | $49,902 |
| Income Deficit | 203 | $0 |
| Wage / Income Gap (%) | 2,529 | 0.00% |
| Wage / Income Gap ($) | 2,529 | 100.00¢ per $1 |
| Gini / Inequality Index | 2,529 | 0.22 |
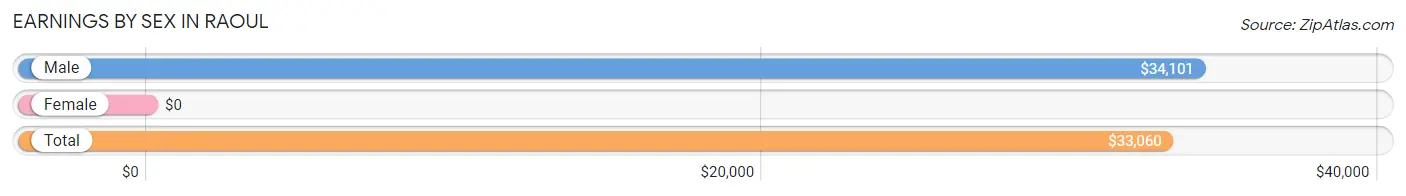
Earnings by Sex in Raoul
| Sex | Number | Average Earnings |
| Male | 344 (39.1%) | $34,101 |
| Female | 536 (60.9%) | $0 |
| Total | 880 (100.0%) | $33,060 |
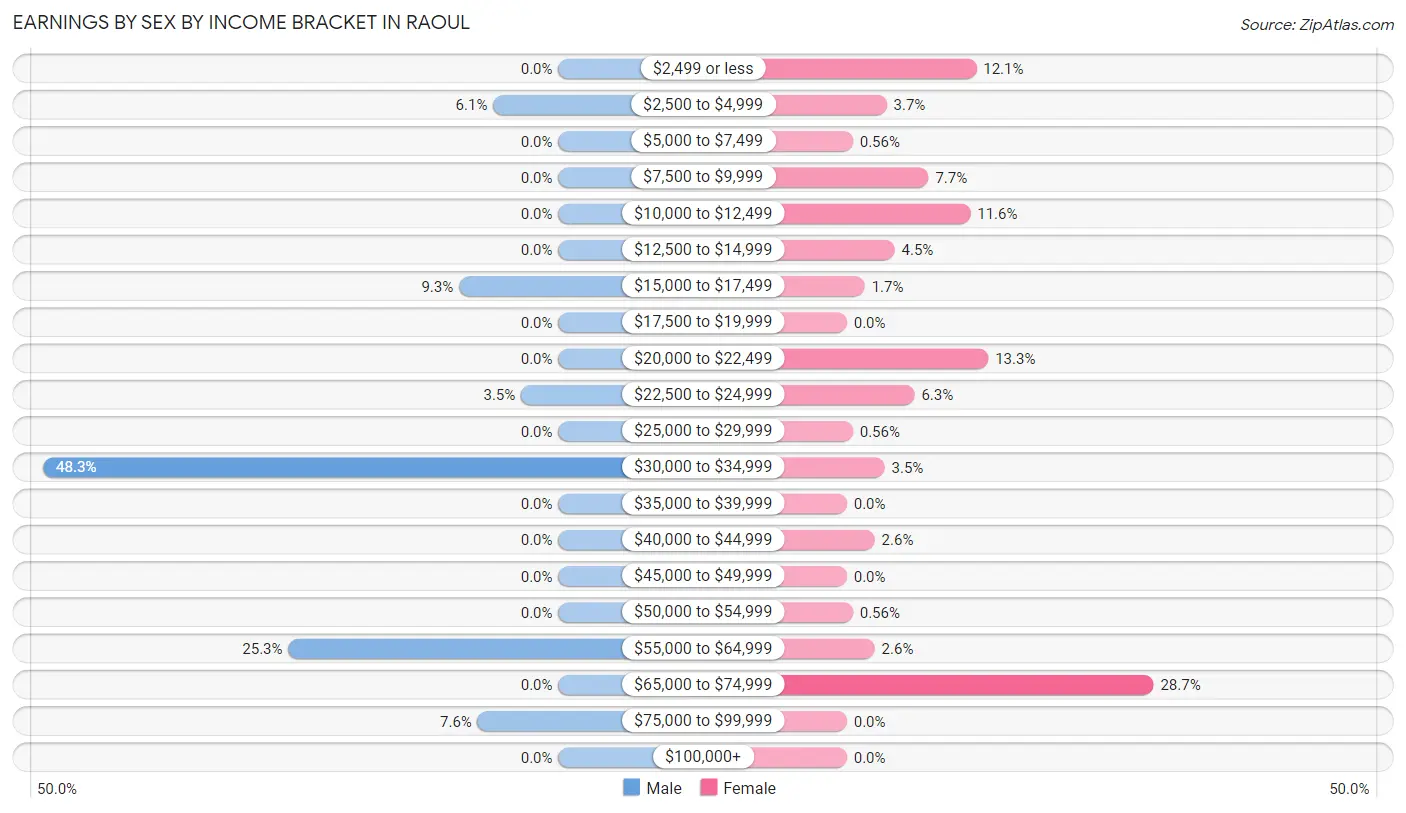
Earnings by Sex by Income Bracket in Raoul
The most common earnings brackets in Raoul are $30,000 to $34,999 for men (166 | 48.3%) and $65,000 to $74,999 for women (154 | 28.7%).
| Income | Male | Female |
| $2,499 or less | 0 (0.0%) | 65 (12.1%) |
| $2,500 to $4,999 | 21 (6.1%) | 20 (3.7%) |
| $5,000 to $7,499 | 0 (0.0%) | 3 (0.6%) |
| $7,500 to $9,999 | 0 (0.0%) | 41 (7.6%) |
| $10,000 to $12,499 | 0 (0.0%) | 62 (11.6%) |
| $12,500 to $14,999 | 0 (0.0%) | 24 (4.5%) |
| $15,000 to $17,499 | 32 (9.3%) | 9 (1.7%) |
| $17,500 to $19,999 | 0 (0.0%) | 0 (0.0%) |
| $20,000 to $22,499 | 0 (0.0%) | 71 (13.3%) |
| $22,500 to $24,999 | 12 (3.5%) | 34 (6.3%) |
| $25,000 to $29,999 | 0 (0.0%) | 3 (0.6%) |
| $30,000 to $34,999 | 166 (48.3%) | 19 (3.5%) |
| $35,000 to $39,999 | 0 (0.0%) | 0 (0.0%) |
| $40,000 to $44,999 | 0 (0.0%) | 14 (2.6%) |
| $45,000 to $49,999 | 0 (0.0%) | 0 (0.0%) |
| $50,000 to $54,999 | 0 (0.0%) | 3 (0.6%) |
| $55,000 to $64,999 | 87 (25.3%) | 14 (2.6%) |
| $65,000 to $74,999 | 0 (0.0%) | 154 (28.7%) |
| $75,000 to $99,999 | 26 (7.6%) | 0 (0.0%) |
| $100,000+ | 0 (0.0%) | 0 (0.0%) |
| Total | 344 (100.0%) | 536 (100.0%) |
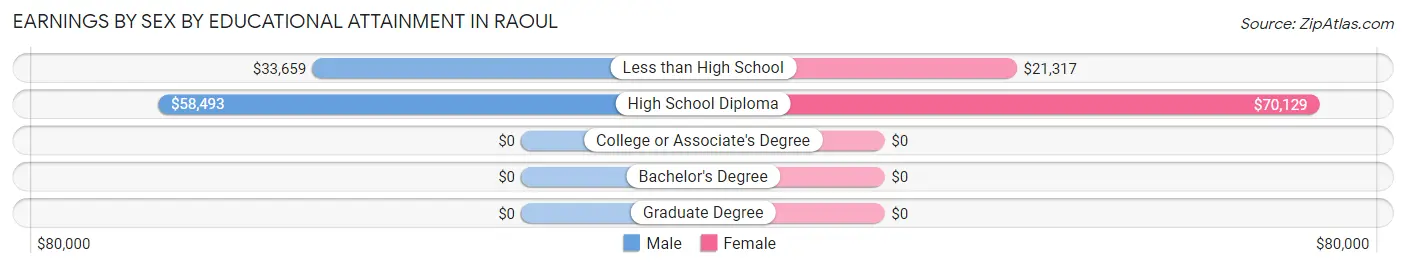
Earnings by Sex by Educational Attainment in Raoul
| Educational Attainment | Male Income | Female Income |
| Less than High School | $33,659 | $21,317 |
| High School Diploma | $58,493 | $70,129 |
| College or Associate's Degree | - | - |
| Bachelor's Degree | - | - |
| Graduate Degree | - | - |
| Total | $34,101 | $0 |
Family Income in Raoul
Family Income Brackets in Raoul
According to the Raoul family income data, there are 78 families falling into the $50,000 to $74,999 income range, which is the most common income bracket and makes up 38.4% of all families.
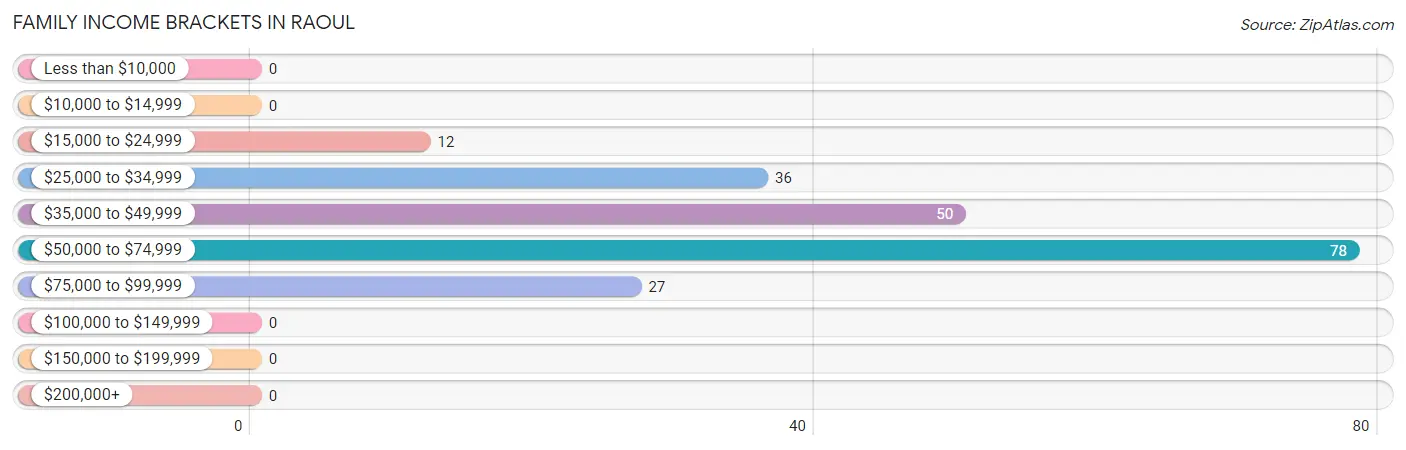
| Income Bracket | # Families | % Families |
| Less than $10,000 | 0 | 0.0% |
| $10,000 to $14,999 | 0 | 0.0% |
| $15,000 to $24,999 | 12 | 5.9% |
| $25,000 to $34,999 | 36 | 17.7% |
| $35,000 to $49,999 | 50 | 24.6% |
| $50,000 to $74,999 | 78 | 38.4% |
| $75,000 to $99,999 | 27 | 13.3% |
| $100,000 to $149,999 | 0 | 0.0% |
| $150,000 to $199,999 | 0 | 0.0% |
| $200,000+ | 0 | 0.0% |
Family Income by Famaliy Size in Raoul
3-person families (149 | 73.4%) account for the highest median family income in Raoul with $44,250 per family, while 3-person families (149 | 73.4%) have the highest median income of $14,750 per family member.
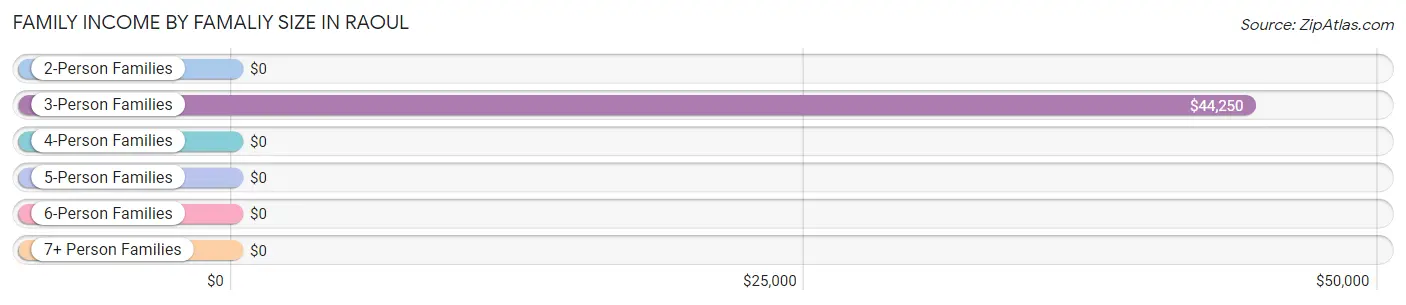
| Income Bracket | # Families | Median Income |
| 2-Person Families | 15 (7.4%) | $0 |
| 3-Person Families | 149 (73.4%) | $44,250 |
| 4-Person Families | 34 (16.8%) | $0 |
| 5-Person Families | 1 (0.5%) | $0 |
| 6-Person Families | 4 (2.0%) | $0 |
| 7+ Person Families | 0 (0.0%) | $0 |
| Total | 203 (100.0%) | $55,165 |
Family Income by Number of Earners in Raoul
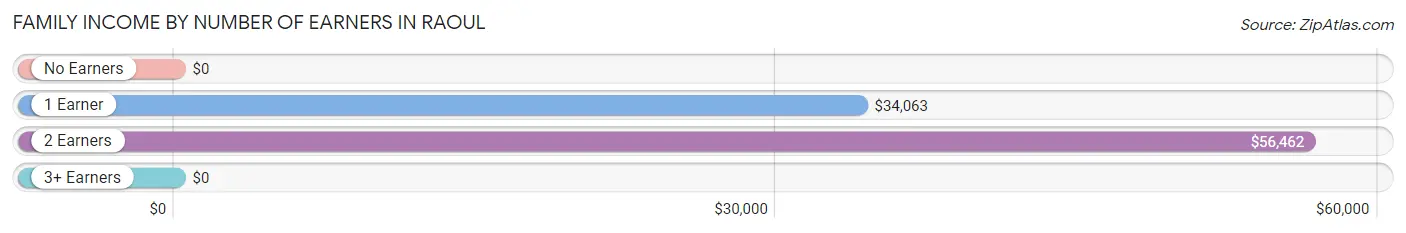
| Number of Earners | # Families | Median Income |
| No Earners | 36 (17.7%) | $0 |
| 1 Earner | 31 (15.3%) | $34,063 |
| 2 Earners | 124 (61.1%) | $56,462 |
| 3+ Earners | 12 (5.9%) | $0 |
| Total | 203 (100.0%) | $55,165 |
Household Income in Raoul
Household Income Brackets in Raoul
With 165 households falling in the category, the $50,000 to $74,999 income range is the most frequent in Raoul, accounting for 52.7% of all households.
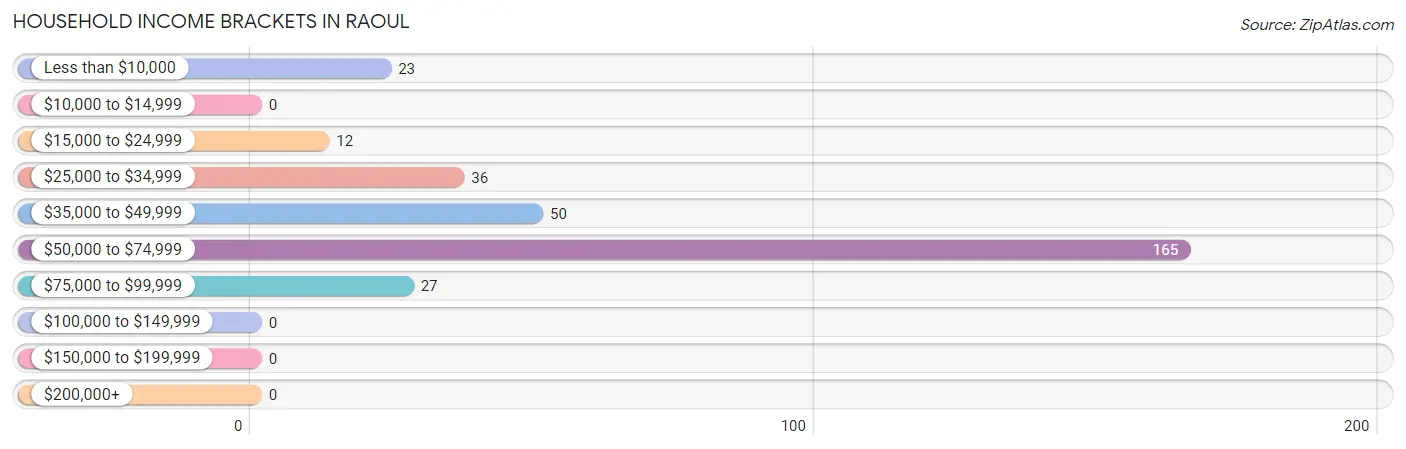
| Income Bracket | # Households | % Households |
| Less than $10,000 | 23 | 7.3% |
| $10,000 to $14,999 | 0 | 0.0% |
| $15,000 to $24,999 | 12 | 3.8% |
| $25,000 to $34,999 | 36 | 11.5% |
| $35,000 to $49,999 | 50 | 16.0% |
| $50,000 to $74,999 | 165 | 52.7% |
| $75,000 to $99,999 | 27 | 8.6% |
| $100,000 to $149,999 | 0 | 0.0% |
| $150,000 to $199,999 | 0 | 0.0% |
| $200,000+ | 0 | 0.0% |
Household Income by Householder Age in Raoul
The median household income in Raoul is $56,675, with the highest median household income of $58,408 found in the 25 to 44 years age bracket for the primary householder. A total of 201 households (64.2%) fall into this category.
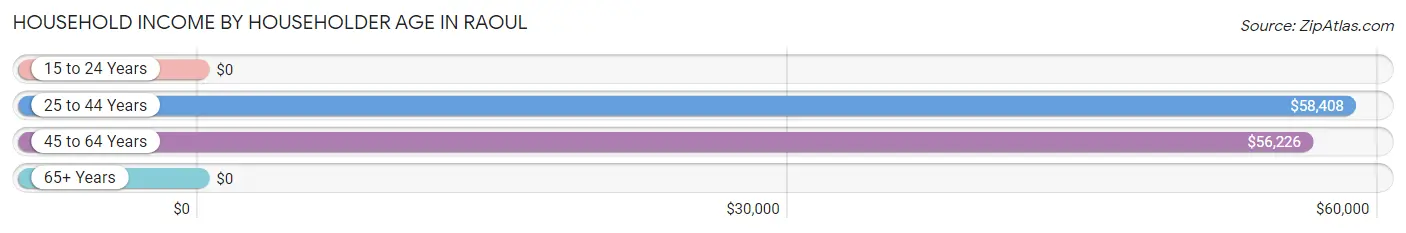
| Income Bracket | # Households | Median Income |
| 15 to 24 Years | 0 (0.0%) | $0 |
| 25 to 44 Years | 201 (64.2%) | $58,408 |
| 45 to 64 Years | 78 (24.9%) | $56,226 |
| 65+ Years | 34 (10.9%) | $0 |
| Total | 313 (100.0%) | $56,675 |
Poverty in Raoul
Income Below Poverty by Sex and Age in Raoul
With 8.7% poverty level for males and 11.3% for females among the residents of Raoul, under 5 year old males and 6 to 11 year old females are the most vulnerable to poverty, with 14 males (73.7%) and 17 females (39.5%) in their respective age groups living below the poverty level.
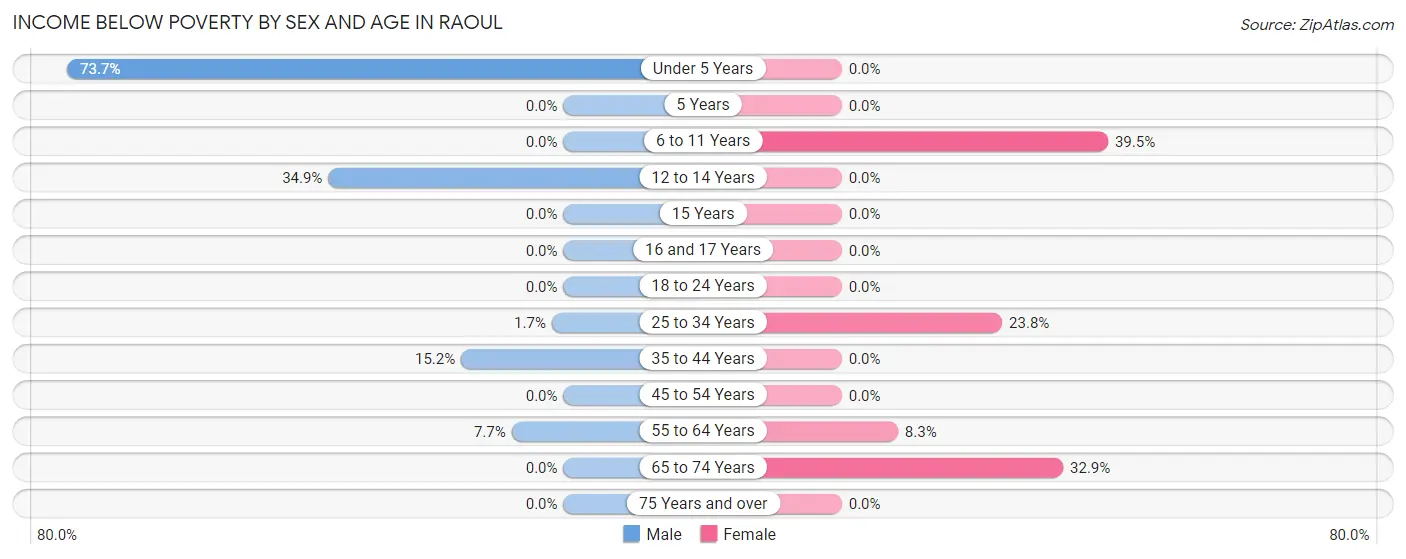
| Age Bracket | Male | Female |
| Under 5 Years | 14 (73.7%) | 0 (0.0%) |
| 5 Years | 0 (0.0%) | 0 (0.0%) |
| 6 to 11 Years | 0 (0.0%) | 17 (39.5%) |
| 12 to 14 Years | 22 (34.9%) | 0 (0.0%) |
| 15 Years | 0 (0.0%) | 0 (0.0%) |
| 16 and 17 Years | 0 (0.0%) | 0 (0.0%) |
| 18 to 24 Years | 0 (0.0%) | 0 (0.0%) |
| 25 to 34 Years | 2 (1.7%) | 15 (23.8%) |
| 35 to 44 Years | 12 (15.2%) | 0 (0.0%) |
| 45 to 54 Years | 0 (0.0%) | 0 (0.0%) |
| 55 to 64 Years | 1 (7.7%) | 1 (8.3%) |
| 65 to 74 Years | 0 (0.0%) | 23 (32.9%) |
| 75 Years and over | 0 (0.0%) | 0 (0.0%) |
| Total | 51 (8.7%) | 56 (11.3%) |
Income Above Poverty by Sex and Age in Raoul
According to the poverty statistics in Raoul, males aged 6 to 11 years and females aged 12 to 14 years are the age groups that are most secure financially, with 100.0% of males and 100.0% of females in these age groups living above the poverty line.
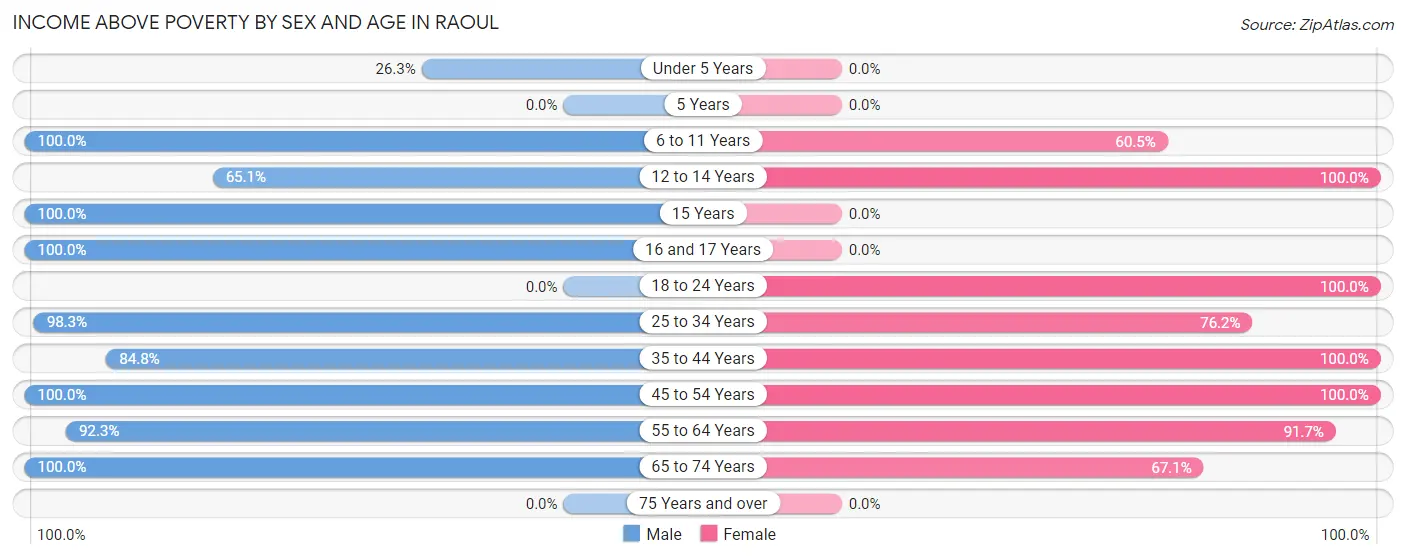
| Age Bracket | Male | Female |
| Under 5 Years | 5 (26.3%) | 0 (0.0%) |
| 5 Years | 0 (0.0%) | 0 (0.0%) |
| 6 to 11 Years | 36 (100.0%) | 26 (60.5%) |
| 12 to 14 Years | 41 (65.1%) | 180 (100.0%) |
| 15 Years | 16 (100.0%) | 0 (0.0%) |
| 16 and 17 Years | 31 (100.0%) | 0 (0.0%) |
| 18 to 24 Years | 0 (0.0%) | 9 (100.0%) |
| 25 to 34 Years | 114 (98.3%) | 48 (76.2%) |
| 35 to 44 Years | 67 (84.8%) | 56 (100.0%) |
| 45 to 54 Years | 166 (100.0%) | 64 (100.0%) |
| 55 to 64 Years | 12 (92.3%) | 11 (91.7%) |
| 65 to 74 Years | 47 (100.0%) | 47 (67.1%) |
| 75 Years and over | 0 (0.0%) | 0 (0.0%) |
| Total | 535 (91.3%) | 441 (88.7%) |
Income Below Poverty Among Married-Couple Families in Raoul
The poverty statistics for married-couple families in Raoul show that 8.3% or 13 of the total 156 families live below the poverty line. Families with 1 or 2 children have the highest poverty rate of 10.4%, comprising of 13 families. On the other hand, families with no children have the lowest poverty rate of 0.0%, which includes 0 families.
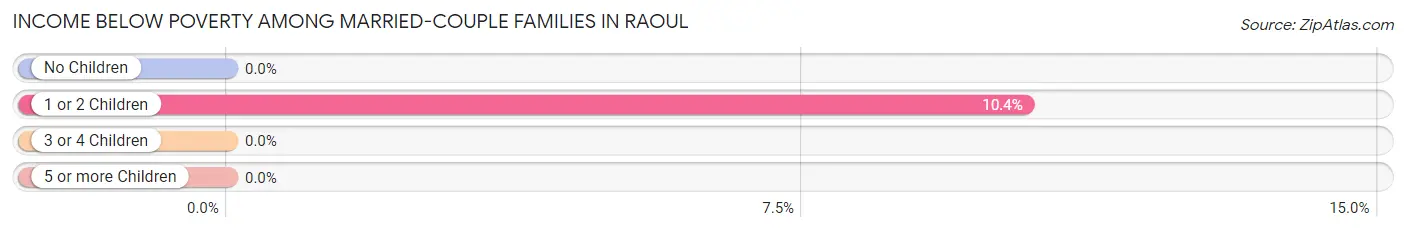
| Children | Above Poverty | Below Poverty |
| No Children | 27 (100.0%) | 0 (0.0%) |
| 1 or 2 Children | 112 (89.6%) | 13 (10.4%) |
| 3 or 4 Children | 4 (100.0%) | 0 (0.0%) |
| 5 or more Children | 0 (0.0%) | 0 (0.0%) |
| Total | 143 (91.7%) | 13 (8.3%) |
Income Below Poverty Among Single-Parent Households in Raoul
| Children | Single Father | Single Mother |
| No Children | 0 (0.0%) | 0 (0.0%) |
| 1 or 2 Children | 0 (0.0%) | 0 (0.0%) |
| 3 or 4 Children | 0 (0.0%) | 0 (0.0%) |
| 5 or more Children | 0 (0.0%) | 0 (0.0%) |
| Total | 0 (0.0%) | 0 (0.0%) |
Income Below Poverty Among Married-Couple vs Single-Parent Households in Raoul
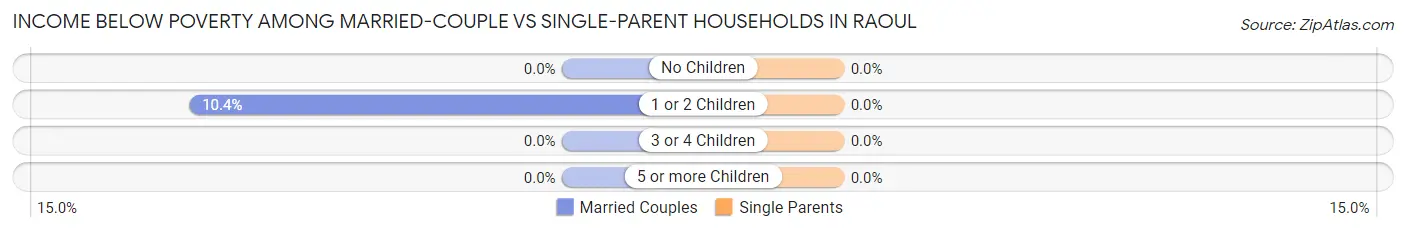
| Children | Married-Couple Families | Single-Parent Households |
| No Children | 0 (0.0%) | 0 (0.0%) |
| 1 or 2 Children | 13 (10.4%) | 0 (0.0%) |
| 3 or 4 Children | 0 (0.0%) | 0 (0.0%) |
| 5 or more Children | 0 (0.0%) | 0 (0.0%) |
| Total | 13 (8.3%) | 0 (0.0%) |
Race in Raoul
The most populous races in Raoul are White / Caucasian (1,917 | 75.8%), Black / African American (540 | 21.3%), and Hispanic or Latino (537 | 21.2%).
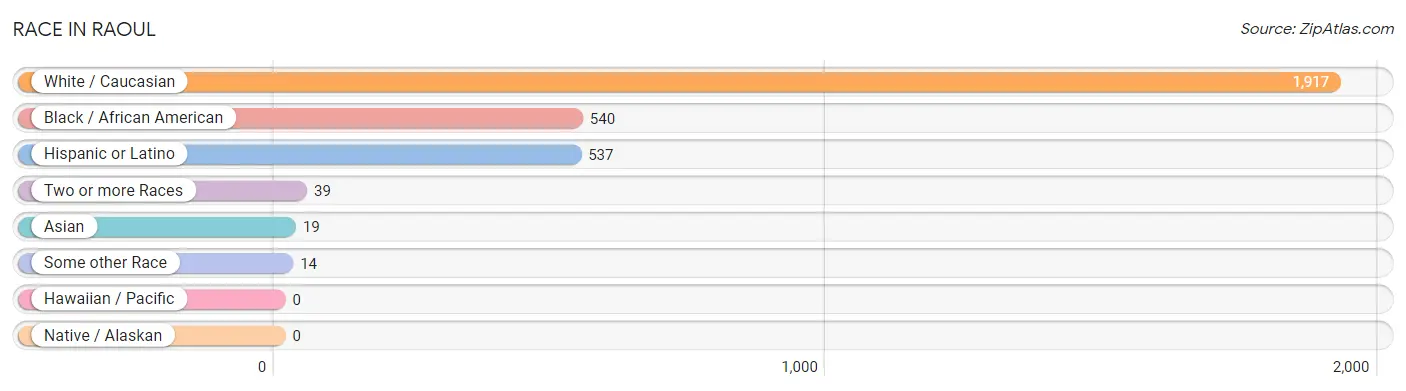
| Race | # Population | % Population |
| Asian | 19 | 0.7% |
| Black / African American | 540 | 21.3% |
| Hawaiian / Pacific | 0 | 0.0% |
| Hispanic or Latino | 537 | 21.2% |
| Native / Alaskan | 0 | 0.0% |
| White / Caucasian | 1,917 | 75.8% |
| Two or more Races | 39 | 1.5% |
| Some other Race | 14 | 0.5% |
| Total | 2,529 | 100.0% |
Ancestry in Raoul
The most populous ancestries reported in Raoul are Mexican (517 | 20.4%), American (357 | 14.1%), Irish (144 | 5.7%), English (106 | 4.2%), and Subsaharan African (39 | 1.5%), together accounting for 46.0% of all Raoul residents.
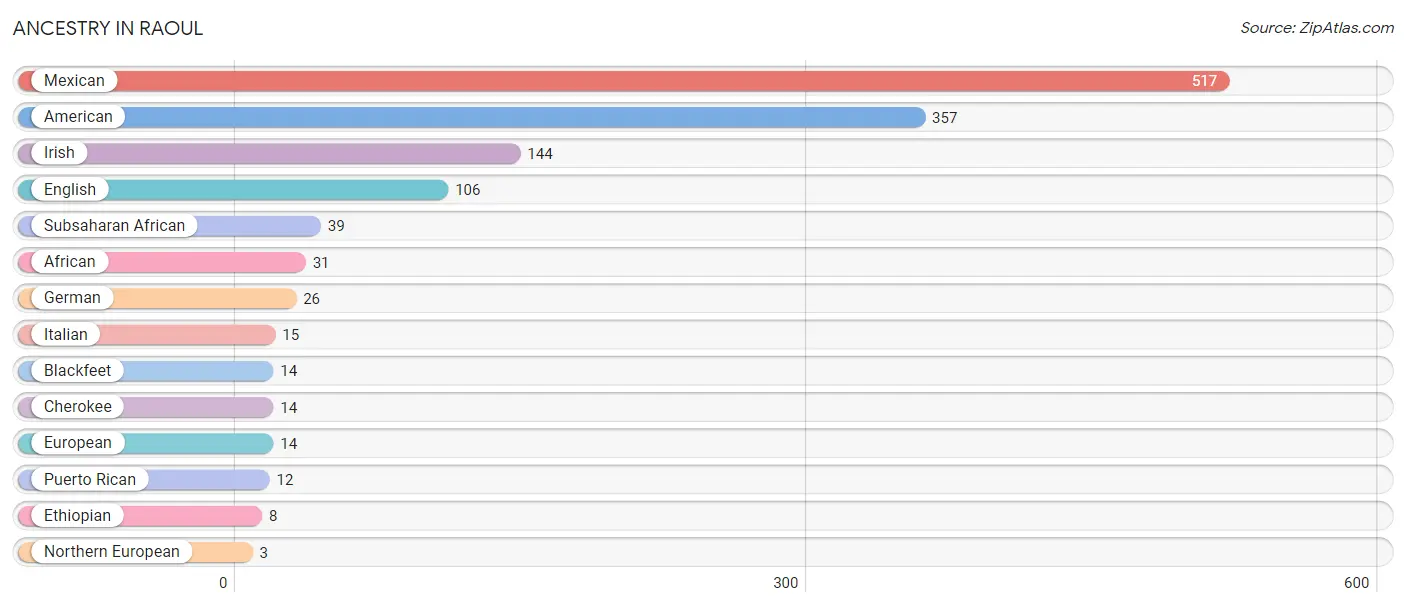
| Ancestry | # Population | % Population |
| African | 31 | 1.2% |
| American | 357 | 14.1% |
| Blackfeet | 14 | 0.5% |
| Cherokee | 14 | 0.5% |
| English | 106 | 4.2% |
| Ethiopian | 8 | 0.3% |
| European | 14 | 0.5% |
| German | 26 | 1.0% |
| Irish | 144 | 5.7% |
| Italian | 15 | 0.6% |
| Mexican | 517 | 20.4% |
| Northern European | 3 | 0.1% |
| Puerto Rican | 12 | 0.5% |
| Subsaharan African | 39 | 1.5% | View All 14 Rows |
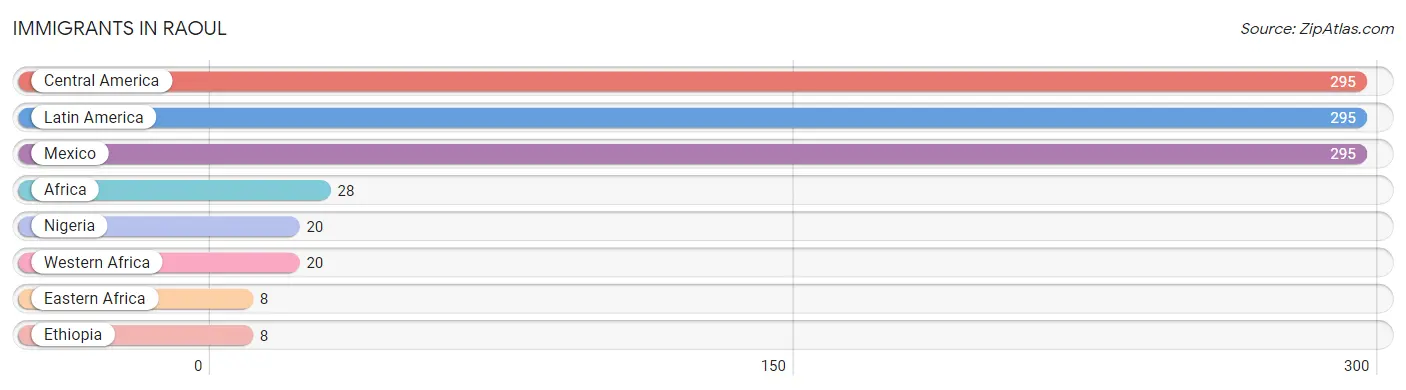
Immigrants in Raoul
The most numerous immigrant groups reported in Raoul came from Central America (295 | 11.7%), Latin America (295 | 11.7%), Mexico (295 | 11.7%), Africa (28 | 1.1%), and Nigeria (20 | 0.8%), together accounting for 36.9% of all Raoul residents.
| Immigration Origin | # Population | % Population |
| Africa | 28 | 1.1% |
| Central America | 295 | 11.7% |
| Eastern Africa | 8 | 0.3% |
| Ethiopia | 8 | 0.3% |
| Latin America | 295 | 11.7% |
| Mexico | 295 | 11.7% |
| Nigeria | 20 | 0.8% |
| Western Africa | 20 | 0.8% | View All 8 Rows |
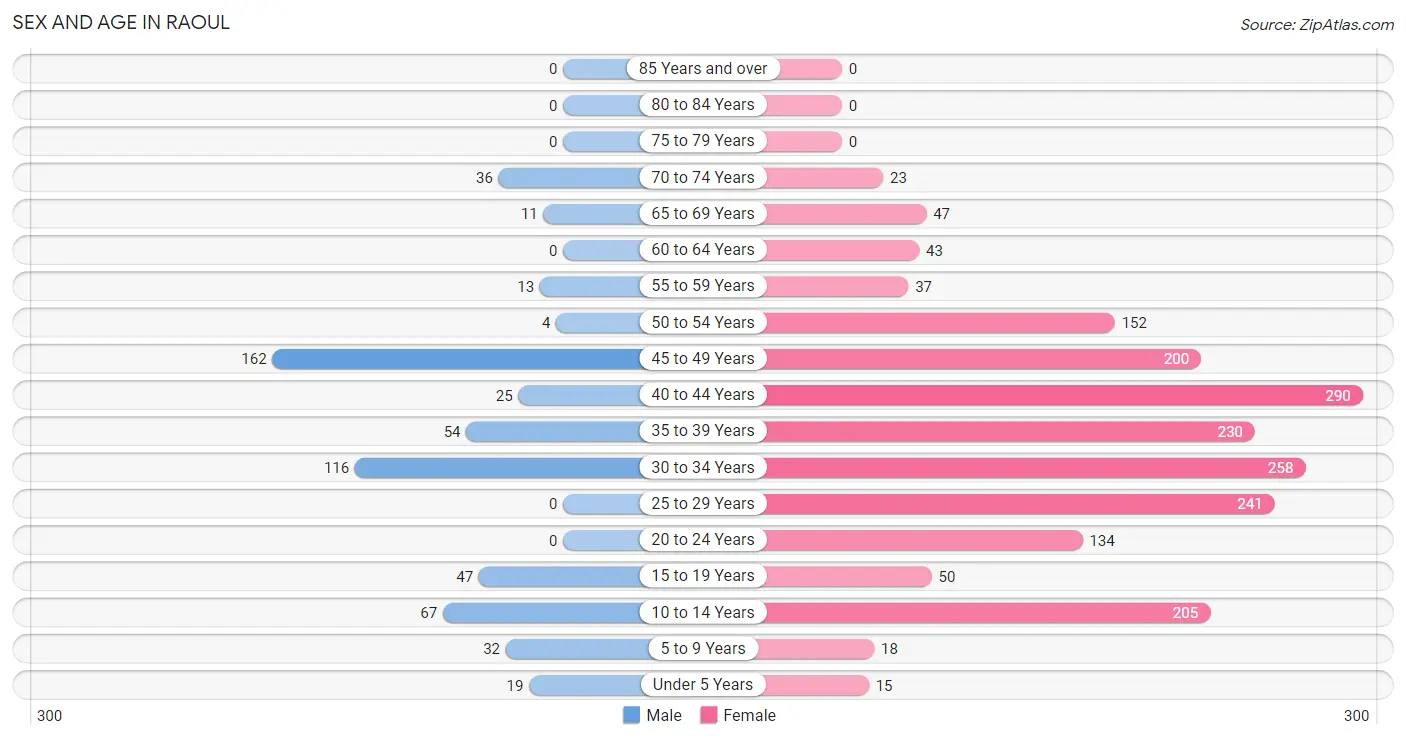
Sex and Age in Raoul
Sex and Age in Raoul
The most populous age groups in Raoul are 45 to 49 Years (162 | 27.7%) for men and 40 to 44 Years (290 | 14.9%) for women.
| Age Bracket | Male | Female |
| Under 5 Years | 19 (3.2%) | 15 (0.8%) |
| 5 to 9 Years | 32 (5.5%) | 18 (0.9%) |
| 10 to 14 Years | 67 (11.4%) | 205 (10.5%) |
| 15 to 19 Years | 47 (8.0%) | 50 (2.6%) |
| 20 to 24 Years | 0 (0.0%) | 134 (6.9%) |
| 25 to 29 Years | 0 (0.0%) | 241 (12.4%) |
| 30 to 34 Years | 116 (19.8%) | 258 (13.3%) |
| 35 to 39 Years | 54 (9.2%) | 230 (11.8%) |
| 40 to 44 Years | 25 (4.3%) | 290 (14.9%) |
| 45 to 49 Years | 162 (27.7%) | 200 (10.3%) |
| 50 to 54 Years | 4 (0.7%) | 152 (7.8%) |
| 55 to 59 Years | 13 (2.2%) | 37 (1.9%) |
| 60 to 64 Years | 0 (0.0%) | 43 (2.2%) |
| 65 to 69 Years | 11 (1.9%) | 47 (2.4%) |
| 70 to 74 Years | 36 (6.1%) | 23 (1.2%) |
| 75 to 79 Years | 0 (0.0%) | 0 (0.0%) |
| 80 to 84 Years | 0 (0.0%) | 0 (0.0%) |
| 85 Years and over | 0 (0.0%) | 0 (0.0%) |
| Total | 586 (100.0%) | 1,943 (100.0%) |
Families and Households in Raoul
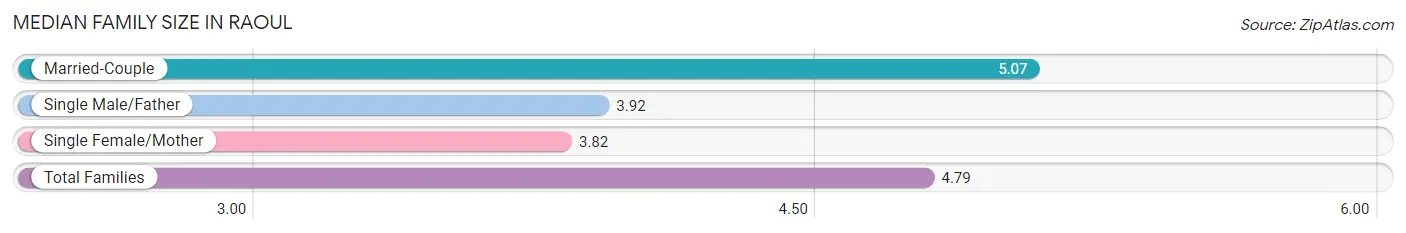
Median Family Size in Raoul
The median family size in Raoul is 4.79 persons per family, with married-couple families (156 | 76.8%) accounting for the largest median family size of 5.07 persons per family. On the other hand, single female/mother families (22 | 10.8%) represent the smallest median family size with 3.82 persons per family.
| Family Type | # Families | Family Size |
| Married-Couple | 156 (76.8%) | 5.07 |
| Single Male/Father | 25 (12.3%) | 3.92 |
| Single Female/Mother | 22 (10.8%) | 3.82 |
| Total Families | 203 (100.0%) | 4.79 |
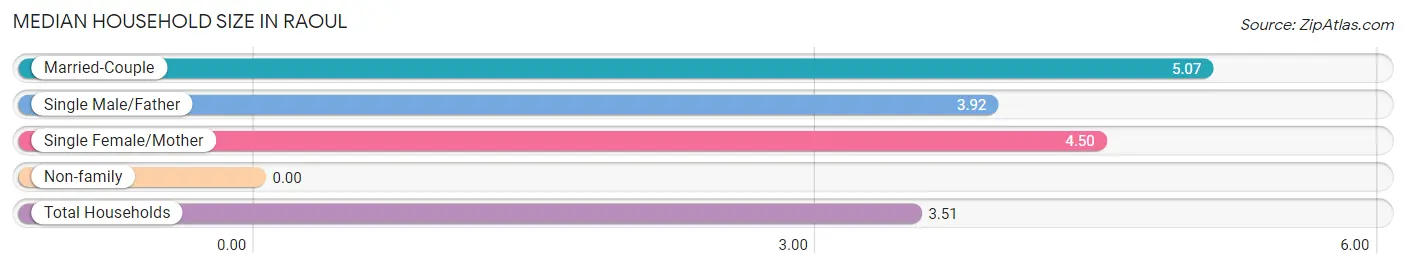
Median Household Size in Raoul
| Household Type | # Households | Household Size |
| Married-Couple | 156 (49.8%) | 5.07 |
| Single Male/Father | 25 (8.0%) | 3.92 |
| Single Female/Mother | 22 (7.0%) | 4.50 |
| Non-family | 110 (35.1%) | - |
| Total Households | 313 (100.0%) | 3.51 |
Household Size by Marriage Status in Raoul
Out of a total of 313 households in Raoul, 203 (64.9%) are family households, while 110 (35.1%) are nonfamily households. The most numerous type of family households are 3-person households, comprising 135, and the most common type of nonfamily households are 1-person households, comprising 110.
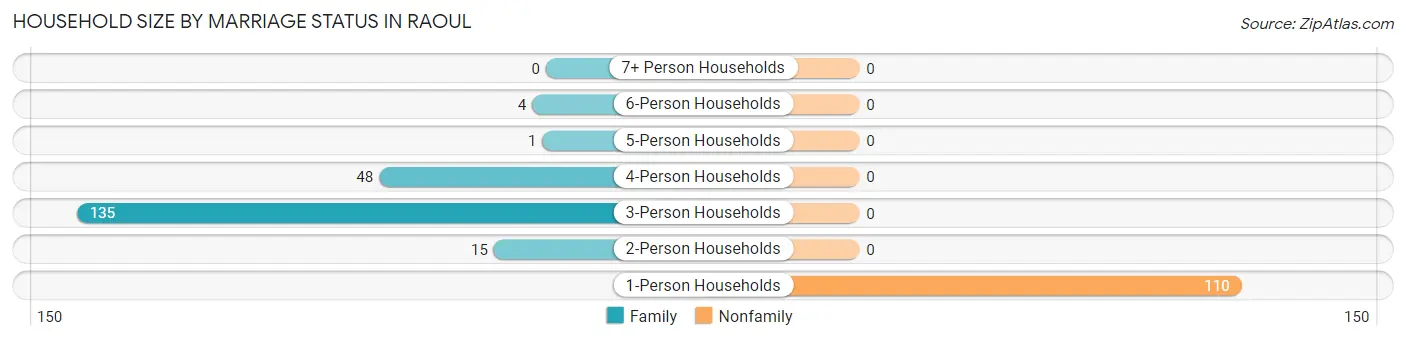
| Household Size | Family Households | Nonfamily Households |
| 1-Person Households | - | 110 (35.1%) |
| 2-Person Households | 15 (4.8%) | 0 (0.0%) |
| 3-Person Households | 135 (43.1%) | 0 (0.0%) |
| 4-Person Households | 48 (15.3%) | 0 (0.0%) |
| 5-Person Households | 1 (0.3%) | 0 (0.0%) |
| 6-Person Households | 4 (1.3%) | 0 (0.0%) |
| 7+ Person Households | 0 (0.0%) | 0 (0.0%) |
| Total | 203 (64.9%) | 110 (35.1%) |
Female Fertility in Raoul
Fertility by Age in Raoul
Average fertility rate in Raoul is 18.0 births per 1,000 women. Women in the age bracket of 20 to 34 years have the highest fertility rate with 38.0 births per 1,000 women. Women in the age bracket of 20 to 34 years acount for 92.3% of all women with births.
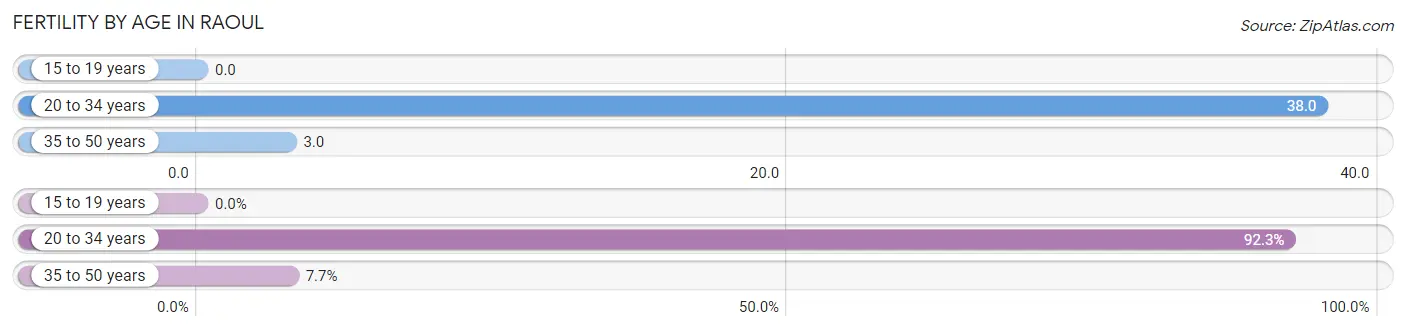
| Age Bracket | Women with Births | Births / 1,000 Women |
| 15 to 19 years | 0 (0.0%) | 0.0 |
| 20 to 34 years | 24 (92.3%) | 38.0 |
| 35 to 50 years | 2 (7.7%) | 3.0 |
| Total | 26 (100.0%) | 18.0 |
Fertility by Age by Marriage Status in Raoul
80.8% of women with births (26) in Raoul are married. The highest percentage of unmarried women with births falls into 35 to 50 years age bracket with 100.0% of them unmarried at the time of birth, while the lowest percentage of unmarried women with births belong to 20 to 34 years age bracket with 12.5% of them unmarried.
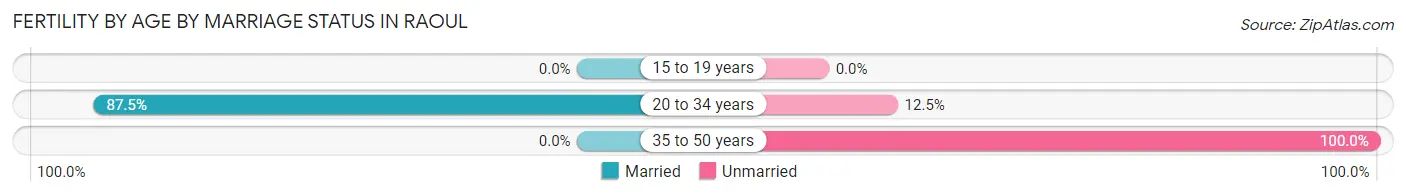
| Age Bracket | Married | Unmarried |
| 15 to 19 years | 0 (0.0%) | 0 (0.0%) |
| 20 to 34 years | 21 (87.5%) | 3 (12.5%) |
| 35 to 50 years | 0 (0.0%) | 2 (100.0%) |
| Total | 21 (80.8%) | 5 (19.2%) |
Fertility by Education in Raoul
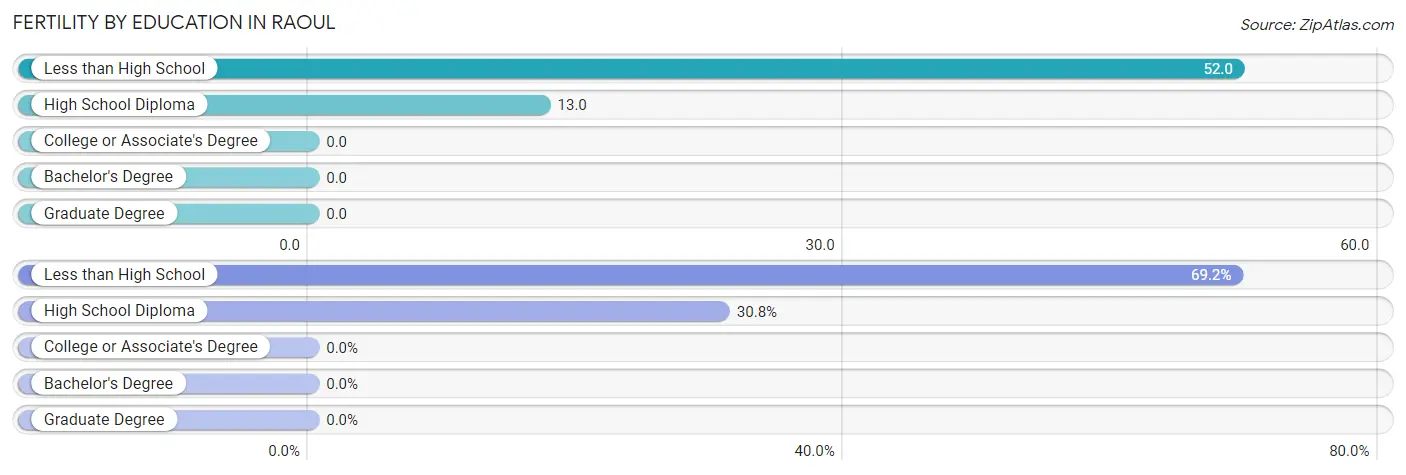
| Educational Attainment | Women with Births | Births / 1,000 Women |
| Less than High School | 18 (69.2%) | 52.0 |
| High School Diploma | 8 (30.8%) | 13.0 |
| College or Associate's Degree | 0 (0.0%) | 0.0 |
| Bachelor's Degree | 0 (0.0%) | 0.0 |
| Graduate Degree | 0 (0.0%) | 0.0 |
| Total | 26 (100.0%) | 18.0 |
Fertility by Education by Marriage Status in Raoul
19.2% of women with births in Raoul are unmarried. Women with the educational attainment of less than high school are most likely to be married with 83.3% of them married at childbirth, while women with the educational attainment of high school diploma are least likely to be married with 25.0% of them unmarried at childbirth.
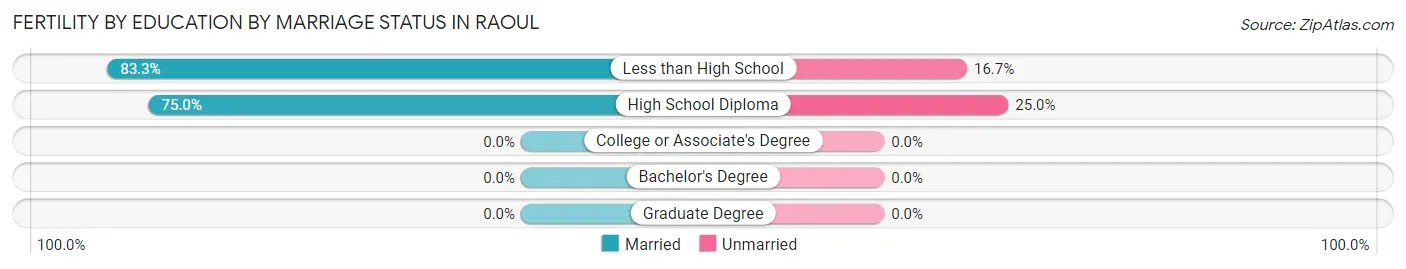
| Educational Attainment | Married | Unmarried |
| Less than High School | 15 (83.3%) | 3 (16.7%) |
| High School Diploma | 6 (75.0%) | 2 (25.0%) |
| College or Associate's Degree | 0 (0.0%) | 0 (0.0%) |
| Bachelor's Degree | 0 (0.0%) | 0 (0.0%) |
| Graduate Degree | 0 (0.0%) | 0 (0.0%) |
| Total | 21 (80.8%) | 5 (19.2%) |
Employment Characteristics in Raoul
Employment by Class of Employer in Raoul
Among the 476 employed individuals in Raoul, private company employees (457 | 96.0%), local government employees (11 | 2.3%), and self-employed (not incorporated) (8 | 1.7%) make up the most common classes of employment.
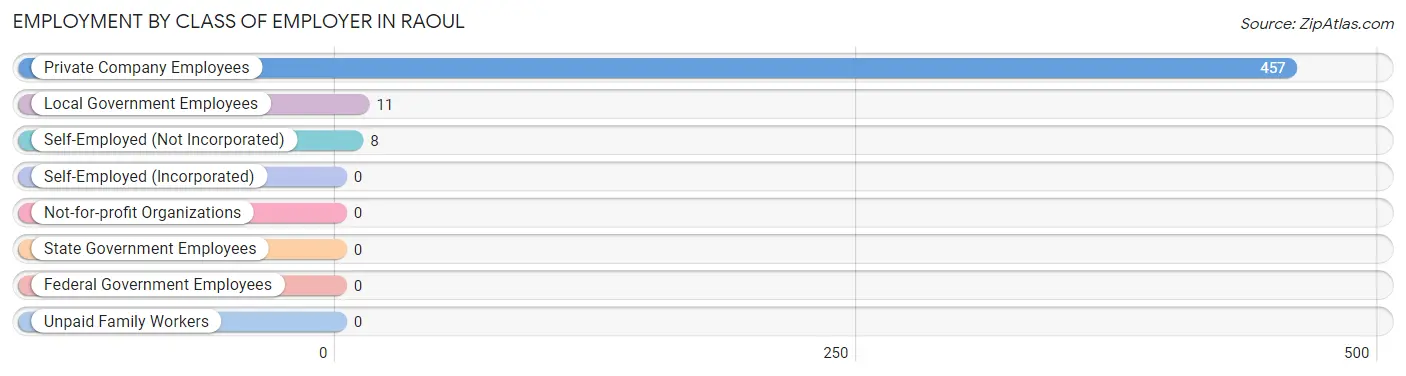
| Employer Class | # Employees | % Employees |
| Private Company Employees | 457 | 96.0% |
| Self-Employed (Incorporated) | 0 | 0.0% |
| Self-Employed (Not Incorporated) | 8 | 1.7% |
| Not-for-profit Organizations | 0 | 0.0% |
| Local Government Employees | 11 | 2.3% |
| State Government Employees | 0 | 0.0% |
| Federal Government Employees | 0 | 0.0% |
| Unpaid Family Workers | 0 | 0.0% |
| Total | 476 | 100.0% |
Employment Status by Age in Raoul
According to the labor force statistics for Raoul, out of the total population over 16 years of age (2,157), 24.7% or 533 individuals are in the labor force, with 4.3% or 23 of them unemployed. The age group with the highest labor force participation rate is 55 to 59 years, with 46.0% or 23 individuals in the labor force. Within the labor force, the 25 to 29 years age range has the highest percentage of unemployed individuals, with 100.0% or 23 of them being unemployed.
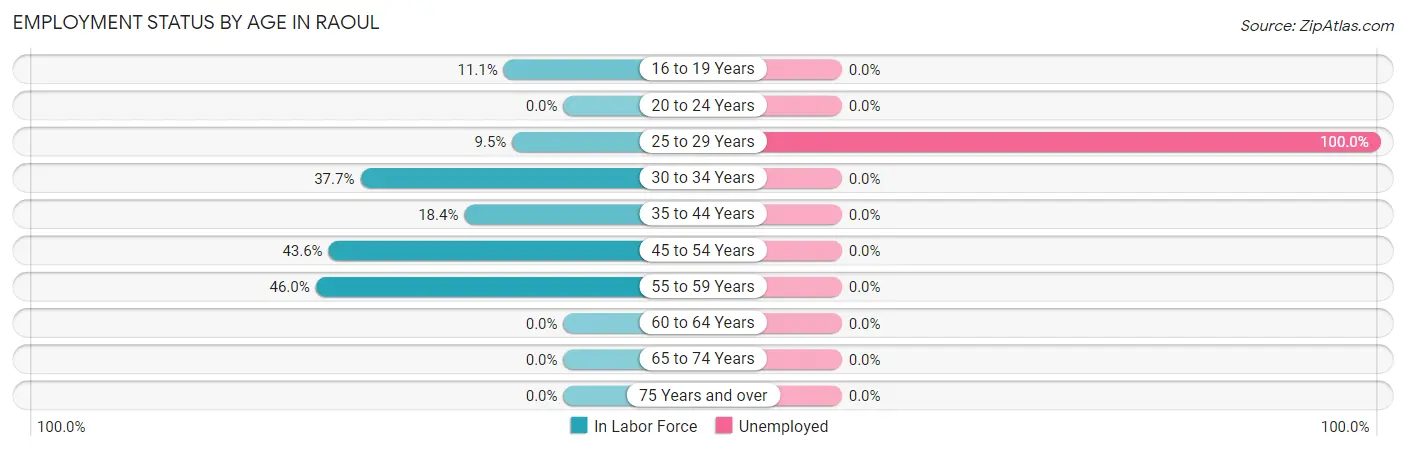
| Age Bracket | In Labor Force | Unemployed |
| 16 to 19 Years | 9 (11.1%) | 0 (0.0%) |
| 20 to 24 Years | 0 (0.0%) | 0 (0.0%) |
| 25 to 29 Years | 23 (9.5%) | 23 (100.0%) |
| 30 to 34 Years | 141 (37.7%) | 0 (0.0%) |
| 35 to 44 Years | 110 (18.4%) | 0 (0.0%) |
| 45 to 54 Years | 226 (43.6%) | 0 (0.0%) |
| 55 to 59 Years | 23 (46.0%) | 0 (0.0%) |
| 60 to 64 Years | 0 (0.0%) | 0 (0.0%) |
| 65 to 74 Years | 0 (0.0%) | 0 (0.0%) |
| 75 Years and over | 0 (0.0%) | 0 (0.0%) |
| Total | 533 (24.7%) | 23 (4.3%) |
Employment Status by Educational Attainment in Raoul
According to labor force statistics for Raoul, 28.7% of individuals (524) out of the total population between 25 and 64 years of age (1,825) are in the labor force, with 4.4% or 23 of them being unemployed. The group with the highest labor force participation rate are those with the educational attainment of less than high school, with 46.4% or 252 individuals in the labor force. Within the labor force, individuals with less than high school education have the highest percentage of unemployment, with 9.1% or 23 of them being unemployed.
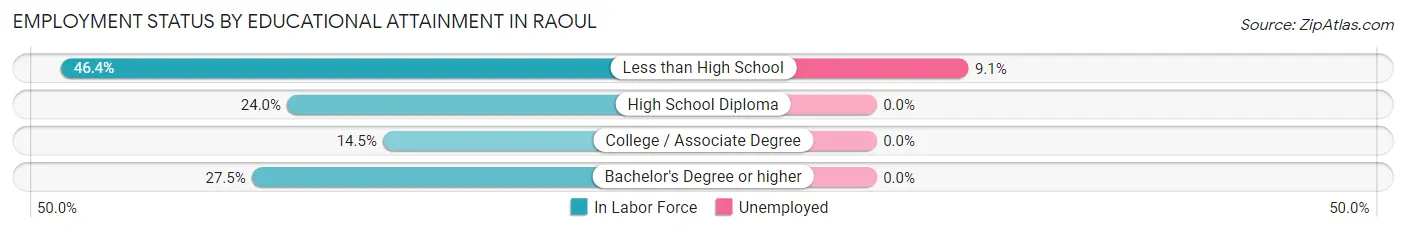
| Educational Attainment | In Labor Force | Unemployed |
| Less than High School | 252 (46.4%) | 49 (9.1%) |
| High School Diploma | 179 (24.0%) | 0 (0.0%) |
| College / Associate Degree | 62 (14.5%) | 0 (0.0%) |
| Bachelor's Degree or higher | 30 (27.5%) | 0 (0.0%) |
| Total | 524 (28.7%) | 80 (4.4%) |
Employment Occupations by Sex in Raoul
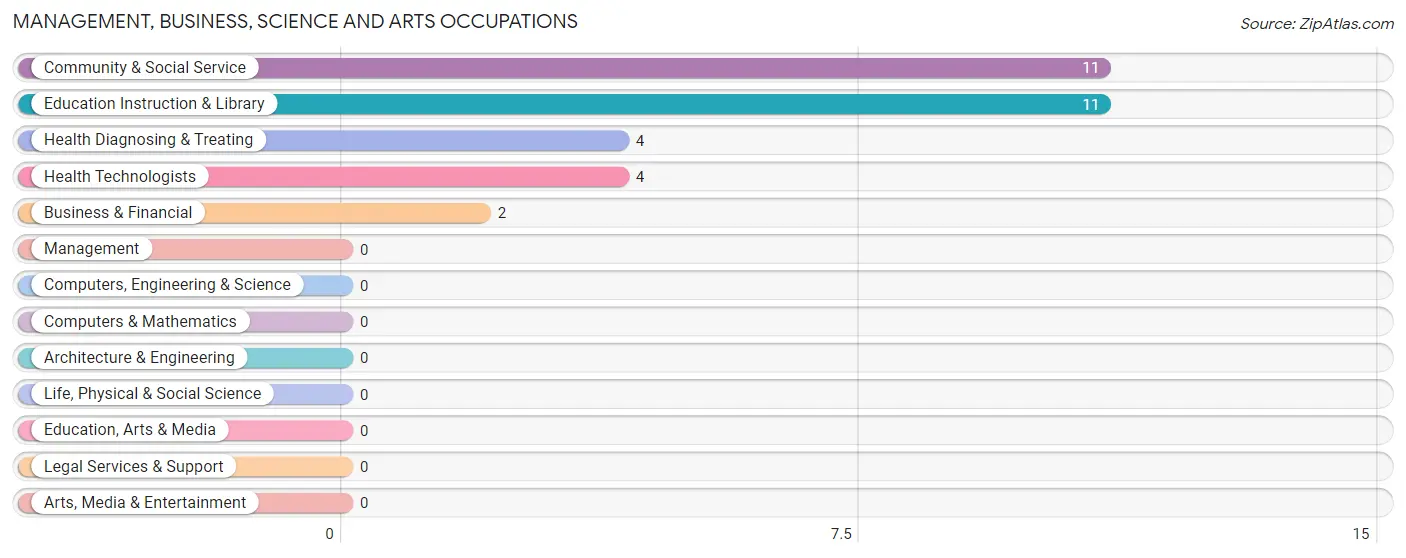
Management, Business, Science and Arts Occupations
The most common Management, Business, Science and Arts occupations in Raoul are Community & Social Service (11 | 2.2%), Education Instruction & Library (11 | 2.2%), Health Diagnosing & Treating (4 | 0.8%), Health Technologists (4 | 0.8%), and Business & Financial (2 | 0.4%).
Management, Business, Science and Arts Occupations by Sex
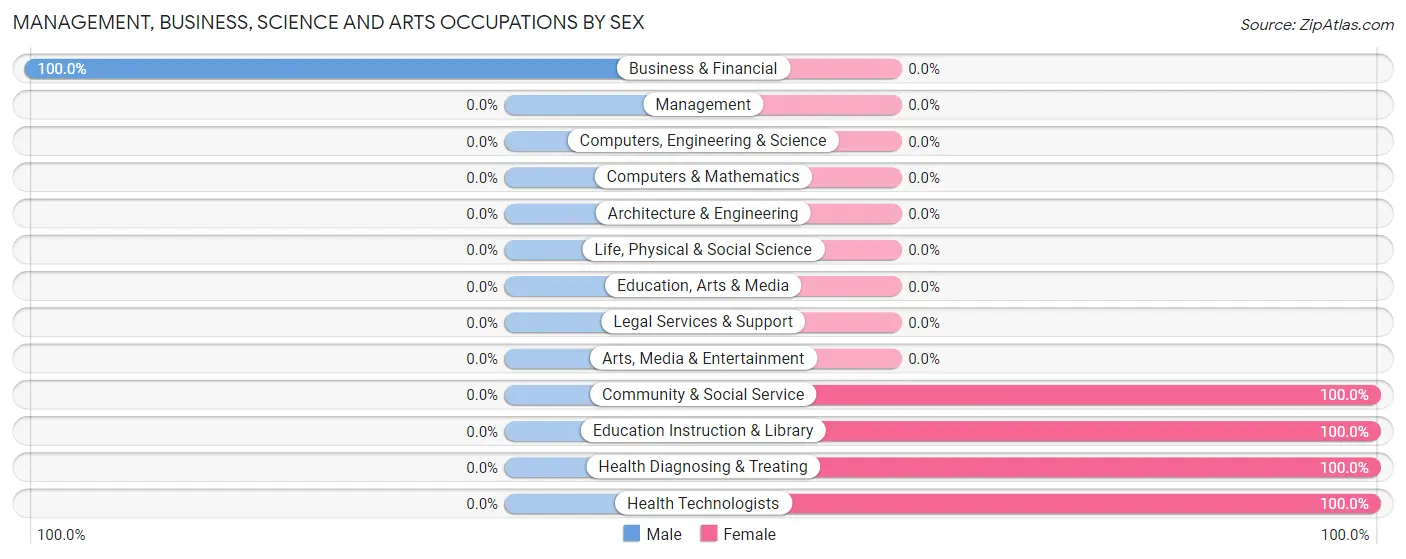
| Occupation | Male | Female |
| Management | 0 (0.0%) | 0 (0.0%) |
| Business & Financial | 2 (100.0%) | 0 (0.0%) |
| Computers, Engineering & Science | 0 (0.0%) | 0 (0.0%) |
| Computers & Mathematics | 0 (0.0%) | 0 (0.0%) |
| Architecture & Engineering | 0 (0.0%) | 0 (0.0%) |
| Life, Physical & Social Science | 0 (0.0%) | 0 (0.0%) |
| Community & Social Service | 0 (0.0%) | 11 (100.0%) |
| Education, Arts & Media | 0 (0.0%) | 0 (0.0%) |
| Legal Services & Support | 0 (0.0%) | 0 (0.0%) |
| Education Instruction & Library | 0 (0.0%) | 11 (100.0%) |
| Arts, Media & Entertainment | 0 (0.0%) | 0 (0.0%) |
| Health Diagnosing & Treating | 0 (0.0%) | 4 (100.0%) |
| Health Technologists | 0 (0.0%) | 4 (100.0%) |
| Total (Category) | 2 (11.8%) | 15 (88.2%) |
| Total (Overall) | 344 (67.6%) | 165 (32.4%) |
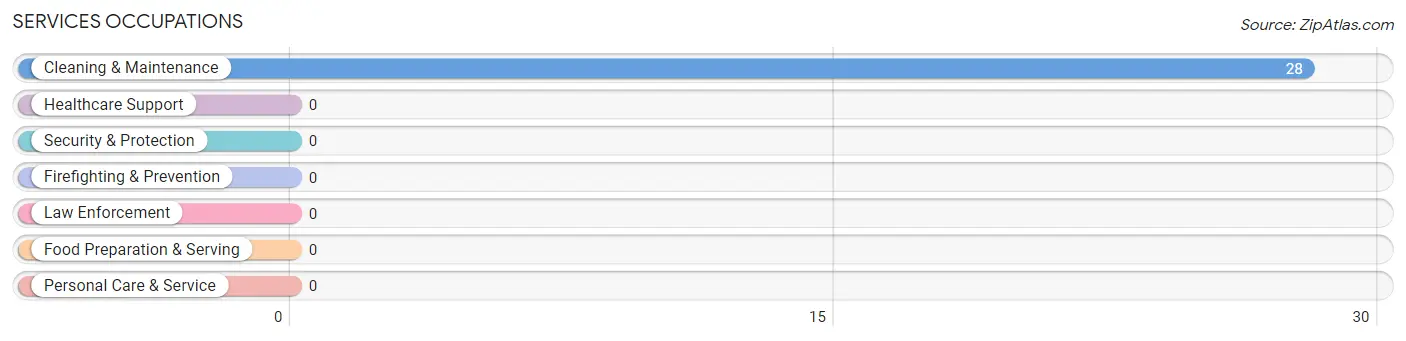
Services Occupations
The most common Services occupations in Raoul are , and Cleaning & Maintenance (28 | 5.5%).
Services Occupations by Sex
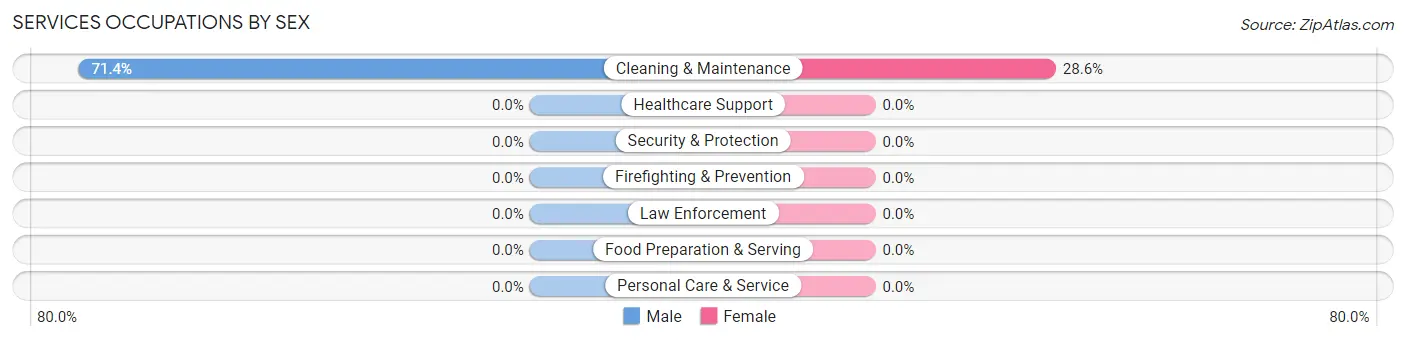
| Occupation | Male | Female |
| Healthcare Support | 0 (0.0%) | 0 (0.0%) |
| Security & Protection | 0 (0.0%) | 0 (0.0%) |
| Firefighting & Prevention | 0 (0.0%) | 0 (0.0%) |
| Law Enforcement | 0 (0.0%) | 0 (0.0%) |
| Food Preparation & Serving | 0 (0.0%) | 0 (0.0%) |
| Cleaning & Maintenance | 20 (71.4%) | 8 (28.6%) |
| Personal Care & Service | 0 (0.0%) | 0 (0.0%) |
| Total (Category) | 20 (71.4%) | 8 (28.6%) |
| Total (Overall) | 344 (67.6%) | 165 (32.4%) |
Sales and Office Occupations
The most common Sales and Office occupations in Raoul are Sales & Related (36 | 7.1%), and Office & Administration (29 | 5.7%).
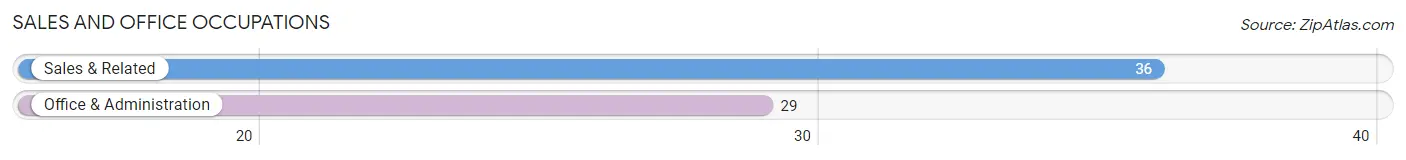
Sales and Office Occupations by Sex
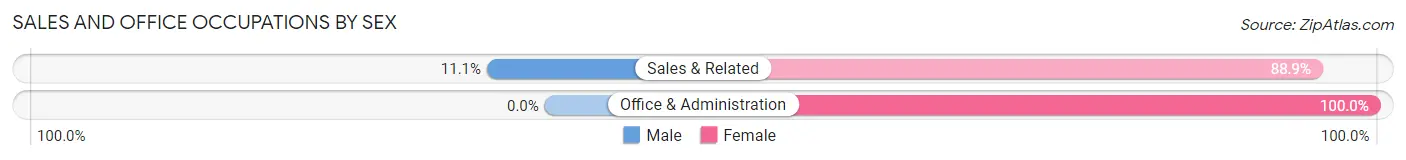
| Occupation | Male | Female |
| Sales & Related | 4 (11.1%) | 32 (88.9%) |
| Office & Administration | 0 (0.0%) | 29 (100.0%) |
| Total (Category) | 4 (6.1%) | 61 (93.9%) |
| Total (Overall) | 344 (67.6%) | 165 (32.4%) |
Natural Resources, Construction and Maintenance Occupations
The most common Natural Resources, Construction and Maintenance occupations in Raoul are Construction & Extraction (268 | 52.6%), and Installation, Maintenance & Repair (36 | 7.1%).
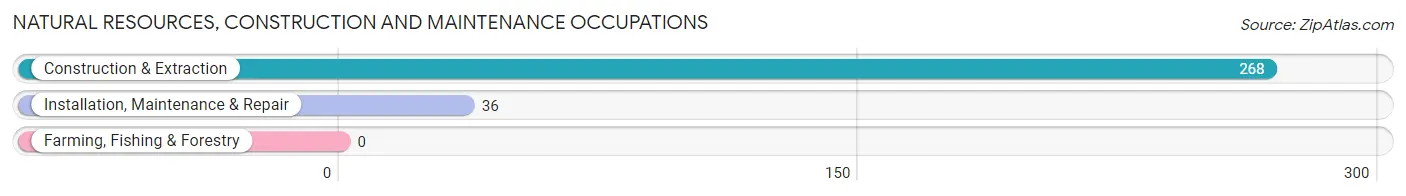
Natural Resources, Construction and Maintenance Occupations by Sex
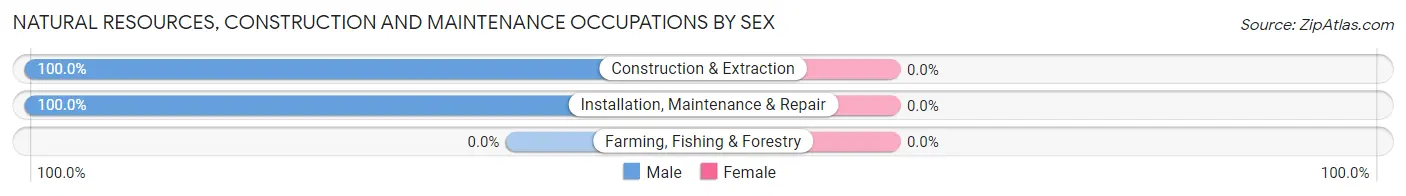
| Occupation | Male | Female |
| Farming, Fishing & Forestry | 0 (0.0%) | 0 (0.0%) |
| Construction & Extraction | 268 (100.0%) | 0 (0.0%) |
| Installation, Maintenance & Repair | 36 (100.0%) | 0 (0.0%) |
| Total (Category) | 304 (100.0%) | 0 (0.0%) |
| Total (Overall) | 344 (67.6%) | 165 (32.4%) |
Production, Transportation and Moving Occupations
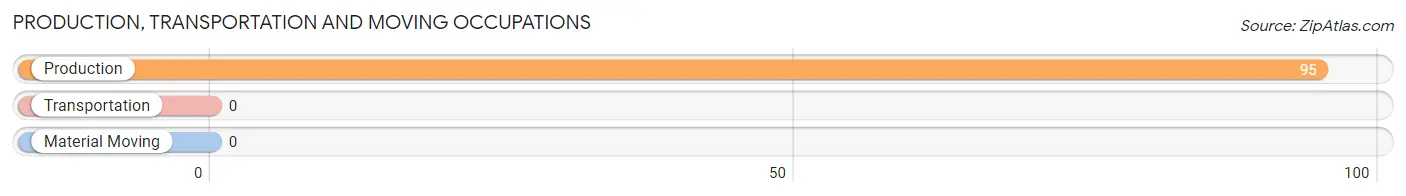
The most common Production, Transportation and Moving occupations in Raoul are , and Production (95 | 18.7%).
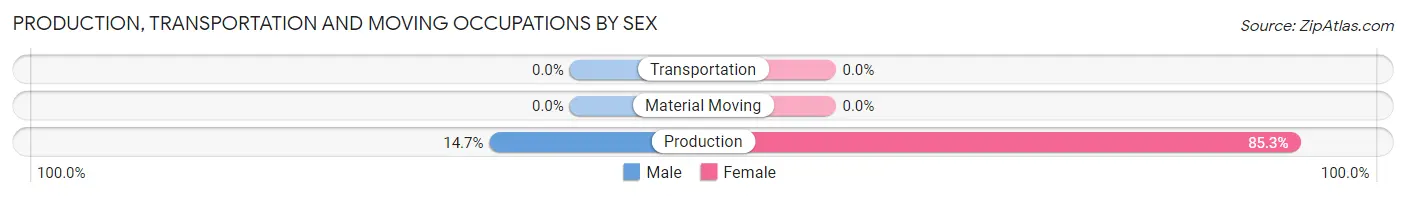
Production, Transportation and Moving Occupations by Sex
| Occupation | Male | Female |
| Production | 14 (14.7%) | 81 (85.3%) |
| Transportation | 0 (0.0%) | 0 (0.0%) |
| Material Moving | 0 (0.0%) | 0 (0.0%) |
| Total (Category) | 14 (14.7%) | 81 (85.3%) |
| Total (Overall) | 344 (67.6%) | 165 (32.4%) |
Employment Industries by Sex in Raoul
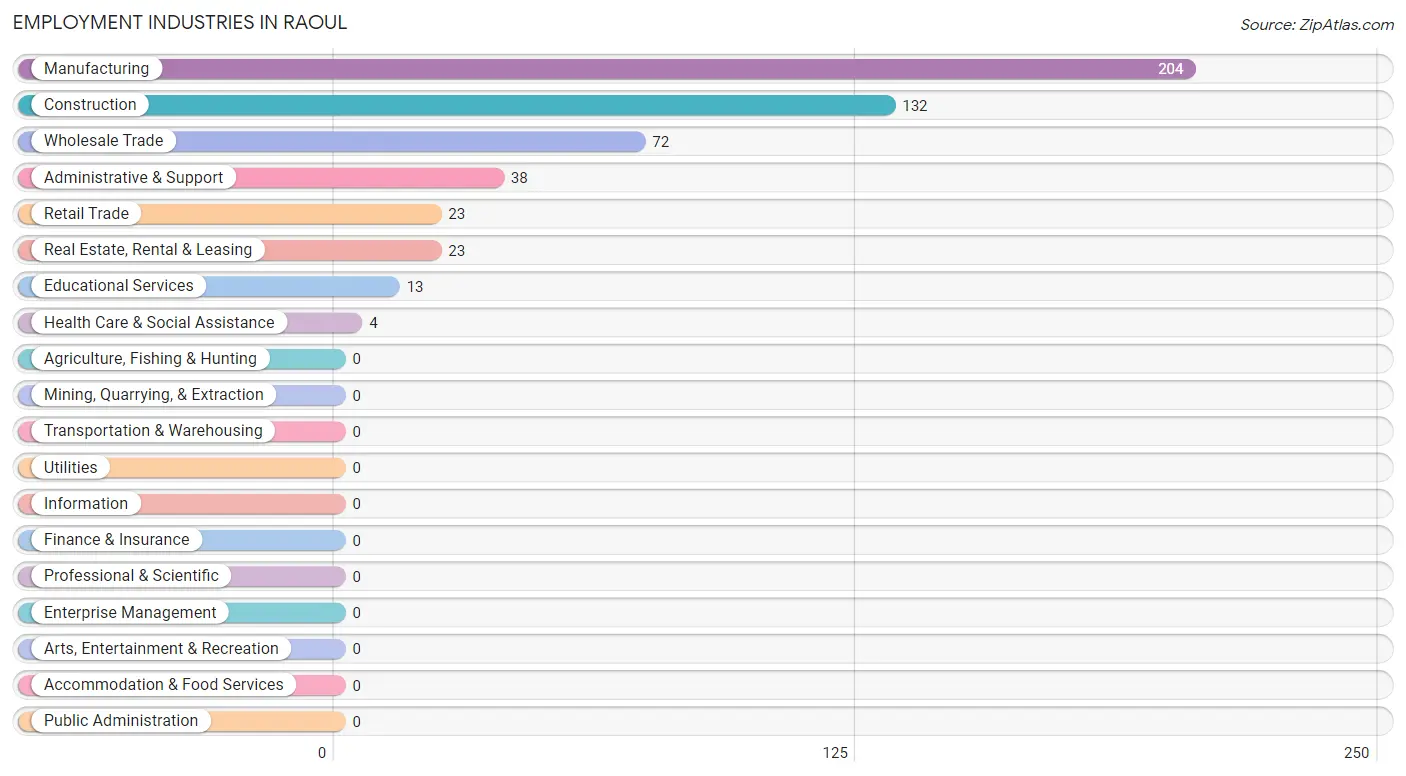
Employment Industries in Raoul
The major employment industries in Raoul include Manufacturing (204 | 40.1%), Construction (132 | 25.9%), Wholesale Trade (72 | 14.1%), Administrative & Support (38 | 7.5%), and Retail Trade (23 | 4.5%).
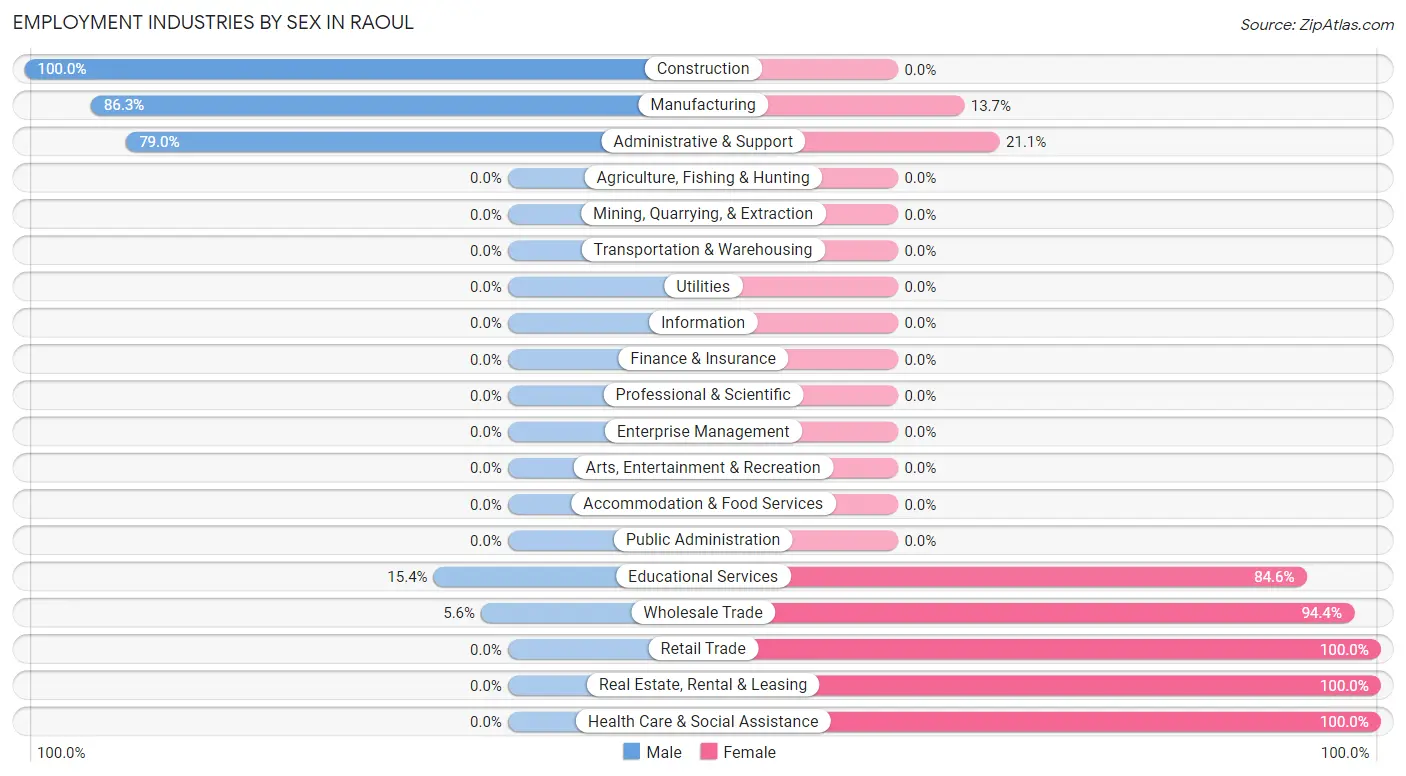
Employment Industries by Sex in Raoul
The Raoul industries that see more men than women are Construction (100.0%), Manufacturing (86.3%), and Administrative & Support (78.9%), whereas the industries that tend to have a higher number of women are Retail Trade (100.0%), Real Estate, Rental & Leasing (100.0%), and Health Care & Social Assistance (100.0%).
| Industry | Male | Female |
| Agriculture, Fishing & Hunting | 0 (0.0%) | 0 (0.0%) |
| Mining, Quarrying, & Extraction | 0 (0.0%) | 0 (0.0%) |
| Construction | 132 (100.0%) | 0 (0.0%) |
| Manufacturing | 176 (86.3%) | 28 (13.7%) |
| Wholesale Trade | 4 (5.6%) | 68 (94.4%) |
| Retail Trade | 0 (0.0%) | 23 (100.0%) |
| Transportation & Warehousing | 0 (0.0%) | 0 (0.0%) |
| Utilities | 0 (0.0%) | 0 (0.0%) |
| Information | 0 (0.0%) | 0 (0.0%) |
| Finance & Insurance | 0 (0.0%) | 0 (0.0%) |
| Real Estate, Rental & Leasing | 0 (0.0%) | 23 (100.0%) |
| Professional & Scientific | 0 (0.0%) | 0 (0.0%) |
| Enterprise Management | 0 (0.0%) | 0 (0.0%) |
| Administrative & Support | 30 (78.9%) | 8 (21.0%) |
| Educational Services | 2 (15.4%) | 11 (84.6%) |
| Health Care & Social Assistance | 0 (0.0%) | 4 (100.0%) |
| Arts, Entertainment & Recreation | 0 (0.0%) | 0 (0.0%) |
| Accommodation & Food Services | 0 (0.0%) | 0 (0.0%) |
| Public Administration | 0 (0.0%) | 0 (0.0%) |
| Total | 344 (67.6%) | 165 (32.4%) |
Education in Raoul
School Enrollment in Raoul
The most common levels of schooling among the 483 students in Raoul are middle school (217 | 44.9%), high school (144 | 29.8%), and college / undergraduate (45 | 9.3%).
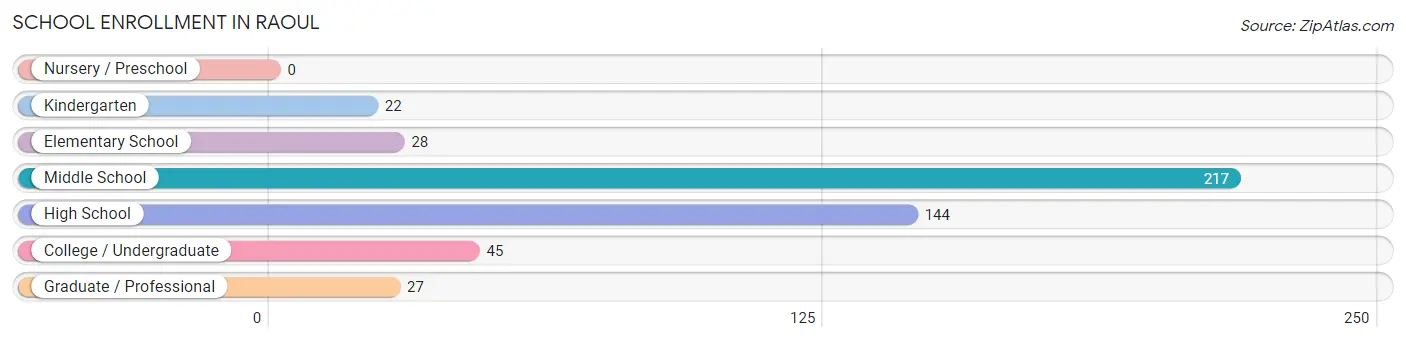
| School Level | # Students | % Students |
| Nursery / Preschool | 0 | 0.0% |
| Kindergarten | 22 | 4.5% |
| Elementary School | 28 | 5.8% |
| Middle School | 217 | 44.9% |
| High School | 144 | 29.8% |
| College / Undergraduate | 45 | 9.3% |
| Graduate / Professional | 27 | 5.6% |
| Total | 483 | 100.0% |
School Enrollment by Age by Funding Source in Raoul
Out of a total of 483 students who are enrolled in schools in Raoul, 49 (10.1%) attend a private institution, while the remaining 434 (89.9%) are enrolled in public schools. The age group of 25 to 34 year olds has the highest likelihood of being enrolled in private schools, with 34 (70.8% in the age bracket) enrolled. Conversely, the age group of 5 to 9 year old has the lowest likelihood of being enrolled in a private school, with 50 (100.0% in the age bracket) attending a public institution.
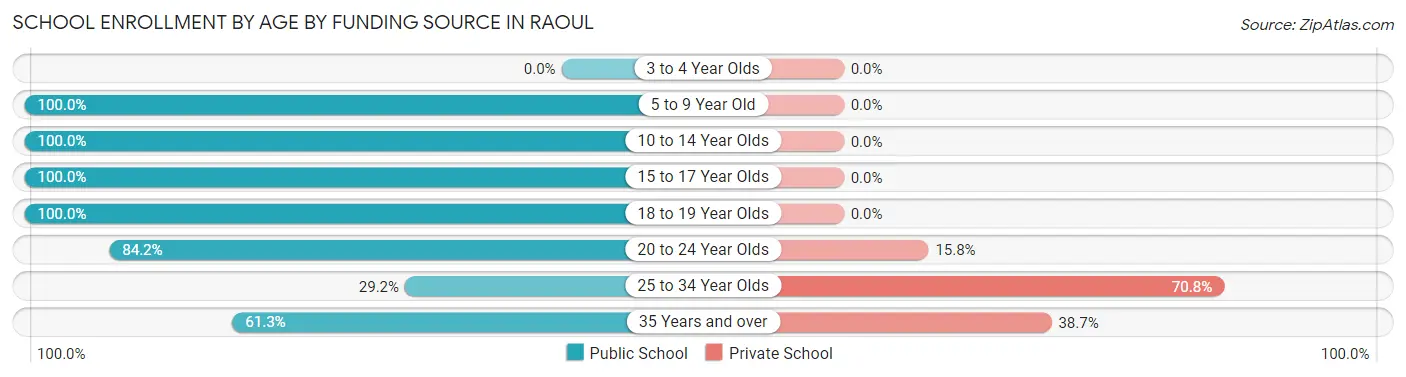
| Age Bracket | Public School | Private School |
| 3 to 4 Year Olds | 0 (0.0%) | 0 (0.0%) |
| 5 to 9 Year Old | 50 (100.0%) | 0 (0.0%) |
| 10 to 14 Year Olds | 272 (100.0%) | 0 (0.0%) |
| 15 to 17 Year Olds | 47 (100.0%) | 0 (0.0%) |
| 18 to 19 Year Olds | 16 (100.0%) | 0 (0.0%) |
| 20 to 24 Year Olds | 16 (84.2%) | 3 (15.8%) |
| 25 to 34 Year Olds | 14 (29.2%) | 34 (70.8%) |
| 35 Years and over | 19 (61.3%) | 12 (38.7%) |
| Total | 434 (89.9%) | 49 (10.1%) |
Educational Attainment by Field of Study in Raoul
Arts & humanities (48 | 44.0%), business (42 | 38.5%), and science & technology (19 | 17.4%) are the most common fields of study among 109 individuals in Raoul who have obtained a bachelor's degree or higher.
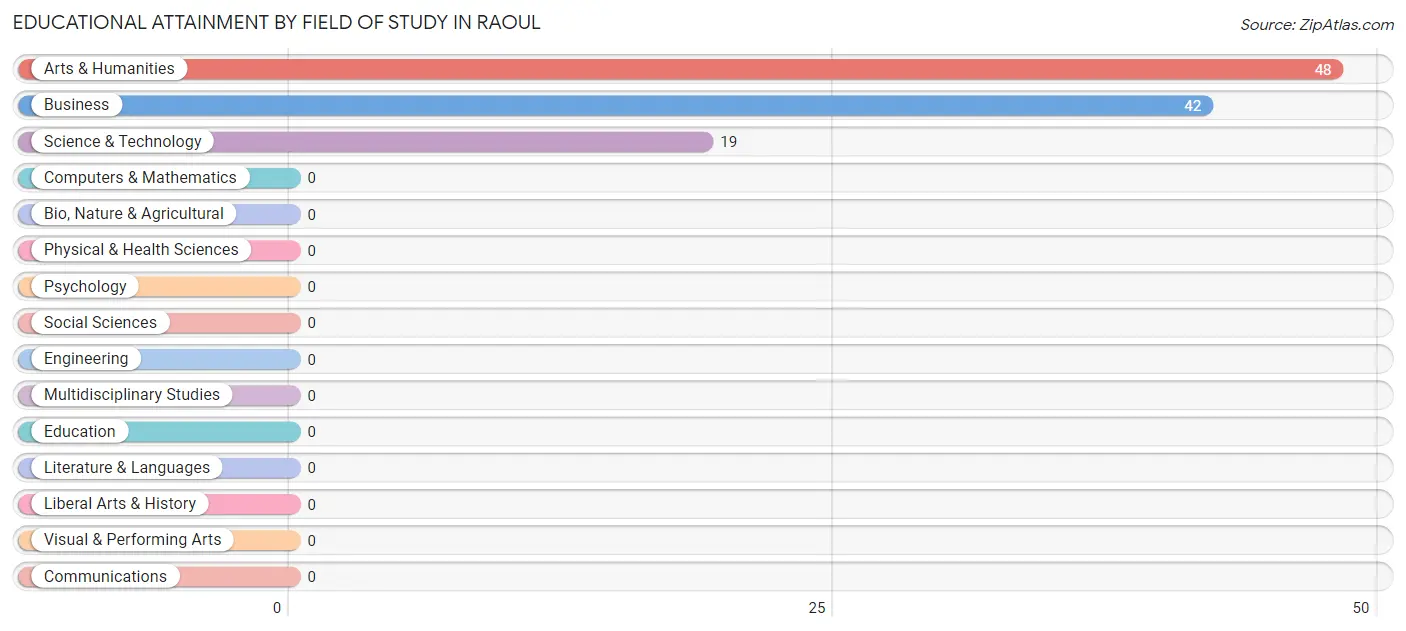
| Field of Study | # Graduates | % Graduates |
| Computers & Mathematics | 0 | 0.0% |
| Bio, Nature & Agricultural | 0 | 0.0% |
| Physical & Health Sciences | 0 | 0.0% |
| Psychology | 0 | 0.0% |
| Social Sciences | 0 | 0.0% |
| Engineering | 0 | 0.0% |
| Multidisciplinary Studies | 0 | 0.0% |
| Science & Technology | 19 | 17.4% |
| Business | 42 | 38.5% |
| Education | 0 | 0.0% |
| Literature & Languages | 0 | 0.0% |
| Liberal Arts & History | 0 | 0.0% |
| Visual & Performing Arts | 0 | 0.0% |
| Communications | 0 | 0.0% |
| Arts & Humanities | 48 | 44.0% |
| Total | 109 | 100.0% |
Transportation & Commute in Raoul
Vehicle Availability by Sex in Raoul
The most prevalent vehicle ownership categories in Raoul are males with 2 vehicles (164, accounting for 52.7%) and females with 2 vehicles (88, making up 99.4%).
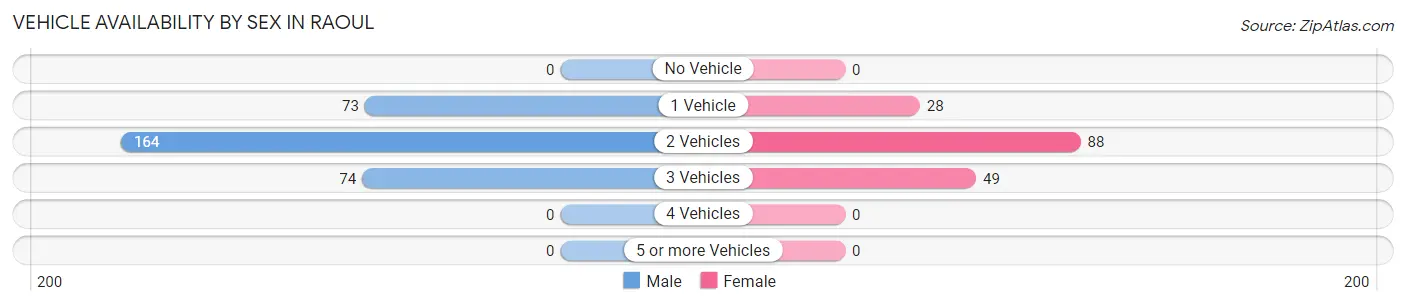
| Vehicles Available | Male | Female |
| No Vehicle | 0 (0.0%) | 0 (0.0%) |
| 1 Vehicle | 73 (23.5%) | 28 (17.0%) |
| 2 Vehicles | 164 (52.7%) | 88 (53.3%) |
| 3 Vehicles | 74 (23.8%) | 49 (29.7%) |
| 4 Vehicles | 0 (0.0%) | 0 (0.0%) |
| 5 or more Vehicles | 0 (0.0%) | 0 (0.0%) |
| Total | 311 (100.0%) | 165 (100.0%) |
Commute Time in Raoul
The most frequently occuring commute durations in Raoul are 40 to 44 minutes (179 commuters, 42.3%), 90 or more minutes (73 commuters, 17.3%), and 25 to 29 minutes (46 commuters, 10.9%).
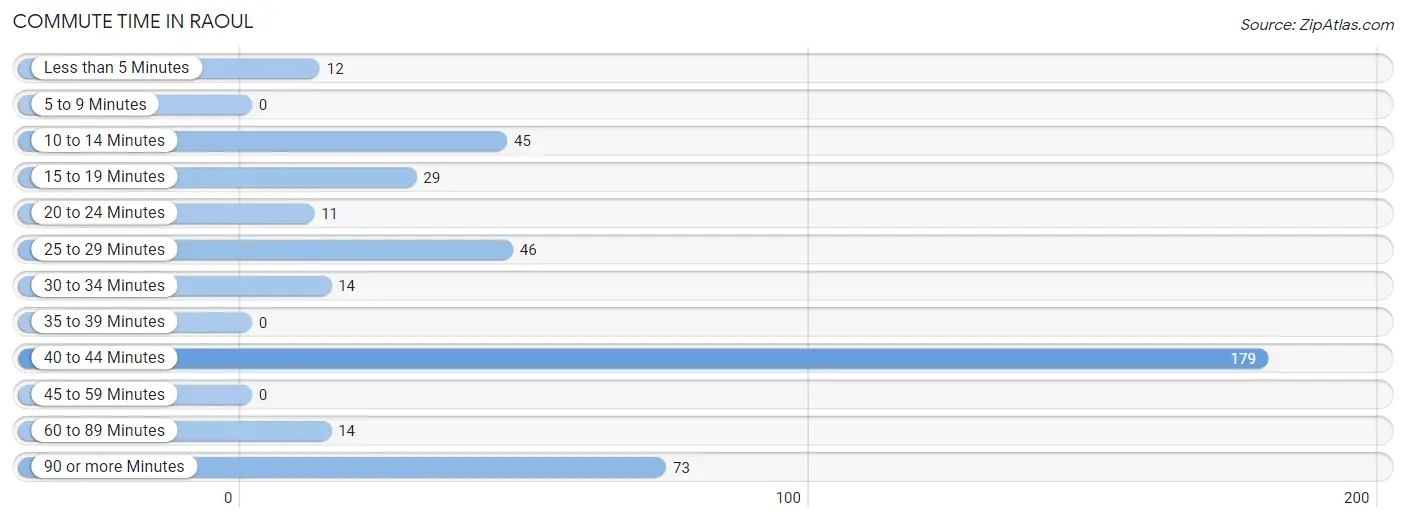
| Commute Time | # Commuters | % Commuters |
| Less than 5 Minutes | 12 | 2.8% |
| 5 to 9 Minutes | 0 | 0.0% |
| 10 to 14 Minutes | 45 | 10.6% |
| 15 to 19 Minutes | 29 | 6.9% |
| 20 to 24 Minutes | 11 | 2.6% |
| 25 to 29 Minutes | 46 | 10.9% |
| 30 to 34 Minutes | 14 | 3.3% |
| 35 to 39 Minutes | 0 | 0.0% |
| 40 to 44 Minutes | 179 | 42.3% |
| 45 to 59 Minutes | 0 | 0.0% |
| 60 to 89 Minutes | 14 | 3.3% |
| 90 or more Minutes | 73 | 17.3% |
Commute Time by Sex in Raoul
The most common commute times in Raoul are 40 to 44 minutes (164 commuters, 52.7%) for males and 10 to 14 minutes (45 commuters, 40.2%) for females.
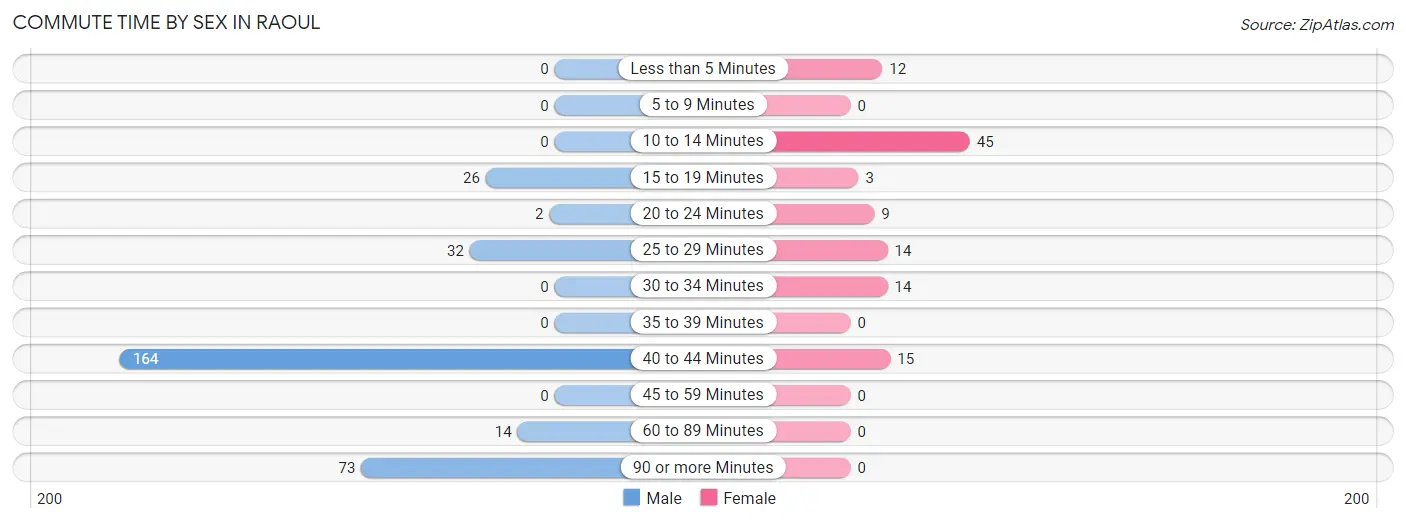
| Commute Time | Male | Female |
| Less than 5 Minutes | 0 (0.0%) | 12 (10.7%) |
| 5 to 9 Minutes | 0 (0.0%) | 0 (0.0%) |
| 10 to 14 Minutes | 0 (0.0%) | 45 (40.2%) |
| 15 to 19 Minutes | 26 (8.4%) | 3 (2.7%) |
| 20 to 24 Minutes | 2 (0.6%) | 9 (8.0%) |
| 25 to 29 Minutes | 32 (10.3%) | 14 (12.5%) |
| 30 to 34 Minutes | 0 (0.0%) | 14 (12.5%) |
| 35 to 39 Minutes | 0 (0.0%) | 0 (0.0%) |
| 40 to 44 Minutes | 164 (52.7%) | 15 (13.4%) |
| 45 to 59 Minutes | 0 (0.0%) | 0 (0.0%) |
| 60 to 89 Minutes | 14 (4.5%) | 0 (0.0%) |
| 90 or more Minutes | 73 (23.5%) | 0 (0.0%) |
Time of Departure to Work by Sex in Raoul
The most frequent times of departure to work in Raoul are 5:00 AM to 5:29 AM (172, 55.3%) for males and 7:00 AM to 7:29 AM (25, 22.3%) for females.
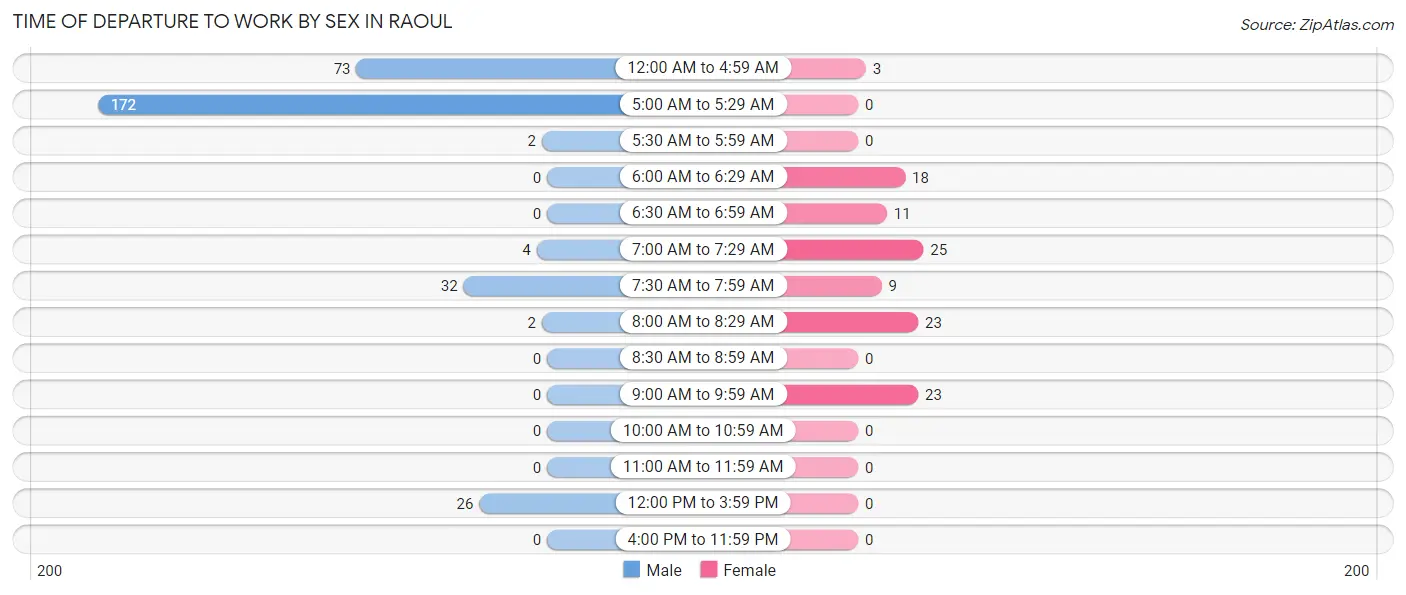
| Time of Departure | Male | Female |
| 12:00 AM to 4:59 AM | 73 (23.5%) | 3 (2.7%) |
| 5:00 AM to 5:29 AM | 172 (55.3%) | 0 (0.0%) |
| 5:30 AM to 5:59 AM | 2 (0.6%) | 0 (0.0%) |
| 6:00 AM to 6:29 AM | 0 (0.0%) | 18 (16.1%) |
| 6:30 AM to 6:59 AM | 0 (0.0%) | 11 (9.8%) |
| 7:00 AM to 7:29 AM | 4 (1.3%) | 25 (22.3%) |
| 7:30 AM to 7:59 AM | 32 (10.3%) | 9 (8.0%) |
| 8:00 AM to 8:29 AM | 2 (0.6%) | 23 (20.5%) |
| 8:30 AM to 8:59 AM | 0 (0.0%) | 0 (0.0%) |
| 9:00 AM to 9:59 AM | 0 (0.0%) | 23 (20.5%) |
| 10:00 AM to 10:59 AM | 0 (0.0%) | 0 (0.0%) |
| 11:00 AM to 11:59 AM | 0 (0.0%) | 0 (0.0%) |
| 12:00 PM to 3:59 PM | 26 (8.4%) | 0 (0.0%) |
| 4:00 PM to 11:59 PM | 0 (0.0%) | 0 (0.0%) |
| Total | 311 (100.0%) | 112 (100.0%) |
Housing Occupancy in Raoul
Occupancy by Ownership in Raoul
Of the total 313 dwellings in Raoul, owner-occupied units account for 205 (65.5%), while renter-occupied units make up 108 (34.5%).
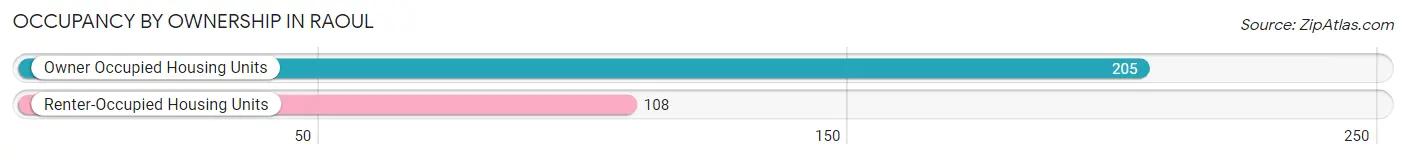
| Occupancy | # Housing Units | % Housing Units |
| Owner Occupied Housing Units | 205 | 65.5% |
| Renter-Occupied Housing Units | 108 | 34.5% |
| Total Occupied Housing Units | 313 | 100.0% |
Occupancy by Household Size in Raoul
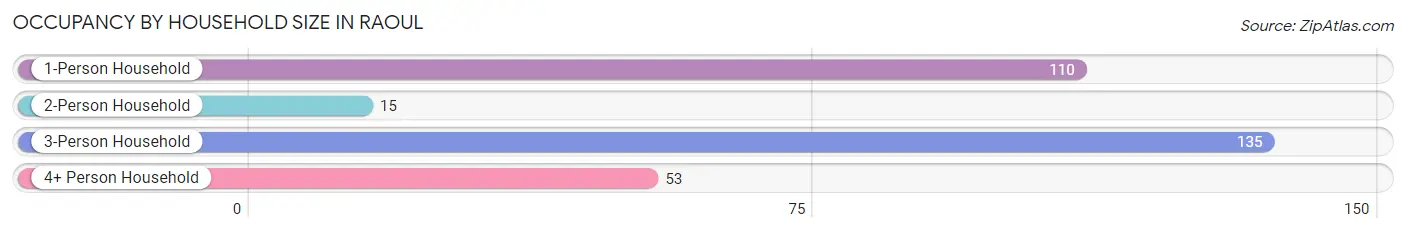
| Household Size | # Housing Units | % Housing Units |
| 1-Person Household | 110 | 35.1% |
| 2-Person Household | 15 | 4.8% |
| 3-Person Household | 135 | 43.1% |
| 4+ Person Household | 53 | 16.9% |
| Total Housing Units | 313 | 100.0% |
Occupancy by Ownership by Household Size in Raoul
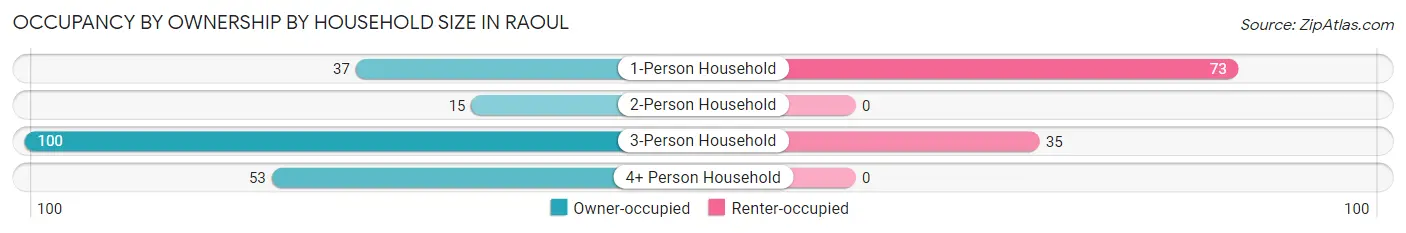
| Household Size | Owner-occupied | Renter-occupied |
| 1-Person Household | 37 (33.6%) | 73 (66.4%) |
| 2-Person Household | 15 (100.0%) | 0 (0.0%) |
| 3-Person Household | 100 (74.1%) | 35 (25.9%) |
| 4+ Person Household | 53 (100.0%) | 0 (0.0%) |
| Total Housing Units | 205 (65.5%) | 108 (34.5%) |
Occupancy by Educational Attainment in Raoul
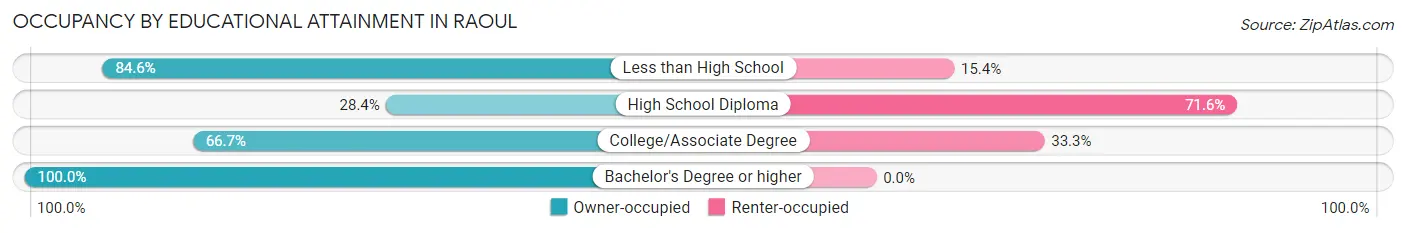
| Household Size | Owner-occupied | Renter-occupied |
| Less than High School | 126 (84.6%) | 23 (15.4%) |
| High School Diploma | 29 (28.4%) | 73 (71.6%) |
| College/Associate Degree | 24 (66.7%) | 12 (33.3%) |
| Bachelor's Degree or higher | 26 (100.0%) | 0 (0.0%) |
Occupancy by Age of Householder in Raoul
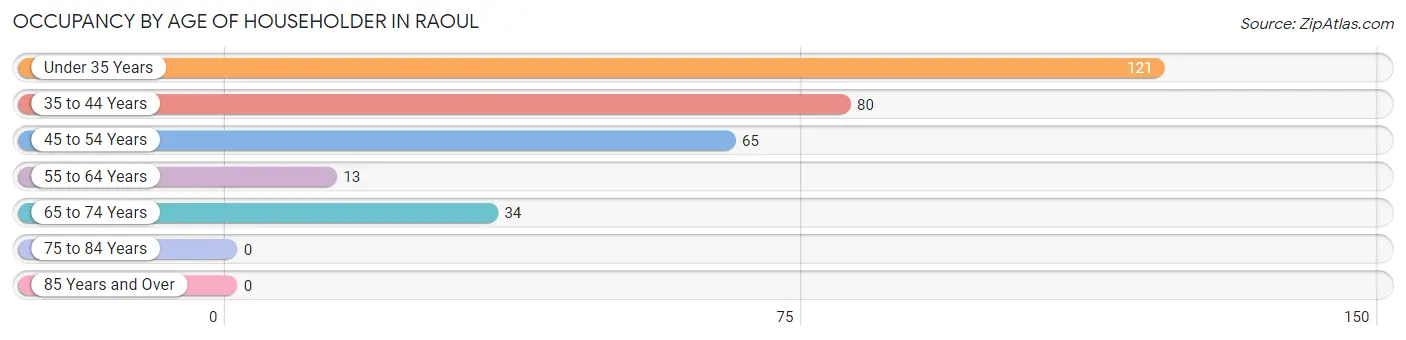
| Age Bracket | # Households | % Households |
| Under 35 Years | 121 | 38.7% |
| 35 to 44 Years | 80 | 25.6% |
| 45 to 54 Years | 65 | 20.8% |
| 55 to 64 Years | 13 | 4.2% |
| 65 to 74 Years | 34 | 10.9% |
| 75 to 84 Years | 0 | 0.0% |
| 85 Years and Over | 0 | 0.0% |
| Total | 313 | 100.0% |
Housing Finances in Raoul
Median Income by Occupancy in Raoul
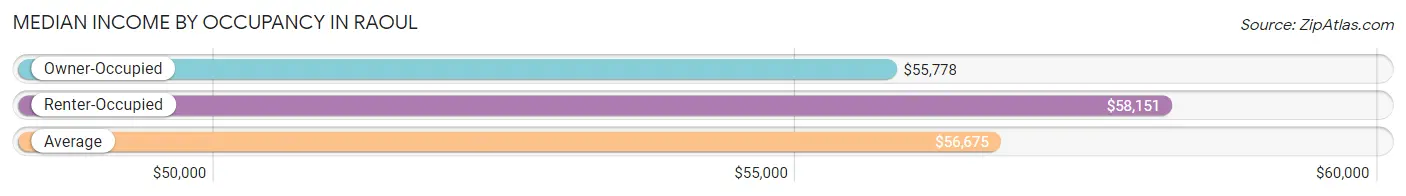
| Occupancy Type | # Households | Median Income |
| Owner-Occupied | 205 (65.5%) | $55,778 |
| Renter-Occupied | 108 (34.5%) | $58,151 |
| Average | 313 (100.0%) | $56,675 |
Occupancy by Householder Income Bracket in Raoul
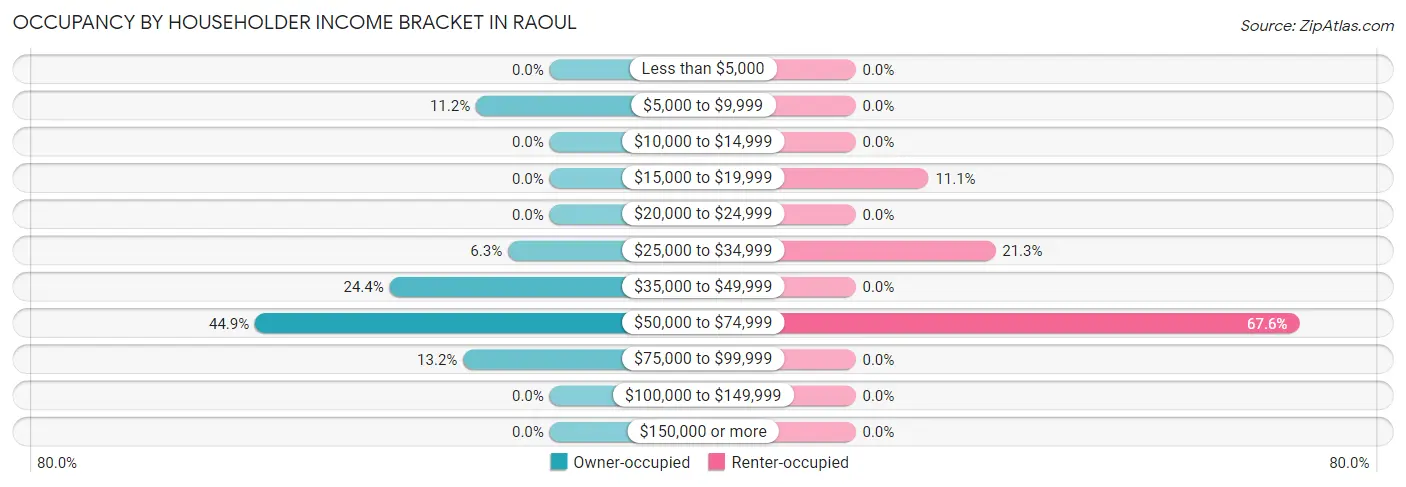
| Income Bracket | Owner-occupied | Renter-occupied |
| Less than $5,000 | 0 (0.0%) | 0 (0.0%) |
| $5,000 to $9,999 | 23 (11.2%) | 0 (0.0%) |
| $10,000 to $14,999 | 0 (0.0%) | 0 (0.0%) |
| $15,000 to $19,999 | 0 (0.0%) | 12 (11.1%) |
| $20,000 to $24,999 | 0 (0.0%) | 0 (0.0%) |
| $25,000 to $34,999 | 13 (6.3%) | 23 (21.3%) |
| $35,000 to $49,999 | 50 (24.4%) | 0 (0.0%) |
| $50,000 to $74,999 | 92 (44.9%) | 73 (67.6%) |
| $75,000 to $99,999 | 27 (13.2%) | 0 (0.0%) |
| $100,000 to $149,999 | 0 (0.0%) | 0 (0.0%) |
| $150,000 or more | 0 (0.0%) | 0 (0.0%) |
| Total | 205 (100.0%) | 108 (100.0%) |
Monthly Housing Cost Tiers in Raoul
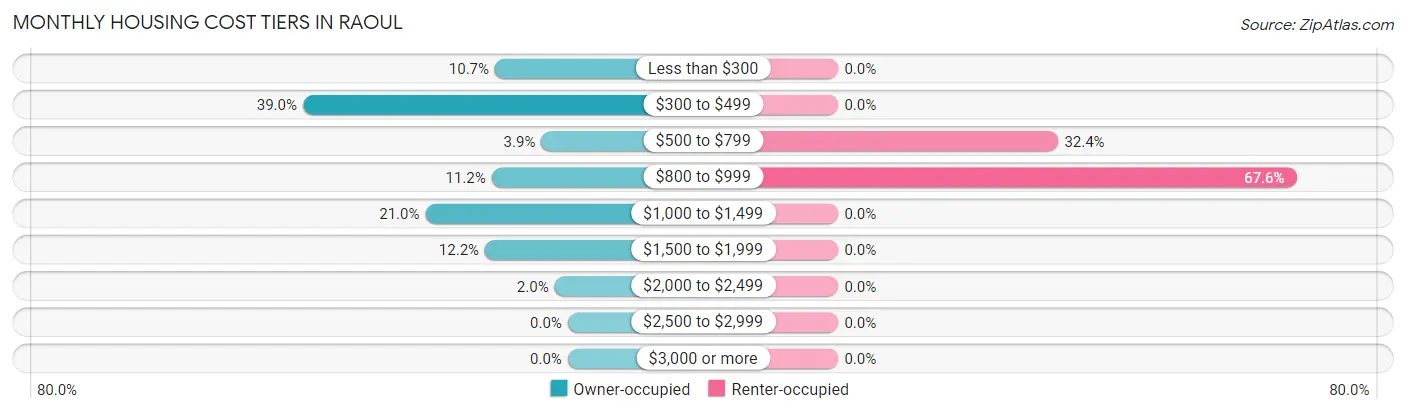
| Monthly Cost | Owner-occupied | Renter-occupied |
| Less than $300 | 22 (10.7%) | 0 (0.0%) |
| $300 to $499 | 80 (39.0%) | 0 (0.0%) |
| $500 to $799 | 8 (3.9%) | 35 (32.4%) |
| $800 to $999 | 23 (11.2%) | 73 (67.6%) |
| $1,000 to $1,499 | 43 (21.0%) | 0 (0.0%) |
| $1,500 to $1,999 | 25 (12.2%) | 0 (0.0%) |
| $2,000 to $2,499 | 4 (1.9%) | 0 (0.0%) |
| $2,500 to $2,999 | 0 (0.0%) | 0 (0.0%) |
| $3,000 or more | 0 (0.0%) | 0 (0.0%) |
| Total | 205 (100.0%) | 108 (100.0%) |
Physical Housing Characteristics in Raoul
Housing Structures in Raoul
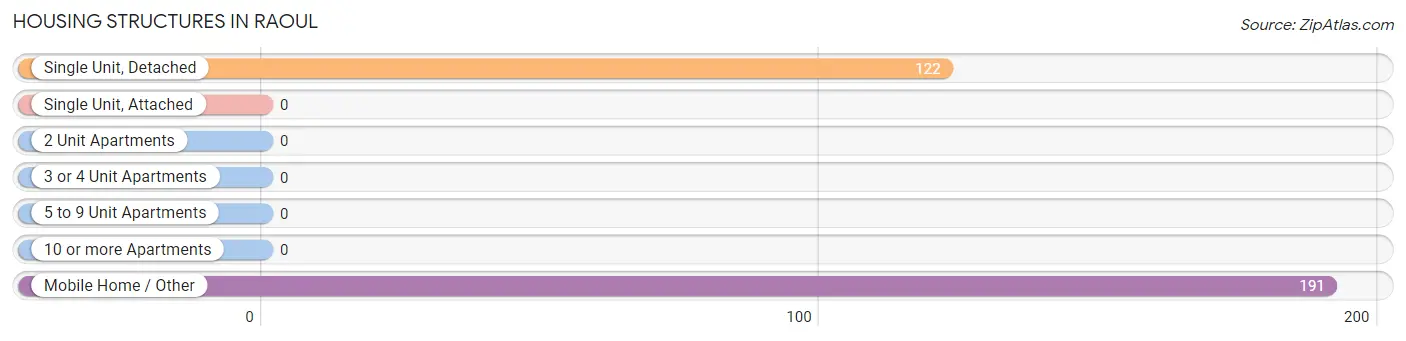
| Structure Type | # Housing Units | % Housing Units |
| Single Unit, Detached | 122 | 39.0% |
| Single Unit, Attached | 0 | 0.0% |
| 2 Unit Apartments | 0 | 0.0% |
| 3 or 4 Unit Apartments | 0 | 0.0% |
| 5 to 9 Unit Apartments | 0 | 0.0% |
| 10 or more Apartments | 0 | 0.0% |
| Mobile Home / Other | 191 | 61.0% |
| Total | 313 | 100.0% |
Housing Structures by Occupancy in Raoul
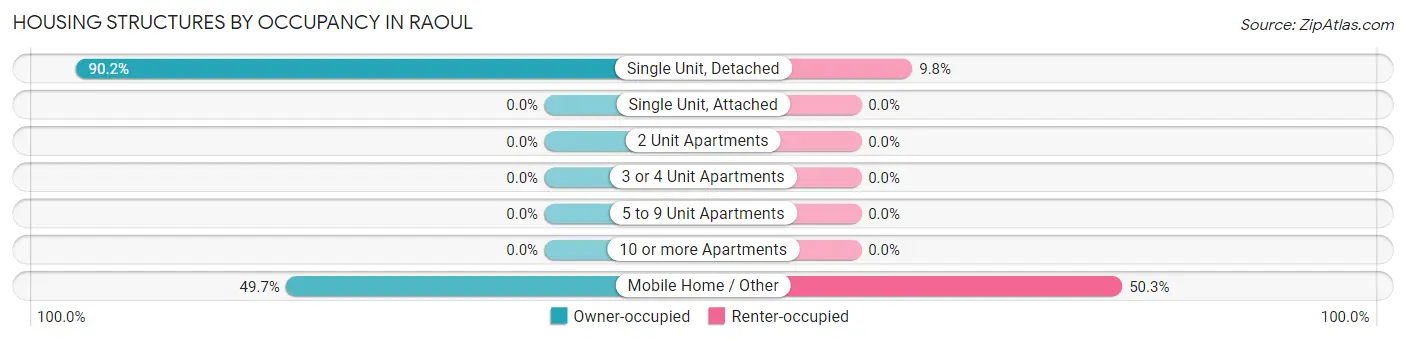
| Structure Type | Owner-occupied | Renter-occupied |
| Single Unit, Detached | 110 (90.2%) | 12 (9.8%) |
| Single Unit, Attached | 0 (0.0%) | 0 (0.0%) |
| 2 Unit Apartments | 0 (0.0%) | 0 (0.0%) |
| 3 or 4 Unit Apartments | 0 (0.0%) | 0 (0.0%) |
| 5 to 9 Unit Apartments | 0 (0.0%) | 0 (0.0%) |
| 10 or more Apartments | 0 (0.0%) | 0 (0.0%) |
| Mobile Home / Other | 95 (49.7%) | 96 (50.3%) |
| Total | 205 (65.5%) | 108 (34.5%) |
Housing Structures by Number of Rooms in Raoul
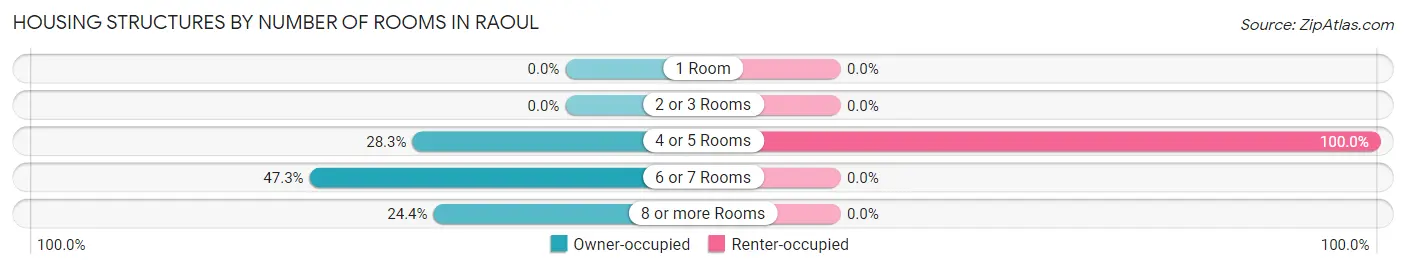
| Number of Rooms | Owner-occupied | Renter-occupied |
| 1 Room | 0 (0.0%) | 0 (0.0%) |
| 2 or 3 Rooms | 0 (0.0%) | 0 (0.0%) |
| 4 or 5 Rooms | 58 (28.3%) | 108 (100.0%) |
| 6 or 7 Rooms | 97 (47.3%) | 0 (0.0%) |
| 8 or more Rooms | 50 (24.4%) | 0 (0.0%) |
| Total | 205 (100.0%) | 108 (100.0%) |
Housing Structure by Heating Type in Raoul
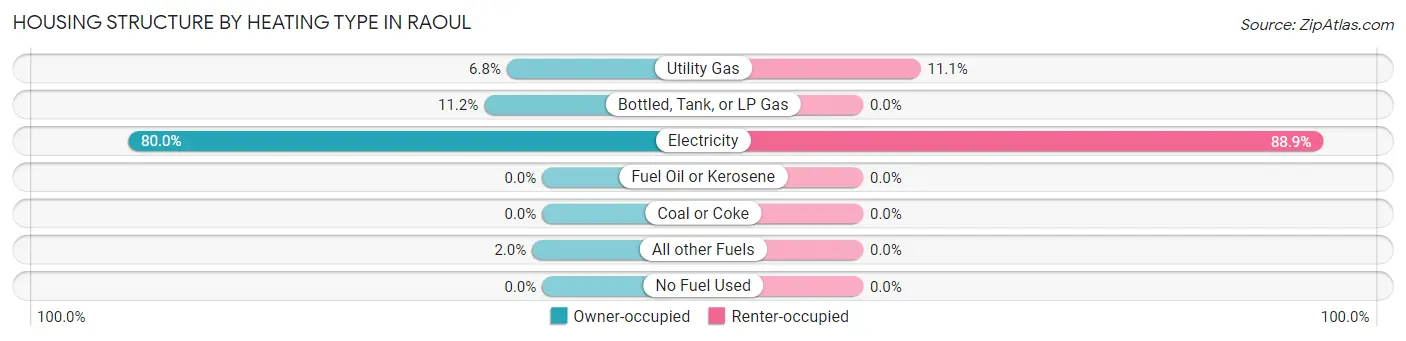
| Heating Type | Owner-occupied | Renter-occupied |
| Utility Gas | 14 (6.8%) | 12 (11.1%) |
| Bottled, Tank, or LP Gas | 23 (11.2%) | 0 (0.0%) |
| Electricity | 164 (80.0%) | 96 (88.9%) |
| Fuel Oil or Kerosene | 0 (0.0%) | 0 (0.0%) |
| Coal or Coke | 0 (0.0%) | 0 (0.0%) |
| All other Fuels | 4 (1.9%) | 0 (0.0%) |
| No Fuel Used | 0 (0.0%) | 0 (0.0%) |
| Total | 205 (100.0%) | 108 (100.0%) |
Household Vehicle Usage in Raoul
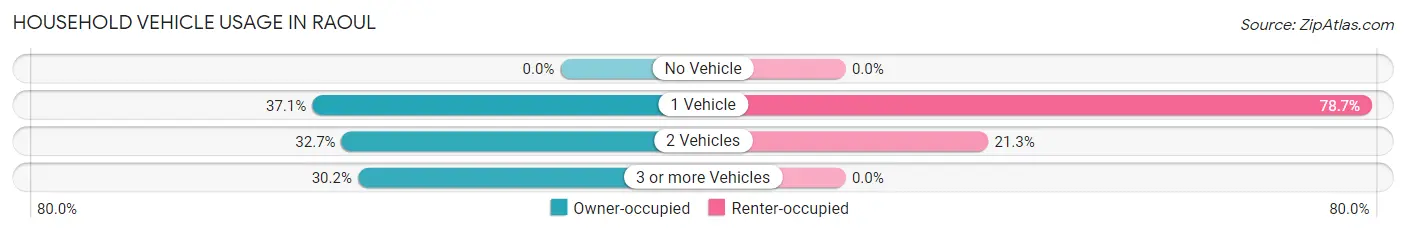
| Vehicles per Household | Owner-occupied | Renter-occupied |
| No Vehicle | 0 (0.0%) | 0 (0.0%) |
| 1 Vehicle | 76 (37.1%) | 85 (78.7%) |
| 2 Vehicles | 67 (32.7%) | 23 (21.3%) |
| 3 or more Vehicles | 62 (30.2%) | 0 (0.0%) |
| Total | 205 (100.0%) | 108 (100.0%) |
Real Estate & Mortgages in Raoul
Real Estate and Mortgage Overview in Raoul
| Characteristic | Without Mortgage | With Mortgage |
| Housing Units | 102 | 103 |
| Median Property Value | - | - |
| Median Household Income | $55,613 | $0 |
| Monthly Housing Costs | $318 | $0 |
| Real Estate Taxes | $808 | $0 |
Property Value by Mortgage Status in Raoul
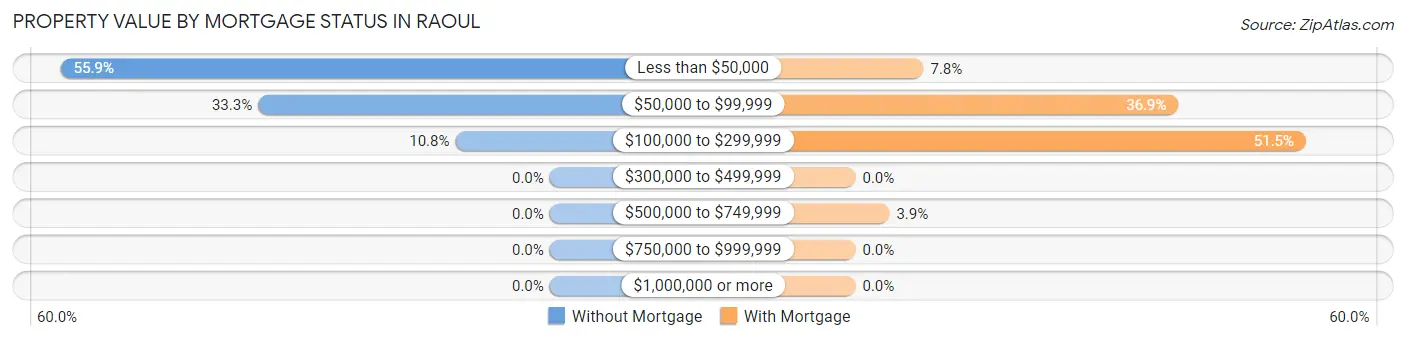
| Property Value | Without Mortgage | With Mortgage |
| Less than $50,000 | 57 (55.9%) | 8 (7.8%) |
| $50,000 to $99,999 | 34 (33.3%) | 38 (36.9%) |
| $100,000 to $299,999 | 11 (10.8%) | 53 (51.5%) |
| $300,000 to $499,999 | 0 (0.0%) | 0 (0.0%) |
| $500,000 to $749,999 | 0 (0.0%) | 4 (3.9%) |
| $750,000 to $999,999 | 0 (0.0%) | 0 (0.0%) |
| $1,000,000 or more | 0 (0.0%) | 0 (0.0%) |
| Total | 102 (100.0%) | 103 (100.0%) |
Household Income by Mortgage Status in Raoul
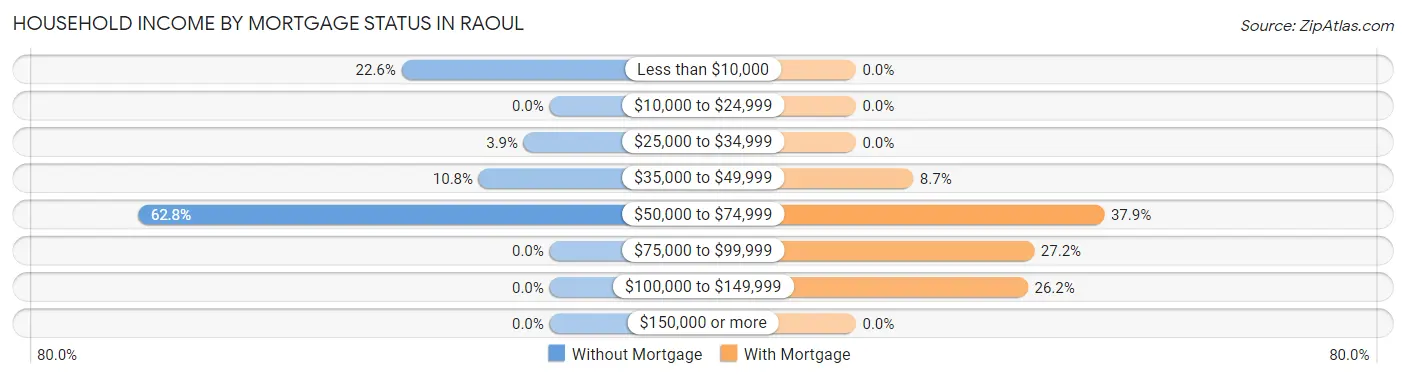
| Household Income | Without Mortgage | With Mortgage |
| Less than $10,000 | 23 (22.6%) | 0 (0.0%) |
| $10,000 to $24,999 | 0 (0.0%) | 0 (0.0%) |
| $25,000 to $34,999 | 4 (3.9%) | 0 (0.0%) |
| $35,000 to $49,999 | 11 (10.8%) | 9 (8.7%) |
| $50,000 to $74,999 | 64 (62.7%) | 39 (37.9%) |
| $75,000 to $99,999 | 0 (0.0%) | 28 (27.2%) |
| $100,000 to $149,999 | 0 (0.0%) | 27 (26.2%) |
| $150,000 or more | 0 (0.0%) | 0 (0.0%) |
| Total | 102 (100.0%) | 103 (100.0%) |
Property Value to Household Income Ratio in Raoul
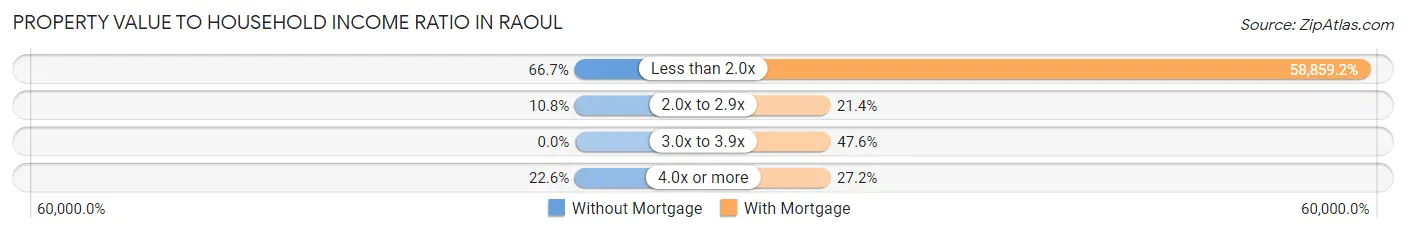
| Value-to-Income Ratio | Without Mortgage | With Mortgage |
| Less than 2.0x | 68 (66.7%) | 60,625 (58,859.2%) |
| 2.0x to 2.9x | 11 (10.8%) | 22 (21.4%) |
| 3.0x to 3.9x | 0 (0.0%) | 49 (47.6%) |
| 4.0x or more | 23 (22.6%) | 28 (27.2%) |
| Total | 102 (100.0%) | 103 (100.0%) |
Real Estate Taxes by Mortgage Status in Raoul
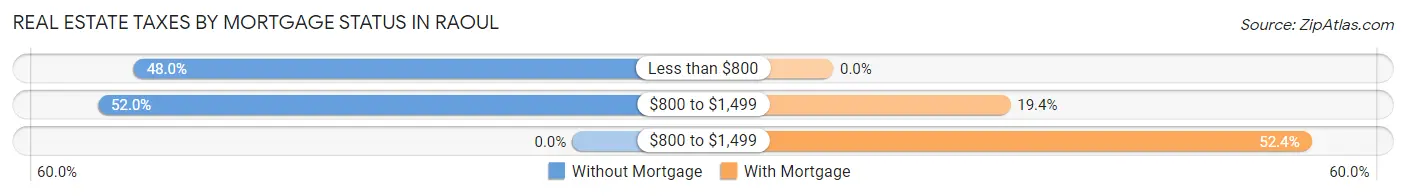
| Property Taxes | Without Mortgage | With Mortgage |
| Less than $800 | 49 (48.0%) | 0 (0.0%) |
| $800 to $1,499 | 53 (52.0%) | 20 (19.4%) |
| $800 to $1,499 | 0 (0.0%) | 54 (52.4%) |
| Total | 102 (100.0%) | 103 (100.0%) |
Health & Disability in Raoul
Health Insurance Coverage by Age in Raoul
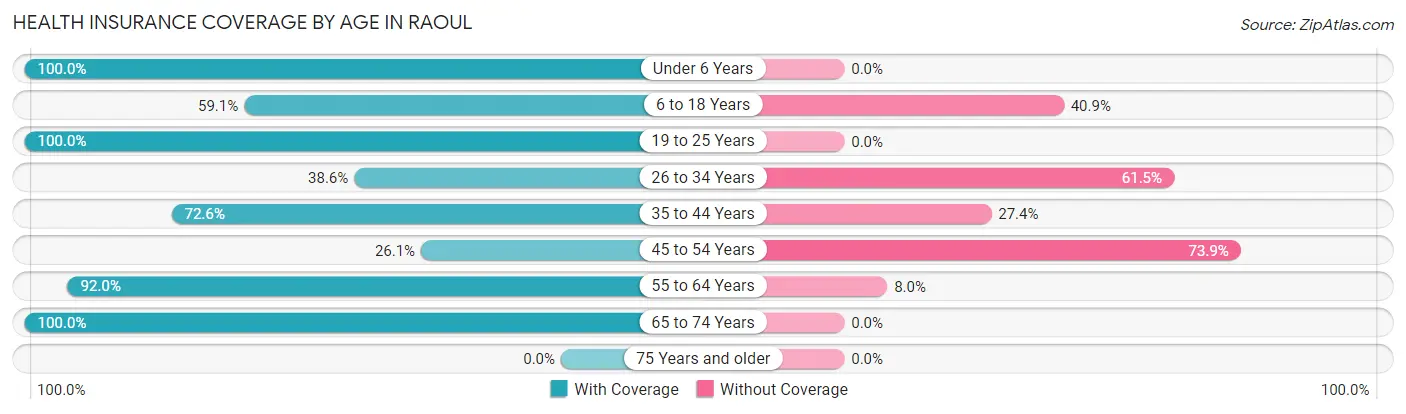
| Age Bracket | With Coverage | Without Coverage |
| Under 6 Years | 34 (100.0%) | 0 (0.0%) |
| 6 to 18 Years | 218 (59.1%) | 151 (40.9%) |
| 19 to 25 Years | 9 (100.0%) | 0 (0.0%) |
| 26 to 34 Years | 69 (38.6%) | 110 (61.5%) |
| 35 to 44 Years | 98 (72.6%) | 37 (27.4%) |
| 45 to 54 Years | 60 (26.1%) | 170 (73.9%) |
| 55 to 64 Years | 23 (92.0%) | 2 (8.0%) |
| 65 to 74 Years | 117 (100.0%) | 0 (0.0%) |
| 75 Years and older | 0 (0.0%) | 0 (0.0%) |
| Total | 628 (57.2%) | 470 (42.8%) |
Health Insurance Coverage by Citizenship Status in Raoul
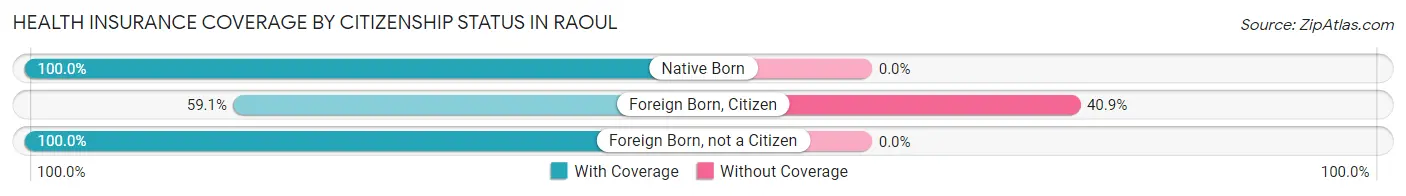
| Citizenship Status | With Coverage | Without Coverage |
| Native Born | 34 (100.0%) | 0 (0.0%) |
| Foreign Born, Citizen | 218 (59.1%) | 151 (40.9%) |
| Foreign Born, not a Citizen | 9 (100.0%) | 0 (0.0%) |
Health Insurance Coverage by Household Income in Raoul
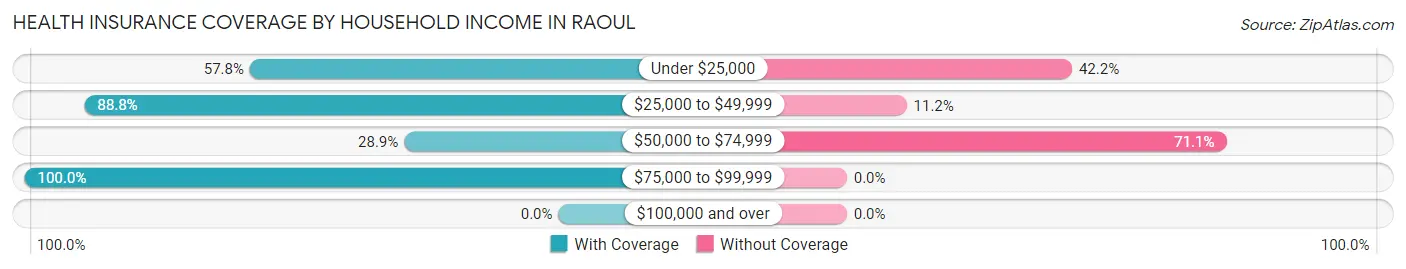
| Household Income | With Coverage | Without Coverage |
| Under $25,000 | 37 (57.8%) | 27 (42.2%) |
| $25,000 to $49,999 | 293 (88.8%) | 37 (11.2%) |
| $50,000 to $74,999 | 165 (28.9%) | 406 (71.1%) |
| $75,000 to $99,999 | 133 (100.0%) | 0 (0.0%) |
| $100,000 and over | 0 (0.0%) | 0 (0.0%) |
Public vs Private Health Insurance Coverage by Age in Raoul
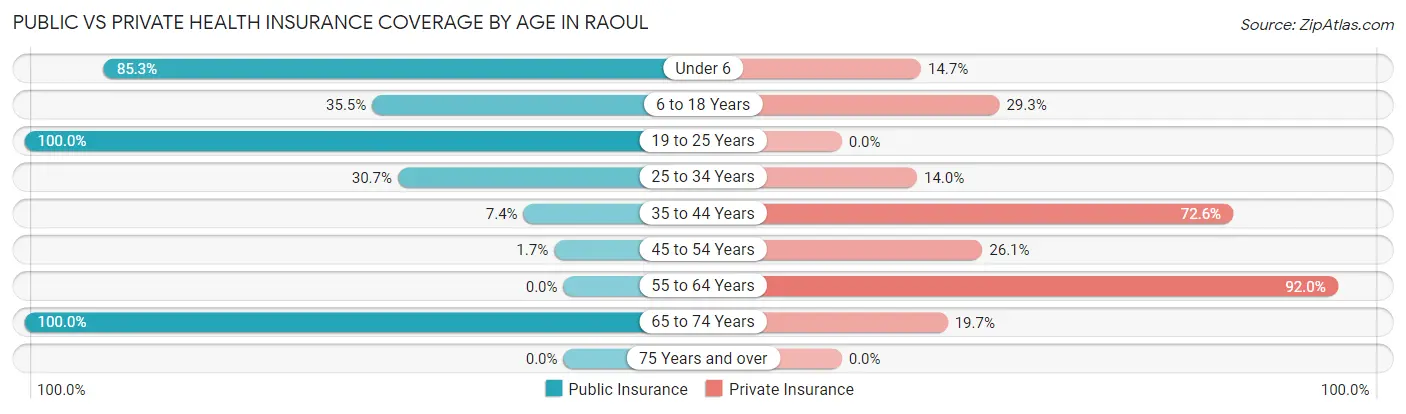
| Age Bracket | Public Insurance | Private Insurance |
| Under 6 | 29 (85.3%) | 5 (14.7%) |
| 6 to 18 Years | 131 (35.5%) | 108 (29.3%) |
| 19 to 25 Years | 9 (100.0%) | 0 (0.0%) |
| 25 to 34 Years | 55 (30.7%) | 25 (14.0%) |
| 35 to 44 Years | 10 (7.4%) | 98 (72.6%) |
| 45 to 54 Years | 4 (1.7%) | 60 (26.1%) |
| 55 to 64 Years | 0 (0.0%) | 23 (92.0%) |
| 65 to 74 Years | 117 (100.0%) | 23 (19.7%) |
| 75 Years and over | 0 (0.0%) | 0 (0.0%) |
| Total | 355 (32.3%) | 342 (31.1%) |
Disability Status by Sex by Age in Raoul
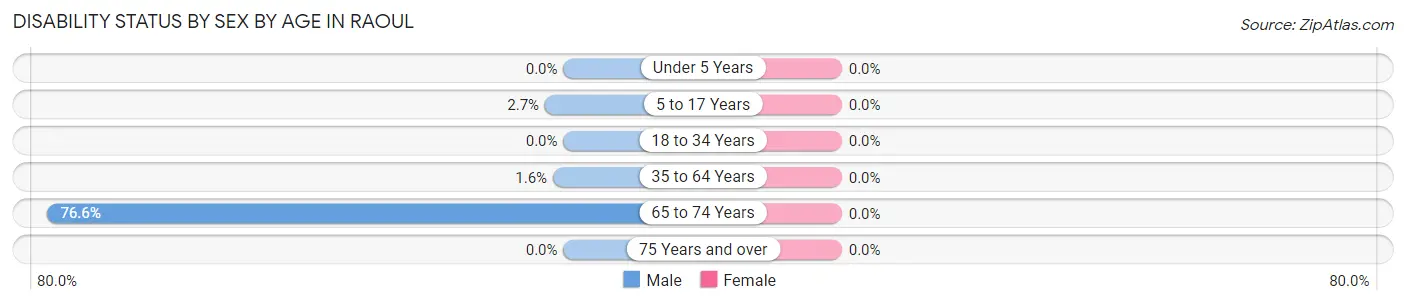
| Age Bracket | Male | Female |
| Under 5 Years | 0 (0.0%) | 0 (0.0%) |
| 5 to 17 Years | 4 (2.7%) | 0 (0.0%) |
| 18 to 34 Years | 0 (0.0%) | 0 (0.0%) |
| 35 to 64 Years | 4 (1.5%) | 0 (0.0%) |
| 65 to 74 Years | 36 (76.6%) | 0 (0.0%) |
| 75 Years and over | 0 (0.0%) | 0 (0.0%) |
Disability Class by Sex by Age in Raoul
Disability Class: Hearing Difficulty
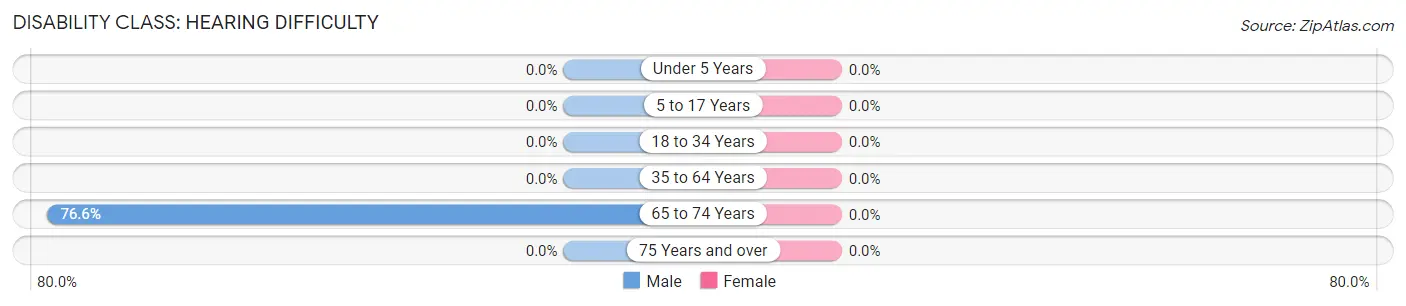
| Age Bracket | Male | Female |
| Under 5 Years | 0 (0.0%) | 0 (0.0%) |
| 5 to 17 Years | 0 (0.0%) | 0 (0.0%) |
| 18 to 34 Years | 0 (0.0%) | 0 (0.0%) |
| 35 to 64 Years | 0 (0.0%) | 0 (0.0%) |
| 65 to 74 Years | 36 (76.6%) | 0 (0.0%) |
| 75 Years and over | 0 (0.0%) | 0 (0.0%) |
Disability Class: Vision Difficulty
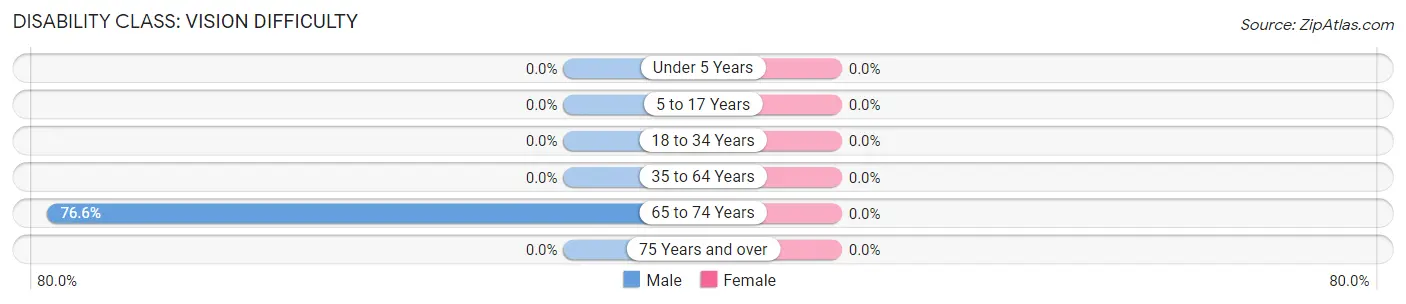
| Age Bracket | Male | Female |
| Under 5 Years | 0 (0.0%) | 0 (0.0%) |
| 5 to 17 Years | 0 (0.0%) | 0 (0.0%) |
| 18 to 34 Years | 0 (0.0%) | 0 (0.0%) |
| 35 to 64 Years | 0 (0.0%) | 0 (0.0%) |
| 65 to 74 Years | 36 (76.6%) | 0 (0.0%) |
| 75 Years and over | 0 (0.0%) | 0 (0.0%) |
Disability Class: Cognitive Difficulty
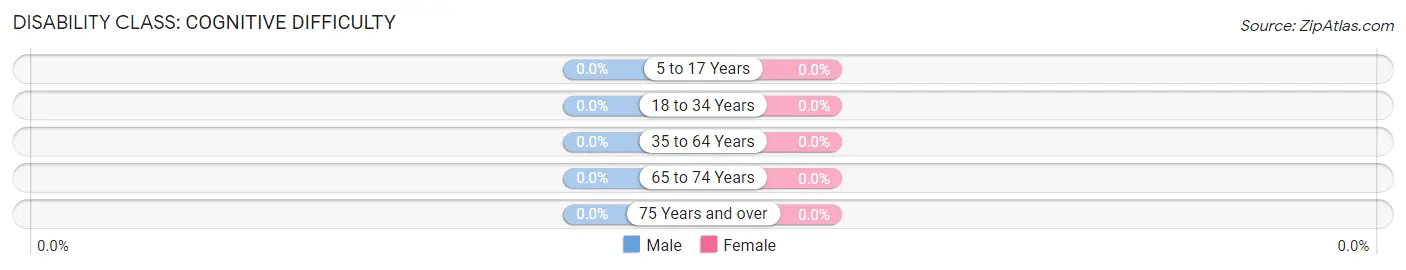
| Age Bracket | Male | Female |
| 5 to 17 Years | 0 (0.0%) | 0 (0.0%) |
| 18 to 34 Years | 0 (0.0%) | 0 (0.0%) |
| 35 to 64 Years | 0 (0.0%) | 0 (0.0%) |
| 65 to 74 Years | 0 (0.0%) | 0 (0.0%) |
| 75 Years and over | 0 (0.0%) | 0 (0.0%) |
Disability Class: Ambulatory Difficulty
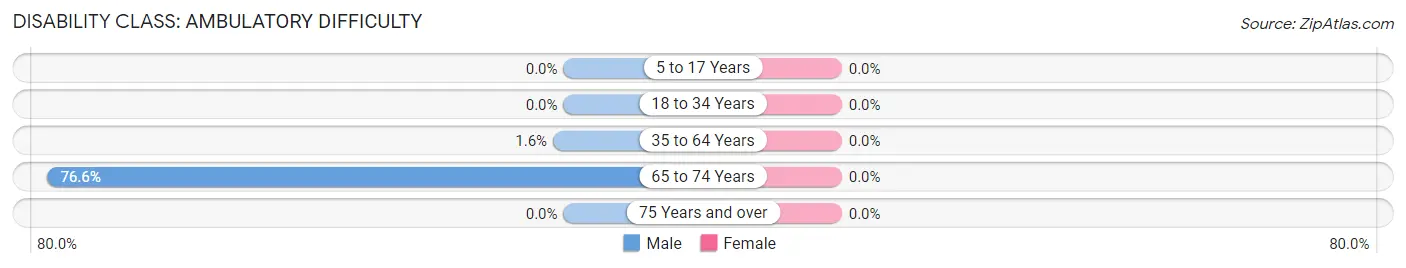
| Age Bracket | Male | Female |
| 5 to 17 Years | 0 (0.0%) | 0 (0.0%) |
| 18 to 34 Years | 0 (0.0%) | 0 (0.0%) |
| 35 to 64 Years | 4 (1.5%) | 0 (0.0%) |
| 65 to 74 Years | 36 (76.6%) | 0 (0.0%) |
| 75 Years and over | 0 (0.0%) | 0 (0.0%) |
Disability Class: Self-Care Difficulty
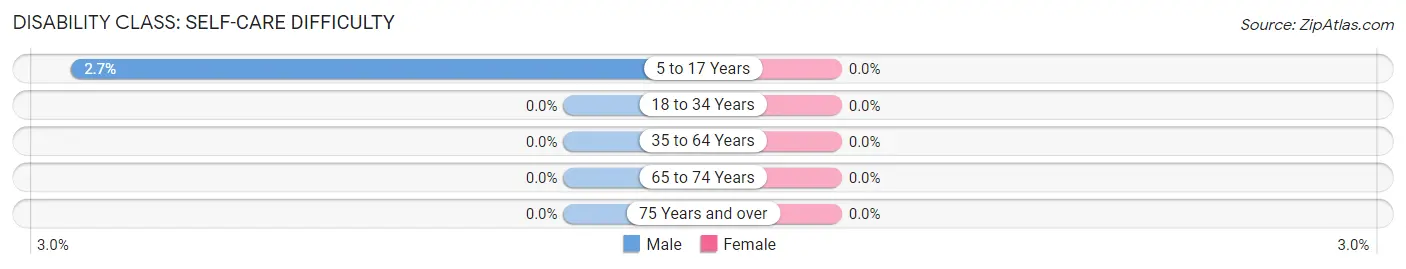
| Age Bracket | Male | Female |
| 5 to 17 Years | 4 (2.7%) | 0 (0.0%) |
| 18 to 34 Years | 0 (0.0%) | 0 (0.0%) |
| 35 to 64 Years | 0 (0.0%) | 0 (0.0%) |
| 65 to 74 Years | 0 (0.0%) | 0 (0.0%) |
| 75 Years and over | 0 (0.0%) | 0 (0.0%) |
Technology Access in Raoul
Computing Device Access in Raoul
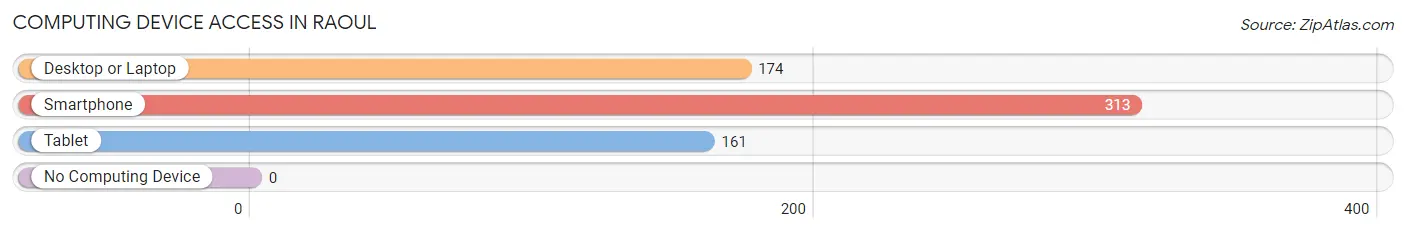
| Device Type | # Households | % Households |
| Desktop or Laptop | 174 | 55.6% |
| Smartphone | 313 | 100.0% |
| Tablet | 161 | 51.4% |
| No Computing Device | 0 | 0.0% |
| Total | 313 | 100.0% |
Internet Access in Raoul
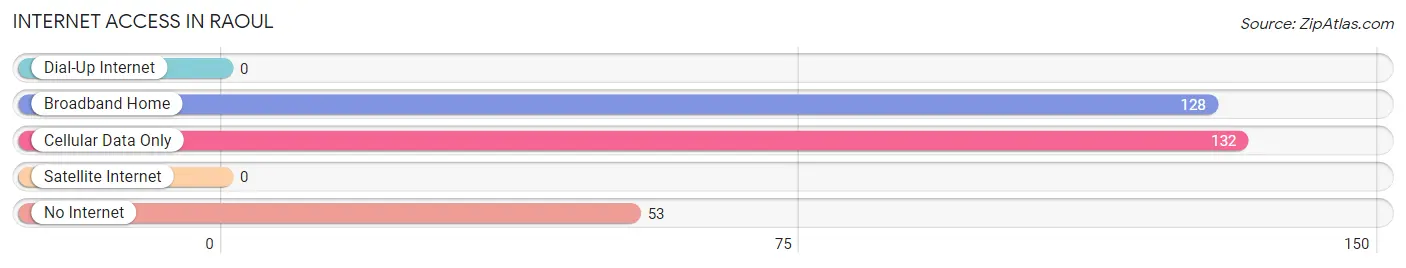
| Internet Type | # Households | % Households |
| Dial-Up Internet | 0 | 0.0% |
| Broadband Home | 128 | 40.9% |
| Cellular Data Only | 132 | 42.2% |
| Satellite Internet | 0 | 0.0% |
| No Internet | 53 | 16.9% |
| Total | 313 | 100.0% |
Raoul Summary
Raoul is a small town located in the state of Georgia, in the United States. It is situated in the southeastern part of the state, in Tattnall County. The town is located on the banks of the Ohoopee River, and is home to a population of just over 500 people.
Geography
Raoul is located in the southeastern part of Georgia, in Tattnall County. It is situated on the banks of the Ohoopee River, and is surrounded by a number of small towns and rural areas. The town is located at an elevation of approximately 200 feet above sea level. The climate in Raoul is humid subtropical, with hot summers and mild winters. The average annual temperature is around 70 degrees Fahrenheit.
Economy
Raoul’s economy is largely based on agriculture and forestry. The town is home to a number of small farms, which produce a variety of crops, including corn, soybeans, cotton, and peanuts. The town also has a number of timber companies, which harvest and process timber for use in construction and other industries. Raoul also has a number of small businesses, including restaurants, convenience stores, and gas stations.
Demographics
As of the 2010 census, Raoul had a population of 514 people. The racial makeup of the town was 95.3% White, 0.6% African American, 0.4% Native American, 0.2% Asian, and 3.5% from other races. The median household income in Raoul was $30,000, and the median family income was $35,000. The per capita income in Raoul was $14,000.
History
Raoul was founded in the late 19th century, and was named after a local settler, Raoul de la Croix. The town was originally a small farming community, and was home to a number of small farms. In the early 20th century, the town began to grow, and a number of businesses were established. In the 1950s, the town was incorporated, and the population began to grow. In the late 20th century, the town began to decline, and the population began to decline as well. Today, Raoul is a small, rural town, with a population of just over 500 people.
Common Questions
What is Per Capita Income in Raoul?
Per Capita income in Raoul is $14,364.
What is the Median Family Income in Raoul?
Median Family Income in Raoul is $55,165.
What is the Median Household income in Raoul?
Median Household Income in Raoul is $56,675.
What is Inequality or Gini Index in Raoul?
Inequality or Gini Index in Raoul is 0.22.
What is the Total Population of Raoul?
Total Population of Raoul is 2,529.
What is the Total Male Population of Raoul?
Total Male Population of Raoul is 586.
What is the Total Female Population of Raoul?
Total Female Population of Raoul is 1,943.
What is the Ratio of Males per 100 Females in Raoul?
There are 30.16 Males per 100 Females in Raoul.
What is the Ratio of Females per 100 Males in Raoul?
There are 331.57 Females per 100 Males in Raoul.
What is the Median Population Age in Raoul?
Median Population Age in Raoul is 36.8 Years.
What is the Average Family Size in Raoul
Average Family Size in Raoul is 4.8 People.
What is the Average Household Size in Raoul
Average Household Size in Raoul is 3.5 People.
How Large is the Labor Force in Raoul?
There are 533 People in the Labor Forcein in Raoul.
What is the Percentage of People in the Labor Force in Raoul?
24.7% of People are in the Labor Force in Raoul.
What is the Unemployment Rate in Raoul?
Unemployment Rate in Raoul is 4.3%.