Ochlocknee, GA Map & Demographics
Ochlocknee Map
Ochlocknee Overview
$23,930
PER CAPITA INCOME
$41,042
AVG FAMILY INCOME
$55,375
AVG HOUSEHOLD INCOME
18.1%
WAGE / INCOME GAP [ % ]
81.9¢/ $1
WAGE / INCOME GAP [ $ ]
0.38
INEQUALITY / GINI INDEX
672
TOTAL POPULATION
341
MALE POPULATION
331
FEMALE POPULATION
103.02
MALES / 100 FEMALES
97.07
FEMALES / 100 MALES
37.3
MEDIAN AGE
3.0
AVG FAMILY SIZE
2.7
AVG HOUSEHOLD SIZE
324
LABOR FORCE [ PEOPLE ]
62.4%
PERCENT IN LABOR FORCE
9.3%
UNEMPLOYMENT RATE
Ochlocknee Zip Codes
Ochlocknee Area Codes
Income in Ochlocknee
Income Overview in Ochlocknee
Per Capita Income in Ochlocknee is $23,930, while median incomes of families and households are $41,042 and $55,375 respectively.
| Characteristic | Number | Measure |
| Per Capita Income | 672 | $23,930 |
| Median Family Income | 175 | $41,042 |
| Mean Family Income | 175 | $59,591 |
| Median Household Income | 252 | $55,375 |
| Mean Household Income | 252 | $57,432 |
| Income Deficit | 175 | $0 |
| Wage / Income Gap (%) | 672 | 18.08% |
| Wage / Income Gap ($) | 672 | 81.92¢ per $1 |
| Gini / Inequality Index | 672 | 0.38 |
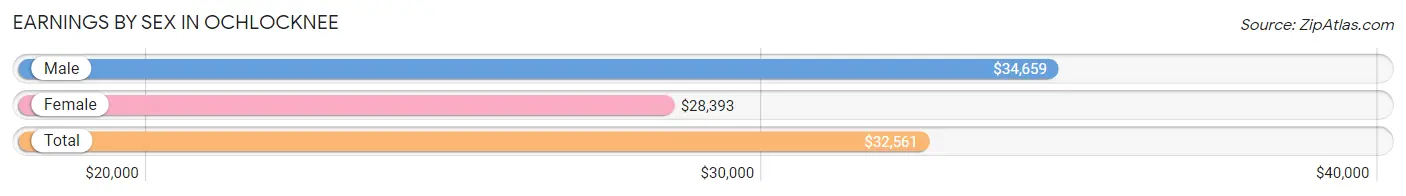
Earnings by Sex in Ochlocknee
Average Earnings in Ochlocknee are $32,561, $34,659 for men and $28,393 for women, a difference of 18.1%.
| Sex | Number | Average Earnings |
| Male | 205 (61.8%) | $34,659 |
| Female | 127 (38.3%) | $28,393 |
| Total | 332 (100.0%) | $32,561 |
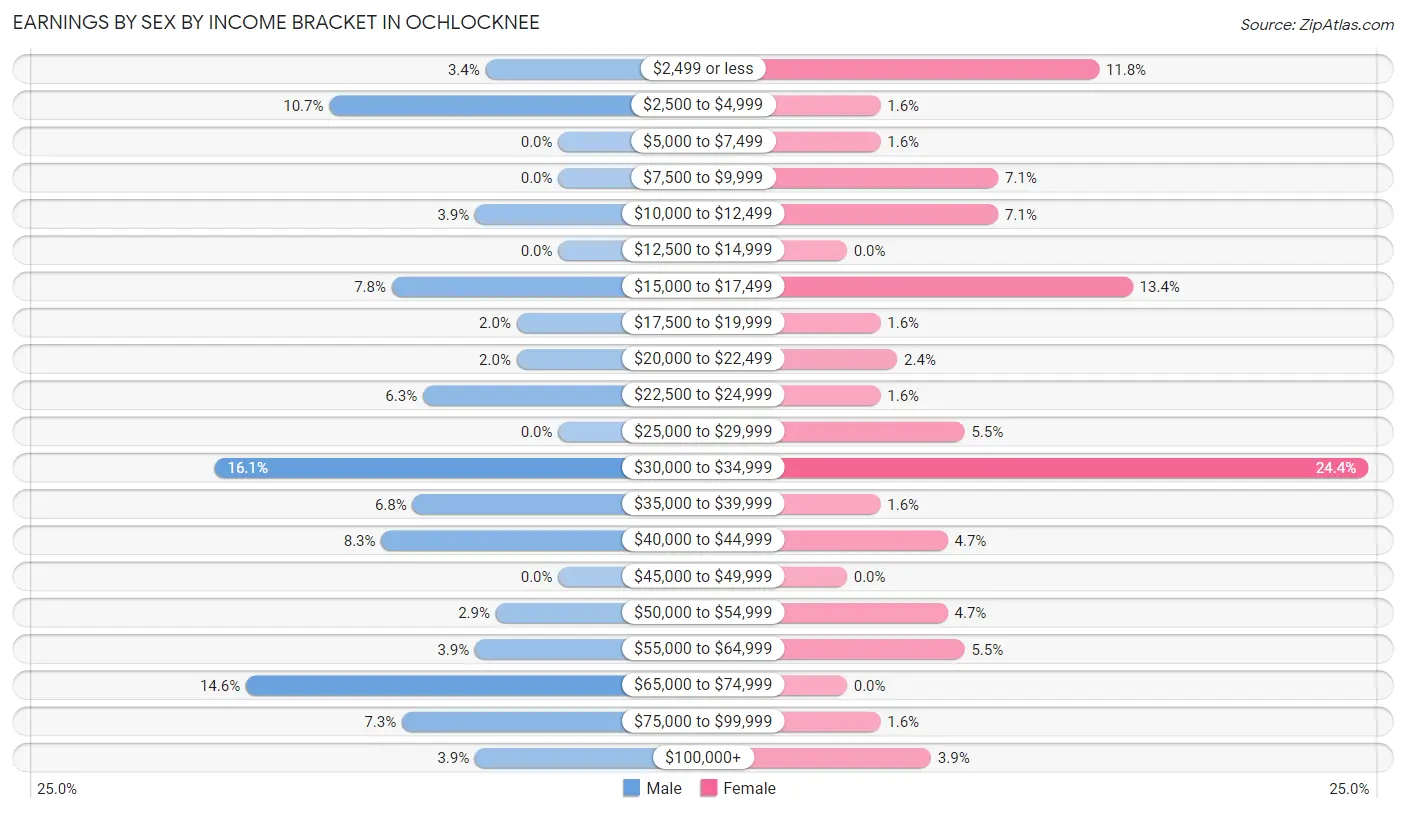
Earnings by Sex by Income Bracket in Ochlocknee
The most common earnings brackets in Ochlocknee are $30,000 to $34,999 for men (33 | 16.1%) and $30,000 to $34,999 for women (31 | 24.4%).
| Income | Male | Female |
| $2,499 or less | 7 (3.4%) | 15 (11.8%) |
| $2,500 to $4,999 | 22 (10.7%) | 2 (1.6%) |
| $5,000 to $7,499 | 0 (0.0%) | 2 (1.6%) |
| $7,500 to $9,999 | 0 (0.0%) | 9 (7.1%) |
| $10,000 to $12,499 | 8 (3.9%) | 9 (7.1%) |
| $12,500 to $14,999 | 0 (0.0%) | 0 (0.0%) |
| $15,000 to $17,499 | 16 (7.8%) | 17 (13.4%) |
| $17,500 to $19,999 | 4 (1.9%) | 2 (1.6%) |
| $20,000 to $22,499 | 4 (1.9%) | 3 (2.4%) |
| $22,500 to $24,999 | 13 (6.3%) | 2 (1.6%) |
| $25,000 to $29,999 | 0 (0.0%) | 7 (5.5%) |
| $30,000 to $34,999 | 33 (16.1%) | 31 (24.4%) |
| $35,000 to $39,999 | 14 (6.8%) | 2 (1.6%) |
| $40,000 to $44,999 | 17 (8.3%) | 6 (4.7%) |
| $45,000 to $49,999 | 0 (0.0%) | 0 (0.0%) |
| $50,000 to $54,999 | 6 (2.9%) | 6 (4.7%) |
| $55,000 to $64,999 | 8 (3.9%) | 7 (5.5%) |
| $65,000 to $74,999 | 30 (14.6%) | 0 (0.0%) |
| $75,000 to $99,999 | 15 (7.3%) | 2 (1.6%) |
| $100,000+ | 8 (3.9%) | 5 (3.9%) |
| Total | 205 (100.0%) | 127 (100.0%) |
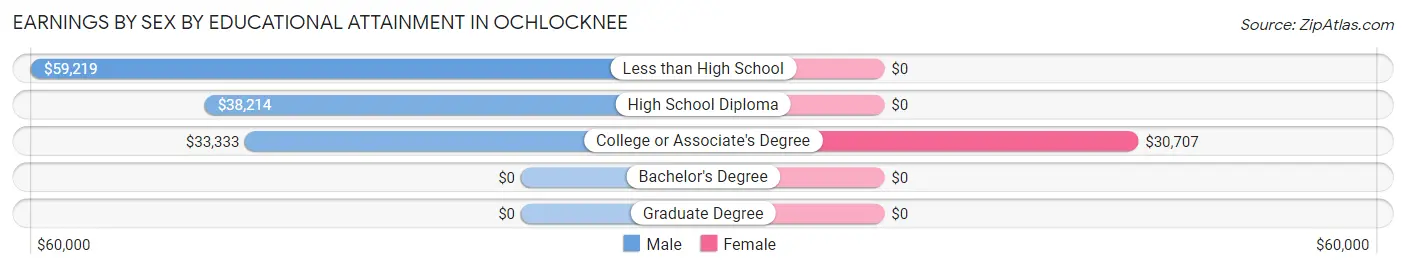
Earnings by Sex by Educational Attainment in Ochlocknee
Average earnings in Ochlocknee are $41,250 for men and $30,109 for women, a difference of 27.0%. Men with an educational attainment of less than high school enjoy the highest average annual earnings of $59,219, while those with college or associate's degree education earn the least with $33,333. Women with an educational attainment of college or associate's degree earn the most with the average annual earnings of $30,707, while those with college or associate's degree education have the smallest earnings of $30,707.
| Educational Attainment | Male Income | Female Income |
| Less than High School | $59,219 | $0 |
| High School Diploma | $38,214 | $0 |
| College or Associate's Degree | $33,333 | $30,707 |
| Bachelor's Degree | - | - |
| Graduate Degree | - | - |
| Total | $41,250 | $30,109 |
Family Income in Ochlocknee
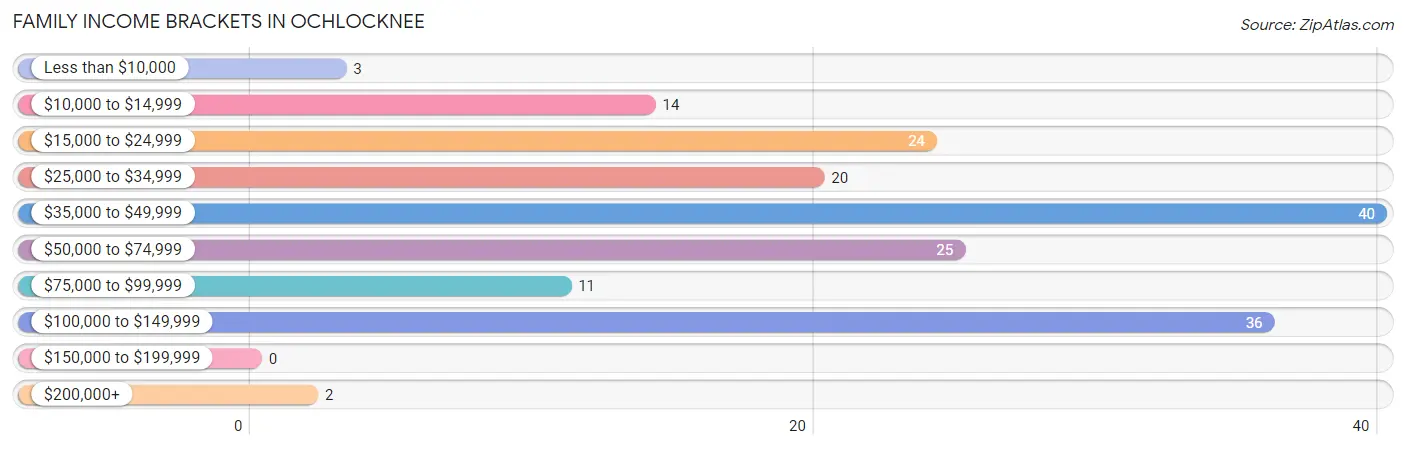
Family Income Brackets in Ochlocknee
According to the Ochlocknee family income data, there are 40 families falling into the $35,000 to $49,999 income range, which is the most common income bracket and makes up 22.9% of all families.
| Income Bracket | # Families | % Families |
| Less than $10,000 | 3 | 1.7% |
| $10,000 to $14,999 | 14 | 8.0% |
| $15,000 to $24,999 | 24 | 13.7% |
| $25,000 to $34,999 | 20 | 11.4% |
| $35,000 to $49,999 | 40 | 22.9% |
| $50,000 to $74,999 | 25 | 14.3% |
| $75,000 to $99,999 | 11 | 6.3% |
| $100,000 to $149,999 | 36 | 20.6% |
| $150,000 to $199,999 | 0 | 0.0% |
| $200,000+ | 2 | 1.1% |
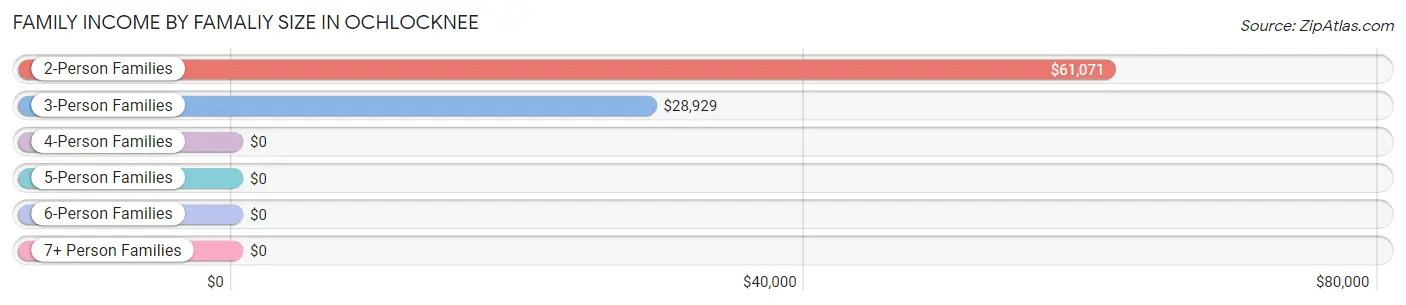
Family Income by Famaliy Size in Ochlocknee
2-person families (92 | 52.6%) account for the highest median family income in Ochlocknee with $61,071 per family, while 2-person families (92 | 52.6%) have the highest median income of $30,536 per family member.
| Income Bracket | # Families | Median Income |
| 2-Person Families | 92 (52.6%) | $61,071 |
| 3-Person Families | 40 (22.9%) | $28,929 |
| 4-Person Families | 17 (9.7%) | $0 |
| 5-Person Families | 22 (12.6%) | $0 |
| 6-Person Families | 0 (0.0%) | $0 |
| 7+ Person Families | 4 (2.3%) | $0 |
| Total | 175 (100.0%) | $41,042 |
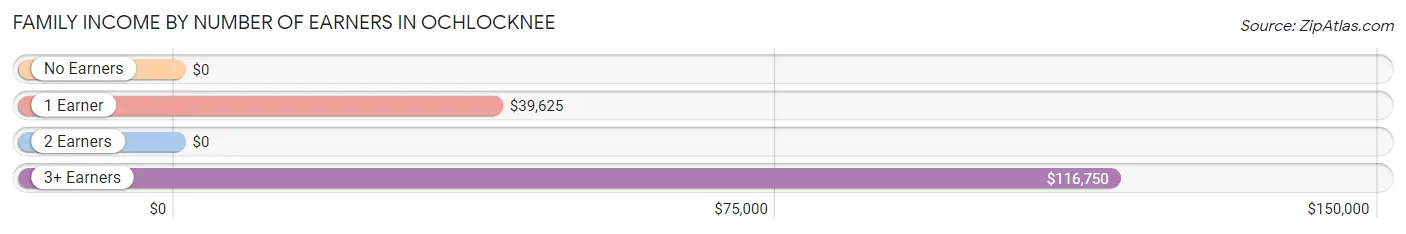
Family Income by Number of Earners in Ochlocknee
| Number of Earners | # Families | Median Income |
| No Earners | 25 (14.3%) | $0 |
| 1 Earner | 114 (65.1%) | $39,625 |
| 2 Earners | 22 (12.6%) | $0 |
| 3+ Earners | 14 (8.0%) | $116,750 |
| Total | 175 (100.0%) | $41,042 |
Household Income in Ochlocknee
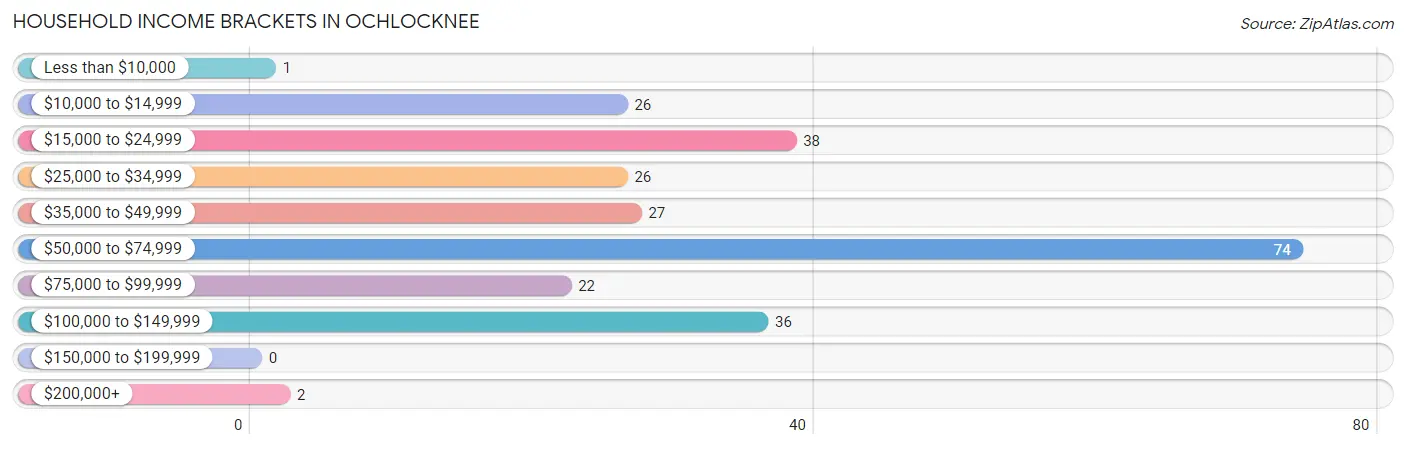
Household Income Brackets in Ochlocknee
With 74 households falling in the category, the $50,000 to $74,999 income range is the most frequent in Ochlocknee, accounting for 29.4% of all households.
| Income Bracket | # Households | % Households |
| Less than $10,000 | 1 | 0.4% |
| $10,000 to $14,999 | 26 | 10.3% |
| $15,000 to $24,999 | 38 | 15.1% |
| $25,000 to $34,999 | 26 | 10.3% |
| $35,000 to $49,999 | 27 | 10.7% |
| $50,000 to $74,999 | 74 | 29.4% |
| $75,000 to $99,999 | 22 | 8.7% |
| $100,000 to $149,999 | 36 | 14.3% |
| $150,000 to $199,999 | 0 | 0.0% |
| $200,000+ | 2 | 0.8% |
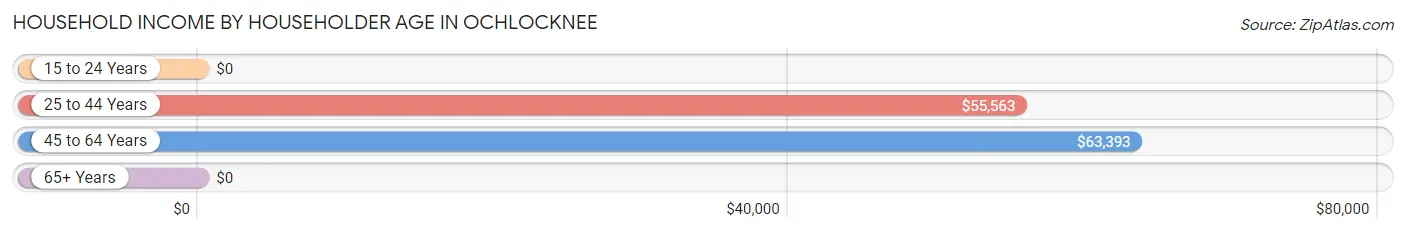
Household Income by Householder Age in Ochlocknee
The median household income in Ochlocknee is $55,375, with the highest median household income of $63,393 found in the 45 to 64 years age bracket for the primary householder. A total of 77 households (30.6%) fall into this category. Meanwhile, the 15 to 24 years age bracket for the primary householder has the lowest median household income of $0, with 8 households (3.2%) in this group.
| Income Bracket | # Households | Median Income |
| 15 to 24 Years | 8 (3.2%) | $0 |
| 25 to 44 Years | 77 (30.6%) | $55,563 |
| 45 to 64 Years | 77 (30.6%) | $63,393 |
| 65+ Years | 90 (35.7%) | $0 |
| Total | 252 (100.0%) | $55,375 |
Poverty in Ochlocknee
Income Below Poverty by Sex and Age in Ochlocknee
With 23.7% poverty level for males and 31.7% for females among the residents of Ochlocknee, 12 to 14 year old males and 18 to 24 year old females are the most vulnerable to poverty, with 20 males (100.0%) and 9 females (81.8%) in their respective age groups living below the poverty level.
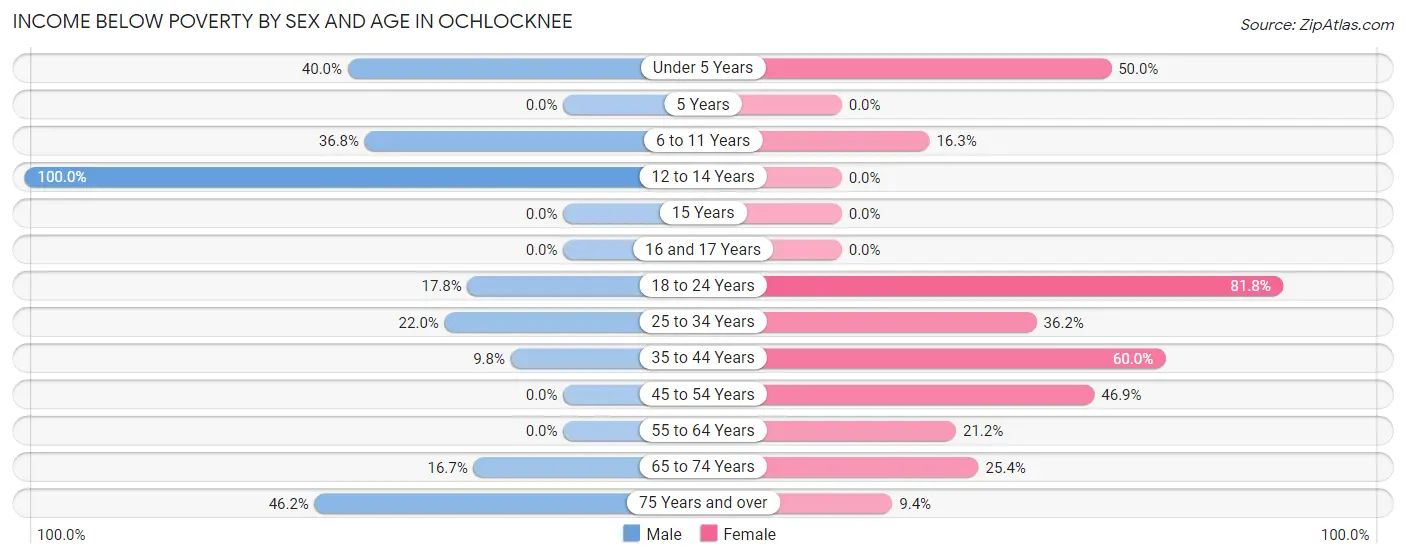
| Age Bracket | Male | Female |
| Under 5 Years | 4 (40.0%) | 13 (50.0%) |
| 5 Years | 0 (0.0%) | 0 (0.0%) |
| 6 to 11 Years | 14 (36.8%) | 7 (16.3%) |
| 12 to 14 Years | 20 (100.0%) | 0 (0.0%) |
| 15 Years | 0 (0.0%) | 0 (0.0%) |
| 16 and 17 Years | 0 (0.0%) | 0 (0.0%) |
| 18 to 24 Years | 8 (17.8%) | 9 (81.8%) |
| 25 to 34 Years | 13 (22.0%) | 17 (36.2%) |
| 35 to 44 Years | 4 (9.8%) | 3 (60.0%) |
| 45 to 54 Years | 0 (0.0%) | 30 (46.9%) |
| 55 to 64 Years | 0 (0.0%) | 7 (21.2%) |
| 65 to 74 Years | 6 (16.7%) | 16 (25.4%) |
| 75 Years and over | 12 (46.2%) | 3 (9.4%) |
| Total | 81 (23.7%) | 105 (31.7%) |
Income Above Poverty by Sex and Age in Ochlocknee
According to the poverty statistics in Ochlocknee, males aged 5 years and females aged 12 to 14 years are the age groups that are most secure financially, with 100.0% of males and 100.0% of females in these age groups living above the poverty line.
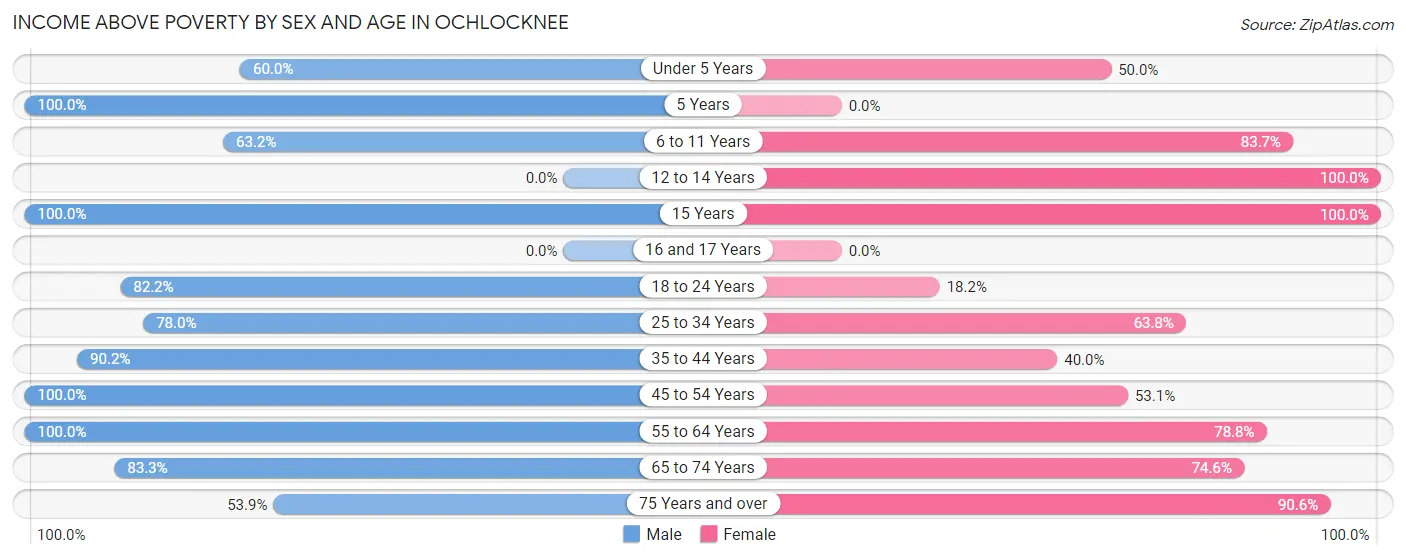
| Age Bracket | Male | Female |
| Under 5 Years | 6 (60.0%) | 13 (50.0%) |
| 5 Years | 3 (100.0%) | 0 (0.0%) |
| 6 to 11 Years | 24 (63.2%) | 36 (83.7%) |
| 12 to 14 Years | 0 (0.0%) | 3 (100.0%) |
| 15 Years | 6 (100.0%) | 4 (100.0%) |
| 16 and 17 Years | 0 (0.0%) | 0 (0.0%) |
| 18 to 24 Years | 37 (82.2%) | 2 (18.2%) |
| 25 to 34 Years | 46 (78.0%) | 30 (63.8%) |
| 35 to 44 Years | 37 (90.2%) | 2 (40.0%) |
| 45 to 54 Years | 39 (100.0%) | 34 (53.1%) |
| 55 to 64 Years | 18 (100.0%) | 26 (78.8%) |
| 65 to 74 Years | 30 (83.3%) | 47 (74.6%) |
| 75 Years and over | 14 (53.8%) | 29 (90.6%) |
| Total | 260 (76.2%) | 226 (68.3%) |
Income Below Poverty Among Married-Couple Families in Ochlocknee
The poverty statistics for married-couple families in Ochlocknee show that 26.8% or 22 of the total 82 families live below the poverty line. Families with 1 or 2 children have the highest poverty rate of 100.0%, comprising of 7 families. On the other hand, families with 3 or 4 children have the lowest poverty rate of 0.0%, which includes 0 families.
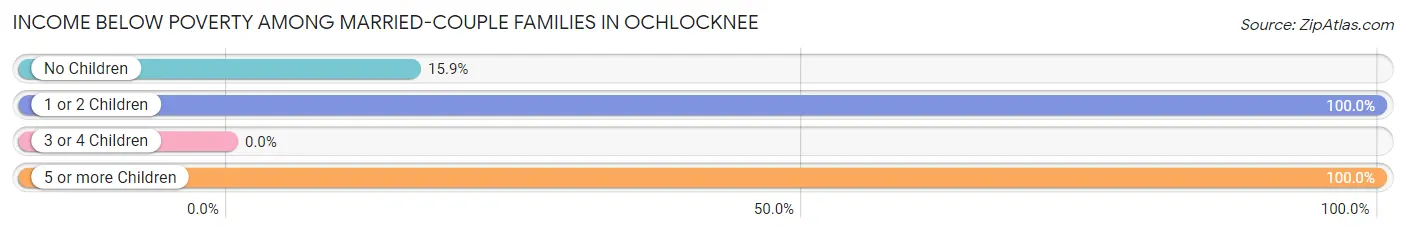
| Children | Above Poverty | Below Poverty |
| No Children | 58 (84.1%) | 11 (15.9%) |
| 1 or 2 Children | 0 (0.0%) | 7 (100.0%) |
| 3 or 4 Children | 2 (100.0%) | 0 (0.0%) |
| 5 or more Children | 0 (0.0%) | 4 (100.0%) |
| Total | 60 (73.2%) | 22 (26.8%) |
Income Below Poverty Among Single-Parent Households in Ochlocknee
According to the poverty data in Ochlocknee, 11.5% or 6 single-father households and 24.4% or 10 single-mother households are living below the poverty line. Among single-father households, those with no children have the highest poverty rate, with 6 households (31.6%) experiencing poverty. Likewise, among single-mother households, those with 1 or 2 children have the highest poverty rate, with 10 households (37.0%) falling below the poverty line.
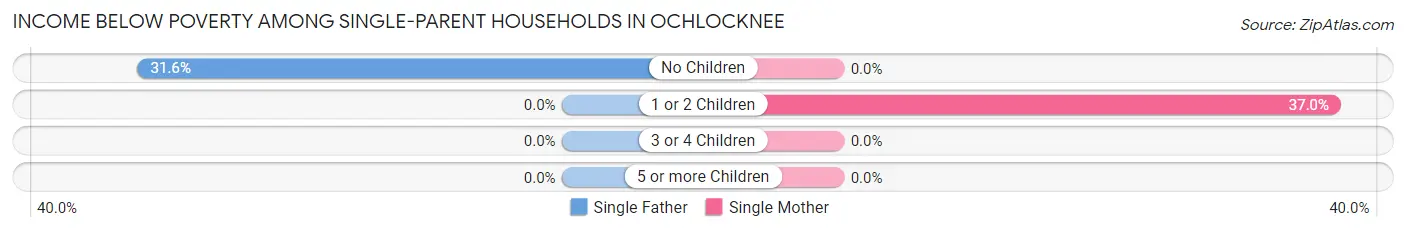
| Children | Single Father | Single Mother |
| No Children | 6 (31.6%) | 0 (0.0%) |
| 1 or 2 Children | 0 (0.0%) | 10 (37.0%) |
| 3 or 4 Children | 0 (0.0%) | 0 (0.0%) |
| 5 or more Children | 0 (0.0%) | 0 (0.0%) |
| Total | 6 (11.5%) | 10 (24.4%) |
Income Below Poverty Among Married-Couple vs Single-Parent Households in Ochlocknee
The poverty data for Ochlocknee shows that 22 of the married-couple family households (26.8%) and 16 of the single-parent households (17.2%) are living below the poverty level. Within the married-couple family households, those with 1 or 2 children have the highest poverty rate, with 7 households (100.0%) falling below the poverty line. Among the single-parent households, those with 1 or 2 children have the highest poverty rate, with 10 household (25.0%) living below poverty.
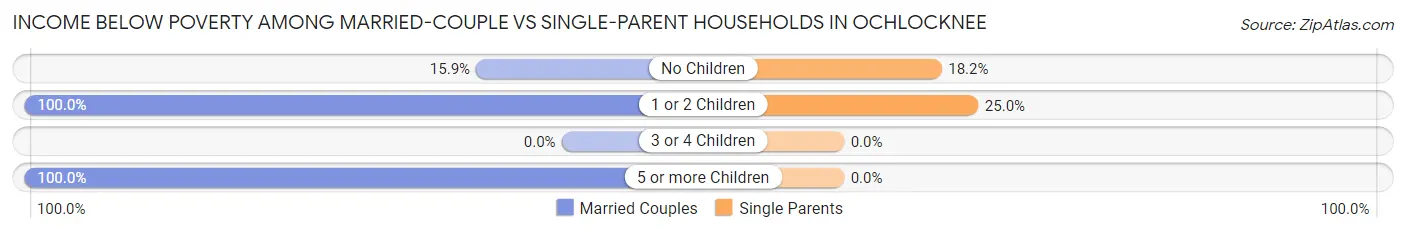
| Children | Married-Couple Families | Single-Parent Households |
| No Children | 11 (15.9%) | 6 (18.2%) |
| 1 or 2 Children | 7 (100.0%) | 10 (25.0%) |
| 3 or 4 Children | 0 (0.0%) | 0 (0.0%) |
| 5 or more Children | 4 (100.0%) | 0 (0.0%) |
| Total | 22 (26.8%) | 16 (17.2%) |
Race in Ochlocknee
The most populous races in Ochlocknee are White / Caucasian (437 | 65.0%), Black / African American (174 | 25.9%), and Hispanic or Latino (48 | 7.1%).
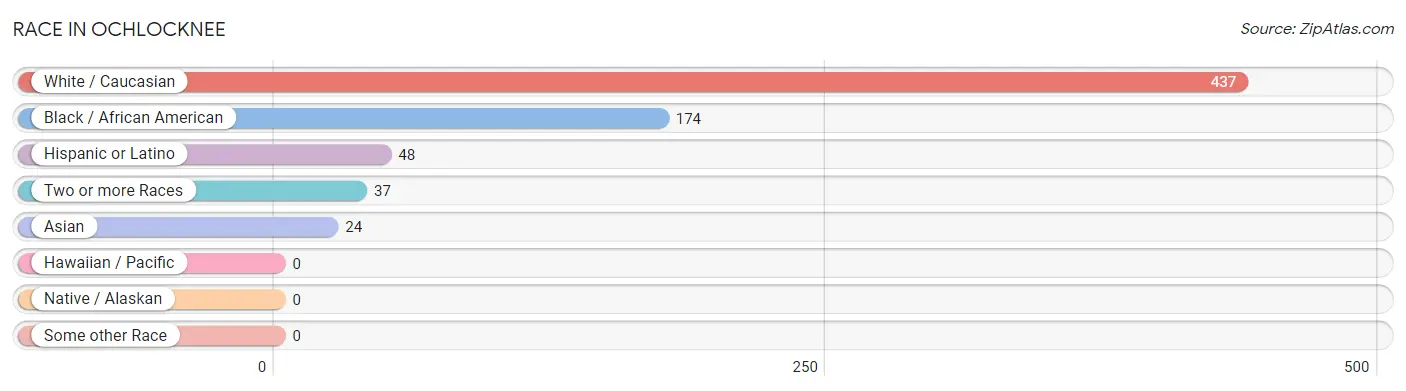
| Race | # Population | % Population |
| Asian | 24 | 3.6% |
| Black / African American | 174 | 25.9% |
| Hawaiian / Pacific | 0 | 0.0% |
| Hispanic or Latino | 48 | 7.1% |
| Native / Alaskan | 0 | 0.0% |
| White / Caucasian | 437 | 65.0% |
| Two or more Races | 37 | 5.5% |
| Some other Race | 0 | 0.0% |
| Total | 672 | 100.0% |
Ancestry in Ochlocknee
The most populous ancestries reported in Ochlocknee are Irish (78 | 11.6%), German (64 | 9.5%), English (36 | 5.4%), Mexican (35 | 5.2%), and Welsh (25 | 3.7%), together accounting for 35.4% of all Ochlocknee residents.
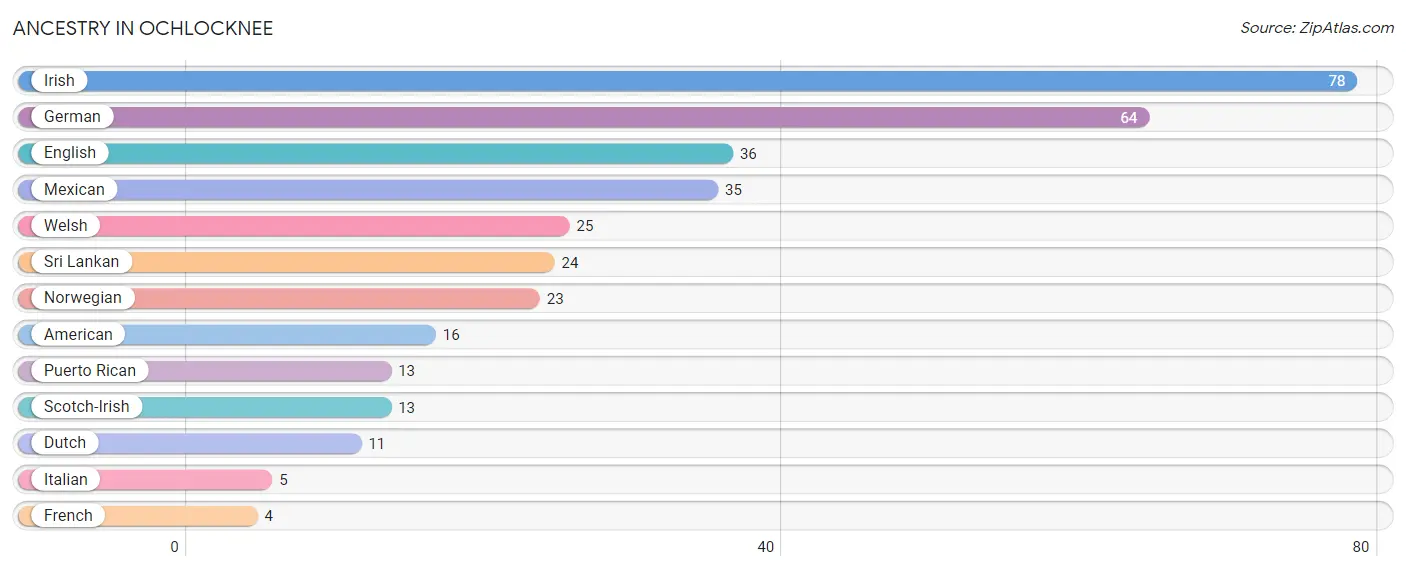
| Ancestry | # Population | % Population |
| American | 16 | 2.4% |
| Dutch | 11 | 1.6% |
| English | 36 | 5.4% |
| French | 4 | 0.6% |
| German | 64 | 9.5% |
| Irish | 78 | 11.6% |
| Italian | 5 | 0.7% |
| Mexican | 35 | 5.2% |
| Norwegian | 23 | 3.4% |
| Puerto Rican | 13 | 1.9% |
| Scotch-Irish | 13 | 1.9% |
| Sri Lankan | 24 | 3.6% |
| Welsh | 25 | 3.7% | View All 13 Rows |
Immigrants in Ochlocknee
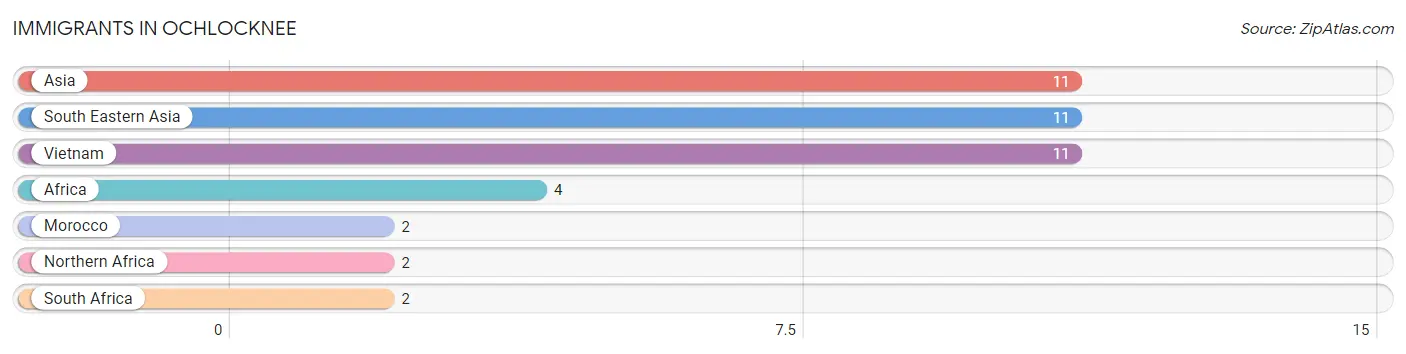
The most numerous immigrant groups reported in Ochlocknee came from Asia (11 | 1.6%), South Eastern Asia (11 | 1.6%), Vietnam (11 | 1.6%), Africa (4 | 0.6%), and Morocco (2 | 0.3%), together accounting for 5.8% of all Ochlocknee residents.
| Immigration Origin | # Population | % Population |
| Africa | 4 | 0.6% |
| Asia | 11 | 1.6% |
| Morocco | 2 | 0.3% |
| Northern Africa | 2 | 0.3% |
| South Africa | 2 | 0.3% |
| South Eastern Asia | 11 | 1.6% |
| Vietnam | 11 | 1.6% | View All 7 Rows |
Sex and Age in Ochlocknee
Sex and Age in Ochlocknee
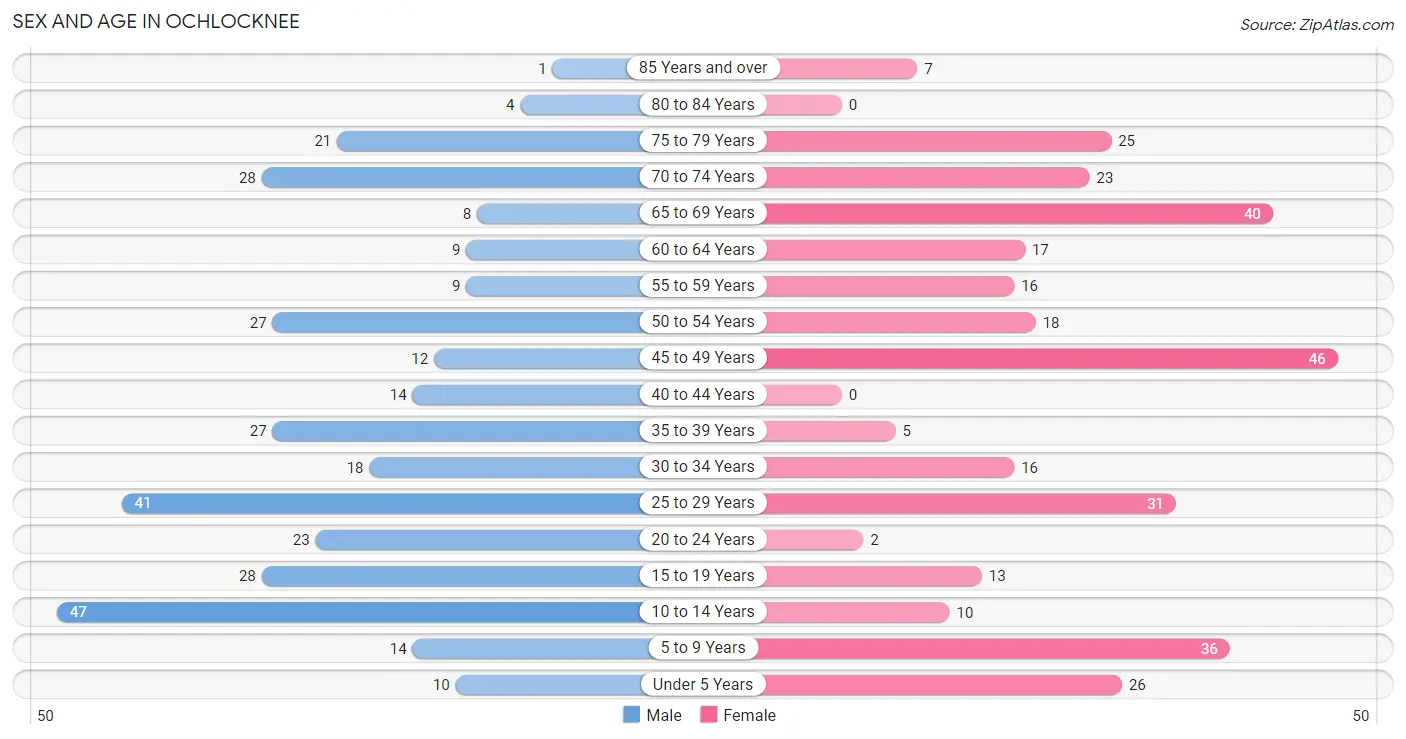
The most populous age groups in Ochlocknee are 10 to 14 Years (47 | 13.8%) for men and 45 to 49 Years (46 | 13.9%) for women.
| Age Bracket | Male | Female |
| Under 5 Years | 10 (2.9%) | 26 (7.9%) |
| 5 to 9 Years | 14 (4.1%) | 36 (10.9%) |
| 10 to 14 Years | 47 (13.8%) | 10 (3.0%) |
| 15 to 19 Years | 28 (8.2%) | 13 (3.9%) |
| 20 to 24 Years | 23 (6.7%) | 2 (0.6%) |
| 25 to 29 Years | 41 (12.0%) | 31 (9.4%) |
| 30 to 34 Years | 18 (5.3%) | 16 (4.8%) |
| 35 to 39 Years | 27 (7.9%) | 5 (1.5%) |
| 40 to 44 Years | 14 (4.1%) | 0 (0.0%) |
| 45 to 49 Years | 12 (3.5%) | 46 (13.9%) |
| 50 to 54 Years | 27 (7.9%) | 18 (5.4%) |
| 55 to 59 Years | 9 (2.6%) | 16 (4.8%) |
| 60 to 64 Years | 9 (2.6%) | 17 (5.1%) |
| 65 to 69 Years | 8 (2.4%) | 40 (12.1%) |
| 70 to 74 Years | 28 (8.2%) | 23 (7.0%) |
| 75 to 79 Years | 21 (6.2%) | 25 (7.5%) |
| 80 to 84 Years | 4 (1.2%) | 0 (0.0%) |
| 85 Years and over | 1 (0.3%) | 7 (2.1%) |
| Total | 341 (100.0%) | 331 (100.0%) |
Families and Households in Ochlocknee
Median Family Size in Ochlocknee
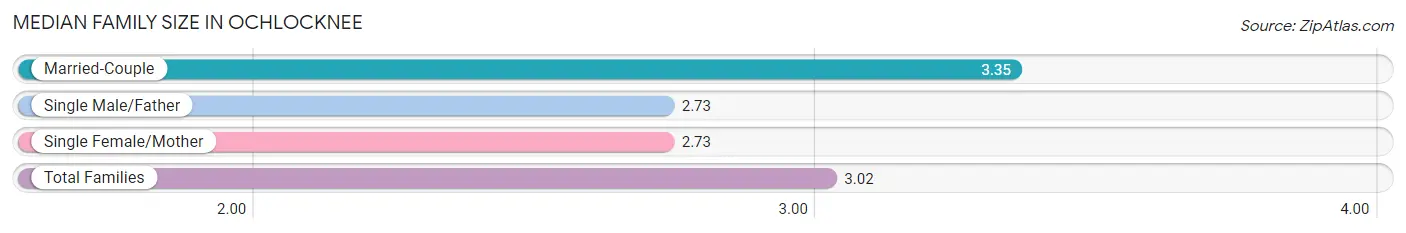
The median family size in Ochlocknee is 3.02 persons per family, with married-couple families (82 | 46.9%) accounting for the largest median family size of 3.35 persons per family. On the other hand, single male/father families (52 | 29.7%) represent the smallest median family size with 2.73 persons per family.
| Family Type | # Families | Family Size |
| Married-Couple | 82 (46.9%) | 3.35 |
| Single Male/Father | 52 (29.7%) | 2.73 |
| Single Female/Mother | 41 (23.4%) | 2.73 |
| Total Families | 175 (100.0%) | 3.02 |
Median Household Size in Ochlocknee
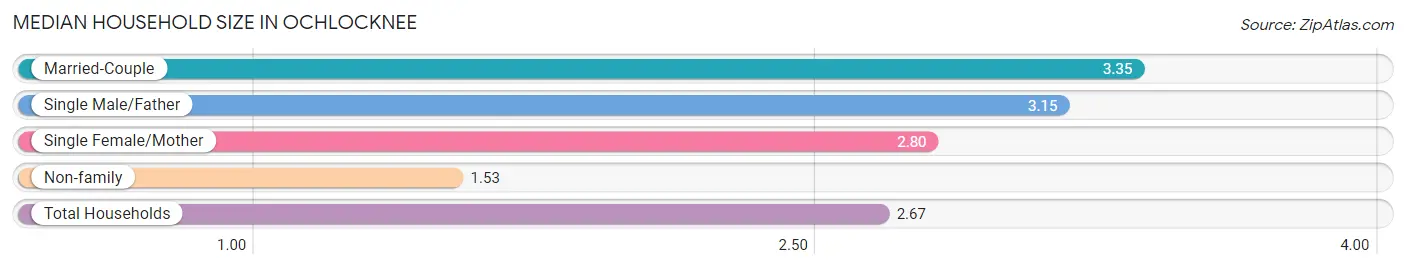
The median household size in Ochlocknee is 2.67 persons per household, with married-couple households (82 | 32.5%) accounting for the largest median household size of 3.35 persons per household. non-family households (77 | 30.6%) represent the smallest median household size with 1.53 persons per household.
| Household Type | # Households | Household Size |
| Married-Couple | 82 (32.5%) | 3.35 |
| Single Male/Father | 52 (20.6%) | 3.15 |
| Single Female/Mother | 41 (16.3%) | 2.80 |
| Non-family | 77 (30.6%) | 1.53 |
| Total Households | 252 (100.0%) | 2.67 |
Household Size by Marriage Status in Ochlocknee
Out of a total of 252 households in Ochlocknee, 175 (69.4%) are family households, while 77 (30.6%) are nonfamily households. The most numerous type of family households are 2-person households, comprising 92, and the most common type of nonfamily households are 1-person households, comprising 63.
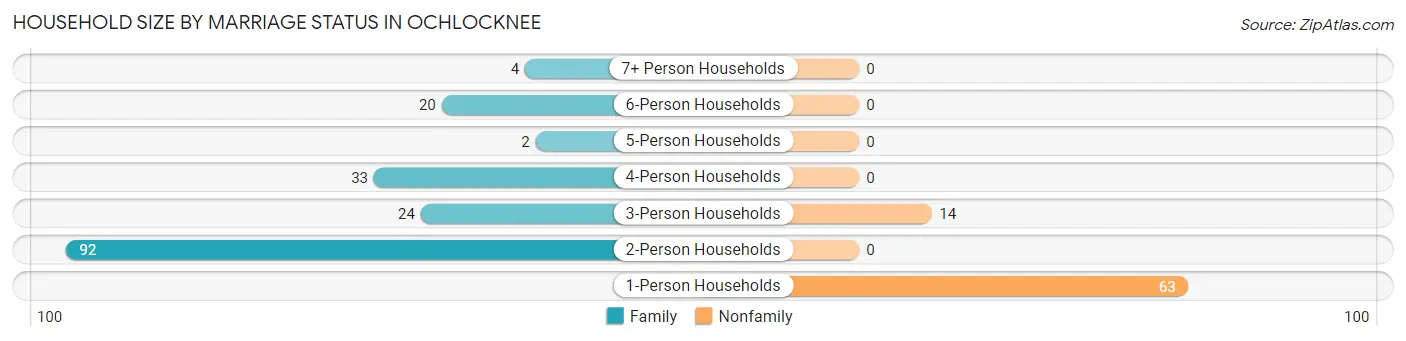
| Household Size | Family Households | Nonfamily Households |
| 1-Person Households | - | 63 (25.0%) |
| 2-Person Households | 92 (36.5%) | 0 (0.0%) |
| 3-Person Households | 24 (9.5%) | 14 (5.6%) |
| 4-Person Households | 33 (13.1%) | 0 (0.0%) |
| 5-Person Households | 2 (0.8%) | 0 (0.0%) |
| 6-Person Households | 20 (7.9%) | 0 (0.0%) |
| 7+ Person Households | 4 (1.6%) | 0 (0.0%) |
| Total | 175 (69.4%) | 77 (30.6%) |
Female Fertility in Ochlocknee
Fertility by Age in Ochlocknee
Average fertility rate in Ochlocknee is 134.0 births per 1,000 women. Women in the age bracket of 20 to 34 years have the highest fertility rate with 265.0 births per 1,000 women. Women in the age bracket of 20 to 34 years acount for 81.2% of all women with births.
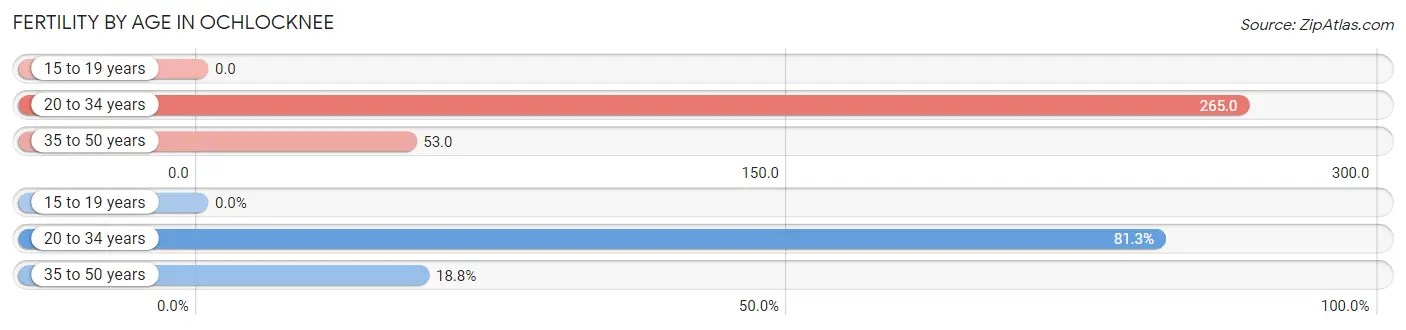
| Age Bracket | Women with Births | Births / 1,000 Women |
| 15 to 19 years | 0 (0.0%) | 0.0 |
| 20 to 34 years | 13 (81.2%) | 265.0 |
| 35 to 50 years | 3 (18.8%) | 53.0 |
| Total | 16 (100.0%) | 134.0 |
Fertility by Age by Marriage Status in Ochlocknee
81.2% of women with births (16) in Ochlocknee are married. The highest percentage of unmarried women with births falls into 35 to 50 years age bracket with 100.0% of them unmarried at the time of birth, while the lowest percentage of unmarried women with births belong to 20 to 34 years age bracket with 0.0% of them unmarried.
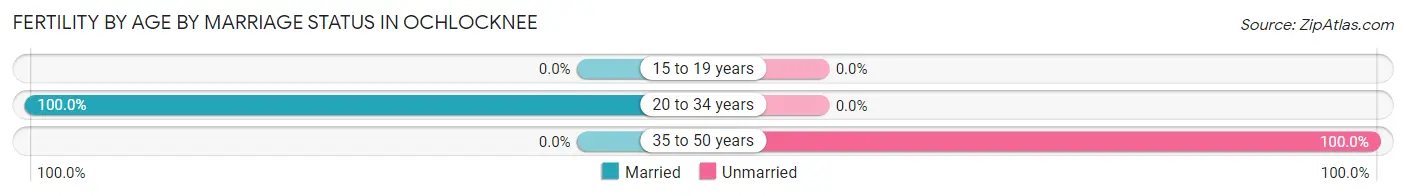
| Age Bracket | Married | Unmarried |
| 15 to 19 years | 0 (0.0%) | 0 (0.0%) |
| 20 to 34 years | 13 (100.0%) | 0 (0.0%) |
| 35 to 50 years | 0 (0.0%) | 3 (100.0%) |
| Total | 13 (81.2%) | 3 (18.8%) |
Fertility by Education in Ochlocknee
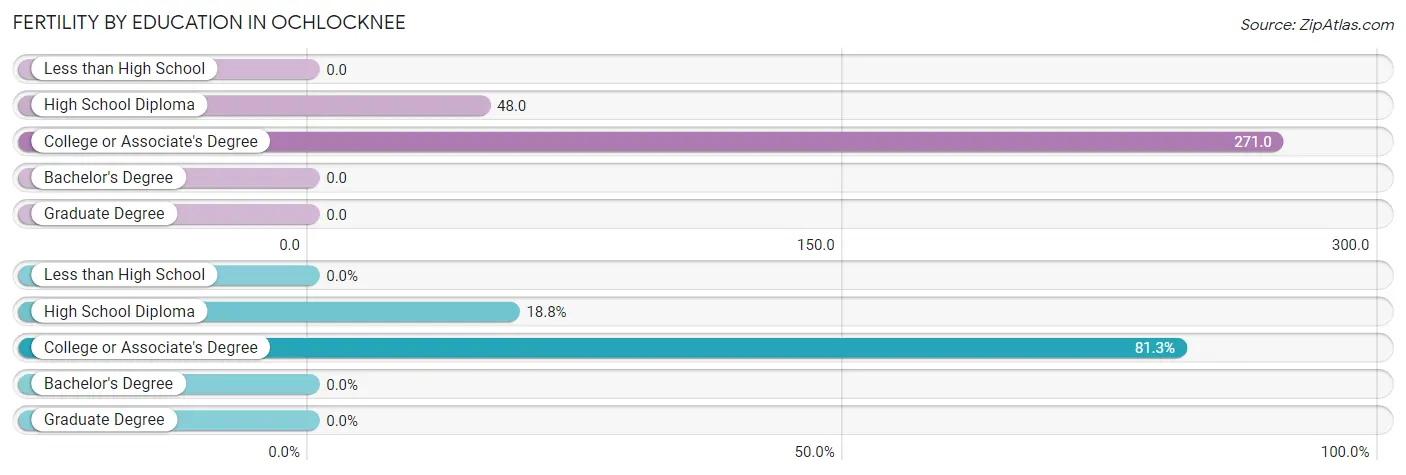
| Educational Attainment | Women with Births | Births / 1,000 Women |
| Less than High School | 0 (0.0%) | 0.0 |
| High School Diploma | 3 (18.8%) | 48.0 |
| College or Associate's Degree | 13 (81.2%) | 271.0 |
| Bachelor's Degree | 0 (0.0%) | 0.0 |
| Graduate Degree | 0 (0.0%) | 0.0 |
| Total | 16 (100.0%) | 134.0 |
Fertility by Education by Marriage Status in Ochlocknee
18.8% of women with births in Ochlocknee are unmarried. Women with the educational attainment of college or associate's degree are most likely to be married with 100.0% of them married at childbirth, while women with the educational attainment of high school diploma are least likely to be married with 100.0% of them unmarried at childbirth.
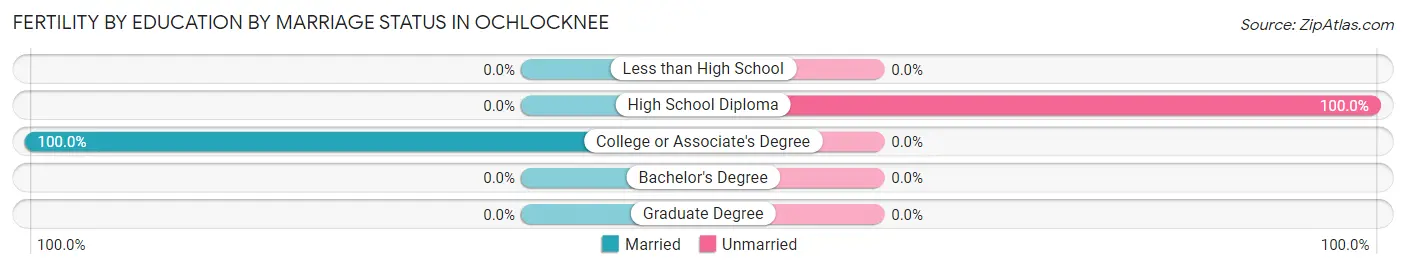
| Educational Attainment | Married | Unmarried |
| Less than High School | 0 (0.0%) | 0 (0.0%) |
| High School Diploma | 0 (0.0%) | 3 (100.0%) |
| College or Associate's Degree | 13 (100.0%) | 0 (0.0%) |
| Bachelor's Degree | 0 (0.0%) | 0 (0.0%) |
| Graduate Degree | 0 (0.0%) | 0 (0.0%) |
| Total | 13 (81.2%) | 3 (18.8%) |
Employment Characteristics in Ochlocknee
Employment by Class of Employer in Ochlocknee
Among the 267 employed individuals in Ochlocknee, private company employees (208 | 77.9%), self-employed (incorporated) (20 | 7.5%), and self-employed (not incorporated) (19 | 7.1%) make up the most common classes of employment.
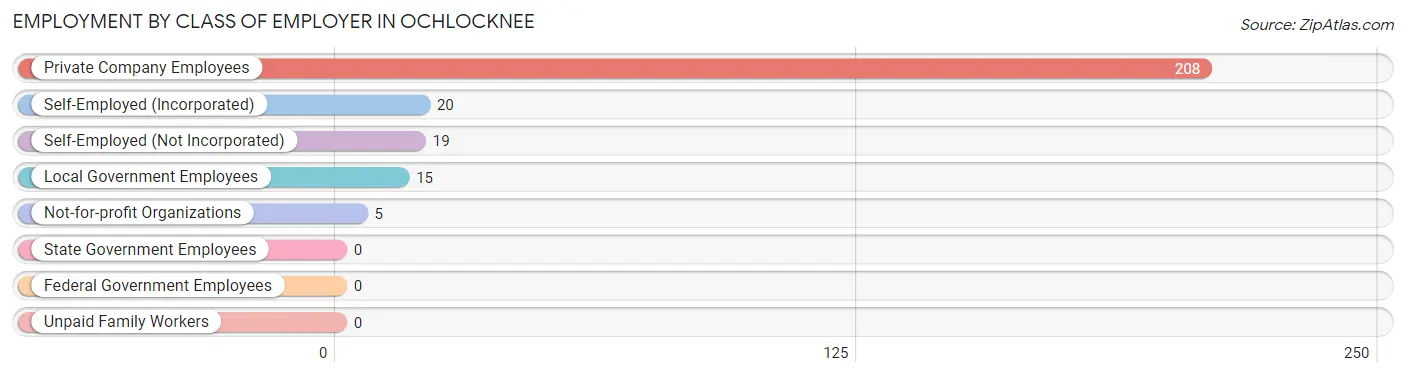
| Employer Class | # Employees | % Employees |
| Private Company Employees | 208 | 77.9% |
| Self-Employed (Incorporated) | 20 | 7.5% |
| Self-Employed (Not Incorporated) | 19 | 7.1% |
| Not-for-profit Organizations | 5 | 1.9% |
| Local Government Employees | 15 | 5.6% |
| State Government Employees | 0 | 0.0% |
| Federal Government Employees | 0 | 0.0% |
| Unpaid Family Workers | 0 | 0.0% |
| Total | 267 | 100.0% |
Employment Status by Age in Ochlocknee
According to the labor force statistics for Ochlocknee, out of the total population over 16 years of age (519), 62.4% or 324 individuals are in the labor force, with 9.3% or 30 of them unemployed. The age group with the highest labor force participation rate is 16 to 19 years, with 100.0% or 31 individuals in the labor force. Within the labor force, the 16 to 19 years age range has the highest percentage of unemployed individuals, with 71.0% or 22 of them being unemployed.
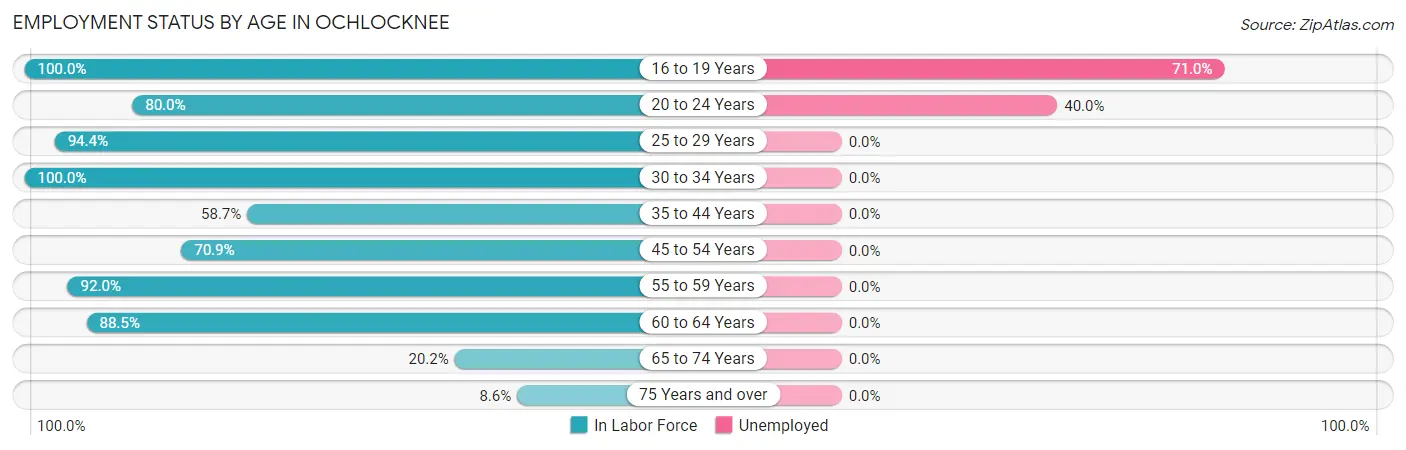
| Age Bracket | In Labor Force | Unemployed |
| 16 to 19 Years | 31 (100.0%) | 22 (71.0%) |
| 20 to 24 Years | 20 (80.0%) | 8 (40.0%) |
| 25 to 29 Years | 68 (94.4%) | 0 (0.0%) |
| 30 to 34 Years | 34 (100.0%) | 0 (0.0%) |
| 35 to 44 Years | 27 (58.7%) | 0 (0.0%) |
| 45 to 54 Years | 73 (70.9%) | 0 (0.0%) |
| 55 to 59 Years | 23 (92.0%) | 0 (0.0%) |
| 60 to 64 Years | 23 (88.5%) | 0 (0.0%) |
| 65 to 74 Years | 20 (20.2%) | 0 (0.0%) |
| 75 Years and over | 5 (8.6%) | 0 (0.0%) |
| Total | 324 (62.4%) | 30 (9.3%) |
Employment Status by Educational Attainment in Ochlocknee
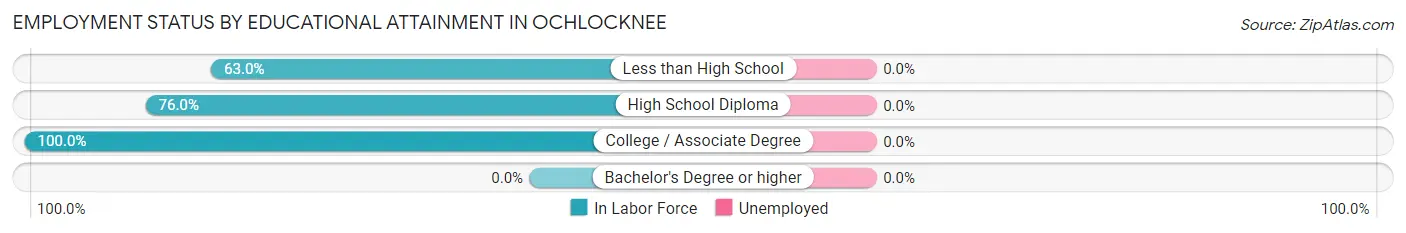
| Educational Attainment | In Labor Force | Unemployed |
| Less than High School | 34 (63.0%) | 0 (0.0%) |
| High School Diploma | 114 (76.0%) | 0 (0.0%) |
| College / Associate Degree | 100 (100.0%) | 0 (0.0%) |
| Bachelor's Degree or higher | 0 (0.0%) | 0 (0.0%) |
| Total | 248 (81.0%) | 0 (0.0%) |
Employment Occupations by Sex in Ochlocknee
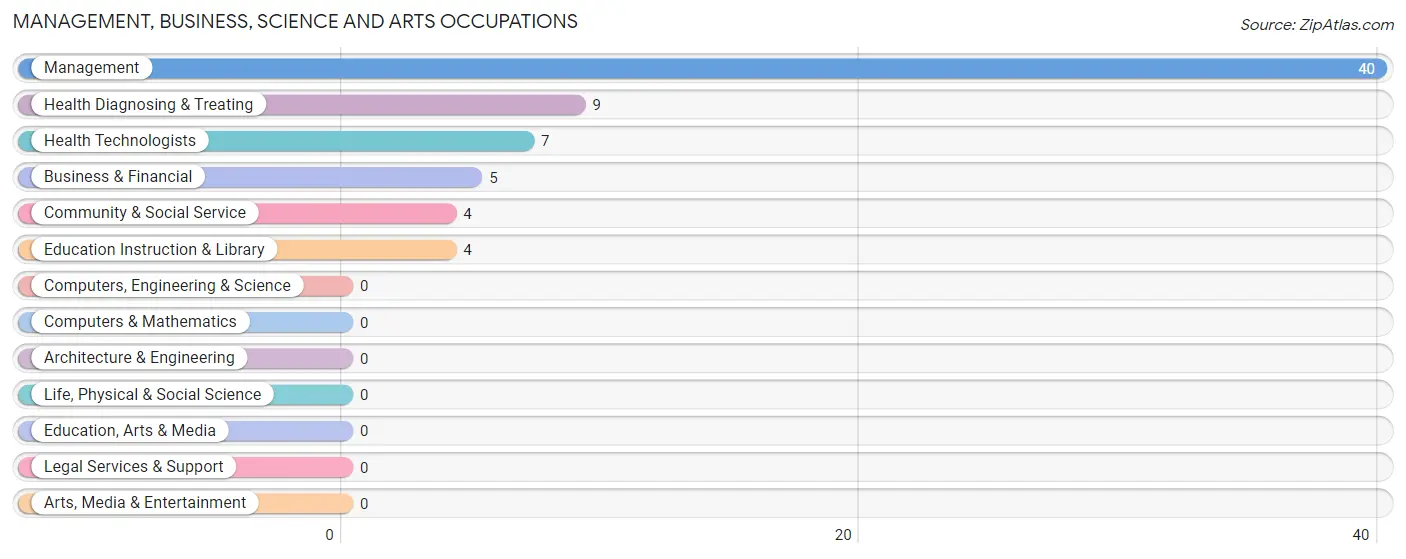
Management, Business, Science and Arts Occupations
The most common Management, Business, Science and Arts occupations in Ochlocknee are Management (40 | 13.6%), Health Diagnosing & Treating (9 | 3.1%), Health Technologists (7 | 2.4%), Business & Financial (5 | 1.7%), and Community & Social Service (4 | 1.4%).
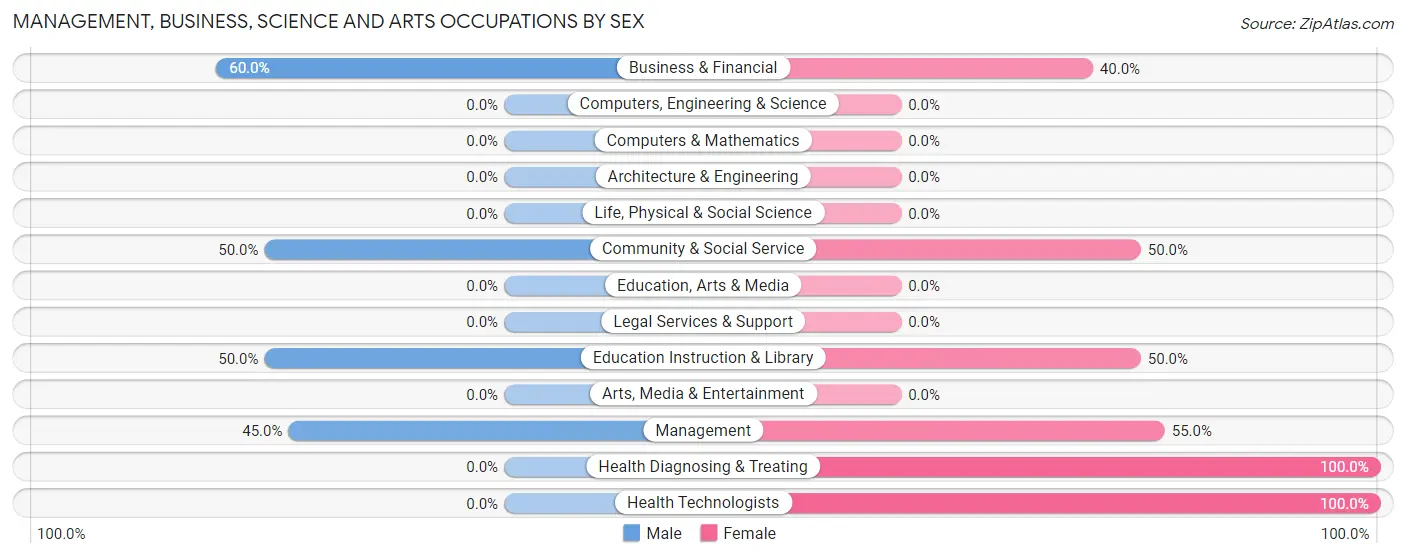
Management, Business, Science and Arts Occupations by Sex
Within the Management, Business, Science and Arts occupations in Ochlocknee, the most male-oriented occupations are Business & Financial (60.0%), Community & Social Service (50.0%), and Education Instruction & Library (50.0%), while the most female-oriented occupations are Health Diagnosing & Treating (100.0%), Health Technologists (100.0%), and Management (55.0%).
| Occupation | Male | Female |
| Management | 18 (45.0%) | 22 (55.0%) |
| Business & Financial | 3 (60.0%) | 2 (40.0%) |
| Computers, Engineering & Science | 0 (0.0%) | 0 (0.0%) |
| Computers & Mathematics | 0 (0.0%) | 0 (0.0%) |
| Architecture & Engineering | 0 (0.0%) | 0 (0.0%) |
| Life, Physical & Social Science | 0 (0.0%) | 0 (0.0%) |
| Community & Social Service | 2 (50.0%) | 2 (50.0%) |
| Education, Arts & Media | 0 (0.0%) | 0 (0.0%) |
| Legal Services & Support | 0 (0.0%) | 0 (0.0%) |
| Education Instruction & Library | 2 (50.0%) | 2 (50.0%) |
| Arts, Media & Entertainment | 0 (0.0%) | 0 (0.0%) |
| Health Diagnosing & Treating | 0 (0.0%) | 9 (100.0%) |
| Health Technologists | 0 (0.0%) | 7 (100.0%) |
| Total (Category) | 23 (39.7%) | 35 (60.3%) |
| Total (Overall) | 167 (56.8%) | 127 (43.2%) |
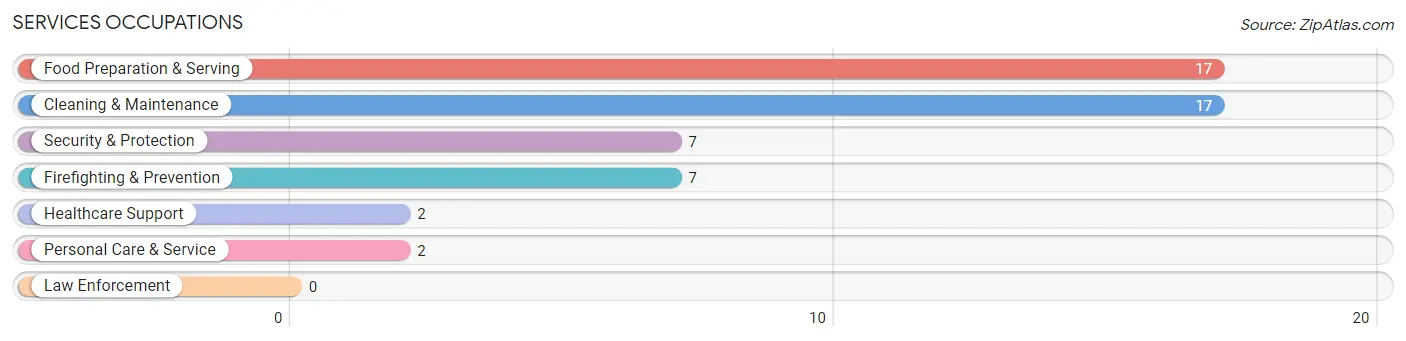
Services Occupations
The most common Services occupations in Ochlocknee are Food Preparation & Serving (17 | 5.8%), Cleaning & Maintenance (17 | 5.8%), Security & Protection (7 | 2.4%), Firefighting & Prevention (7 | 2.4%), and Healthcare Support (2 | 0.7%).
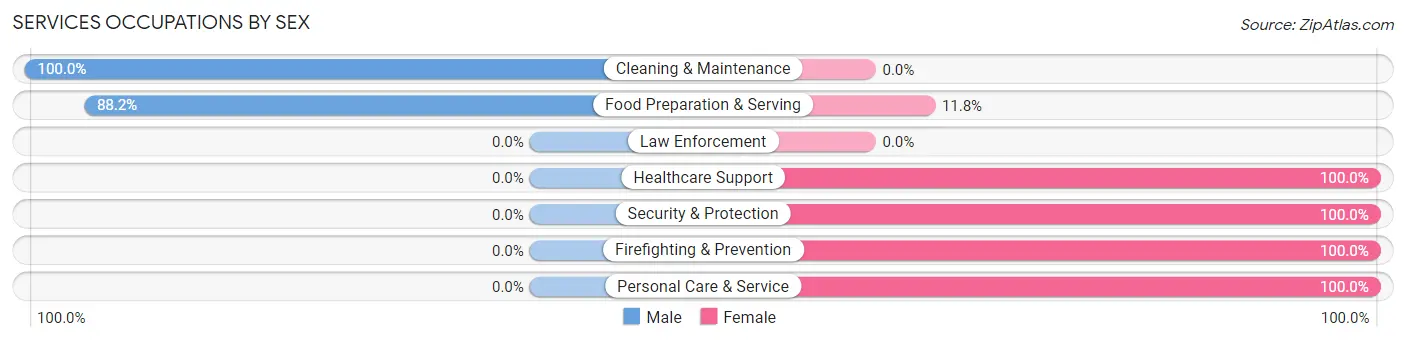
Services Occupations by Sex
Within the Services occupations in Ochlocknee, the most male-oriented occupations are Cleaning & Maintenance (100.0%), and Food Preparation & Serving (88.2%), while the most female-oriented occupations are Healthcare Support (100.0%), Security & Protection (100.0%), and Firefighting & Prevention (100.0%).
| Occupation | Male | Female |
| Healthcare Support | 0 (0.0%) | 2 (100.0%) |
| Security & Protection | 0 (0.0%) | 7 (100.0%) |
| Firefighting & Prevention | 0 (0.0%) | 7 (100.0%) |
| Law Enforcement | 0 (0.0%) | 0 (0.0%) |
| Food Preparation & Serving | 15 (88.2%) | 2 (11.8%) |
| Cleaning & Maintenance | 17 (100.0%) | 0 (0.0%) |
| Personal Care & Service | 0 (0.0%) | 2 (100.0%) |
| Total (Category) | 32 (71.1%) | 13 (28.9%) |
| Total (Overall) | 167 (56.8%) | 127 (43.2%) |
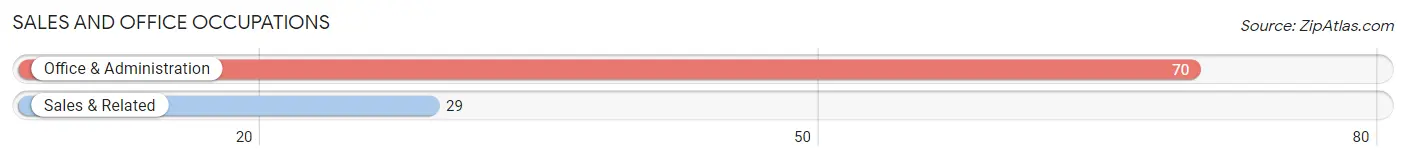
Sales and Office Occupations
The most common Sales and Office occupations in Ochlocknee are Office & Administration (70 | 23.8%), and Sales & Related (29 | 9.9%).
Sales and Office Occupations by Sex

| Occupation | Male | Female |
| Sales & Related | 0 (0.0%) | 29 (100.0%) |
| Office & Administration | 30 (42.9%) | 40 (57.1%) |
| Total (Category) | 30 (30.3%) | 69 (69.7%) |
| Total (Overall) | 167 (56.8%) | 127 (43.2%) |
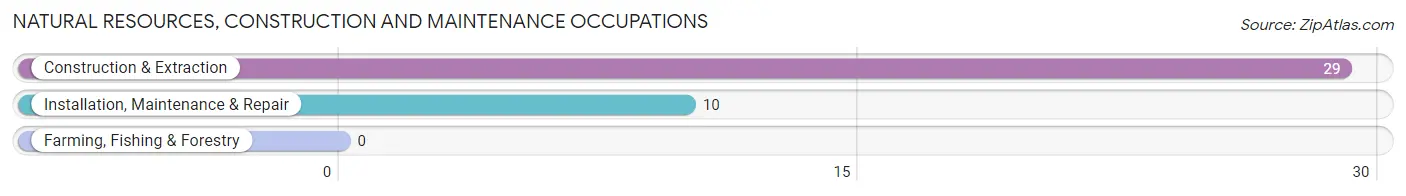
Natural Resources, Construction and Maintenance Occupations
The most common Natural Resources, Construction and Maintenance occupations in Ochlocknee are Construction & Extraction (29 | 9.9%), and Installation, Maintenance & Repair (10 | 3.4%).
Natural Resources, Construction and Maintenance Occupations by Sex

| Occupation | Male | Female |
| Farming, Fishing & Forestry | 0 (0.0%) | 0 (0.0%) |
| Construction & Extraction | 29 (100.0%) | 0 (0.0%) |
| Installation, Maintenance & Repair | 10 (100.0%) | 0 (0.0%) |
| Total (Category) | 39 (100.0%) | 0 (0.0%) |
| Total (Overall) | 167 (56.8%) | 127 (43.2%) |
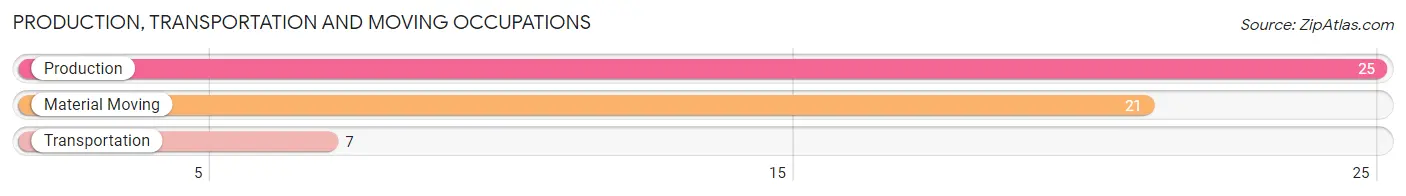
Production, Transportation and Moving Occupations
The most common Production, Transportation and Moving occupations in Ochlocknee are Production (25 | 8.5%), Material Moving (21 | 7.1%), and Transportation (7 | 2.4%).
Production, Transportation and Moving Occupations by Sex
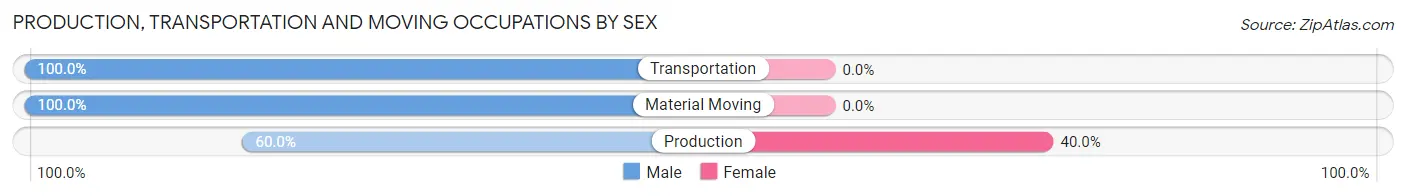
| Occupation | Male | Female |
| Production | 15 (60.0%) | 10 (40.0%) |
| Transportation | 7 (100.0%) | 0 (0.0%) |
| Material Moving | 21 (100.0%) | 0 (0.0%) |
| Total (Category) | 43 (81.1%) | 10 (18.9%) |
| Total (Overall) | 167 (56.8%) | 127 (43.2%) |
Employment Industries by Sex in Ochlocknee
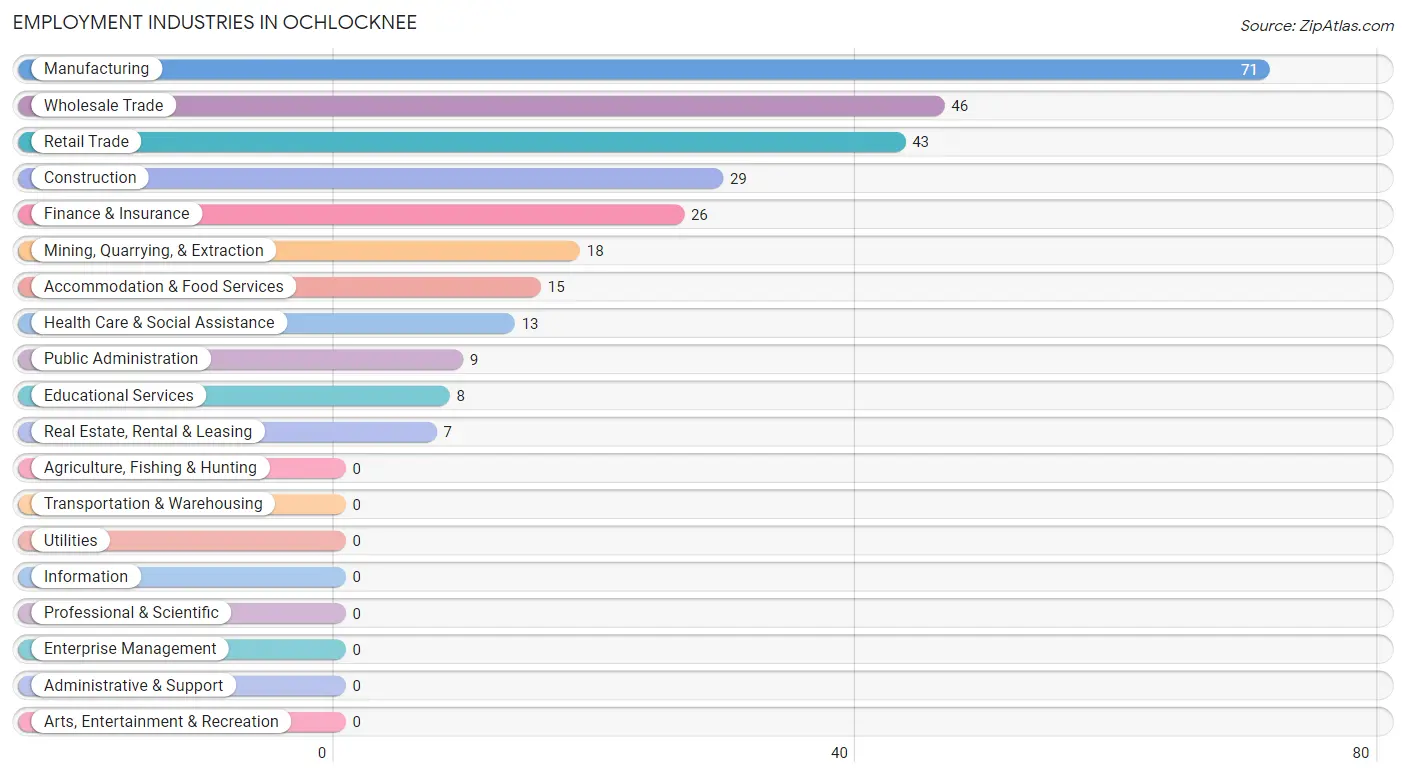
Employment Industries in Ochlocknee
The major employment industries in Ochlocknee include Manufacturing (71 | 24.1%), Wholesale Trade (46 | 15.7%), Retail Trade (43 | 14.6%), Construction (29 | 9.9%), and Finance & Insurance (26 | 8.8%).
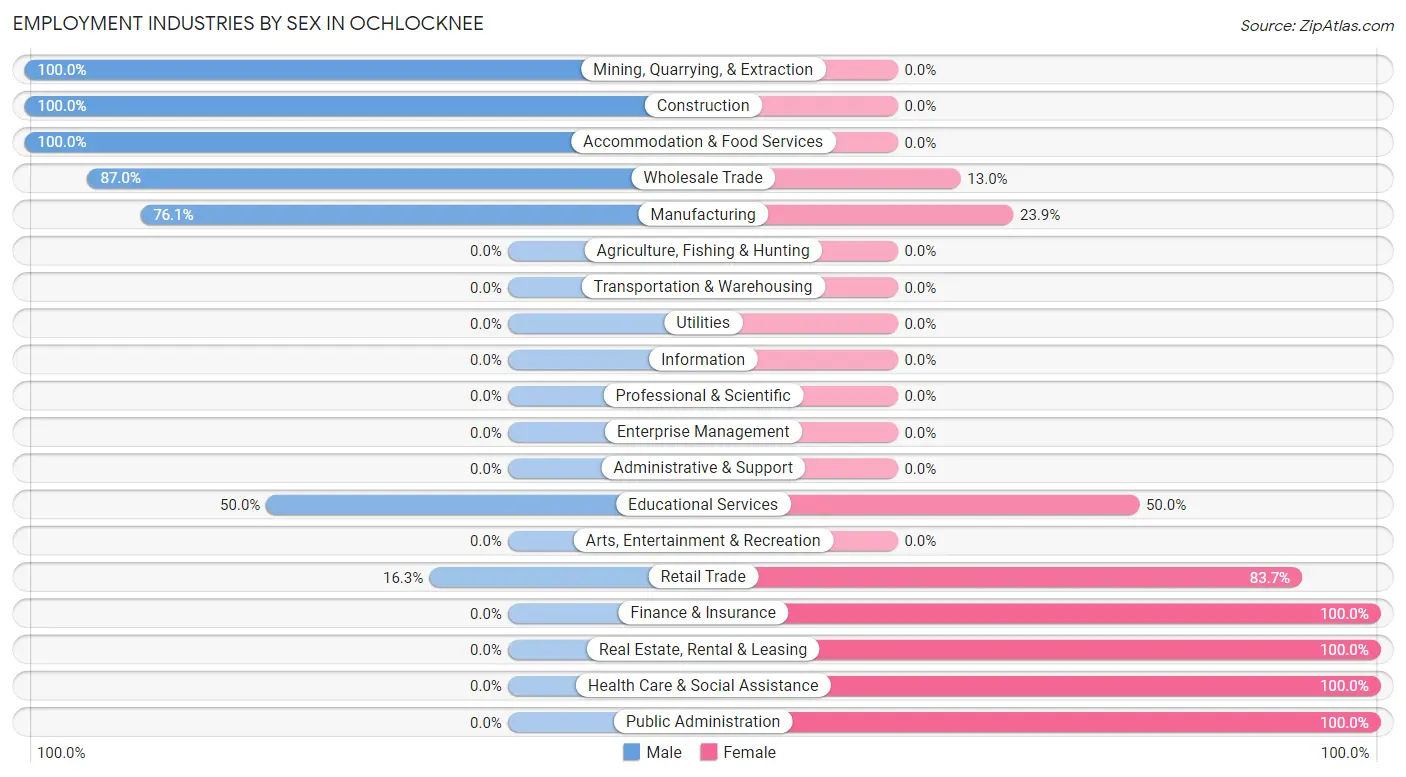
Employment Industries by Sex in Ochlocknee
The Ochlocknee industries that see more men than women are Mining, Quarrying, & Extraction (100.0%), Construction (100.0%), and Accommodation & Food Services (100.0%), whereas the industries that tend to have a higher number of women are Finance & Insurance (100.0%), Real Estate, Rental & Leasing (100.0%), and Health Care & Social Assistance (100.0%).
| Industry | Male | Female |
| Agriculture, Fishing & Hunting | 0 (0.0%) | 0 (0.0%) |
| Mining, Quarrying, & Extraction | 18 (100.0%) | 0 (0.0%) |
| Construction | 29 (100.0%) | 0 (0.0%) |
| Manufacturing | 54 (76.1%) | 17 (23.9%) |
| Wholesale Trade | 40 (87.0%) | 6 (13.0%) |
| Retail Trade | 7 (16.3%) | 36 (83.7%) |
| Transportation & Warehousing | 0 (0.0%) | 0 (0.0%) |
| Utilities | 0 (0.0%) | 0 (0.0%) |
| Information | 0 (0.0%) | 0 (0.0%) |
| Finance & Insurance | 0 (0.0%) | 26 (100.0%) |
| Real Estate, Rental & Leasing | 0 (0.0%) | 7 (100.0%) |
| Professional & Scientific | 0 (0.0%) | 0 (0.0%) |
| Enterprise Management | 0 (0.0%) | 0 (0.0%) |
| Administrative & Support | 0 (0.0%) | 0 (0.0%) |
| Educational Services | 4 (50.0%) | 4 (50.0%) |
| Health Care & Social Assistance | 0 (0.0%) | 13 (100.0%) |
| Arts, Entertainment & Recreation | 0 (0.0%) | 0 (0.0%) |
| Accommodation & Food Services | 15 (100.0%) | 0 (0.0%) |
| Public Administration | 0 (0.0%) | 9 (100.0%) |
| Total | 167 (56.8%) | 127 (43.2%) |
Education in Ochlocknee
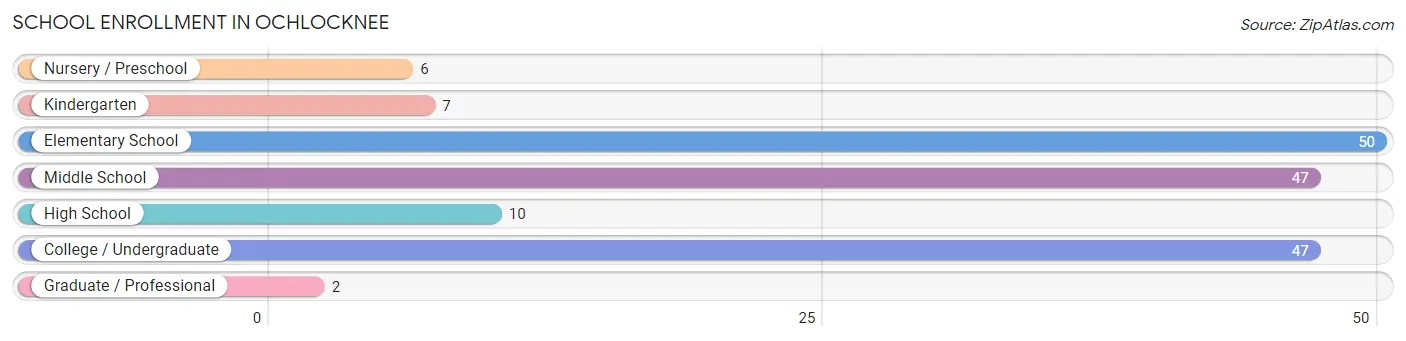
School Enrollment in Ochlocknee
The most common levels of schooling among the 169 students in Ochlocknee are elementary school (50 | 29.6%), middle school (47 | 27.8%), and college / undergraduate (47 | 27.8%).
| School Level | # Students | % Students |
| Nursery / Preschool | 6 | 3.5% |
| Kindergarten | 7 | 4.1% |
| Elementary School | 50 | 29.6% |
| Middle School | 47 | 27.8% |
| High School | 10 | 5.9% |
| College / Undergraduate | 47 | 27.8% |
| Graduate / Professional | 2 | 1.2% |
| Total | 169 | 100.0% |
School Enrollment by Age by Funding Source in Ochlocknee
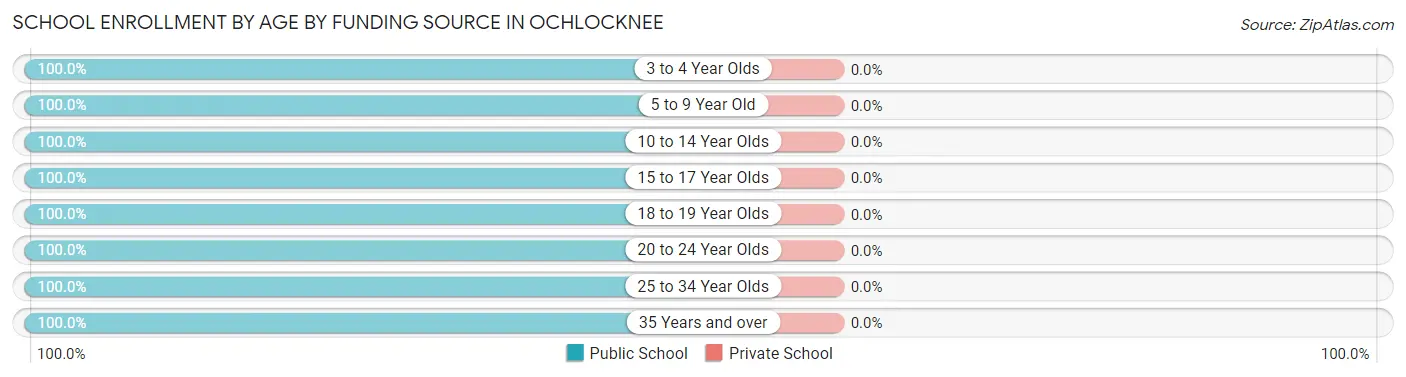
| Age Bracket | Public School | Private School |
| 3 to 4 Year Olds | 3 (100.0%) | 0 (0.0%) |
| 5 to 9 Year Old | 50 (100.0%) | 0 (0.0%) |
| 10 to 14 Year Olds | 57 (100.0%) | 0 (0.0%) |
| 15 to 17 Year Olds | 10 (100.0%) | 0 (0.0%) |
| 18 to 19 Year Olds | 31 (100.0%) | 0 (0.0%) |
| 20 to 24 Year Olds | 10 (100.0%) | 0 (0.0%) |
| 25 to 34 Year Olds | 6 (100.0%) | 0 (0.0%) |
| 35 Years and over | 2 (100.0%) | 0 (0.0%) |
| Total | 169 (100.0%) | 0 (0.0%) |
Educational Attainment by Field of Study in Ochlocknee
Science & technology (3 | 42.9%), engineering (2 | 28.6%), and business (2 | 28.6%) are the most common fields of study among 7 individuals in Ochlocknee who have obtained a bachelor's degree or higher.
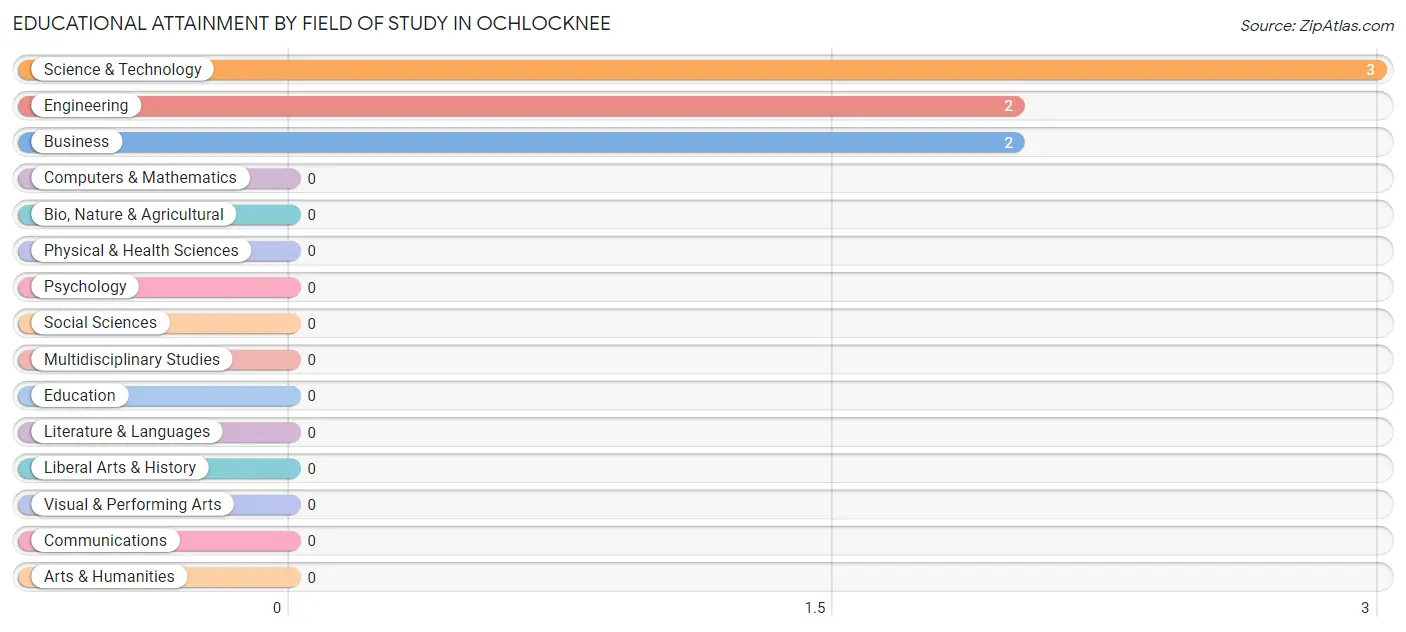
| Field of Study | # Graduates | % Graduates |
| Computers & Mathematics | 0 | 0.0% |
| Bio, Nature & Agricultural | 0 | 0.0% |
| Physical & Health Sciences | 0 | 0.0% |
| Psychology | 0 | 0.0% |
| Social Sciences | 0 | 0.0% |
| Engineering | 2 | 28.6% |
| Multidisciplinary Studies | 0 | 0.0% |
| Science & Technology | 3 | 42.9% |
| Business | 2 | 28.6% |
| Education | 0 | 0.0% |
| Literature & Languages | 0 | 0.0% |
| Liberal Arts & History | 0 | 0.0% |
| Visual & Performing Arts | 0 | 0.0% |
| Communications | 0 | 0.0% |
| Arts & Humanities | 0 | 0.0% |
| Total | 7 | 100.0% |
Transportation & Commute in Ochlocknee
Vehicle Availability by Sex in Ochlocknee
The most prevalent vehicle ownership categories in Ochlocknee are males with 2 vehicles (72, accounting for 50.7%) and females with 2 vehicles (59, making up 57.6%).
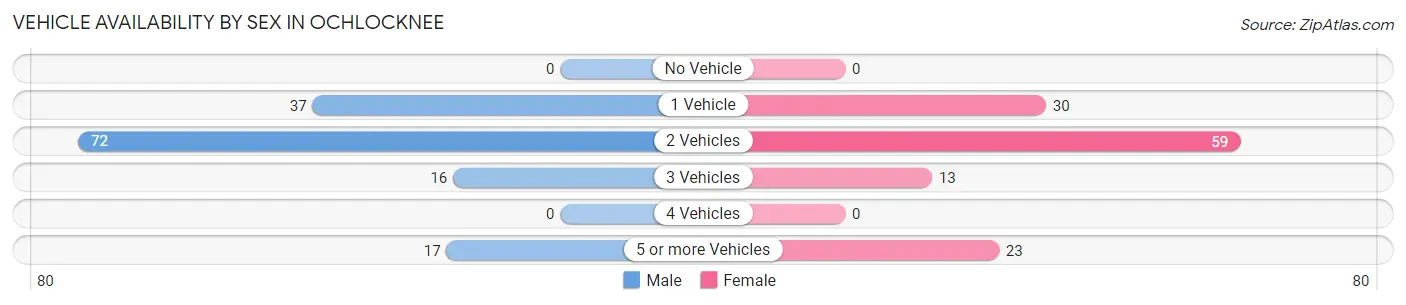
| Vehicles Available | Male | Female |
| No Vehicle | 0 (0.0%) | 0 (0.0%) |
| 1 Vehicle | 37 (26.1%) | 30 (24.0%) |
| 2 Vehicles | 72 (50.7%) | 59 (47.2%) |
| 3 Vehicles | 16 (11.3%) | 13 (10.4%) |
| 4 Vehicles | 0 (0.0%) | 0 (0.0%) |
| 5 or more Vehicles | 17 (12.0%) | 23 (18.4%) |
| Total | 142 (100.0%) | 125 (100.0%) |
Commute Time in Ochlocknee
The most frequently occuring commute durations in Ochlocknee are 20 to 24 minutes (56 commuters, 23.1%), 15 to 19 minutes (50 commuters, 20.6%), and 30 to 34 minutes (50 commuters, 20.6%).
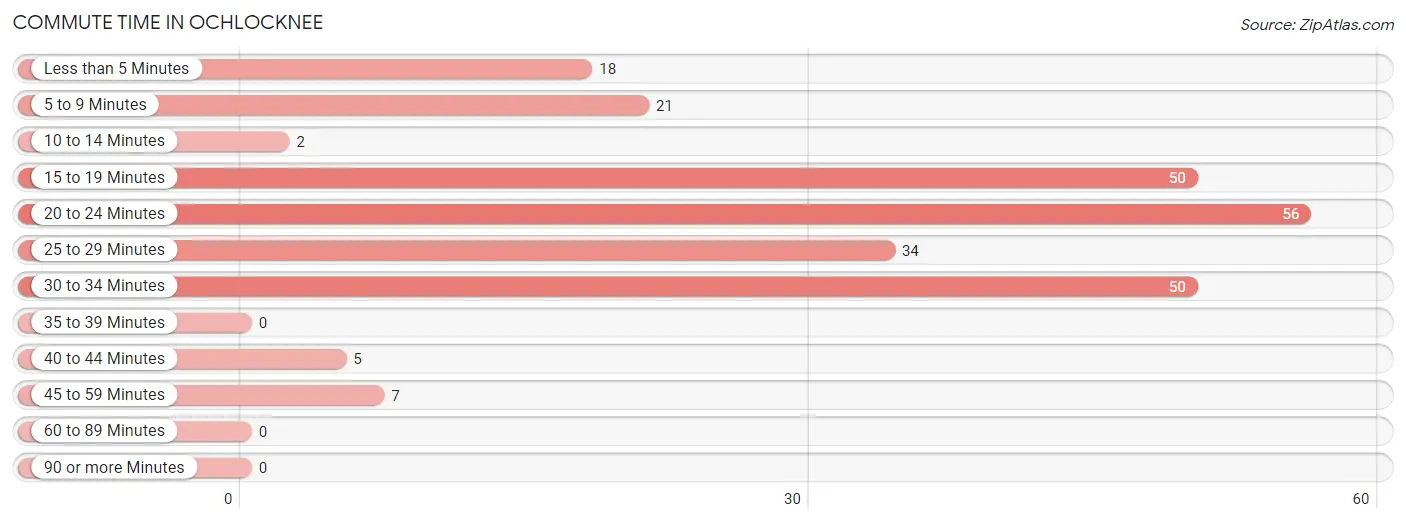
| Commute Time | # Commuters | % Commuters |
| Less than 5 Minutes | 18 | 7.4% |
| 5 to 9 Minutes | 21 | 8.6% |
| 10 to 14 Minutes | 2 | 0.8% |
| 15 to 19 Minutes | 50 | 20.6% |
| 20 to 24 Minutes | 56 | 23.1% |
| 25 to 29 Minutes | 34 | 14.0% |
| 30 to 34 Minutes | 50 | 20.6% |
| 35 to 39 Minutes | 0 | 0.0% |
| 40 to 44 Minutes | 5 | 2.1% |
| 45 to 59 Minutes | 7 | 2.9% |
| 60 to 89 Minutes | 0 | 0.0% |
| 90 or more Minutes | 0 | 0.0% |
Commute Time by Sex in Ochlocknee
The most common commute times in Ochlocknee are 30 to 34 minutes (35 commuters, 26.3%) for males and 20 to 24 minutes (27 commuters, 24.5%) for females.
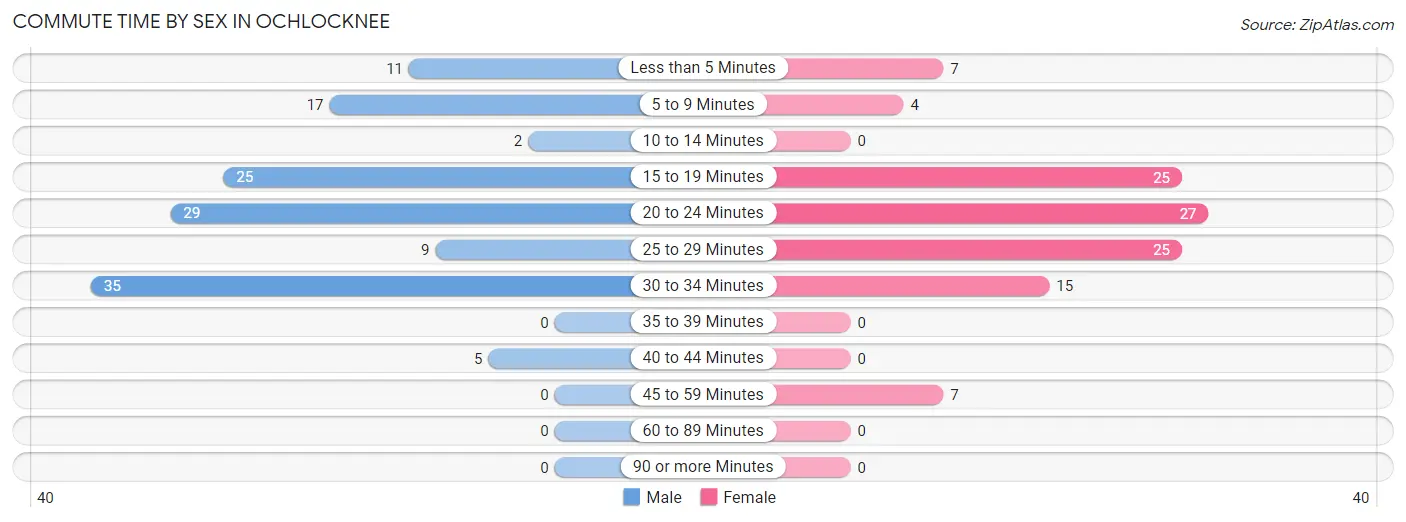
| Commute Time | Male | Female |
| Less than 5 Minutes | 11 (8.3%) | 7 (6.4%) |
| 5 to 9 Minutes | 17 (12.8%) | 4 (3.6%) |
| 10 to 14 Minutes | 2 (1.5%) | 0 (0.0%) |
| 15 to 19 Minutes | 25 (18.8%) | 25 (22.7%) |
| 20 to 24 Minutes | 29 (21.8%) | 27 (24.5%) |
| 25 to 29 Minutes | 9 (6.8%) | 25 (22.7%) |
| 30 to 34 Minutes | 35 (26.3%) | 15 (13.6%) |
| 35 to 39 Minutes | 0 (0.0%) | 0 (0.0%) |
| 40 to 44 Minutes | 5 (3.8%) | 0 (0.0%) |
| 45 to 59 Minutes | 0 (0.0%) | 7 (6.4%) |
| 60 to 89 Minutes | 0 (0.0%) | 0 (0.0%) |
| 90 or more Minutes | 0 (0.0%) | 0 (0.0%) |
Time of Departure to Work by Sex in Ochlocknee
The most frequent times of departure to work in Ochlocknee are 8:00 AM to 8:29 AM (36, 27.1%) for males and 7:00 AM to 7:29 AM (65, 59.1%) for females.
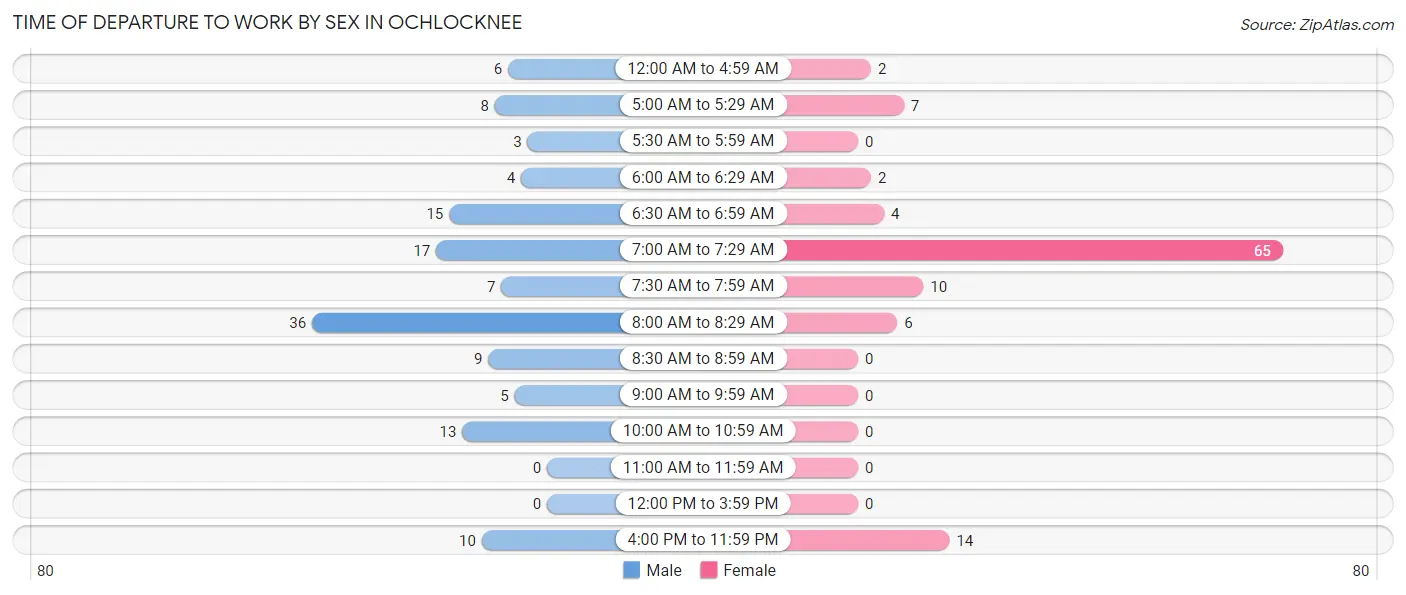
| Time of Departure | Male | Female |
| 12:00 AM to 4:59 AM | 6 (4.5%) | 2 (1.8%) |
| 5:00 AM to 5:29 AM | 8 (6.0%) | 7 (6.4%) |
| 5:30 AM to 5:59 AM | 3 (2.3%) | 0 (0.0%) |
| 6:00 AM to 6:29 AM | 4 (3.0%) | 2 (1.8%) |
| 6:30 AM to 6:59 AM | 15 (11.3%) | 4 (3.6%) |
| 7:00 AM to 7:29 AM | 17 (12.8%) | 65 (59.1%) |
| 7:30 AM to 7:59 AM | 7 (5.3%) | 10 (9.1%) |
| 8:00 AM to 8:29 AM | 36 (27.1%) | 6 (5.4%) |
| 8:30 AM to 8:59 AM | 9 (6.8%) | 0 (0.0%) |
| 9:00 AM to 9:59 AM | 5 (3.8%) | 0 (0.0%) |
| 10:00 AM to 10:59 AM | 13 (9.8%) | 0 (0.0%) |
| 11:00 AM to 11:59 AM | 0 (0.0%) | 0 (0.0%) |
| 12:00 PM to 3:59 PM | 0 (0.0%) | 0 (0.0%) |
| 4:00 PM to 11:59 PM | 10 (7.5%) | 14 (12.7%) |
| Total | 133 (100.0%) | 110 (100.0%) |
Housing Occupancy in Ochlocknee
Occupancy by Ownership in Ochlocknee
Of the total 252 dwellings in Ochlocknee, owner-occupied units account for 140 (55.6%), while renter-occupied units make up 112 (44.4%).
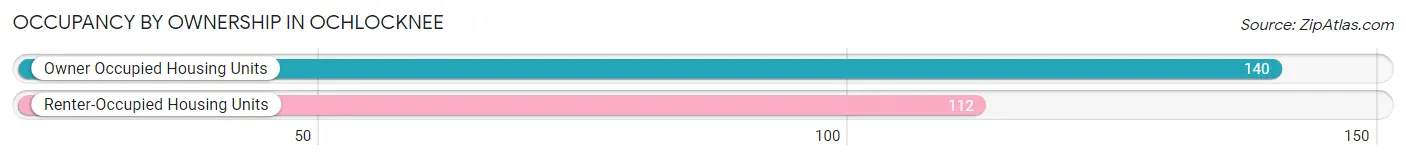
| Occupancy | # Housing Units | % Housing Units |
| Owner Occupied Housing Units | 140 | 55.6% |
| Renter-Occupied Housing Units | 112 | 44.4% |
| Total Occupied Housing Units | 252 | 100.0% |
Occupancy by Household Size in Ochlocknee
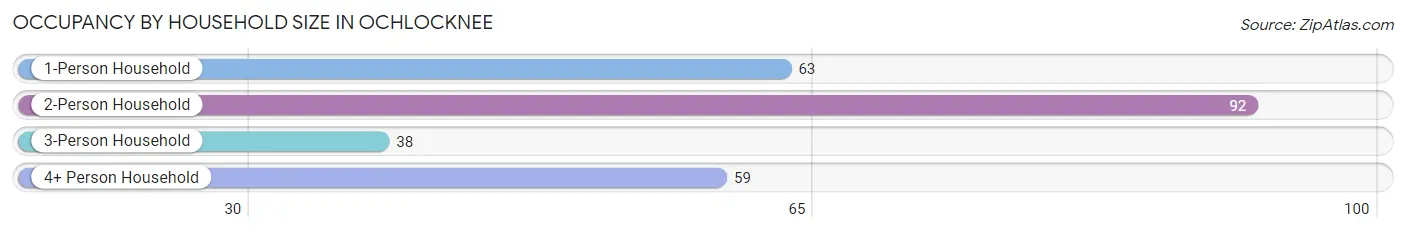
| Household Size | # Housing Units | % Housing Units |
| 1-Person Household | 63 | 25.0% |
| 2-Person Household | 92 | 36.5% |
| 3-Person Household | 38 | 15.1% |
| 4+ Person Household | 59 | 23.4% |
| Total Housing Units | 252 | 100.0% |
Occupancy by Ownership by Household Size in Ochlocknee
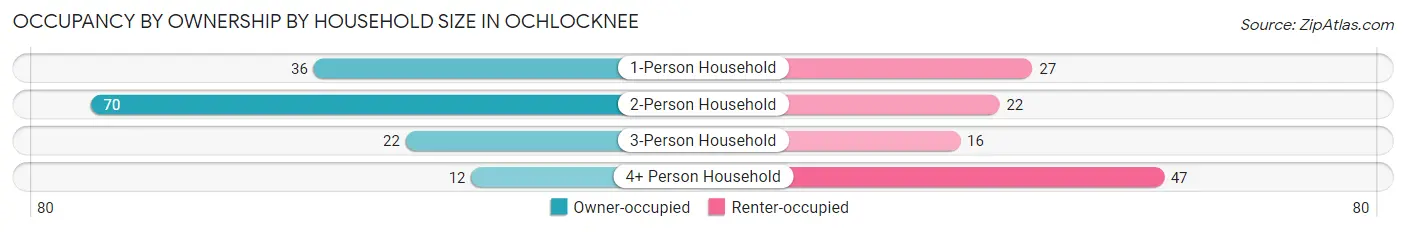
| Household Size | Owner-occupied | Renter-occupied |
| 1-Person Household | 36 (57.1%) | 27 (42.9%) |
| 2-Person Household | 70 (76.1%) | 22 (23.9%) |
| 3-Person Household | 22 (57.9%) | 16 (42.1%) |
| 4+ Person Household | 12 (20.3%) | 47 (79.7%) |
| Total Housing Units | 140 (55.6%) | 112 (44.4%) |
Occupancy by Educational Attainment in Ochlocknee
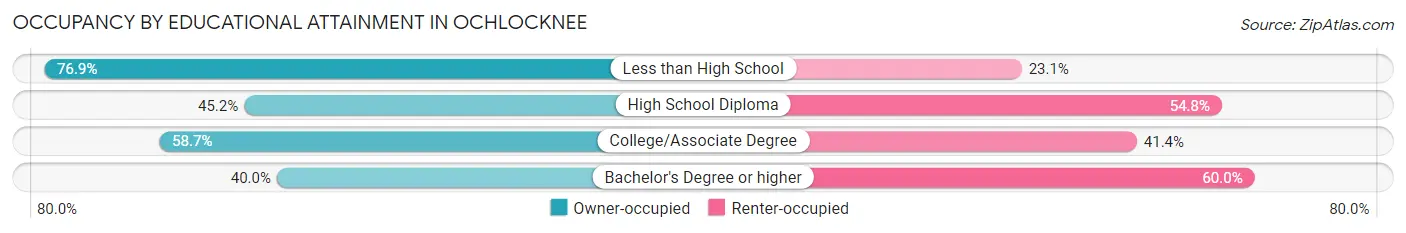
| Household Size | Owner-occupied | Renter-occupied |
| Less than High School | 30 (76.9%) | 9 (23.1%) |
| High School Diploma | 47 (45.2%) | 57 (54.8%) |
| College/Associate Degree | 61 (58.7%) | 43 (41.3%) |
| Bachelor's Degree or higher | 2 (40.0%) | 3 (60.0%) |
Occupancy by Age of Householder in Ochlocknee
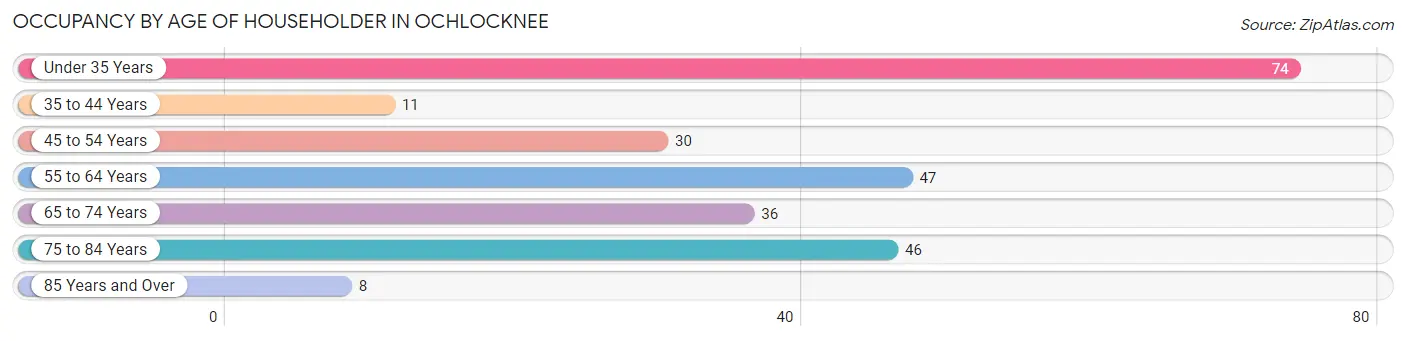
| Age Bracket | # Households | % Households |
| Under 35 Years | 74 | 29.4% |
| 35 to 44 Years | 11 | 4.4% |
| 45 to 54 Years | 30 | 11.9% |
| 55 to 64 Years | 47 | 18.6% |
| 65 to 74 Years | 36 | 14.3% |
| 75 to 84 Years | 46 | 18.2% |
| 85 Years and Over | 8 | 3.2% |
| Total | 252 | 100.0% |
Housing Finances in Ochlocknee
Median Income by Occupancy in Ochlocknee
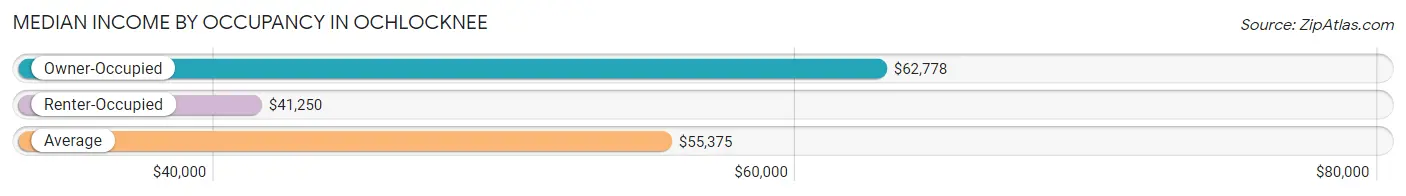
| Occupancy Type | # Households | Median Income |
| Owner-Occupied | 140 (55.6%) | $62,778 |
| Renter-Occupied | 112 (44.4%) | $41,250 |
| Average | 252 (100.0%) | $55,375 |
Occupancy by Householder Income Bracket in Ochlocknee
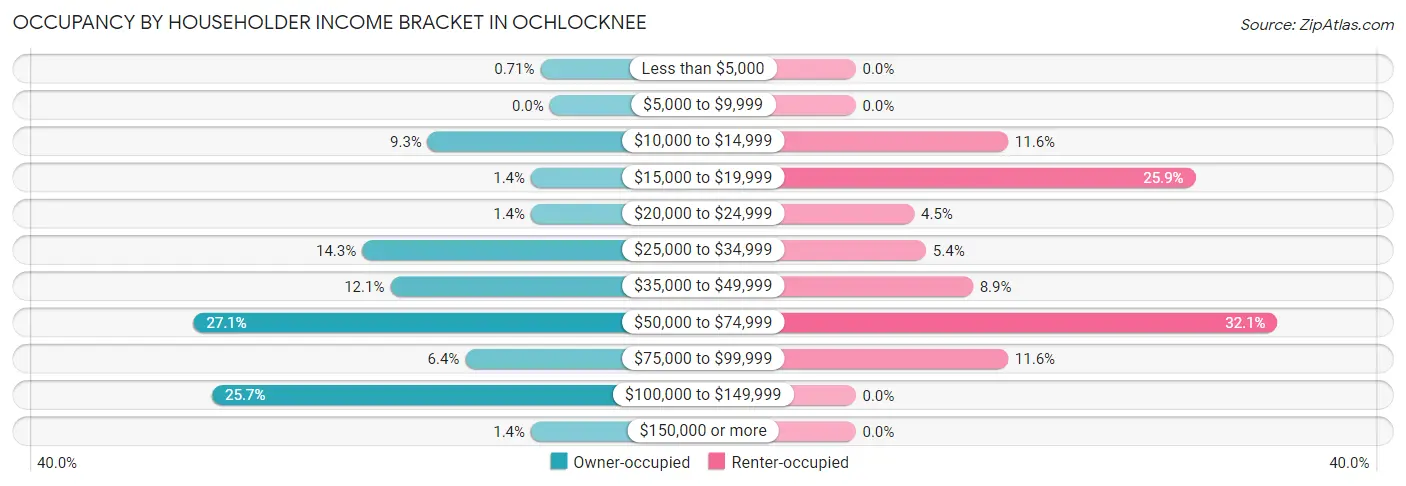
| Income Bracket | Owner-occupied | Renter-occupied |
| Less than $5,000 | 1 (0.7%) | 0 (0.0%) |
| $5,000 to $9,999 | 0 (0.0%) | 0 (0.0%) |
| $10,000 to $14,999 | 13 (9.3%) | 13 (11.6%) |
| $15,000 to $19,999 | 2 (1.4%) | 29 (25.9%) |
| $20,000 to $24,999 | 2 (1.4%) | 5 (4.5%) |
| $25,000 to $34,999 | 20 (14.3%) | 6 (5.4%) |
| $35,000 to $49,999 | 17 (12.1%) | 10 (8.9%) |
| $50,000 to $74,999 | 38 (27.1%) | 36 (32.1%) |
| $75,000 to $99,999 | 9 (6.4%) | 13 (11.6%) |
| $100,000 to $149,999 | 36 (25.7%) | 0 (0.0%) |
| $150,000 or more | 2 (1.4%) | 0 (0.0%) |
| Total | 140 (100.0%) | 112 (100.0%) |
Monthly Housing Cost Tiers in Ochlocknee
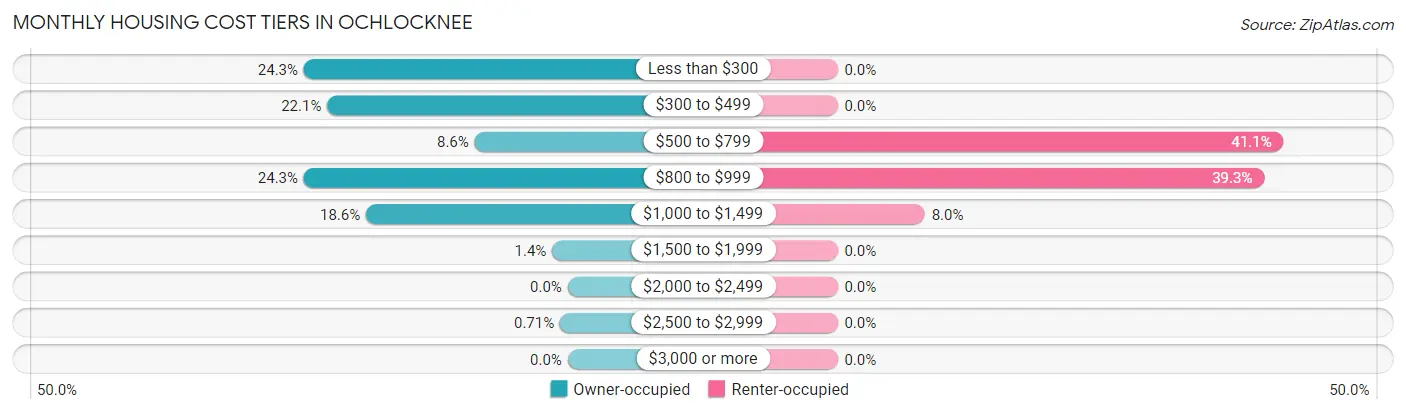
| Monthly Cost | Owner-occupied | Renter-occupied |
| Less than $300 | 34 (24.3%) | 0 (0.0%) |
| $300 to $499 | 31 (22.1%) | 0 (0.0%) |
| $500 to $799 | 12 (8.6%) | 46 (41.1%) |
| $800 to $999 | 34 (24.3%) | 44 (39.3%) |
| $1,000 to $1,499 | 26 (18.6%) | 9 (8.0%) |
| $1,500 to $1,999 | 2 (1.4%) | 0 (0.0%) |
| $2,000 to $2,499 | 0 (0.0%) | 0 (0.0%) |
| $2,500 to $2,999 | 1 (0.7%) | 0 (0.0%) |
| $3,000 or more | 0 (0.0%) | 0 (0.0%) |
| Total | 140 (100.0%) | 112 (100.0%) |
Physical Housing Characteristics in Ochlocknee
Housing Structures in Ochlocknee
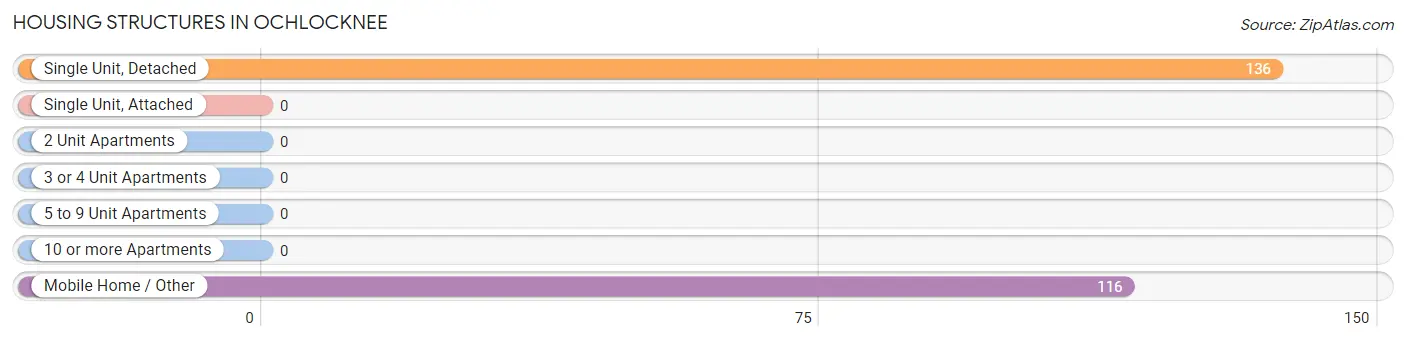
| Structure Type | # Housing Units | % Housing Units |
| Single Unit, Detached | 136 | 54.0% |
| Single Unit, Attached | 0 | 0.0% |
| 2 Unit Apartments | 0 | 0.0% |
| 3 or 4 Unit Apartments | 0 | 0.0% |
| 5 to 9 Unit Apartments | 0 | 0.0% |
| 10 or more Apartments | 0 | 0.0% |
| Mobile Home / Other | 116 | 46.0% |
| Total | 252 | 100.0% |
Housing Structures by Occupancy in Ochlocknee
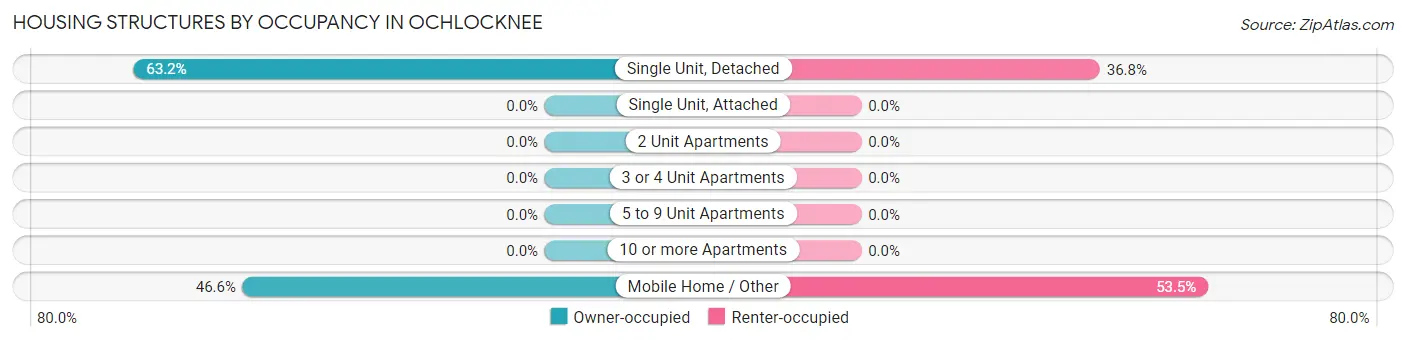
| Structure Type | Owner-occupied | Renter-occupied |
| Single Unit, Detached | 86 (63.2%) | 50 (36.8%) |
| Single Unit, Attached | 0 (0.0%) | 0 (0.0%) |
| 2 Unit Apartments | 0 (0.0%) | 0 (0.0%) |
| 3 or 4 Unit Apartments | 0 (0.0%) | 0 (0.0%) |
| 5 to 9 Unit Apartments | 0 (0.0%) | 0 (0.0%) |
| 10 or more Apartments | 0 (0.0%) | 0 (0.0%) |
| Mobile Home / Other | 54 (46.6%) | 62 (53.4%) |
| Total | 140 (55.6%) | 112 (44.4%) |
Housing Structures by Number of Rooms in Ochlocknee
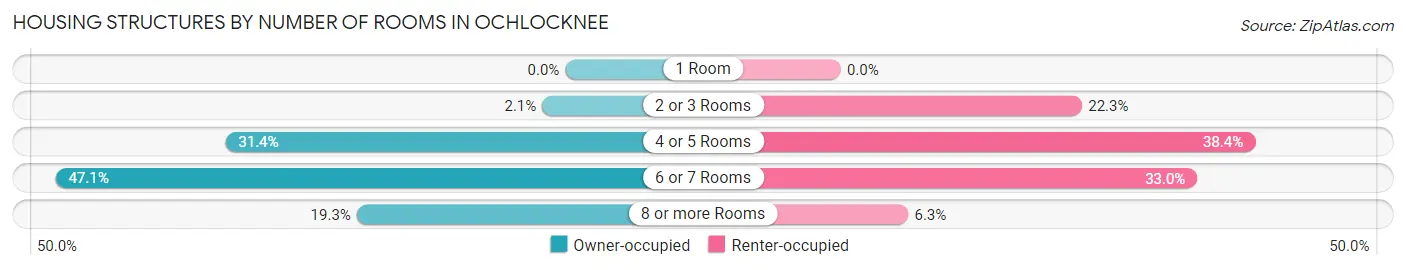
| Number of Rooms | Owner-occupied | Renter-occupied |
| 1 Room | 0 (0.0%) | 0 (0.0%) |
| 2 or 3 Rooms | 3 (2.1%) | 25 (22.3%) |
| 4 or 5 Rooms | 44 (31.4%) | 43 (38.4%) |
| 6 or 7 Rooms | 66 (47.1%) | 37 (33.0%) |
| 8 or more Rooms | 27 (19.3%) | 7 (6.2%) |
| Total | 140 (100.0%) | 112 (100.0%) |
Housing Structure by Heating Type in Ochlocknee
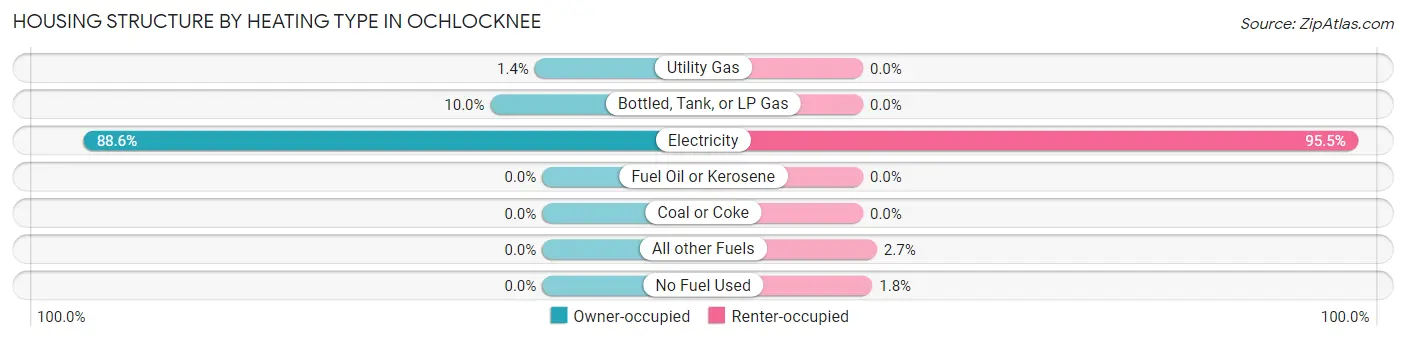
| Heating Type | Owner-occupied | Renter-occupied |
| Utility Gas | 2 (1.4%) | 0 (0.0%) |
| Bottled, Tank, or LP Gas | 14 (10.0%) | 0 (0.0%) |
| Electricity | 124 (88.6%) | 107 (95.5%) |
| Fuel Oil or Kerosene | 0 (0.0%) | 0 (0.0%) |
| Coal or Coke | 0 (0.0%) | 0 (0.0%) |
| All other Fuels | 0 (0.0%) | 3 (2.7%) |
| No Fuel Used | 0 (0.0%) | 2 (1.8%) |
| Total | 140 (100.0%) | 112 (100.0%) |
Household Vehicle Usage in Ochlocknee
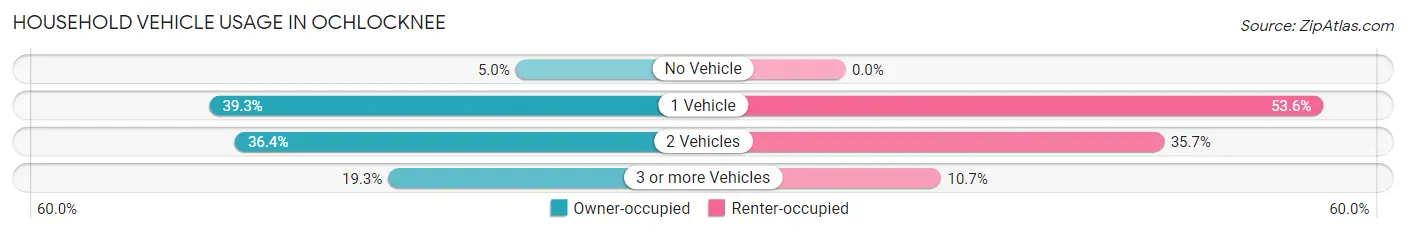
| Vehicles per Household | Owner-occupied | Renter-occupied |
| No Vehicle | 7 (5.0%) | 0 (0.0%) |
| 1 Vehicle | 55 (39.3%) | 60 (53.6%) |
| 2 Vehicles | 51 (36.4%) | 40 (35.7%) |
| 3 or more Vehicles | 27 (19.3%) | 12 (10.7%) |
| Total | 140 (100.0%) | 112 (100.0%) |
Real Estate & Mortgages in Ochlocknee
Real Estate and Mortgage Overview in Ochlocknee
| Characteristic | Without Mortgage | With Mortgage |
| Housing Units | 67 | 73 |
| Median Property Value | $47,500 | $0 |
| Median Household Income | $38,036 | $0 |
| Monthly Housing Costs | $296 | $0 |
| Real Estate Taxes | $557 | $2 |
Property Value by Mortgage Status in Ochlocknee
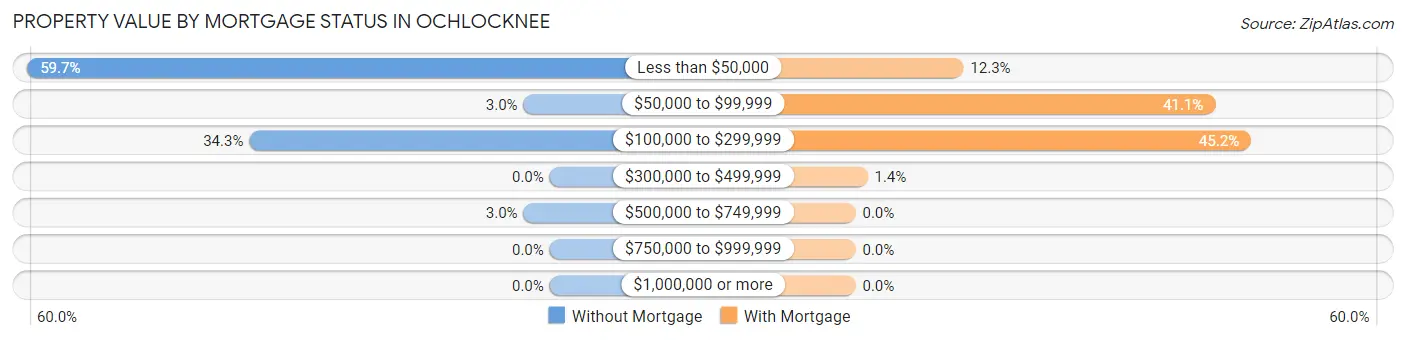
| Property Value | Without Mortgage | With Mortgage |
| Less than $50,000 | 40 (59.7%) | 9 (12.3%) |
| $50,000 to $99,999 | 2 (3.0%) | 30 (41.1%) |
| $100,000 to $299,999 | 23 (34.3%) | 33 (45.2%) |
| $300,000 to $499,999 | 0 (0.0%) | 1 (1.4%) |
| $500,000 to $749,999 | 2 (3.0%) | 0 (0.0%) |
| $750,000 to $999,999 | 0 (0.0%) | 0 (0.0%) |
| $1,000,000 or more | 0 (0.0%) | 0 (0.0%) |
| Total | 67 (100.0%) | 73 (100.0%) |
Household Income by Mortgage Status in Ochlocknee
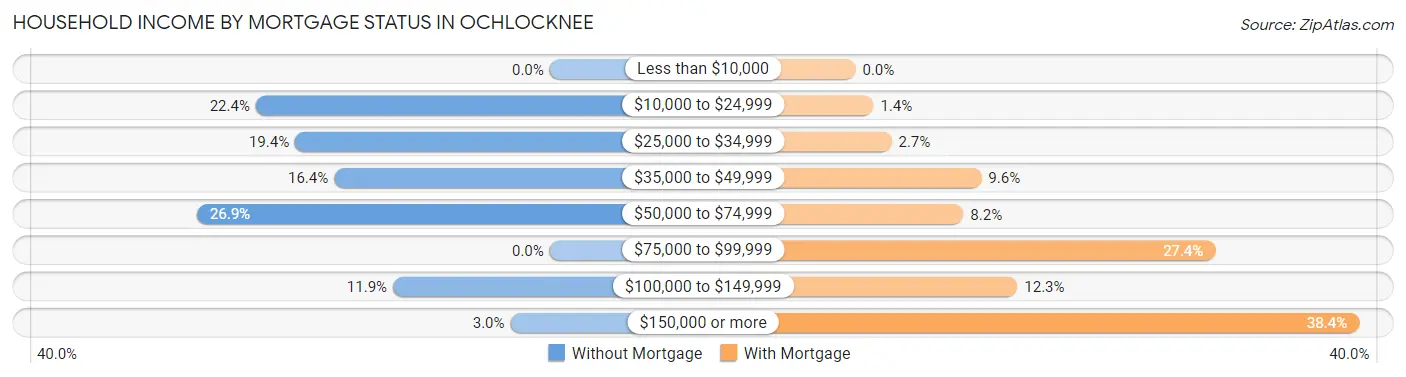
| Household Income | Without Mortgage | With Mortgage |
| Less than $10,000 | 0 (0.0%) | 0 (0.0%) |
| $10,000 to $24,999 | 15 (22.4%) | 1 (1.4%) |
| $25,000 to $34,999 | 13 (19.4%) | 2 (2.7%) |
| $35,000 to $49,999 | 11 (16.4%) | 7 (9.6%) |
| $50,000 to $74,999 | 18 (26.9%) | 6 (8.2%) |
| $75,000 to $99,999 | 0 (0.0%) | 20 (27.4%) |
| $100,000 to $149,999 | 8 (11.9%) | 9 (12.3%) |
| $150,000 or more | 2 (3.0%) | 28 (38.4%) |
| Total | 67 (100.0%) | 73 (100.0%) |
Property Value to Household Income Ratio in Ochlocknee
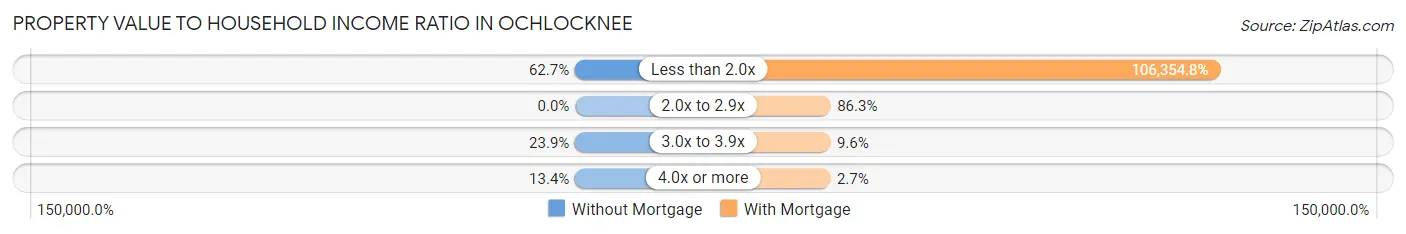
| Value-to-Income Ratio | Without Mortgage | With Mortgage |
| Less than 2.0x | 42 (62.7%) | 77,639 (106,354.8%) |
| 2.0x to 2.9x | 0 (0.0%) | 63 (86.3%) |
| 3.0x to 3.9x | 16 (23.9%) | 7 (9.6%) |
| 4.0x or more | 9 (13.4%) | 2 (2.7%) |
| Total | 67 (100.0%) | 73 (100.0%) |
Real Estate Taxes by Mortgage Status in Ochlocknee
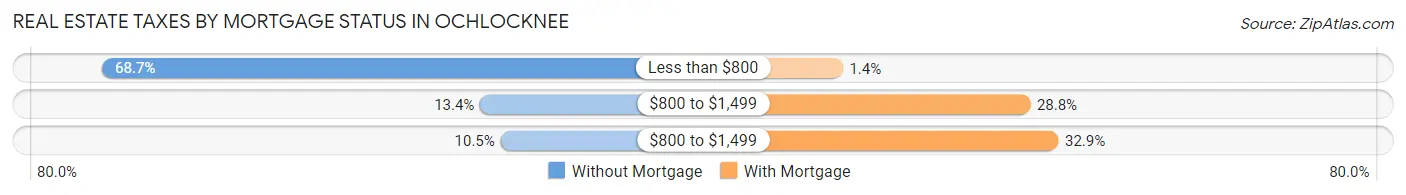
| Property Taxes | Without Mortgage | With Mortgage |
| Less than $800 | 46 (68.7%) | 1 (1.4%) |
| $800 to $1,499 | 9 (13.4%) | 21 (28.8%) |
| $800 to $1,499 | 7 (10.4%) | 24 (32.9%) |
| Total | 67 (100.0%) | 73 (100.0%) |
Health & Disability in Ochlocknee
Health Insurance Coverage by Age in Ochlocknee
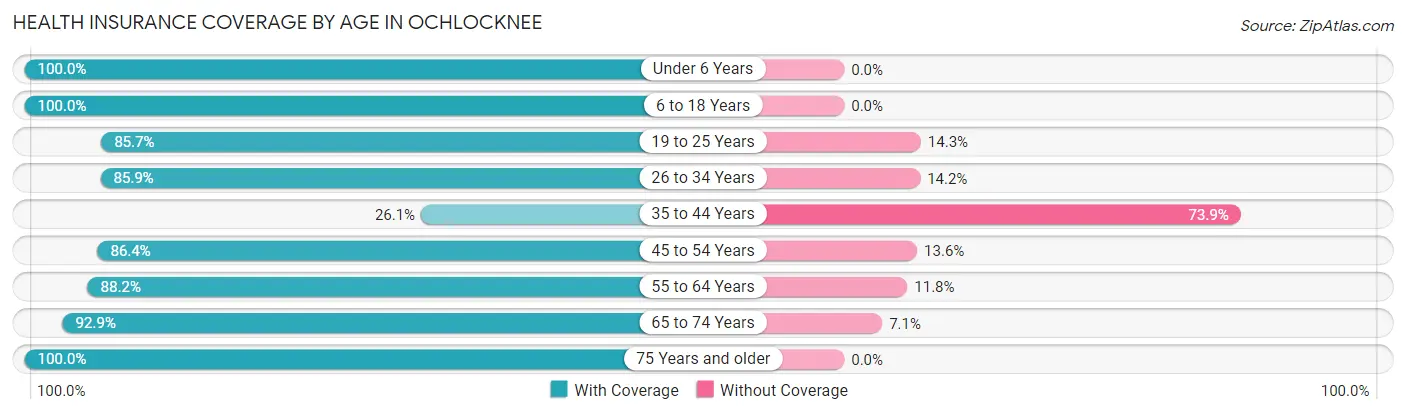
| Age Bracket | With Coverage | Without Coverage |
| Under 6 Years | 39 (100.0%) | 0 (0.0%) |
| 6 to 18 Years | 114 (100.0%) | 0 (0.0%) |
| 19 to 25 Years | 48 (85.7%) | 8 (14.3%) |
| 26 to 34 Years | 91 (85.9%) | 15 (14.1%) |
| 35 to 44 Years | 12 (26.1%) | 34 (73.9%) |
| 45 to 54 Years | 89 (86.4%) | 14 (13.6%) |
| 55 to 64 Years | 45 (88.2%) | 6 (11.8%) |
| 65 to 74 Years | 92 (92.9%) | 7 (7.1%) |
| 75 Years and older | 58 (100.0%) | 0 (0.0%) |
| Total | 588 (87.5%) | 84 (12.5%) |
Health Insurance Coverage by Citizenship Status in Ochlocknee

| Citizenship Status | With Coverage | Without Coverage |
| Native Born | 39 (100.0%) | 0 (0.0%) |
| Foreign Born, Citizen | 114 (100.0%) | 0 (0.0%) |
| Foreign Born, not a Citizen | 48 (85.7%) | 8 (14.3%) |
Health Insurance Coverage by Household Income in Ochlocknee
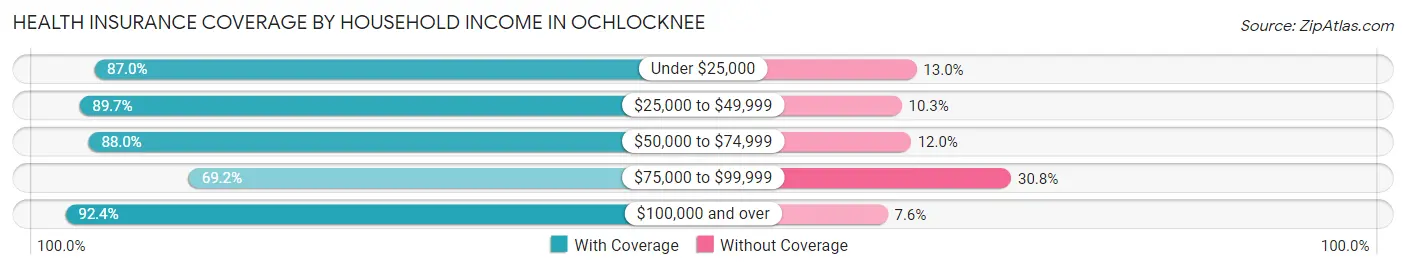
| Household Income | With Coverage | Without Coverage |
| Under $25,000 | 120 (87.0%) | 18 (13.0%) |
| $25,000 to $49,999 | 105 (89.7%) | 12 (10.3%) |
| $50,000 to $74,999 | 206 (88.0%) | 28 (12.0%) |
| $75,000 to $99,999 | 36 (69.2%) | 16 (30.8%) |
| $100,000 and over | 121 (92.4%) | 10 (7.6%) |
Public vs Private Health Insurance Coverage by Age in Ochlocknee
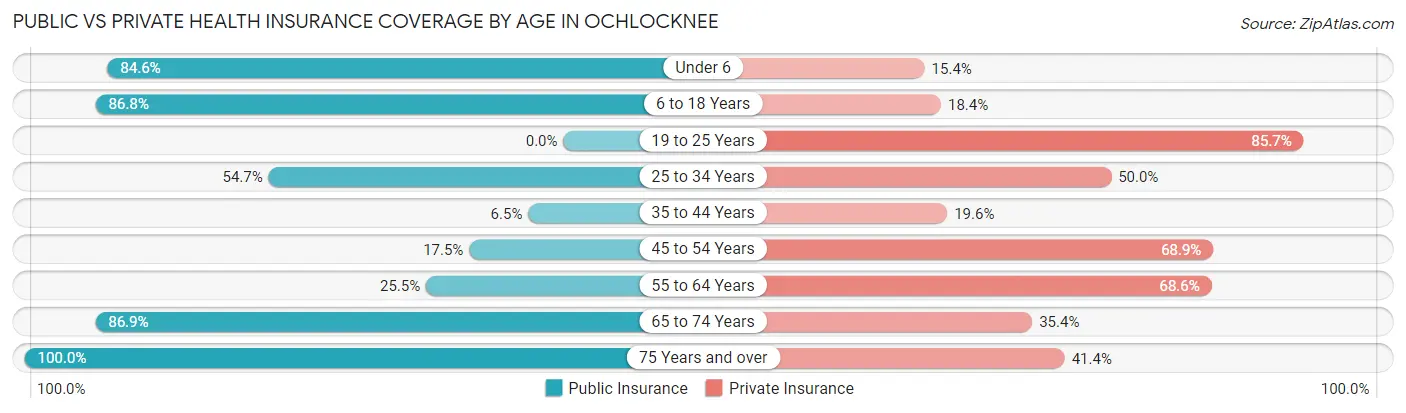
| Age Bracket | Public Insurance | Private Insurance |
| Under 6 | 33 (84.6%) | 6 (15.4%) |
| 6 to 18 Years | 99 (86.8%) | 21 (18.4%) |
| 19 to 25 Years | 0 (0.0%) | 48 (85.7%) |
| 25 to 34 Years | 58 (54.7%) | 53 (50.0%) |
| 35 to 44 Years | 3 (6.5%) | 9 (19.6%) |
| 45 to 54 Years | 18 (17.5%) | 71 (68.9%) |
| 55 to 64 Years | 13 (25.5%) | 35 (68.6%) |
| 65 to 74 Years | 86 (86.9%) | 35 (35.3%) |
| 75 Years and over | 58 (100.0%) | 24 (41.4%) |
| Total | 368 (54.8%) | 302 (44.9%) |
Disability Status by Sex by Age in Ochlocknee
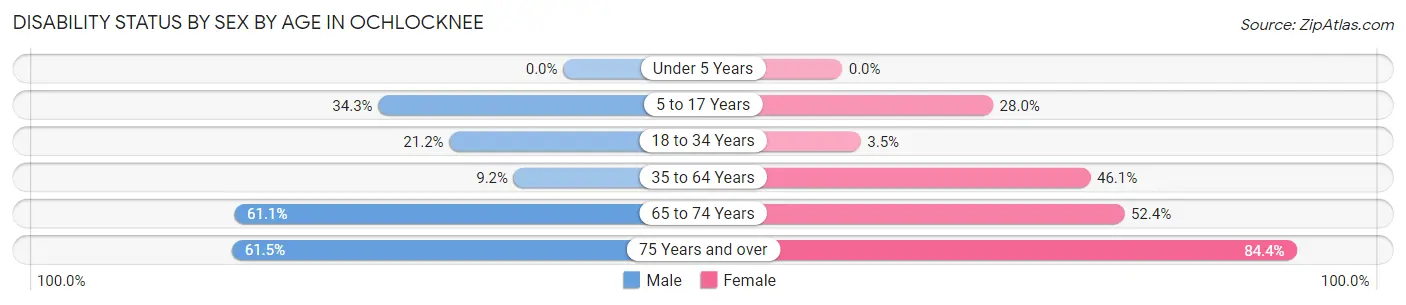
| Age Bracket | Male | Female |
| Under 5 Years | 0 (0.0%) | 0 (0.0%) |
| 5 to 17 Years | 23 (34.3%) | 14 (28.0%) |
| 18 to 34 Years | 22 (21.1%) | 2 (3.5%) |
| 35 to 64 Years | 9 (9.2%) | 47 (46.1%) |
| 65 to 74 Years | 22 (61.1%) | 33 (52.4%) |
| 75 Years and over | 16 (61.5%) | 27 (84.4%) |
Disability Class by Sex by Age in Ochlocknee
Disability Class: Hearing Difficulty
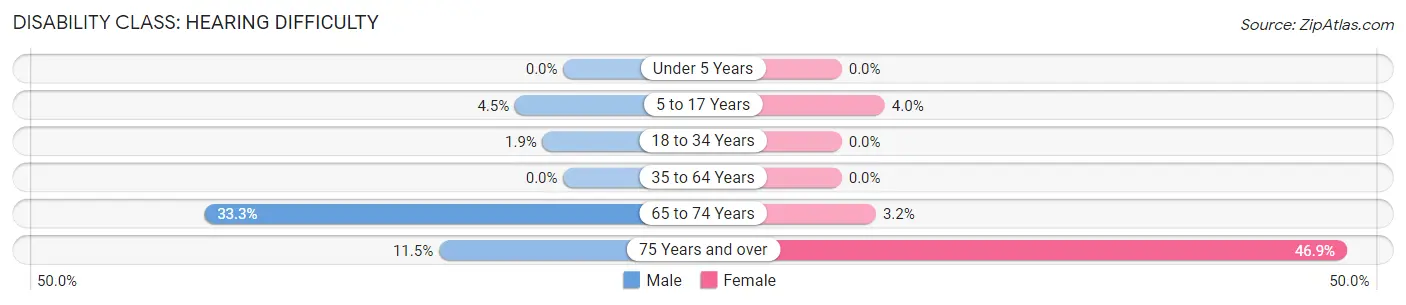
| Age Bracket | Male | Female |
| Under 5 Years | 0 (0.0%) | 0 (0.0%) |
| 5 to 17 Years | 3 (4.5%) | 2 (4.0%) |
| 18 to 34 Years | 2 (1.9%) | 0 (0.0%) |
| 35 to 64 Years | 0 (0.0%) | 0 (0.0%) |
| 65 to 74 Years | 12 (33.3%) | 2 (3.2%) |
| 75 Years and over | 3 (11.5%) | 15 (46.9%) |
Disability Class: Vision Difficulty
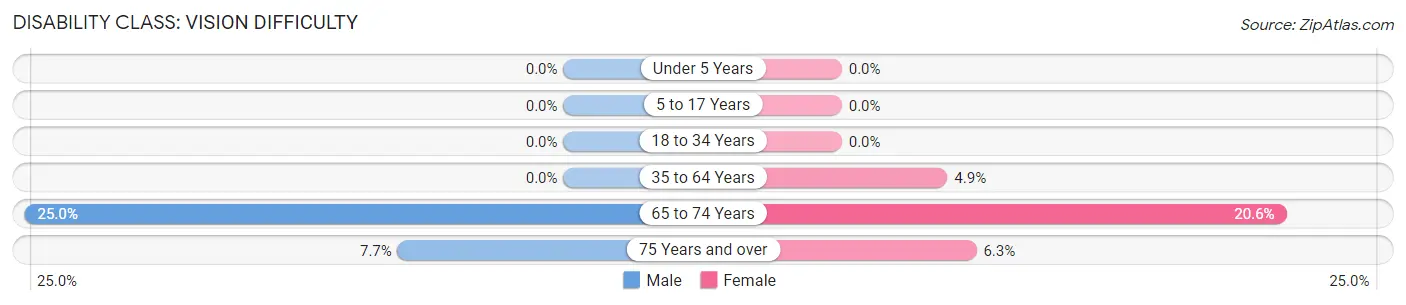
| Age Bracket | Male | Female |
| Under 5 Years | 0 (0.0%) | 0 (0.0%) |
| 5 to 17 Years | 0 (0.0%) | 0 (0.0%) |
| 18 to 34 Years | 0 (0.0%) | 0 (0.0%) |
| 35 to 64 Years | 0 (0.0%) | 5 (4.9%) |
| 65 to 74 Years | 9 (25.0%) | 13 (20.6%) |
| 75 Years and over | 2 (7.7%) | 2 (6.2%) |
Disability Class: Cognitive Difficulty
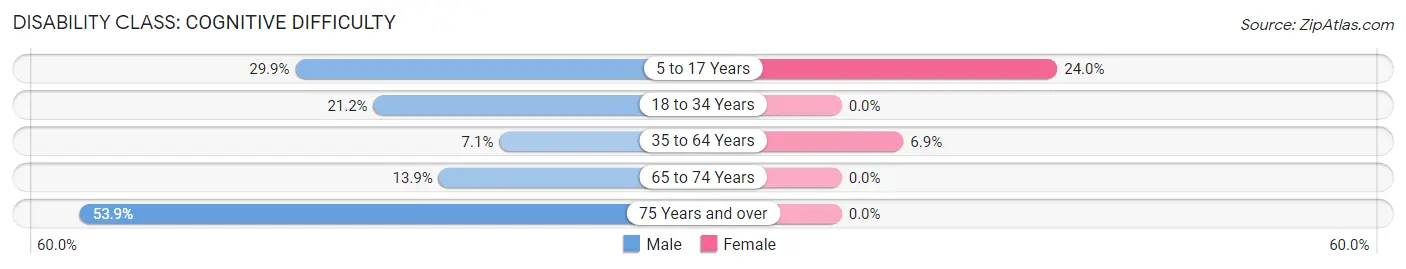
| Age Bracket | Male | Female |
| 5 to 17 Years | 20 (29.8%) | 12 (24.0%) |
| 18 to 34 Years | 22 (21.1%) | 0 (0.0%) |
| 35 to 64 Years | 7 (7.1%) | 7 (6.9%) |
| 65 to 74 Years | 5 (13.9%) | 0 (0.0%) |
| 75 Years and over | 14 (53.8%) | 0 (0.0%) |
Disability Class: Ambulatory Difficulty
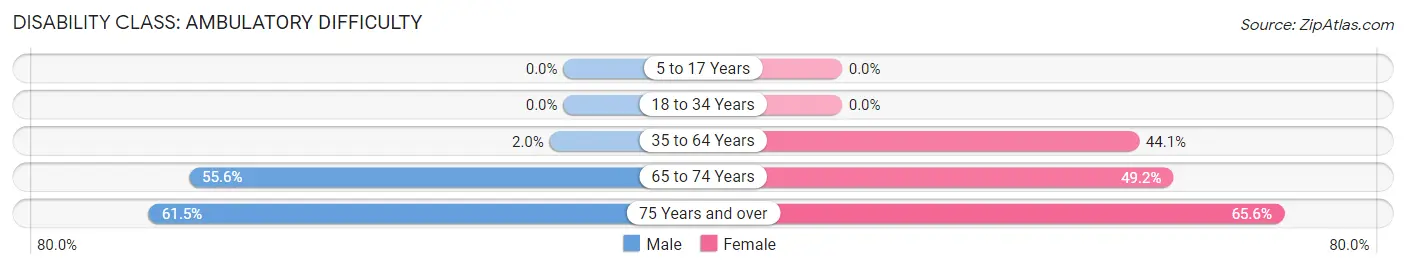
| Age Bracket | Male | Female |
| 5 to 17 Years | 0 (0.0%) | 0 (0.0%) |
| 18 to 34 Years | 0 (0.0%) | 0 (0.0%) |
| 35 to 64 Years | 2 (2.0%) | 45 (44.1%) |
| 65 to 74 Years | 20 (55.6%) | 31 (49.2%) |
| 75 Years and over | 16 (61.5%) | 21 (65.6%) |
Disability Class: Self-Care Difficulty
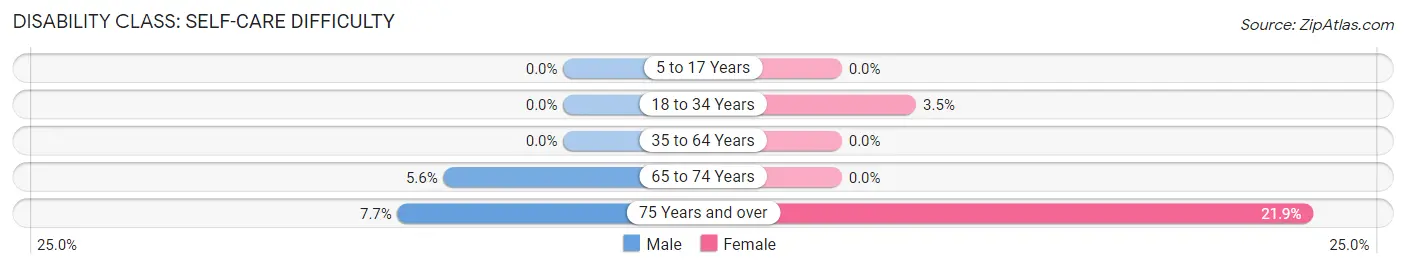
| Age Bracket | Male | Female |
| 5 to 17 Years | 0 (0.0%) | 0 (0.0%) |
| 18 to 34 Years | 0 (0.0%) | 2 (3.5%) |
| 35 to 64 Years | 0 (0.0%) | 0 (0.0%) |
| 65 to 74 Years | 2 (5.6%) | 0 (0.0%) |
| 75 Years and over | 2 (7.7%) | 7 (21.9%) |
Technology Access in Ochlocknee
Computing Device Access in Ochlocknee
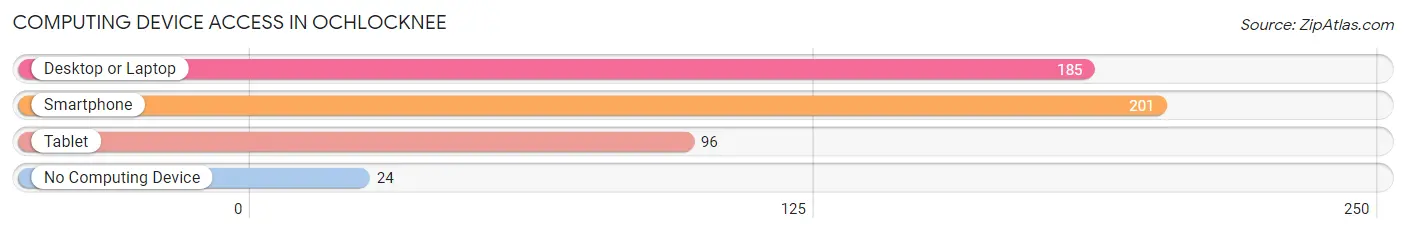
| Device Type | # Households | % Households |
| Desktop or Laptop | 185 | 73.4% |
| Smartphone | 201 | 79.8% |
| Tablet | 96 | 38.1% |
| No Computing Device | 24 | 9.5% |
| Total | 252 | 100.0% |
Internet Access in Ochlocknee
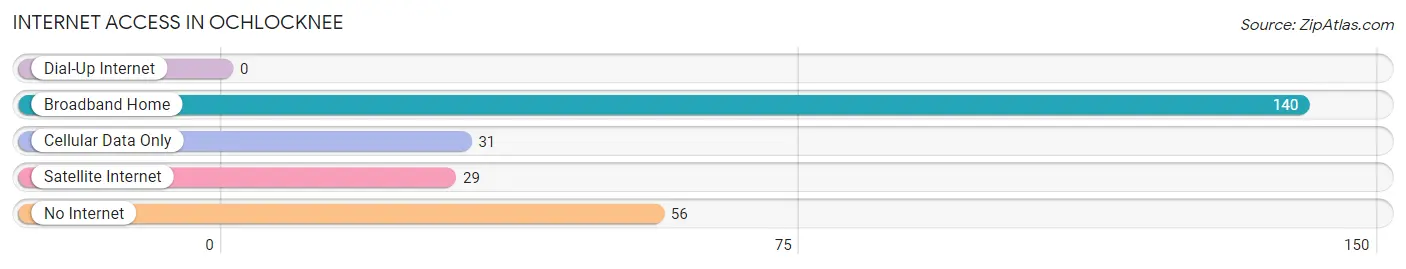
| Internet Type | # Households | % Households |
| Dial-Up Internet | 0 | 0.0% |
| Broadband Home | 140 | 55.6% |
| Cellular Data Only | 31 | 12.3% |
| Satellite Internet | 29 | 11.5% |
| No Internet | 56 | 22.2% |
| Total | 252 | 100.0% |
Ochlocknee Summary
Ochlocknee is a small town located in Thomas County, Georgia, United States. It is situated on the banks of the Ochlockonee River, which is a tributary of the Apalachicola River. The town was founded in 1854 and is named after the river. The population of Ochlocknee was 1,072 at the 2010 census.
History
The area around Ochlocknee was first inhabited by Native American tribes, including the Apalachee, Creek, and Seminole. The first European settlers arrived in the area in the early 19th century. The town was founded in 1854 and was named after the Ochlockonee River. The town was incorporated in 1872.
In the late 19th century, Ochlocknee was a thriving agricultural center, with cotton, corn, and tobacco being the main crops. The town also had a sawmill, gristmill, and a cotton gin. The railroad arrived in Ochlocknee in 1883, connecting the town to other parts of the state.
In the early 20th century, Ochlocknee was a popular tourist destination, with many visitors coming to fish and hunt in the area. The town also had a number of hotels and restaurants.
Geography
Ochlocknee is located at 30°59'25" North, 83°59'25" West (30.9903, -83.9903). The town is situated on the banks of the Ochlockonee River, which is a tributary of the Apalachicola River. The town is located in Thomas County, Georgia, and is approximately 20 miles south of Thomasville.
The town has a total area of 1.2 square miles, all of which is land. The town is located in the Coastal Plain region of Georgia, and the terrain is mostly flat.
Economy
The economy of Ochlocknee is largely based on agriculture. The town is home to several farms, which produce cotton, corn, and tobacco. The town also has a number of small businesses, including restaurants, stores, and service providers.
The town is also home to a number of manufacturing companies, including a paper mill and a wood products plant. The town is also home to a number of government offices, including the Thomas County Courthouse and the Thomas County Sheriff's Office.
Demographics
As of the 2010 census, the population of Ochlocknee was 1,072. The racial makeup of the town was 79.2% White, 17.7% African American, 0.7% Native American, 0.3% Asian, 0.1% Pacific Islander, 0.7% from other races, and 1.2% from two or more races. Hispanic or Latino of any race were 2.2% of the population.
The median income for a household in Ochlocknee was $30,938, and the median income for a family was $37,500. The per capita income for the town was $15,945. About 17.2% of families and 20.2% of the population were below the poverty line, including 28.3% of those under age 18 and 15.2% of those age 65 or over.
Common Questions
What is Per Capita Income in Ochlocknee?
Per Capita income in Ochlocknee is $23,930.
What is the Median Family Income in Ochlocknee?
Median Family Income in Ochlocknee is $41,042.
What is the Median Household income in Ochlocknee?
Median Household Income in Ochlocknee is $55,375.
What is Income or Wage Gap in Ochlocknee?
Income or Wage Gap in Ochlocknee is 18.1%.
Women in Ochlocknee earn 81.9 cents for every dollar earned by a man.
What is Inequality or Gini Index in Ochlocknee?
Inequality or Gini Index in Ochlocknee is 0.38.
What is the Total Population of Ochlocknee?
Total Population of Ochlocknee is 672.
What is the Total Male Population of Ochlocknee?
Total Male Population of Ochlocknee is 341.
What is the Total Female Population of Ochlocknee?
Total Female Population of Ochlocknee is 331.
What is the Ratio of Males per 100 Females in Ochlocknee?
There are 103.02 Males per 100 Females in Ochlocknee.
What is the Ratio of Females per 100 Males in Ochlocknee?
There are 97.07 Females per 100 Males in Ochlocknee.
What is the Median Population Age in Ochlocknee?
Median Population Age in Ochlocknee is 37.3 Years.
What is the Average Family Size in Ochlocknee
Average Family Size in Ochlocknee is 3.0 People.
What is the Average Household Size in Ochlocknee
Average Household Size in Ochlocknee is 2.7 People.
How Large is the Labor Force in Ochlocknee?
There are 324 People in the Labor Forcein in Ochlocknee.
What is the Percentage of People in the Labor Force in Ochlocknee?
62.4% of People are in the Labor Force in Ochlocknee.
What is the Unemployment Rate in Ochlocknee?
Unemployment Rate in Ochlocknee is 9.3%.