Braswell, GA Map & Demographics
Braswell Map
Braswell Overview
$26,713
PER CAPITA INCOME
$90,625
AVG FAMILY INCOME
$72,813
AVG HOUSEHOLD INCOME
67.4%
WAGE / INCOME GAP [ % ]
32.6¢/ $1
WAGE / INCOME GAP [ $ ]
0.41
INEQUALITY / GINI INDEX
369
TOTAL POPULATION
152
MALE POPULATION
217
FEMALE POPULATION
70.05
MALES / 100 FEMALES
142.76
FEMALES / 100 MALES
36.2
MEDIAN AGE
3.7
AVG FAMILY SIZE
3.0
AVG HOUSEHOLD SIZE
169
LABOR FORCE [ PEOPLE ]
67.3%
PERCENT IN LABOR FORCE
3.0%
UNEMPLOYMENT RATE
Income in Braswell
Income Overview in Braswell
Per Capita Income in Braswell is $26,713, while median incomes of families and households are $90,625 and $72,813 respectively.
| Characteristic | Number | Measure |
| Per Capita Income | 369 | $26,713 |
| Median Family Income | 75 | $90,625 |
| Mean Family Income | 75 | $94,159 |
| Median Household Income | 121 | $72,813 |
| Mean Household Income | 121 | $79,464 |
| Income Deficit | 75 | $0 |
| Wage / Income Gap (%) | 369 | 67.39% |
| Wage / Income Gap ($) | 369 | 32.61¢ per $1 |
| Gini / Inequality Index | 369 | 0.41 |
Earnings by Sex in Braswell
Average Earnings in Braswell are $41,563, $65,938 for men and $21,500 for women, a difference of 67.4%.
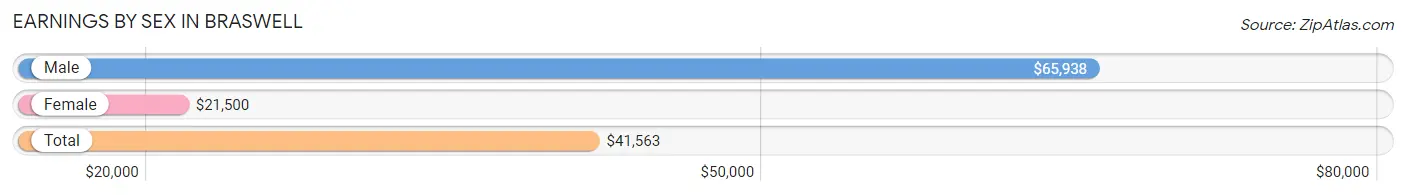
| Sex | Number | Average Earnings |
| Male | 89 (52.0%) | $65,938 |
| Female | 82 (47.9%) | $21,500 |
| Total | 171 (100.0%) | $41,563 |
Earnings by Sex by Income Bracket in Braswell
The most common earnings brackets in Braswell are $75,000 to $99,999 for men (17 | 19.1%) and $2,499 or less for women (12 | 14.6%).
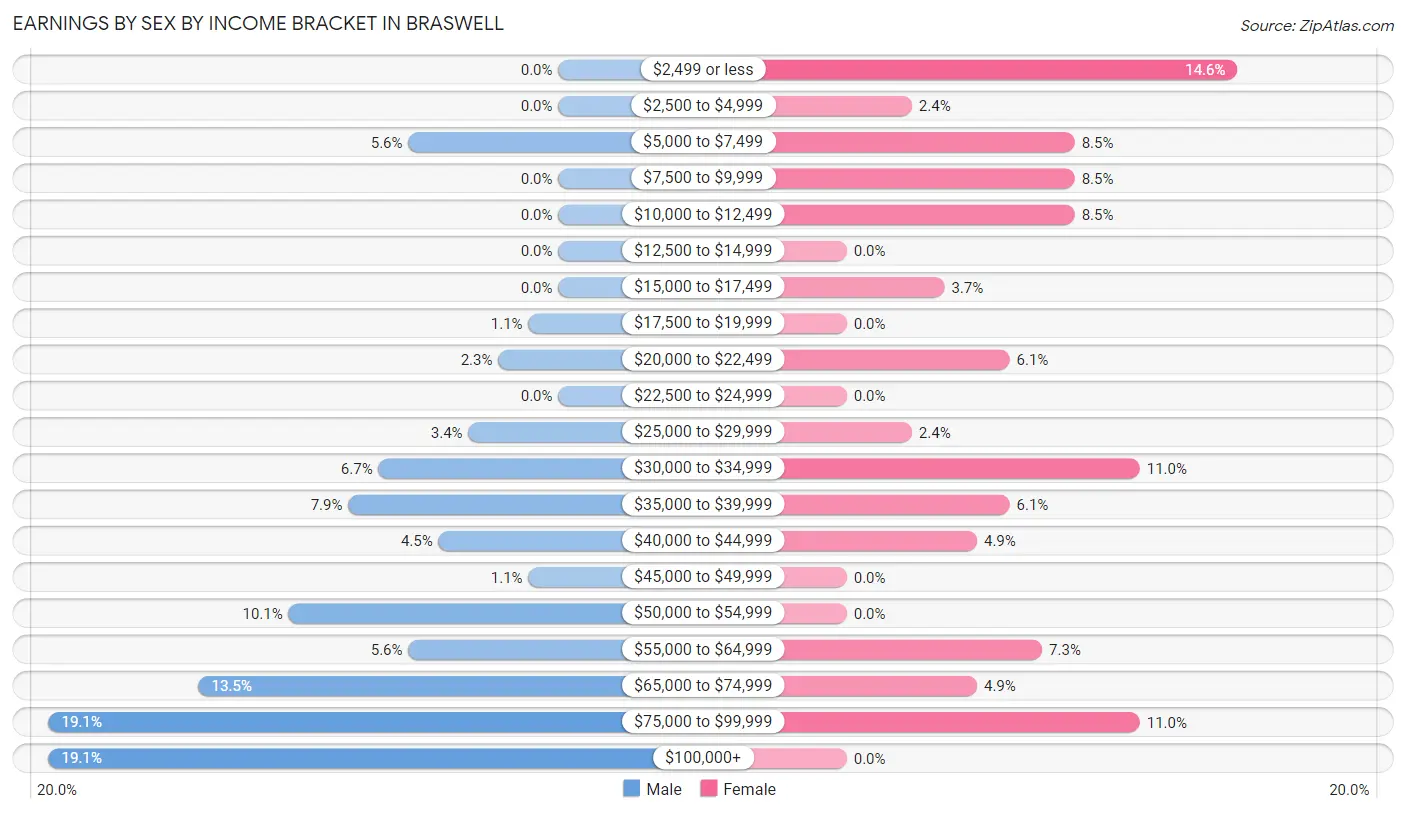
| Income | Male | Female |
| $2,499 or less | 0 (0.0%) | 12 (14.6%) |
| $2,500 to $4,999 | 0 (0.0%) | 2 (2.4%) |
| $5,000 to $7,499 | 5 (5.6%) | 7 (8.5%) |
| $7,500 to $9,999 | 0 (0.0%) | 7 (8.5%) |
| $10,000 to $12,499 | 0 (0.0%) | 7 (8.5%) |
| $12,500 to $14,999 | 0 (0.0%) | 0 (0.0%) |
| $15,000 to $17,499 | 0 (0.0%) | 3 (3.7%) |
| $17,500 to $19,999 | 1 (1.1%) | 0 (0.0%) |
| $20,000 to $22,499 | 2 (2.2%) | 5 (6.1%) |
| $22,500 to $24,999 | 0 (0.0%) | 0 (0.0%) |
| $25,000 to $29,999 | 3 (3.4%) | 2 (2.4%) |
| $30,000 to $34,999 | 6 (6.7%) | 9 (11.0%) |
| $35,000 to $39,999 | 7 (7.9%) | 5 (6.1%) |
| $40,000 to $44,999 | 4 (4.5%) | 4 (4.9%) |
| $45,000 to $49,999 | 1 (1.1%) | 0 (0.0%) |
| $50,000 to $54,999 | 9 (10.1%) | 0 (0.0%) |
| $55,000 to $64,999 | 5 (5.6%) | 6 (7.3%) |
| $65,000 to $74,999 | 12 (13.5%) | 4 (4.9%) |
| $75,000 to $99,999 | 17 (19.1%) | 9 (11.0%) |
| $100,000+ | 17 (19.1%) | 0 (0.0%) |
| Total | 89 (100.0%) | 82 (100.0%) |
Earnings by Sex by Educational Attainment in Braswell
Average earnings in Braswell are $67,813 for men and $26,250 for women, a difference of 61.3%. Men with an educational attainment of college or associate's degree enjoy the highest average annual earnings of $84,688, while those with less than high school education earn the least with $39,000. Women with an educational attainment of graduate degree earn the most with the average annual earnings of $57,500, while those with college or associate's degree education have the smallest earnings of $31,528.
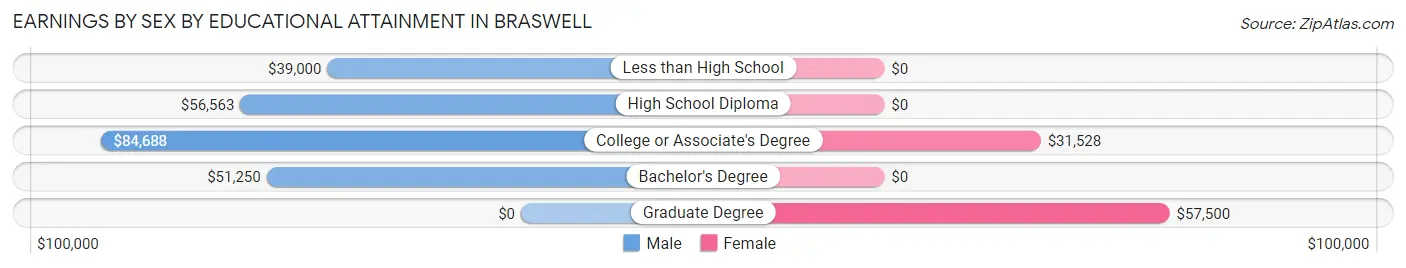
| Educational Attainment | Male Income | Female Income |
| Less than High School | $39,000 | $0 |
| High School Diploma | $56,563 | $0 |
| College or Associate's Degree | $84,688 | $31,528 |
| Bachelor's Degree | $51,250 | $0 |
| Graduate Degree | - | - |
| Total | $67,813 | $26,250 |
Family Income in Braswell
Family Income Brackets in Braswell
According to the Braswell family income data, there are 22 families falling into the $150,000 to $199,999 income range, which is the most common income bracket and makes up 29.3% of all families.
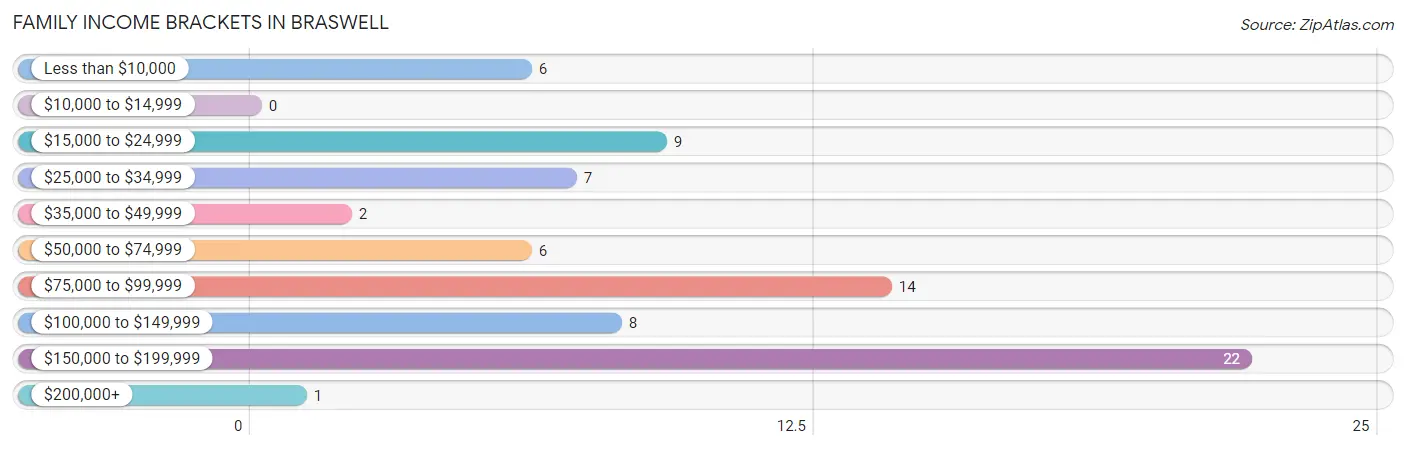
| Income Bracket | # Families | % Families |
| Less than $10,000 | 6 | 8.0% |
| $10,000 to $14,999 | 0 | 0.0% |
| $15,000 to $24,999 | 9 | 12.0% |
| $25,000 to $34,999 | 7 | 9.3% |
| $35,000 to $49,999 | 2 | 2.7% |
| $50,000 to $74,999 | 6 | 8.0% |
| $75,000 to $99,999 | 14 | 18.7% |
| $100,000 to $149,999 | 8 | 10.7% |
| $150,000 to $199,999 | 22 | 29.3% |
| $200,000+ | 1 | 1.3% |
Family Income by Famaliy Size in Braswell
5-person families (18 | 24.0%) account for the highest median family income in Braswell with $163,750 per family, while 3-person families (12 | 16.0%) have the highest median income of $46,111 per family member.
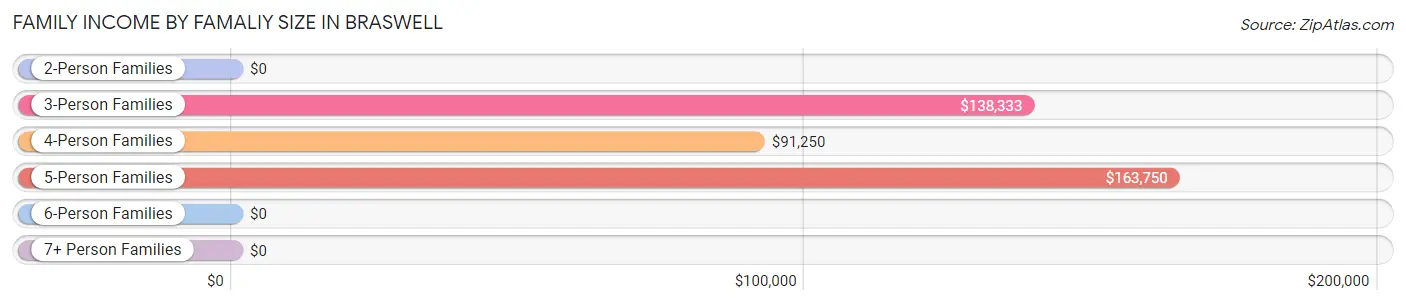
| Income Bracket | # Families | Median Income |
| 2-Person Families | 29 (38.7%) | $0 |
| 3-Person Families | 12 (16.0%) | $138,333 |
| 4-Person Families | 16 (21.3%) | $91,250 |
| 5-Person Families | 18 (24.0%) | $163,750 |
| 6-Person Families | 0 (0.0%) | $0 |
| 7+ Person Families | 0 (0.0%) | $0 |
| Total | 75 (100.0%) | $90,625 |
Family Income by Number of Earners in Braswell
The median family income in Braswell is $90,625, with families comprising 2 earners (39) having the highest median family income of $149,583, while families with no earners (11) have the lowest median family income of $2,499, accounting for 52.0% and 14.7% of families, respectively.
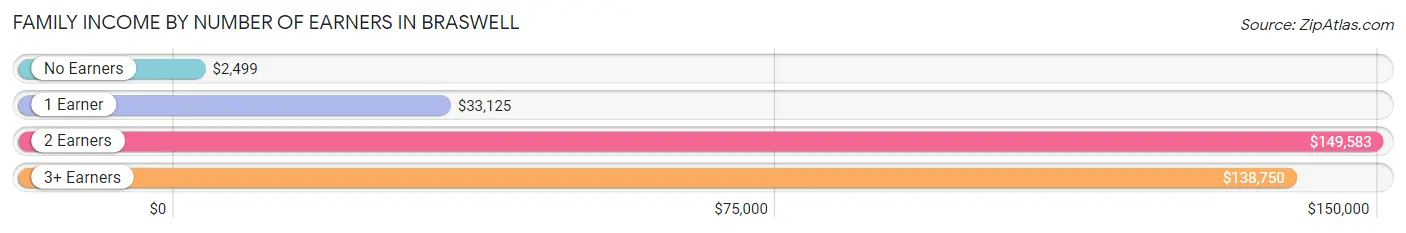
| Number of Earners | # Families | Median Income |
| No Earners | 11 (14.7%) | $2,499 |
| 1 Earner | 16 (21.3%) | $33,125 |
| 2 Earners | 39 (52.0%) | $149,583 |
| 3+ Earners | 9 (12.0%) | $138,750 |
| Total | 75 (100.0%) | $90,625 |
Household Income in Braswell
Household Income Brackets in Braswell
With 22 households falling in the category, the $100,000 to $149,999 income range is the most frequent in Braswell, accounting for 18.2% of all households. In contrast, only 1 households (0.8%) fall into the $200,000+ income bracket, making it the least populous group.
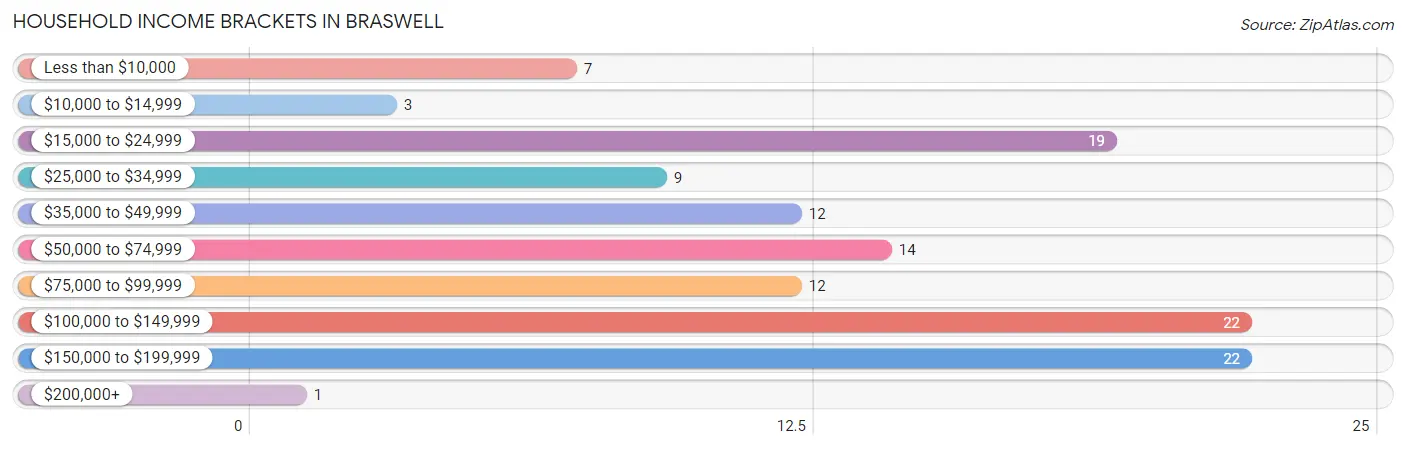
| Income Bracket | # Households | % Households |
| Less than $10,000 | 7 | 5.8% |
| $10,000 to $14,999 | 3 | 2.5% |
| $15,000 to $24,999 | 19 | 15.7% |
| $25,000 to $34,999 | 9 | 7.4% |
| $35,000 to $49,999 | 12 | 9.9% |
| $50,000 to $74,999 | 14 | 11.6% |
| $75,000 to $99,999 | 12 | 9.9% |
| $100,000 to $149,999 | 22 | 18.2% |
| $150,000 to $199,999 | 22 | 18.2% |
| $200,000+ | 1 | 0.8% |
Household Income by Householder Age in Braswell
The median household income in Braswell is $72,813, with the highest median household income of $63,750 found in the 45 to 64 years age bracket for the primary householder. A total of 52 households (43.0%) fall into this category. Meanwhile, the 15 to 24 years age bracket for the primary householder has the lowest median household income of $0, with 4 households (3.3%) in this group.
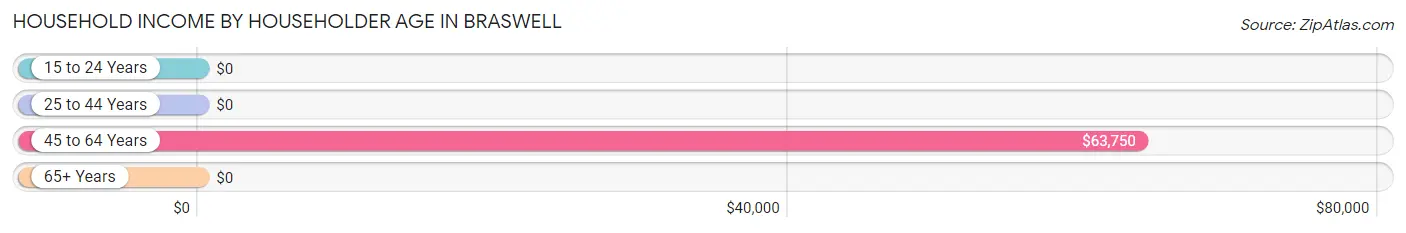
| Income Bracket | # Households | Median Income |
| 15 to 24 Years | 4 (3.3%) | $0 |
| 25 to 44 Years | 41 (33.9%) | $0 |
| 45 to 64 Years | 52 (43.0%) | $63,750 |
| 65+ Years | 24 (19.8%) | $0 |
| Total | 121 (100.0%) | $72,813 |
Poverty in Braswell
Income Below Poverty by Sex and Age in Braswell
With 6.6% poverty level for males and 20.0% for females among the residents of Braswell, 55 to 64 year old males and 5 year old females are the most vulnerable to poverty, with 4 males (23.5%) and 3 females (100.0%) in their respective age groups living below the poverty level.
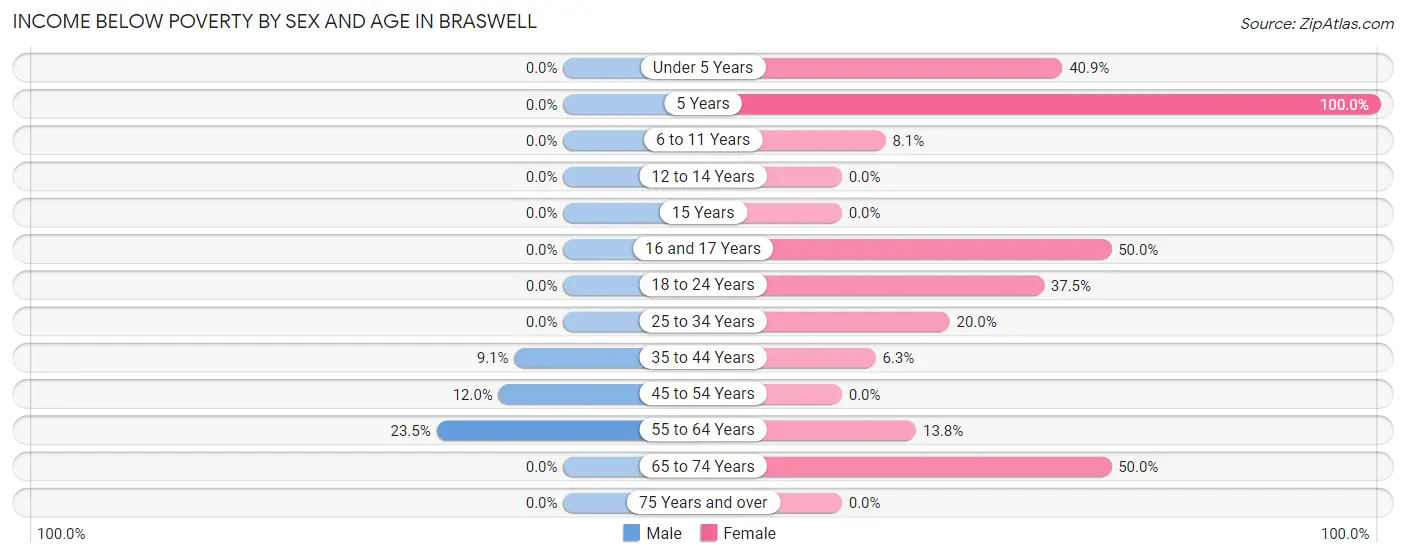
| Age Bracket | Male | Female |
| Under 5 Years | 0 (0.0%) | 9 (40.9%) |
| 5 Years | 0 (0.0%) | 3 (100.0%) |
| 6 to 11 Years | 0 (0.0%) | 3 (8.1%) |
| 12 to 14 Years | 0 (0.0%) | 0 (0.0%) |
| 15 Years | 0 (0.0%) | 0 (0.0%) |
| 16 and 17 Years | 0 (0.0%) | 2 (50.0%) |
| 18 to 24 Years | 0 (0.0%) | 6 (37.5%) |
| 25 to 34 Years | 0 (0.0%) | 3 (20.0%) |
| 35 to 44 Years | 3 (9.1%) | 2 (6.2%) |
| 45 to 54 Years | 3 (12.0%) | 0 (0.0%) |
| 55 to 64 Years | 4 (23.5%) | 4 (13.8%) |
| 65 to 74 Years | 0 (0.0%) | 7 (50.0%) |
| 75 Years and over | 0 (0.0%) | 0 (0.0%) |
| Total | 10 (6.6%) | 39 (20.0%) |
Income Above Poverty by Sex and Age in Braswell
According to the poverty statistics in Braswell, males aged 5 years and females aged 12 to 14 years are the age groups that are most secure financially, with 100.0% of males and 100.0% of females in these age groups living above the poverty line.
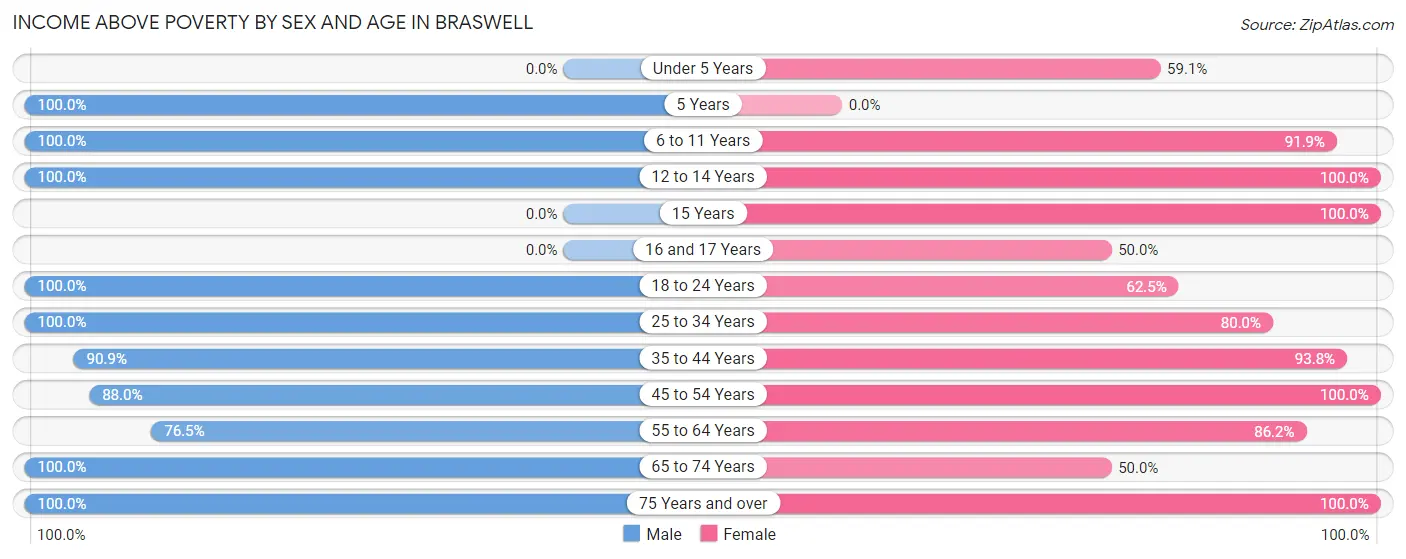
| Age Bracket | Male | Female |
| Under 5 Years | 0 (0.0%) | 13 (59.1%) |
| 5 Years | 2 (100.0%) | 0 (0.0%) |
| 6 to 11 Years | 10 (100.0%) | 34 (91.9%) |
| 12 to 14 Years | 17 (100.0%) | 3 (100.0%) |
| 15 Years | 0 (0.0%) | 2 (100.0%) |
| 16 and 17 Years | 0 (0.0%) | 2 (50.0%) |
| 18 to 24 Years | 13 (100.0%) | 10 (62.5%) |
| 25 to 34 Years | 11 (100.0%) | 12 (80.0%) |
| 35 to 44 Years | 30 (90.9%) | 30 (93.8%) |
| 45 to 54 Years | 22 (88.0%) | 17 (100.0%) |
| 55 to 64 Years | 13 (76.5%) | 25 (86.2%) |
| 65 to 74 Years | 17 (100.0%) | 7 (50.0%) |
| 75 Years and over | 7 (100.0%) | 1 (100.0%) |
| Total | 142 (93.4%) | 156 (80.0%) |
Income Below Poverty Among Married-Couple Families in Braswell
The poverty statistics for married-couple families in Braswell show that 8.5% or 5 of the total 59 families live below the poverty line. Families with 3 or 4 children have the highest poverty rate of 20.0%, comprising of 3 families. On the other hand, families with no children have the lowest poverty rate of 0.0%, which includes 0 families.
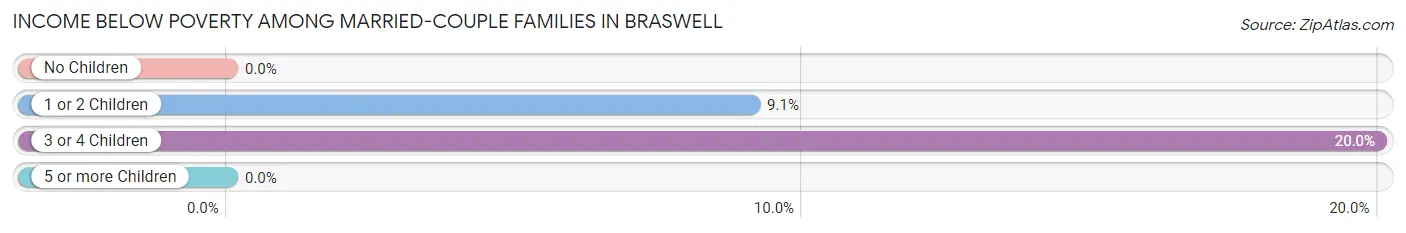
| Children | Above Poverty | Below Poverty |
| No Children | 22 (100.0%) | 0 (0.0%) |
| 1 or 2 Children | 20 (90.9%) | 2 (9.1%) |
| 3 or 4 Children | 12 (80.0%) | 3 (20.0%) |
| 5 or more Children | 0 (0.0%) | 0 (0.0%) |
| Total | 54 (91.5%) | 5 (8.5%) |
Income Below Poverty Among Single-Parent Households in Braswell
According to the poverty data in Braswell, 25.0% or 1 single-father households and 33.3% or 4 single-mother households are living below the poverty line. Among single-father households, those with no children have the highest poverty rate, with 1 households (33.3%) experiencing poverty. Likewise, among single-mother households, those with 1 or 2 children have the highest poverty rate, with 4 households (66.7%) falling below the poverty line.
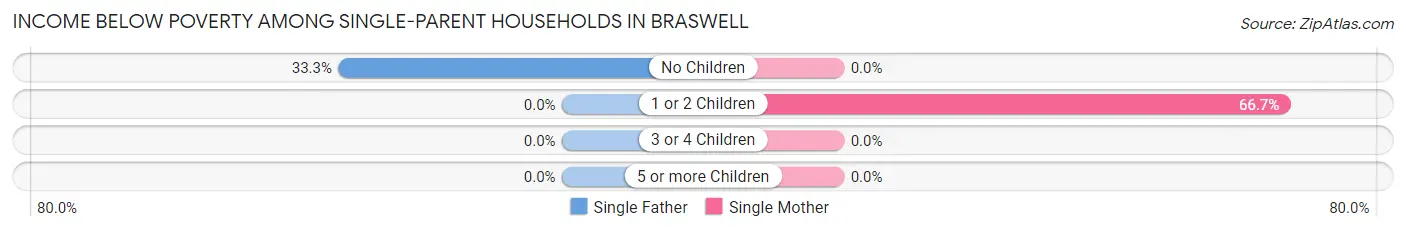
| Children | Single Father | Single Mother |
| No Children | 1 (33.3%) | 0 (0.0%) |
| 1 or 2 Children | 0 (0.0%) | 4 (66.7%) |
| 3 or 4 Children | 0 (0.0%) | 0 (0.0%) |
| 5 or more Children | 0 (0.0%) | 0 (0.0%) |
| Total | 1 (25.0%) | 4 (33.3%) |
Income Below Poverty Among Married-Couple vs Single-Parent Households in Braswell
The poverty data for Braswell shows that 5 of the married-couple family households (8.5%) and 5 of the single-parent households (31.2%) are living below the poverty level. Within the married-couple family households, those with 3 or 4 children have the highest poverty rate, with 3 households (20.0%) falling below the poverty line. Among the single-parent households, those with 1 or 2 children have the highest poverty rate, with 4 household (57.1%) living below poverty.
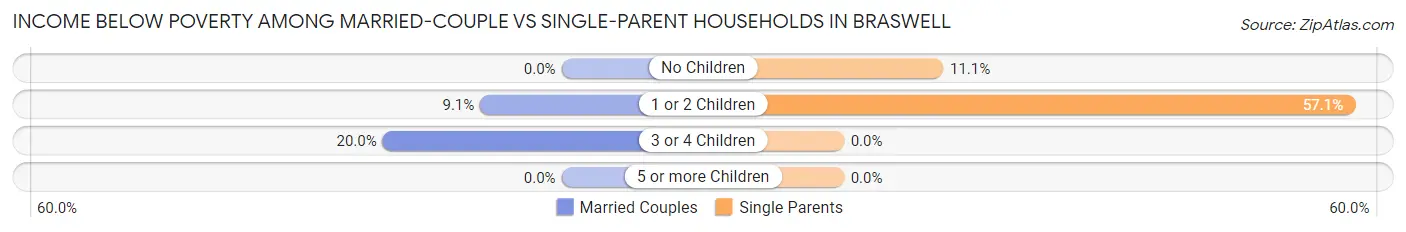
| Children | Married-Couple Families | Single-Parent Households |
| No Children | 0 (0.0%) | 1 (11.1%) |
| 1 or 2 Children | 2 (9.1%) | 4 (57.1%) |
| 3 or 4 Children | 3 (20.0%) | 0 (0.0%) |
| 5 or more Children | 0 (0.0%) | 0 (0.0%) |
| Total | 5 (8.5%) | 5 (31.2%) |
Race in Braswell
The most populous races in Braswell are White / Caucasian (348 | 94.3%), Black / African American (16 | 4.3%), and Hispanic or Latino (8 | 2.2%).
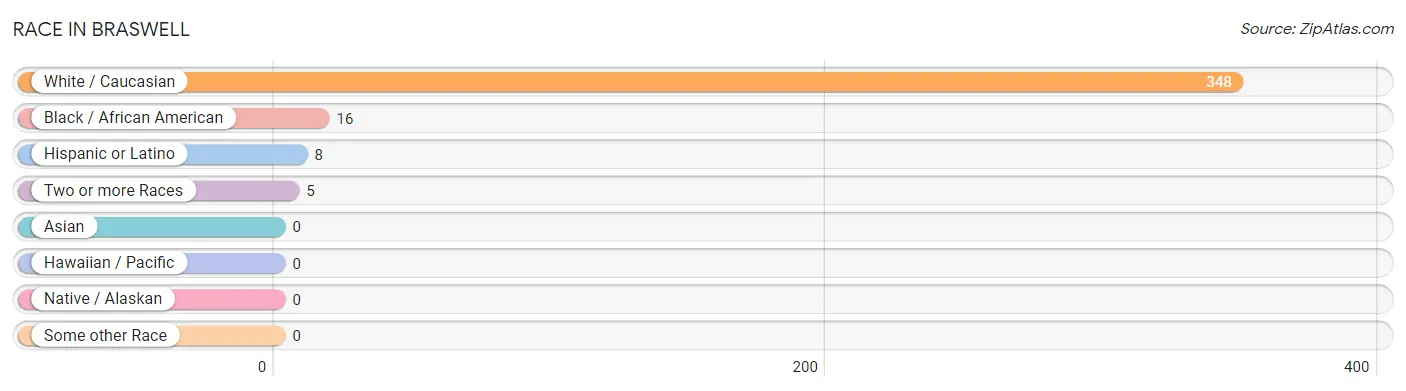
| Race | # Population | % Population |
| Asian | 0 | 0.0% |
| Black / African American | 16 | 4.3% |
| Hawaiian / Pacific | 0 | 0.0% |
| Hispanic or Latino | 8 | 2.2% |
| Native / Alaskan | 0 | 0.0% |
| White / Caucasian | 348 | 94.3% |
| Two or more Races | 5 | 1.4% |
| Some other Race | 0 | 0.0% |
| Total | 369 | 100.0% |
Ancestry in Braswell
The most populous ancestries reported in Braswell are English (83 | 22.5%), American (29 | 7.9%), German (26 | 7.0%), Irish (23 | 6.2%), and Scottish (17 | 4.6%), together accounting for 48.2% of all Braswell residents.
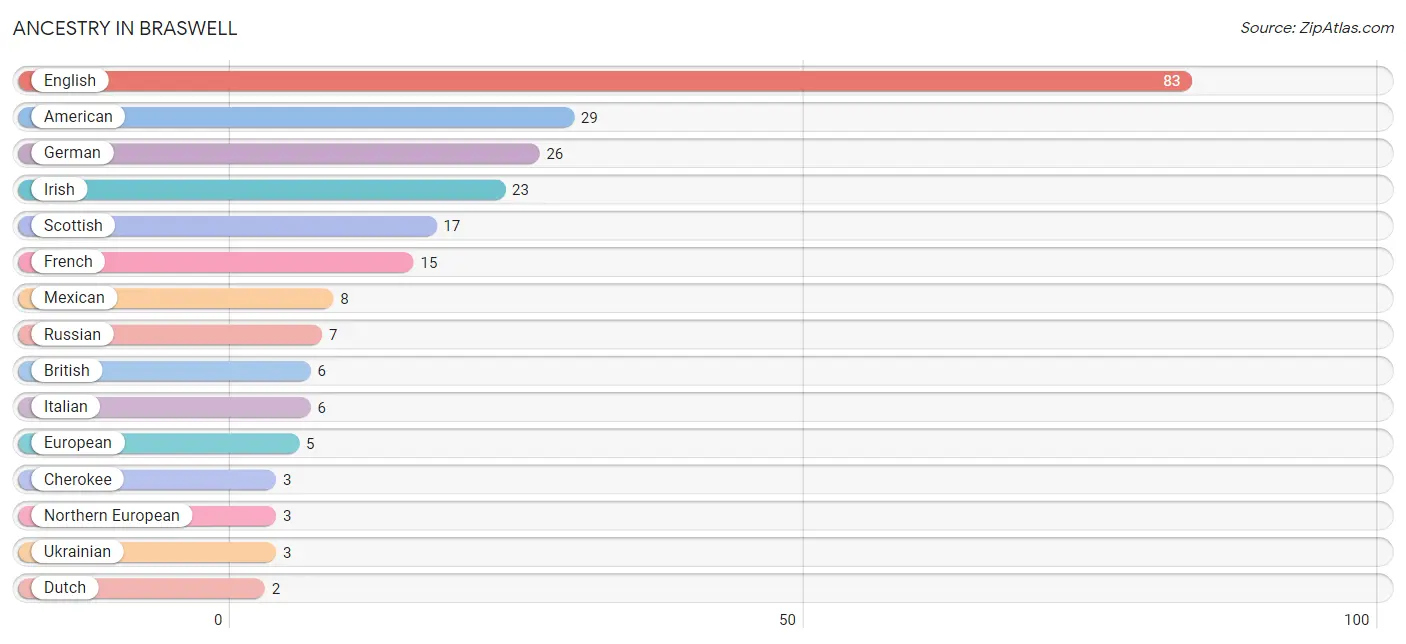
| Ancestry | # Population | % Population |
| American | 29 | 7.9% |
| British | 6 | 1.6% |
| Cherokee | 3 | 0.8% |
| Dutch | 2 | 0.5% |
| English | 83 | 22.5% |
| European | 5 | 1.4% |
| Finnish | 1 | 0.3% |
| French | 15 | 4.1% |
| German | 26 | 7.0% |
| Irish | 23 | 6.2% |
| Italian | 6 | 1.6% |
| Lumbee | 1 | 0.3% |
| Mexican | 8 | 2.2% |
| Northern European | 3 | 0.8% |
| Russian | 7 | 1.9% |
| Scandinavian | 1 | 0.3% |
| Scottish | 17 | 4.6% |
| Ukrainian | 3 | 0.8% | View All 18 Rows |
Immigrants in Braswell
The most numerous immigrant groups reported in Braswell came from Central America (3 | 0.8%), Latin America (3 | 0.8%), and Mexico (3 | 0.8%), together accounting for 2.4% of all Braswell residents.
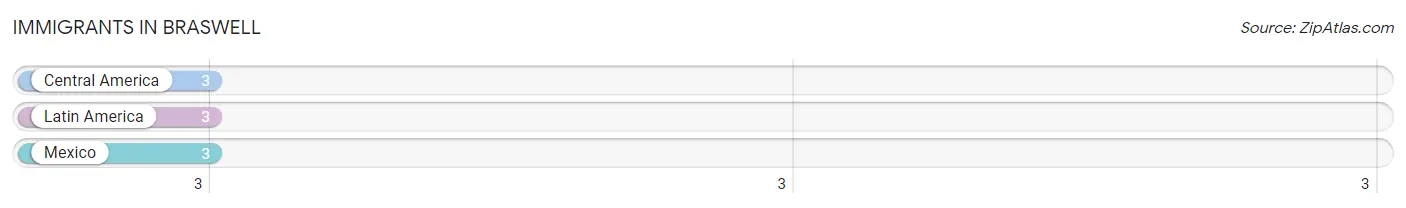
| Immigration Origin | # Population | % Population |
| Central America | 3 | 0.8% |
| Latin America | 3 | 0.8% |
| Mexico | 3 | 0.8% | View All 3 Rows |
Sex and Age in Braswell
Sex and Age in Braswell
The most populous age groups in Braswell are 35 to 39 Years (27 | 17.8%) for men and Under 5 Years (44 | 20.3%) for women.
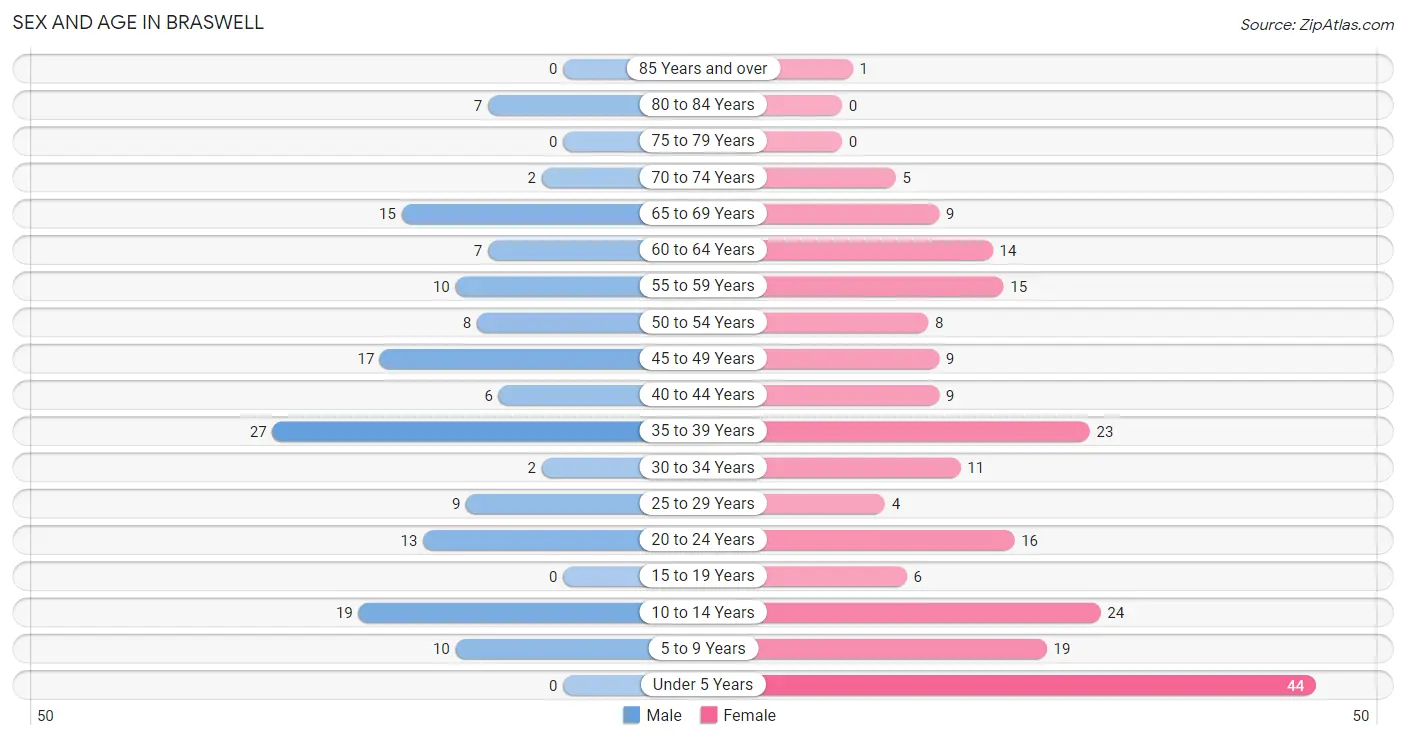
| Age Bracket | Male | Female |
| Under 5 Years | 0 (0.0%) | 44 (20.3%) |
| 5 to 9 Years | 10 (6.6%) | 19 (8.8%) |
| 10 to 14 Years | 19 (12.5%) | 24 (11.1%) |
| 15 to 19 Years | 0 (0.0%) | 6 (2.8%) |
| 20 to 24 Years | 13 (8.6%) | 16 (7.4%) |
| 25 to 29 Years | 9 (5.9%) | 4 (1.8%) |
| 30 to 34 Years | 2 (1.3%) | 11 (5.1%) |
| 35 to 39 Years | 27 (17.8%) | 23 (10.6%) |
| 40 to 44 Years | 6 (4.0%) | 9 (4.2%) |
| 45 to 49 Years | 17 (11.2%) | 9 (4.2%) |
| 50 to 54 Years | 8 (5.3%) | 8 (3.7%) |
| 55 to 59 Years | 10 (6.6%) | 15 (6.9%) |
| 60 to 64 Years | 7 (4.6%) | 14 (6.5%) |
| 65 to 69 Years | 15 (9.9%) | 9 (4.2%) |
| 70 to 74 Years | 2 (1.3%) | 5 (2.3%) |
| 75 to 79 Years | 0 (0.0%) | 0 (0.0%) |
| 80 to 84 Years | 7 (4.6%) | 0 (0.0%) |
| 85 Years and over | 0 (0.0%) | 1 (0.5%) |
| Total | 152 (100.0%) | 217 (100.0%) |
Families and Households in Braswell
Median Family Size in Braswell
The median family size in Braswell is 3.73 persons per family, with married-couple families (59 | 78.7%) accounting for the largest median family size of 4.17 persons per family. On the other hand, single male/father families (4 | 5.3%) represent the smallest median family size with 2.00 persons per family.
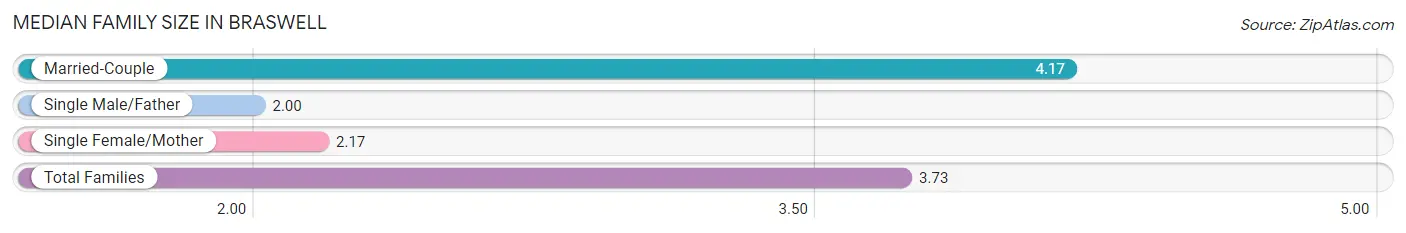
| Family Type | # Families | Family Size |
| Married-Couple | 59 (78.7%) | 4.17 |
| Single Male/Father | 4 (5.3%) | 2.00 |
| Single Female/Mother | 12 (16.0%) | 2.17 |
| Total Families | 75 (100.0%) | 3.73 |
Median Household Size in Braswell
The median household size in Braswell is 3.05 persons per household, with married-couple households (59 | 48.8%) accounting for the largest median household size of 4.59 persons per household. non-family households (46 | 38.0%) represent the smallest median household size with 1.24 persons per household.
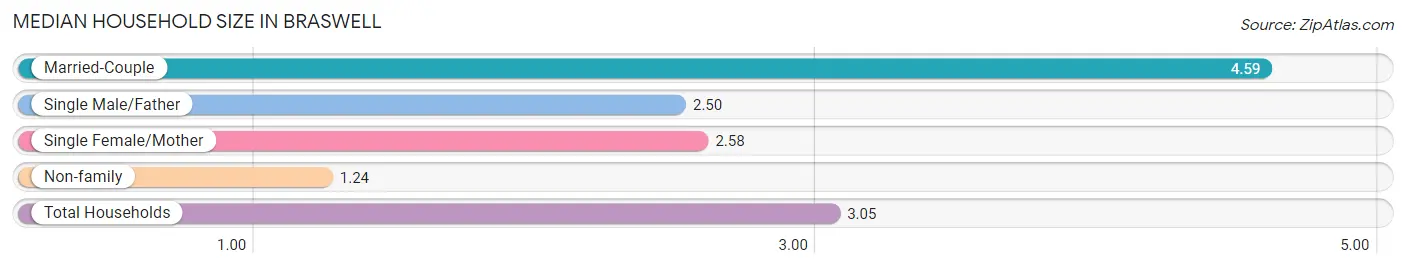
| Household Type | # Households | Household Size |
| Married-Couple | 59 (48.8%) | 4.59 |
| Single Male/Father | 4 (3.3%) | 2.50 |
| Single Female/Mother | 12 (9.9%) | 2.58 |
| Non-family | 46 (38.0%) | 1.24 |
| Total Households | 121 (100.0%) | 3.05 |
Household Size by Marriage Status in Braswell
Out of a total of 121 households in Braswell, 75 (62.0%) are family households, while 46 (38.0%) are nonfamily households. The most numerous type of family households are 5-person households, comprising 30, and the most common type of nonfamily households are 1-person households, comprising 33.
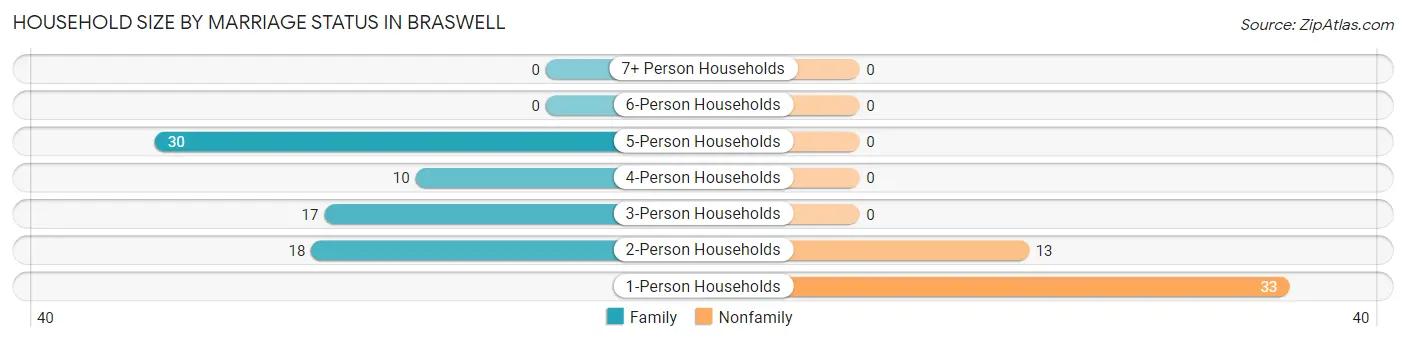
| Household Size | Family Households | Nonfamily Households |
| 1-Person Households | - | 33 (27.3%) |
| 2-Person Households | 18 (14.9%) | 13 (10.7%) |
| 3-Person Households | 17 (14.1%) | 0 (0.0%) |
| 4-Person Households | 10 (8.3%) | 0 (0.0%) |
| 5-Person Households | 30 (24.8%) | 0 (0.0%) |
| 6-Person Households | 0 (0.0%) | 0 (0.0%) |
| 7+ Person Households | 0 (0.0%) | 0 (0.0%) |
| Total | 75 (62.0%) | 46 (38.0%) |
Female Fertility in Braswell
Fertility by Age in Braswell
Average fertility rate in Braswell is 90.0 births per 1,000 women. Women in the age bracket of 35 to 50 years have the highest fertility rate with 171.0 births per 1,000 women. Women in the age bracket of 35 to 50 years acount for 100.0% of all women with births.
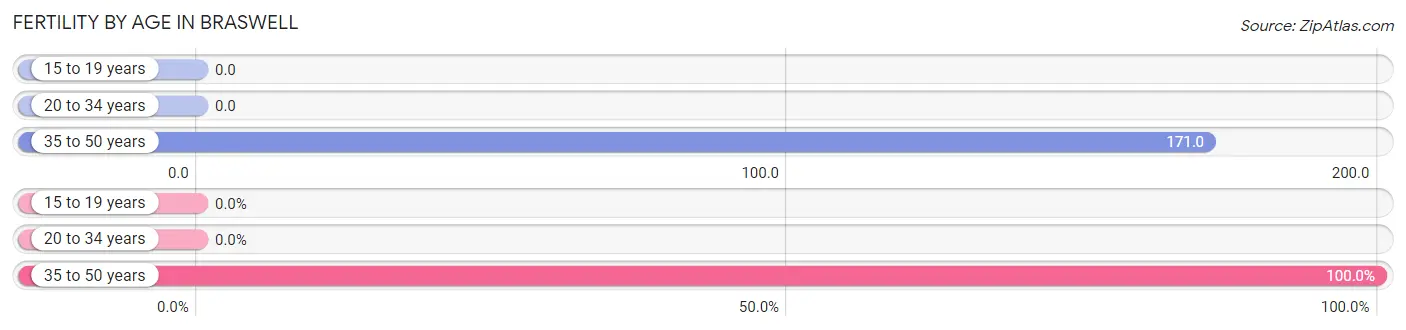
| Age Bracket | Women with Births | Births / 1,000 Women |
| 15 to 19 years | 0 (0.0%) | 0.0 |
| 20 to 34 years | 0 (0.0%) | 0.0 |
| 35 to 50 years | 7 (100.0%) | 171.0 |
| Total | 7 (100.0%) | 90.0 |
Fertility by Age by Marriage Status in Braswell
42.9% of women with births (7) in Braswell are married. The highest percentage of unmarried women with births falls into 35 to 50 years age bracket with 57.1% of them unmarried at the time of birth, while the lowest percentage of unmarried women with births belong to 35 to 50 years age bracket with 57.1% of them unmarried.
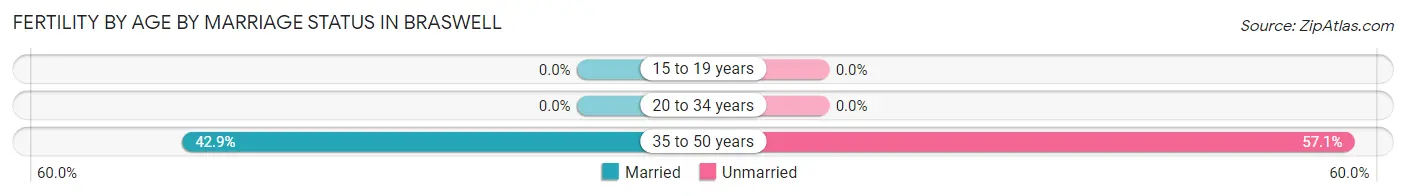
| Age Bracket | Married | Unmarried |
| 15 to 19 years | 0 (0.0%) | 0 (0.0%) |
| 20 to 34 years | 0 (0.0%) | 0 (0.0%) |
| 35 to 50 years | 3 (42.9%) | 4 (57.1%) |
| Total | 3 (42.9%) | 4 (57.1%) |
Fertility by Education in Braswell
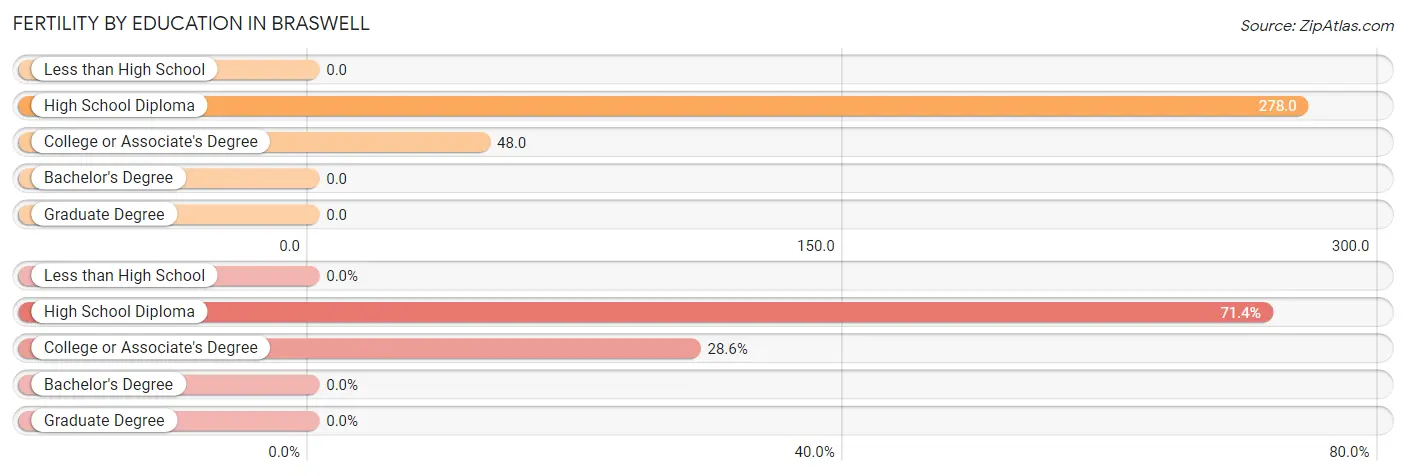
| Educational Attainment | Women with Births | Births / 1,000 Women |
| Less than High School | 0 (0.0%) | 0.0 |
| High School Diploma | 5 (71.4%) | 278.0 |
| College or Associate's Degree | 2 (28.6%) | 48.0 |
| Bachelor's Degree | 0 (0.0%) | 0.0 |
| Graduate Degree | 0 (0.0%) | 0.0 |
| Total | 7 (100.0%) | 90.0 |
Fertility by Education by Marriage Status in Braswell
57.1% of women with births in Braswell are unmarried. Women with the educational attainment of college or associate's degree are most likely to be married with 100.0% of them married at childbirth, while women with the educational attainment of high school diploma are least likely to be married with 80.0% of them unmarried at childbirth.
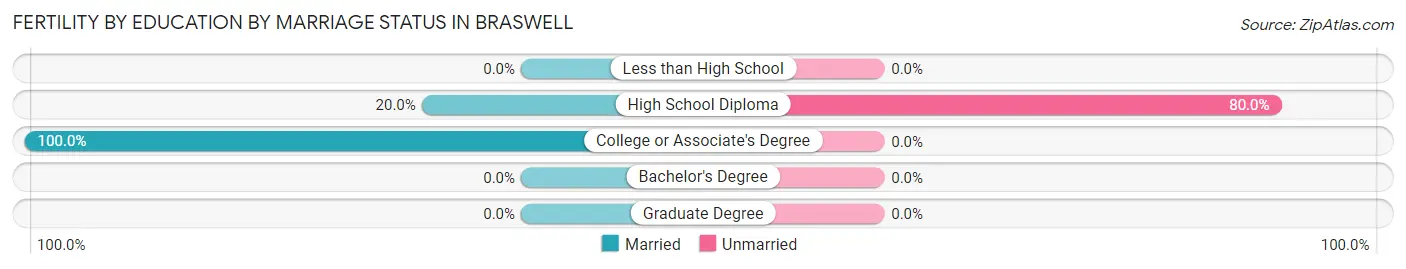
| Educational Attainment | Married | Unmarried |
| Less than High School | 0 (0.0%) | 0 (0.0%) |
| High School Diploma | 1 (20.0%) | 4 (80.0%) |
| College or Associate's Degree | 2 (100.0%) | 0 (0.0%) |
| Bachelor's Degree | 0 (0.0%) | 0 (0.0%) |
| Graduate Degree | 0 (0.0%) | 0 (0.0%) |
| Total | 3 (42.9%) | 4 (57.1%) |
Employment Characteristics in Braswell
Employment by Class of Employer in Braswell
Among the 164 employed individuals in Braswell, private company employees (115 | 70.1%), local government employees (33 | 20.1%), and not-for-profit organizations (9 | 5.5%) make up the most common classes of employment.
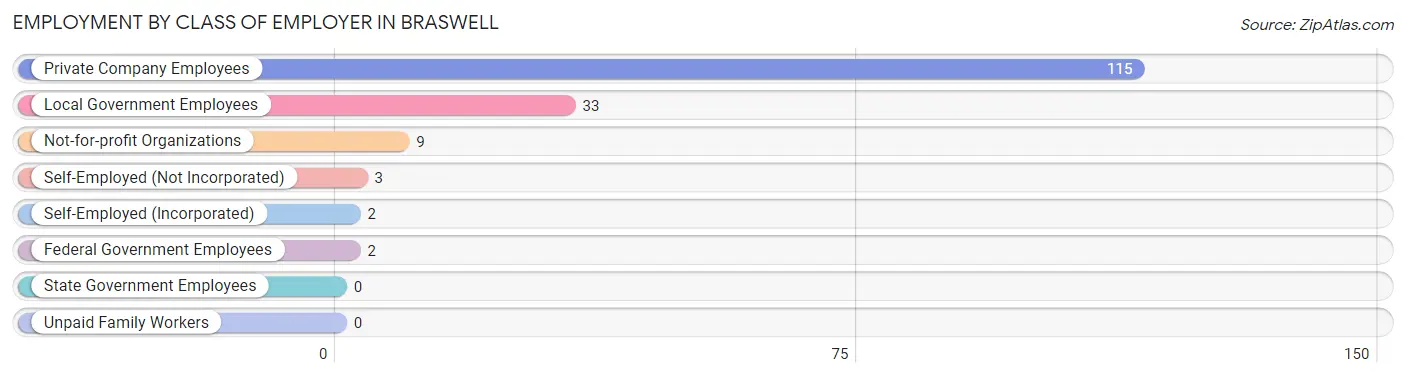
| Employer Class | # Employees | % Employees |
| Private Company Employees | 115 | 70.1% |
| Self-Employed (Incorporated) | 2 | 1.2% |
| Self-Employed (Not Incorporated) | 3 | 1.8% |
| Not-for-profit Organizations | 9 | 5.5% |
| Local Government Employees | 33 | 20.1% |
| State Government Employees | 0 | 0.0% |
| Federal Government Employees | 2 | 1.2% |
| Unpaid Family Workers | 0 | 0.0% |
| Total | 164 | 100.0% |
Employment Status by Age in Braswell
According to the labor force statistics for Braswell, out of the total population over 16 years of age (251), 67.3% or 169 individuals are in the labor force, with 3.0% or 5 of them unemployed. The age group with the highest labor force participation rate is 60 to 64 years, with 95.2% or 20 individuals in the labor force. Within the labor force, the 55 to 59 years age range has the highest percentage of unemployed individuals, with 18.8% or 3 of them being unemployed.
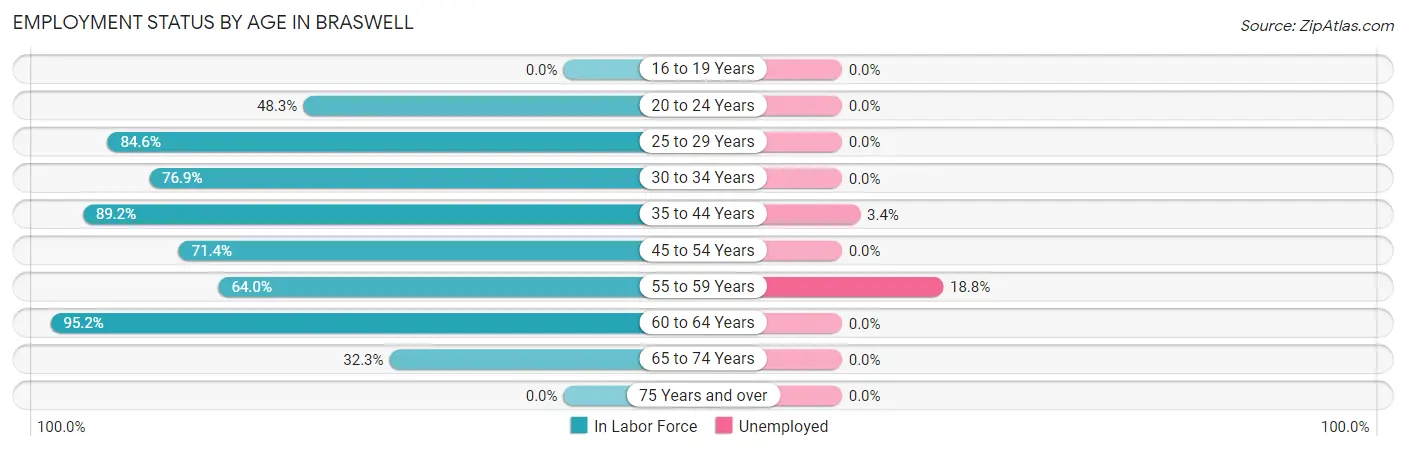
| Age Bracket | In Labor Force | Unemployed |
| 16 to 19 Years | 0 (0.0%) | 0 (0.0%) |
| 20 to 24 Years | 14 (48.3%) | 0 (0.0%) |
| 25 to 29 Years | 11 (84.6%) | 0 (0.0%) |
| 30 to 34 Years | 10 (76.9%) | 0 (0.0%) |
| 35 to 44 Years | 58 (89.2%) | 2 (3.4%) |
| 45 to 54 Years | 30 (71.4%) | 0 (0.0%) |
| 55 to 59 Years | 16 (64.0%) | 3 (18.8%) |
| 60 to 64 Years | 20 (95.2%) | 0 (0.0%) |
| 65 to 74 Years | 10 (32.3%) | 0 (0.0%) |
| 75 Years and over | 0 (0.0%) | 0 (0.0%) |
| Total | 169 (67.3%) | 5 (3.0%) |
Employment Status by Educational Attainment in Braswell
According to labor force statistics for Braswell, 81.0% of individuals (145) out of the total population between 25 and 64 years of age (179) are in the labor force, with 3.4% or 5 of them being unemployed. The group with the highest labor force participation rate are those with the educational attainment of college / associate degree, with 88.1% or 59 individuals in the labor force. Within the labor force, individuals with bachelor's degree or higher education have the highest percentage of unemployment, with 12.5% or 3 of them being unemployed.
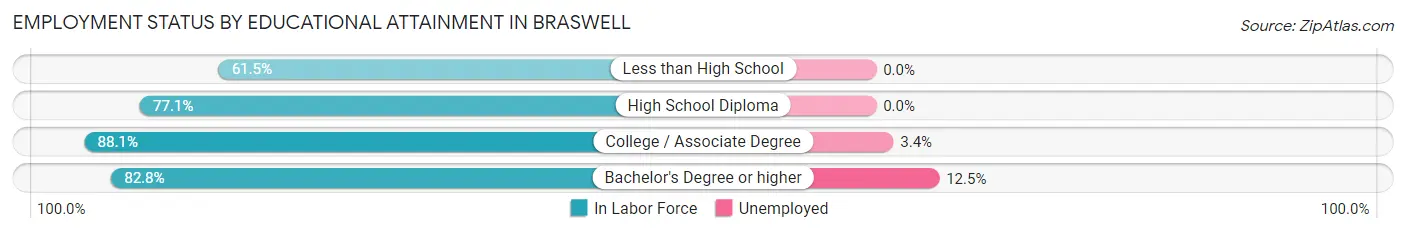
| Educational Attainment | In Labor Force | Unemployed |
| Less than High School | 8 (61.5%) | 0 (0.0%) |
| High School Diploma | 54 (77.1%) | 0 (0.0%) |
| College / Associate Degree | 59 (88.1%) | 2 (3.4%) |
| Bachelor's Degree or higher | 24 (82.8%) | 4 (12.5%) |
| Total | 145 (81.0%) | 6 (3.4%) |
Employment Occupations by Sex in Braswell
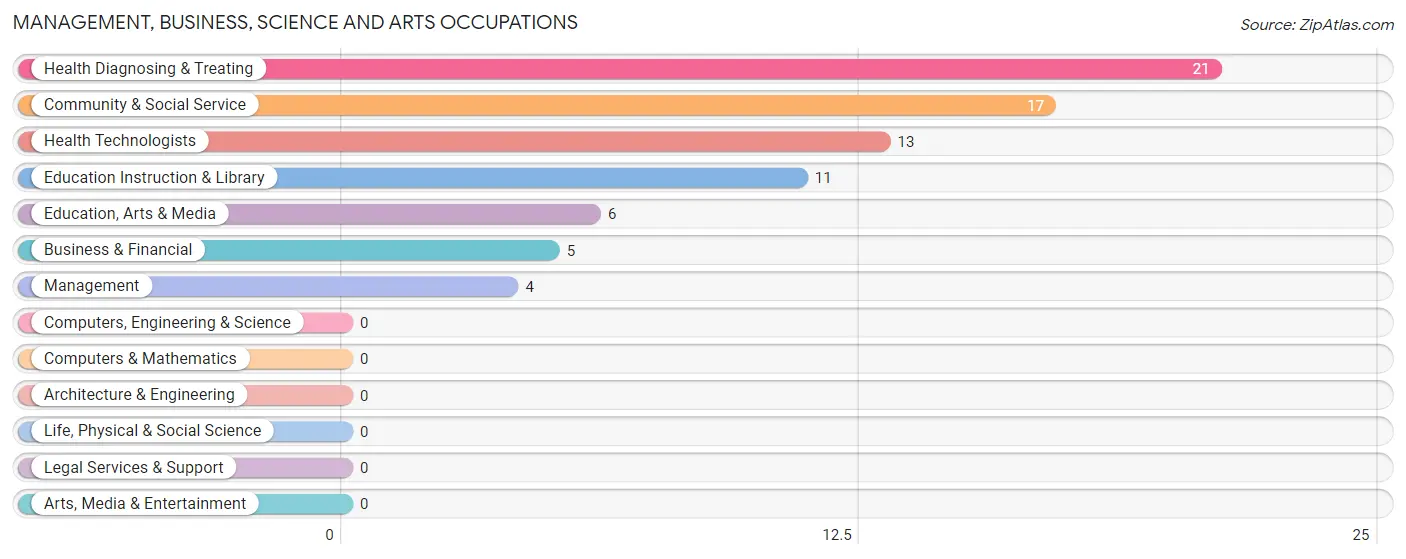
Management, Business, Science and Arts Occupations
The most common Management, Business, Science and Arts occupations in Braswell are Health Diagnosing & Treating (21 | 12.8%), Community & Social Service (17 | 10.4%), Health Technologists (13 | 7.9%), Education Instruction & Library (11 | 6.7%), and Education, Arts & Media (6 | 3.7%).
Management, Business, Science and Arts Occupations by Sex
Within the Management, Business, Science and Arts occupations in Braswell, the most male-oriented occupations are Management (100.0%), Business & Financial (100.0%), and Education, Arts & Media (100.0%), while the most female-oriented occupations are Education Instruction & Library (100.0%), Health Diagnosing & Treating (100.0%), and Health Technologists (100.0%).
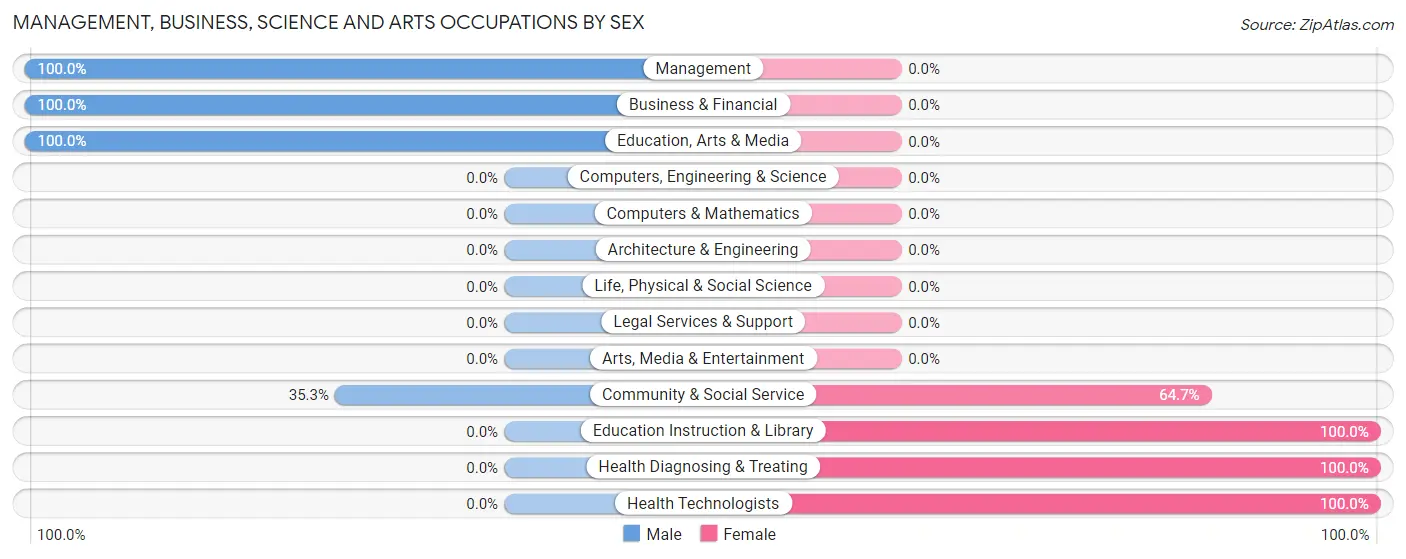
| Occupation | Male | Female |
| Management | 4 (100.0%) | 0 (0.0%) |
| Business & Financial | 5 (100.0%) | 0 (0.0%) |
| Computers, Engineering & Science | 0 (0.0%) | 0 (0.0%) |
| Computers & Mathematics | 0 (0.0%) | 0 (0.0%) |
| Architecture & Engineering | 0 (0.0%) | 0 (0.0%) |
| Life, Physical & Social Science | 0 (0.0%) | 0 (0.0%) |
| Community & Social Service | 6 (35.3%) | 11 (64.7%) |
| Education, Arts & Media | 6 (100.0%) | 0 (0.0%) |
| Legal Services & Support | 0 (0.0%) | 0 (0.0%) |
| Education Instruction & Library | 0 (0.0%) | 11 (100.0%) |
| Arts, Media & Entertainment | 0 (0.0%) | 0 (0.0%) |
| Health Diagnosing & Treating | 0 (0.0%) | 21 (100.0%) |
| Health Technologists | 0 (0.0%) | 13 (100.0%) |
| Total (Category) | 15 (31.9%) | 32 (68.1%) |
| Total (Overall) | 84 (51.2%) | 80 (48.8%) |
Services Occupations
The most common Services occupations in Braswell are Food Preparation & Serving (15 | 9.1%), Security & Protection (9 | 5.5%), Firefighting & Prevention (6 | 3.7%), Healthcare Support (5 | 3.0%), and Law Enforcement (3 | 1.8%).
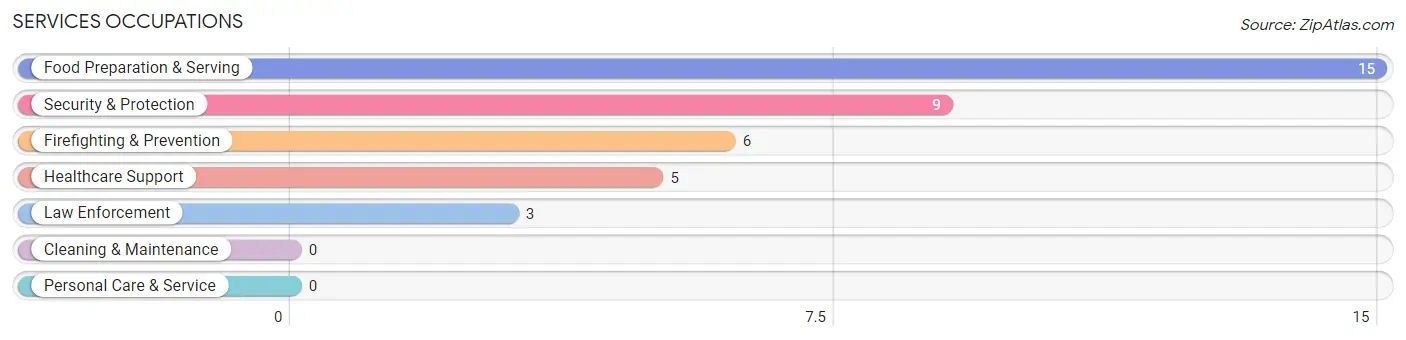
Services Occupations by Sex
Within the Services occupations in Braswell, the most male-oriented occupations are Firefighting & Prevention (100.0%), Security & Protection (88.9%), and Law Enforcement (66.7%), while the most female-oriented occupations are Healthcare Support (100.0%), Food Preparation & Serving (93.3%), and Law Enforcement (33.3%).
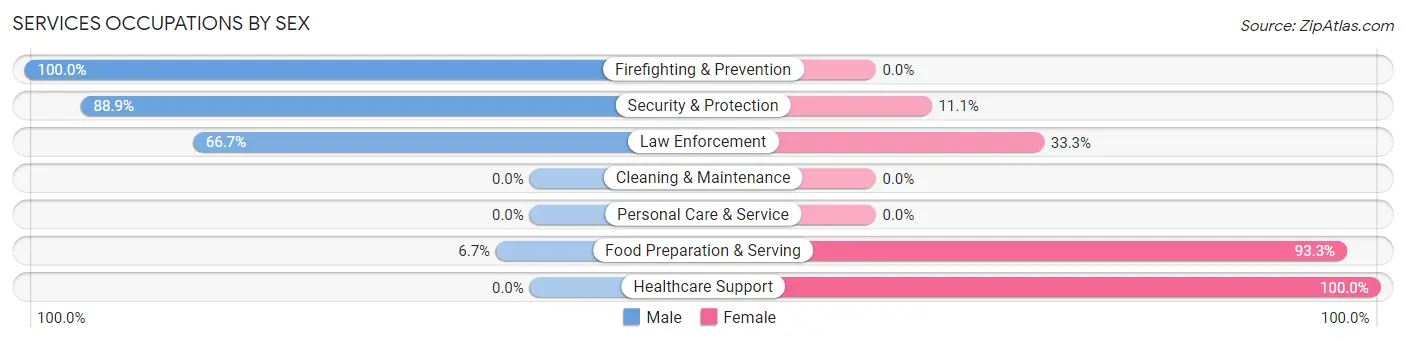
| Occupation | Male | Female |
| Healthcare Support | 0 (0.0%) | 5 (100.0%) |
| Security & Protection | 8 (88.9%) | 1 (11.1%) |
| Firefighting & Prevention | 6 (100.0%) | 0 (0.0%) |
| Law Enforcement | 2 (66.7%) | 1 (33.3%) |
| Food Preparation & Serving | 1 (6.7%) | 14 (93.3%) |
| Cleaning & Maintenance | 0 (0.0%) | 0 (0.0%) |
| Personal Care & Service | 0 (0.0%) | 0 (0.0%) |
| Total (Category) | 9 (31.0%) | 20 (69.0%) |
| Total (Overall) | 84 (51.2%) | 80 (48.8%) |
Sales and Office Occupations
The most common Sales and Office occupations in Braswell are Office & Administration (16 | 9.8%), and Sales & Related (6 | 3.7%).

Sales and Office Occupations by Sex

| Occupation | Male | Female |
| Sales & Related | 1 (16.7%) | 5 (83.3%) |
| Office & Administration | 11 (68.8%) | 5 (31.2%) |
| Total (Category) | 12 (54.5%) | 10 (45.5%) |
| Total (Overall) | 84 (51.2%) | 80 (48.8%) |
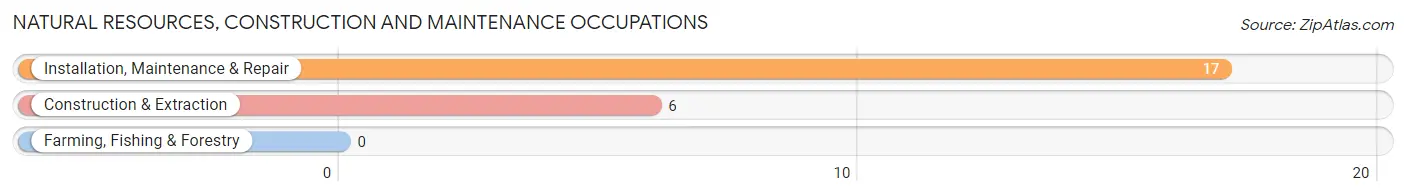
Natural Resources, Construction and Maintenance Occupations
The most common Natural Resources, Construction and Maintenance occupations in Braswell are Installation, Maintenance & Repair (17 | 10.4%), and Construction & Extraction (6 | 3.7%).
Natural Resources, Construction and Maintenance Occupations by Sex
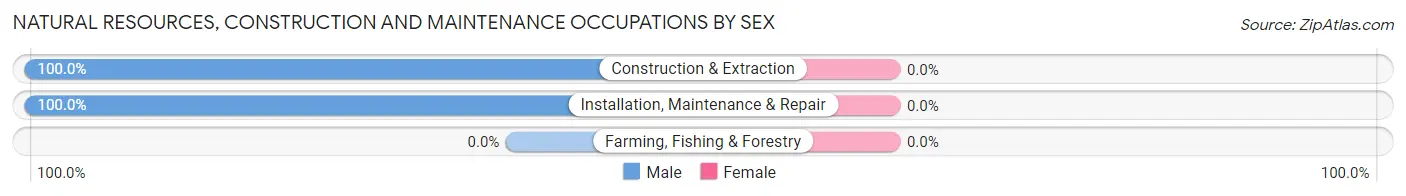
| Occupation | Male | Female |
| Farming, Fishing & Forestry | 0 (0.0%) | 0 (0.0%) |
| Construction & Extraction | 6 (100.0%) | 0 (0.0%) |
| Installation, Maintenance & Repair | 17 (100.0%) | 0 (0.0%) |
| Total (Category) | 23 (100.0%) | 0 (0.0%) |
| Total (Overall) | 84 (51.2%) | 80 (48.8%) |
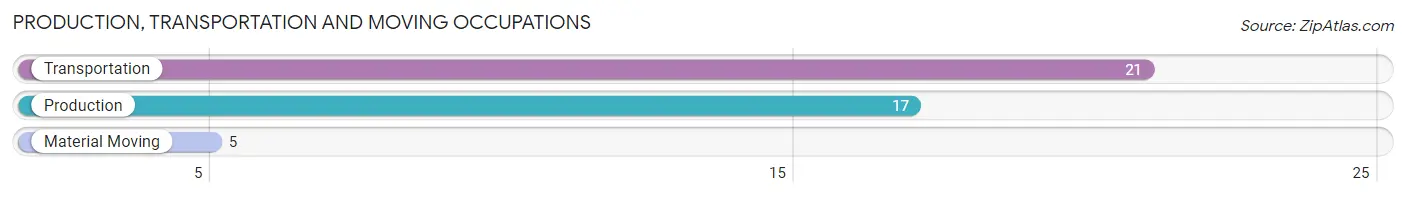
Production, Transportation and Moving Occupations
The most common Production, Transportation and Moving occupations in Braswell are Transportation (21 | 12.8%), Production (17 | 10.4%), and Material Moving (5 | 3.0%).
Production, Transportation and Moving Occupations by Sex
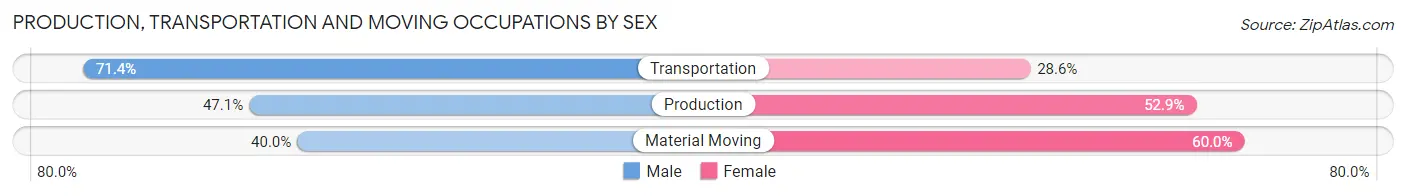
| Occupation | Male | Female |
| Production | 8 (47.1%) | 9 (52.9%) |
| Transportation | 15 (71.4%) | 6 (28.6%) |
| Material Moving | 2 (40.0%) | 3 (60.0%) |
| Total (Category) | 25 (58.1%) | 18 (41.9%) |
| Total (Overall) | 84 (51.2%) | 80 (48.8%) |
Employment Industries by Sex in Braswell
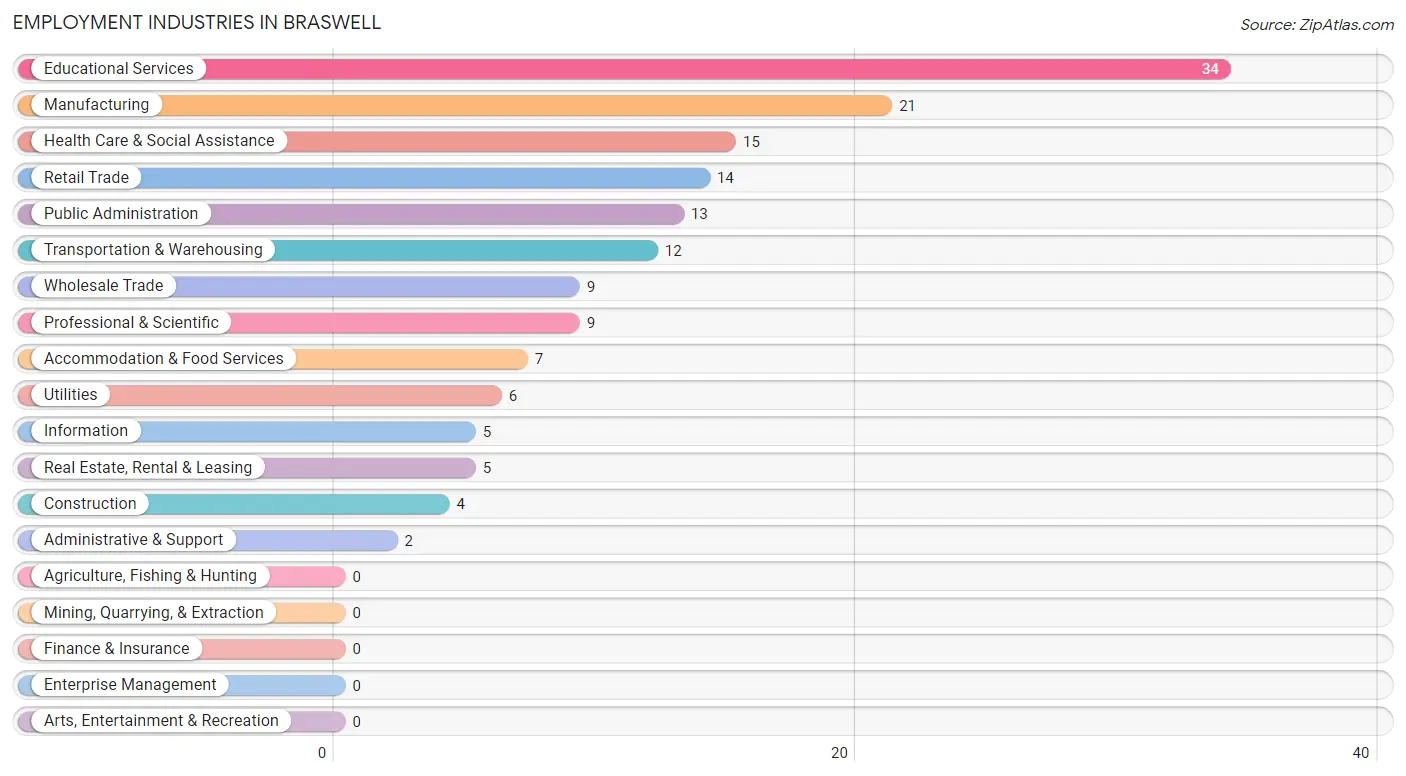
Employment Industries in Braswell
The major employment industries in Braswell include Educational Services (34 | 20.7%), Manufacturing (21 | 12.8%), Health Care & Social Assistance (15 | 9.1%), Retail Trade (14 | 8.5%), and Public Administration (13 | 7.9%).
Employment Industries by Sex in Braswell
The Braswell industries that see more men than women are Construction (100.0%), Transportation & Warehousing (100.0%), and Utilities (100.0%), whereas the industries that tend to have a higher number of women are Administrative & Support (100.0%), Educational Services (100.0%), and Health Care & Social Assistance (100.0%).
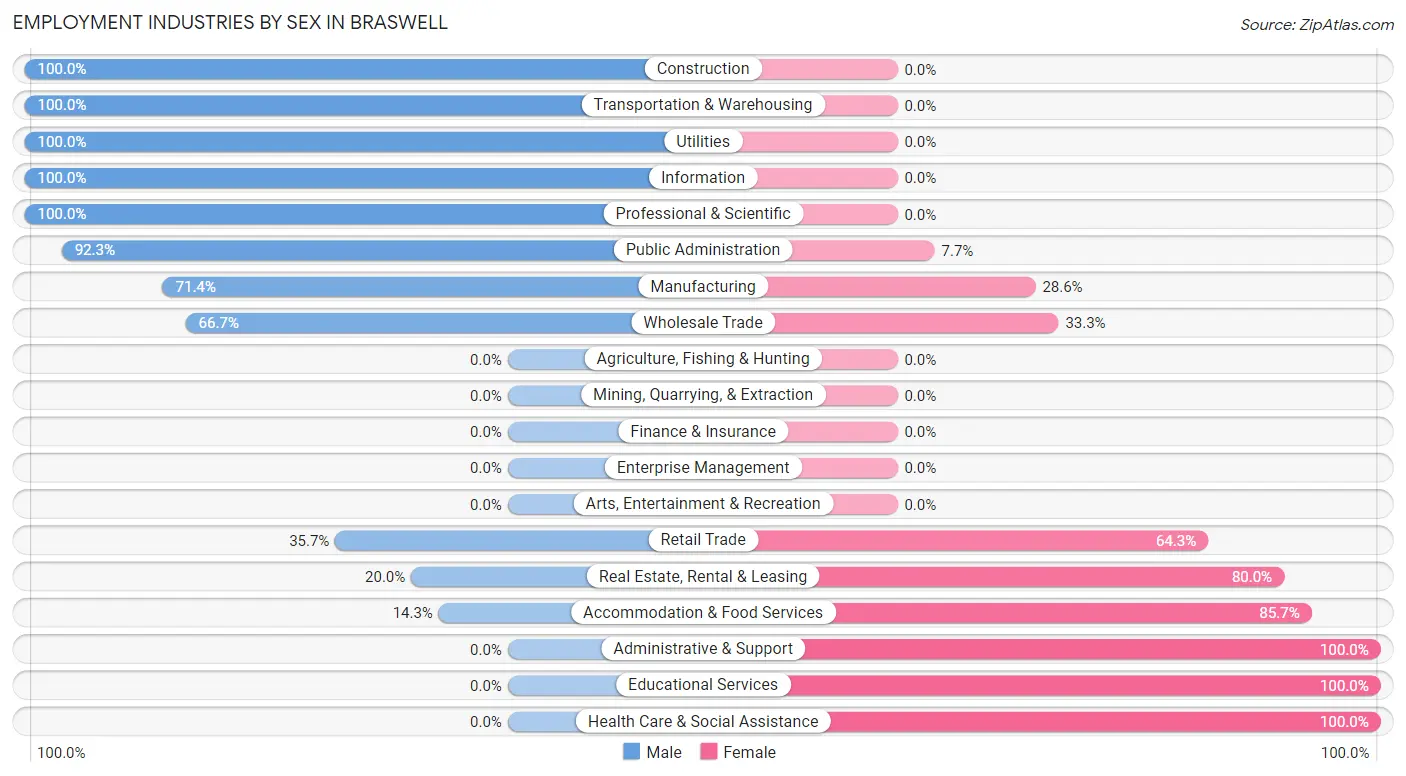
| Industry | Male | Female |
| Agriculture, Fishing & Hunting | 0 (0.0%) | 0 (0.0%) |
| Mining, Quarrying, & Extraction | 0 (0.0%) | 0 (0.0%) |
| Construction | 4 (100.0%) | 0 (0.0%) |
| Manufacturing | 15 (71.4%) | 6 (28.6%) |
| Wholesale Trade | 6 (66.7%) | 3 (33.3%) |
| Retail Trade | 5 (35.7%) | 9 (64.3%) |
| Transportation & Warehousing | 12 (100.0%) | 0 (0.0%) |
| Utilities | 6 (100.0%) | 0 (0.0%) |
| Information | 5 (100.0%) | 0 (0.0%) |
| Finance & Insurance | 0 (0.0%) | 0 (0.0%) |
| Real Estate, Rental & Leasing | 1 (20.0%) | 4 (80.0%) |
| Professional & Scientific | 9 (100.0%) | 0 (0.0%) |
| Enterprise Management | 0 (0.0%) | 0 (0.0%) |
| Administrative & Support | 0 (0.0%) | 2 (100.0%) |
| Educational Services | 0 (0.0%) | 34 (100.0%) |
| Health Care & Social Assistance | 0 (0.0%) | 15 (100.0%) |
| Arts, Entertainment & Recreation | 0 (0.0%) | 0 (0.0%) |
| Accommodation & Food Services | 1 (14.3%) | 6 (85.7%) |
| Public Administration | 12 (92.3%) | 1 (7.7%) |
| Total | 84 (51.2%) | 80 (48.8%) |
Education in Braswell
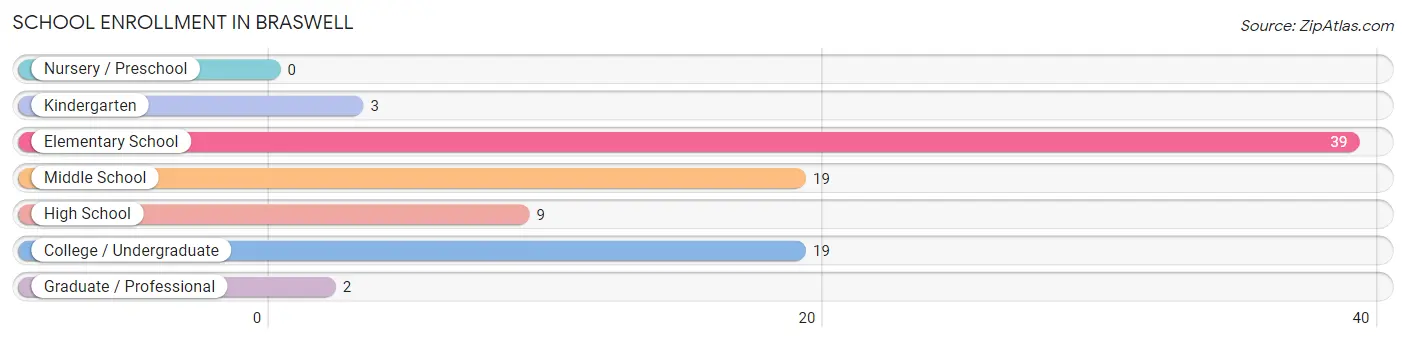
School Enrollment in Braswell
The most common levels of schooling among the 91 students in Braswell are elementary school (39 | 42.9%), middle school (19 | 20.9%), and college / undergraduate (19 | 20.9%).
| School Level | # Students | % Students |
| Nursery / Preschool | 0 | 0.0% |
| Kindergarten | 3 | 3.3% |
| Elementary School | 39 | 42.9% |
| Middle School | 19 | 20.9% |
| High School | 9 | 9.9% |
| College / Undergraduate | 19 | 20.9% |
| Graduate / Professional | 2 | 2.2% |
| Total | 91 | 100.0% |
School Enrollment by Age by Funding Source in Braswell
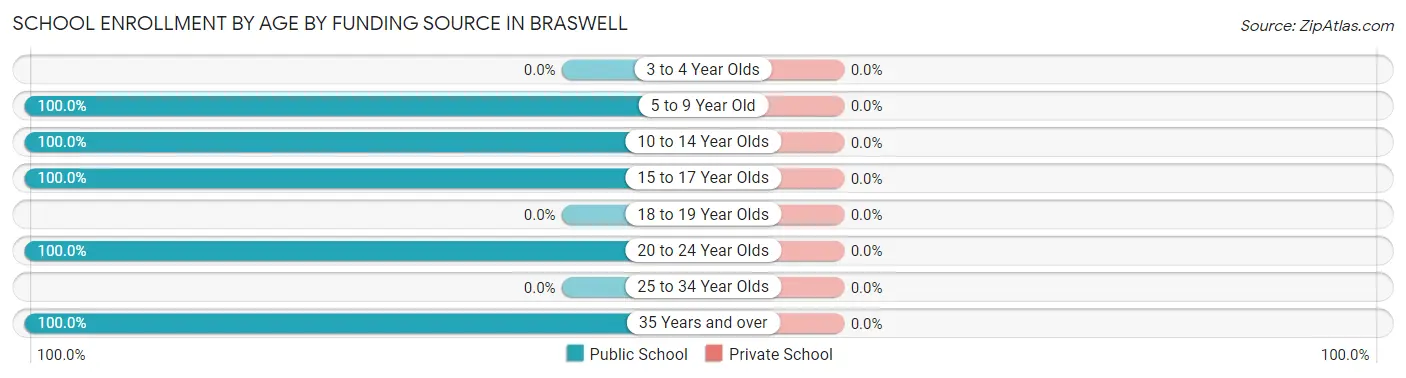
| Age Bracket | Public School | Private School |
| 3 to 4 Year Olds | 0 (0.0%) | 0 (0.0%) |
| 5 to 9 Year Old | 21 (100.0%) | 0 (0.0%) |
| 10 to 14 Year Olds | 43 (100.0%) | 0 (0.0%) |
| 15 to 17 Year Olds | 6 (100.0%) | 0 (0.0%) |
| 18 to 19 Year Olds | 0 (0.0%) | 0 (0.0%) |
| 20 to 24 Year Olds | 11 (100.0%) | 0 (0.0%) |
| 25 to 34 Year Olds | 0 (0.0%) | 0 (0.0%) |
| 35 Years and over | 10 (100.0%) | 0 (0.0%) |
| Total | 91 (100.0%) | 0 (0.0%) |
Educational Attainment by Field of Study in Braswell
Science & technology (8 | 21.0%), education (7 | 18.4%), liberal arts & history (7 | 18.4%), computers & mathematics (6 | 15.8%), and engineering (5 | 13.2%) are the most common fields of study among 38 individuals in Braswell who have obtained a bachelor's degree or higher.
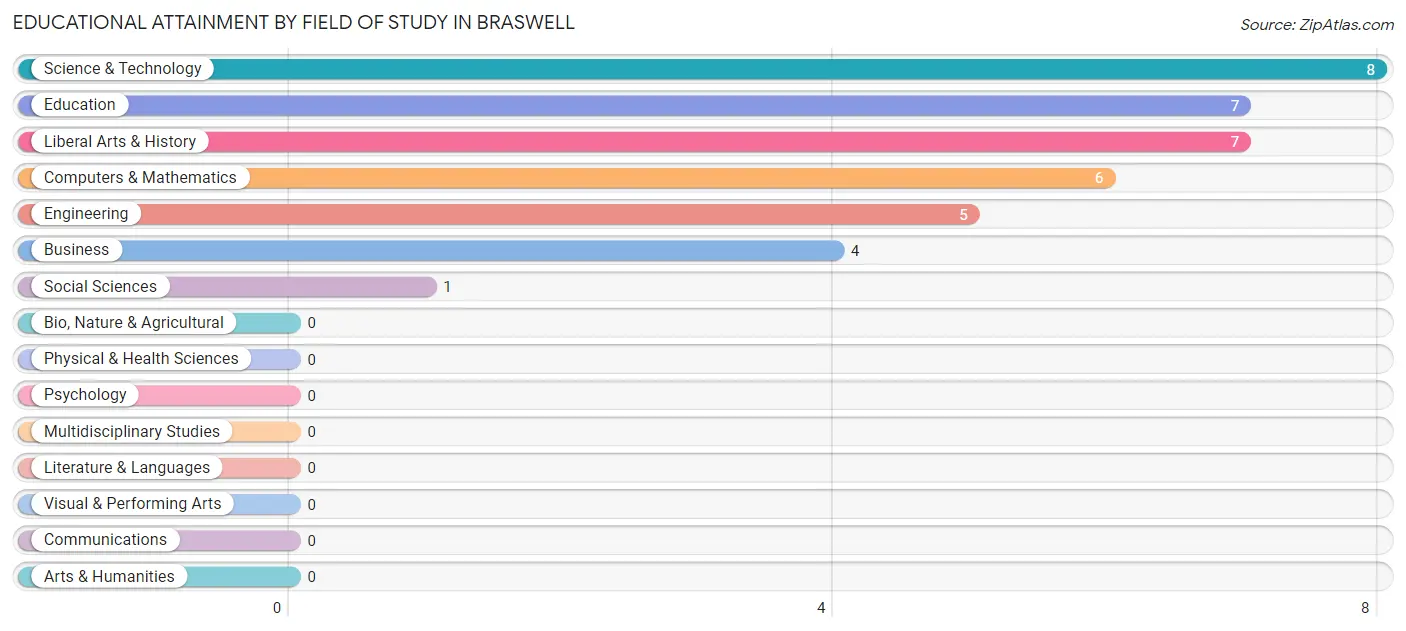
| Field of Study | # Graduates | % Graduates |
| Computers & Mathematics | 6 | 15.8% |
| Bio, Nature & Agricultural | 0 | 0.0% |
| Physical & Health Sciences | 0 | 0.0% |
| Psychology | 0 | 0.0% |
| Social Sciences | 1 | 2.6% |
| Engineering | 5 | 13.2% |
| Multidisciplinary Studies | 0 | 0.0% |
| Science & Technology | 8 | 21.0% |
| Business | 4 | 10.5% |
| Education | 7 | 18.4% |
| Literature & Languages | 0 | 0.0% |
| Liberal Arts & History | 7 | 18.4% |
| Visual & Performing Arts | 0 | 0.0% |
| Communications | 0 | 0.0% |
| Arts & Humanities | 0 | 0.0% |
| Total | 38 | 100.0% |
Transportation & Commute in Braswell
Vehicle Availability by Sex in Braswell
The most prevalent vehicle ownership categories in Braswell are males with 4 vehicles (28, accounting for 33.3%) and females with 4 vehicles (27, making up 35.0%).
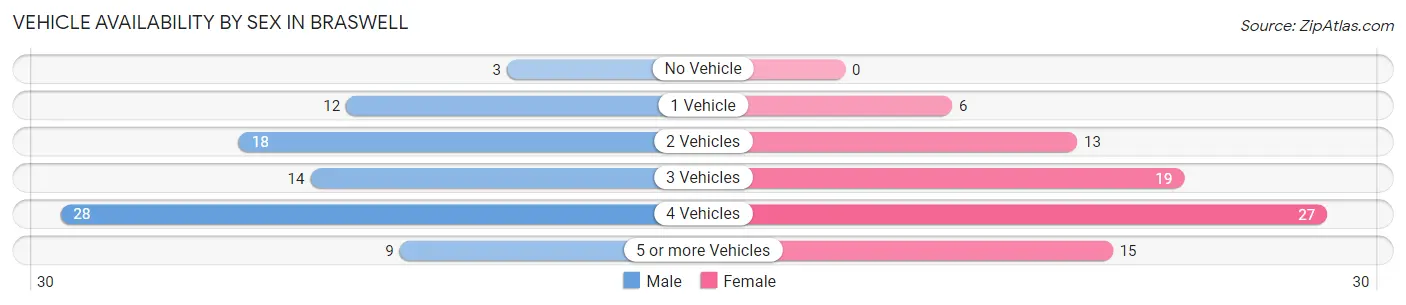
| Vehicles Available | Male | Female |
| No Vehicle | 3 (3.6%) | 0 (0.0%) |
| 1 Vehicle | 12 (14.3%) | 6 (7.5%) |
| 2 Vehicles | 18 (21.4%) | 13 (16.3%) |
| 3 Vehicles | 14 (16.7%) | 19 (23.7%) |
| 4 Vehicles | 28 (33.3%) | 27 (33.8%) |
| 5 or more Vehicles | 9 (10.7%) | 15 (18.8%) |
| Total | 84 (100.0%) | 80 (100.0%) |
Commute Time in Braswell
The most frequently occuring commute durations in Braswell are 45 to 59 minutes (41 commuters, 26.5%), 30 to 34 minutes (30 commuters, 19.4%), and 10 to 14 minutes (16 commuters, 10.3%).
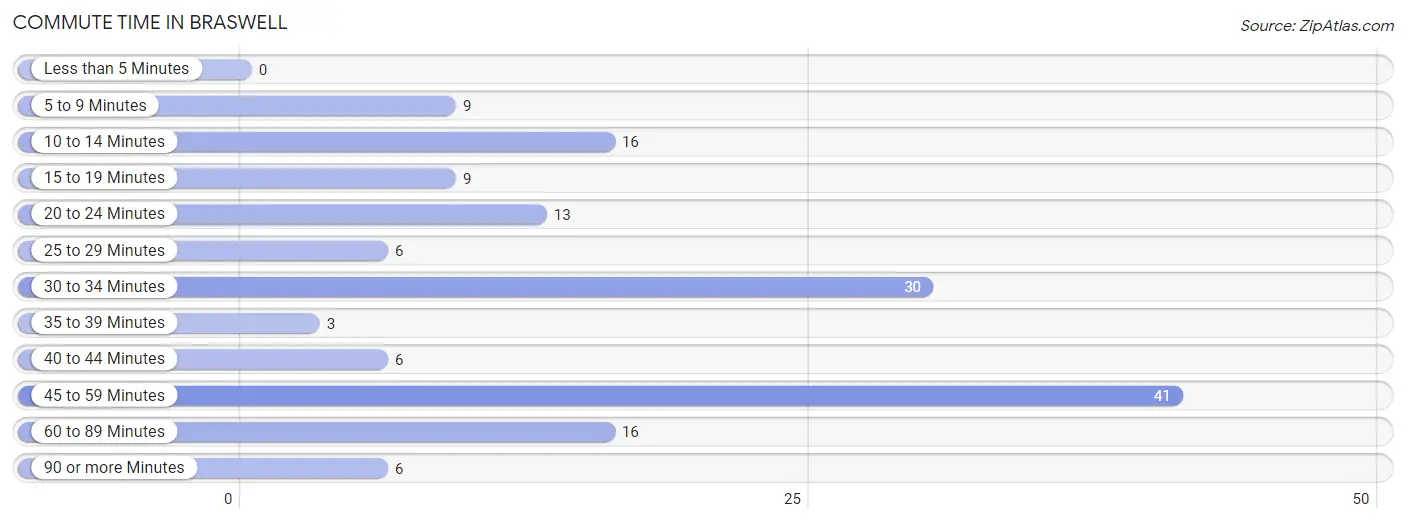
| Commute Time | # Commuters | % Commuters |
| Less than 5 Minutes | 0 | 0.0% |
| 5 to 9 Minutes | 9 | 5.8% |
| 10 to 14 Minutes | 16 | 10.3% |
| 15 to 19 Minutes | 9 | 5.8% |
| 20 to 24 Minutes | 13 | 8.4% |
| 25 to 29 Minutes | 6 | 3.9% |
| 30 to 34 Minutes | 30 | 19.4% |
| 35 to 39 Minutes | 3 | 1.9% |
| 40 to 44 Minutes | 6 | 3.9% |
| 45 to 59 Minutes | 41 | 26.5% |
| 60 to 89 Minutes | 16 | 10.3% |
| 90 or more Minutes | 6 | 3.9% |
Commute Time by Sex in Braswell
The most common commute times in Braswell are 45 to 59 minutes (31 commuters, 41.3%) for males and 30 to 34 minutes (21 commuters, 26.3%) for females.
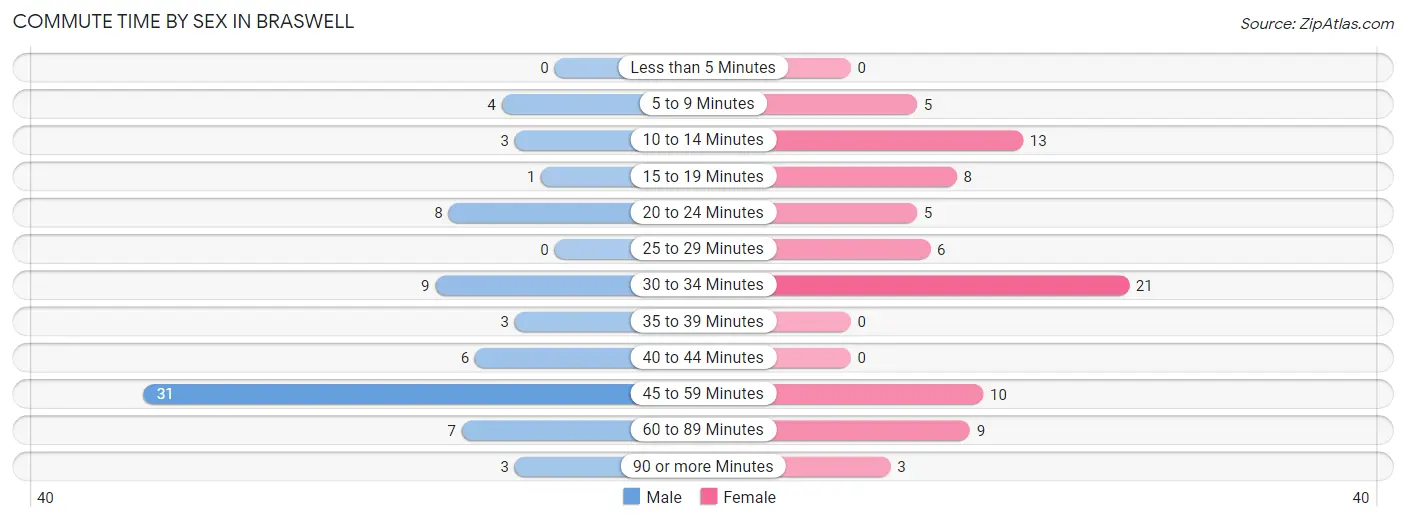
| Commute Time | Male | Female |
| Less than 5 Minutes | 0 (0.0%) | 0 (0.0%) |
| 5 to 9 Minutes | 4 (5.3%) | 5 (6.2%) |
| 10 to 14 Minutes | 3 (4.0%) | 13 (16.3%) |
| 15 to 19 Minutes | 1 (1.3%) | 8 (10.0%) |
| 20 to 24 Minutes | 8 (10.7%) | 5 (6.2%) |
| 25 to 29 Minutes | 0 (0.0%) | 6 (7.5%) |
| 30 to 34 Minutes | 9 (12.0%) | 21 (26.3%) |
| 35 to 39 Minutes | 3 (4.0%) | 0 (0.0%) |
| 40 to 44 Minutes | 6 (8.0%) | 0 (0.0%) |
| 45 to 59 Minutes | 31 (41.3%) | 10 (12.5%) |
| 60 to 89 Minutes | 7 (9.3%) | 9 (11.3%) |
| 90 or more Minutes | 3 (4.0%) | 3 (3.7%) |
Time of Departure to Work by Sex in Braswell
The most frequent times of departure to work in Braswell are 4:00 PM to 11:59 PM (18, 24.0%) for males and 7:00 AM to 7:29 AM (24, 30.0%) for females.
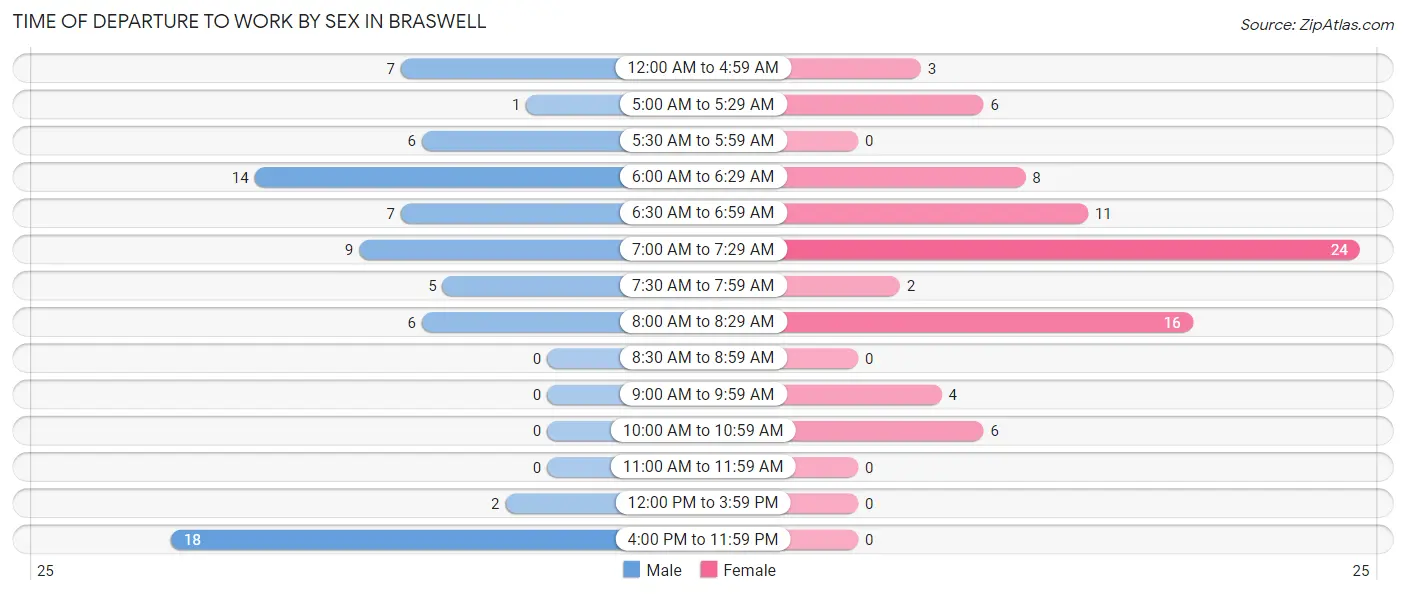
| Time of Departure | Male | Female |
| 12:00 AM to 4:59 AM | 7 (9.3%) | 3 (3.7%) |
| 5:00 AM to 5:29 AM | 1 (1.3%) | 6 (7.5%) |
| 5:30 AM to 5:59 AM | 6 (8.0%) | 0 (0.0%) |
| 6:00 AM to 6:29 AM | 14 (18.7%) | 8 (10.0%) |
| 6:30 AM to 6:59 AM | 7 (9.3%) | 11 (13.8%) |
| 7:00 AM to 7:29 AM | 9 (12.0%) | 24 (30.0%) |
| 7:30 AM to 7:59 AM | 5 (6.7%) | 2 (2.5%) |
| 8:00 AM to 8:29 AM | 6 (8.0%) | 16 (20.0%) |
| 8:30 AM to 8:59 AM | 0 (0.0%) | 0 (0.0%) |
| 9:00 AM to 9:59 AM | 0 (0.0%) | 4 (5.0%) |
| 10:00 AM to 10:59 AM | 0 (0.0%) | 6 (7.5%) |
| 11:00 AM to 11:59 AM | 0 (0.0%) | 0 (0.0%) |
| 12:00 PM to 3:59 PM | 2 (2.7%) | 0 (0.0%) |
| 4:00 PM to 11:59 PM | 18 (24.0%) | 0 (0.0%) |
| Total | 75 (100.0%) | 80 (100.0%) |
Housing Occupancy in Braswell
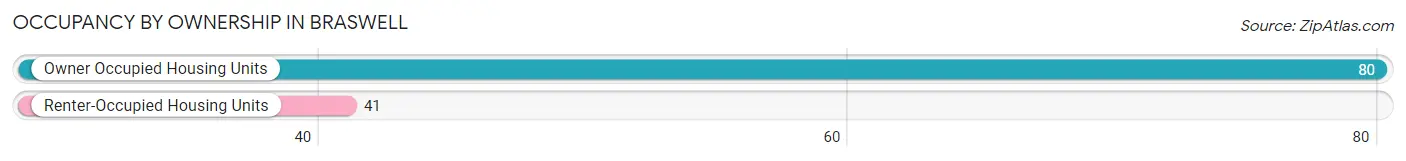
Occupancy by Ownership in Braswell
Of the total 121 dwellings in Braswell, owner-occupied units account for 80 (66.1%), while renter-occupied units make up 41 (33.9%).
| Occupancy | # Housing Units | % Housing Units |
| Owner Occupied Housing Units | 80 | 66.1% |
| Renter-Occupied Housing Units | 41 | 33.9% |
| Total Occupied Housing Units | 121 | 100.0% |
Occupancy by Household Size in Braswell
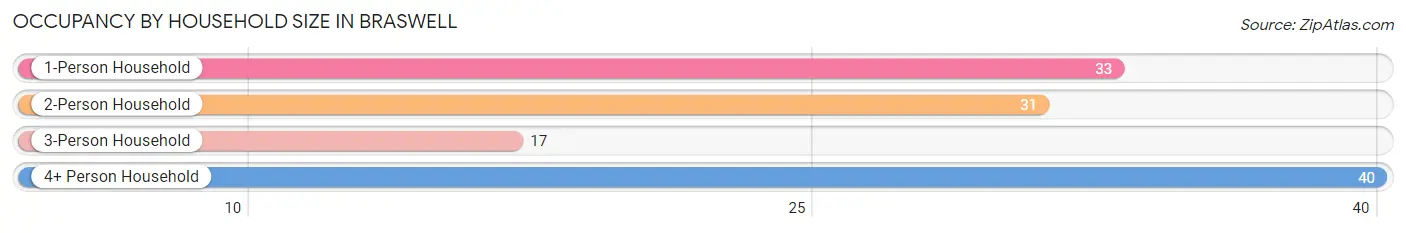
| Household Size | # Housing Units | % Housing Units |
| 1-Person Household | 33 | 27.3% |
| 2-Person Household | 31 | 25.6% |
| 3-Person Household | 17 | 14.1% |
| 4+ Person Household | 40 | 33.1% |
| Total Housing Units | 121 | 100.0% |
Occupancy by Ownership by Household Size in Braswell
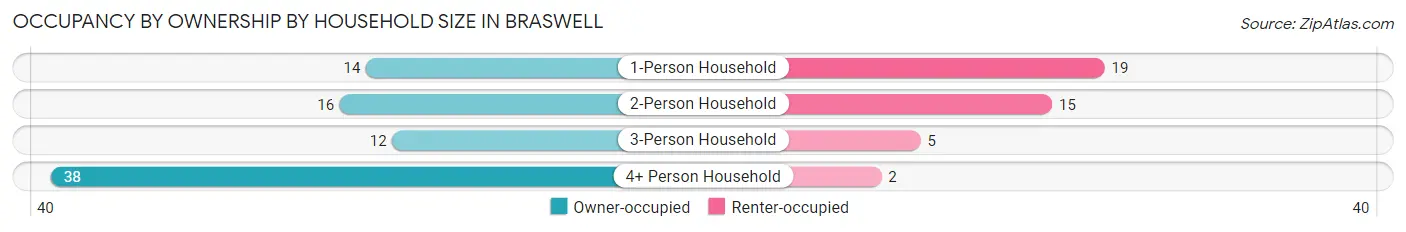
| Household Size | Owner-occupied | Renter-occupied |
| 1-Person Household | 14 (42.4%) | 19 (57.6%) |
| 2-Person Household | 16 (51.6%) | 15 (48.4%) |
| 3-Person Household | 12 (70.6%) | 5 (29.4%) |
| 4+ Person Household | 38 (95.0%) | 2 (5.0%) |
| Total Housing Units | 80 (66.1%) | 41 (33.9%) |
Occupancy by Educational Attainment in Braswell
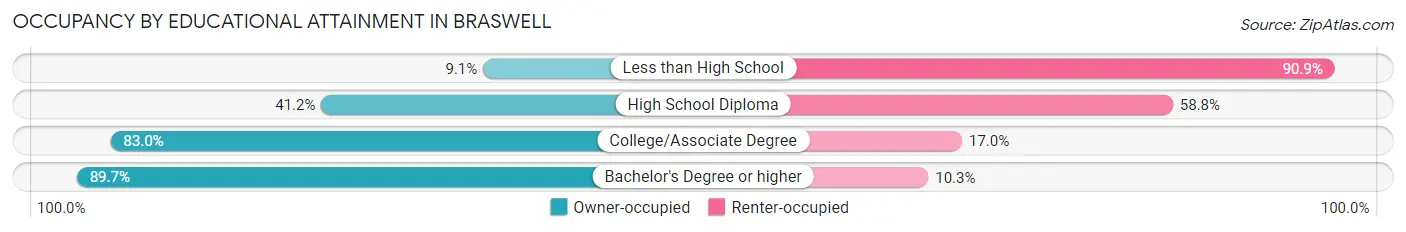
| Household Size | Owner-occupied | Renter-occupied |
| Less than High School | 1 (9.1%) | 10 (90.9%) |
| High School Diploma | 14 (41.2%) | 20 (58.8%) |
| College/Associate Degree | 39 (83.0%) | 8 (17.0%) |
| Bachelor's Degree or higher | 26 (89.7%) | 3 (10.3%) |
Occupancy by Age of Householder in Braswell
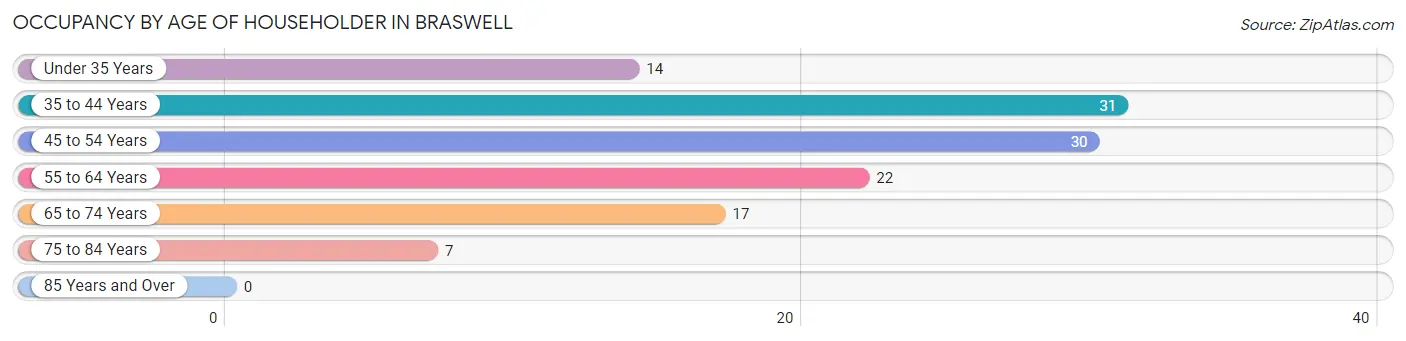
| Age Bracket | # Households | % Households |
| Under 35 Years | 14 | 11.6% |
| 35 to 44 Years | 31 | 25.6% |
| 45 to 54 Years | 30 | 24.8% |
| 55 to 64 Years | 22 | 18.2% |
| 65 to 74 Years | 17 | 14.1% |
| 75 to 84 Years | 7 | 5.8% |
| 85 Years and Over | 0 | 0.0% |
| Total | 121 | 100.0% |
Housing Finances in Braswell
Median Income by Occupancy in Braswell
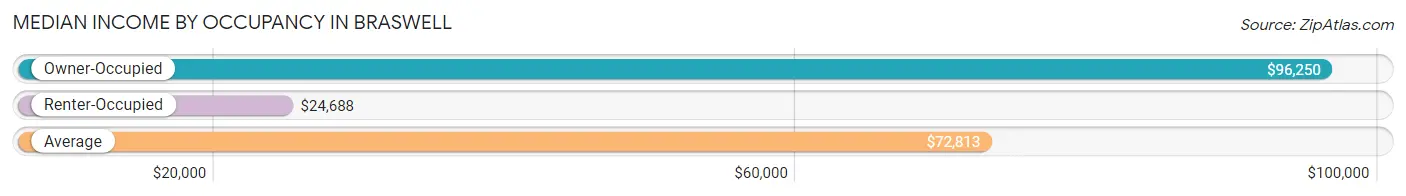
| Occupancy Type | # Households | Median Income |
| Owner-Occupied | 80 (66.1%) | $96,250 |
| Renter-Occupied | 41 (33.9%) | $24,688 |
| Average | 121 (100.0%) | $72,813 |
Occupancy by Householder Income Bracket in Braswell
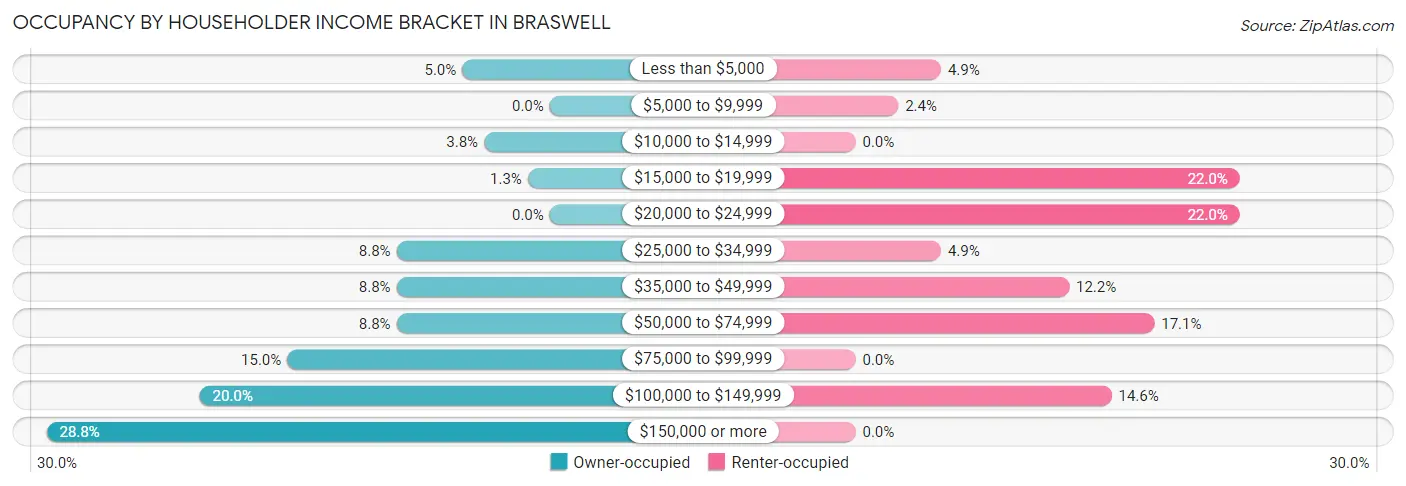
| Income Bracket | Owner-occupied | Renter-occupied |
| Less than $5,000 | 4 (5.0%) | 2 (4.9%) |
| $5,000 to $9,999 | 0 (0.0%) | 1 (2.4%) |
| $10,000 to $14,999 | 3 (3.7%) | 0 (0.0%) |
| $15,000 to $19,999 | 1 (1.3%) | 9 (22.0%) |
| $20,000 to $24,999 | 0 (0.0%) | 9 (22.0%) |
| $25,000 to $34,999 | 7 (8.7%) | 2 (4.9%) |
| $35,000 to $49,999 | 7 (8.7%) | 5 (12.2%) |
| $50,000 to $74,999 | 7 (8.7%) | 7 (17.1%) |
| $75,000 to $99,999 | 12 (15.0%) | 0 (0.0%) |
| $100,000 to $149,999 | 16 (20.0%) | 6 (14.6%) |
| $150,000 or more | 23 (28.7%) | 0 (0.0%) |
| Total | 80 (100.0%) | 41 (100.0%) |
Monthly Housing Cost Tiers in Braswell
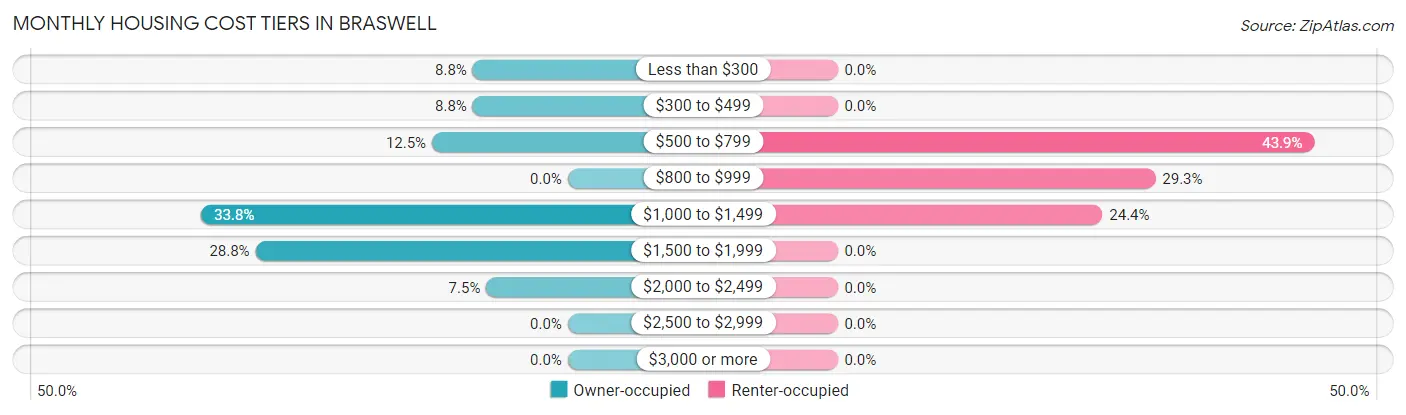
| Monthly Cost | Owner-occupied | Renter-occupied |
| Less than $300 | 7 (8.7%) | 0 (0.0%) |
| $300 to $499 | 7 (8.7%) | 0 (0.0%) |
| $500 to $799 | 10 (12.5%) | 18 (43.9%) |
| $800 to $999 | 0 (0.0%) | 12 (29.3%) |
| $1,000 to $1,499 | 27 (33.8%) | 10 (24.4%) |
| $1,500 to $1,999 | 23 (28.7%) | 0 (0.0%) |
| $2,000 to $2,499 | 6 (7.5%) | 0 (0.0%) |
| $2,500 to $2,999 | 0 (0.0%) | 0 (0.0%) |
| $3,000 or more | 0 (0.0%) | 0 (0.0%) |
| Total | 80 (100.0%) | 41 (100.0%) |
Physical Housing Characteristics in Braswell
Housing Structures in Braswell
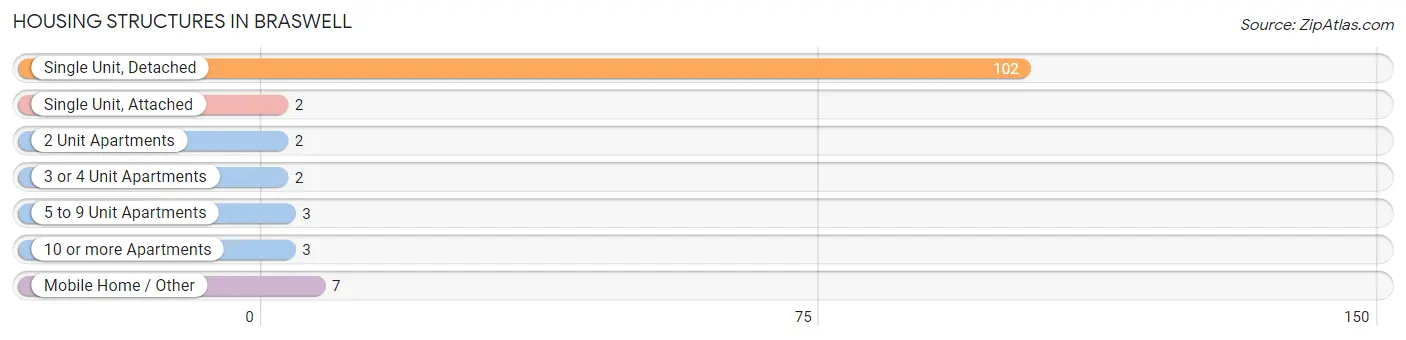
| Structure Type | # Housing Units | % Housing Units |
| Single Unit, Detached | 102 | 84.3% |
| Single Unit, Attached | 2 | 1.7% |
| 2 Unit Apartments | 2 | 1.7% |
| 3 or 4 Unit Apartments | 2 | 1.7% |
| 5 to 9 Unit Apartments | 3 | 2.5% |
| 10 or more Apartments | 3 | 2.5% |
| Mobile Home / Other | 7 | 5.8% |
| Total | 121 | 100.0% |
Housing Structures by Occupancy in Braswell
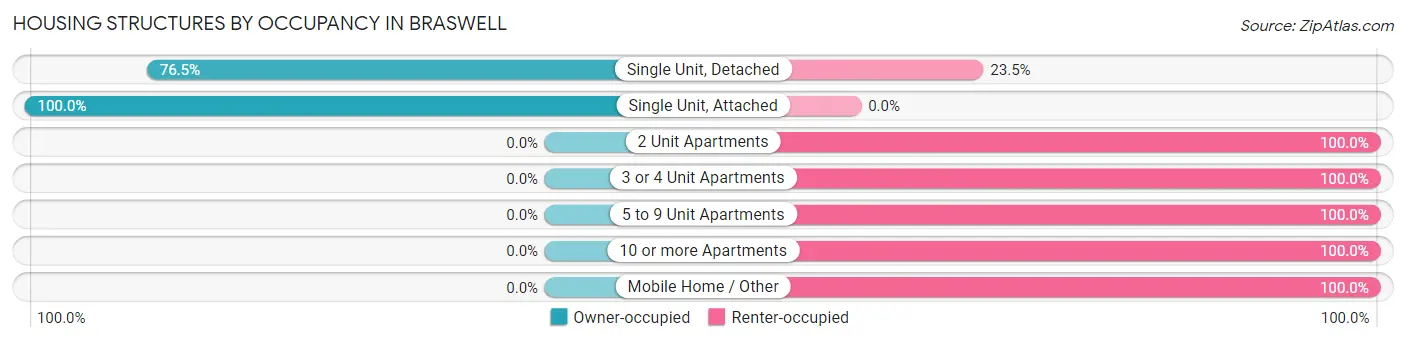
| Structure Type | Owner-occupied | Renter-occupied |
| Single Unit, Detached | 78 (76.5%) | 24 (23.5%) |
| Single Unit, Attached | 2 (100.0%) | 0 (0.0%) |
| 2 Unit Apartments | 0 (0.0%) | 2 (100.0%) |
| 3 or 4 Unit Apartments | 0 (0.0%) | 2 (100.0%) |
| 5 to 9 Unit Apartments | 0 (0.0%) | 3 (100.0%) |
| 10 or more Apartments | 0 (0.0%) | 3 (100.0%) |
| Mobile Home / Other | 0 (0.0%) | 7 (100.0%) |
| Total | 80 (66.1%) | 41 (33.9%) |
Housing Structures by Number of Rooms in Braswell
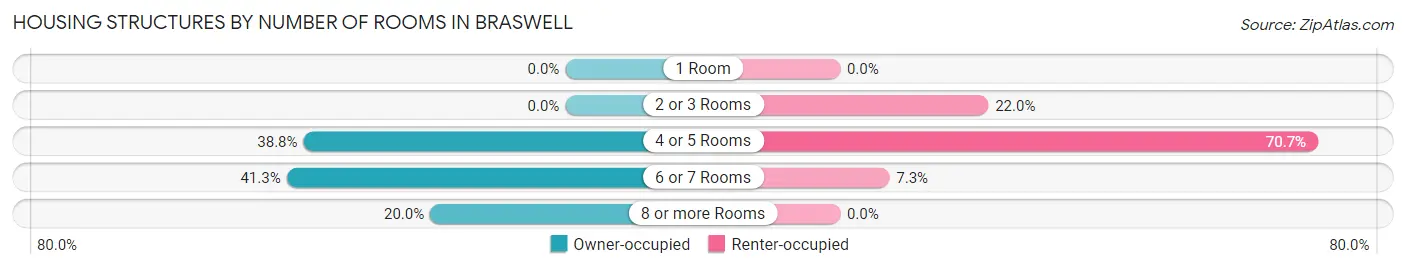
| Number of Rooms | Owner-occupied | Renter-occupied |
| 1 Room | 0 (0.0%) | 0 (0.0%) |
| 2 or 3 Rooms | 0 (0.0%) | 9 (22.0%) |
| 4 or 5 Rooms | 31 (38.8%) | 29 (70.7%) |
| 6 or 7 Rooms | 33 (41.2%) | 3 (7.3%) |
| 8 or more Rooms | 16 (20.0%) | 0 (0.0%) |
| Total | 80 (100.0%) | 41 (100.0%) |
Housing Structure by Heating Type in Braswell
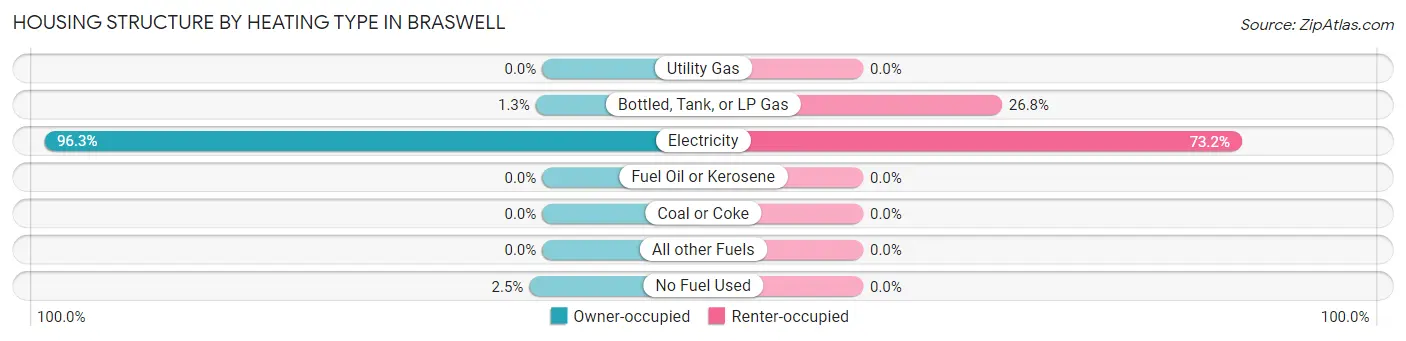
| Heating Type | Owner-occupied | Renter-occupied |
| Utility Gas | 0 (0.0%) | 0 (0.0%) |
| Bottled, Tank, or LP Gas | 1 (1.3%) | 11 (26.8%) |
| Electricity | 77 (96.3%) | 30 (73.2%) |
| Fuel Oil or Kerosene | 0 (0.0%) | 0 (0.0%) |
| Coal or Coke | 0 (0.0%) | 0 (0.0%) |
| All other Fuels | 0 (0.0%) | 0 (0.0%) |
| No Fuel Used | 2 (2.5%) | 0 (0.0%) |
| Total | 80 (100.0%) | 41 (100.0%) |
Household Vehicle Usage in Braswell
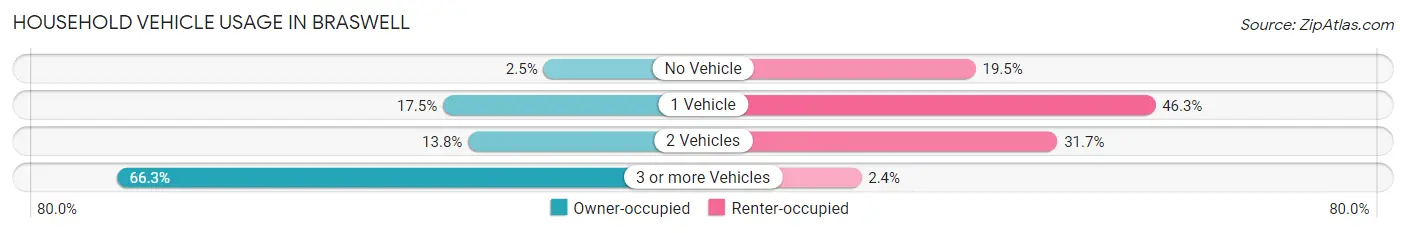
| Vehicles per Household | Owner-occupied | Renter-occupied |
| No Vehicle | 2 (2.5%) | 8 (19.5%) |
| 1 Vehicle | 14 (17.5%) | 19 (46.3%) |
| 2 Vehicles | 11 (13.8%) | 13 (31.7%) |
| 3 or more Vehicles | 53 (66.2%) | 1 (2.4%) |
| Total | 80 (100.0%) | 41 (100.0%) |
Real Estate & Mortgages in Braswell
Real Estate and Mortgage Overview in Braswell
| Characteristic | Without Mortgage | With Mortgage |
| Housing Units | 23 | 57 |
| Median Property Value | $225,000 | $178,100 |
| Median Household Income | - | - |
| Monthly Housing Costs | $470 | $0 |
| Real Estate Taxes | $1,708 | $0 |
Property Value by Mortgage Status in Braswell
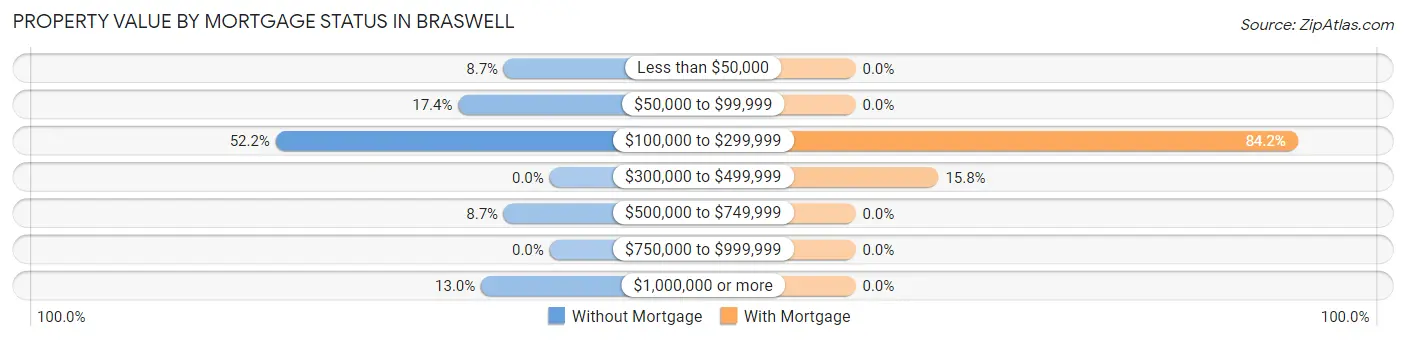
| Property Value | Without Mortgage | With Mortgage |
| Less than $50,000 | 2 (8.7%) | 0 (0.0%) |
| $50,000 to $99,999 | 4 (17.4%) | 0 (0.0%) |
| $100,000 to $299,999 | 12 (52.2%) | 48 (84.2%) |
| $300,000 to $499,999 | 0 (0.0%) | 9 (15.8%) |
| $500,000 to $749,999 | 2 (8.7%) | 0 (0.0%) |
| $750,000 to $999,999 | 0 (0.0%) | 0 (0.0%) |
| $1,000,000 or more | 3 (13.0%) | 0 (0.0%) |
| Total | 23 (100.0%) | 57 (100.0%) |
Household Income by Mortgage Status in Braswell
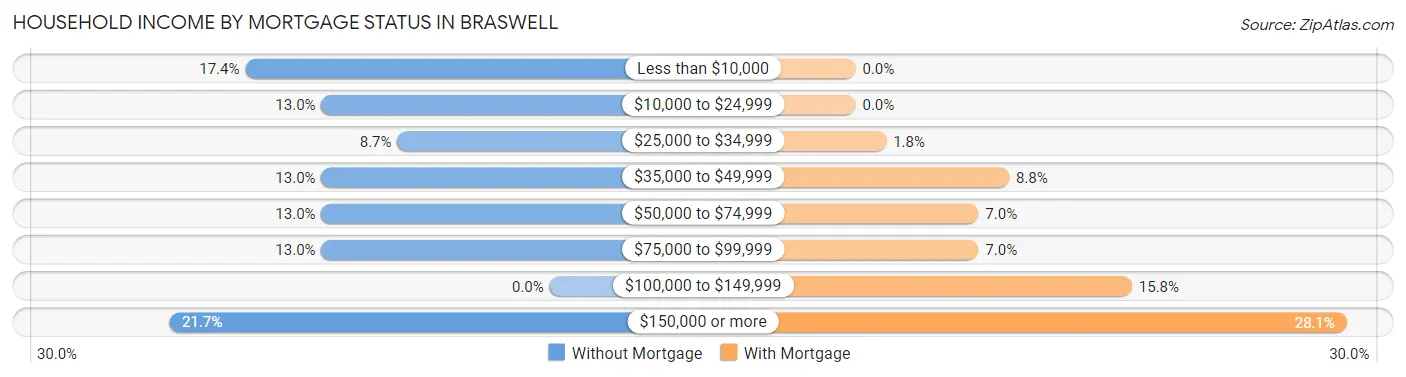
| Household Income | Without Mortgage | With Mortgage |
| Less than $10,000 | 4 (17.4%) | 0 (0.0%) |
| $10,000 to $24,999 | 3 (13.0%) | 0 (0.0%) |
| $25,000 to $34,999 | 2 (8.7%) | 1 (1.8%) |
| $35,000 to $49,999 | 3 (13.0%) | 5 (8.8%) |
| $50,000 to $74,999 | 3 (13.0%) | 4 (7.0%) |
| $75,000 to $99,999 | 3 (13.0%) | 4 (7.0%) |
| $100,000 to $149,999 | 0 (0.0%) | 9 (15.8%) |
| $150,000 or more | 5 (21.7%) | 16 (28.1%) |
| Total | 23 (100.0%) | 57 (100.0%) |
Property Value to Household Income Ratio in Braswell
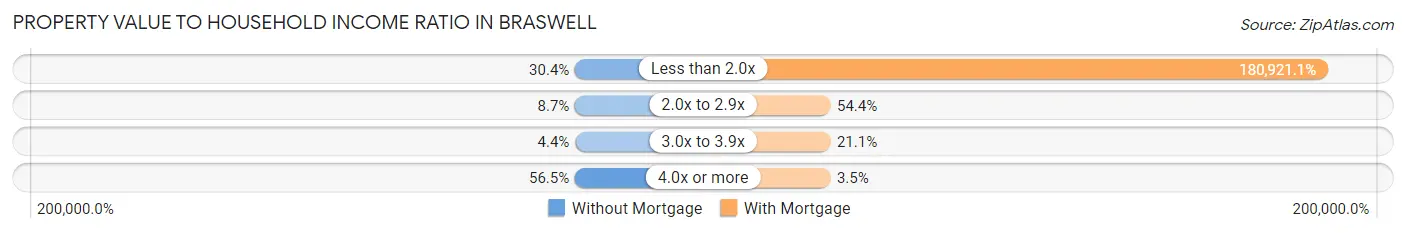
| Value-to-Income Ratio | Without Mortgage | With Mortgage |
| Less than 2.0x | 7 (30.4%) | 103,125 (180,921.0%) |
| 2.0x to 2.9x | 2 (8.7%) | 31 (54.4%) |
| 3.0x to 3.9x | 1 (4.3%) | 12 (21.0%) |
| 4.0x or more | 13 (56.5%) | 2 (3.5%) |
| Total | 23 (100.0%) | 57 (100.0%) |
Real Estate Taxes by Mortgage Status in Braswell
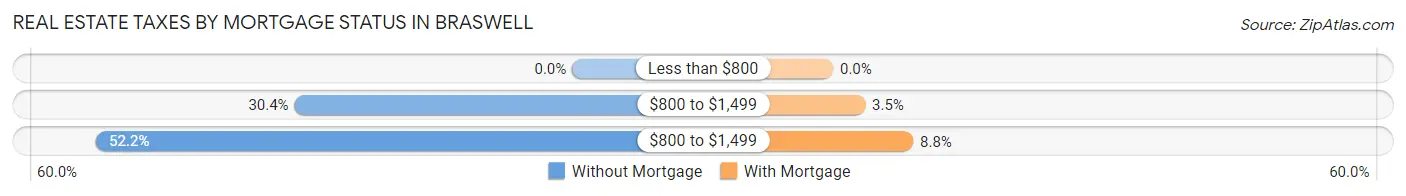
| Property Taxes | Without Mortgage | With Mortgage |
| Less than $800 | 0 (0.0%) | 0 (0.0%) |
| $800 to $1,499 | 7 (30.4%) | 2 (3.5%) |
| $800 to $1,499 | 12 (52.2%) | 5 (8.8%) |
| Total | 23 (100.0%) | 57 (100.0%) |
Health & Disability in Braswell
Health Insurance Coverage by Age in Braswell
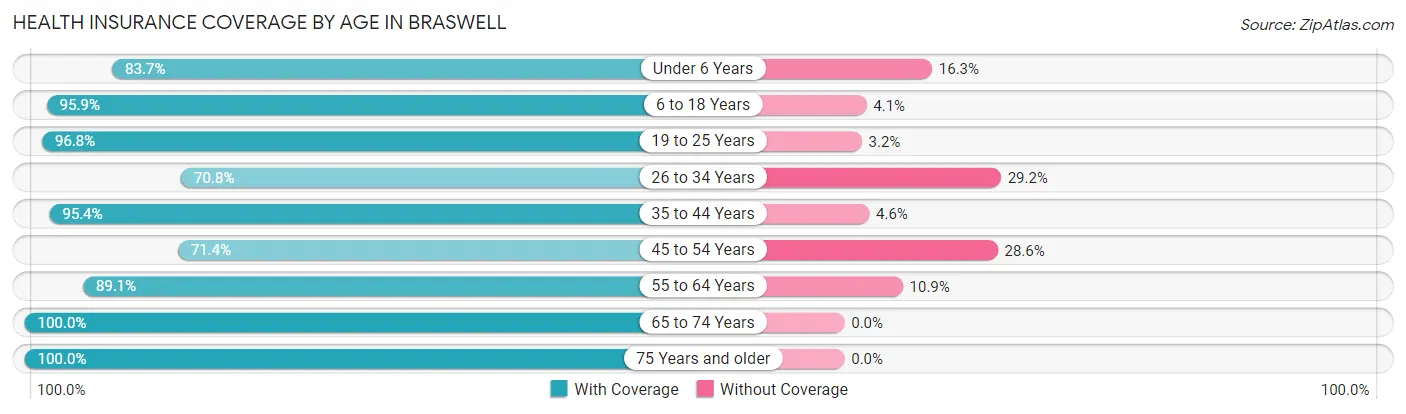
| Age Bracket | With Coverage | Without Coverage |
| Under 6 Years | 41 (83.7%) | 8 (16.3%) |
| 6 to 18 Years | 70 (95.9%) | 3 (4.1%) |
| 19 to 25 Years | 30 (96.8%) | 1 (3.2%) |
| 26 to 34 Years | 17 (70.8%) | 7 (29.2%) |
| 35 to 44 Years | 62 (95.4%) | 3 (4.6%) |
| 45 to 54 Years | 30 (71.4%) | 12 (28.6%) |
| 55 to 64 Years | 41 (89.1%) | 5 (10.9%) |
| 65 to 74 Years | 31 (100.0%) | 0 (0.0%) |
| 75 Years and older | 8 (100.0%) | 0 (0.0%) |
| Total | 330 (89.4%) | 39 (10.6%) |
Health Insurance Coverage by Citizenship Status in Braswell
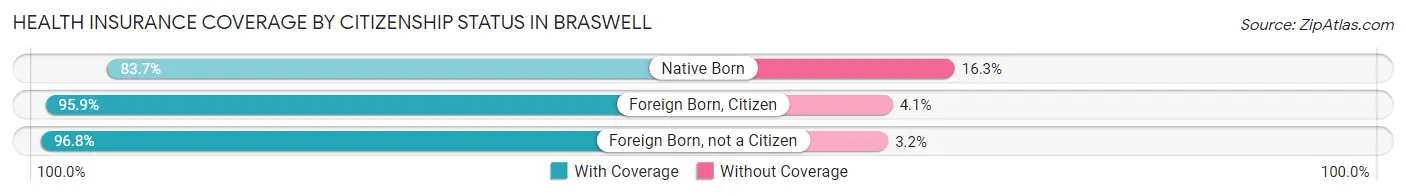
| Citizenship Status | With Coverage | Without Coverage |
| Native Born | 41 (83.7%) | 8 (16.3%) |
| Foreign Born, Citizen | 70 (95.9%) | 3 (4.1%) |
| Foreign Born, not a Citizen | 30 (96.8%) | 1 (3.2%) |
Health Insurance Coverage by Household Income in Braswell
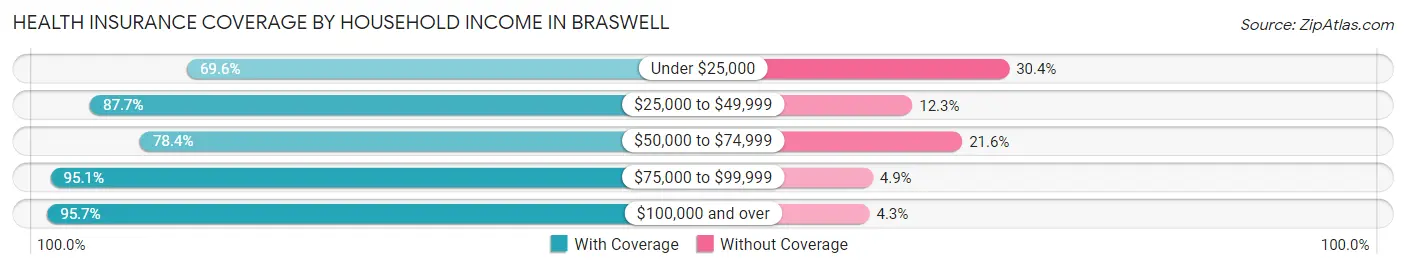
| Household Income | With Coverage | Without Coverage |
| Under $25,000 | 32 (69.6%) | 14 (30.4%) |
| $25,000 to $49,999 | 50 (87.7%) | 7 (12.3%) |
| $50,000 to $74,999 | 29 (78.4%) | 8 (21.6%) |
| $75,000 to $99,999 | 39 (95.1%) | 2 (4.9%) |
| $100,000 and over | 180 (95.7%) | 8 (4.3%) |
Public vs Private Health Insurance Coverage by Age in Braswell
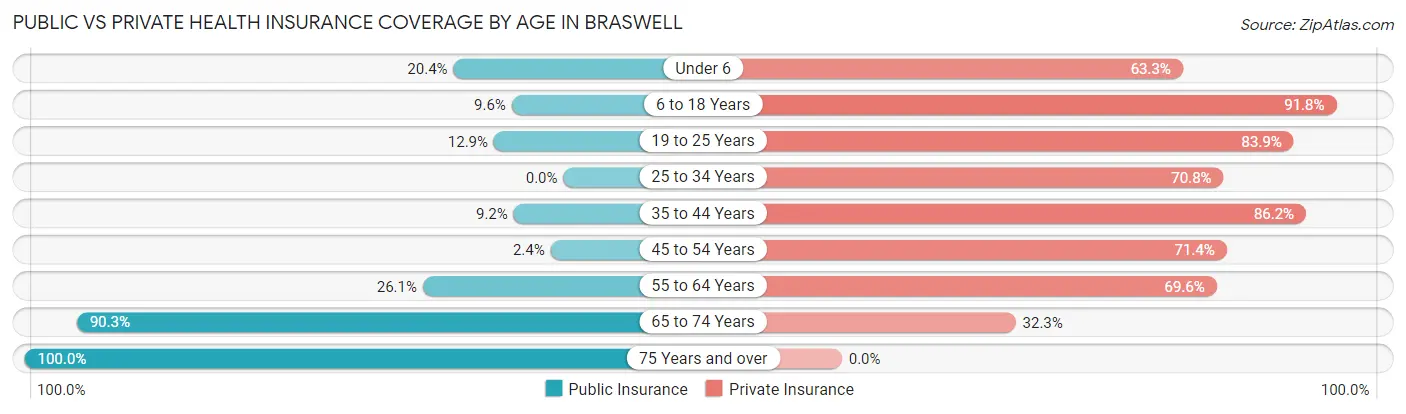
| Age Bracket | Public Insurance | Private Insurance |
| Under 6 | 10 (20.4%) | 31 (63.3%) |
| 6 to 18 Years | 7 (9.6%) | 67 (91.8%) |
| 19 to 25 Years | 4 (12.9%) | 26 (83.9%) |
| 25 to 34 Years | 0 (0.0%) | 17 (70.8%) |
| 35 to 44 Years | 6 (9.2%) | 56 (86.2%) |
| 45 to 54 Years | 1 (2.4%) | 30 (71.4%) |
| 55 to 64 Years | 12 (26.1%) | 32 (69.6%) |
| 65 to 74 Years | 28 (90.3%) | 10 (32.3%) |
| 75 Years and over | 8 (100.0%) | 0 (0.0%) |
| Total | 76 (20.6%) | 269 (72.9%) |
Disability Status by Sex by Age in Braswell
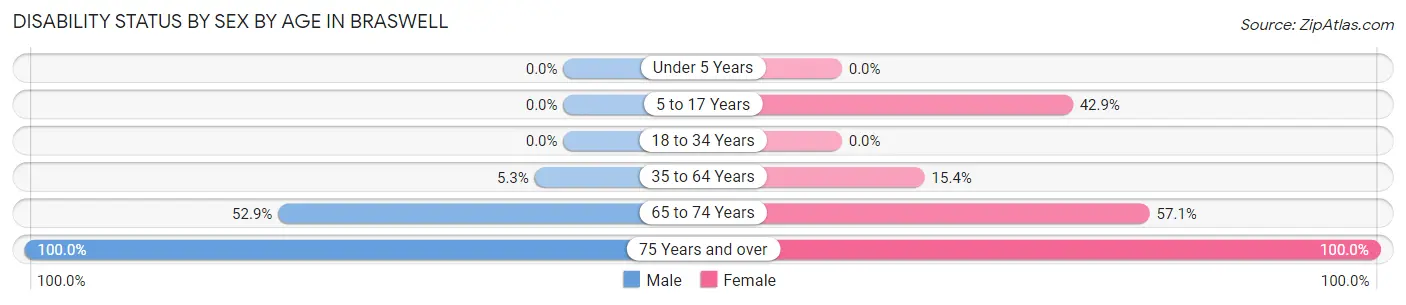
| Age Bracket | Male | Female |
| Under 5 Years | 0 (0.0%) | 0 (0.0%) |
| 5 to 17 Years | 0 (0.0%) | 21 (42.9%) |
| 18 to 34 Years | 0 (0.0%) | 0 (0.0%) |
| 35 to 64 Years | 4 (5.3%) | 12 (15.4%) |
| 65 to 74 Years | 9 (52.9%) | 8 (57.1%) |
| 75 Years and over | 7 (100.0%) | 1 (100.0%) |
Disability Class by Sex by Age in Braswell
Disability Class: Hearing Difficulty
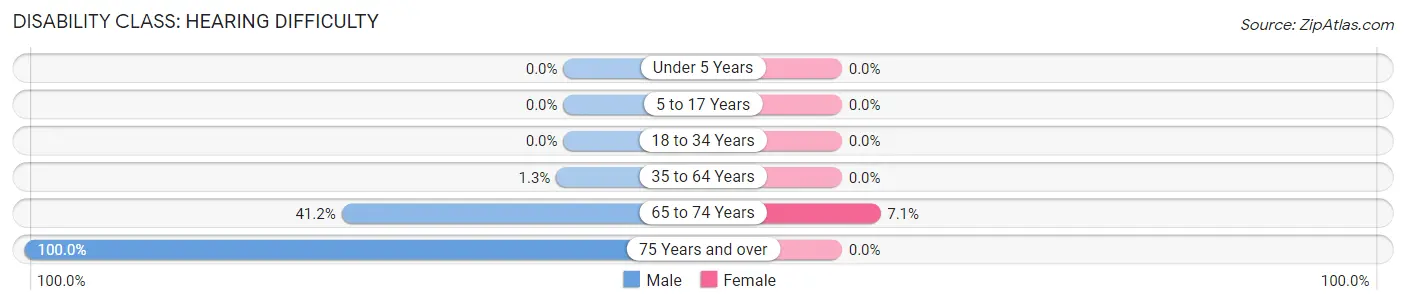
| Age Bracket | Male | Female |
| Under 5 Years | 0 (0.0%) | 0 (0.0%) |
| 5 to 17 Years | 0 (0.0%) | 0 (0.0%) |
| 18 to 34 Years | 0 (0.0%) | 0 (0.0%) |
| 35 to 64 Years | 1 (1.3%) | 0 (0.0%) |
| 65 to 74 Years | 7 (41.2%) | 1 (7.1%) |
| 75 Years and over | 7 (100.0%) | 0 (0.0%) |
Disability Class: Vision Difficulty
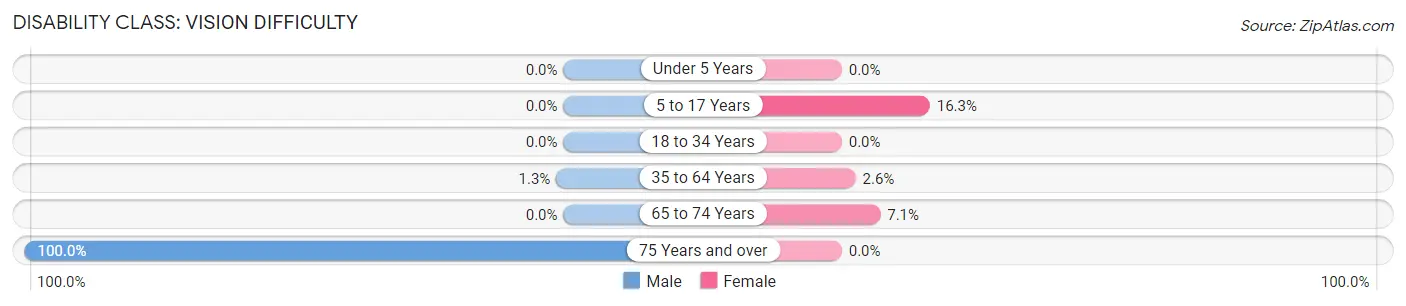
| Age Bracket | Male | Female |
| Under 5 Years | 0 (0.0%) | 0 (0.0%) |
| 5 to 17 Years | 0 (0.0%) | 8 (16.3%) |
| 18 to 34 Years | 0 (0.0%) | 0 (0.0%) |
| 35 to 64 Years | 1 (1.3%) | 2 (2.6%) |
| 65 to 74 Years | 0 (0.0%) | 1 (7.1%) |
| 75 Years and over | 7 (100.0%) | 0 (0.0%) |
Disability Class: Cognitive Difficulty
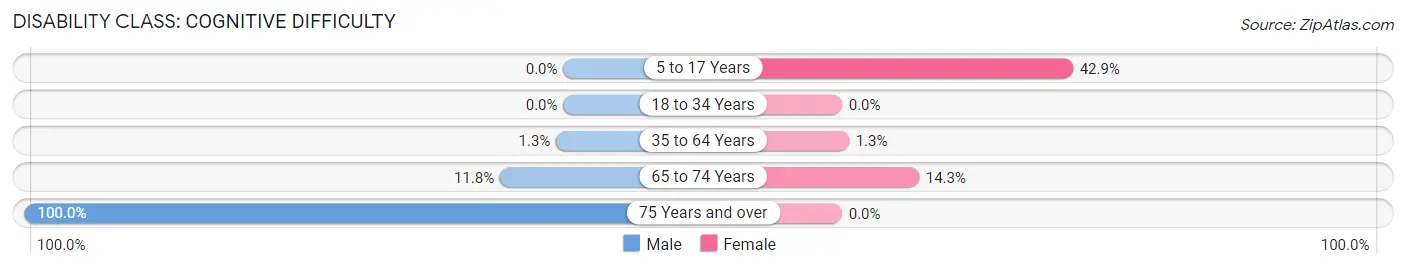
| Age Bracket | Male | Female |
| 5 to 17 Years | 0 (0.0%) | 21 (42.9%) |
| 18 to 34 Years | 0 (0.0%) | 0 (0.0%) |
| 35 to 64 Years | 1 (1.3%) | 1 (1.3%) |
| 65 to 74 Years | 2 (11.8%) | 2 (14.3%) |
| 75 Years and over | 7 (100.0%) | 0 (0.0%) |
Disability Class: Ambulatory Difficulty
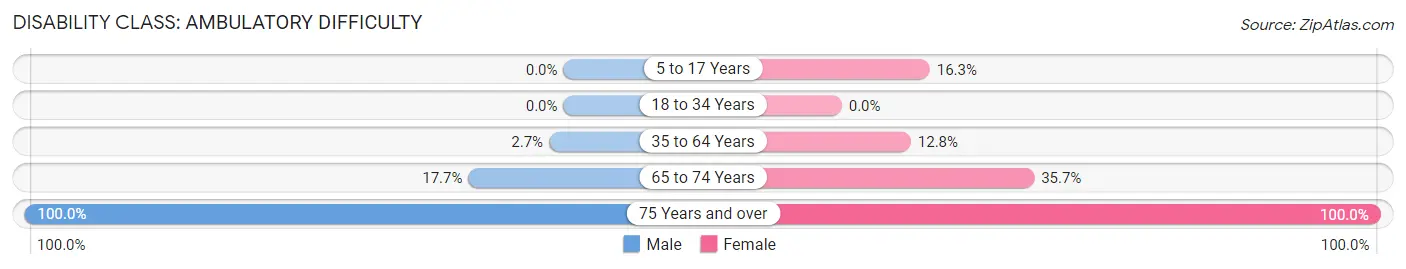
| Age Bracket | Male | Female |
| 5 to 17 Years | 0 (0.0%) | 8 (16.3%) |
| 18 to 34 Years | 0 (0.0%) | 0 (0.0%) |
| 35 to 64 Years | 2 (2.7%) | 10 (12.8%) |
| 65 to 74 Years | 3 (17.6%) | 5 (35.7%) |
| 75 Years and over | 7 (100.0%) | 1 (100.0%) |
Disability Class: Self-Care Difficulty
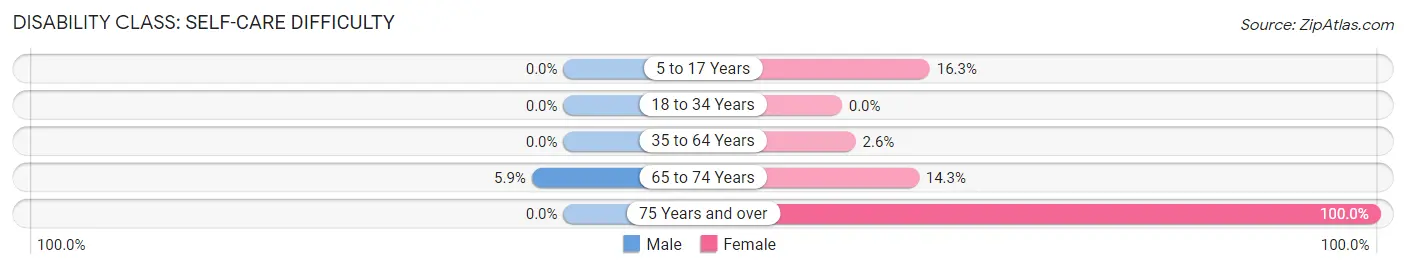
| Age Bracket | Male | Female |
| 5 to 17 Years | 0 (0.0%) | 8 (16.3%) |
| 18 to 34 Years | 0 (0.0%) | 0 (0.0%) |
| 35 to 64 Years | 0 (0.0%) | 2 (2.6%) |
| 65 to 74 Years | 1 (5.9%) | 2 (14.3%) |
| 75 Years and over | 0 (0.0%) | 1 (100.0%) |
Technology Access in Braswell
Computing Device Access in Braswell
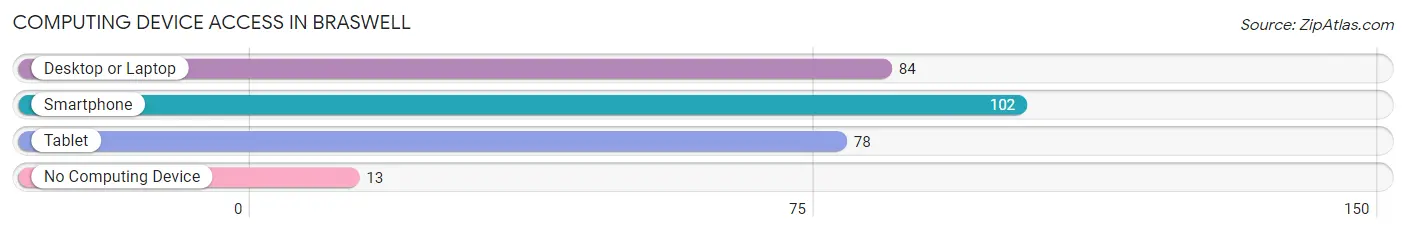
| Device Type | # Households | % Households |
| Desktop or Laptop | 84 | 69.4% |
| Smartphone | 102 | 84.3% |
| Tablet | 78 | 64.5% |
| No Computing Device | 13 | 10.7% |
| Total | 121 | 100.0% |
Internet Access in Braswell
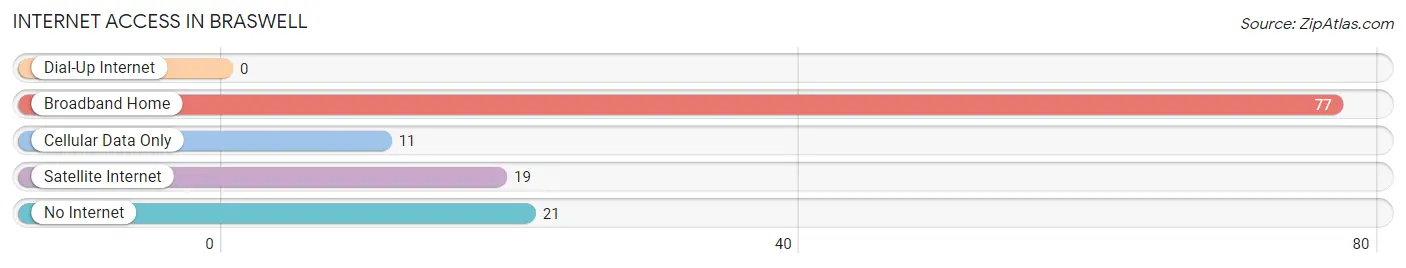
| Internet Type | # Households | % Households |
| Dial-Up Internet | 0 | 0.0% |
| Broadband Home | 77 | 63.6% |
| Cellular Data Only | 11 | 9.1% |
| Satellite Internet | 19 | 15.7% |
| No Internet | 21 | 17.4% |
| Total | 121 | 100.0% |
Braswell Summary
Braswell is a small unincorporated community located in the southwestern corner of Georgia, in the United States. It is situated in the county of Decatur, and is part of the Atlanta metropolitan area. The population of Braswell was estimated to be around 1,000 people in 2020.
History
Braswell was first settled in the early 1800s by a group of settlers from North Carolina. The town was named after a local family, the Braswells, who were among the first settlers. The town was officially incorporated in 1883.
In the early 1900s, Braswell was a thriving agricultural community, with cotton and tobacco being the main crops. The town also had a number of small businesses, including a general store, a blacksmith shop, and a sawmill.
In the 1950s, Braswell began to experience a decline in population as many of its residents moved away to larger cities in search of better job opportunities. The town also suffered from a lack of investment in infrastructure, leading to a decrease in economic activity.
Geography
Braswell is located in the southwestern corner of Georgia, in the county of Decatur. It is situated in the Atlanta metropolitan area, and is approximately 30 miles from the city of Atlanta. The town is located in a rural area, and is surrounded by farmland and forests.
The climate in Braswell is humid subtropical, with hot summers and mild winters. The average annual temperature is around 70 degrees Fahrenheit, and the average annual precipitation is around 50 inches.
Economy
Braswell’s economy is largely based on agriculture, with cotton and tobacco being the main crops. The town also has a number of small businesses, including a general store, a blacksmith shop, and a sawmill.
In recent years, Braswell has seen an increase in tourism, as the town is located close to several popular attractions, such as Stone Mountain Park and the Georgia Aquarium. The town also has a number of bed and breakfasts, as well as a few restaurants.
Demographics
As of 2020, the population of Braswell was estimated to be around 1,000 people. The racial makeup of the town is predominantly white, with African Americans making up around 10% of the population. The median household income in Braswell is around $40,000, and the median home value is around $150,000.
Braswell is a small, rural community with a rich history and a strong sense of community. The town is home to a diverse population, and is a great place to live for those looking for a quiet, rural lifestyle.
Common Questions
What is Per Capita Income in Braswell?
Per Capita income in Braswell is $26,713.
What is the Median Family Income in Braswell?
Median Family Income in Braswell is $90,625.
What is the Median Household income in Braswell?
Median Household Income in Braswell is $72,813.
What is Income or Wage Gap in Braswell?
Income or Wage Gap in Braswell is 67.4%.
Women in Braswell earn 32.6 cents for every dollar earned by a man.
What is Inequality or Gini Index in Braswell?
Inequality or Gini Index in Braswell is 0.41.
What is the Total Population of Braswell?
Total Population of Braswell is 369.
What is the Total Male Population of Braswell?
Total Male Population of Braswell is 152.
What is the Total Female Population of Braswell?
Total Female Population of Braswell is 217.
What is the Ratio of Males per 100 Females in Braswell?
There are 70.05 Males per 100 Females in Braswell.
What is the Ratio of Females per 100 Males in Braswell?
There are 142.76 Females per 100 Males in Braswell.
What is the Median Population Age in Braswell?
Median Population Age in Braswell is 36.2 Years.
What is the Average Family Size in Braswell
Average Family Size in Braswell is 3.7 People.
What is the Average Household Size in Braswell
Average Household Size in Braswell is 3.0 People.
How Large is the Labor Force in Braswell?
There are 169 People in the Labor Forcein in Braswell.
What is the Percentage of People in the Labor Force in Braswell?
67.3% of People are in the Labor Force in Braswell.
What is the Unemployment Rate in Braswell?
Unemployment Rate in Braswell is 3.0%.