Lincolnton, GA Map & Demographics
Lincolnton Map
Lincolnton Overview
$24,556
PER CAPITA INCOME
$54,306
AVG FAMILY INCOME
$38,681
AVG HOUSEHOLD INCOME
43.3%
WAGE / INCOME GAP [ % ]
56.7¢/ $1
WAGE / INCOME GAP [ $ ]
0.49
INEQUALITY / GINI INDEX
1,876
TOTAL POPULATION
923
MALE POPULATION
953
FEMALE POPULATION
96.85
MALES / 100 FEMALES
103.25
FEMALES / 100 MALES
49.6
MEDIAN AGE
3.3
AVG FAMILY SIZE
2.4
AVG HOUSEHOLD SIZE
686
LABOR FORCE [ PEOPLE ]
44.6%
PERCENT IN LABOR FORCE
1.5%
UNEMPLOYMENT RATE
Lincolnton Zip Codes
Lincolnton Area Codes
Income in Lincolnton
Income Overview in Lincolnton
Per Capita Income in Lincolnton is $24,556, while median incomes of families and households are $54,306 and $38,681 respectively.
| Characteristic | Number | Measure |
| Per Capita Income | 1,876 | $24,556 |
| Median Family Income | 439 | $54,306 |
| Mean Family Income | 439 | $82,661 |
| Median Household Income | 755 | $38,681 |
| Mean Household Income | 755 | $58,737 |
| Income Deficit | 439 | $0 |
| Wage / Income Gap (%) | 1,876 | 43.27% |
| Wage / Income Gap ($) | 1,876 | 56.73¢ per $1 |
| Gini / Inequality Index | 1,876 | 0.49 |
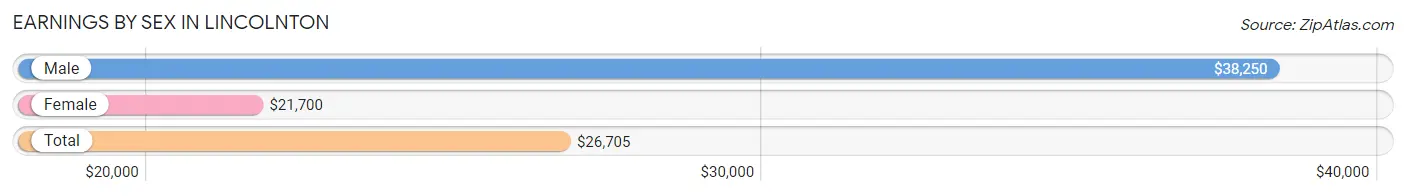
Earnings by Sex in Lincolnton
Average Earnings in Lincolnton are $26,705, $38,250 for men and $21,700 for women, a difference of 43.3%.
| Sex | Number | Average Earnings |
| Male | 333 (43.4%) | $38,250 |
| Female | 434 (56.6%) | $21,700 |
| Total | 767 (100.0%) | $26,705 |
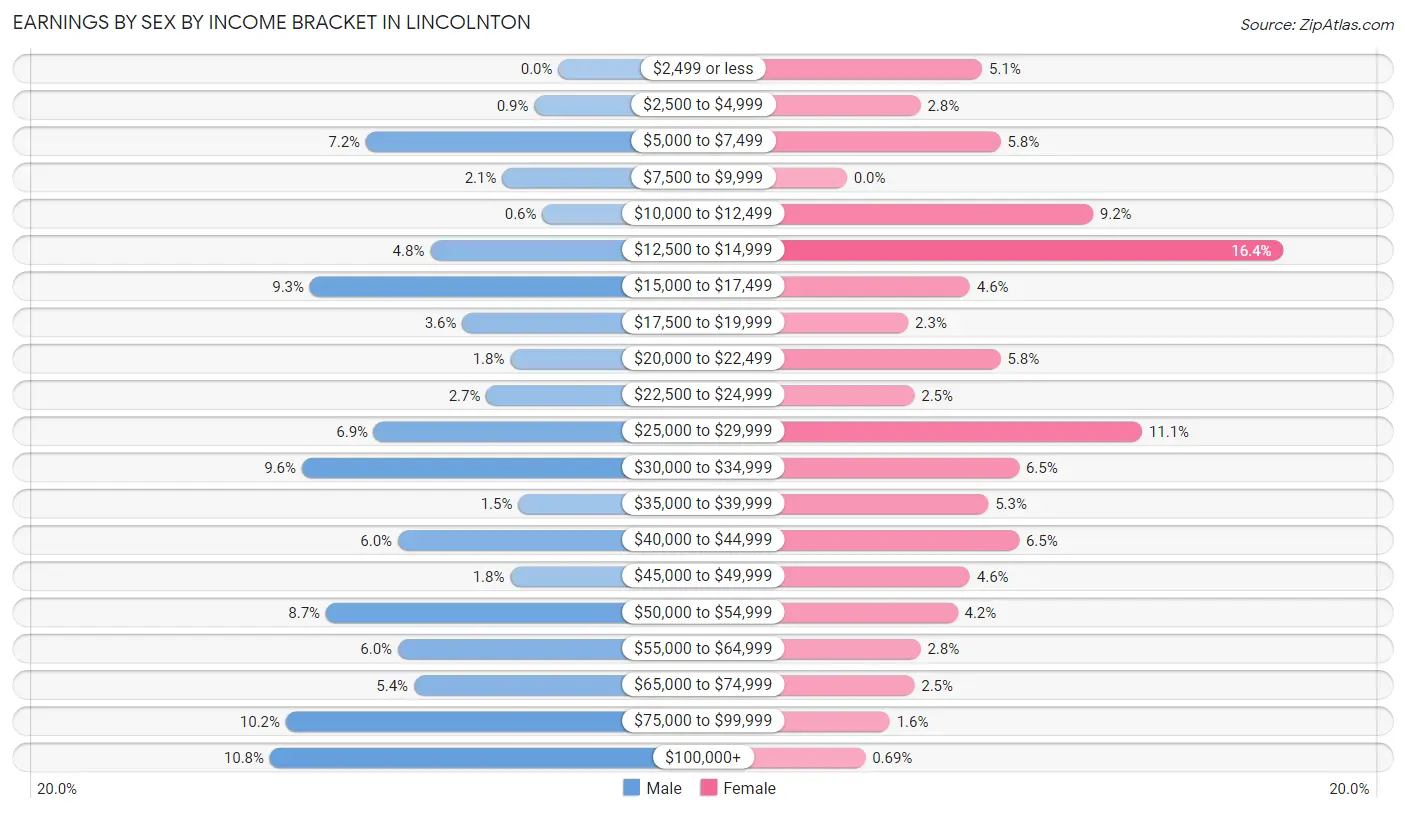
Earnings by Sex by Income Bracket in Lincolnton
The most common earnings brackets in Lincolnton are $100,000+ for men (36 | 10.8%) and $12,500 to $14,999 for women (71 | 16.4%).
| Income | Male | Female |
| $2,499 or less | 0 (0.0%) | 22 (5.1%) |
| $2,500 to $4,999 | 3 (0.9%) | 12 (2.8%) |
| $5,000 to $7,499 | 24 (7.2%) | 25 (5.8%) |
| $7,500 to $9,999 | 7 (2.1%) | 0 (0.0%) |
| $10,000 to $12,499 | 2 (0.6%) | 40 (9.2%) |
| $12,500 to $14,999 | 16 (4.8%) | 71 (16.4%) |
| $15,000 to $17,499 | 31 (9.3%) | 20 (4.6%) |
| $17,500 to $19,999 | 12 (3.6%) | 10 (2.3%) |
| $20,000 to $22,499 | 6 (1.8%) | 25 (5.8%) |
| $22,500 to $24,999 | 9 (2.7%) | 11 (2.5%) |
| $25,000 to $29,999 | 23 (6.9%) | 48 (11.1%) |
| $30,000 to $34,999 | 32 (9.6%) | 28 (6.5%) |
| $35,000 to $39,999 | 5 (1.5%) | 23 (5.3%) |
| $40,000 to $44,999 | 20 (6.0%) | 28 (6.5%) |
| $45,000 to $49,999 | 6 (1.8%) | 20 (4.6%) |
| $50,000 to $54,999 | 29 (8.7%) | 18 (4.2%) |
| $55,000 to $64,999 | 20 (6.0%) | 12 (2.8%) |
| $65,000 to $74,999 | 18 (5.4%) | 11 (2.5%) |
| $75,000 to $99,999 | 34 (10.2%) | 7 (1.6%) |
| $100,000+ | 36 (10.8%) | 3 (0.7%) |
| Total | 333 (100.0%) | 434 (100.0%) |
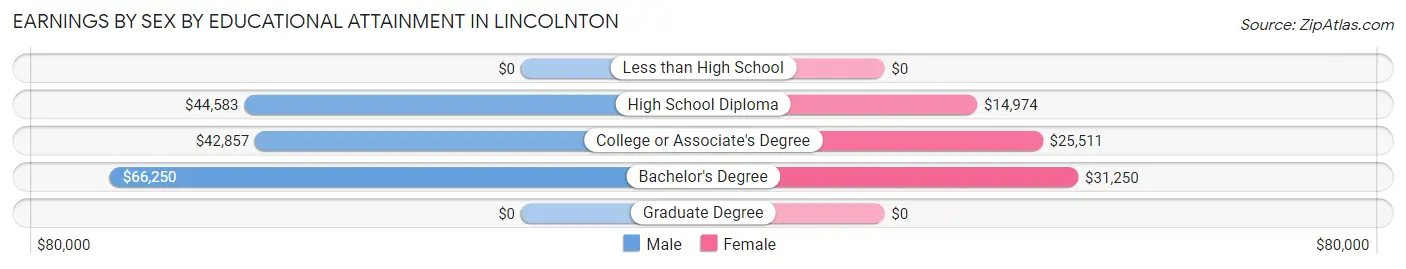
Earnings by Sex by Educational Attainment in Lincolnton
Average earnings in Lincolnton are $44,844 for men and $21,100 for women, a difference of 52.9%. Men with an educational attainment of bachelor's degree enjoy the highest average annual earnings of $66,250, while those with college or associate's degree education earn the least with $42,857. Women with an educational attainment of bachelor's degree earn the most with the average annual earnings of $31,250, while those with high school diploma education have the smallest earnings of $14,974.
| Educational Attainment | Male Income | Female Income |
| Less than High School | - | - |
| High School Diploma | $44,583 | $14,974 |
| College or Associate's Degree | $42,857 | $25,511 |
| Bachelor's Degree | $66,250 | $31,250 |
| Graduate Degree | - | - |
| Total | $44,844 | $21,100 |
Family Income in Lincolnton
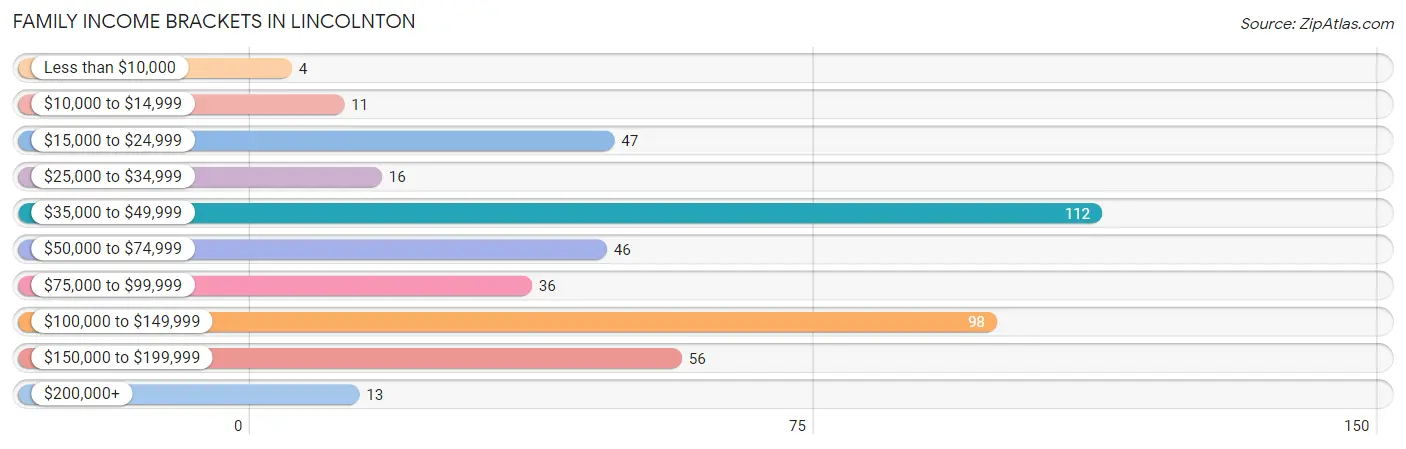
Family Income Brackets in Lincolnton
According to the Lincolnton family income data, there are 112 families falling into the $35,000 to $49,999 income range, which is the most common income bracket and makes up 25.5% of all families. Conversely, the less than $10,000 income bracket is the least frequent group with only 4 families (0.9%) belonging to this category.
| Income Bracket | # Families | % Families |
| Less than $10,000 | 4 | 0.9% |
| $10,000 to $14,999 | 11 | 2.5% |
| $15,000 to $24,999 | 47 | 10.7% |
| $25,000 to $34,999 | 16 | 3.6% |
| $35,000 to $49,999 | 112 | 25.5% |
| $50,000 to $74,999 | 46 | 10.5% |
| $75,000 to $99,999 | 36 | 8.2% |
| $100,000 to $149,999 | 98 | 22.3% |
| $150,000 to $199,999 | 56 | 12.8% |
| $200,000+ | 13 | 3.0% |
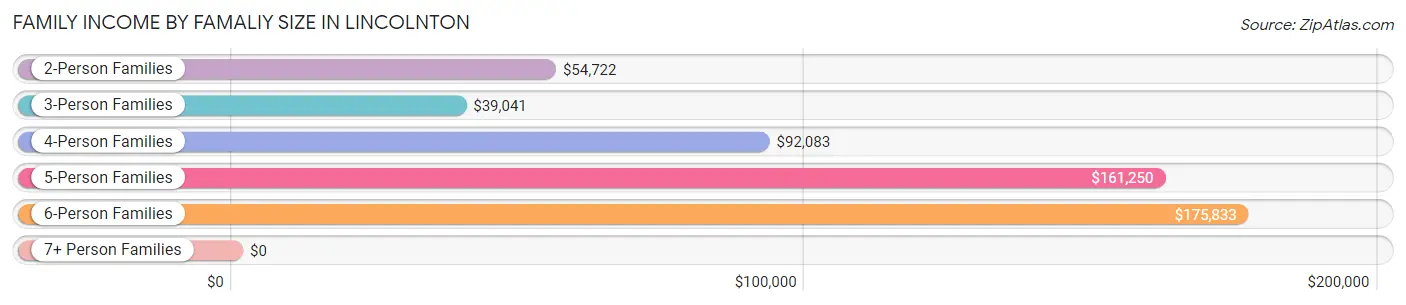
Family Income by Famaliy Size in Lincolnton
6-person families (16 | 3.6%) account for the highest median family income in Lincolnton with $175,833 per family, while 5-person families (26 | 5.9%) have the highest median income of $32,250 per family member.
| Income Bracket | # Families | Median Income |
| 2-Person Families | 214 (48.7%) | $54,722 |
| 3-Person Families | 114 (26.0%) | $39,041 |
| 4-Person Families | 65 (14.8%) | $92,083 |
| 5-Person Families | 26 (5.9%) | $161,250 |
| 6-Person Families | 16 (3.6%) | $175,833 |
| 7+ Person Families | 4 (0.9%) | $0 |
| Total | 439 (100.0%) | $54,306 |
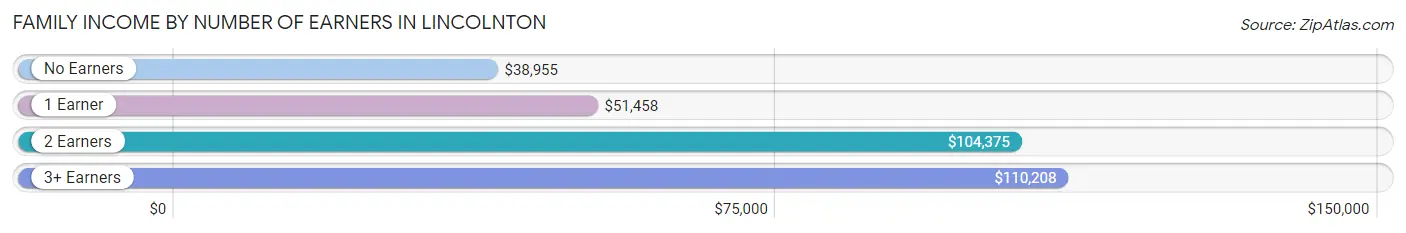
Family Income by Number of Earners in Lincolnton
The median family income in Lincolnton is $54,306, with families comprising 3+ earners (44) having the highest median family income of $110,208, while families with no earners (127) have the lowest median family income of $38,955, accounting for 10.0% and 28.9% of families, respectively.
| Number of Earners | # Families | Median Income |
| No Earners | 127 (28.9%) | $38,955 |
| 1 Earner | 145 (33.0%) | $51,458 |
| 2 Earners | 123 (28.0%) | $104,375 |
| 3+ Earners | 44 (10.0%) | $110,208 |
| Total | 439 (100.0%) | $54,306 |
Household Income in Lincolnton
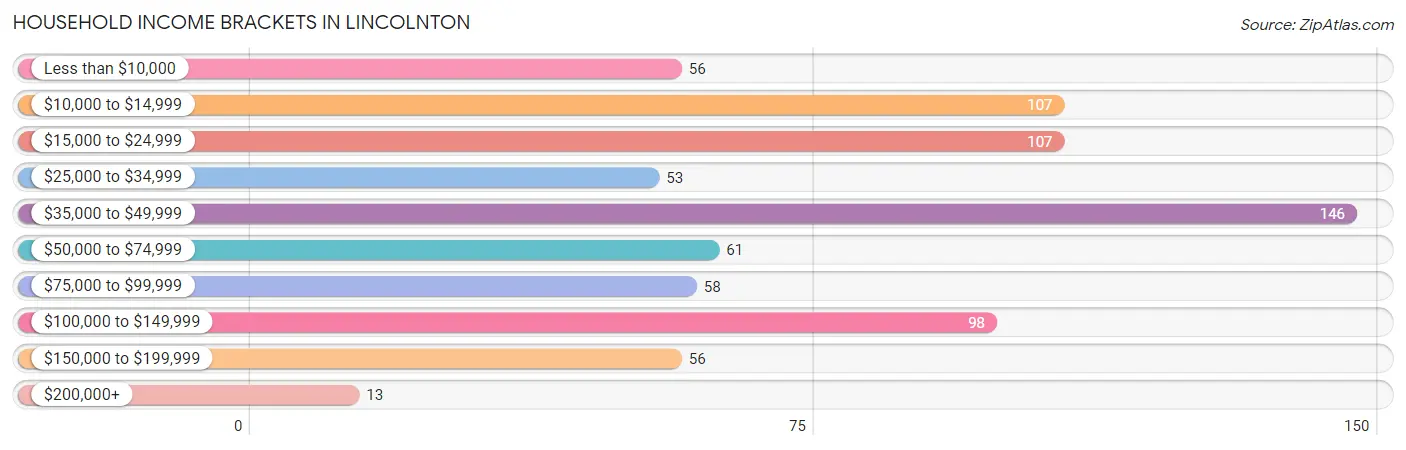
Household Income Brackets in Lincolnton
With 146 households falling in the category, the $35,000 to $49,999 income range is the most frequent in Lincolnton, accounting for 19.3% of all households. In contrast, only 13 households (1.7%) fall into the $200,000+ income bracket, making it the least populous group.
| Income Bracket | # Households | % Households |
| Less than $10,000 | 56 | 7.4% |
| $10,000 to $14,999 | 107 | 14.2% |
| $15,000 to $24,999 | 107 | 14.2% |
| $25,000 to $34,999 | 53 | 7.0% |
| $35,000 to $49,999 | 146 | 19.3% |
| $50,000 to $74,999 | 61 | 8.1% |
| $75,000 to $99,999 | 58 | 7.7% |
| $100,000 to $149,999 | 98 | 13.0% |
| $150,000 to $199,999 | 56 | 7.4% |
| $200,000+ | 13 | 1.7% |
Household Income by Householder Age in Lincolnton
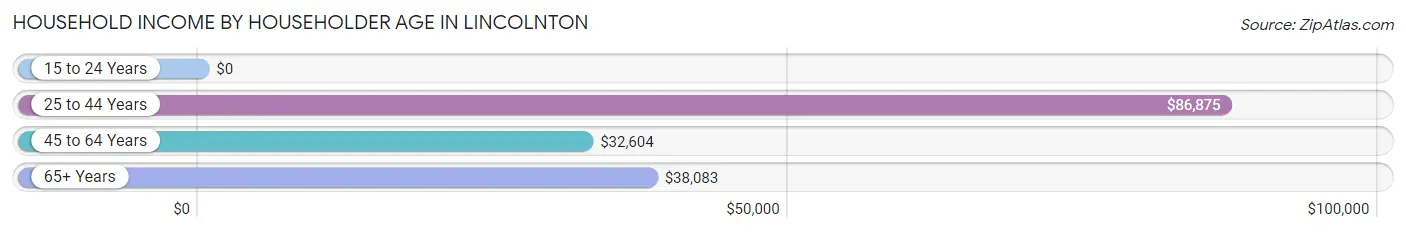
The median household income in Lincolnton is $38,681, with the highest median household income of $86,875 found in the 25 to 44 years age bracket for the primary householder. A total of 114 households (15.1%) fall into this category. Meanwhile, the 15 to 24 years age bracket for the primary householder has the lowest median household income of $0, with 20 households (2.6%) in this group.
| Income Bracket | # Households | Median Income |
| 15 to 24 Years | 20 (2.6%) | $0 |
| 25 to 44 Years | 114 (15.1%) | $86,875 |
| 45 to 64 Years | 243 (32.2%) | $32,604 |
| 65+ Years | 378 (50.1%) | $38,083 |
| Total | 755 (100.0%) | $38,681 |
Poverty in Lincolnton
Income Below Poverty by Sex and Age in Lincolnton
With 12.6% poverty level for males and 19.4% for females among the residents of Lincolnton, 75 year old and over males and 5 year old females are the most vulnerable to poverty, with 43 males (41.7%) and 7 females (77.8%) in their respective age groups living below the poverty level.
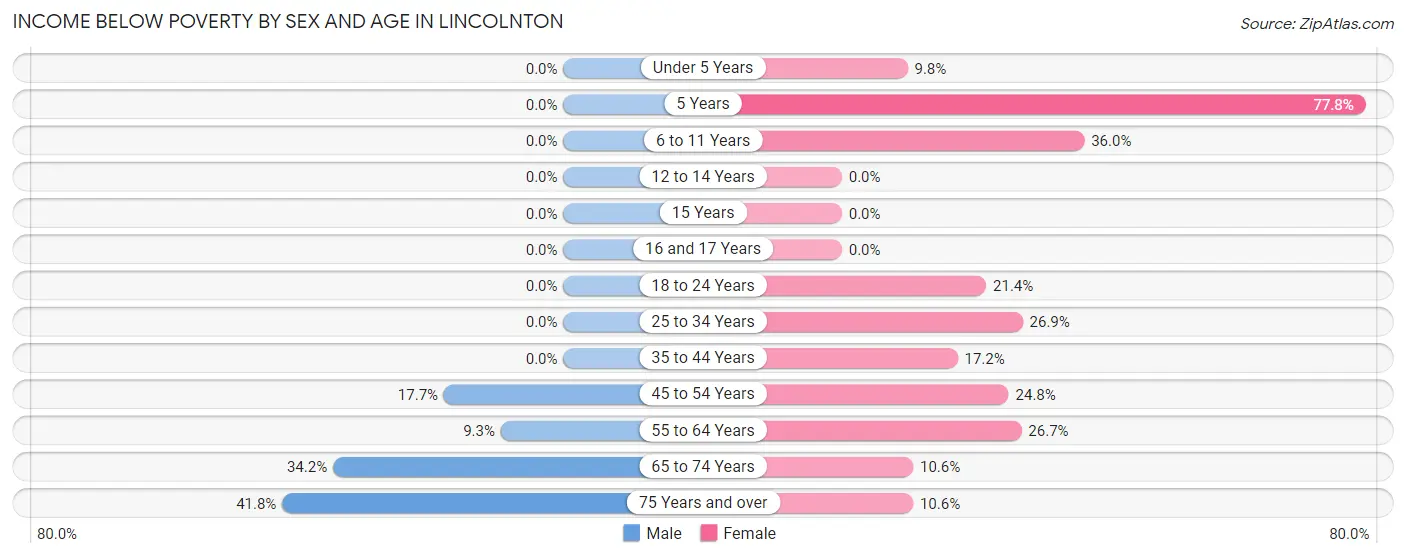
| Age Bracket | Male | Female |
| Under 5 Years | 0 (0.0%) | 4 (9.8%) |
| 5 Years | 0 (0.0%) | 7 (77.8%) |
| 6 to 11 Years | 0 (0.0%) | 18 (36.0%) |
| 12 to 14 Years | 0 (0.0%) | 0 (0.0%) |
| 15 Years | 0 (0.0%) | 0 (0.0%) |
| 16 and 17 Years | 0 (0.0%) | 0 (0.0%) |
| 18 to 24 Years | 0 (0.0%) | 12 (21.4%) |
| 25 to 34 Years | 0 (0.0%) | 29 (26.9%) |
| 35 to 44 Years | 0 (0.0%) | 11 (17.2%) |
| 45 to 54 Years | 11 (17.7%) | 27 (24.8%) |
| 55 to 64 Years | 17 (9.3%) | 44 (26.7%) |
| 65 to 74 Years | 39 (34.2%) | 20 (10.6%) |
| 75 Years and over | 43 (41.7%) | 13 (10.6%) |
| Total | 110 (12.6%) | 185 (19.4%) |
Income Above Poverty by Sex and Age in Lincolnton
According to the poverty statistics in Lincolnton, males aged under 5 years and females aged 12 to 14 years are the age groups that are most secure financially, with 100.0% of males and 100.0% of females in these age groups living above the poverty line.
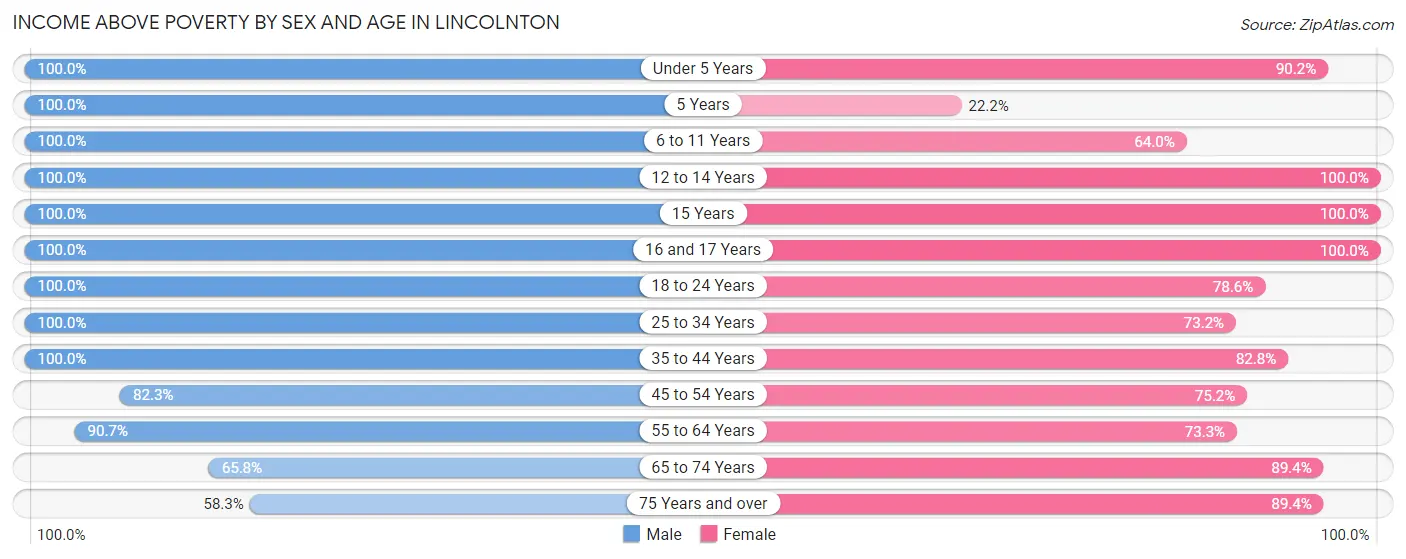
| Age Bracket | Male | Female |
| Under 5 Years | 31 (100.0%) | 37 (90.2%) |
| 5 Years | 14 (100.0%) | 2 (22.2%) |
| 6 to 11 Years | 60 (100.0%) | 32 (64.0%) |
| 12 to 14 Years | 83 (100.0%) | 35 (100.0%) |
| 15 Years | 12 (100.0%) | 2 (100.0%) |
| 16 and 17 Years | 19 (100.0%) | 2 (100.0%) |
| 18 to 24 Years | 77 (100.0%) | 44 (78.6%) |
| 25 to 34 Years | 50 (100.0%) | 79 (73.2%) |
| 35 to 44 Years | 65 (100.0%) | 53 (82.8%) |
| 45 to 54 Years | 51 (82.3%) | 82 (75.2%) |
| 55 to 64 Years | 166 (90.7%) | 121 (73.3%) |
| 65 to 74 Years | 75 (65.8%) | 169 (89.4%) |
| 75 Years and over | 60 (58.3%) | 110 (89.4%) |
| Total | 763 (87.4%) | 768 (80.6%) |
Income Below Poverty Among Married-Couple Families in Lincolnton
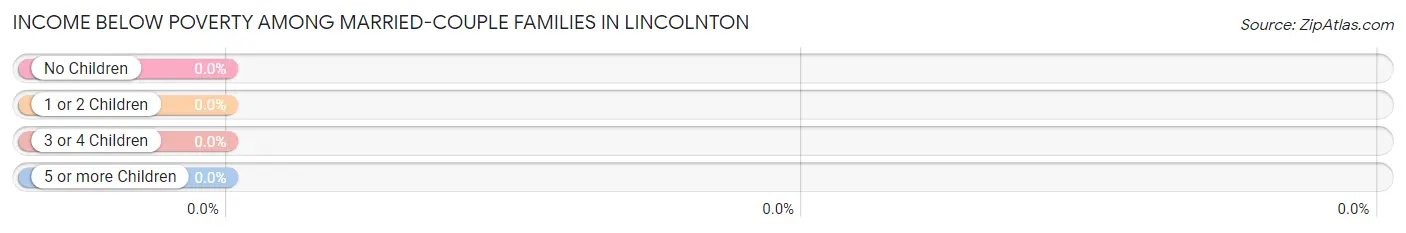
| Children | Above Poverty | Below Poverty |
| No Children | 170 (100.0%) | 0 (0.0%) |
| 1 or 2 Children | 57 (100.0%) | 0 (0.0%) |
| 3 or 4 Children | 42 (100.0%) | 0 (0.0%) |
| 5 or more Children | 4 (100.0%) | 0 (0.0%) |
| Total | 273 (100.0%) | 0 (0.0%) |
Income Below Poverty Among Single-Parent Households in Lincolnton
According to the poverty data in Lincolnton, 36.1% or 13 single-father households and 16.2% or 21 single-mother households are living below the poverty line. Among single-father households, those with no children have the highest poverty rate, with 13 households (39.4%) experiencing poverty. Likewise, among single-mother households, those with 1 or 2 children have the highest poverty rate, with 18 households (62.1%) falling below the poverty line.
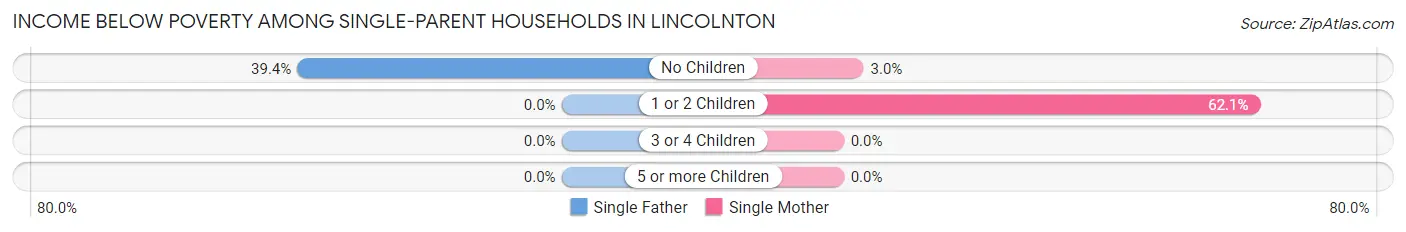
| Children | Single Father | Single Mother |
| No Children | 13 (39.4%) | 3 (3.0%) |
| 1 or 2 Children | 0 (0.0%) | 18 (62.1%) |
| 3 or 4 Children | 0 (0.0%) | 0 (0.0%) |
| 5 or more Children | 0 (0.0%) | 0 (0.0%) |
| Total | 13 (36.1%) | 21 (16.2%) |
Income Below Poverty Among Married-Couple vs Single-Parent Households in Lincolnton
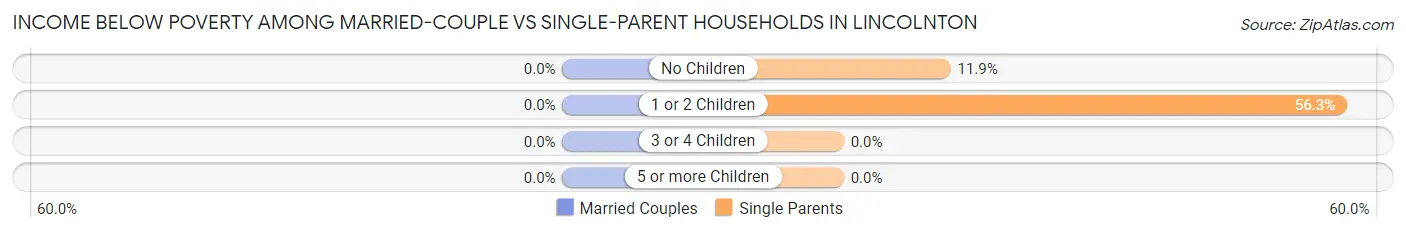
| Children | Married-Couple Families | Single-Parent Households |
| No Children | 0 (0.0%) | 16 (11.9%) |
| 1 or 2 Children | 0 (0.0%) | 18 (56.2%) |
| 3 or 4 Children | 0 (0.0%) | 0 (0.0%) |
| 5 or more Children | 0 (0.0%) | 0 (0.0%) |
| Total | 0 (0.0%) | 34 (20.5%) |
Race in Lincolnton
The most populous races in Lincolnton are White / Caucasian (908 | 48.4%), Black / African American (874 | 46.6%), and Hispanic or Latino (123 | 6.6%).
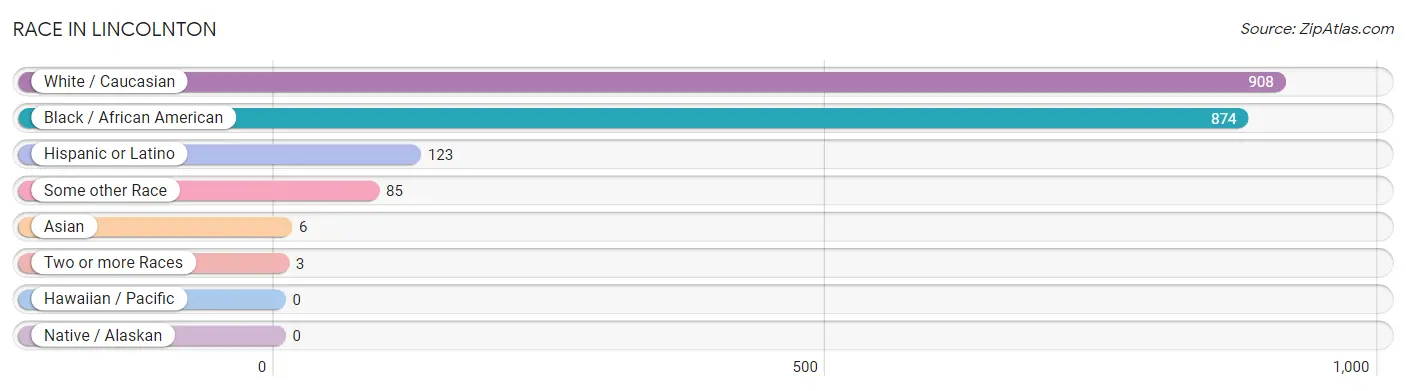
| Race | # Population | % Population |
| Asian | 6 | 0.3% |
| Black / African American | 874 | 46.6% |
| Hawaiian / Pacific | 0 | 0.0% |
| Hispanic or Latino | 123 | 6.6% |
| Native / Alaskan | 0 | 0.0% |
| White / Caucasian | 908 | 48.4% |
| Two or more Races | 3 | 0.2% |
| Some other Race | 85 | 4.5% |
| Total | 1,876 | 100.0% |
Ancestry in Lincolnton
The most populous ancestries reported in Lincolnton are American (252 | 13.4%), Irish (88 | 4.7%), Mexican (72 | 3.8%), English (67 | 3.6%), and Central American (51 | 2.7%), together accounting for 28.2% of all Lincolnton residents.
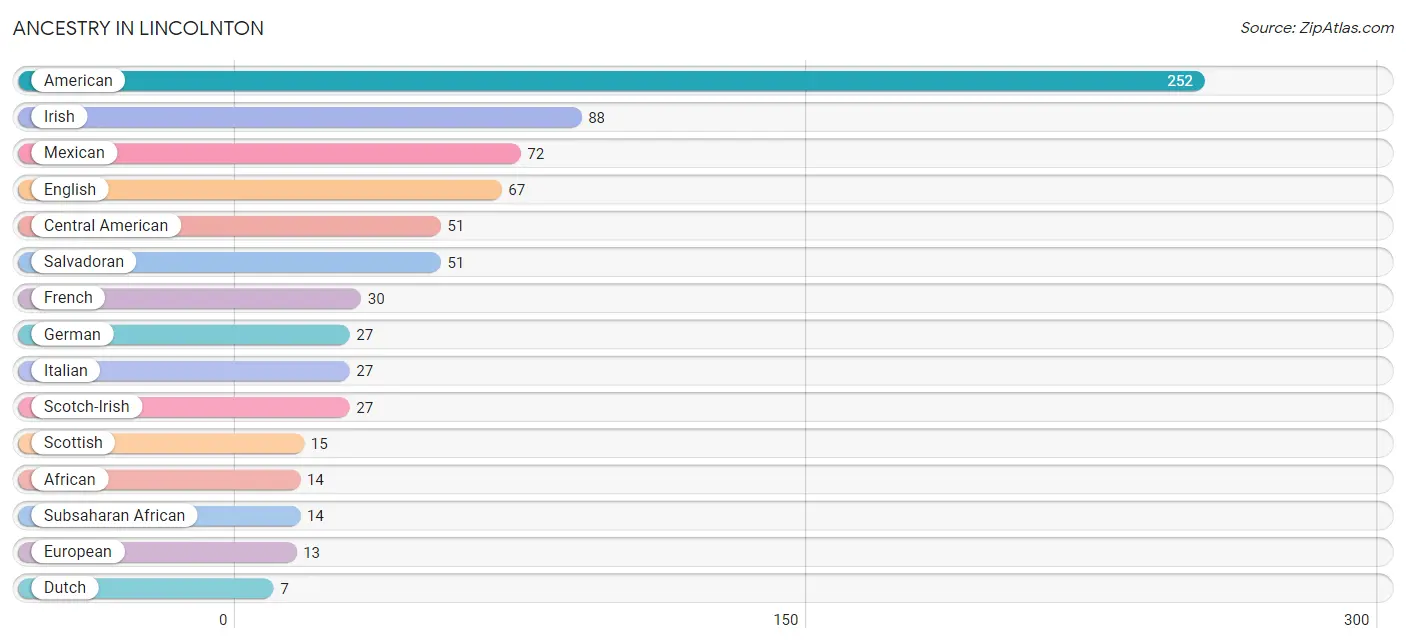
| Ancestry | # Population | % Population |
| African | 14 | 0.7% |
| American | 252 | 13.4% |
| Central American | 51 | 2.7% |
| Cherokee | 3 | 0.2% |
| Dutch | 7 | 0.4% |
| English | 67 | 3.6% |
| European | 13 | 0.7% |
| French | 30 | 1.6% |
| German | 27 | 1.4% |
| Hungarian | 5 | 0.3% |
| Irish | 88 | 4.7% |
| Italian | 27 | 1.4% |
| Mexican | 72 | 3.8% |
| Polish | 4 | 0.2% |
| Portuguese | 2 | 0.1% |
| Russian | 4 | 0.2% |
| Salvadoran | 51 | 2.7% |
| Scotch-Irish | 27 | 1.4% |
| Scottish | 15 | 0.8% |
| Sri Lankan | 6 | 0.3% |
| Subsaharan African | 14 | 0.7% |
| U.S. Virgin Islander | 7 | 0.4% | View All 22 Rows |
Immigrants in Lincolnton
The most numerous immigrant groups reported in Lincolnton came from Latin America (116 | 6.2%), Central America (114 | 6.1%), Mexico (92 | 4.9%), El Salvador (22 | 1.2%), and Europe (7 | 0.4%), together accounting for 18.7% of all Lincolnton residents.
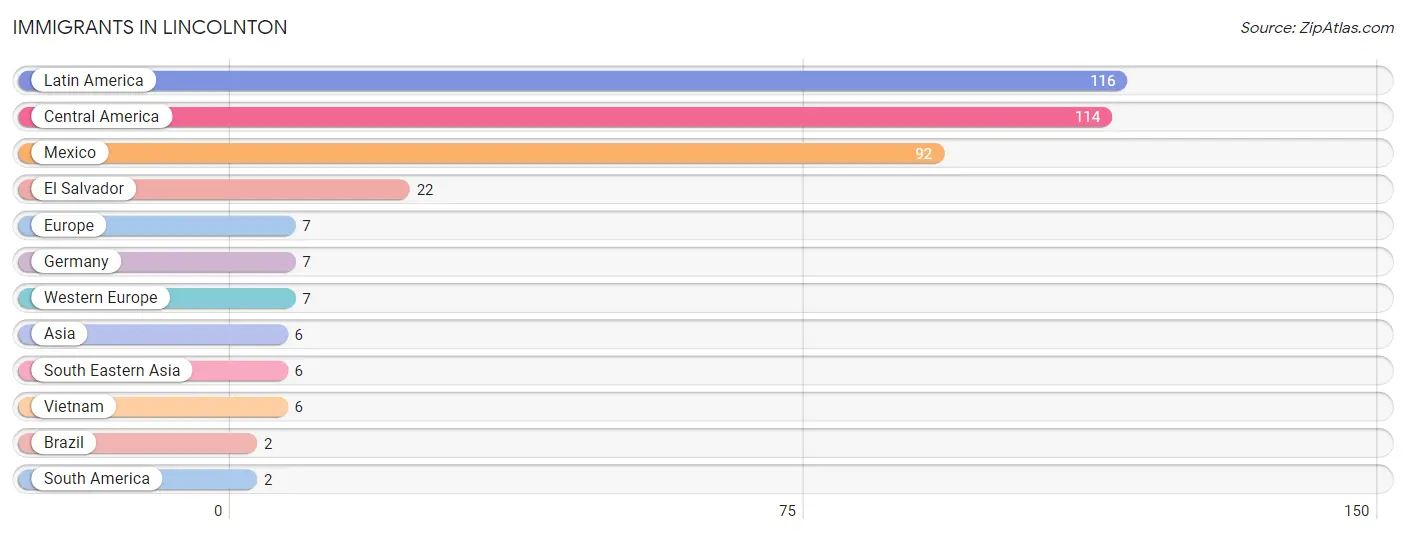
| Immigration Origin | # Population | % Population |
| Asia | 6 | 0.3% |
| Brazil | 2 | 0.1% |
| Central America | 114 | 6.1% |
| El Salvador | 22 | 1.2% |
| Europe | 7 | 0.4% |
| Germany | 7 | 0.4% |
| Latin America | 116 | 6.2% |
| Mexico | 92 | 4.9% |
| South America | 2 | 0.1% |
| South Eastern Asia | 6 | 0.3% |
| Vietnam | 6 | 0.3% |
| Western Europe | 7 | 0.4% | View All 12 Rows |
Sex and Age in Lincolnton
Sex and Age in Lincolnton
The most populous age groups in Lincolnton are 60 to 64 Years (158 | 17.1%) for men and 65 to 69 Years (145 | 15.2%) for women.
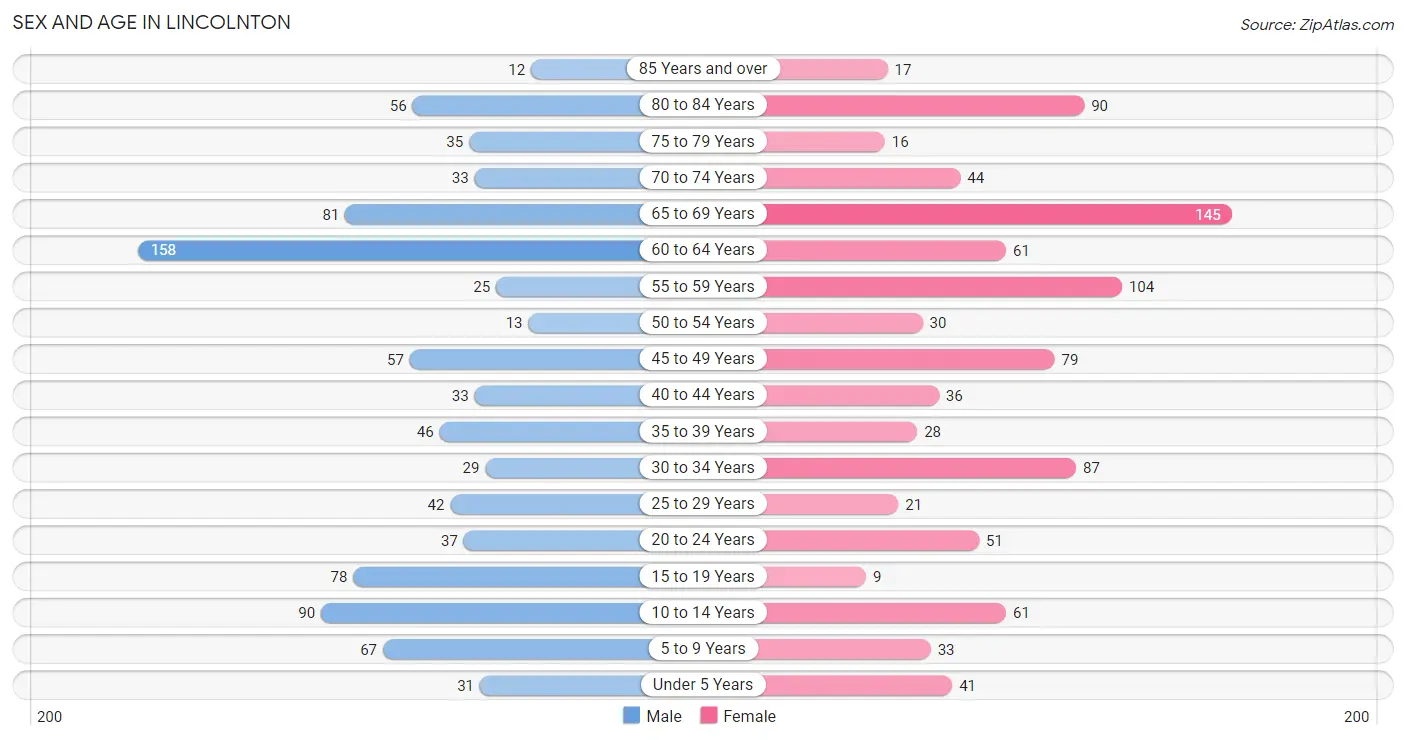
| Age Bracket | Male | Female |
| Under 5 Years | 31 (3.4%) | 41 (4.3%) |
| 5 to 9 Years | 67 (7.3%) | 33 (3.5%) |
| 10 to 14 Years | 90 (9.8%) | 61 (6.4%) |
| 15 to 19 Years | 78 (8.5%) | 9 (0.9%) |
| 20 to 24 Years | 37 (4.0%) | 51 (5.3%) |
| 25 to 29 Years | 42 (4.5%) | 21 (2.2%) |
| 30 to 34 Years | 29 (3.1%) | 87 (9.1%) |
| 35 to 39 Years | 46 (5.0%) | 28 (2.9%) |
| 40 to 44 Years | 33 (3.6%) | 36 (3.8%) |
| 45 to 49 Years | 57 (6.2%) | 79 (8.3%) |
| 50 to 54 Years | 13 (1.4%) | 30 (3.2%) |
| 55 to 59 Years | 25 (2.7%) | 104 (10.9%) |
| 60 to 64 Years | 158 (17.1%) | 61 (6.4%) |
| 65 to 69 Years | 81 (8.8%) | 145 (15.2%) |
| 70 to 74 Years | 33 (3.6%) | 44 (4.6%) |
| 75 to 79 Years | 35 (3.8%) | 16 (1.7%) |
| 80 to 84 Years | 56 (6.1%) | 90 (9.4%) |
| 85 Years and over | 12 (1.3%) | 17 (1.8%) |
| Total | 923 (100.0%) | 953 (100.0%) |
Families and Households in Lincolnton
Median Family Size in Lincolnton
The median family size in Lincolnton is 3.28 persons per family, with married-couple families (273 | 62.2%) accounting for the largest median family size of 3.41 persons per family. On the other hand, single male/father families (36 | 8.2%) represent the smallest median family size with 2.44 persons per family.
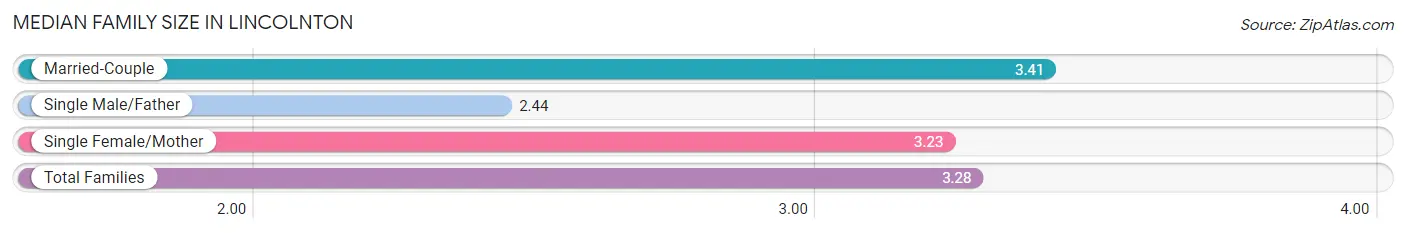
| Family Type | # Families | Family Size |
| Married-Couple | 273 (62.2%) | 3.41 |
| Single Male/Father | 36 (8.2%) | 2.44 |
| Single Female/Mother | 130 (29.6%) | 3.23 |
| Total Families | 439 (100.0%) | 3.28 |
Median Household Size in Lincolnton
The median household size in Lincolnton is 2.40 persons per household, with married-couple households (273 | 36.2%) accounting for the largest median household size of 3.41 persons per household. non-family households (316 | 41.8%) represent the smallest median household size with 1.17 persons per household.
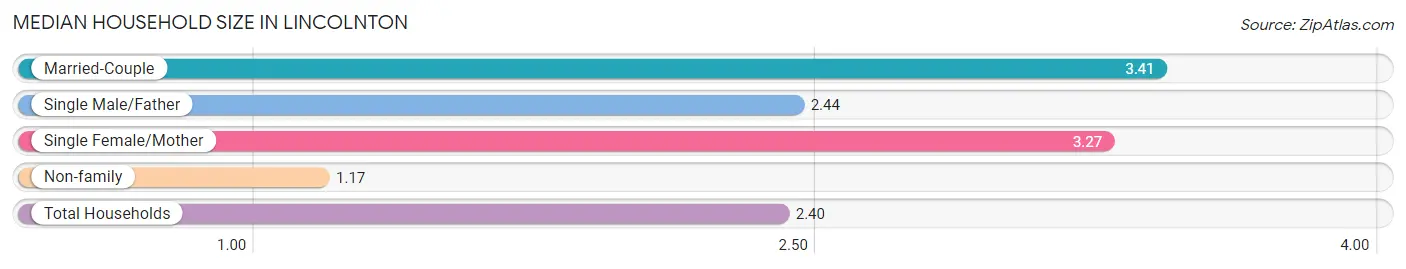
| Household Type | # Households | Household Size |
| Married-Couple | 273 (36.2%) | 3.41 |
| Single Male/Father | 36 (4.8%) | 2.44 |
| Single Female/Mother | 130 (17.2%) | 3.27 |
| Non-family | 316 (41.8%) | 1.17 |
| Total Households | 755 (100.0%) | 2.40 |
Household Size by Marriage Status in Lincolnton
Out of a total of 755 households in Lincolnton, 439 (58.2%) are family households, while 316 (41.8%) are nonfamily households. The most numerous type of family households are 2-person households, comprising 214, and the most common type of nonfamily households are 1-person households, comprising 280.
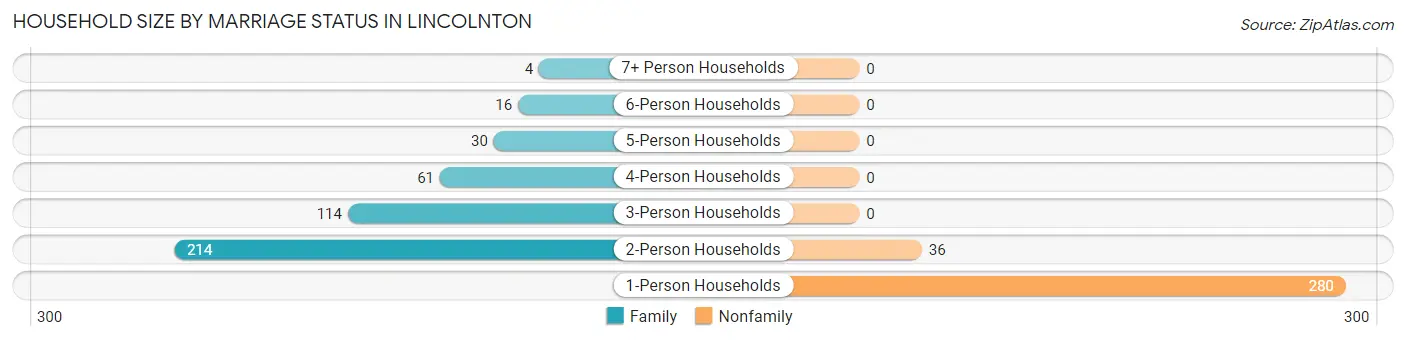
| Household Size | Family Households | Nonfamily Households |
| 1-Person Households | - | 280 (37.1%) |
| 2-Person Households | 214 (28.3%) | 36 (4.8%) |
| 3-Person Households | 114 (15.1%) | 0 (0.0%) |
| 4-Person Households | 61 (8.1%) | 0 (0.0%) |
| 5-Person Households | 30 (4.0%) | 0 (0.0%) |
| 6-Person Households | 16 (2.1%) | 0 (0.0%) |
| 7+ Person Households | 4 (0.5%) | 0 (0.0%) |
| Total | 439 (58.2%) | 316 (41.8%) |
Female Fertility in Lincolnton
Fertility by Age in Lincolnton
Average fertility rate in Lincolnton is 51.0 births per 1,000 women. Women in the age bracket of 20 to 34 years have the highest fertility rate with 82.0 births per 1,000 women. Women in the age bracket of 20 to 34 years acount for 81.2% of all women with births.
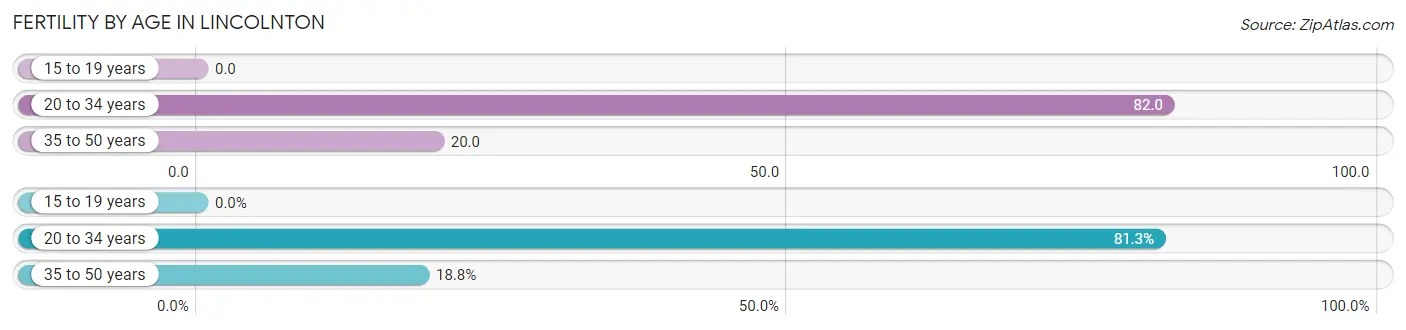
| Age Bracket | Women with Births | Births / 1,000 Women |
| 15 to 19 years | 0 (0.0%) | 0.0 |
| 20 to 34 years | 13 (81.2%) | 82.0 |
| 35 to 50 years | 3 (18.8%) | 20.0 |
| Total | 16 (100.0%) | 51.0 |
Fertility by Age by Marriage Status in Lincolnton
50.0% of women with births (16) in Lincolnton are married. The highest percentage of unmarried women with births falls into 35 to 50 years age bracket with 100.0% of them unmarried at the time of birth, while the lowest percentage of unmarried women with births belong to 20 to 34 years age bracket with 38.5% of them unmarried.
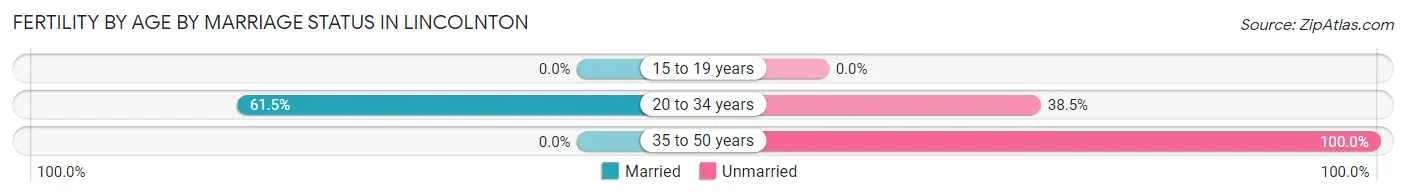
| Age Bracket | Married | Unmarried |
| 15 to 19 years | 0 (0.0%) | 0 (0.0%) |
| 20 to 34 years | 8 (61.5%) | 5 (38.5%) |
| 35 to 50 years | 0 (0.0%) | 3 (100.0%) |
| Total | 8 (50.0%) | 8 (50.0%) |
Fertility by Education in Lincolnton
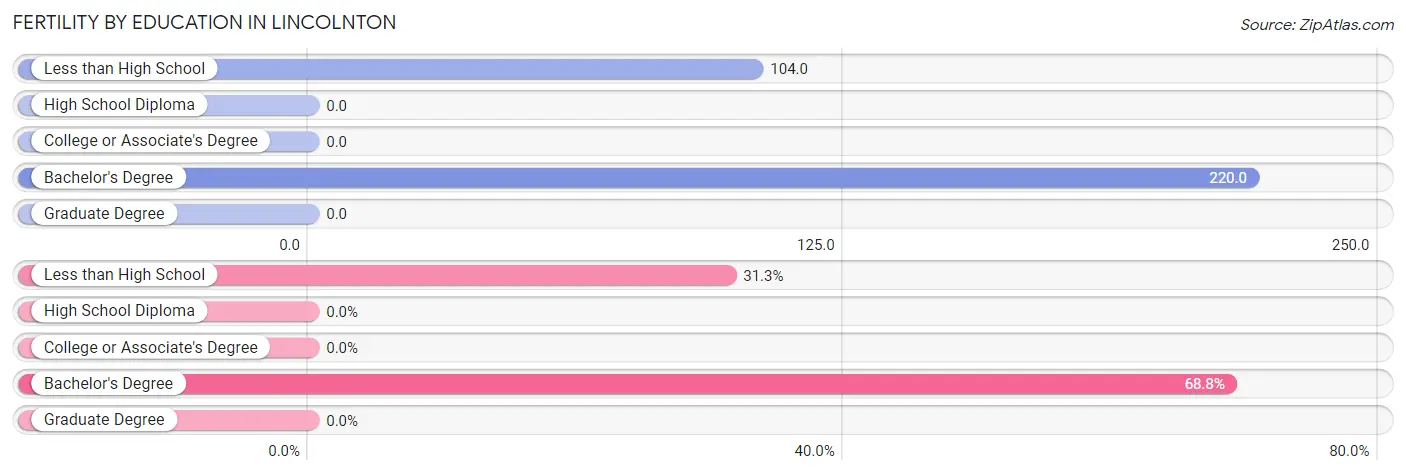
| Educational Attainment | Women with Births | Births / 1,000 Women |
| Less than High School | 5 (31.2%) | 104.0 |
| High School Diploma | 0 (0.0%) | 0.0 |
| College or Associate's Degree | 0 (0.0%) | 0.0 |
| Bachelor's Degree | 11 (68.8%) | 220.0 |
| Graduate Degree | 0 (0.0%) | 0.0 |
| Total | 16 (100.0%) | 51.0 |
Fertility by Education by Marriage Status in Lincolnton
50.0% of women with births in Lincolnton are unmarried. Women with the educational attainment of bachelor's degree are most likely to be married with 72.7% of them married at childbirth, while women with the educational attainment of less than high school are least likely to be married with 100.0% of them unmarried at childbirth.
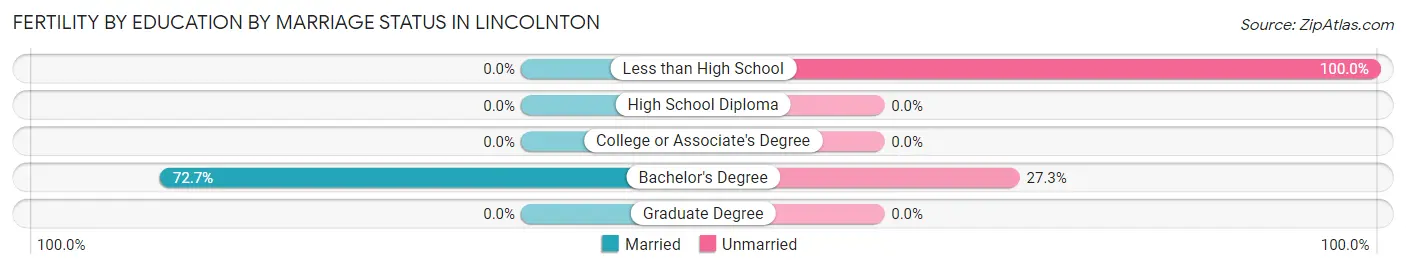
| Educational Attainment | Married | Unmarried |
| Less than High School | 0 (0.0%) | 5 (100.0%) |
| High School Diploma | 0 (0.0%) | 0 (0.0%) |
| College or Associate's Degree | 0 (0.0%) | 0 (0.0%) |
| Bachelor's Degree | 8 (72.7%) | 3 (27.3%) |
| Graduate Degree | 0 (0.0%) | 0 (0.0%) |
| Total | 8 (50.0%) | 8 (50.0%) |
Employment Characteristics in Lincolnton
Employment by Class of Employer in Lincolnton
Among the 642 employed individuals in Lincolnton, private company employees (266 | 41.4%), self-employed (not incorporated) (108 | 16.8%), and local government employees (83 | 12.9%) make up the most common classes of employment.
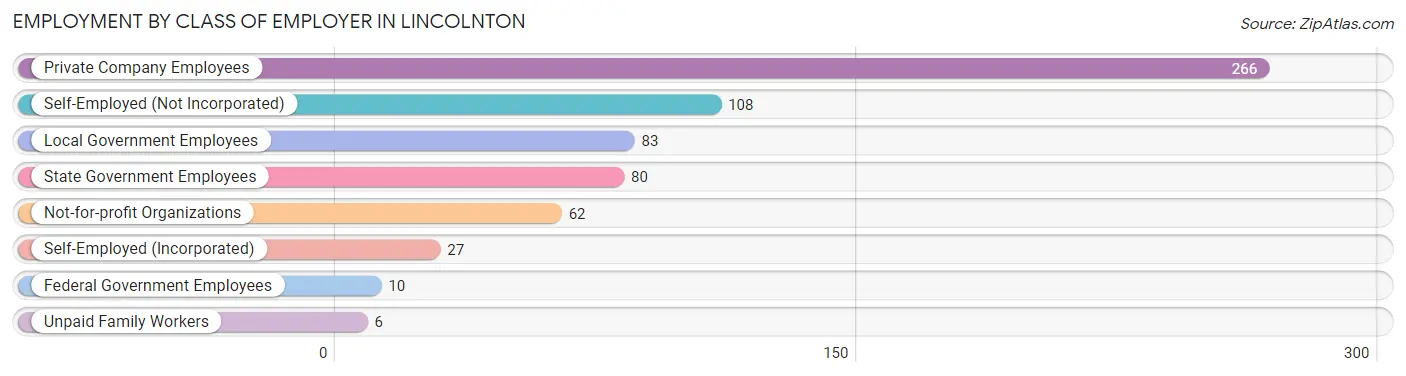
| Employer Class | # Employees | % Employees |
| Private Company Employees | 266 | 41.4% |
| Self-Employed (Incorporated) | 27 | 4.2% |
| Self-Employed (Not Incorporated) | 108 | 16.8% |
| Not-for-profit Organizations | 62 | 9.7% |
| Local Government Employees | 83 | 12.9% |
| State Government Employees | 80 | 12.5% |
| Federal Government Employees | 10 | 1.6% |
| Unpaid Family Workers | 6 | 0.9% |
| Total | 642 | 100.0% |
Employment Status by Age in Lincolnton
According to the labor force statistics for Lincolnton, out of the total population over 16 years of age (1,539), 44.6% or 686 individuals are in the labor force, with 1.5% or 10 of them unemployed. The age group with the highest labor force participation rate is 20 to 24 years, with 94.3% or 83 individuals in the labor force. Within the labor force, the 30 to 34 years age range has the highest percentage of unemployed individuals, with 12.0% or 6 of them being unemployed.
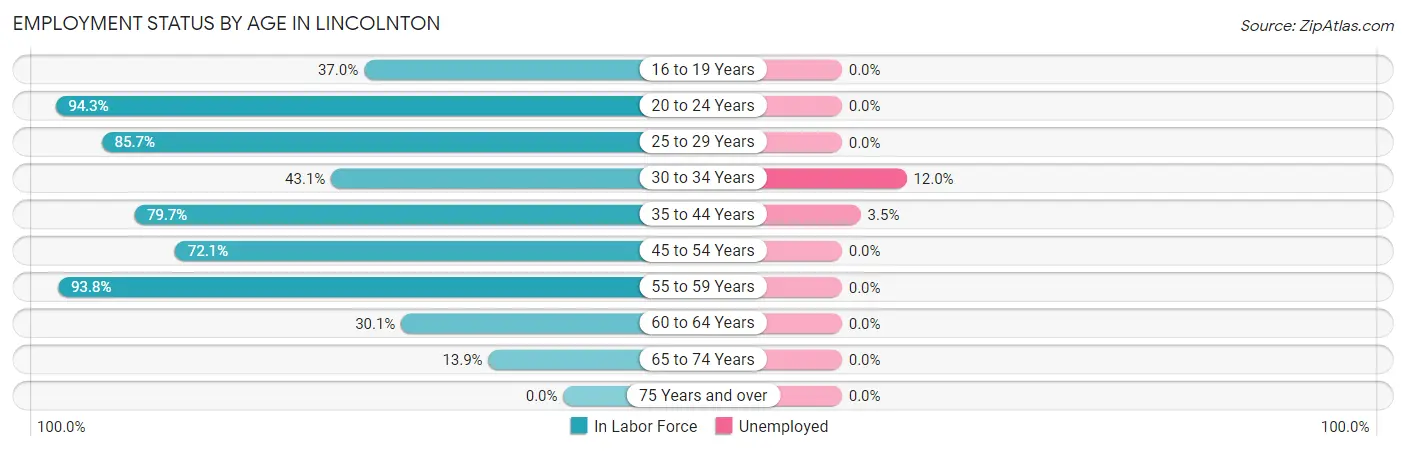
| Age Bracket | In Labor Force | Unemployed |
| 16 to 19 Years | 27 (37.0%) | 0 (0.0%) |
| 20 to 24 Years | 83 (94.3%) | 0 (0.0%) |
| 25 to 29 Years | 54 (85.7%) | 0 (0.0%) |
| 30 to 34 Years | 50 (43.1%) | 6 (12.0%) |
| 35 to 44 Years | 114 (79.7%) | 4 (3.5%) |
| 45 to 54 Years | 129 (72.1%) | 0 (0.0%) |
| 55 to 59 Years | 121 (93.8%) | 0 (0.0%) |
| 60 to 64 Years | 66 (30.1%) | 0 (0.0%) |
| 65 to 74 Years | 42 (13.9%) | 0 (0.0%) |
| 75 Years and over | 0 (0.0%) | 0 (0.0%) |
| Total | 686 (44.6%) | 10 (1.5%) |
Employment Status by Educational Attainment in Lincolnton
According to labor force statistics for Lincolnton, 62.9% of individuals (534) out of the total population between 25 and 64 years of age (849) are in the labor force, with 1.9% or 10 of them being unemployed. The group with the highest labor force participation rate are those with the educational attainment of bachelor's degree or higher, with 86.2% or 156 individuals in the labor force. Within the labor force, individuals with college / associate degree education have the highest percentage of unemployment, with 3.7% or 6 of them being unemployed.
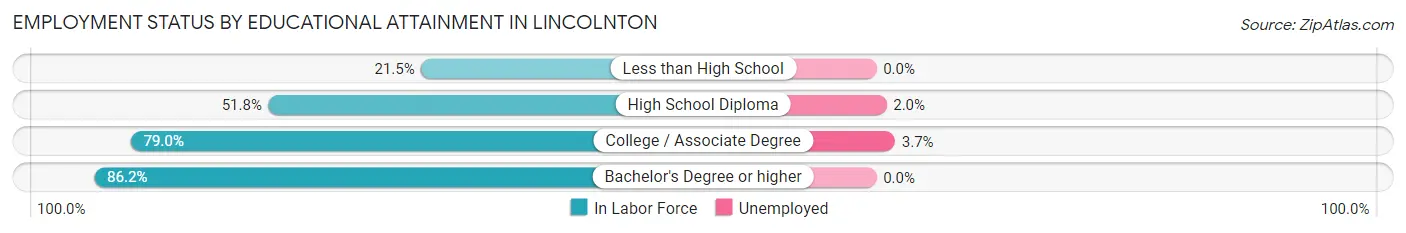
| Educational Attainment | In Labor Force | Unemployed |
| Less than High School | 17 (21.5%) | 0 (0.0%) |
| High School Diploma | 199 (51.8%) | 8 (2.0%) |
| College / Associate Degree | 162 (79.0%) | 8 (3.7%) |
| Bachelor's Degree or higher | 156 (86.2%) | 0 (0.0%) |
| Total | 534 (62.9%) | 16 (1.9%) |
Employment Occupations by Sex in Lincolnton
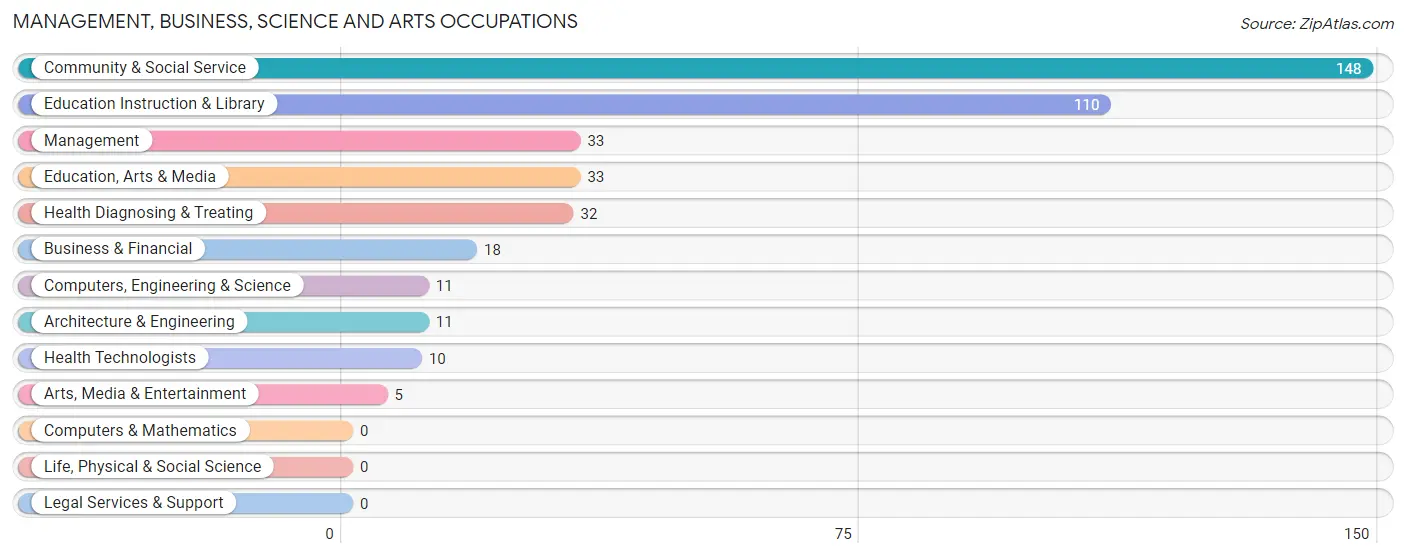
Management, Business, Science and Arts Occupations
The most common Management, Business, Science and Arts occupations in Lincolnton are Community & Social Service (148 | 21.9%), Education Instruction & Library (110 | 16.3%), Management (33 | 4.9%), Education, Arts & Media (33 | 4.9%), and Health Diagnosing & Treating (32 | 4.7%).
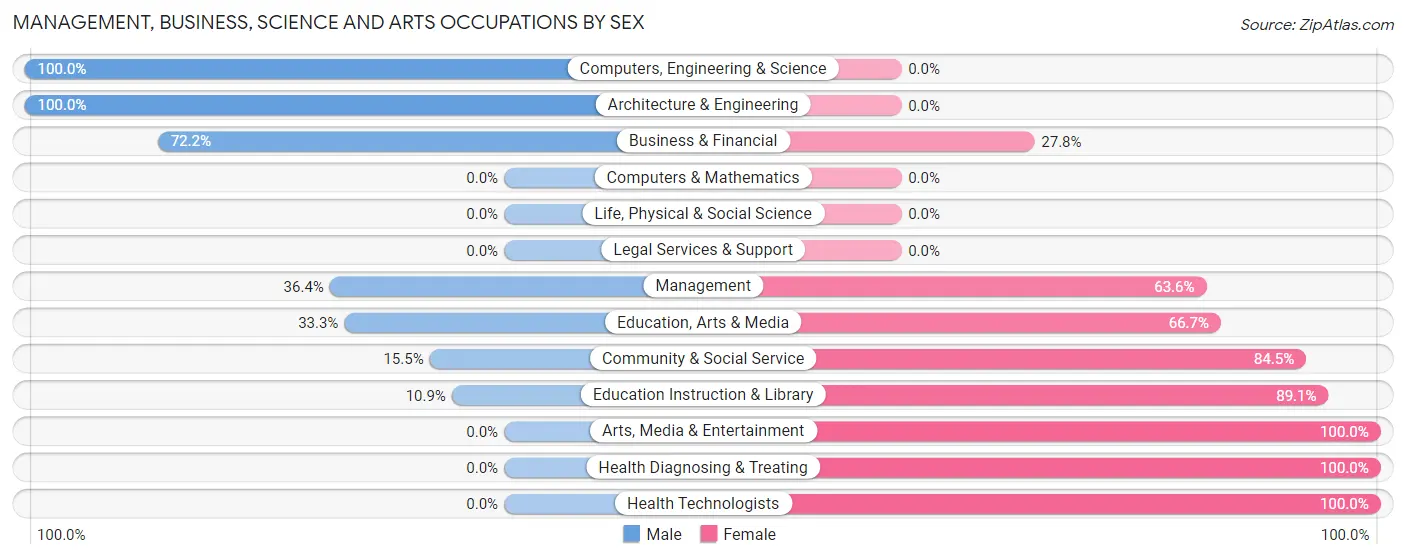
Management, Business, Science and Arts Occupations by Sex
Within the Management, Business, Science and Arts occupations in Lincolnton, the most male-oriented occupations are Computers, Engineering & Science (100.0%), Architecture & Engineering (100.0%), and Business & Financial (72.2%), while the most female-oriented occupations are Arts, Media & Entertainment (100.0%), Health Diagnosing & Treating (100.0%), and Health Technologists (100.0%).
| Occupation | Male | Female |
| Management | 12 (36.4%) | 21 (63.6%) |
| Business & Financial | 13 (72.2%) | 5 (27.8%) |
| Computers, Engineering & Science | 11 (100.0%) | 0 (0.0%) |
| Computers & Mathematics | 0 (0.0%) | 0 (0.0%) |
| Architecture & Engineering | 11 (100.0%) | 0 (0.0%) |
| Life, Physical & Social Science | 0 (0.0%) | 0 (0.0%) |
| Community & Social Service | 23 (15.5%) | 125 (84.5%) |
| Education, Arts & Media | 11 (33.3%) | 22 (66.7%) |
| Legal Services & Support | 0 (0.0%) | 0 (0.0%) |
| Education Instruction & Library | 12 (10.9%) | 98 (89.1%) |
| Arts, Media & Entertainment | 0 (0.0%) | 5 (100.0%) |
| Health Diagnosing & Treating | 0 (0.0%) | 32 (100.0%) |
| Health Technologists | 0 (0.0%) | 10 (100.0%) |
| Total (Category) | 59 (24.4%) | 183 (75.6%) |
| Total (Overall) | 294 (43.5%) | 382 (56.5%) |
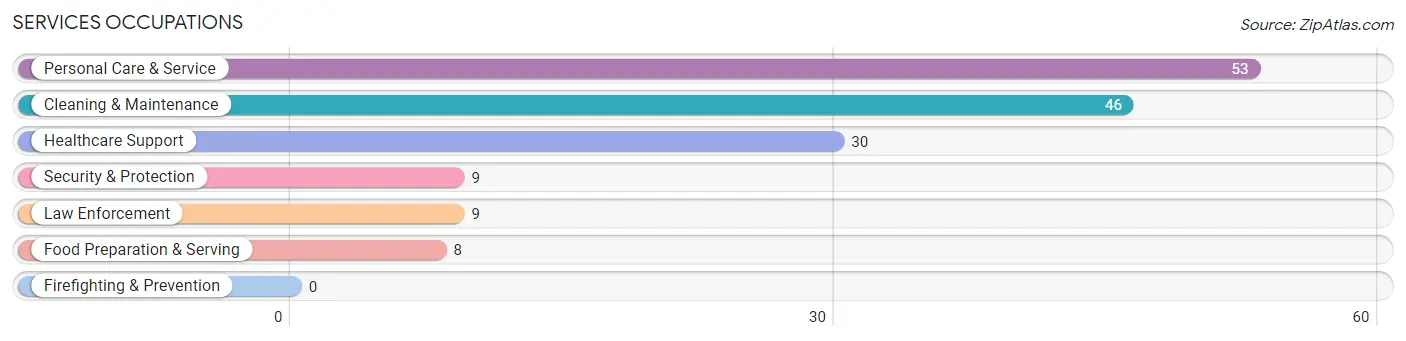
Services Occupations
The most common Services occupations in Lincolnton are Personal Care & Service (53 | 7.8%), Cleaning & Maintenance (46 | 6.8%), Healthcare Support (30 | 4.4%), Security & Protection (9 | 1.3%), and Law Enforcement (9 | 1.3%).
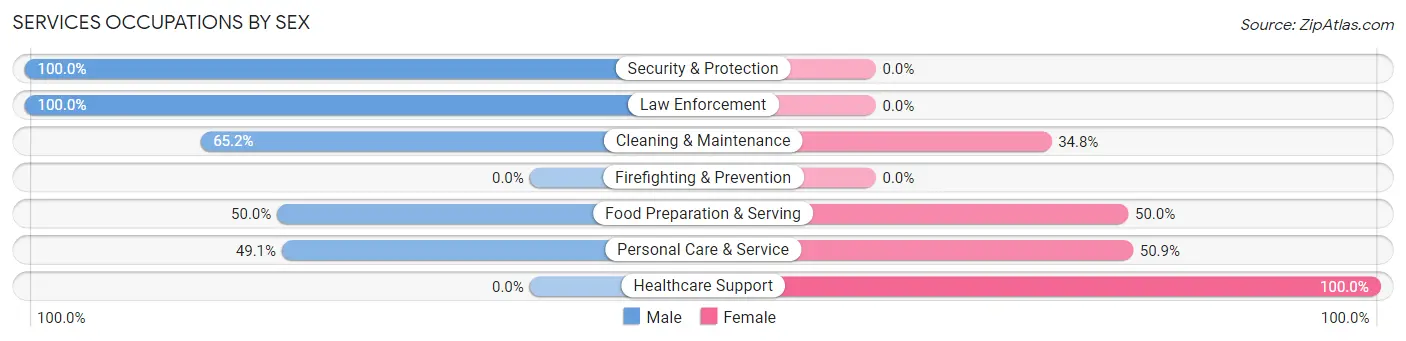
Services Occupations by Sex
Within the Services occupations in Lincolnton, the most male-oriented occupations are Security & Protection (100.0%), Law Enforcement (100.0%), and Cleaning & Maintenance (65.2%), while the most female-oriented occupations are Healthcare Support (100.0%), Personal Care & Service (50.9%), and Food Preparation & Serving (50.0%).
| Occupation | Male | Female |
| Healthcare Support | 0 (0.0%) | 30 (100.0%) |
| Security & Protection | 9 (100.0%) | 0 (0.0%) |
| Firefighting & Prevention | 0 (0.0%) | 0 (0.0%) |
| Law Enforcement | 9 (100.0%) | 0 (0.0%) |
| Food Preparation & Serving | 4 (50.0%) | 4 (50.0%) |
| Cleaning & Maintenance | 30 (65.2%) | 16 (34.8%) |
| Personal Care & Service | 26 (49.1%) | 27 (50.9%) |
| Total (Category) | 69 (47.3%) | 77 (52.7%) |
| Total (Overall) | 294 (43.5%) | 382 (56.5%) |
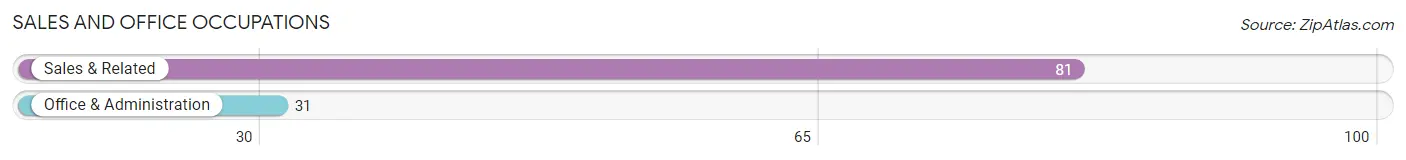
Sales and Office Occupations
The most common Sales and Office occupations in Lincolnton are Sales & Related (81 | 12.0%), and Office & Administration (31 | 4.6%).
Sales and Office Occupations by Sex
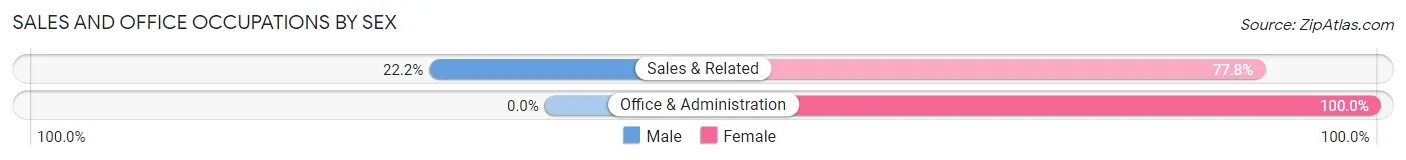
| Occupation | Male | Female |
| Sales & Related | 18 (22.2%) | 63 (77.8%) |
| Office & Administration | 0 (0.0%) | 31 (100.0%) |
| Total (Category) | 18 (16.1%) | 94 (83.9%) |
| Total (Overall) | 294 (43.5%) | 382 (56.5%) |
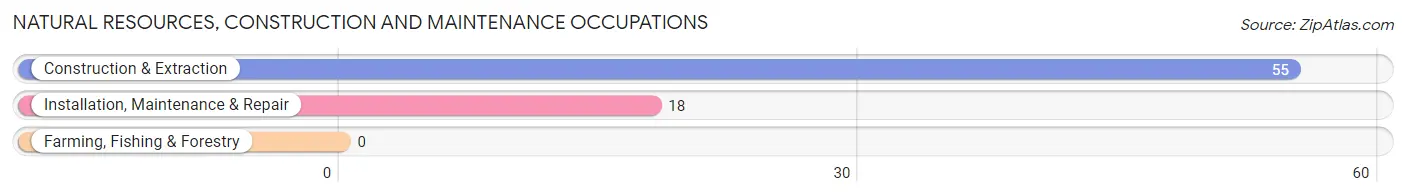
Natural Resources, Construction and Maintenance Occupations
The most common Natural Resources, Construction and Maintenance occupations in Lincolnton are Construction & Extraction (55 | 8.1%), and Installation, Maintenance & Repair (18 | 2.7%).
Natural Resources, Construction and Maintenance Occupations by Sex
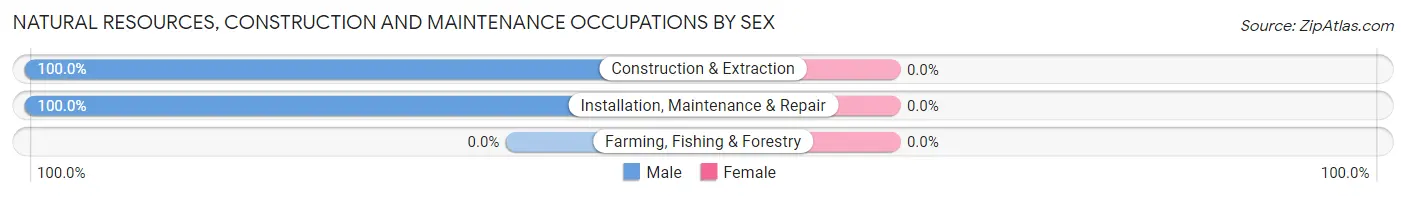
| Occupation | Male | Female |
| Farming, Fishing & Forestry | 0 (0.0%) | 0 (0.0%) |
| Construction & Extraction | 55 (100.0%) | 0 (0.0%) |
| Installation, Maintenance & Repair | 18 (100.0%) | 0 (0.0%) |
| Total (Category) | 73 (100.0%) | 0 (0.0%) |
| Total (Overall) | 294 (43.5%) | 382 (56.5%) |
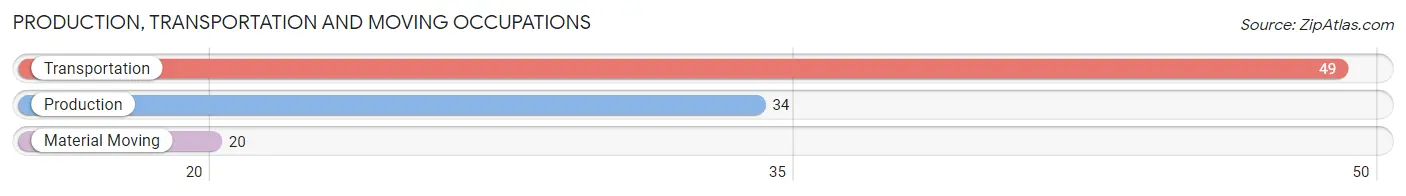
Production, Transportation and Moving Occupations
The most common Production, Transportation and Moving occupations in Lincolnton are Transportation (49 | 7.2%), Production (34 | 5.0%), and Material Moving (20 | 3.0%).
Production, Transportation and Moving Occupations by Sex
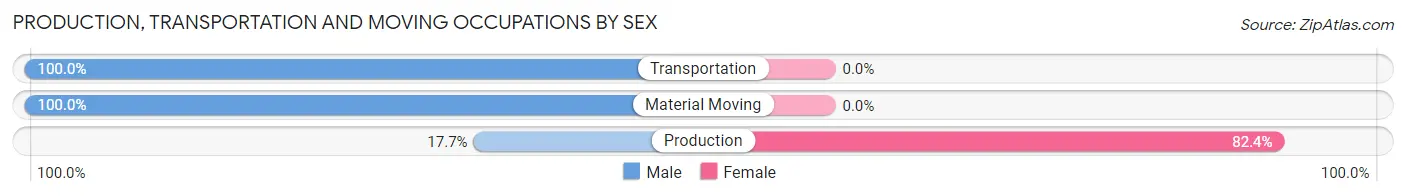
| Occupation | Male | Female |
| Production | 6 (17.6%) | 28 (82.4%) |
| Transportation | 49 (100.0%) | 0 (0.0%) |
| Material Moving | 20 (100.0%) | 0 (0.0%) |
| Total (Category) | 75 (72.8%) | 28 (27.2%) |
| Total (Overall) | 294 (43.5%) | 382 (56.5%) |
Employment Industries by Sex in Lincolnton
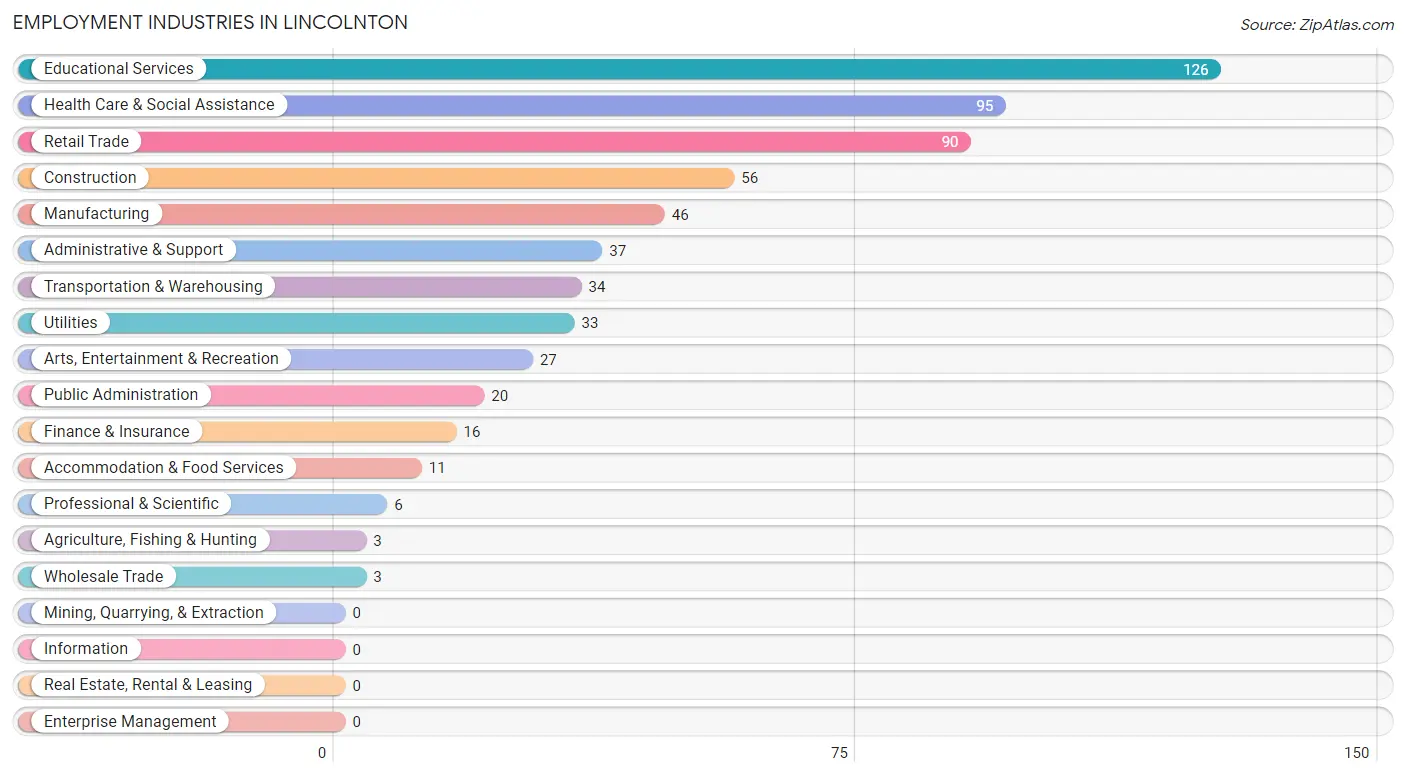
Employment Industries in Lincolnton
The major employment industries in Lincolnton include Educational Services (126 | 18.6%), Health Care & Social Assistance (95 | 14.1%), Retail Trade (90 | 13.3%), Construction (56 | 8.3%), and Manufacturing (46 | 6.8%).
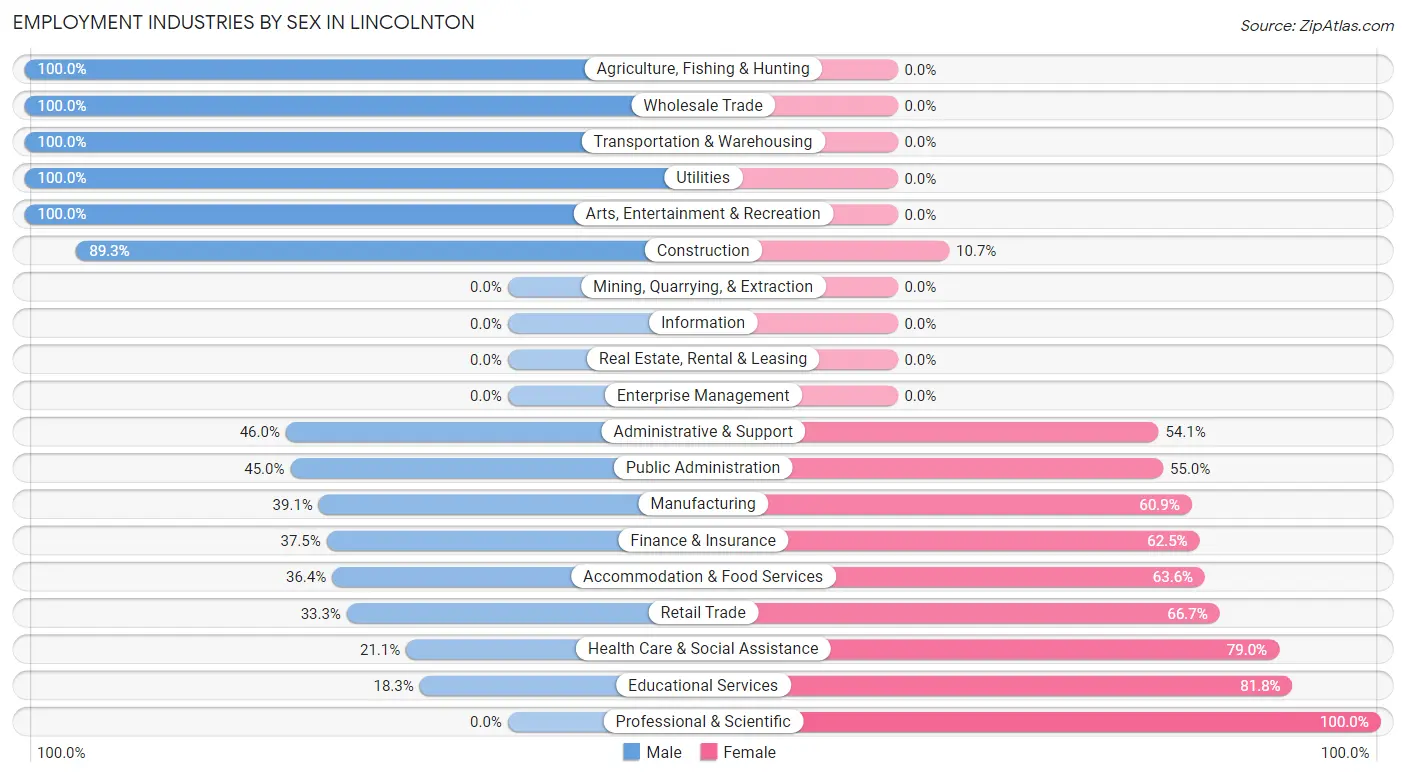
Employment Industries by Sex in Lincolnton
The Lincolnton industries that see more men than women are Agriculture, Fishing & Hunting (100.0%), Wholesale Trade (100.0%), and Transportation & Warehousing (100.0%), whereas the industries that tend to have a higher number of women are Professional & Scientific (100.0%), Educational Services (81.8%), and Health Care & Social Assistance (78.9%).
| Industry | Male | Female |
| Agriculture, Fishing & Hunting | 3 (100.0%) | 0 (0.0%) |
| Mining, Quarrying, & Extraction | 0 (0.0%) | 0 (0.0%) |
| Construction | 50 (89.3%) | 6 (10.7%) |
| Manufacturing | 18 (39.1%) | 28 (60.9%) |
| Wholesale Trade | 3 (100.0%) | 0 (0.0%) |
| Retail Trade | 30 (33.3%) | 60 (66.7%) |
| Transportation & Warehousing | 34 (100.0%) | 0 (0.0%) |
| Utilities | 33 (100.0%) | 0 (0.0%) |
| Information | 0 (0.0%) | 0 (0.0%) |
| Finance & Insurance | 6 (37.5%) | 10 (62.5%) |
| Real Estate, Rental & Leasing | 0 (0.0%) | 0 (0.0%) |
| Professional & Scientific | 0 (0.0%) | 6 (100.0%) |
| Enterprise Management | 0 (0.0%) | 0 (0.0%) |
| Administrative & Support | 17 (46.0%) | 20 (54.0%) |
| Educational Services | 23 (18.2%) | 103 (81.8%) |
| Health Care & Social Assistance | 20 (21.0%) | 75 (78.9%) |
| Arts, Entertainment & Recreation | 27 (100.0%) | 0 (0.0%) |
| Accommodation & Food Services | 4 (36.4%) | 7 (63.6%) |
| Public Administration | 9 (45.0%) | 11 (55.0%) |
| Total | 294 (43.5%) | 382 (56.5%) |
Education in Lincolnton
School Enrollment in Lincolnton
The most common levels of schooling among the 343 students in Lincolnton are middle school (126 | 36.7%), elementary school (67 | 19.5%), and high school (62 | 18.1%).
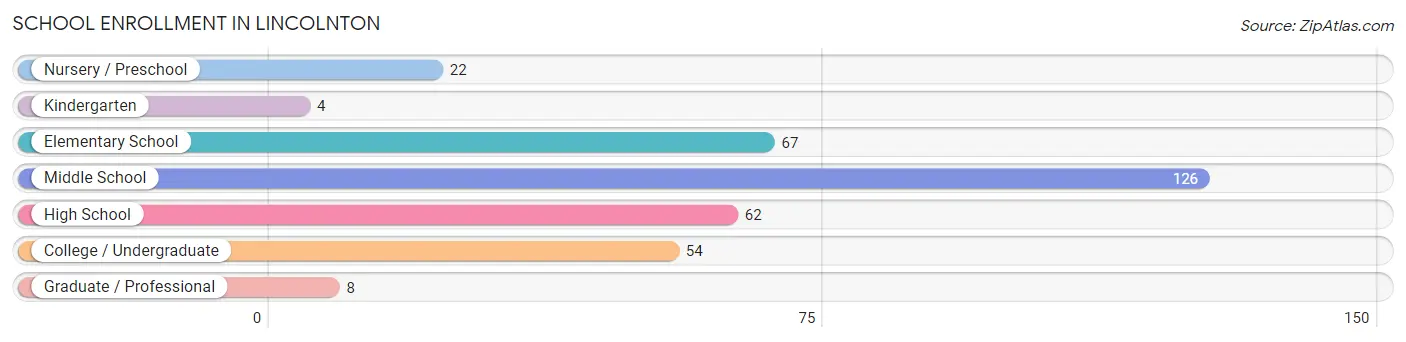
| School Level | # Students | % Students |
| Nursery / Preschool | 22 | 6.4% |
| Kindergarten | 4 | 1.2% |
| Elementary School | 67 | 19.5% |
| Middle School | 126 | 36.7% |
| High School | 62 | 18.1% |
| College / Undergraduate | 54 | 15.7% |
| Graduate / Professional | 8 | 2.3% |
| Total | 343 | 100.0% |
School Enrollment by Age by Funding Source in Lincolnton
Out of a total of 343 students who are enrolled in schools in Lincolnton, 59 (17.2%) attend a private institution, while the remaining 284 (82.8%) are enrolled in public schools. The age group of 35 years and over has the highest likelihood of being enrolled in private schools, with 5 (100.0% in the age bracket) enrolled. Conversely, the age group of 3 to 4 year olds has the lowest likelihood of being enrolled in a private school, with 3 (100.0% in the age bracket) attending a public institution.
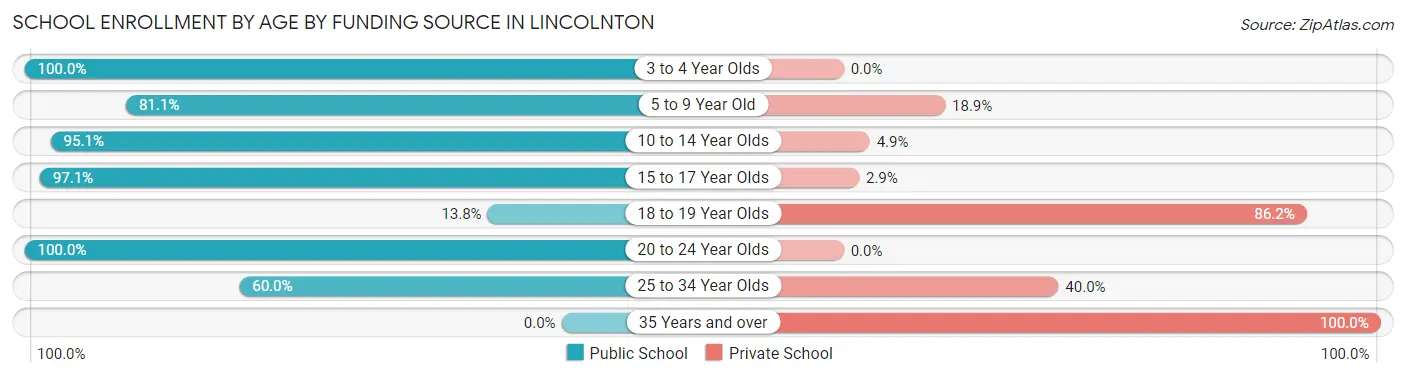
| Age Bracket | Public School | Private School |
| 3 to 4 Year Olds | 3 (100.0%) | 0 (0.0%) |
| 5 to 9 Year Old | 73 (81.1%) | 17 (18.9%) |
| 10 to 14 Year Olds | 137 (95.1%) | 7 (4.9%) |
| 15 to 17 Year Olds | 34 (97.1%) | 1 (2.9%) |
| 18 to 19 Year Olds | 4 (13.8%) | 25 (86.2%) |
| 20 to 24 Year Olds | 27 (100.0%) | 0 (0.0%) |
| 25 to 34 Year Olds | 6 (60.0%) | 4 (40.0%) |
| 35 Years and over | 0 (0.0%) | 5 (100.0%) |
| Total | 284 (82.8%) | 59 (17.2%) |
Educational Attainment by Field of Study in Lincolnton
Education (107 | 38.1%), business (43 | 15.3%), psychology (27 | 9.6%), liberal arts & history (21 | 7.5%), and science & technology (19 | 6.8%) are the most common fields of study among 281 individuals in Lincolnton who have obtained a bachelor's degree or higher.
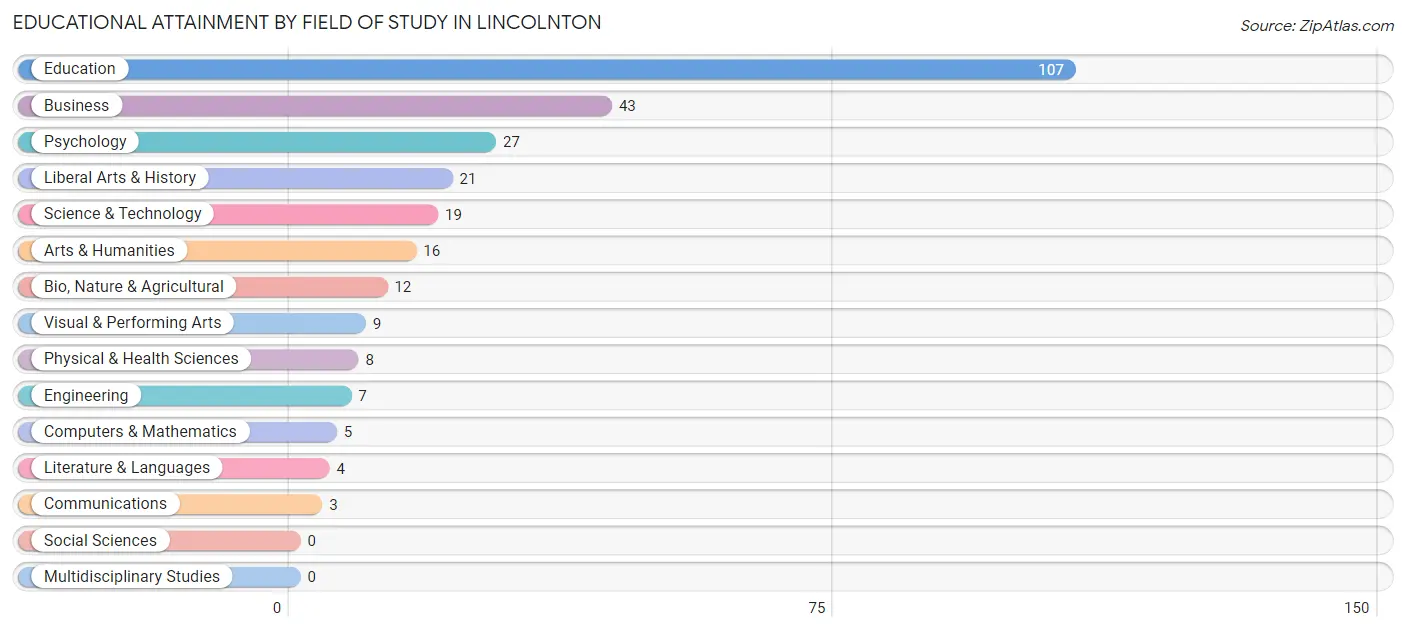
| Field of Study | # Graduates | % Graduates |
| Computers & Mathematics | 5 | 1.8% |
| Bio, Nature & Agricultural | 12 | 4.3% |
| Physical & Health Sciences | 8 | 2.9% |
| Psychology | 27 | 9.6% |
| Social Sciences | 0 | 0.0% |
| Engineering | 7 | 2.5% |
| Multidisciplinary Studies | 0 | 0.0% |
| Science & Technology | 19 | 6.8% |
| Business | 43 | 15.3% |
| Education | 107 | 38.1% |
| Literature & Languages | 4 | 1.4% |
| Liberal Arts & History | 21 | 7.5% |
| Visual & Performing Arts | 9 | 3.2% |
| Communications | 3 | 1.1% |
| Arts & Humanities | 16 | 5.7% |
| Total | 281 | 100.0% |
Transportation & Commute in Lincolnton
Vehicle Availability by Sex in Lincolnton
The most prevalent vehicle ownership categories in Lincolnton are males with 2 vehicles (109, accounting for 37.1%) and females with 2 vehicles (129, making up 31.8%).
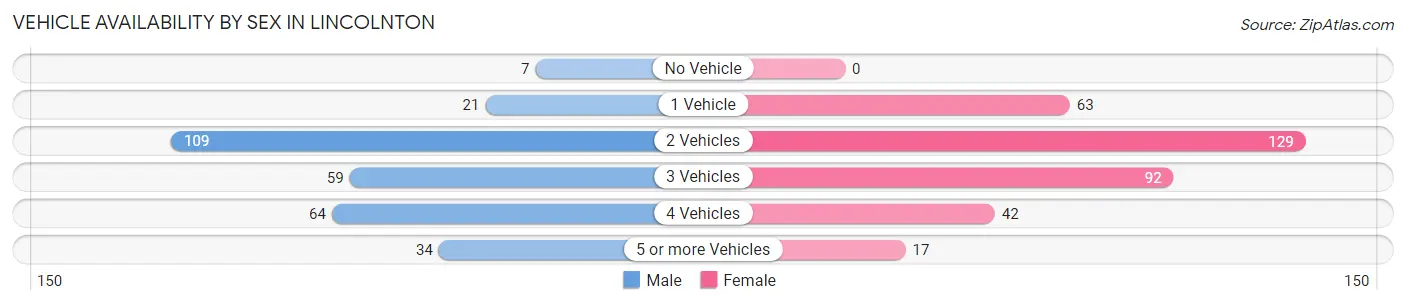
| Vehicles Available | Male | Female |
| No Vehicle | 7 (2.4%) | 0 (0.0%) |
| 1 Vehicle | 21 (7.1%) | 63 (18.4%) |
| 2 Vehicles | 109 (37.1%) | 129 (37.6%) |
| 3 Vehicles | 59 (20.1%) | 92 (26.8%) |
| 4 Vehicles | 64 (21.8%) | 42 (12.2%) |
| 5 or more Vehicles | 34 (11.6%) | 17 (5.0%) |
| Total | 294 (100.0%) | 343 (100.0%) |
Commute Time in Lincolnton
The most frequently occuring commute durations in Lincolnton are 5 to 9 minutes (123 commuters, 19.9%), less than 5 minutes (100 commuters, 16.2%), and 45 to 59 minutes (94 commuters, 15.2%).
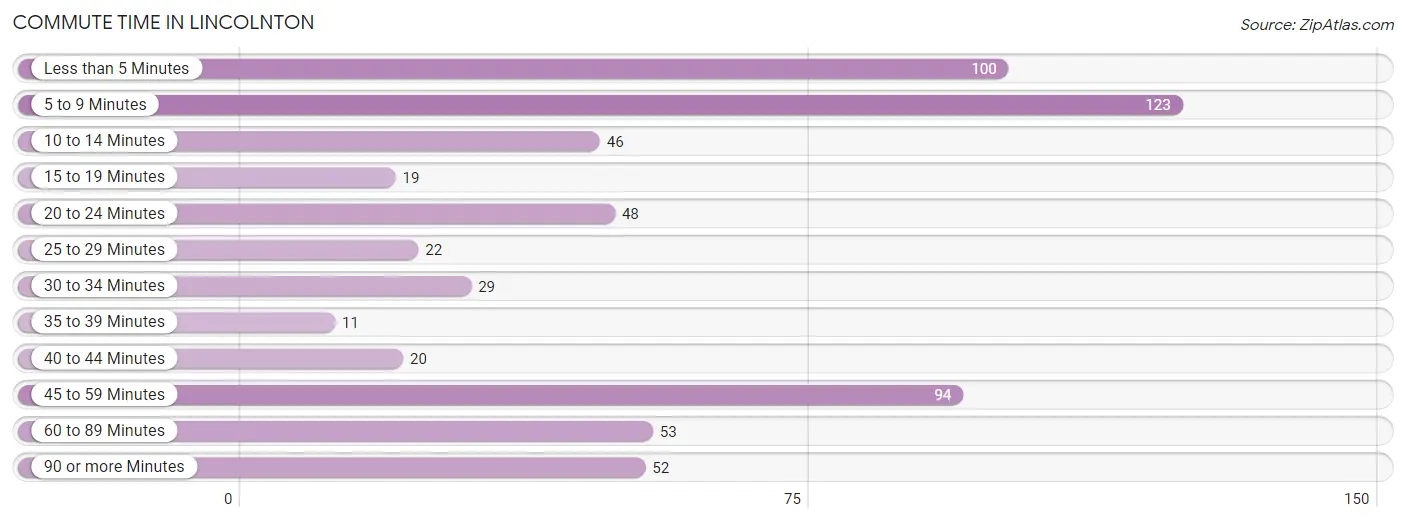
| Commute Time | # Commuters | % Commuters |
| Less than 5 Minutes | 100 | 16.2% |
| 5 to 9 Minutes | 123 | 19.9% |
| 10 to 14 Minutes | 46 | 7.5% |
| 15 to 19 Minutes | 19 | 3.1% |
| 20 to 24 Minutes | 48 | 7.8% |
| 25 to 29 Minutes | 22 | 3.6% |
| 30 to 34 Minutes | 29 | 4.7% |
| 35 to 39 Minutes | 11 | 1.8% |
| 40 to 44 Minutes | 20 | 3.2% |
| 45 to 59 Minutes | 94 | 15.2% |
| 60 to 89 Minutes | 53 | 8.6% |
| 90 or more Minutes | 52 | 8.4% |
Commute Time by Sex in Lincolnton
The most common commute times in Lincolnton are 45 to 59 minutes (52 commuters, 17.9%) for males and 5 to 9 minutes (83 commuters, 25.4%) for females.
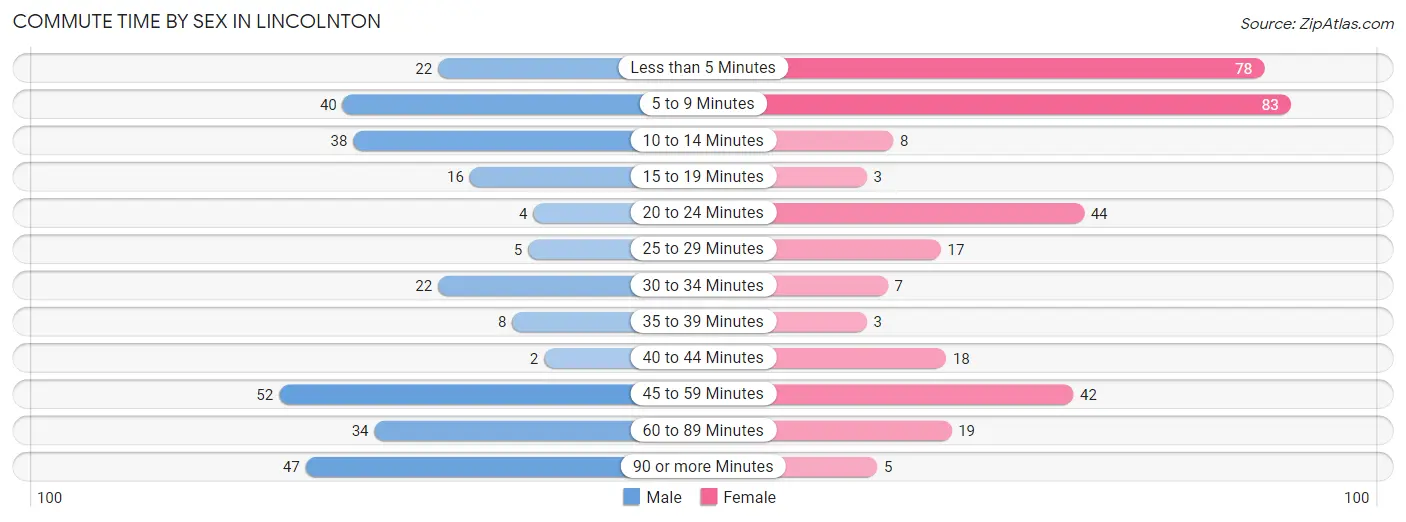
| Commute Time | Male | Female |
| Less than 5 Minutes | 22 (7.6%) | 78 (23.8%) |
| 5 to 9 Minutes | 40 (13.8%) | 83 (25.4%) |
| 10 to 14 Minutes | 38 (13.1%) | 8 (2.5%) |
| 15 to 19 Minutes | 16 (5.5%) | 3 (0.9%) |
| 20 to 24 Minutes | 4 (1.4%) | 44 (13.5%) |
| 25 to 29 Minutes | 5 (1.7%) | 17 (5.2%) |
| 30 to 34 Minutes | 22 (7.6%) | 7 (2.1%) |
| 35 to 39 Minutes | 8 (2.8%) | 3 (0.9%) |
| 40 to 44 Minutes | 2 (0.7%) | 18 (5.5%) |
| 45 to 59 Minutes | 52 (17.9%) | 42 (12.8%) |
| 60 to 89 Minutes | 34 (11.7%) | 19 (5.8%) |
| 90 or more Minutes | 47 (16.2%) | 5 (1.5%) |
Time of Departure to Work by Sex in Lincolnton
The most frequent times of departure to work in Lincolnton are 7:00 AM to 7:29 AM (102, 35.2%) for males and 8:00 AM to 8:29 AM (94, 28.7%) for females.
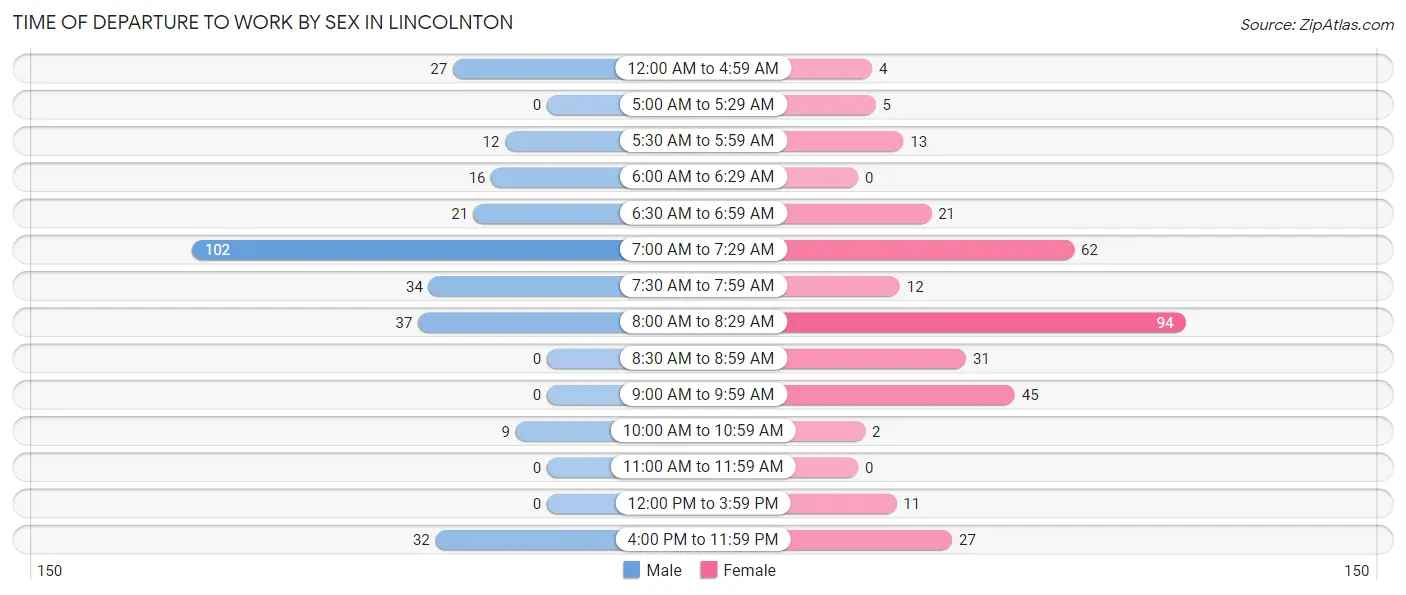
| Time of Departure | Male | Female |
| 12:00 AM to 4:59 AM | 27 (9.3%) | 4 (1.2%) |
| 5:00 AM to 5:29 AM | 0 (0.0%) | 5 (1.5%) |
| 5:30 AM to 5:59 AM | 12 (4.1%) | 13 (4.0%) |
| 6:00 AM to 6:29 AM | 16 (5.5%) | 0 (0.0%) |
| 6:30 AM to 6:59 AM | 21 (7.2%) | 21 (6.4%) |
| 7:00 AM to 7:29 AM | 102 (35.2%) | 62 (19.0%) |
| 7:30 AM to 7:59 AM | 34 (11.7%) | 12 (3.7%) |
| 8:00 AM to 8:29 AM | 37 (12.8%) | 94 (28.7%) |
| 8:30 AM to 8:59 AM | 0 (0.0%) | 31 (9.5%) |
| 9:00 AM to 9:59 AM | 0 (0.0%) | 45 (13.8%) |
| 10:00 AM to 10:59 AM | 9 (3.1%) | 2 (0.6%) |
| 11:00 AM to 11:59 AM | 0 (0.0%) | 0 (0.0%) |
| 12:00 PM to 3:59 PM | 0 (0.0%) | 11 (3.4%) |
| 4:00 PM to 11:59 PM | 32 (11.0%) | 27 (8.3%) |
| Total | 290 (100.0%) | 327 (100.0%) |
Housing Occupancy in Lincolnton
Occupancy by Ownership in Lincolnton
Of the total 755 dwellings in Lincolnton, owner-occupied units account for 438 (58.0%), while renter-occupied units make up 317 (42.0%).
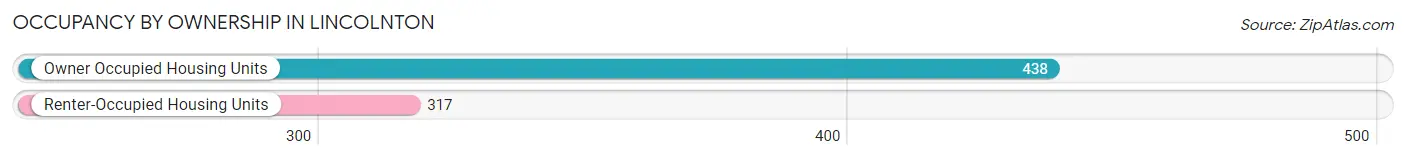
| Occupancy | # Housing Units | % Housing Units |
| Owner Occupied Housing Units | 438 | 58.0% |
| Renter-Occupied Housing Units | 317 | 42.0% |
| Total Occupied Housing Units | 755 | 100.0% |
Occupancy by Household Size in Lincolnton
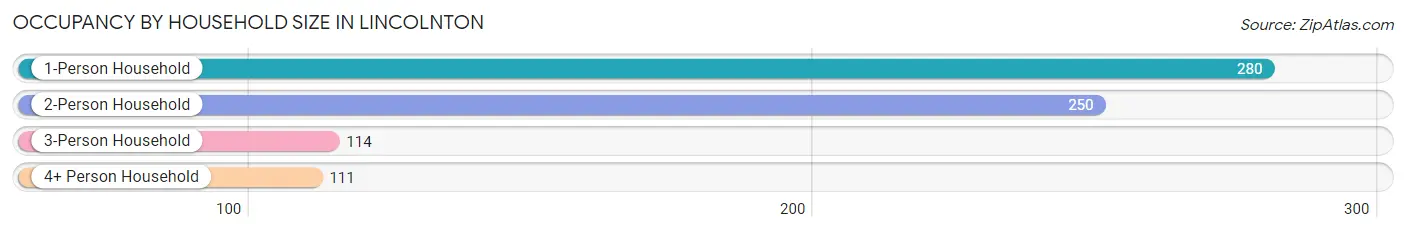
| Household Size | # Housing Units | % Housing Units |
| 1-Person Household | 280 | 37.1% |
| 2-Person Household | 250 | 33.1% |
| 3-Person Household | 114 | 15.1% |
| 4+ Person Household | 111 | 14.7% |
| Total Housing Units | 755 | 100.0% |
Occupancy by Ownership by Household Size in Lincolnton
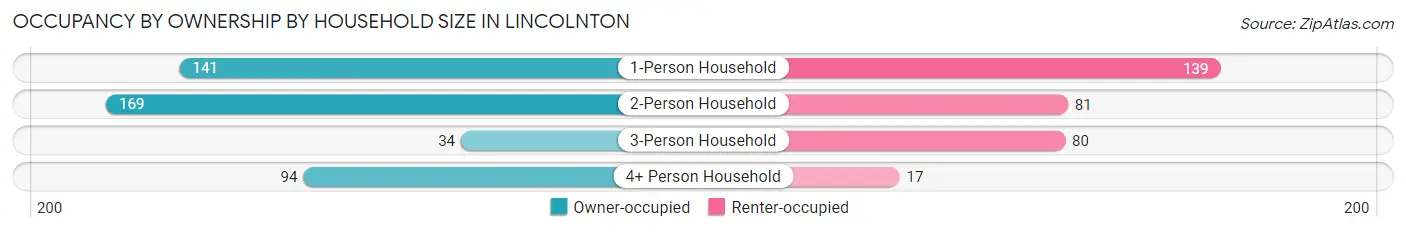
| Household Size | Owner-occupied | Renter-occupied |
| 1-Person Household | 141 (50.4%) | 139 (49.6%) |
| 2-Person Household | 169 (67.6%) | 81 (32.4%) |
| 3-Person Household | 34 (29.8%) | 80 (70.2%) |
| 4+ Person Household | 94 (84.7%) | 17 (15.3%) |
| Total Housing Units | 438 (58.0%) | 317 (42.0%) |
Occupancy by Educational Attainment in Lincolnton
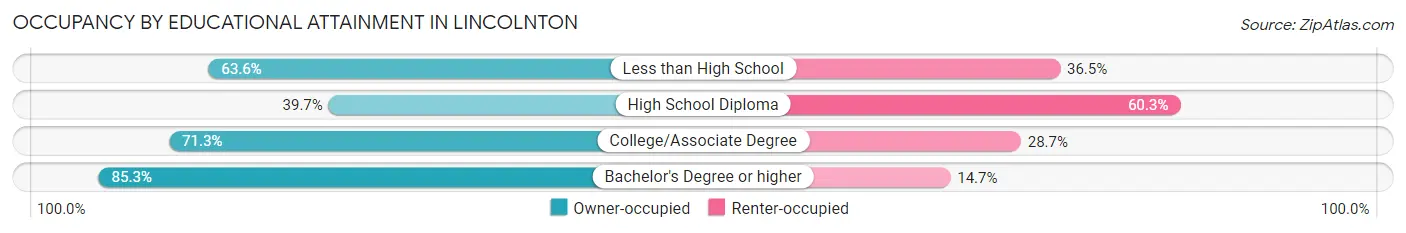
| Household Size | Owner-occupied | Renter-occupied |
| Less than High School | 68 (63.5%) | 39 (36.4%) |
| High School Diploma | 141 (39.7%) | 214 (60.3%) |
| College/Associate Degree | 107 (71.3%) | 43 (28.7%) |
| Bachelor's Degree or higher | 122 (85.3%) | 21 (14.7%) |
Occupancy by Age of Householder in Lincolnton
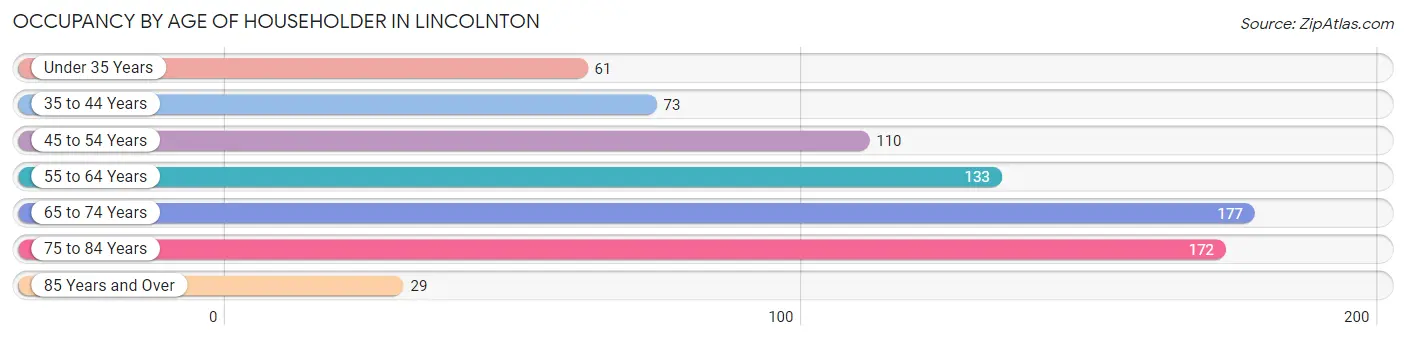
| Age Bracket | # Households | % Households |
| Under 35 Years | 61 | 8.1% |
| 35 to 44 Years | 73 | 9.7% |
| 45 to 54 Years | 110 | 14.6% |
| 55 to 64 Years | 133 | 17.6% |
| 65 to 74 Years | 177 | 23.4% |
| 75 to 84 Years | 172 | 22.8% |
| 85 Years and Over | 29 | 3.8% |
| Total | 755 | 100.0% |
Housing Finances in Lincolnton
Median Income by Occupancy in Lincolnton
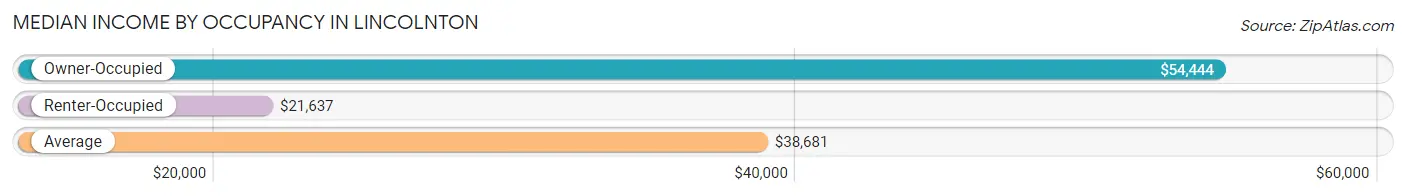
| Occupancy Type | # Households | Median Income |
| Owner-Occupied | 438 (58.0%) | $54,444 |
| Renter-Occupied | 317 (42.0%) | $21,637 |
| Average | 755 (100.0%) | $38,681 |
Occupancy by Householder Income Bracket in Lincolnton
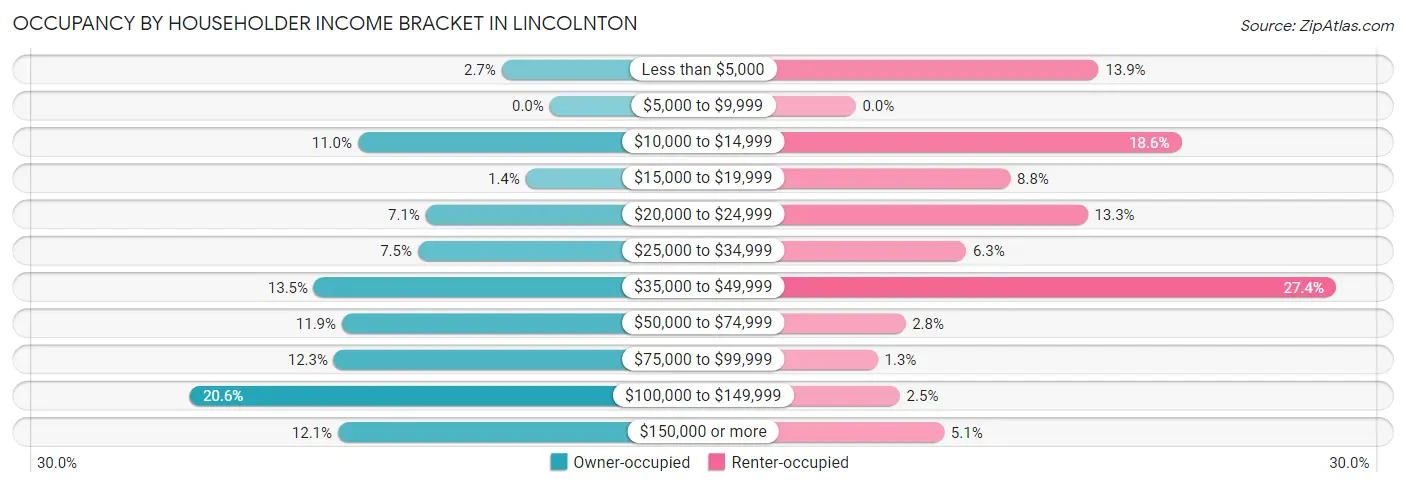
| Income Bracket | Owner-occupied | Renter-occupied |
| Less than $5,000 | 12 (2.7%) | 44 (13.9%) |
| $5,000 to $9,999 | 0 (0.0%) | 0 (0.0%) |
| $10,000 to $14,999 | 48 (11.0%) | 59 (18.6%) |
| $15,000 to $19,999 | 6 (1.4%) | 28 (8.8%) |
| $20,000 to $24,999 | 31 (7.1%) | 42 (13.3%) |
| $25,000 to $34,999 | 33 (7.5%) | 20 (6.3%) |
| $35,000 to $49,999 | 59 (13.5%) | 87 (27.4%) |
| $50,000 to $74,999 | 52 (11.9%) | 9 (2.8%) |
| $75,000 to $99,999 | 54 (12.3%) | 4 (1.3%) |
| $100,000 to $149,999 | 90 (20.5%) | 8 (2.5%) |
| $150,000 or more | 53 (12.1%) | 16 (5.1%) |
| Total | 438 (100.0%) | 317 (100.0%) |
Monthly Housing Cost Tiers in Lincolnton
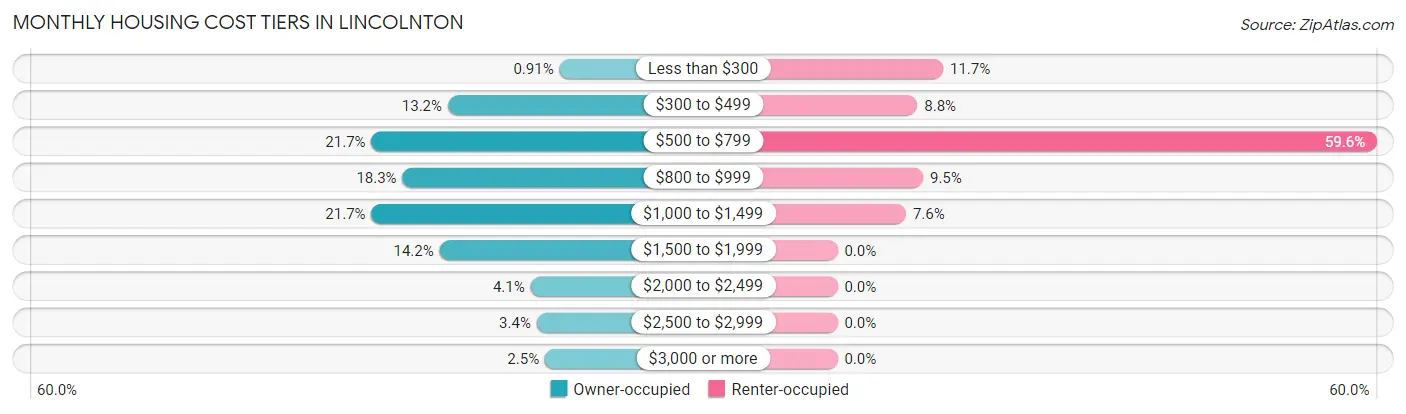
| Monthly Cost | Owner-occupied | Renter-occupied |
| Less than $300 | 4 (0.9%) | 37 (11.7%) |
| $300 to $499 | 58 (13.2%) | 28 (8.8%) |
| $500 to $799 | 95 (21.7%) | 189 (59.6%) |
| $800 to $999 | 80 (18.3%) | 30 (9.5%) |
| $1,000 to $1,499 | 95 (21.7%) | 24 (7.6%) |
| $1,500 to $1,999 | 62 (14.2%) | 0 (0.0%) |
| $2,000 to $2,499 | 18 (4.1%) | 0 (0.0%) |
| $2,500 to $2,999 | 15 (3.4%) | 0 (0.0%) |
| $3,000 or more | 11 (2.5%) | 0 (0.0%) |
| Total | 438 (100.0%) | 317 (100.0%) |
Physical Housing Characteristics in Lincolnton
Housing Structures in Lincolnton
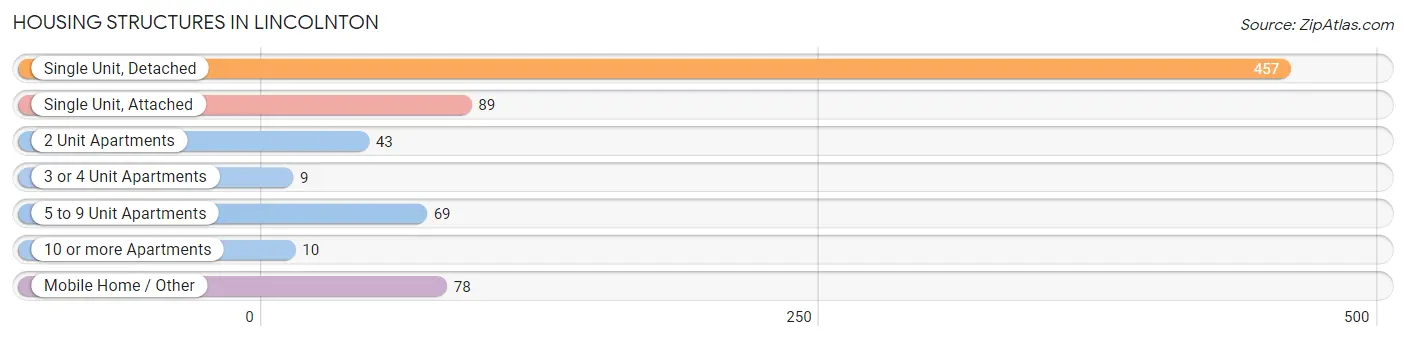
| Structure Type | # Housing Units | % Housing Units |
| Single Unit, Detached | 457 | 60.5% |
| Single Unit, Attached | 89 | 11.8% |
| 2 Unit Apartments | 43 | 5.7% |
| 3 or 4 Unit Apartments | 9 | 1.2% |
| 5 to 9 Unit Apartments | 69 | 9.1% |
| 10 or more Apartments | 10 | 1.3% |
| Mobile Home / Other | 78 | 10.3% |
| Total | 755 | 100.0% |
Housing Structures by Occupancy in Lincolnton
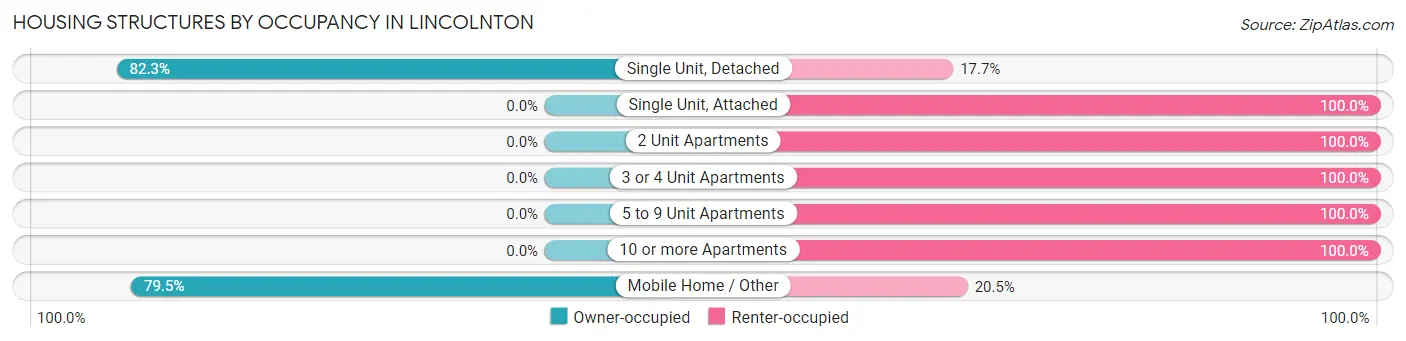
| Structure Type | Owner-occupied | Renter-occupied |
| Single Unit, Detached | 376 (82.3%) | 81 (17.7%) |
| Single Unit, Attached | 0 (0.0%) | 89 (100.0%) |
| 2 Unit Apartments | 0 (0.0%) | 43 (100.0%) |
| 3 or 4 Unit Apartments | 0 (0.0%) | 9 (100.0%) |
| 5 to 9 Unit Apartments | 0 (0.0%) | 69 (100.0%) |
| 10 or more Apartments | 0 (0.0%) | 10 (100.0%) |
| Mobile Home / Other | 62 (79.5%) | 16 (20.5%) |
| Total | 438 (58.0%) | 317 (42.0%) |
Housing Structures by Number of Rooms in Lincolnton
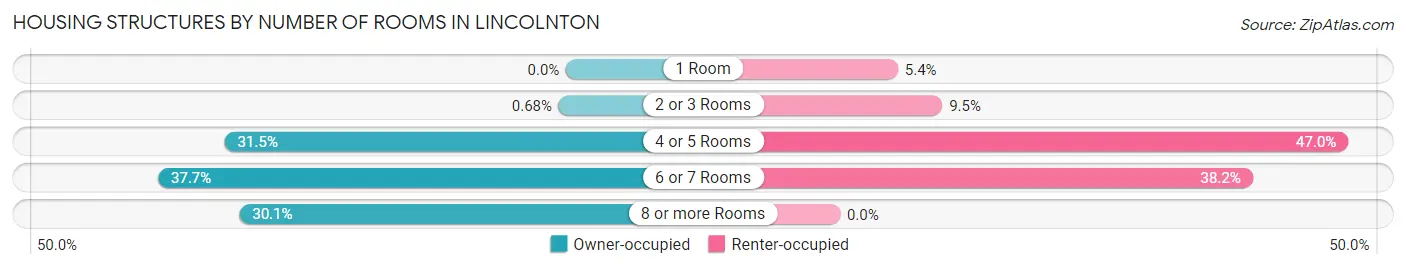
| Number of Rooms | Owner-occupied | Renter-occupied |
| 1 Room | 0 (0.0%) | 17 (5.4%) |
| 2 or 3 Rooms | 3 (0.7%) | 30 (9.5%) |
| 4 or 5 Rooms | 138 (31.5%) | 149 (47.0%) |
| 6 or 7 Rooms | 165 (37.7%) | 121 (38.2%) |
| 8 or more Rooms | 132 (30.1%) | 0 (0.0%) |
| Total | 438 (100.0%) | 317 (100.0%) |
Housing Structure by Heating Type in Lincolnton
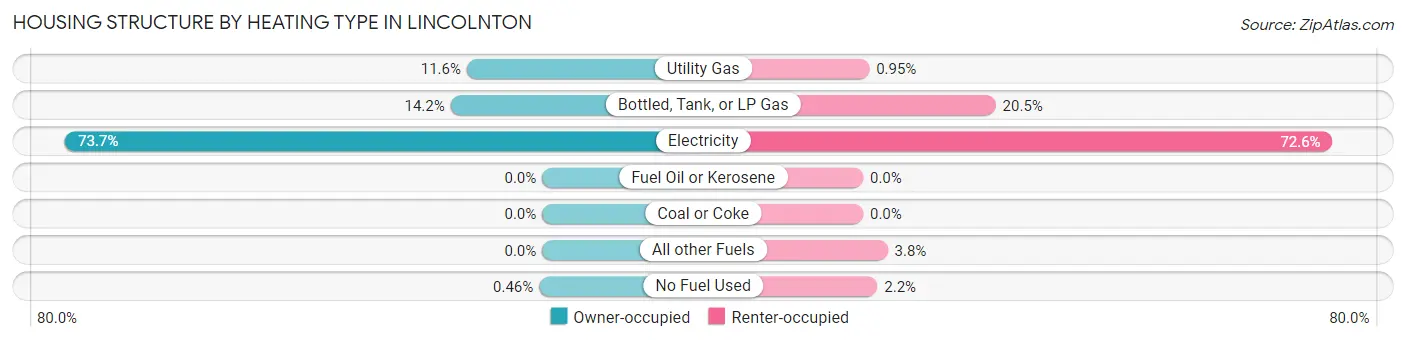
| Heating Type | Owner-occupied | Renter-occupied |
| Utility Gas | 51 (11.6%) | 3 (0.9%) |
| Bottled, Tank, or LP Gas | 62 (14.2%) | 65 (20.5%) |
| Electricity | 323 (73.7%) | 230 (72.6%) |
| Fuel Oil or Kerosene | 0 (0.0%) | 0 (0.0%) |
| Coal or Coke | 0 (0.0%) | 0 (0.0%) |
| All other Fuels | 0 (0.0%) | 12 (3.8%) |
| No Fuel Used | 2 (0.5%) | 7 (2.2%) |
| Total | 438 (100.0%) | 317 (100.0%) |
Household Vehicle Usage in Lincolnton
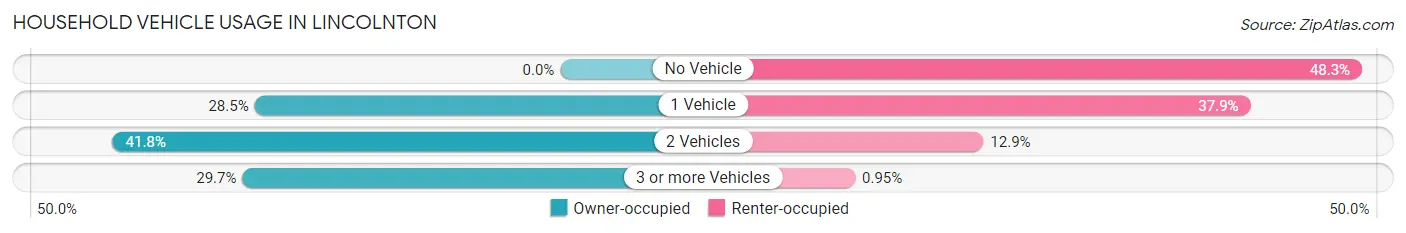
| Vehicles per Household | Owner-occupied | Renter-occupied |
| No Vehicle | 0 (0.0%) | 153 (48.3%) |
| 1 Vehicle | 125 (28.5%) | 120 (37.9%) |
| 2 Vehicles | 183 (41.8%) | 41 (12.9%) |
| 3 or more Vehicles | 130 (29.7%) | 3 (0.9%) |
| Total | 438 (100.0%) | 317 (100.0%) |
Real Estate & Mortgages in Lincolnton
Real Estate and Mortgage Overview in Lincolnton
| Characteristic | Without Mortgage | With Mortgage |
| Housing Units | 219 | 219 |
| Median Property Value | $187,500 | $183,100 |
| Median Household Income | $38,162 | $33 |
| Monthly Housing Costs | $643 | $11 |
| Real Estate Taxes | $1,298 | $4 |
Property Value by Mortgage Status in Lincolnton
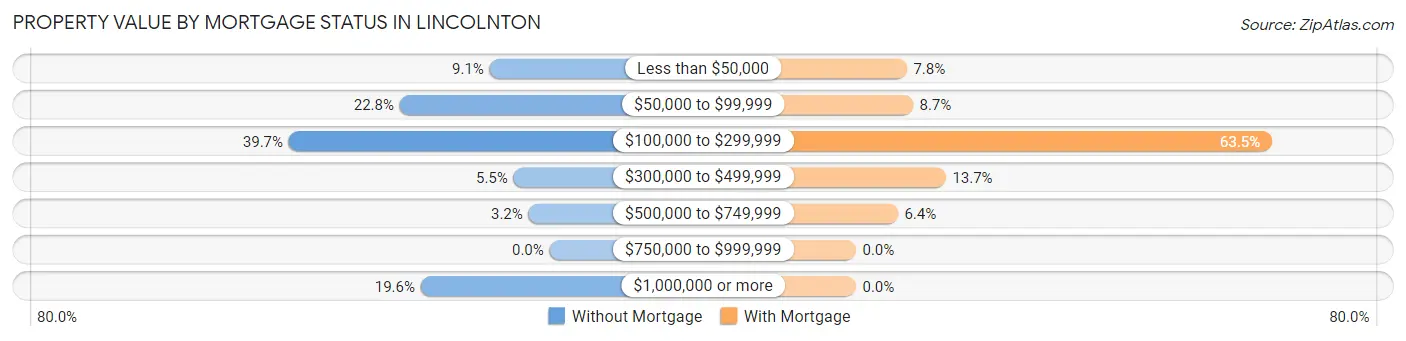
| Property Value | Without Mortgage | With Mortgage |
| Less than $50,000 | 20 (9.1%) | 17 (7.8%) |
| $50,000 to $99,999 | 50 (22.8%) | 19 (8.7%) |
| $100,000 to $299,999 | 87 (39.7%) | 139 (63.5%) |
| $300,000 to $499,999 | 12 (5.5%) | 30 (13.7%) |
| $500,000 to $749,999 | 7 (3.2%) | 14 (6.4%) |
| $750,000 to $999,999 | 0 (0.0%) | 0 (0.0%) |
| $1,000,000 or more | 43 (19.6%) | 0 (0.0%) |
| Total | 219 (100.0%) | 219 (100.0%) |
Household Income by Mortgage Status in Lincolnton
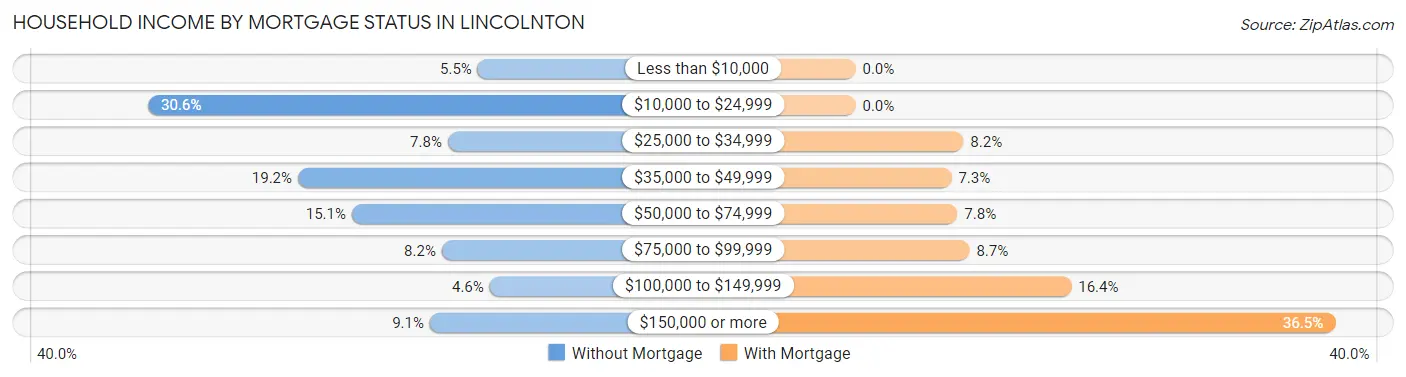
| Household Income | Without Mortgage | With Mortgage |
| Less than $10,000 | 12 (5.5%) | 0 (0.0%) |
| $10,000 to $24,999 | 67 (30.6%) | 0 (0.0%) |
| $25,000 to $34,999 | 17 (7.8%) | 18 (8.2%) |
| $35,000 to $49,999 | 42 (19.2%) | 16 (7.3%) |
| $50,000 to $74,999 | 33 (15.1%) | 17 (7.8%) |
| $75,000 to $99,999 | 18 (8.2%) | 19 (8.7%) |
| $100,000 to $149,999 | 10 (4.6%) | 36 (16.4%) |
| $150,000 or more | 20 (9.1%) | 80 (36.5%) |
| Total | 219 (100.0%) | 219 (100.0%) |
Property Value to Household Income Ratio in Lincolnton
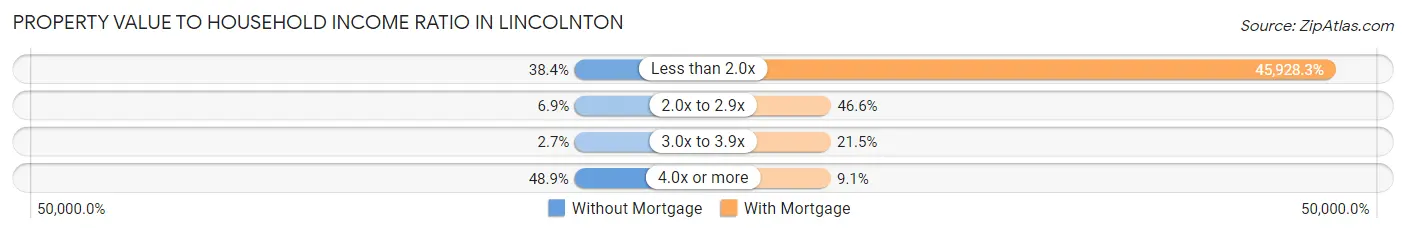
| Value-to-Income Ratio | Without Mortgage | With Mortgage |
| Less than 2.0x | 84 (38.4%) | 100,583 (45,928.3%) |
| 2.0x to 2.9x | 15 (6.9%) | 102 (46.6%) |
| 3.0x to 3.9x | 6 (2.7%) | 47 (21.5%) |
| 4.0x or more | 107 (48.9%) | 20 (9.1%) |
| Total | 219 (100.0%) | 219 (100.0%) |
Real Estate Taxes by Mortgage Status in Lincolnton
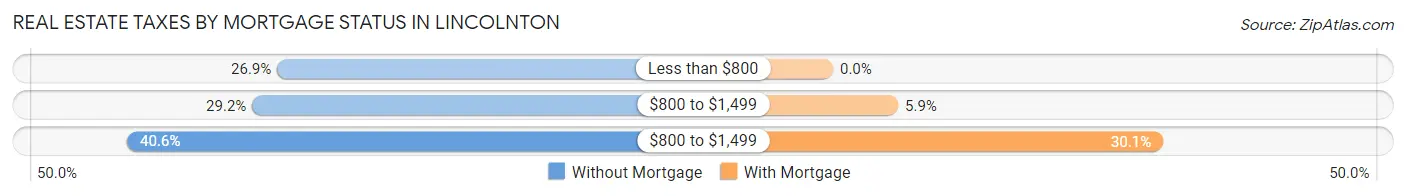
| Property Taxes | Without Mortgage | With Mortgage |
| Less than $800 | 59 (26.9%) | 0 (0.0%) |
| $800 to $1,499 | 64 (29.2%) | 13 (5.9%) |
| $800 to $1,499 | 89 (40.6%) | 66 (30.1%) |
| Total | 219 (100.0%) | 219 (100.0%) |
Health & Disability in Lincolnton
Health Insurance Coverage by Age in Lincolnton
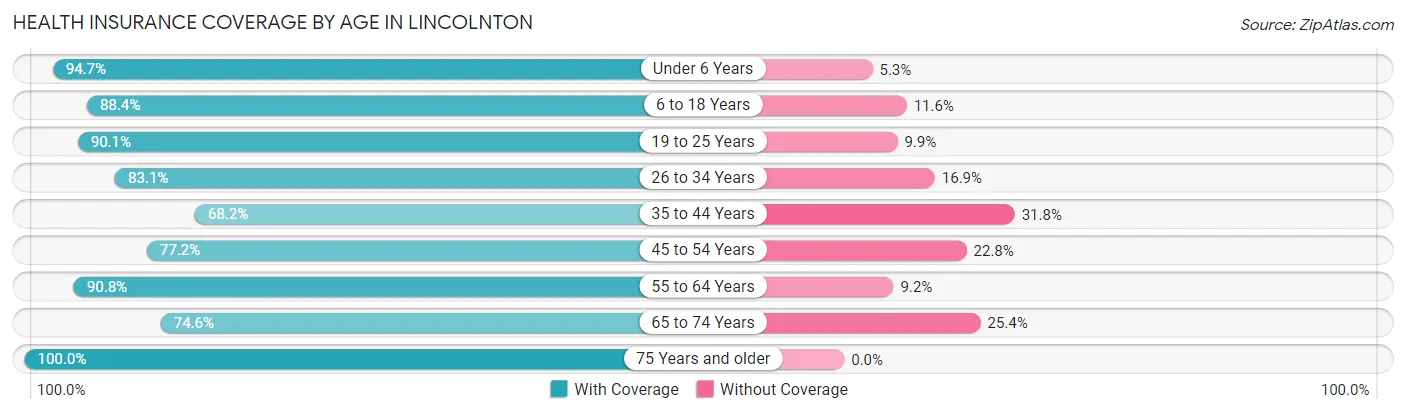
| Age Bracket | With Coverage | Without Coverage |
| Under 6 Years | 90 (94.7%) | 5 (5.3%) |
| 6 to 18 Years | 243 (88.4%) | 32 (11.6%) |
| 19 to 25 Years | 118 (90.1%) | 13 (9.9%) |
| 26 to 34 Years | 123 (83.1%) | 25 (16.9%) |
| 35 to 44 Years | 88 (68.2%) | 41 (31.8%) |
| 45 to 54 Years | 132 (77.2%) | 39 (22.8%) |
| 55 to 64 Years | 316 (90.8%) | 32 (9.2%) |
| 65 to 74 Years | 226 (74.6%) | 77 (25.4%) |
| 75 Years and older | 226 (100.0%) | 0 (0.0%) |
| Total | 1,562 (85.5%) | 264 (14.5%) |
Health Insurance Coverage by Citizenship Status in Lincolnton
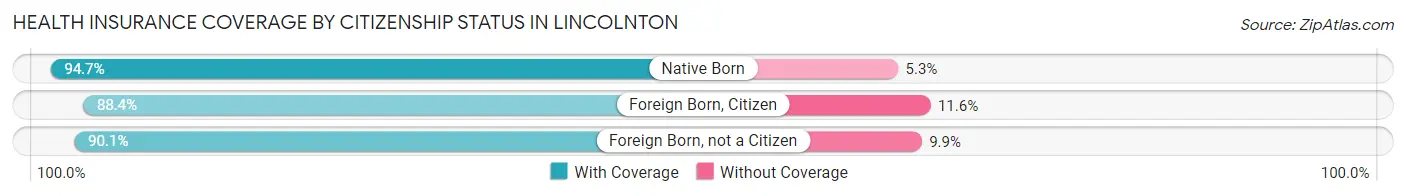
| Citizenship Status | With Coverage | Without Coverage |
| Native Born | 90 (94.7%) | 5 (5.3%) |
| Foreign Born, Citizen | 243 (88.4%) | 32 (11.6%) |
| Foreign Born, not a Citizen | 118 (90.1%) | 13 (9.9%) |
Health Insurance Coverage by Household Income in Lincolnton
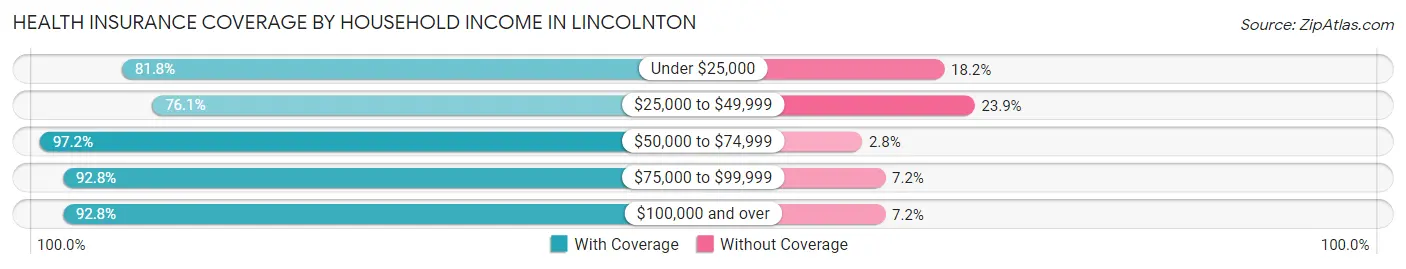
| Household Income | With Coverage | Without Coverage |
| Under $25,000 | 296 (81.8%) | 66 (18.2%) |
| $25,000 to $49,999 | 404 (76.1%) | 127 (23.9%) |
| $50,000 to $74,999 | 137 (97.2%) | 4 (2.8%) |
| $75,000 to $99,999 | 168 (92.8%) | 13 (7.2%) |
| $100,000 and over | 557 (92.8%) | 43 (7.2%) |
Public vs Private Health Insurance Coverage by Age in Lincolnton
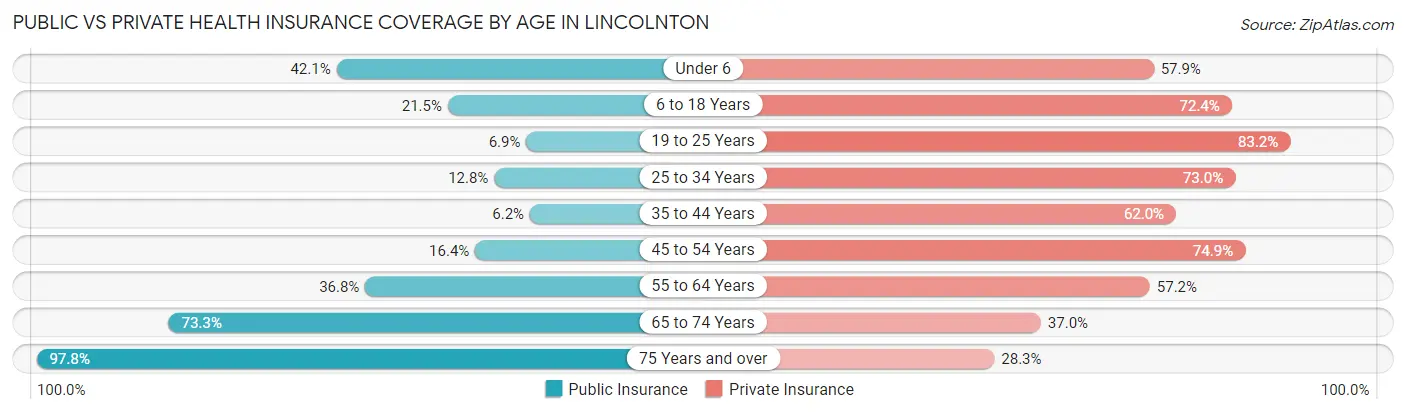
| Age Bracket | Public Insurance | Private Insurance |
| Under 6 | 40 (42.1%) | 55 (57.9%) |
| 6 to 18 Years | 59 (21.4%) | 199 (72.4%) |
| 19 to 25 Years | 9 (6.9%) | 109 (83.2%) |
| 25 to 34 Years | 19 (12.8%) | 108 (73.0%) |
| 35 to 44 Years | 8 (6.2%) | 80 (62.0%) |
| 45 to 54 Years | 28 (16.4%) | 128 (74.9%) |
| 55 to 64 Years | 128 (36.8%) | 199 (57.2%) |
| 65 to 74 Years | 222 (73.3%) | 112 (37.0%) |
| 75 Years and over | 221 (97.8%) | 64 (28.3%) |
| Total | 734 (40.2%) | 1,054 (57.7%) |
Disability Status by Sex by Age in Lincolnton
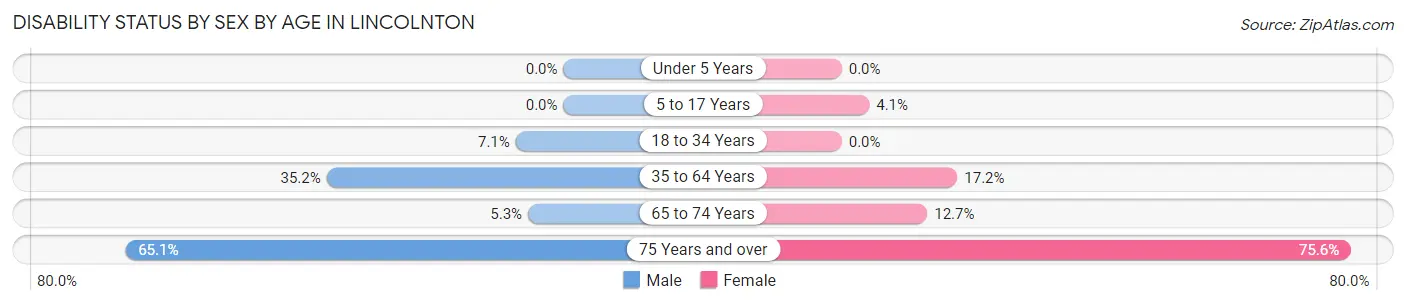
| Age Bracket | Male | Female |
| Under 5 Years | 0 (0.0%) | 0 (0.0%) |
| 5 to 17 Years | 0 (0.0%) | 4 (4.1%) |
| 18 to 34 Years | 9 (7.1%) | 0 (0.0%) |
| 35 to 64 Years | 109 (35.2%) | 58 (17.2%) |
| 65 to 74 Years | 6 (5.3%) | 24 (12.7%) |
| 75 Years and over | 67 (65.0%) | 93 (75.6%) |
Disability Class by Sex by Age in Lincolnton
Disability Class: Hearing Difficulty
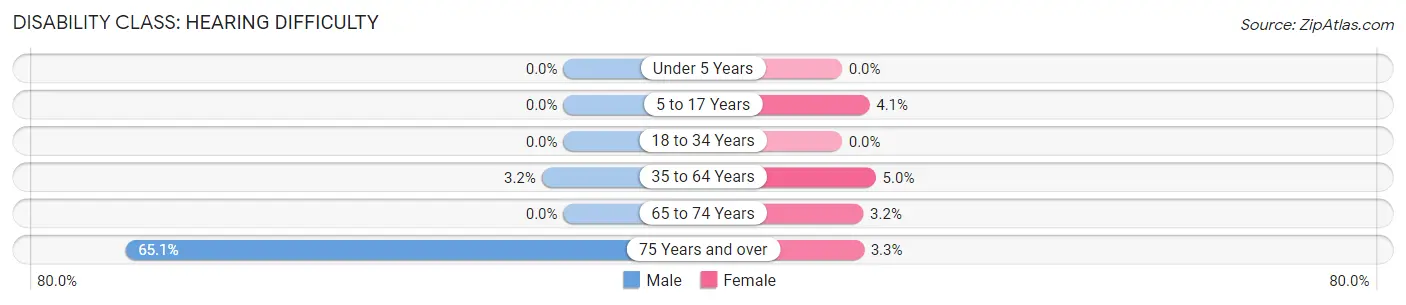
| Age Bracket | Male | Female |
| Under 5 Years | 0 (0.0%) | 0 (0.0%) |
| 5 to 17 Years | 0 (0.0%) | 4 (4.1%) |
| 18 to 34 Years | 0 (0.0%) | 0 (0.0%) |
| 35 to 64 Years | 10 (3.2%) | 17 (5.0%) |
| 65 to 74 Years | 0 (0.0%) | 6 (3.2%) |
| 75 Years and over | 67 (65.0%) | 4 (3.3%) |
Disability Class: Vision Difficulty
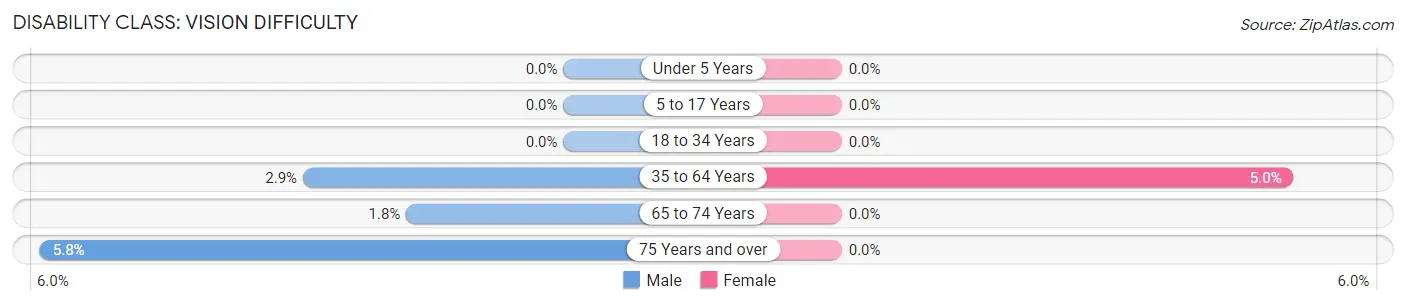
| Age Bracket | Male | Female |
| Under 5 Years | 0 (0.0%) | 0 (0.0%) |
| 5 to 17 Years | 0 (0.0%) | 0 (0.0%) |
| 18 to 34 Years | 0 (0.0%) | 0 (0.0%) |
| 35 to 64 Years | 9 (2.9%) | 17 (5.0%) |
| 65 to 74 Years | 2 (1.8%) | 0 (0.0%) |
| 75 Years and over | 6 (5.8%) | 0 (0.0%) |
Disability Class: Cognitive Difficulty
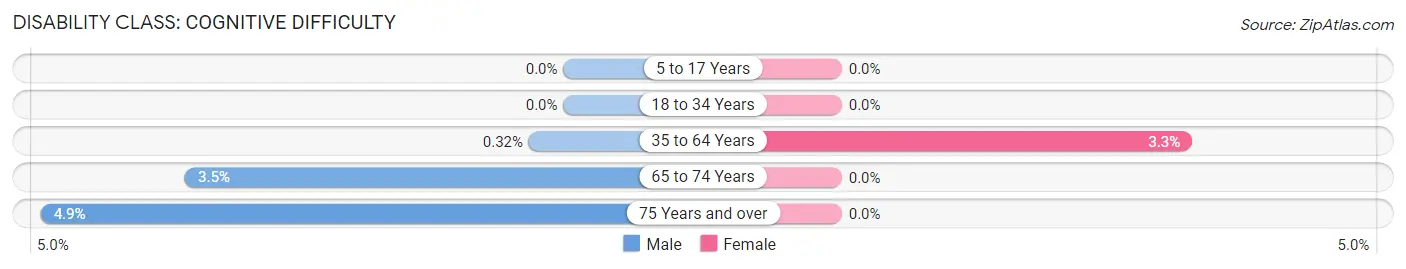
| Age Bracket | Male | Female |
| 5 to 17 Years | 0 (0.0%) | 0 (0.0%) |
| 18 to 34 Years | 0 (0.0%) | 0 (0.0%) |
| 35 to 64 Years | 1 (0.3%) | 11 (3.3%) |
| 65 to 74 Years | 4 (3.5%) | 0 (0.0%) |
| 75 Years and over | 5 (4.9%) | 0 (0.0%) |
Disability Class: Ambulatory Difficulty
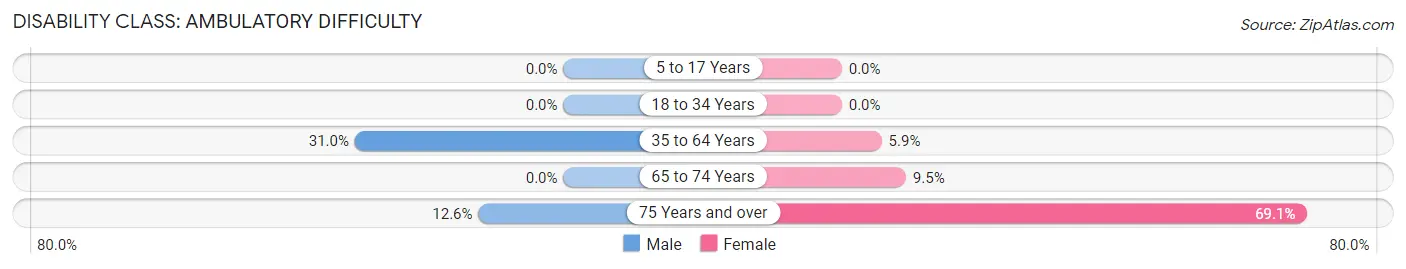
| Age Bracket | Male | Female |
| 5 to 17 Years | 0 (0.0%) | 0 (0.0%) |
| 18 to 34 Years | 0 (0.0%) | 0 (0.0%) |
| 35 to 64 Years | 96 (31.0%) | 20 (5.9%) |
| 65 to 74 Years | 0 (0.0%) | 18 (9.5%) |
| 75 Years and over | 13 (12.6%) | 85 (69.1%) |
Disability Class: Self-Care Difficulty
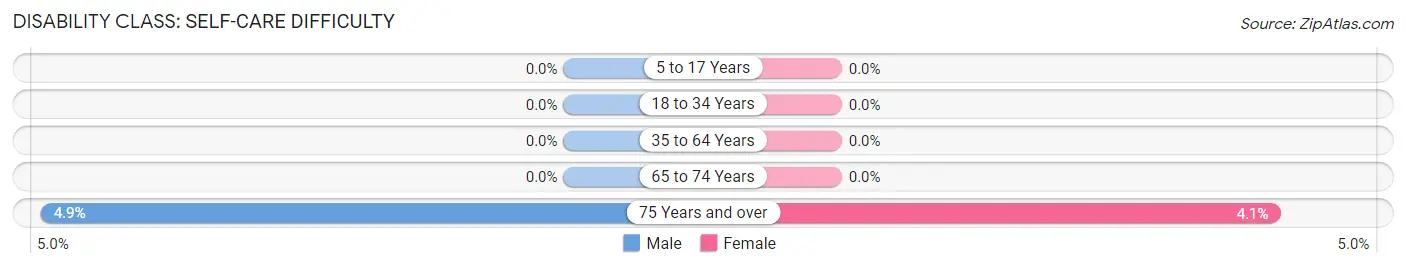
| Age Bracket | Male | Female |
| 5 to 17 Years | 0 (0.0%) | 0 (0.0%) |
| 18 to 34 Years | 0 (0.0%) | 0 (0.0%) |
| 35 to 64 Years | 0 (0.0%) | 0 (0.0%) |
| 65 to 74 Years | 0 (0.0%) | 0 (0.0%) |
| 75 Years and over | 5 (4.9%) | 5 (4.1%) |
Technology Access in Lincolnton
Computing Device Access in Lincolnton
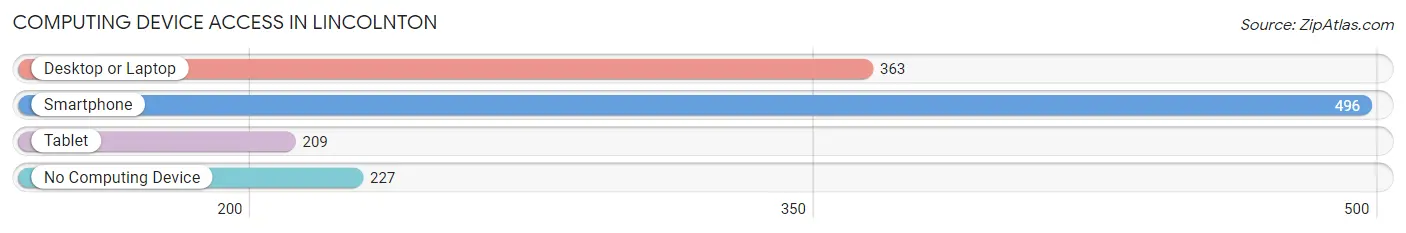
| Device Type | # Households | % Households |
| Desktop or Laptop | 363 | 48.1% |
| Smartphone | 496 | 65.7% |
| Tablet | 209 | 27.7% |
| No Computing Device | 227 | 30.1% |
| Total | 755 | 100.0% |
Internet Access in Lincolnton
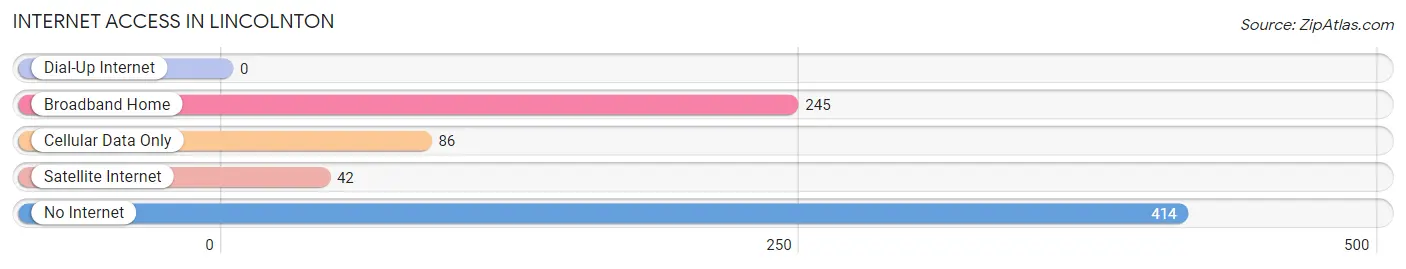
| Internet Type | # Households | % Households |
| Dial-Up Internet | 0 | 0.0% |
| Broadband Home | 245 | 32.5% |
| Cellular Data Only | 86 | 11.4% |
| Satellite Internet | 42 | 5.6% |
| No Internet | 414 | 54.8% |
| Total | 755 | 100.0% |
Lincolnton Summary
Lincolnton is a city located in Lincoln County, Georgia, United States. It is the county seat of Lincoln County and is located in the heart of the Georgia Piedmont. The city is situated on the banks of the Broad River, which flows through the city and is a major tributary of the Savannah River. The city is located approximately 40 miles east of Atlanta and is part of the Greater Atlanta Metropolitan Area.
History
The area that is now Lincolnton was first settled in the late 1700s by settlers from the British colonies of Virginia and North Carolina. The town was originally known as "Lincoln Town" and was named after General Benjamin Lincoln, a Revolutionary War hero. The town was incorporated in 1820 and was officially named Lincolnton in 1821.
The city was an important center of commerce and industry in the 19th century. It was home to several cotton mills, a grist mill, and a sawmill. The city was also home to a number of churches, including the First Baptist Church, which was founded in 1820.
In the late 19th century, the city was a major stop on the Central of Georgia Railway. The railway connected the city to Atlanta and other major cities in the region. The railway also helped to spur the growth of the city and the surrounding area.
Geography
Lincolnton is located in the Georgia Piedmont region of the state. The city is situated on the banks of the Broad River, which flows through the city and is a major tributary of the Savannah River. The city is located approximately 40 miles east of Atlanta and is part of the Greater Atlanta Metropolitan Area.
The city has a total area of 4.2 square miles, all of which is land. The city is located at an elevation of 845 feet above sea level.
Economy
Lincolnton is a small city with a population of just over 3,000 people. The city is home to a number of small businesses, including restaurants, retail stores, and professional services. The city is also home to a number of manufacturing companies, including a paper mill and a furniture factory.
The city is also home to a number of agricultural operations, including poultry farms, cattle farms, and vegetable farms. The city is also home to a number of wineries and vineyards.
Demographics
As of the 2010 census, the city had a population of 3,072 people. The racial makeup of the city was 79.2% White, 17.3% African American, 0.3% Native American, 0.4% Asian, 0.1% Pacific Islander, 1.2% from other races, and 1.5% from two or more races. Hispanic or Latino of any race were 3.2% of the population.
The median income for a household in the city was $31,250, and the median income for a family was $37,500. The per capita income for the city was $17,845. About 17.3% of families and 20.2% of the population were below the poverty line, including 28.3% of those under age 18 and 15.2% of those age 65 or over.
Common Questions
What is Per Capita Income in Lincolnton?
Per Capita income in Lincolnton is $24,556.
What is the Median Family Income in Lincolnton?
Median Family Income in Lincolnton is $54,306.
What is the Median Household income in Lincolnton?
Median Household Income in Lincolnton is $38,681.
What is Income or Wage Gap in Lincolnton?
Income or Wage Gap in Lincolnton is 43.3%.
Women in Lincolnton earn 56.7 cents for every dollar earned by a man.
What is Inequality or Gini Index in Lincolnton?
Inequality or Gini Index in Lincolnton is 0.49.
What is the Total Population of Lincolnton?
Total Population of Lincolnton is 1,876.
What is the Total Male Population of Lincolnton?
Total Male Population of Lincolnton is 923.
What is the Total Female Population of Lincolnton?
Total Female Population of Lincolnton is 953.
What is the Ratio of Males per 100 Females in Lincolnton?
There are 96.85 Males per 100 Females in Lincolnton.
What is the Ratio of Females per 100 Males in Lincolnton?
There are 103.25 Females per 100 Males in Lincolnton.
What is the Median Population Age in Lincolnton?
Median Population Age in Lincolnton is 49.6 Years.
What is the Average Family Size in Lincolnton
Average Family Size in Lincolnton is 3.3 People.
What is the Average Household Size in Lincolnton
Average Household Size in Lincolnton is 2.4 People.
How Large is the Labor Force in Lincolnton?
There are 686 People in the Labor Forcein in Lincolnton.
What is the Percentage of People in the Labor Force in Lincolnton?
44.6% of People are in the Labor Force in Lincolnton.
What is the Unemployment Rate in Lincolnton?
Unemployment Rate in Lincolnton is 1.5%.