Box Elder, SD Map & Demographics
Box Elder Map
Box Elder Overview
$30,710
PER CAPITA INCOME
$73,995
AVG FAMILY INCOME
$71,532
AVG HOUSEHOLD INCOME
36.9%
WAGE / INCOME GAP [ % ]
63.1¢/ $1
WAGE / INCOME GAP [ $ ]
0.36
INEQUALITY / GINI INDEX
11,905
TOTAL POPULATION
6,374
MALE POPULATION
5,531
FEMALE POPULATION
115.24
MALES / 100 FEMALES
86.77
FEMALES / 100 MALES
28.6
MEDIAN AGE
3.2
AVG FAMILY SIZE
2.8
AVG HOUSEHOLD SIZE
7,080
LABOR FORCE [ PEOPLE ]
77.5%
PERCENT IN LABOR FORCE
5.0%
UNEMPLOYMENT RATE
Box Elder Zip Codes
Box Elder Area Codes
Income in Box Elder
Income Overview in Box Elder
Per Capita Income in Box Elder is $30,710, while median incomes of families and households are $73,995 and $71,532 respectively.
| Characteristic | Number | Measure |
| Per Capita Income | 11,905 | $30,710 |
| Median Family Income | 2,903 | $73,995 |
| Mean Family Income | 2,903 | $88,333 |
| Median Household Income | 4,120 | $71,532 |
| Mean Household Income | 4,120 | $84,470 |
| Income Deficit | 2,903 | $0 |
| Wage / Income Gap (%) | 11,905 | 36.91% |
| Wage / Income Gap ($) | 11,905 | 63.09¢ per $1 |
| Gini / Inequality Index | 11,905 | 0.36 |
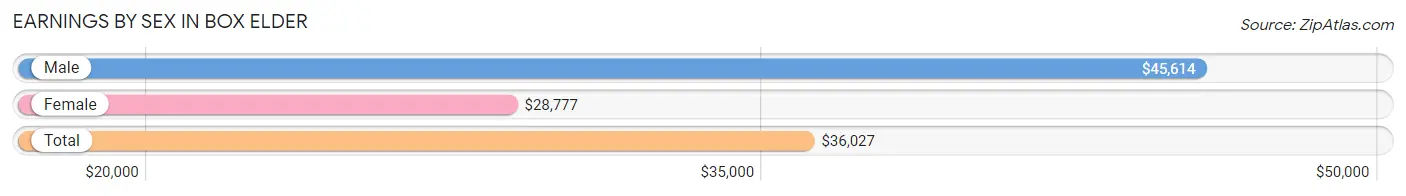
Earnings by Sex in Box Elder
Average Earnings in Box Elder are $36,027, $45,614 for men and $28,777 for women, a difference of 36.9%.
| Sex | Number | Average Earnings |
| Male | 4,283 (59.0%) | $45,614 |
| Female | 2,982 (41.0%) | $28,777 |
| Total | 7,265 (100.0%) | $36,027 |
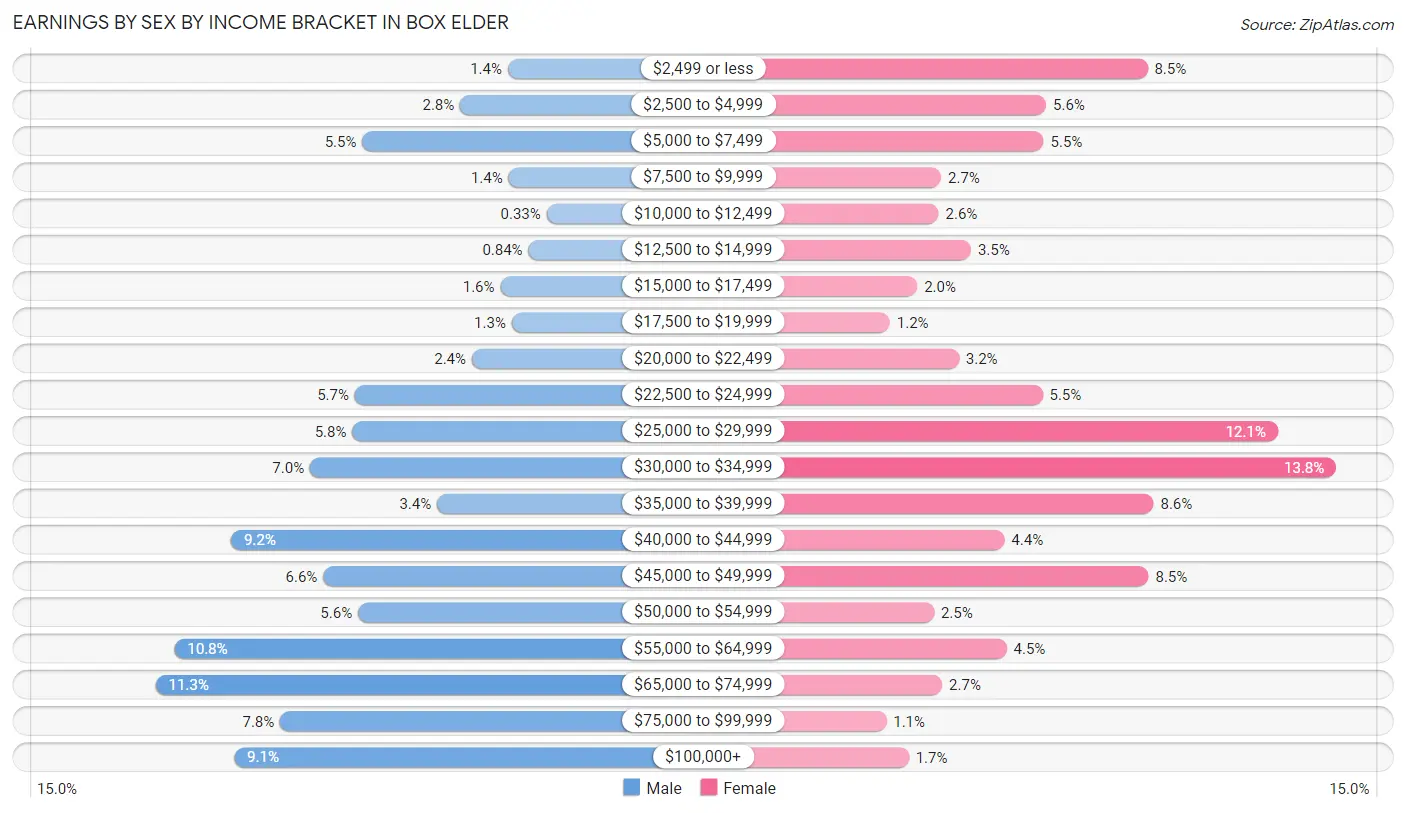
Earnings by Sex by Income Bracket in Box Elder
The most common earnings brackets in Box Elder are $65,000 to $74,999 for men (485 | 11.3%) and $30,000 to $34,999 for women (410 | 13.8%).
| Income | Male | Female |
| $2,499 or less | 61 (1.4%) | 252 (8.5%) |
| $2,500 to $4,999 | 118 (2.8%) | 167 (5.6%) |
| $5,000 to $7,499 | 236 (5.5%) | 165 (5.5%) |
| $7,500 to $9,999 | 60 (1.4%) | 79 (2.6%) |
| $10,000 to $12,499 | 14 (0.3%) | 77 (2.6%) |
| $12,500 to $14,999 | 36 (0.8%) | 104 (3.5%) |
| $15,000 to $17,499 | 70 (1.6%) | 59 (2.0%) |
| $17,500 to $19,999 | 56 (1.3%) | 36 (1.2%) |
| $20,000 to $22,499 | 104 (2.4%) | 94 (3.2%) |
| $22,500 to $24,999 | 245 (5.7%) | 164 (5.5%) |
| $25,000 to $29,999 | 248 (5.8%) | 361 (12.1%) |
| $30,000 to $34,999 | 299 (7.0%) | 410 (13.8%) |
| $35,000 to $39,999 | 146 (3.4%) | 257 (8.6%) |
| $40,000 to $44,999 | 394 (9.2%) | 132 (4.4%) |
| $45,000 to $49,999 | 283 (6.6%) | 253 (8.5%) |
| $50,000 to $54,999 | 241 (5.6%) | 73 (2.5%) |
| $55,000 to $64,999 | 462 (10.8%) | 134 (4.5%) |
| $65,000 to $74,999 | 485 (11.3%) | 80 (2.7%) |
| $75,000 to $99,999 | 335 (7.8%) | 33 (1.1%) |
| $100,000+ | 390 (9.1%) | 52 (1.7%) |
| Total | 4,283 (100.0%) | 2,982 (100.0%) |
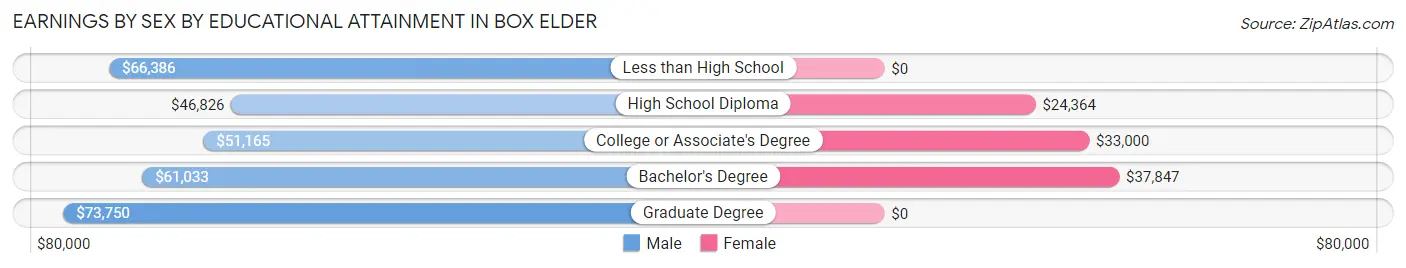
Earnings by Sex by Educational Attainment in Box Elder
Average earnings in Box Elder are $57,674 for men and $32,989 for women, a difference of 42.8%. Men with an educational attainment of graduate degree enjoy the highest average annual earnings of $73,750, while those with high school diploma education earn the least with $46,826. Women with an educational attainment of bachelor's degree earn the most with the average annual earnings of $37,847, while those with high school diploma education have the smallest earnings of $24,364.
| Educational Attainment | Male Income | Female Income |
| Less than High School | $66,386 | $0 |
| High School Diploma | $46,826 | $24,364 |
| College or Associate's Degree | $51,165 | $33,000 |
| Bachelor's Degree | $61,033 | $37,847 |
| Graduate Degree | $73,750 | $0 |
| Total | $57,674 | $32,989 |
Family Income in Box Elder
Family Income Brackets in Box Elder
According to the Box Elder family income data, there are 816 families falling into the $50,000 to $74,999 income range, which is the most common income bracket and makes up 28.1% of all families.
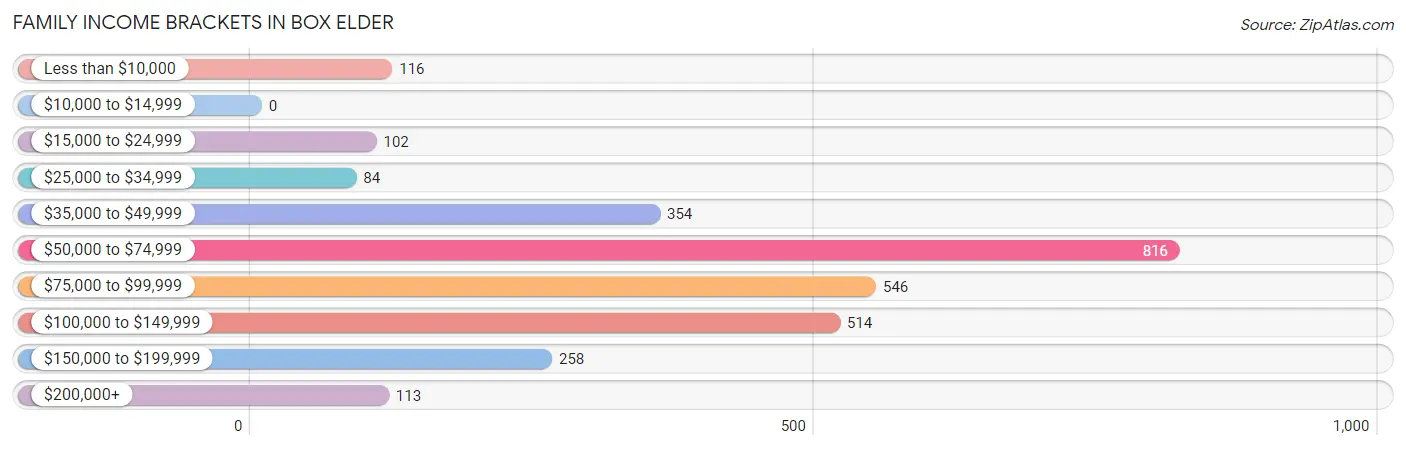
| Income Bracket | # Families | % Families |
| Less than $10,000 | 116 | 4.0% |
| $10,000 to $14,999 | 0 | 0.0% |
| $15,000 to $24,999 | 102 | 3.5% |
| $25,000 to $34,999 | 84 | 2.9% |
| $35,000 to $49,999 | 354 | 12.2% |
| $50,000 to $74,999 | 816 | 28.1% |
| $75,000 to $99,999 | 546 | 18.8% |
| $100,000 to $149,999 | 514 | 17.7% |
| $150,000 to $199,999 | 258 | 8.9% |
| $200,000+ | 113 | 3.9% |
Family Income by Famaliy Size in Box Elder
6-person families (64 | 2.2%) account for the highest median family income in Box Elder with $132,813 per family, while 2-person families (1,241 | 42.7%) have the highest median income of $31,875 per family member.
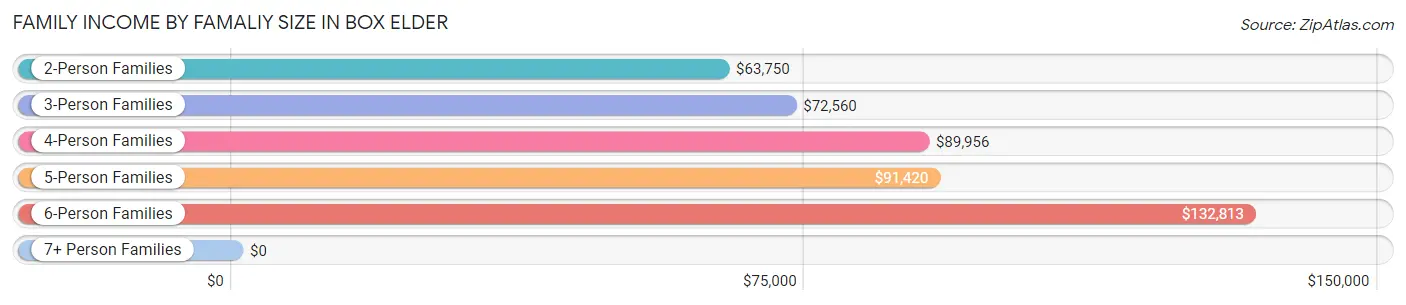
| Income Bracket | # Families | Median Income |
| 2-Person Families | 1,241 (42.7%) | $63,750 |
| 3-Person Families | 668 (23.0%) | $72,560 |
| 4-Person Families | 648 (22.3%) | $89,956 |
| 5-Person Families | 241 (8.3%) | $91,420 |
| 6-Person Families | 64 (2.2%) | $132,813 |
| 7+ Person Families | 41 (1.4%) | $0 |
| Total | 2,903 (100.0%) | $73,995 |
Family Income by Number of Earners in Box Elder
The median family income in Box Elder is $73,995, with families comprising 3+ earners (307) having the highest median family income of $168,750, while families with no earners (283) have the lowest median family income of $49,028, accounting for 10.6% and 9.8% of families, respectively.
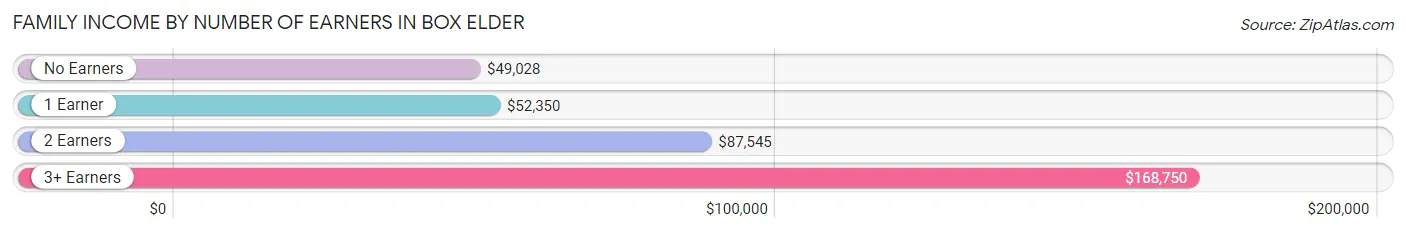
| Number of Earners | # Families | Median Income |
| No Earners | 283 (9.8%) | $49,028 |
| 1 Earner | 763 (26.3%) | $52,350 |
| 2 Earners | 1,550 (53.4%) | $87,545 |
| 3+ Earners | 307 (10.6%) | $168,750 |
| Total | 2,903 (100.0%) | $73,995 |
Household Income in Box Elder
Household Income Brackets in Box Elder
With 886 households falling in the category, the $50,000 to $74,999 income range is the most frequent in Box Elder, accounting for 21.5% of all households. In contrast, only 41 households (1.0%) fall into the $10,000 to $14,999 income bracket, making it the least populous group.
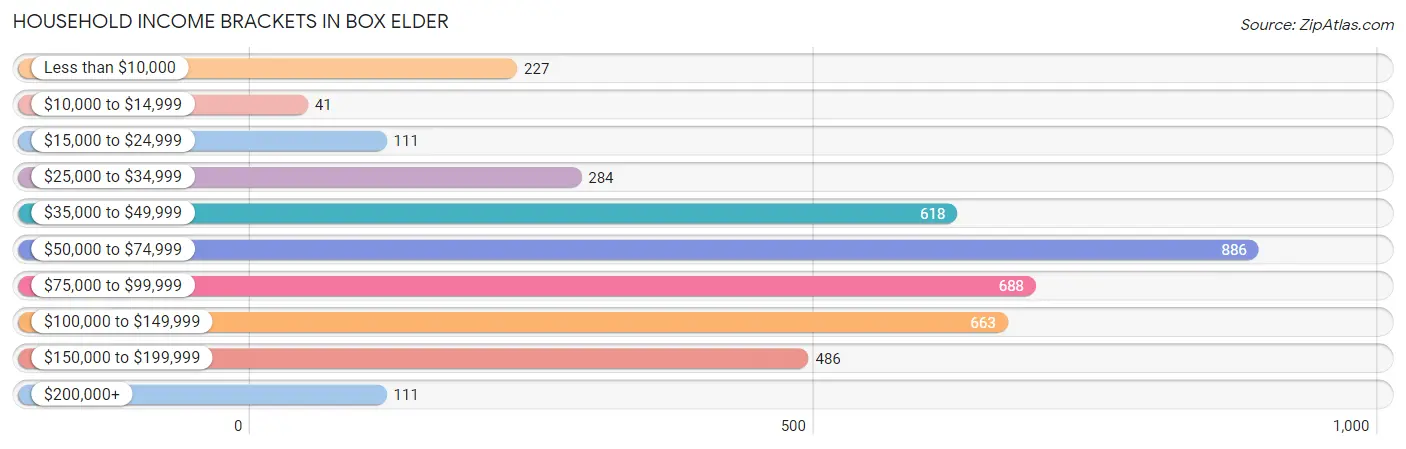
| Income Bracket | # Households | % Households |
| Less than $10,000 | 227 | 5.5% |
| $10,000 to $14,999 | 41 | 1.0% |
| $15,000 to $24,999 | 111 | 2.7% |
| $25,000 to $34,999 | 284 | 6.9% |
| $35,000 to $49,999 | 618 | 15.0% |
| $50,000 to $74,999 | 886 | 21.5% |
| $75,000 to $99,999 | 688 | 16.7% |
| $100,000 to $149,999 | 663 | 16.1% |
| $150,000 to $199,999 | 486 | 11.8% |
| $200,000+ | 111 | 2.7% |
Household Income by Householder Age in Box Elder
The median household income in Box Elder is $71,532, with the highest median household income of $102,625 found in the 45 to 64 years age bracket for the primary householder. A total of 1,204 households (29.2%) fall into this category. Meanwhile, the 15 to 24 years age bracket for the primary householder has the lowest median household income of $45,768, with 489 households (11.9%) in this group.
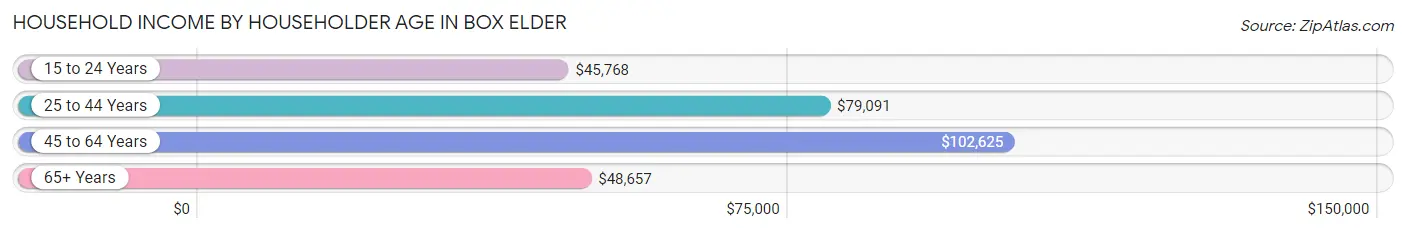
| Income Bracket | # Households | Median Income |
| 15 to 24 Years | 489 (11.9%) | $45,768 |
| 25 to 44 Years | 1,950 (47.3%) | $79,091 |
| 45 to 64 Years | 1,204 (29.2%) | $102,625 |
| 65+ Years | 477 (11.6%) | $48,657 |
| Total | 4,120 (100.0%) | $71,532 |
Poverty in Box Elder
Income Below Poverty by Sex and Age in Box Elder
With 5.3% poverty level for males and 6.8% for females among the residents of Box Elder, 75 year old and over males and 75 year old and over females are the most vulnerable to poverty, with 41 males (31.5%) and 48 females (23.5%) in their respective age groups living below the poverty level.
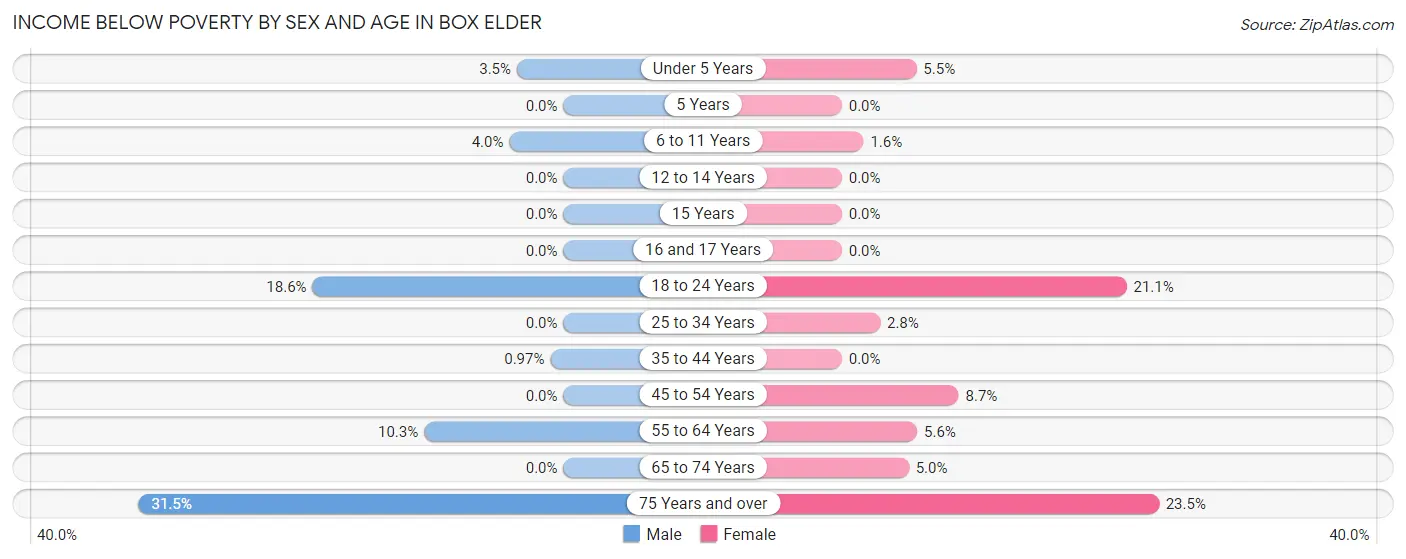
| Age Bracket | Male | Female |
| Under 5 Years | 19 (3.5%) | 23 (5.5%) |
| 5 Years | 0 (0.0%) | 0 (0.0%) |
| 6 to 11 Years | 16 (4.0%) | 8 (1.6%) |
| 12 to 14 Years | 0 (0.0%) | 0 (0.0%) |
| 15 Years | 0 (0.0%) | 0 (0.0%) |
| 16 and 17 Years | 0 (0.0%) | 0 (0.0%) |
| 18 to 24 Years | 161 (18.6%) | 185 (21.1%) |
| 25 to 34 Years | 0 (0.0%) | 37 (2.8%) |
| 35 to 44 Years | 8 (1.0%) | 0 (0.0%) |
| 45 to 54 Years | 0 (0.0%) | 37 (8.7%) |
| 55 to 64 Years | 78 (10.3%) | 20 (5.6%) |
| 65 to 74 Years | 0 (0.0%) | 16 (5.0%) |
| 75 Years and over | 41 (31.5%) | 48 (23.5%) |
| Total | 323 (5.3%) | 374 (6.8%) |
Income Above Poverty by Sex and Age in Box Elder
According to the poverty statistics in Box Elder, males aged 5 years and females aged 5 years are the age groups that are most secure financially, with 100.0% of males and 100.0% of females in these age groups living above the poverty line.
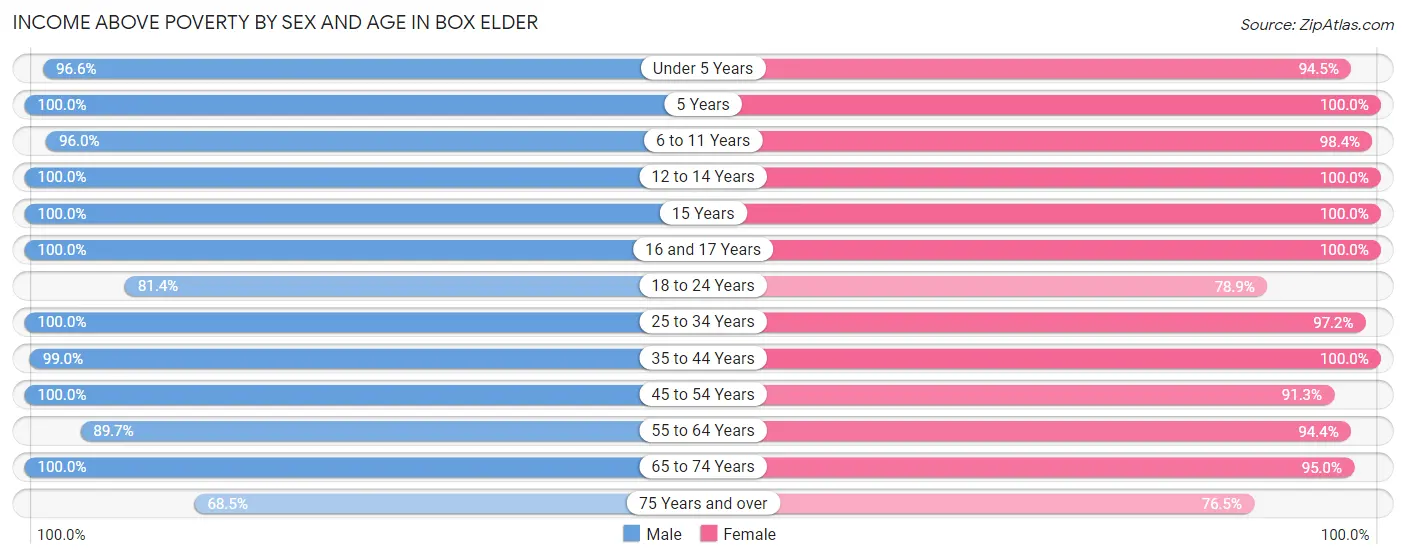
| Age Bracket | Male | Female |
| Under 5 Years | 532 (96.6%) | 392 (94.5%) |
| 5 Years | 68 (100.0%) | 139 (100.0%) |
| 6 to 11 Years | 383 (96.0%) | 488 (98.4%) |
| 12 to 14 Years | 234 (100.0%) | 425 (100.0%) |
| 15 Years | 16 (100.0%) | 26 (100.0%) |
| 16 and 17 Years | 95 (100.0%) | 96 (100.0%) |
| 18 to 24 Years | 703 (81.4%) | 690 (78.9%) |
| 25 to 34 Years | 1,324 (100.0%) | 1,268 (97.2%) |
| 35 to 44 Years | 816 (99.0%) | 430 (100.0%) |
| 45 to 54 Years | 682 (100.0%) | 390 (91.3%) |
| 55 to 64 Years | 676 (89.7%) | 338 (94.4%) |
| 65 to 74 Years | 145 (100.0%) | 306 (95.0%) |
| 75 Years and over | 89 (68.5%) | 156 (76.5%) |
| Total | 5,763 (94.7%) | 5,144 (93.2%) |
Income Below Poverty Among Married-Couple Families in Box Elder
The poverty statistics for married-couple families in Box Elder show that 2.3% or 52 of the total 2,231 families live below the poverty line. Families with no children have the highest poverty rate of 4.9%, comprising of 52 families. On the other hand, families with 1 or 2 children have the lowest poverty rate of 0.0%, which includes 0 families.
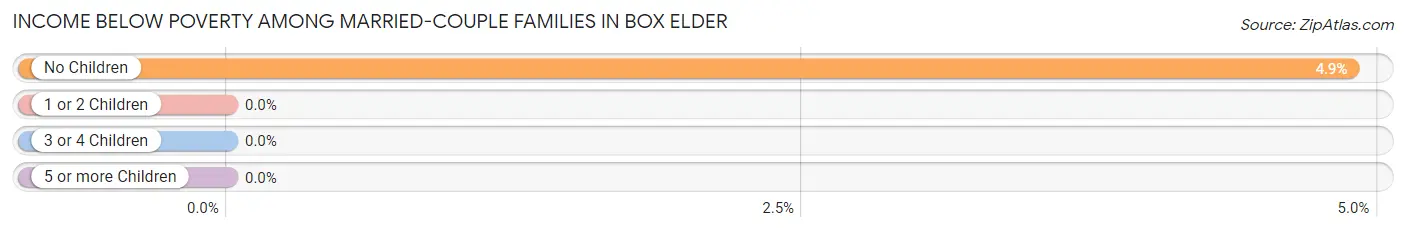
| Children | Above Poverty | Below Poverty |
| No Children | 1,013 (95.1%) | 52 (4.9%) |
| 1 or 2 Children | 936 (100.0%) | 0 (0.0%) |
| 3 or 4 Children | 189 (100.0%) | 0 (0.0%) |
| 5 or more Children | 41 (100.0%) | 0 (0.0%) |
| Total | 2,179 (97.7%) | 52 (2.3%) |
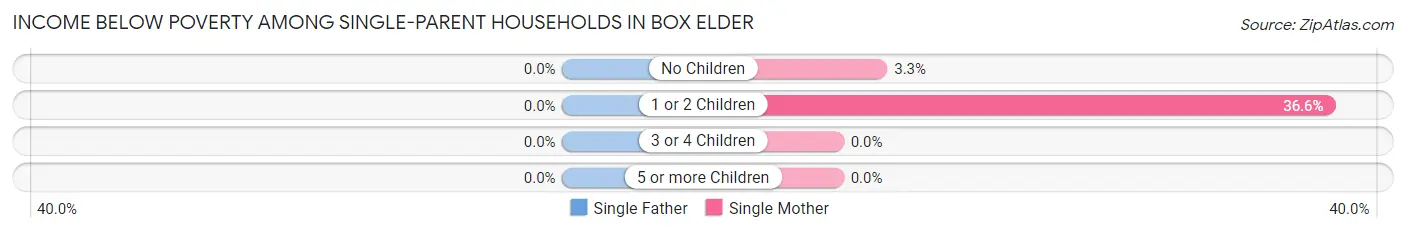
Income Below Poverty Among Single-Parent Households in Box Elder
| Children | Single Father | Single Mother |
| No Children | 0 (0.0%) | 5 (3.3%) |
| 1 or 2 Children | 0 (0.0%) | 74 (36.6%) |
| 3 or 4 Children | 0 (0.0%) | 0 (0.0%) |
| 5 or more Children | 0 (0.0%) | 0 (0.0%) |
| Total | 0 (0.0%) | 79 (22.2%) |
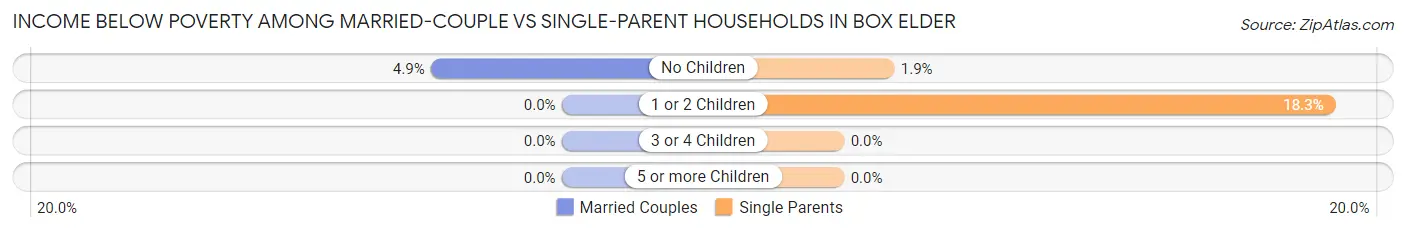
Income Below Poverty Among Married-Couple vs Single-Parent Households in Box Elder
The poverty data for Box Elder shows that 52 of the married-couple family households (2.3%) and 79 of the single-parent households (11.8%) are living below the poverty level. Within the married-couple family households, those with no children have the highest poverty rate, with 52 households (4.9%) falling below the poverty line. Among the single-parent households, those with 1 or 2 children have the highest poverty rate, with 74 household (18.3%) living below poverty.
| Children | Married-Couple Families | Single-Parent Households |
| No Children | 52 (4.9%) | 5 (1.9%) |
| 1 or 2 Children | 0 (0.0%) | 74 (18.3%) |
| 3 or 4 Children | 0 (0.0%) | 0 (0.0%) |
| 5 or more Children | 0 (0.0%) | 0 (0.0%) |
| Total | 52 (2.3%) | 79 (11.8%) |
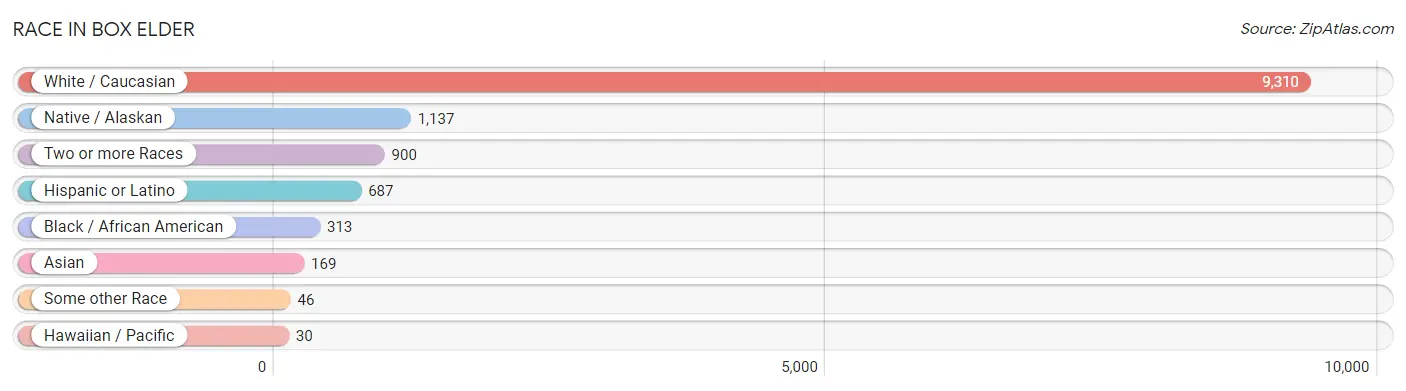
Race in Box Elder
The most populous races in Box Elder are White / Caucasian (9,310 | 78.2%), Native / Alaskan (1,137 | 9.6%), and Two or more Races (900 | 7.6%).
| Race | # Population | % Population |
| Asian | 169 | 1.4% |
| Black / African American | 313 | 2.6% |
| Hawaiian / Pacific | 30 | 0.3% |
| Hispanic or Latino | 687 | 5.8% |
| Native / Alaskan | 1,137 | 9.6% |
| White / Caucasian | 9,310 | 78.2% |
| Two or more Races | 900 | 7.6% |
| Some other Race | 46 | 0.4% |
| Total | 11,905 | 100.0% |
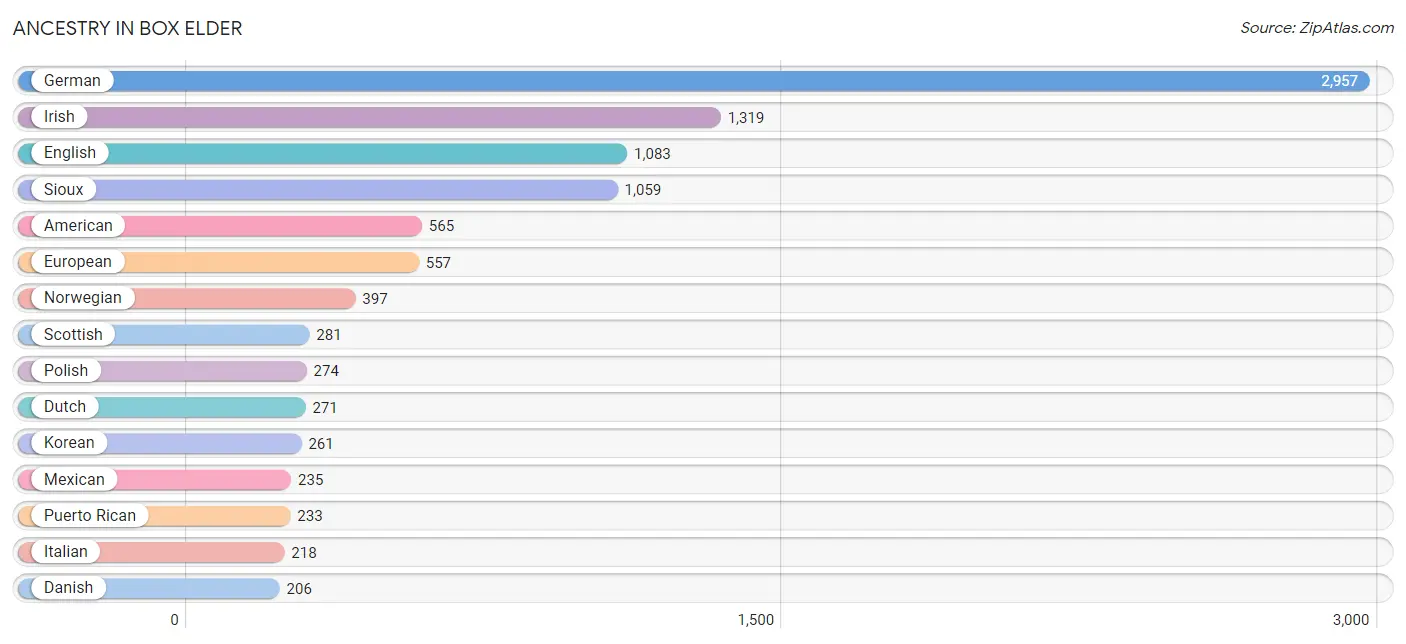
Ancestry in Box Elder
The most populous ancestries reported in Box Elder are German (2,957 | 24.8%), Irish (1,319 | 11.1%), English (1,083 | 9.1%), Sioux (1,059 | 8.9%), and American (565 | 4.8%), together accounting for 58.7% of all Box Elder residents.
| Ancestry | # Population | % Population |
| African | 41 | 0.3% |
| American | 565 | 4.8% |
| Bhutanese | 128 | 1.1% |
| British | 11 | 0.1% |
| British West Indian | 15 | 0.1% |
| Burmese | 36 | 0.3% |
| Canadian | 10 | 0.1% |
| Central American | 61 | 0.5% |
| Chippewa | 44 | 0.4% |
| Choctaw | 11 | 0.1% |
| Creek | 11 | 0.1% |
| Cuban | 9 | 0.1% |
| Czech | 146 | 1.2% |
| Danish | 206 | 1.7% |
| Dominican | 20 | 0.2% |
| Dutch | 271 | 2.3% |
| Ecuadorian | 10 | 0.1% |
| English | 1,083 | 9.1% |
| European | 557 | 4.7% |
| French | 169 | 1.4% |
| French Canadian | 157 | 1.3% |
| German | 2,957 | 24.8% |
| Guamanian / Chamorro | 26 | 0.2% |
| Hungarian | 83 | 0.7% |
| Indian (Asian) | 62 | 0.5% |
| Irish | 1,319 | 11.1% |
| Italian | 218 | 1.8% |
| Jamaican | 6 | 0.1% |
| Korean | 261 | 2.2% |
| Mexican | 235 | 2.0% |
| Native Hawaiian | 17 | 0.1% |
| Navajo | 65 | 0.5% |
| Norwegian | 397 | 3.3% |
| Polish | 274 | 2.3% |
| Puerto Rican | 233 | 2.0% |
| Russian | 52 | 0.4% |
| Salvadoran | 61 | 0.5% |
| Samoan | 7 | 0.1% |
| Scandinavian | 31 | 0.3% |
| Scotch-Irish | 38 | 0.3% |
| Scottish | 281 | 2.4% |
| Seminole | 12 | 0.1% |
| Sioux | 1,059 | 8.9% |
| Slovene | 7 | 0.1% |
| South American | 10 | 0.1% |
| Spaniard | 27 | 0.2% |
| Spanish | 48 | 0.4% |
| Sri Lankan | 26 | 0.2% |
| Subsaharan African | 41 | 0.3% |
| Swedish | 98 | 0.8% |
| Turkish | 13 | 0.1% |
| Ukrainian | 25 | 0.2% |
| Welsh | 3 | 0.0% |
| Yuman | 13 | 0.1% | View All 54 Rows |
Immigrants in Box Elder
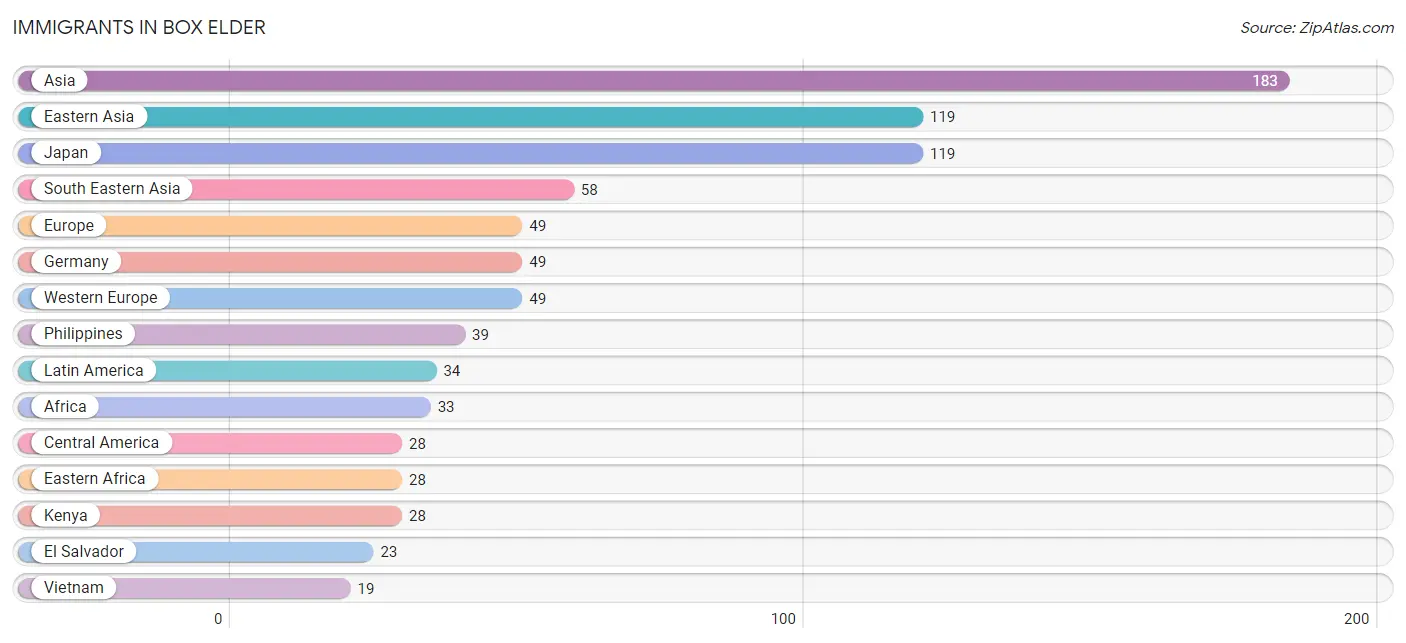
The most numerous immigrant groups reported in Box Elder came from Asia (183 | 1.5%), Eastern Asia (119 | 1.0%), Japan (119 | 1.0%), South Eastern Asia (58 | 0.5%), and Europe (49 | 0.4%), together accounting for 4.4% of all Box Elder residents.
| Immigration Origin | # Population | % Population |
| Africa | 33 | 0.3% |
| Asia | 183 | 1.5% |
| Caribbean | 6 | 0.1% |
| Central America | 28 | 0.2% |
| Eastern Africa | 28 | 0.2% |
| Eastern Asia | 119 | 1.0% |
| El Salvador | 23 | 0.2% |
| Europe | 49 | 0.4% |
| Germany | 49 | 0.4% |
| Jamaica | 6 | 0.1% |
| Japan | 119 | 1.0% |
| Kenya | 28 | 0.2% |
| Latin America | 34 | 0.3% |
| Mexico | 5 | 0.0% |
| Nigeria | 5 | 0.0% |
| Philippines | 39 | 0.3% |
| South Eastern Asia | 58 | 0.5% |
| Turkey | 6 | 0.1% |
| Vietnam | 19 | 0.2% |
| Western Africa | 5 | 0.0% |
| Western Asia | 6 | 0.1% |
| Western Europe | 49 | 0.4% | View All 22 Rows |
Sex and Age in Box Elder
Sex and Age in Box Elder
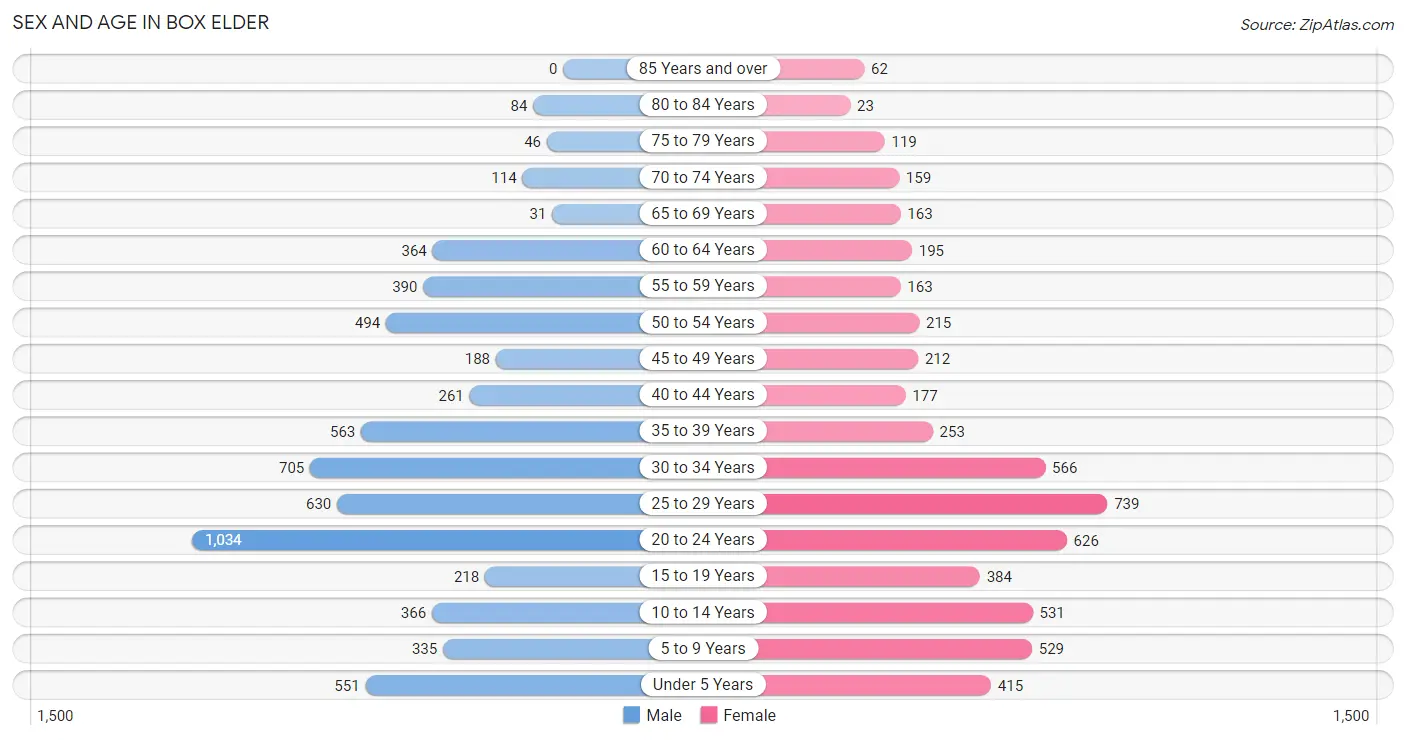
The most populous age groups in Box Elder are 20 to 24 Years (1,034 | 16.2%) for men and 25 to 29 Years (739 | 13.4%) for women.
| Age Bracket | Male | Female |
| Under 5 Years | 551 (8.6%) | 415 (7.5%) |
| 5 to 9 Years | 335 (5.3%) | 529 (9.6%) |
| 10 to 14 Years | 366 (5.7%) | 531 (9.6%) |
| 15 to 19 Years | 218 (3.4%) | 384 (6.9%) |
| 20 to 24 Years | 1,034 (16.2%) | 626 (11.3%) |
| 25 to 29 Years | 630 (9.9%) | 739 (13.4%) |
| 30 to 34 Years | 705 (11.1%) | 566 (10.2%) |
| 35 to 39 Years | 563 (8.8%) | 253 (4.6%) |
| 40 to 44 Years | 261 (4.1%) | 177 (3.2%) |
| 45 to 49 Years | 188 (2.9%) | 212 (3.8%) |
| 50 to 54 Years | 494 (7.7%) | 215 (3.9%) |
| 55 to 59 Years | 390 (6.1%) | 163 (2.9%) |
| 60 to 64 Years | 364 (5.7%) | 195 (3.5%) |
| 65 to 69 Years | 31 (0.5%) | 163 (2.9%) |
| 70 to 74 Years | 114 (1.8%) | 159 (2.9%) |
| 75 to 79 Years | 46 (0.7%) | 119 (2.1%) |
| 80 to 84 Years | 84 (1.3%) | 23 (0.4%) |
| 85 Years and over | 0 (0.0%) | 62 (1.1%) |
| Total | 6,374 (100.0%) | 5,531 (100.0%) |
Families and Households in Box Elder
Median Family Size in Box Elder
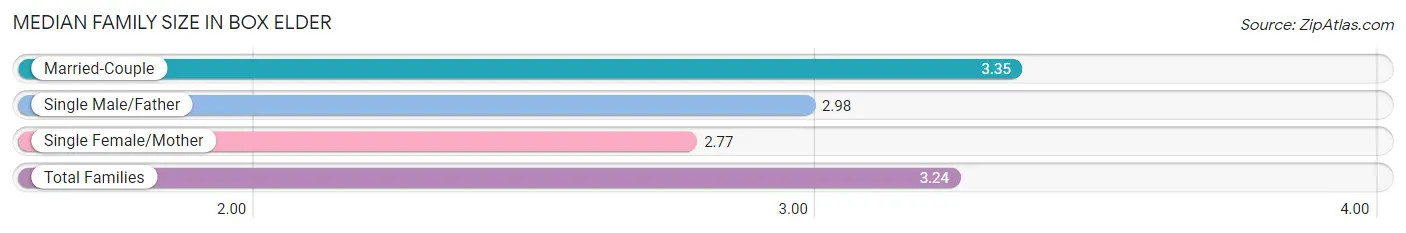
The median family size in Box Elder is 3.24 persons per family, with married-couple families (2,231 | 76.8%) accounting for the largest median family size of 3.35 persons per family. On the other hand, single female/mother families (356 | 12.3%) represent the smallest median family size with 2.77 persons per family.
| Family Type | # Families | Family Size |
| Married-Couple | 2,231 (76.8%) | 3.35 |
| Single Male/Father | 316 (10.9%) | 2.98 |
| Single Female/Mother | 356 (12.3%) | 2.77 |
| Total Families | 2,903 (100.0%) | 3.24 |
Median Household Size in Box Elder
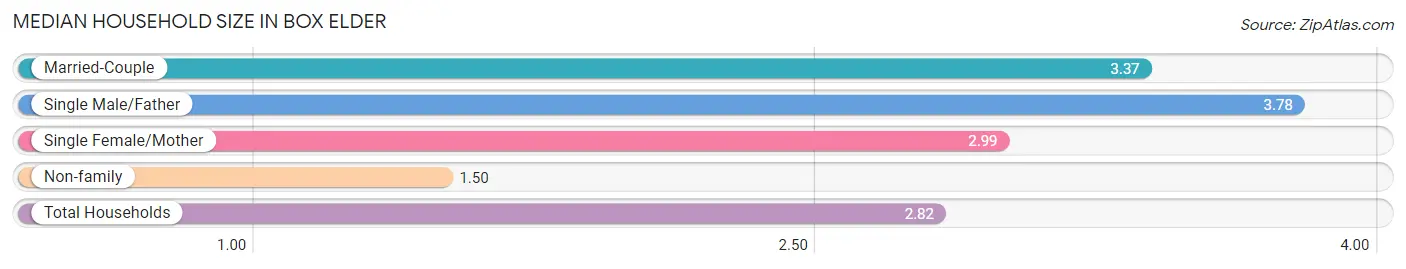
The median household size in Box Elder is 2.82 persons per household, with single male/father households (316 | 7.7%) accounting for the largest median household size of 3.78 persons per household. non-family households (1,217 | 29.5%) represent the smallest median household size with 1.50 persons per household.
| Household Type | # Households | Household Size |
| Married-Couple | 2,231 (54.1%) | 3.37 |
| Single Male/Father | 316 (7.7%) | 3.78 |
| Single Female/Mother | 356 (8.6%) | 2.99 |
| Non-family | 1,217 (29.5%) | 1.50 |
| Total Households | 4,120 (100.0%) | 2.82 |
Household Size by Marriage Status in Box Elder
Out of a total of 4,120 households in Box Elder, 2,903 (70.5%) are family households, while 1,217 (29.5%) are nonfamily households. The most numerous type of family households are 2-person households, comprising 1,085, and the most common type of nonfamily households are 1-person households, comprising 775.
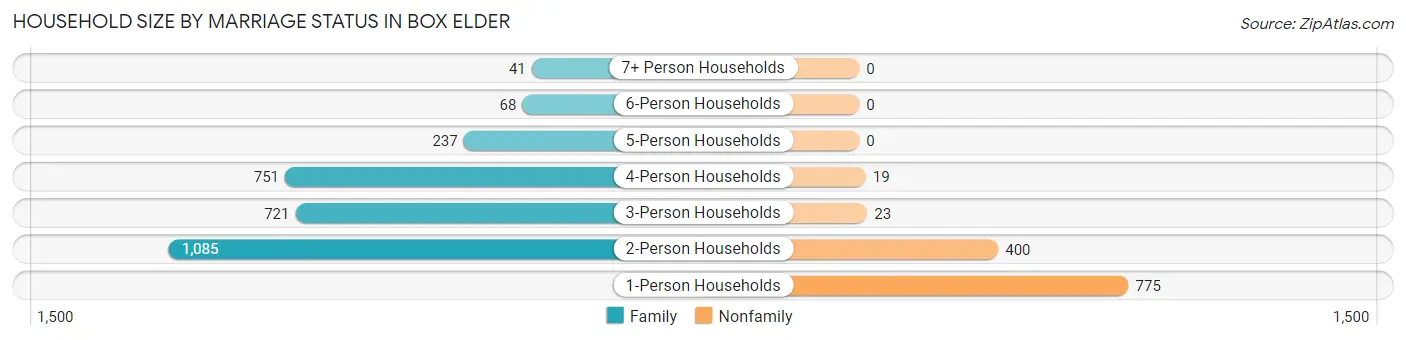
| Household Size | Family Households | Nonfamily Households |
| 1-Person Households | - | 775 (18.8%) |
| 2-Person Households | 1,085 (26.3%) | 400 (9.7%) |
| 3-Person Households | 721 (17.5%) | 23 (0.6%) |
| 4-Person Households | 751 (18.2%) | 19 (0.5%) |
| 5-Person Households | 237 (5.8%) | 0 (0.0%) |
| 6-Person Households | 68 (1.7%) | 0 (0.0%) |
| 7+ Person Households | 41 (1.0%) | 0 (0.0%) |
| Total | 2,903 (70.5%) | 1,217 (29.5%) |
Female Fertility in Box Elder
Fertility by Age in Box Elder
Average fertility rate in Box Elder is 68.0 births per 1,000 women. Women in the age bracket of 15 to 19 years have the highest fertility rate with 89.0 births per 1,000 women. Women in the age bracket of 20 to 34 years acount for 79.7% of all women with births.
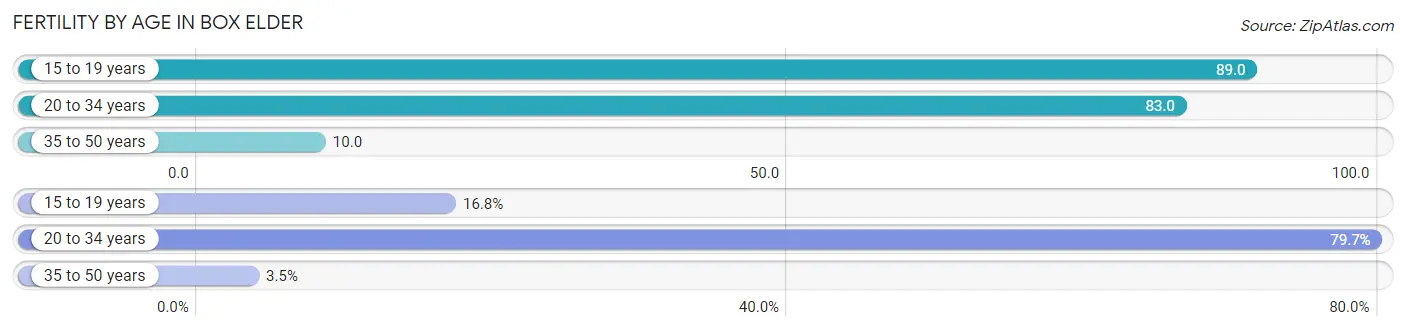
| Age Bracket | Women with Births | Births / 1,000 Women |
| 15 to 19 years | 34 (16.8%) | 89.0 |
| 20 to 34 years | 161 (79.7%) | 83.0 |
| 35 to 50 years | 7 (3.5%) | 10.0 |
| Total | 202 (100.0%) | 68.0 |
Fertility by Age by Marriage Status in Box Elder
78.7% of women with births (202) in Box Elder are married. The highest percentage of unmarried women with births falls into 15 to 19 years age bracket with 100.0% of them unmarried at the time of birth, while the lowest percentage of unmarried women with births belong to 35 to 50 years age bracket with 0.0% of them unmarried.
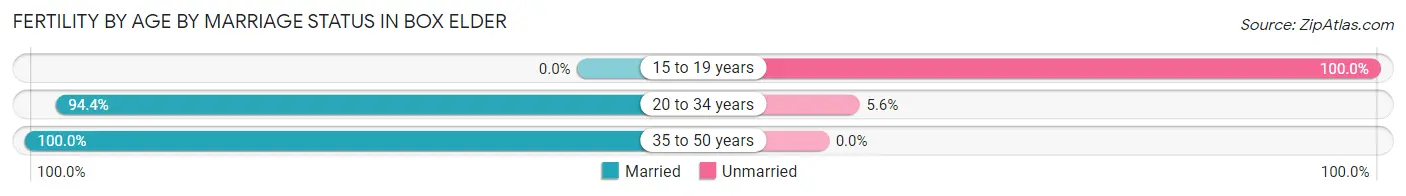
| Age Bracket | Married | Unmarried |
| 15 to 19 years | 0 (0.0%) | 34 (100.0%) |
| 20 to 34 years | 152 (94.4%) | 9 (5.6%) |
| 35 to 50 years | 7 (100.0%) | 0 (0.0%) |
| Total | 159 (78.7%) | 43 (21.3%) |
Fertility by Education in Box Elder
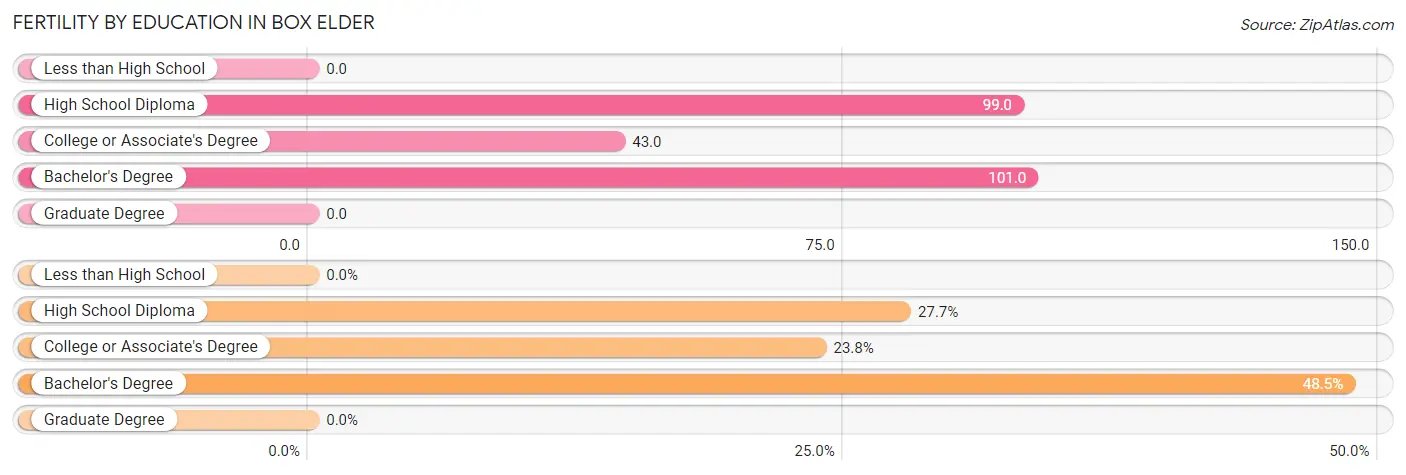
| Educational Attainment | Women with Births | Births / 1,000 Women |
| Less than High School | 0 (0.0%) | 0.0 |
| High School Diploma | 56 (27.7%) | 99.0 |
| College or Associate's Degree | 48 (23.8%) | 43.0 |
| Bachelor's Degree | 98 (48.5%) | 101.0 |
| Graduate Degree | 0 (0.0%) | 0.0 |
| Total | 202 (100.0%) | 68.0 |
Fertility by Education by Marriage Status in Box Elder
21.3% of women with births in Box Elder are unmarried. Women with the educational attainment of bachelor's degree are most likely to be married with 100.0% of them married at childbirth, while women with the educational attainment of high school diploma are least likely to be married with 60.7% of them unmarried at childbirth.
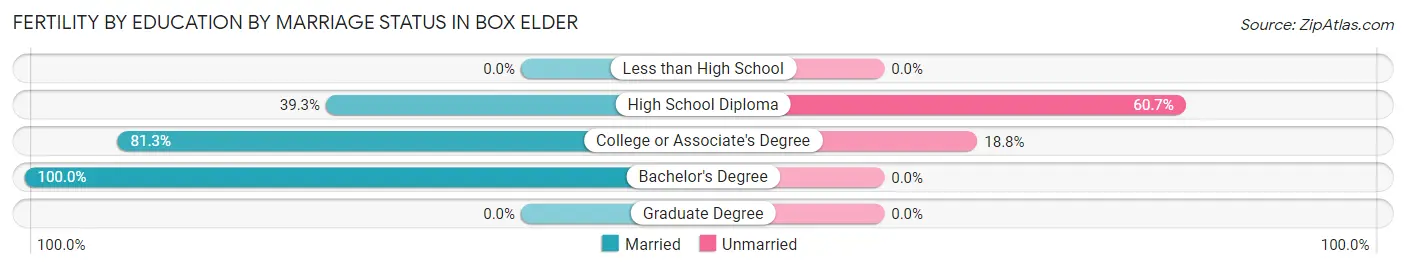
| Educational Attainment | Married | Unmarried |
| Less than High School | 0 (0.0%) | 0 (0.0%) |
| High School Diploma | 22 (39.3%) | 34 (60.7%) |
| College or Associate's Degree | 39 (81.2%) | 9 (18.8%) |
| Bachelor's Degree | 98 (100.0%) | 0 (0.0%) |
| Graduate Degree | 0 (0.0%) | 0 (0.0%) |
| Total | 159 (78.7%) | 43 (21.3%) |
Employment Characteristics in Box Elder
Employment by Class of Employer in Box Elder
Among the 6,584 employed individuals in Box Elder, private company employees (3,257 | 49.5%), federal government employees (1,757 | 26.7%), and local government employees (656 | 10.0%) make up the most common classes of employment.
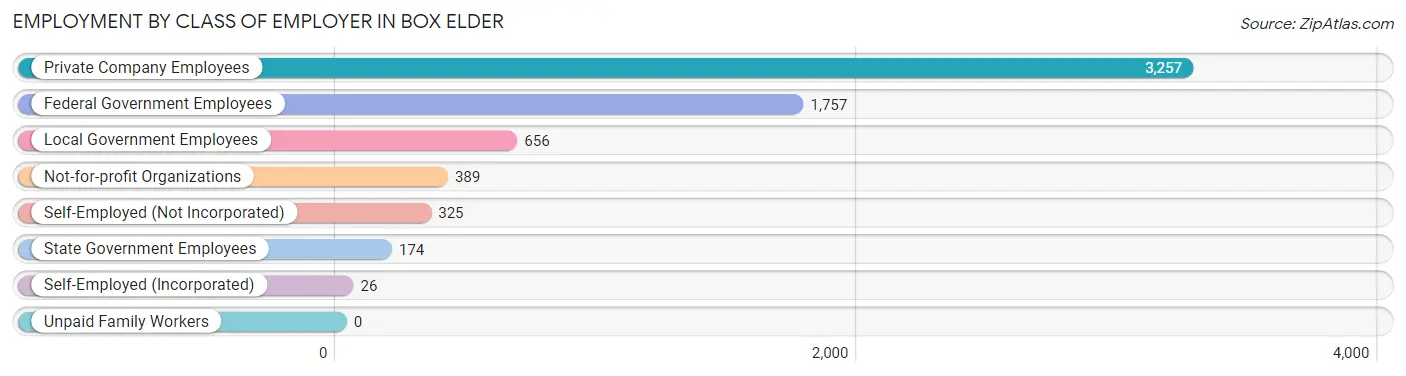
| Employer Class | # Employees | % Employees |
| Private Company Employees | 3,257 | 49.5% |
| Self-Employed (Incorporated) | 26 | 0.4% |
| Self-Employed (Not Incorporated) | 325 | 4.9% |
| Not-for-profit Organizations | 389 | 5.9% |
| Local Government Employees | 656 | 10.0% |
| State Government Employees | 174 | 2.6% |
| Federal Government Employees | 1,757 | 26.7% |
| Unpaid Family Workers | 0 | 0.0% |
| Total | 6,584 | 100.0% |
Employment Status by Age in Box Elder
According to the labor force statistics for Box Elder, out of the total population over 16 years of age (9,136), 77.5% or 7,080 individuals are in the labor force, with 5.0% or 354 of them unemployed. The age group with the highest labor force participation rate is 25 to 29 years, with 95.9% or 1,313 individuals in the labor force. Within the labor force, the 20 to 24 years age range has the highest percentage of unemployed individuals, with 14.3% or 210 of them being unemployed.
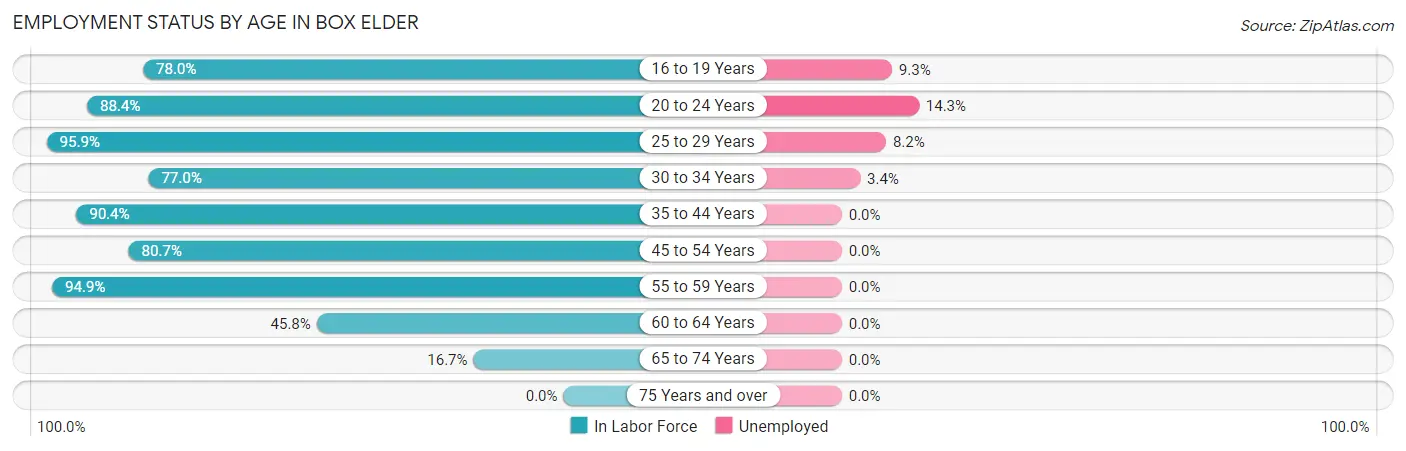
| Age Bracket | In Labor Force | Unemployed |
| 16 to 19 Years | 437 (78.0%) | 41 (9.3%) |
| 20 to 24 Years | 1,467 (88.4%) | 210 (14.3%) |
| 25 to 29 Years | 1,313 (95.9%) | 108 (8.2%) |
| 30 to 34 Years | 979 (77.0%) | 33 (3.4%) |
| 35 to 44 Years | 1,134 (90.4%) | 0 (0.0%) |
| 45 to 54 Years | 895 (80.7%) | 0 (0.0%) |
| 55 to 59 Years | 525 (94.9%) | 0 (0.0%) |
| 60 to 64 Years | 256 (45.8%) | 0 (0.0%) |
| 65 to 74 Years | 78 (16.7%) | 0 (0.0%) |
| 75 Years and over | 0 (0.0%) | 0 (0.0%) |
| Total | 7,080 (77.5%) | 354 (5.0%) |
Employment Status by Educational Attainment in Box Elder
According to labor force statistics for Box Elder, 83.4% of individuals (5,100) out of the total population between 25 and 64 years of age (6,115) are in the labor force, with 2.7% or 138 of them being unemployed. The group with the highest labor force participation rate are those with the educational attainment of college / associate degree, with 90.3% or 2,127 individuals in the labor force. Within the labor force, individuals with high school diploma education have the highest percentage of unemployment, with 5.2% or 51 of them being unemployed.
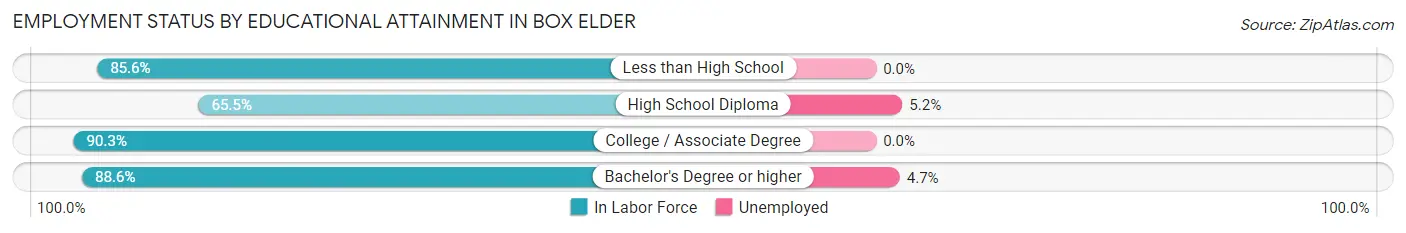
| Educational Attainment | In Labor Force | Unemployed |
| Less than High School | 308 (85.6%) | 0 (0.0%) |
| High School Diploma | 982 (65.5%) | 78 (5.2%) |
| College / Associate Degree | 2,127 (90.3%) | 0 (0.0%) |
| Bachelor's Degree or higher | 1,683 (88.6%) | 89 (4.7%) |
| Total | 5,100 (83.4%) | 165 (2.7%) |
Employment Occupations by Sex in Box Elder
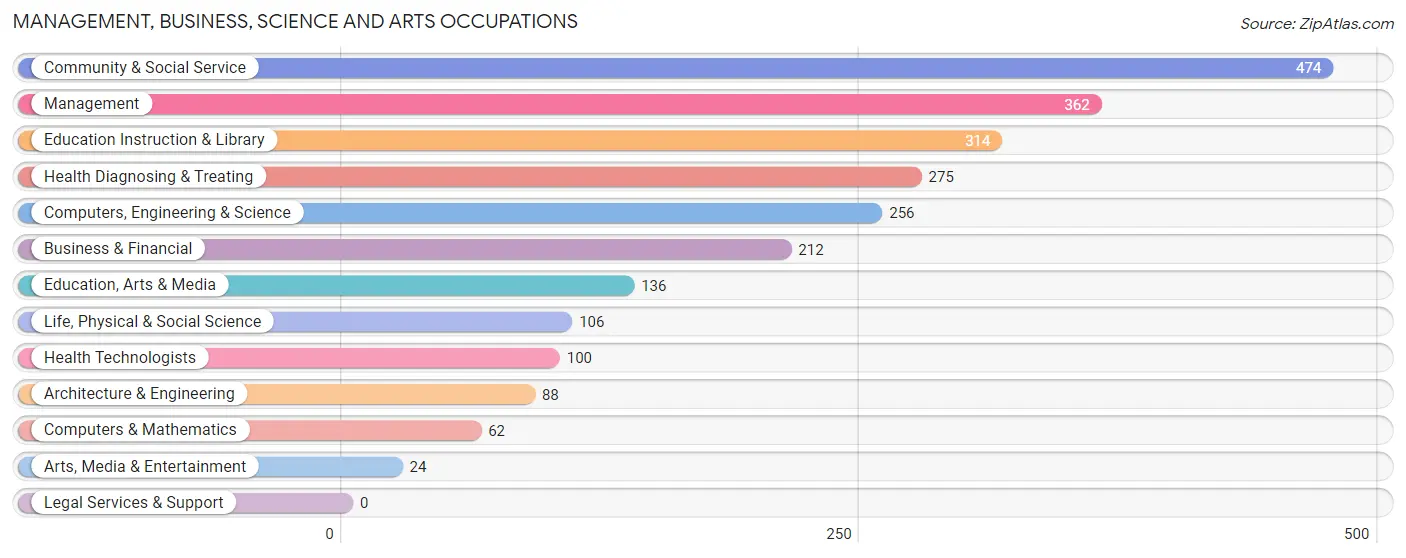
Management, Business, Science and Arts Occupations
The most common Management, Business, Science and Arts occupations in Box Elder are Community & Social Service (474 | 8.4%), Management (362 | 6.4%), Education Instruction & Library (314 | 5.5%), Health Diagnosing & Treating (275 | 4.8%), and Computers, Engineering & Science (256 | 4.5%).
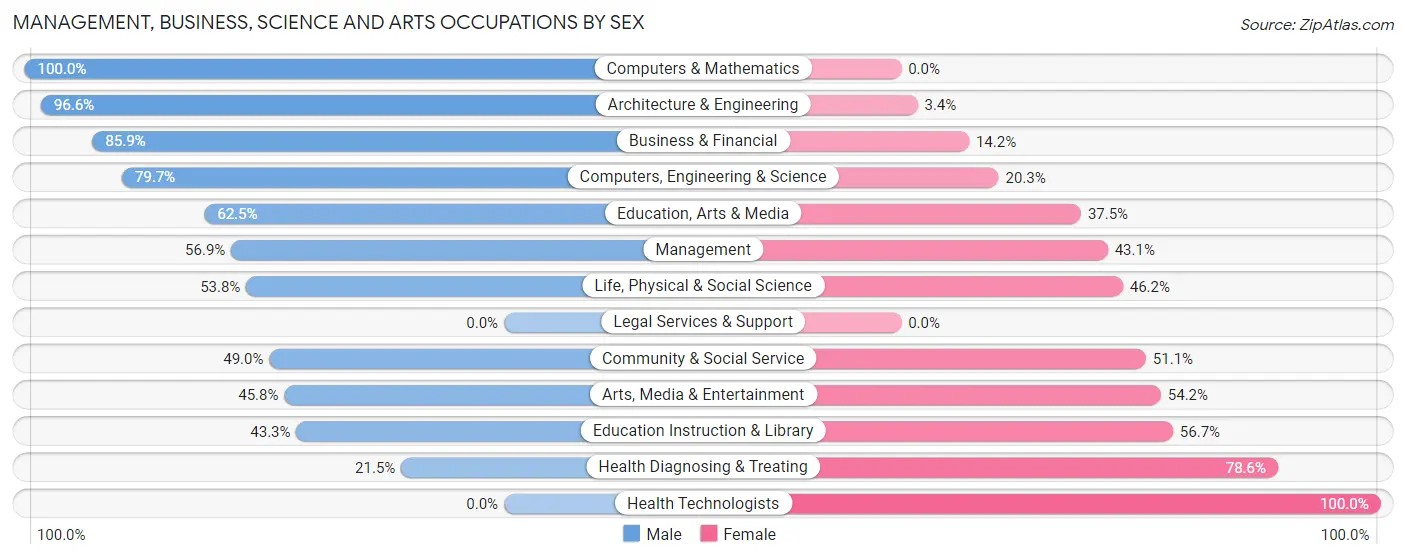
Management, Business, Science and Arts Occupations by Sex
Within the Management, Business, Science and Arts occupations in Box Elder, the most male-oriented occupations are Computers & Mathematics (100.0%), Architecture & Engineering (96.6%), and Business & Financial (85.9%), while the most female-oriented occupations are Health Technologists (100.0%), Health Diagnosing & Treating (78.5%), and Education Instruction & Library (56.7%).
| Occupation | Male | Female |
| Management | 206 (56.9%) | 156 (43.1%) |
| Business & Financial | 182 (85.9%) | 30 (14.1%) |
| Computers, Engineering & Science | 204 (79.7%) | 52 (20.3%) |
| Computers & Mathematics | 62 (100.0%) | 0 (0.0%) |
| Architecture & Engineering | 85 (96.6%) | 3 (3.4%) |
| Life, Physical & Social Science | 57 (53.8%) | 49 (46.2%) |
| Community & Social Service | 232 (48.9%) | 242 (51.0%) |
| Education, Arts & Media | 85 (62.5%) | 51 (37.5%) |
| Legal Services & Support | 0 (0.0%) | 0 (0.0%) |
| Education Instruction & Library | 136 (43.3%) | 178 (56.7%) |
| Arts, Media & Entertainment | 11 (45.8%) | 13 (54.2%) |
| Health Diagnosing & Treating | 59 (21.4%) | 216 (78.5%) |
| Health Technologists | 0 (0.0%) | 100 (100.0%) |
| Total (Category) | 883 (55.9%) | 696 (44.1%) |
| Total (Overall) | 3,107 (54.7%) | 2,570 (45.3%) |
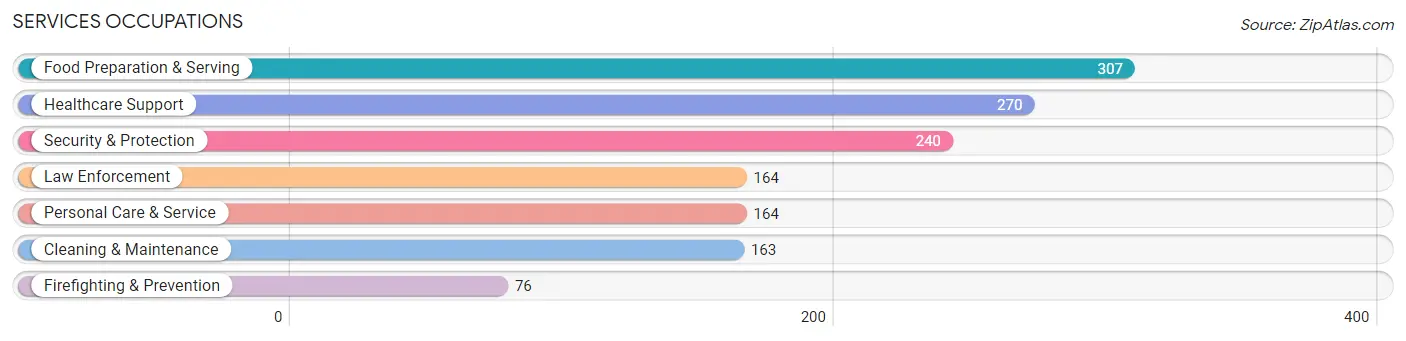
Services Occupations
The most common Services occupations in Box Elder are Food Preparation & Serving (307 | 5.4%), Healthcare Support (270 | 4.8%), Security & Protection (240 | 4.2%), Law Enforcement (164 | 2.9%), and Personal Care & Service (164 | 2.9%).
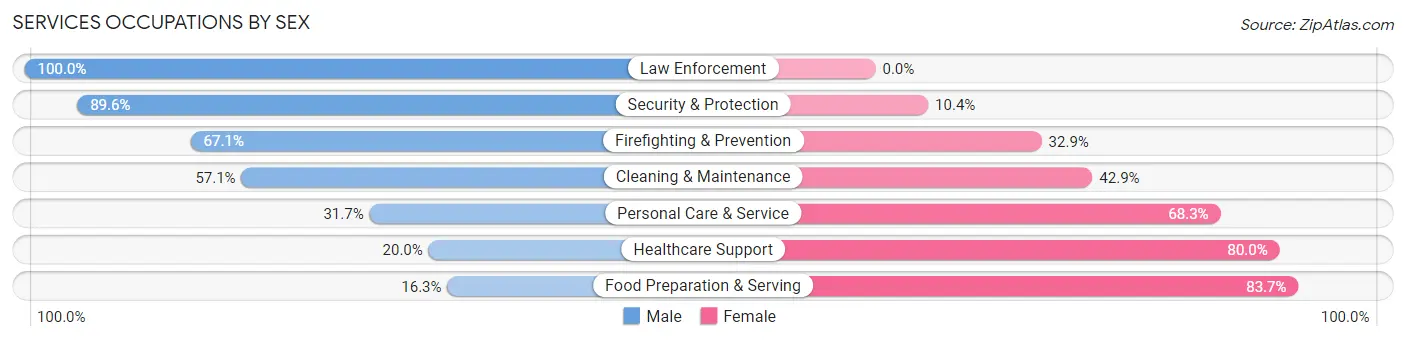
Services Occupations by Sex
Within the Services occupations in Box Elder, the most male-oriented occupations are Law Enforcement (100.0%), Security & Protection (89.6%), and Firefighting & Prevention (67.1%), while the most female-oriented occupations are Food Preparation & Serving (83.7%), Healthcare Support (80.0%), and Personal Care & Service (68.3%).
| Occupation | Male | Female |
| Healthcare Support | 54 (20.0%) | 216 (80.0%) |
| Security & Protection | 215 (89.6%) | 25 (10.4%) |
| Firefighting & Prevention | 51 (67.1%) | 25 (32.9%) |
| Law Enforcement | 164 (100.0%) | 0 (0.0%) |
| Food Preparation & Serving | 50 (16.3%) | 257 (83.7%) |
| Cleaning & Maintenance | 93 (57.1%) | 70 (42.9%) |
| Personal Care & Service | 52 (31.7%) | 112 (68.3%) |
| Total (Category) | 464 (40.6%) | 680 (59.4%) |
| Total (Overall) | 3,107 (54.7%) | 2,570 (45.3%) |
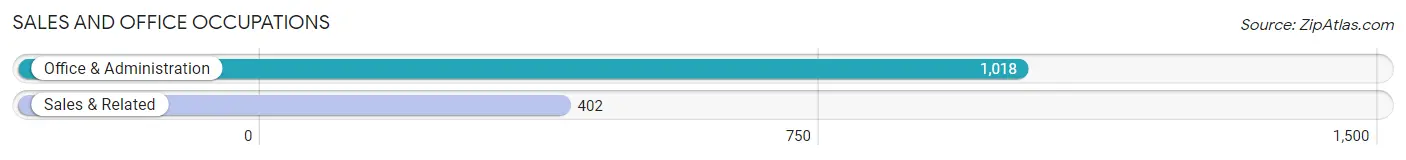
Sales and Office Occupations
The most common Sales and Office occupations in Box Elder are Office & Administration (1,018 | 17.9%), and Sales & Related (402 | 7.1%).
Sales and Office Occupations by Sex
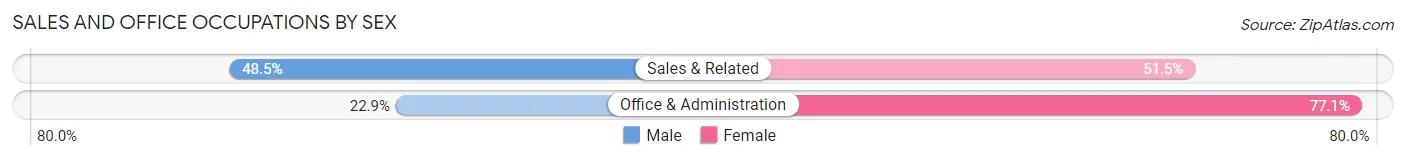
| Occupation | Male | Female |
| Sales & Related | 195 (48.5%) | 207 (51.5%) |
| Office & Administration | 233 (22.9%) | 785 (77.1%) |
| Total (Category) | 428 (30.1%) | 992 (69.9%) |
| Total (Overall) | 3,107 (54.7%) | 2,570 (45.3%) |
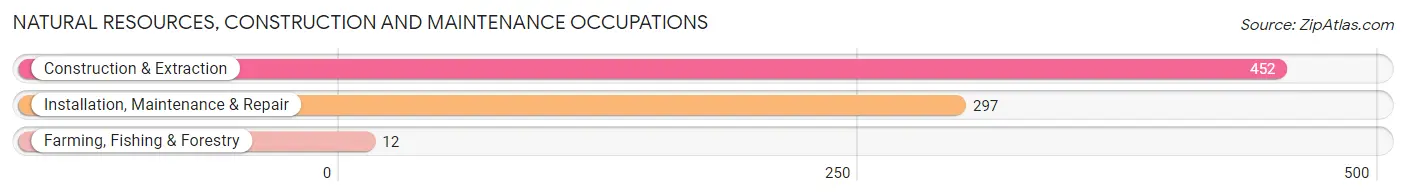
Natural Resources, Construction and Maintenance Occupations
The most common Natural Resources, Construction and Maintenance occupations in Box Elder are Construction & Extraction (452 | 8.0%), Installation, Maintenance & Repair (297 | 5.2%), and Farming, Fishing & Forestry (12 | 0.2%).
Natural Resources, Construction and Maintenance Occupations by Sex
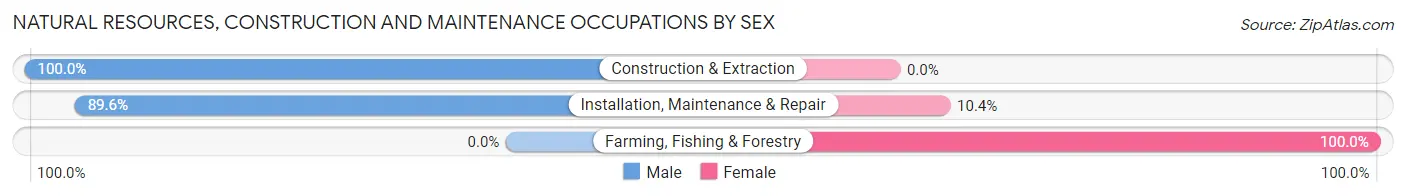
| Occupation | Male | Female |
| Farming, Fishing & Forestry | 0 (0.0%) | 12 (100.0%) |
| Construction & Extraction | 452 (100.0%) | 0 (0.0%) |
| Installation, Maintenance & Repair | 266 (89.6%) | 31 (10.4%) |
| Total (Category) | 718 (94.4%) | 43 (5.7%) |
| Total (Overall) | 3,107 (54.7%) | 2,570 (45.3%) |
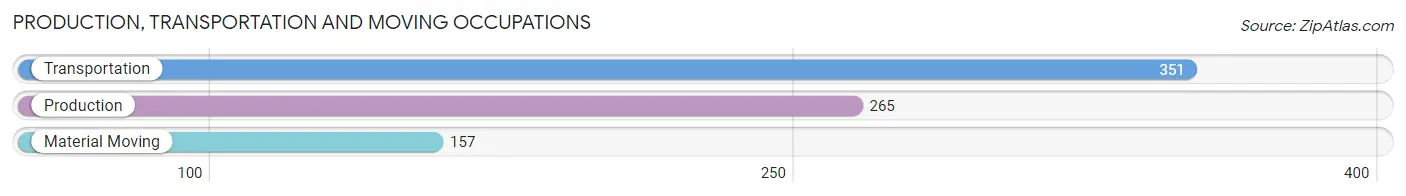
Production, Transportation and Moving Occupations
The most common Production, Transportation and Moving occupations in Box Elder are Transportation (351 | 6.2%), Production (265 | 4.7%), and Material Moving (157 | 2.8%).
Production, Transportation and Moving Occupations by Sex
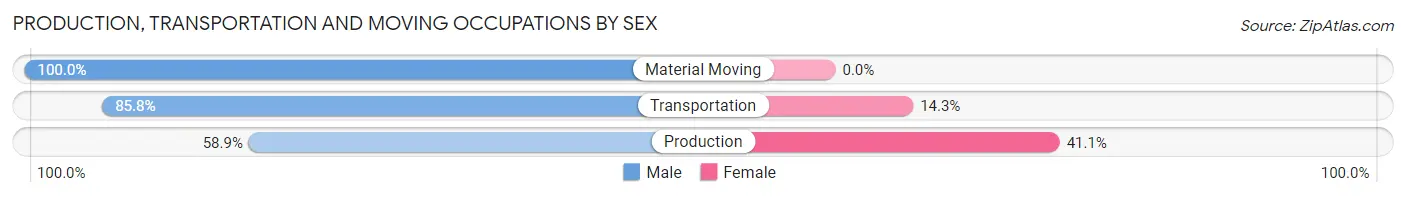
| Occupation | Male | Female |
| Production | 156 (58.9%) | 109 (41.1%) |
| Transportation | 301 (85.8%) | 50 (14.2%) |
| Material Moving | 157 (100.0%) | 0 (0.0%) |
| Total (Category) | 614 (79.4%) | 159 (20.6%) |
| Total (Overall) | 3,107 (54.7%) | 2,570 (45.3%) |
Employment Industries by Sex in Box Elder
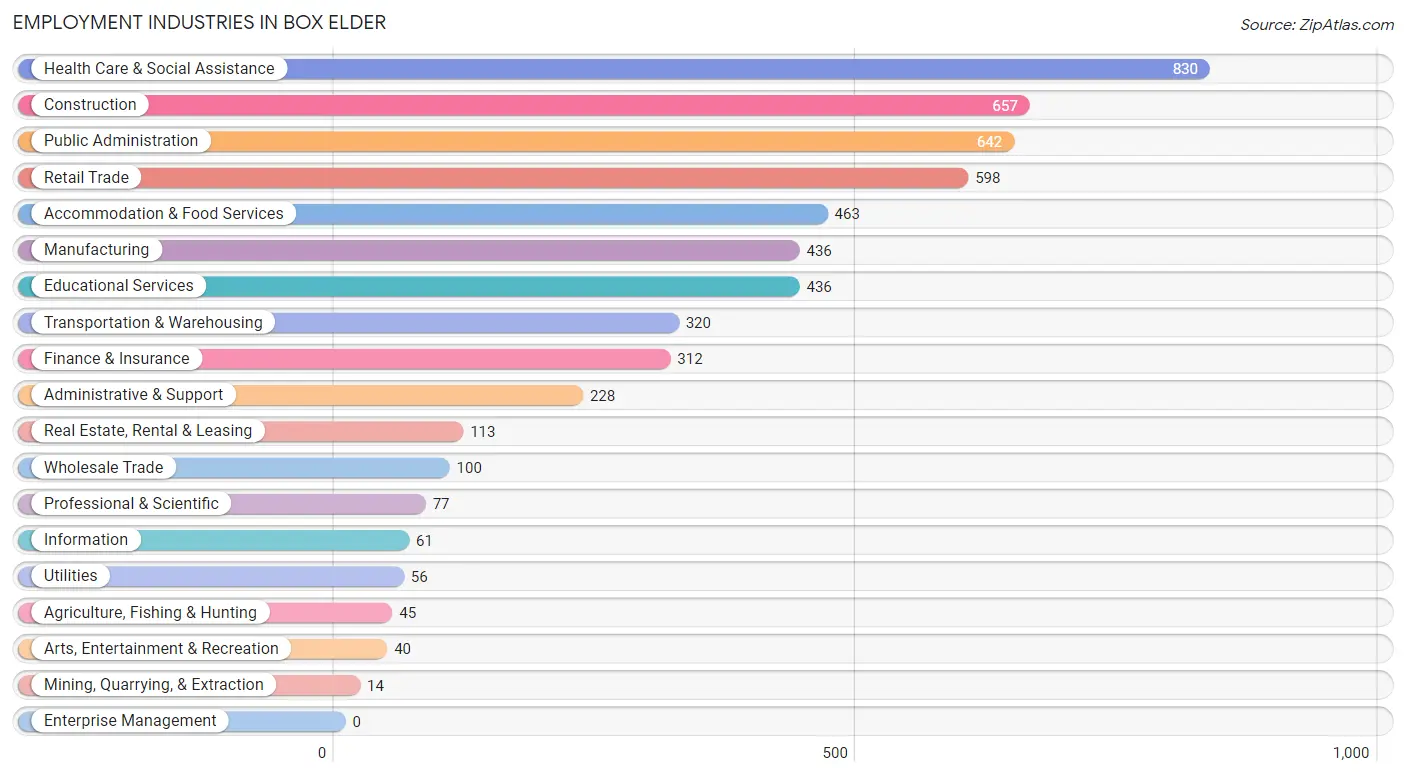
Employment Industries in Box Elder
The major employment industries in Box Elder include Health Care & Social Assistance (830 | 14.6%), Construction (657 | 11.6%), Public Administration (642 | 11.3%), Retail Trade (598 | 10.5%), and Accommodation & Food Services (463 | 8.2%).
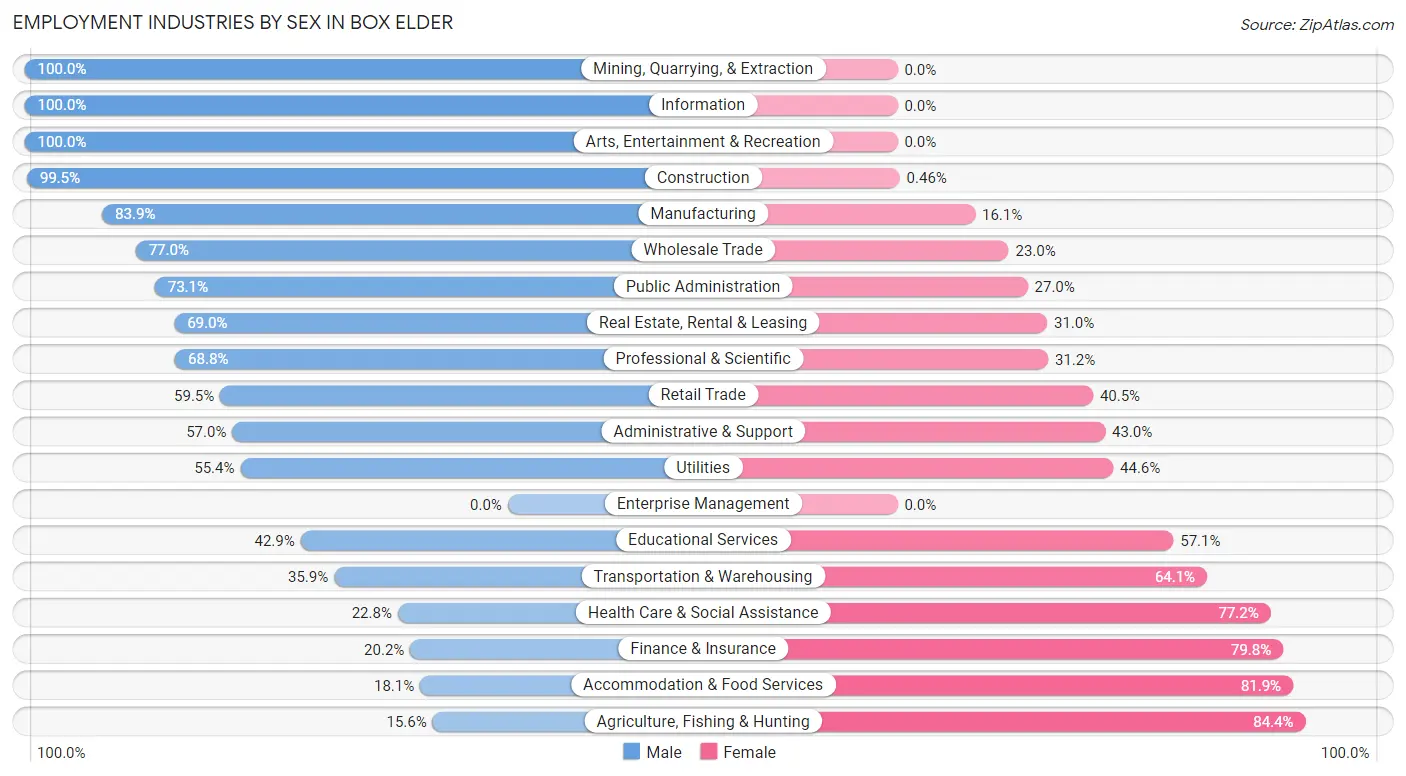
Employment Industries by Sex in Box Elder
The Box Elder industries that see more men than women are Mining, Quarrying, & Extraction (100.0%), Information (100.0%), and Arts, Entertainment & Recreation (100.0%), whereas the industries that tend to have a higher number of women are Agriculture, Fishing & Hunting (84.4%), Accommodation & Food Services (81.9%), and Finance & Insurance (79.8%).
| Industry | Male | Female |
| Agriculture, Fishing & Hunting | 7 (15.6%) | 38 (84.4%) |
| Mining, Quarrying, & Extraction | 14 (100.0%) | 0 (0.0%) |
| Construction | 654 (99.5%) | 3 (0.5%) |
| Manufacturing | 366 (83.9%) | 70 (16.1%) |
| Wholesale Trade | 77 (77.0%) | 23 (23.0%) |
| Retail Trade | 356 (59.5%) | 242 (40.5%) |
| Transportation & Warehousing | 115 (35.9%) | 205 (64.1%) |
| Utilities | 31 (55.4%) | 25 (44.6%) |
| Information | 61 (100.0%) | 0 (0.0%) |
| Finance & Insurance | 63 (20.2%) | 249 (79.8%) |
| Real Estate, Rental & Leasing | 78 (69.0%) | 35 (31.0%) |
| Professional & Scientific | 53 (68.8%) | 24 (31.2%) |
| Enterprise Management | 0 (0.0%) | 0 (0.0%) |
| Administrative & Support | 130 (57.0%) | 98 (43.0%) |
| Educational Services | 187 (42.9%) | 249 (57.1%) |
| Health Care & Social Assistance | 189 (22.8%) | 641 (77.2%) |
| Arts, Entertainment & Recreation | 40 (100.0%) | 0 (0.0%) |
| Accommodation & Food Services | 84 (18.1%) | 379 (81.9%) |
| Public Administration | 469 (73.1%) | 173 (27.0%) |
| Total | 3,107 (54.7%) | 2,570 (45.3%) |
Education in Box Elder
School Enrollment in Box Elder
The most common levels of schooling among the 3,291 students in Box Elder are college / undergraduate (918 | 27.9%), middle school (842 | 25.6%), and elementary school (551 | 16.7%).
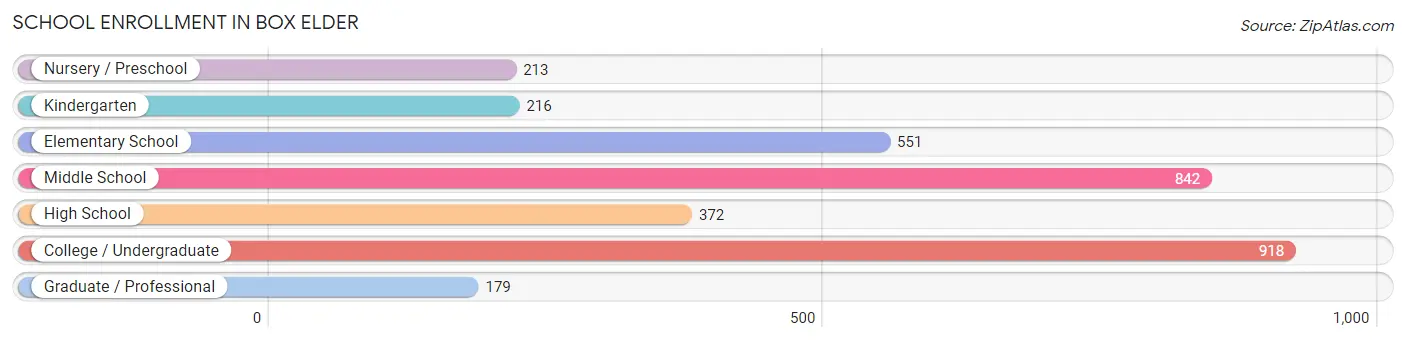
| School Level | # Students | % Students |
| Nursery / Preschool | 213 | 6.5% |
| Kindergarten | 216 | 6.6% |
| Elementary School | 551 | 16.7% |
| Middle School | 842 | 25.6% |
| High School | 372 | 11.3% |
| College / Undergraduate | 918 | 27.9% |
| Graduate / Professional | 179 | 5.4% |
| Total | 3,291 | 100.0% |
School Enrollment by Age by Funding Source in Box Elder
Out of a total of 3,291 students who are enrolled in schools in Box Elder, 270 (8.2%) attend a private institution, while the remaining 3,021 (91.8%) are enrolled in public schools. The age group of 3 to 4 year olds has the highest likelihood of being enrolled in private schools, with 37 (23.1% in the age bracket) enrolled. Conversely, the age group of 20 to 24 year olds has the lowest likelihood of being enrolled in a private school, with 476 (98.1% in the age bracket) attending a public institution.
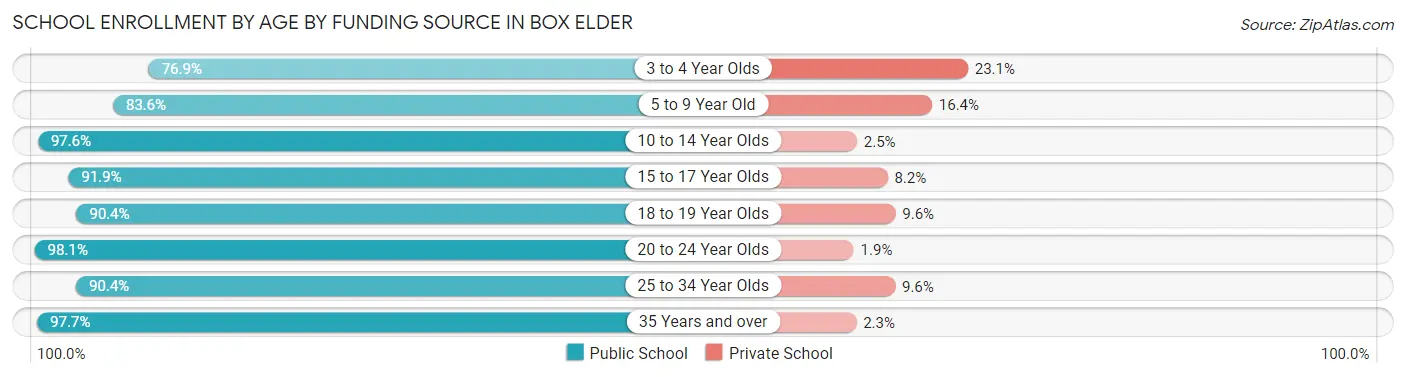
| Age Bracket | Public School | Private School |
| 3 to 4 Year Olds | 123 (76.9%) | 37 (23.1%) |
| 5 to 9 Year Old | 661 (83.6%) | 130 (16.4%) |
| 10 to 14 Year Olds | 875 (97.6%) | 22 (2.5%) |
| 15 to 17 Year Olds | 214 (91.8%) | 19 (8.2%) |
| 18 to 19 Year Olds | 122 (90.4%) | 13 (9.6%) |
| 20 to 24 Year Olds | 476 (98.1%) | 9 (1.9%) |
| 25 to 34 Year Olds | 340 (90.4%) | 36 (9.6%) |
| 35 Years and over | 209 (97.7%) | 5 (2.3%) |
| Total | 3,021 (91.8%) | 270 (8.2%) |
Educational Attainment by Field of Study in Box Elder
Business (473 | 22.1%), science & technology (392 | 18.3%), education (373 | 17.4%), bio, nature & agricultural (210 | 9.8%), and arts & humanities (132 | 6.2%) are the most common fields of study among 2,137 individuals in Box Elder who have obtained a bachelor's degree or higher.
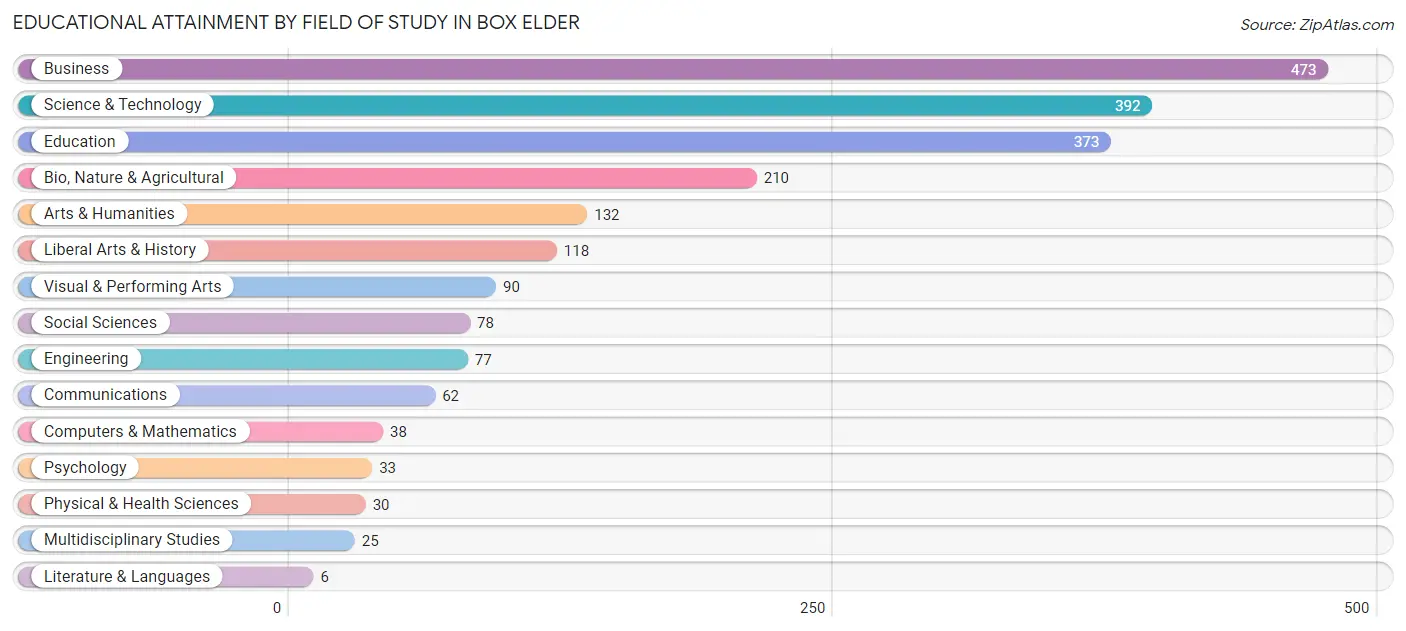
| Field of Study | # Graduates | % Graduates |
| Computers & Mathematics | 38 | 1.8% |
| Bio, Nature & Agricultural | 210 | 9.8% |
| Physical & Health Sciences | 30 | 1.4% |
| Psychology | 33 | 1.5% |
| Social Sciences | 78 | 3.6% |
| Engineering | 77 | 3.6% |
| Multidisciplinary Studies | 25 | 1.2% |
| Science & Technology | 392 | 18.3% |
| Business | 473 | 22.1% |
| Education | 373 | 17.4% |
| Literature & Languages | 6 | 0.3% |
| Liberal Arts & History | 118 | 5.5% |
| Visual & Performing Arts | 90 | 4.2% |
| Communications | 62 | 2.9% |
| Arts & Humanities | 132 | 6.2% |
| Total | 2,137 | 100.0% |
Transportation & Commute in Box Elder
Vehicle Availability by Sex in Box Elder
The most prevalent vehicle ownership categories in Box Elder are males with 2 vehicles (1,650, accounting for 44.6%) and females with 2 vehicles (1,071, making up 62.8%).
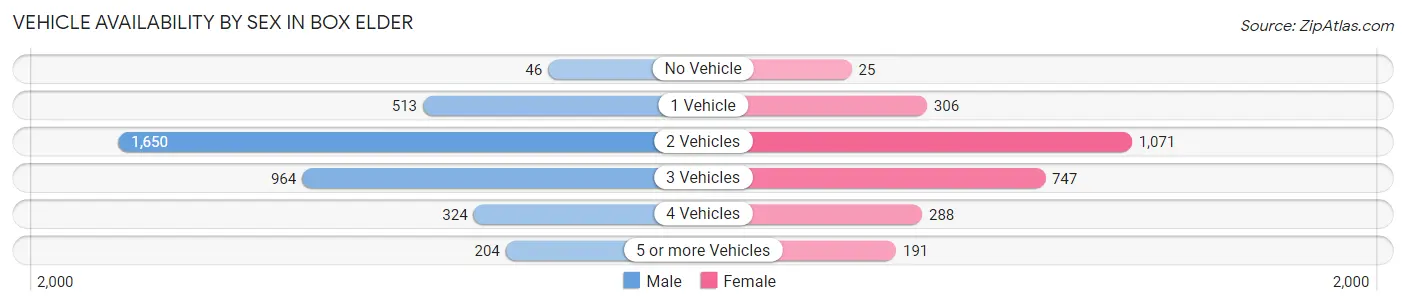
| Vehicles Available | Male | Female |
| No Vehicle | 46 (1.2%) | 25 (0.9%) |
| 1 Vehicle | 513 (13.9%) | 306 (11.6%) |
| 2 Vehicles | 1,650 (44.6%) | 1,071 (40.7%) |
| 3 Vehicles | 964 (26.1%) | 747 (28.4%) |
| 4 Vehicles | 324 (8.7%) | 288 (11.0%) |
| 5 or more Vehicles | 204 (5.5%) | 191 (7.3%) |
| Total | 3,701 (100.0%) | 2,628 (100.0%) |
Commute Time in Box Elder
The most frequently occuring commute durations in Box Elder are 15 to 19 minutes (1,468 commuters, 23.6%), 20 to 24 minutes (1,076 commuters, 17.3%), and 10 to 14 minutes (1,025 commuters, 16.5%).
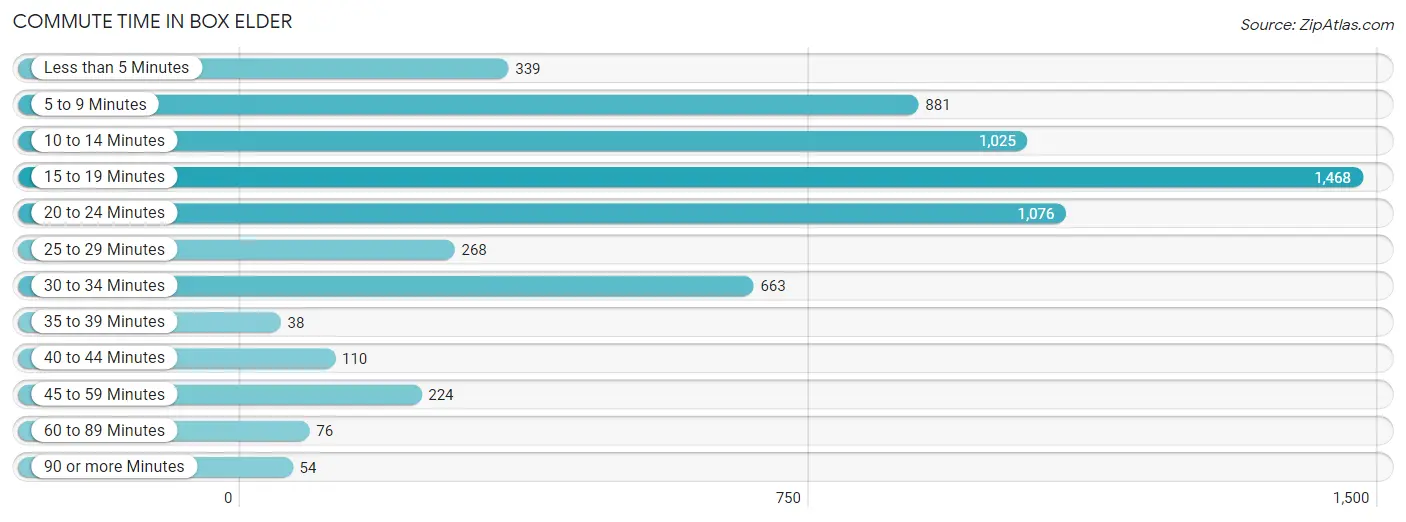
| Commute Time | # Commuters | % Commuters |
| Less than 5 Minutes | 339 | 5.4% |
| 5 to 9 Minutes | 881 | 14.2% |
| 10 to 14 Minutes | 1,025 | 16.5% |
| 15 to 19 Minutes | 1,468 | 23.6% |
| 20 to 24 Minutes | 1,076 | 17.3% |
| 25 to 29 Minutes | 268 | 4.3% |
| 30 to 34 Minutes | 663 | 10.7% |
| 35 to 39 Minutes | 38 | 0.6% |
| 40 to 44 Minutes | 110 | 1.8% |
| 45 to 59 Minutes | 224 | 3.6% |
| 60 to 89 Minutes | 76 | 1.2% |
| 90 or more Minutes | 54 | 0.9% |
Commute Time by Sex in Box Elder
The most common commute times in Box Elder are 15 to 19 minutes (995 commuters, 26.6%) for males and 20 to 24 minutes (555 commuters, 22.4%) for females.
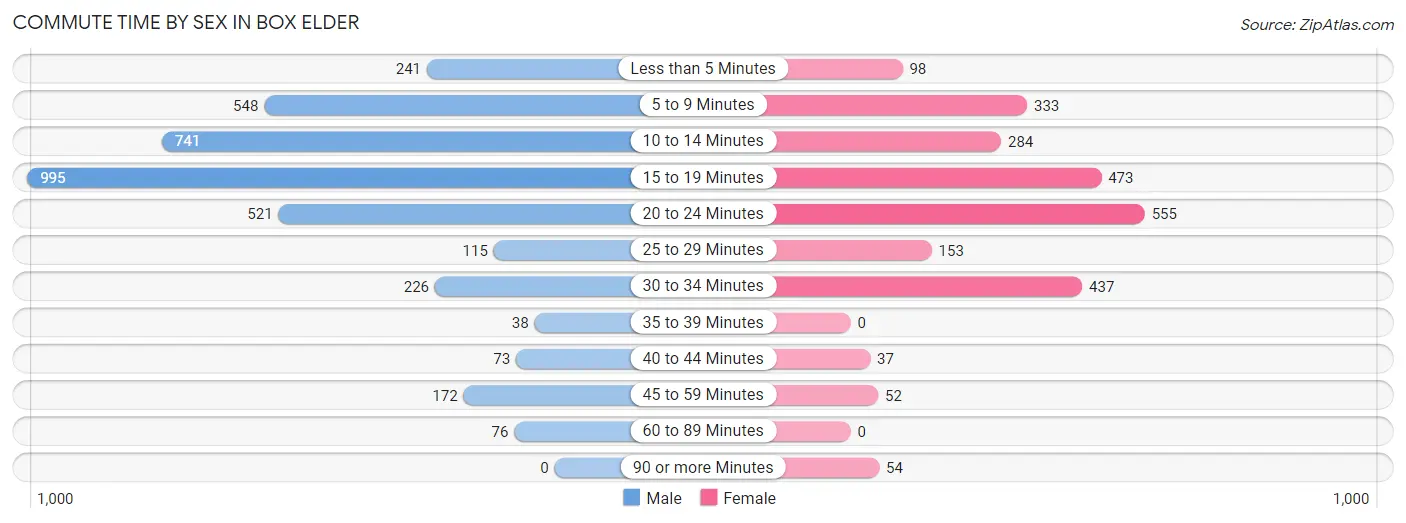
| Commute Time | Male | Female |
| Less than 5 Minutes | 241 (6.4%) | 98 (4.0%) |
| 5 to 9 Minutes | 548 (14.6%) | 333 (13.5%) |
| 10 to 14 Minutes | 741 (19.8%) | 284 (11.5%) |
| 15 to 19 Minutes | 995 (26.6%) | 473 (19.1%) |
| 20 to 24 Minutes | 521 (13.9%) | 555 (22.4%) |
| 25 to 29 Minutes | 115 (3.1%) | 153 (6.2%) |
| 30 to 34 Minutes | 226 (6.0%) | 437 (17.6%) |
| 35 to 39 Minutes | 38 (1.0%) | 0 (0.0%) |
| 40 to 44 Minutes | 73 (1.9%) | 37 (1.5%) |
| 45 to 59 Minutes | 172 (4.6%) | 52 (2.1%) |
| 60 to 89 Minutes | 76 (2.0%) | 0 (0.0%) |
| 90 or more Minutes | 0 (0.0%) | 54 (2.2%) |
Time of Departure to Work by Sex in Box Elder
The most frequent times of departure to work in Box Elder are 6:30 AM to 6:59 AM (954, 25.5%) for males and 7:00 AM to 7:29 AM (729, 29.4%) for females.
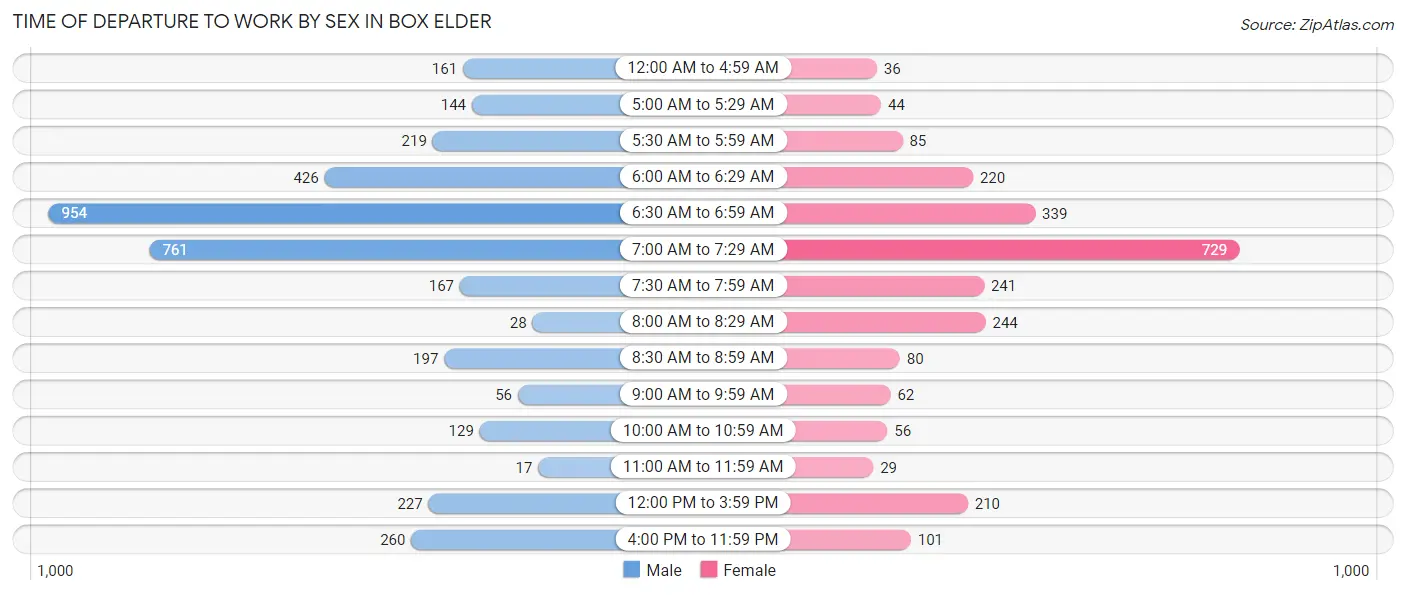
| Time of Departure | Male | Female |
| 12:00 AM to 4:59 AM | 161 (4.3%) | 36 (1.5%) |
| 5:00 AM to 5:29 AM | 144 (3.8%) | 44 (1.8%) |
| 5:30 AM to 5:59 AM | 219 (5.9%) | 85 (3.4%) |
| 6:00 AM to 6:29 AM | 426 (11.4%) | 220 (8.9%) |
| 6:30 AM to 6:59 AM | 954 (25.5%) | 339 (13.7%) |
| 7:00 AM to 7:29 AM | 761 (20.3%) | 729 (29.4%) |
| 7:30 AM to 7:59 AM | 167 (4.5%) | 241 (9.7%) |
| 8:00 AM to 8:29 AM | 28 (0.7%) | 244 (9.9%) |
| 8:30 AM to 8:59 AM | 197 (5.3%) | 80 (3.2%) |
| 9:00 AM to 9:59 AM | 56 (1.5%) | 62 (2.5%) |
| 10:00 AM to 10:59 AM | 129 (3.4%) | 56 (2.3%) |
| 11:00 AM to 11:59 AM | 17 (0.4%) | 29 (1.2%) |
| 12:00 PM to 3:59 PM | 227 (6.1%) | 210 (8.5%) |
| 4:00 PM to 11:59 PM | 260 (6.9%) | 101 (4.1%) |
| Total | 3,746 (100.0%) | 2,476 (100.0%) |
Housing Occupancy in Box Elder
Occupancy by Ownership in Box Elder
Of the total 4,120 dwellings in Box Elder, owner-occupied units account for 2,100 (51.0%), while renter-occupied units make up 2,020 (49.0%).
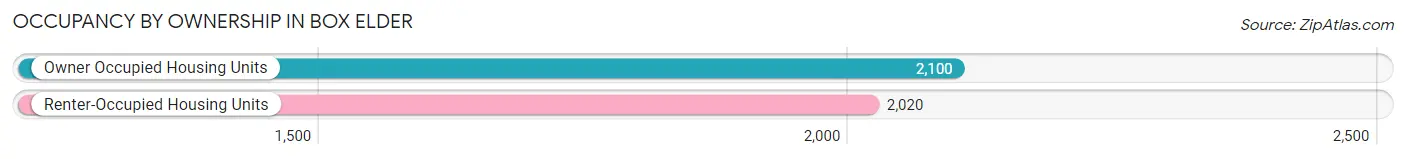
| Occupancy | # Housing Units | % Housing Units |
| Owner Occupied Housing Units | 2,100 | 51.0% |
| Renter-Occupied Housing Units | 2,020 | 49.0% |
| Total Occupied Housing Units | 4,120 | 100.0% |
Occupancy by Household Size in Box Elder
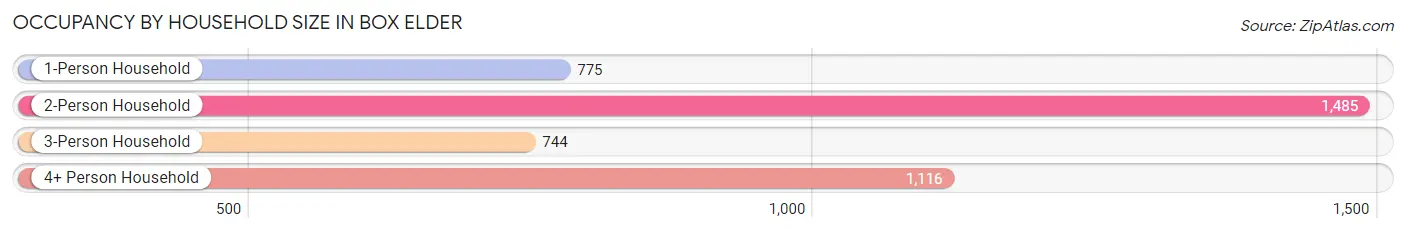
| Household Size | # Housing Units | % Housing Units |
| 1-Person Household | 775 | 18.8% |
| 2-Person Household | 1,485 | 36.0% |
| 3-Person Household | 744 | 18.1% |
| 4+ Person Household | 1,116 | 27.1% |
| Total Housing Units | 4,120 | 100.0% |
Occupancy by Ownership by Household Size in Box Elder
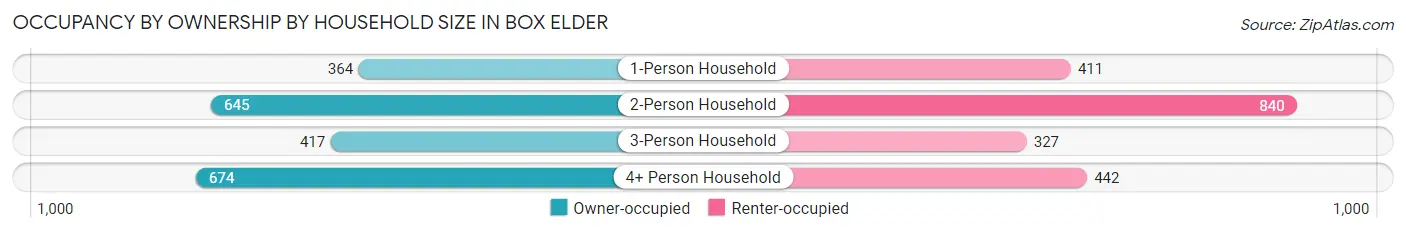
| Household Size | Owner-occupied | Renter-occupied |
| 1-Person Household | 364 (47.0%) | 411 (53.0%) |
| 2-Person Household | 645 (43.4%) | 840 (56.6%) |
| 3-Person Household | 417 (56.0%) | 327 (44.0%) |
| 4+ Person Household | 674 (60.4%) | 442 (39.6%) |
| Total Housing Units | 2,100 (51.0%) | 2,020 (49.0%) |
Occupancy by Educational Attainment in Box Elder
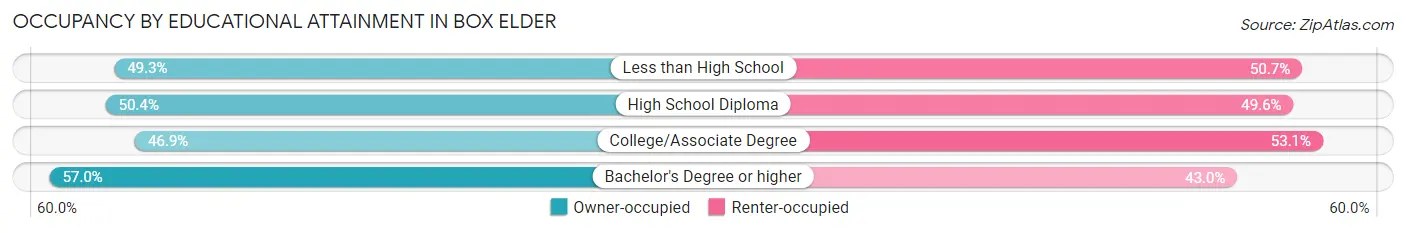
| Household Size | Owner-occupied | Renter-occupied |
| Less than High School | 112 (49.3%) | 115 (50.7%) |
| High School Diploma | 543 (50.4%) | 535 (49.6%) |
| College/Associate Degree | 740 (46.9%) | 839 (53.1%) |
| Bachelor's Degree or higher | 705 (57.0%) | 531 (43.0%) |
Occupancy by Age of Householder in Box Elder
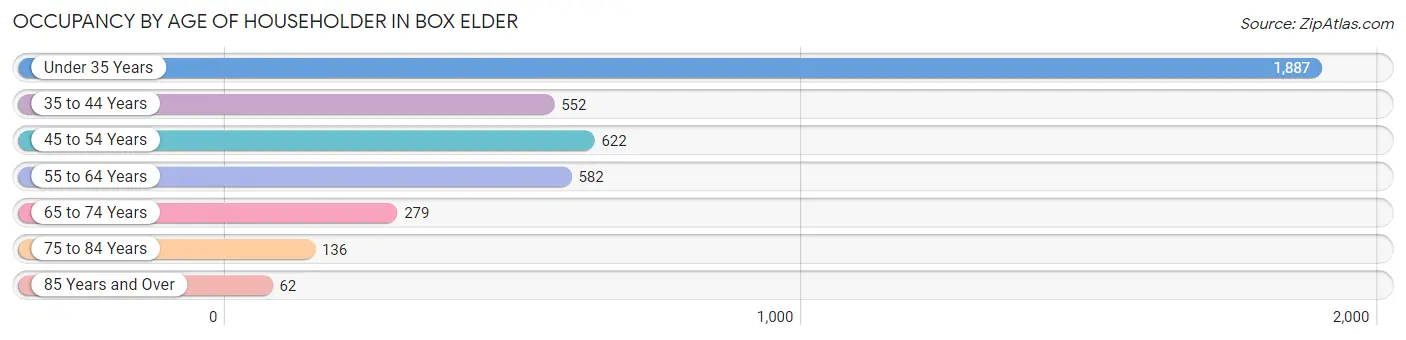
| Age Bracket | # Households | % Households |
| Under 35 Years | 1,887 | 45.8% |
| 35 to 44 Years | 552 | 13.4% |
| 45 to 54 Years | 622 | 15.1% |
| 55 to 64 Years | 582 | 14.1% |
| 65 to 74 Years | 279 | 6.8% |
| 75 to 84 Years | 136 | 3.3% |
| 85 Years and Over | 62 | 1.5% |
| Total | 4,120 | 100.0% |
Housing Finances in Box Elder
Median Income by Occupancy in Box Elder
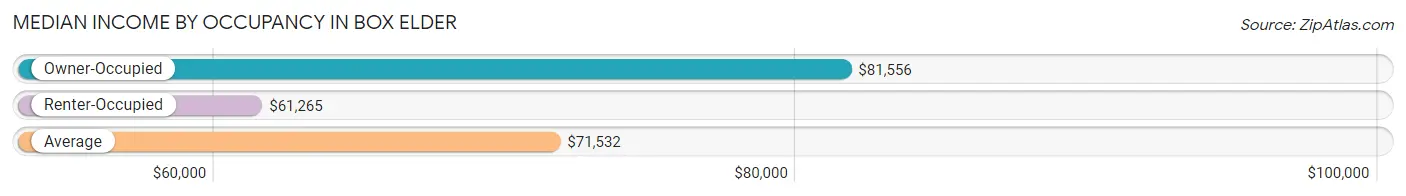
| Occupancy Type | # Households | Median Income |
| Owner-Occupied | 2,100 (51.0%) | $81,556 |
| Renter-Occupied | 2,020 (49.0%) | $61,265 |
| Average | 4,120 (100.0%) | $71,532 |
Occupancy by Householder Income Bracket in Box Elder
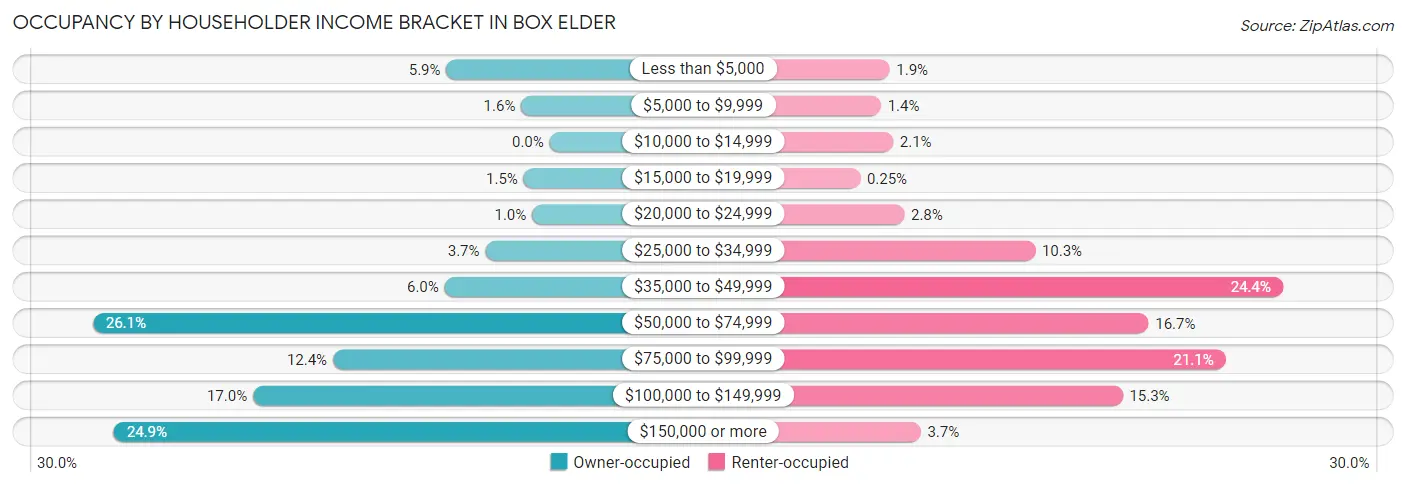
| Income Bracket | Owner-occupied | Renter-occupied |
| Less than $5,000 | 124 (5.9%) | 39 (1.9%) |
| $5,000 to $9,999 | 34 (1.6%) | 29 (1.4%) |
| $10,000 to $14,999 | 0 (0.0%) | 43 (2.1%) |
| $15,000 to $19,999 | 31 (1.5%) | 5 (0.3%) |
| $20,000 to $24,999 | 21 (1.0%) | 56 (2.8%) |
| $25,000 to $34,999 | 77 (3.7%) | 207 (10.2%) |
| $35,000 to $49,999 | 126 (6.0%) | 493 (24.4%) |
| $50,000 to $74,999 | 548 (26.1%) | 338 (16.7%) |
| $75,000 to $99,999 | 260 (12.4%) | 427 (21.1%) |
| $100,000 to $149,999 | 356 (17.0%) | 308 (15.2%) |
| $150,000 or more | 523 (24.9%) | 75 (3.7%) |
| Total | 2,100 (100.0%) | 2,020 (100.0%) |
Monthly Housing Cost Tiers in Box Elder
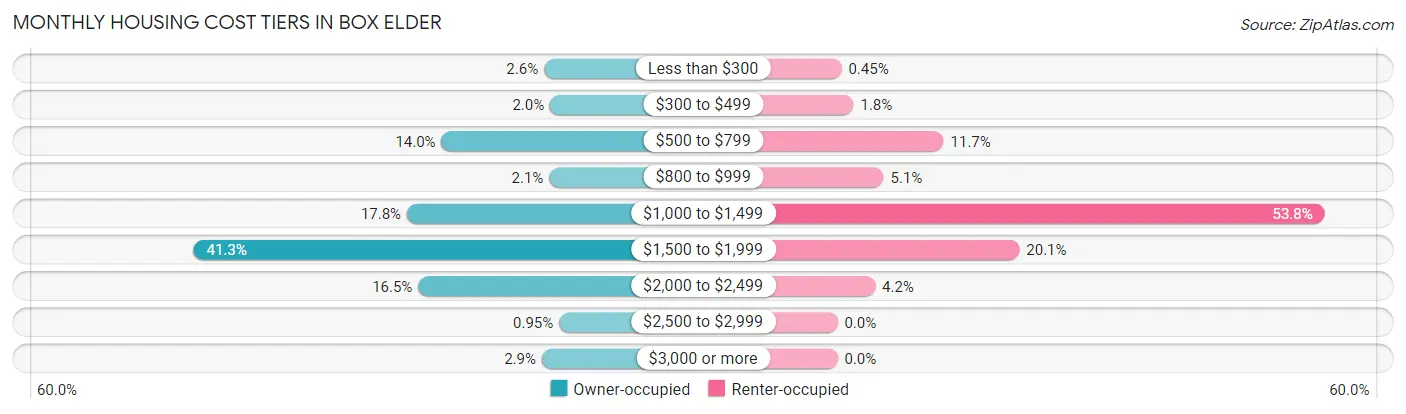
| Monthly Cost | Owner-occupied | Renter-occupied |
| Less than $300 | 55 (2.6%) | 9 (0.4%) |
| $300 to $499 | 41 (1.9%) | 36 (1.8%) |
| $500 to $799 | 293 (14.0%) | 237 (11.7%) |
| $800 to $999 | 43 (2.1%) | 103 (5.1%) |
| $1,000 to $1,499 | 373 (17.8%) | 1,087 (53.8%) |
| $1,500 to $1,999 | 868 (41.3%) | 406 (20.1%) |
| $2,000 to $2,499 | 347 (16.5%) | 84 (4.2%) |
| $2,500 to $2,999 | 20 (0.9%) | 0 (0.0%) |
| $3,000 or more | 60 (2.9%) | 0 (0.0%) |
| Total | 2,100 (100.0%) | 2,020 (100.0%) |
Physical Housing Characteristics in Box Elder
Housing Structures in Box Elder
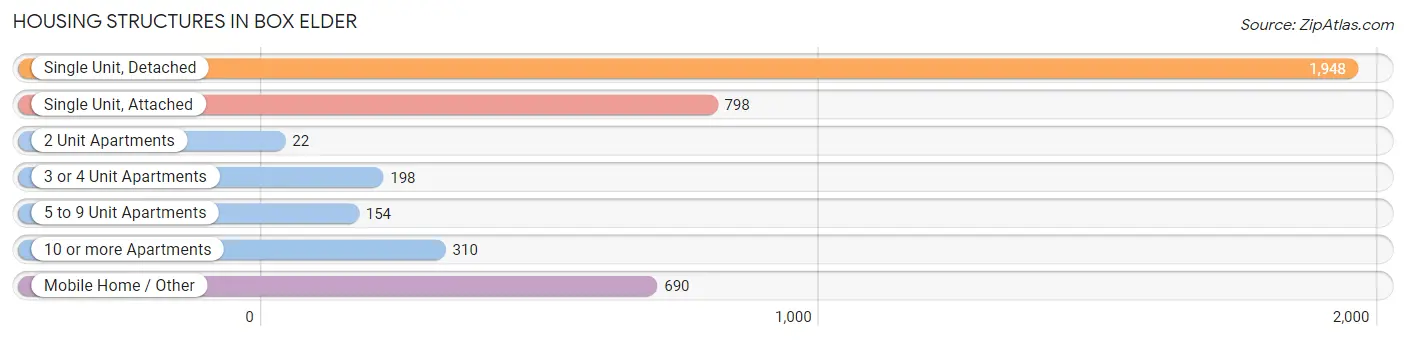
| Structure Type | # Housing Units | % Housing Units |
| Single Unit, Detached | 1,948 | 47.3% |
| Single Unit, Attached | 798 | 19.4% |
| 2 Unit Apartments | 22 | 0.5% |
| 3 or 4 Unit Apartments | 198 | 4.8% |
| 5 to 9 Unit Apartments | 154 | 3.7% |
| 10 or more Apartments | 310 | 7.5% |
| Mobile Home / Other | 690 | 16.8% |
| Total | 4,120 | 100.0% |
Housing Structures by Occupancy in Box Elder
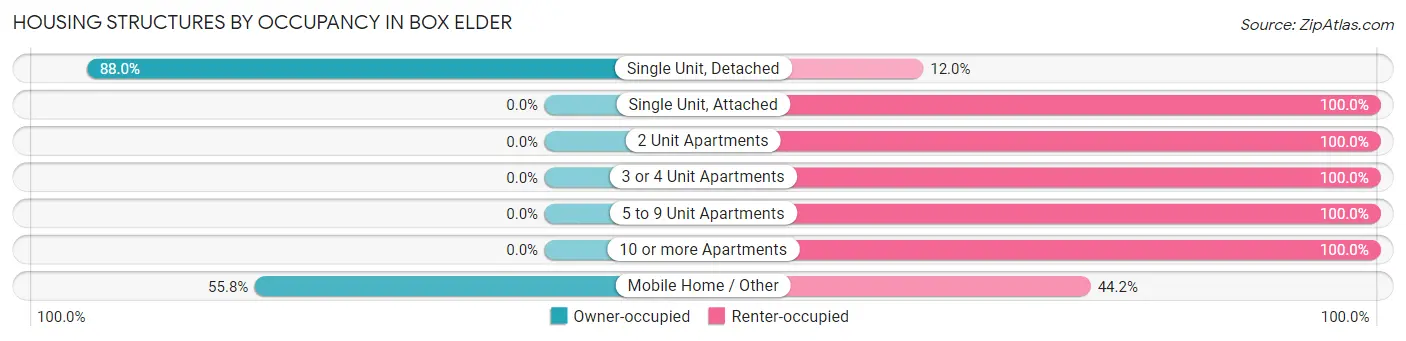
| Structure Type | Owner-occupied | Renter-occupied |
| Single Unit, Detached | 1,715 (88.0%) | 233 (12.0%) |
| Single Unit, Attached | 0 (0.0%) | 798 (100.0%) |
| 2 Unit Apartments | 0 (0.0%) | 22 (100.0%) |
| 3 or 4 Unit Apartments | 0 (0.0%) | 198 (100.0%) |
| 5 to 9 Unit Apartments | 0 (0.0%) | 154 (100.0%) |
| 10 or more Apartments | 0 (0.0%) | 310 (100.0%) |
| Mobile Home / Other | 385 (55.8%) | 305 (44.2%) |
| Total | 2,100 (51.0%) | 2,020 (49.0%) |
Housing Structures by Number of Rooms in Box Elder
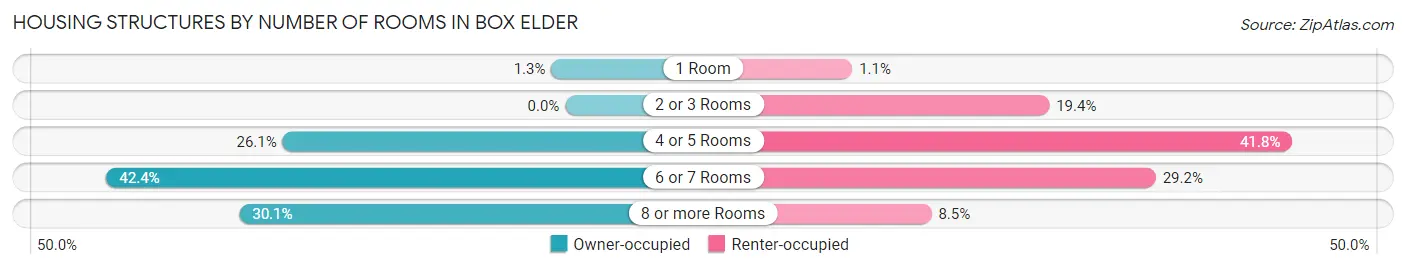
| Number of Rooms | Owner-occupied | Renter-occupied |
| 1 Room | 27 (1.3%) | 23 (1.1%) |
| 2 or 3 Rooms | 0 (0.0%) | 391 (19.4%) |
| 4 or 5 Rooms | 549 (26.1%) | 845 (41.8%) |
| 6 or 7 Rooms | 891 (42.4%) | 590 (29.2%) |
| 8 or more Rooms | 633 (30.1%) | 171 (8.5%) |
| Total | 2,100 (100.0%) | 2,020 (100.0%) |
Housing Structure by Heating Type in Box Elder
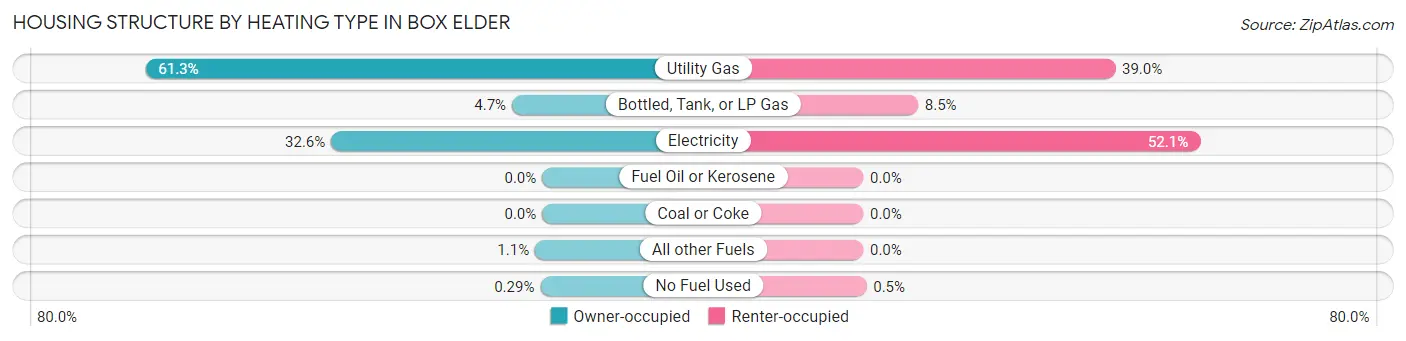
| Heating Type | Owner-occupied | Renter-occupied |
| Utility Gas | 1,288 (61.3%) | 787 (39.0%) |
| Bottled, Tank, or LP Gas | 98 (4.7%) | 171 (8.5%) |
| Electricity | 685 (32.6%) | 1,052 (52.1%) |
| Fuel Oil or Kerosene | 0 (0.0%) | 0 (0.0%) |
| Coal or Coke | 0 (0.0%) | 0 (0.0%) |
| All other Fuels | 23 (1.1%) | 0 (0.0%) |
| No Fuel Used | 6 (0.3%) | 10 (0.5%) |
| Total | 2,100 (100.0%) | 2,020 (100.0%) |
Household Vehicle Usage in Box Elder
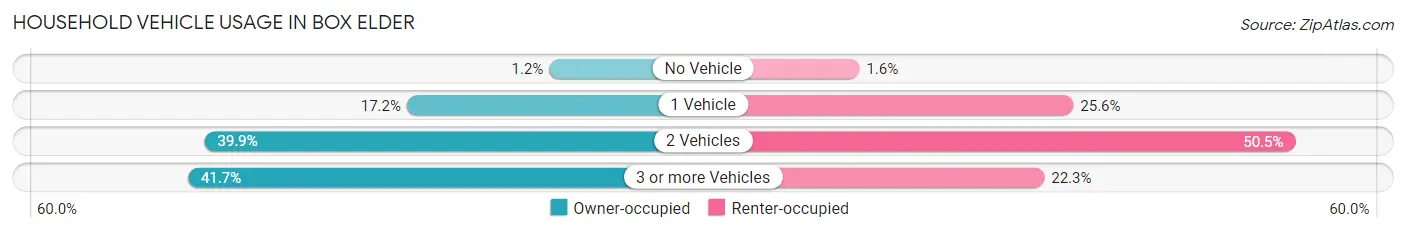
| Vehicles per Household | Owner-occupied | Renter-occupied |
| No Vehicle | 26 (1.2%) | 33 (1.6%) |
| 1 Vehicle | 361 (17.2%) | 517 (25.6%) |
| 2 Vehicles | 837 (39.9%) | 1,019 (50.4%) |
| 3 or more Vehicles | 876 (41.7%) | 451 (22.3%) |
| Total | 2,100 (100.0%) | 2,020 (100.0%) |
Real Estate & Mortgages in Box Elder
Real Estate and Mortgage Overview in Box Elder
| Characteristic | Without Mortgage | With Mortgage |
| Housing Units | 439 | 1,661 |
| Median Property Value | $179,000 | $277,800 |
| Median Household Income | $44,954 | $501 |
| Monthly Housing Costs | $681 | $60 |
| Real Estate Taxes | $2,583 | $0 |
Property Value by Mortgage Status in Box Elder
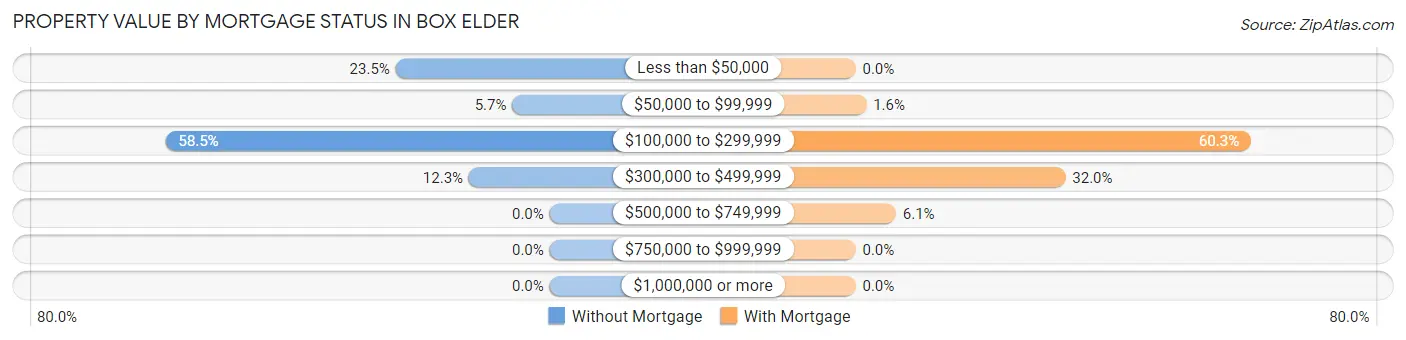
| Property Value | Without Mortgage | With Mortgage |
| Less than $50,000 | 103 (23.5%) | 0 (0.0%) |
| $50,000 to $99,999 | 25 (5.7%) | 27 (1.6%) |
| $100,000 to $299,999 | 257 (58.5%) | 1,001 (60.3%) |
| $300,000 to $499,999 | 54 (12.3%) | 531 (32.0%) |
| $500,000 to $749,999 | 0 (0.0%) | 102 (6.1%) |
| $750,000 to $999,999 | 0 (0.0%) | 0 (0.0%) |
| $1,000,000 or more | 0 (0.0%) | 0 (0.0%) |
| Total | 439 (100.0%) | 1,661 (100.0%) |
Household Income by Mortgage Status in Box Elder
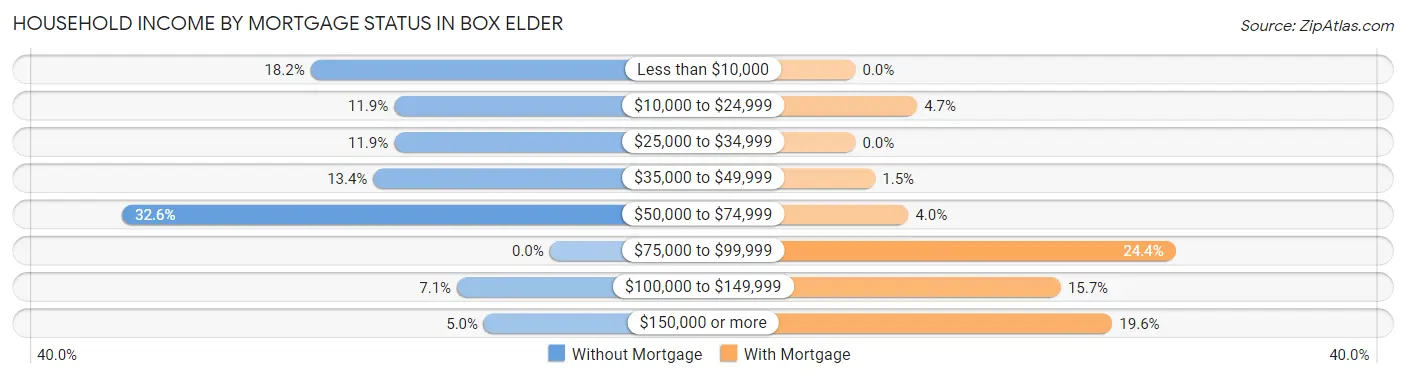
| Household Income | Without Mortgage | With Mortgage |
| Less than $10,000 | 80 (18.2%) | 0 (0.0%) |
| $10,000 to $24,999 | 52 (11.8%) | 78 (4.7%) |
| $25,000 to $34,999 | 52 (11.8%) | 0 (0.0%) |
| $35,000 to $49,999 | 59 (13.4%) | 25 (1.5%) |
| $50,000 to $74,999 | 143 (32.6%) | 67 (4.0%) |
| $75,000 to $99,999 | 0 (0.0%) | 405 (24.4%) |
| $100,000 to $149,999 | 31 (7.1%) | 260 (15.7%) |
| $150,000 or more | 22 (5.0%) | 325 (19.6%) |
| Total | 439 (100.0%) | 1,661 (100.0%) |
Property Value to Household Income Ratio in Box Elder
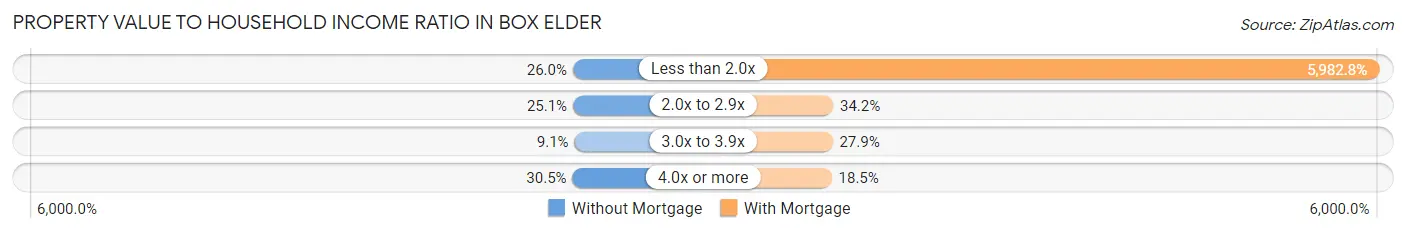
| Value-to-Income Ratio | Without Mortgage | With Mortgage |
| Less than 2.0x | 114 (26.0%) | 99,375 (5,982.8%) |
| 2.0x to 2.9x | 110 (25.1%) | 568 (34.2%) |
| 3.0x to 3.9x | 40 (9.1%) | 464 (27.9%) |
| 4.0x or more | 134 (30.5%) | 307 (18.5%) |
| Total | 439 (100.0%) | 1,661 (100.0%) |
Real Estate Taxes by Mortgage Status in Box Elder
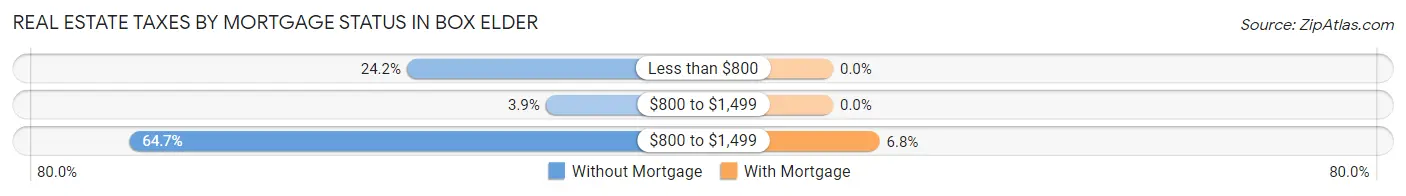
| Property Taxes | Without Mortgage | With Mortgage |
| Less than $800 | 106 (24.1%) | 0 (0.0%) |
| $800 to $1,499 | 17 (3.9%) | 0 (0.0%) |
| $800 to $1,499 | 284 (64.7%) | 113 (6.8%) |
| Total | 439 (100.0%) | 1,661 (100.0%) |
Health & Disability in Box Elder
Health Insurance Coverage by Age in Box Elder
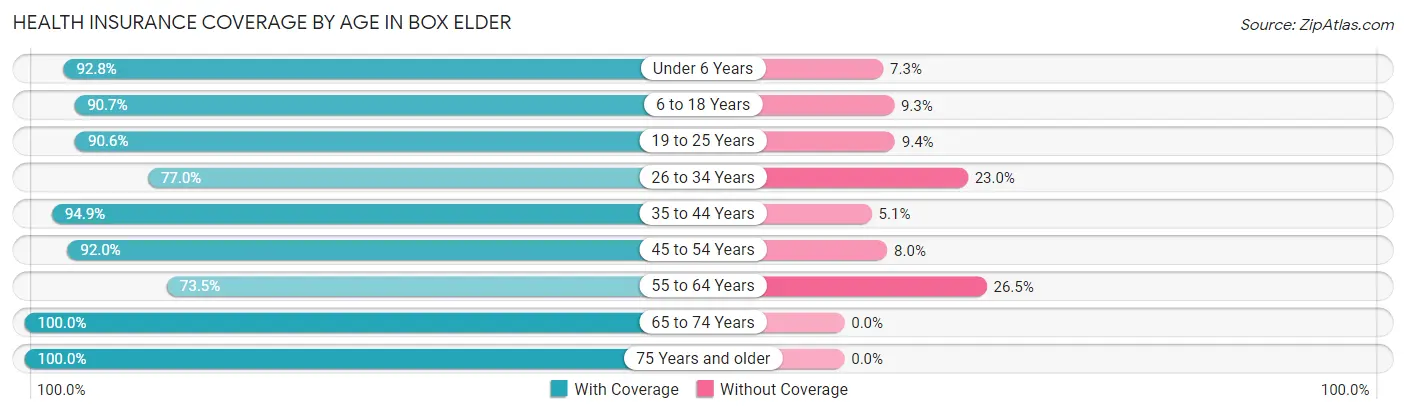
| Age Bracket | With Coverage | Without Coverage |
| Under 6 Years | 1,088 (92.7%) | 85 (7.2%) |
| 6 to 18 Years | 1,714 (90.7%) | 175 (9.3%) |
| 19 to 25 Years | 1,365 (90.6%) | 142 (9.4%) |
| 26 to 34 Years | 1,666 (77.0%) | 498 (23.0%) |
| 35 to 44 Years | 1,024 (94.9%) | 55 (5.1%) |
| 45 to 54 Years | 967 (92.0%) | 84 (8.0%) |
| 55 to 64 Years | 817 (73.5%) | 295 (26.5%) |
| 65 to 74 Years | 467 (100.0%) | 0 (0.0%) |
| 75 Years and older | 334 (100.0%) | 0 (0.0%) |
| Total | 9,442 (87.6%) | 1,334 (12.4%) |
Health Insurance Coverage by Citizenship Status in Box Elder
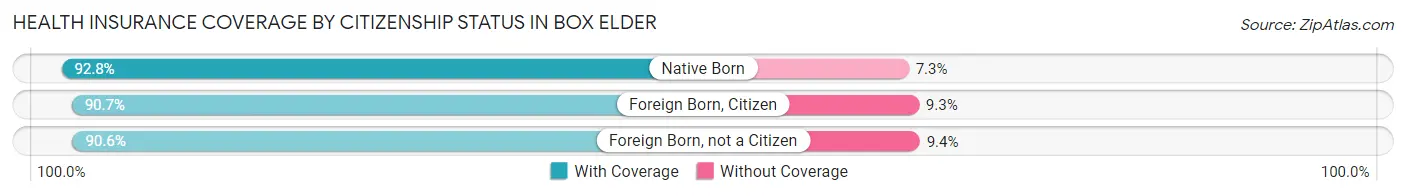
| Citizenship Status | With Coverage | Without Coverage |
| Native Born | 1,088 (92.7%) | 85 (7.2%) |
| Foreign Born, Citizen | 1,714 (90.7%) | 175 (9.3%) |
| Foreign Born, not a Citizen | 1,365 (90.6%) | 142 (9.4%) |
Health Insurance Coverage by Household Income in Box Elder
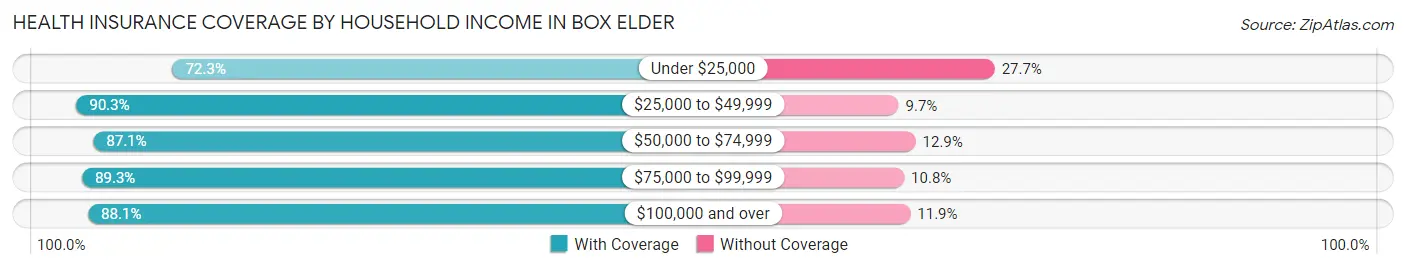
| Household Income | With Coverage | Without Coverage |
| Under $25,000 | 394 (72.3%) | 151 (27.7%) |
| $25,000 to $49,999 | 1,424 (90.3%) | 153 (9.7%) |
| $50,000 to $74,999 | 2,054 (87.1%) | 304 (12.9%) |
| $75,000 to $99,999 | 1,835 (89.2%) | 221 (10.7%) |
| $100,000 and over | 3,735 (88.1%) | 505 (11.9%) |
Public vs Private Health Insurance Coverage by Age in Box Elder
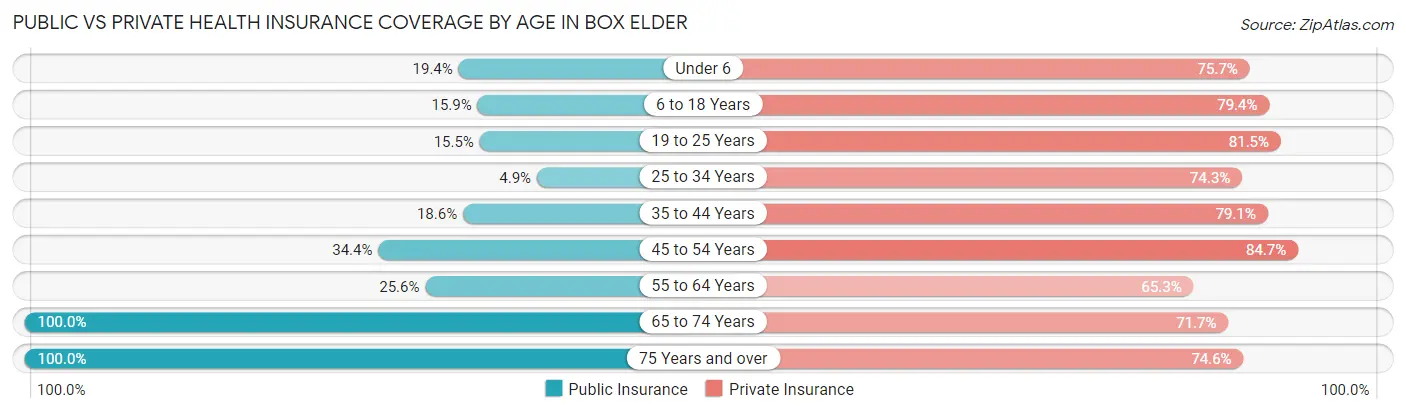
| Age Bracket | Public Insurance | Private Insurance |
| Under 6 | 228 (19.4%) | 888 (75.7%) |
| 6 to 18 Years | 301 (15.9%) | 1,499 (79.3%) |
| 19 to 25 Years | 234 (15.5%) | 1,228 (81.5%) |
| 25 to 34 Years | 106 (4.9%) | 1,608 (74.3%) |
| 35 to 44 Years | 201 (18.6%) | 853 (79.0%) |
| 45 to 54 Years | 361 (34.4%) | 890 (84.7%) |
| 55 to 64 Years | 285 (25.6%) | 726 (65.3%) |
| 65 to 74 Years | 467 (100.0%) | 335 (71.7%) |
| 75 Years and over | 334 (100.0%) | 249 (74.6%) |
| Total | 2,517 (23.4%) | 8,276 (76.8%) |
Disability Status by Sex by Age in Box Elder
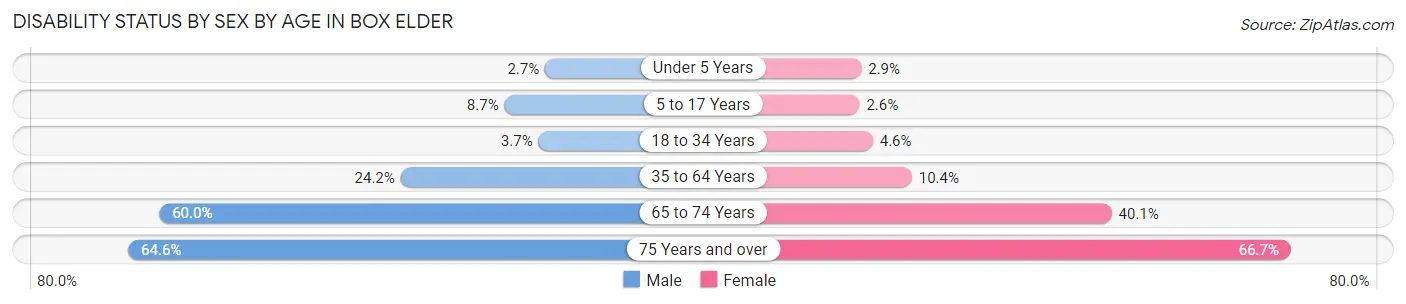
| Age Bracket | Male | Female |
| Under 5 Years | 15 (2.7%) | 12 (2.9%) |
| 5 to 17 Years | 71 (8.7%) | 31 (2.6%) |
| 18 to 34 Years | 63 (3.7%) | 95 (4.6%) |
| 35 to 64 Years | 493 (24.2%) | 125 (10.4%) |
| 65 to 74 Years | 87 (60.0%) | 129 (40.1%) |
| 75 Years and over | 84 (64.6%) | 136 (66.7%) |
Disability Class by Sex by Age in Box Elder
Disability Class: Hearing Difficulty
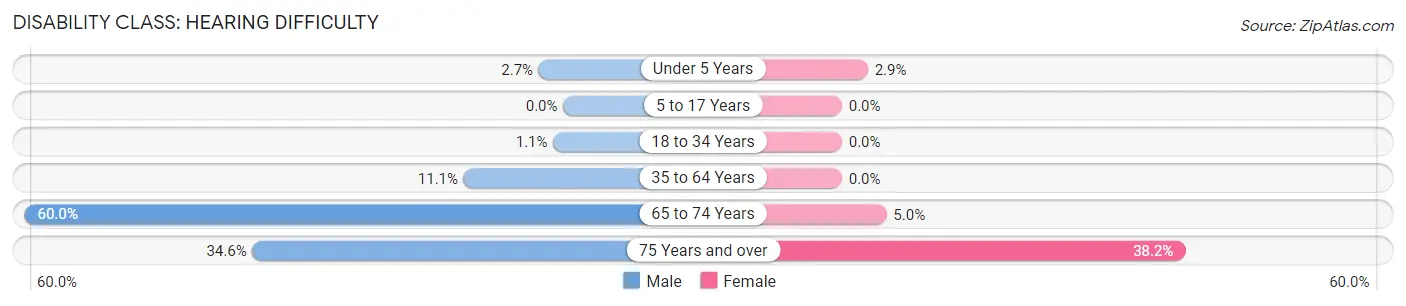
| Age Bracket | Male | Female |
| Under 5 Years | 15 (2.7%) | 12 (2.9%) |
| 5 to 17 Years | 0 (0.0%) | 0 (0.0%) |
| 18 to 34 Years | 19 (1.1%) | 0 (0.0%) |
| 35 to 64 Years | 226 (11.1%) | 0 (0.0%) |
| 65 to 74 Years | 87 (60.0%) | 16 (5.0%) |
| 75 Years and over | 45 (34.6%) | 78 (38.2%) |
Disability Class: Vision Difficulty
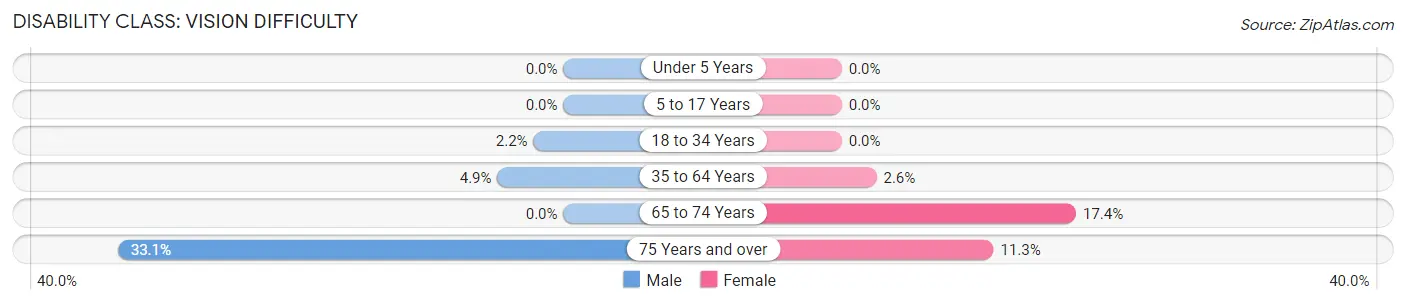
| Age Bracket | Male | Female |
| Under 5 Years | 0 (0.0%) | 0 (0.0%) |
| 5 to 17 Years | 0 (0.0%) | 0 (0.0%) |
| 18 to 34 Years | 38 (2.2%) | 0 (0.0%) |
| 35 to 64 Years | 100 (4.9%) | 31 (2.6%) |
| 65 to 74 Years | 0 (0.0%) | 56 (17.4%) |
| 75 Years and over | 43 (33.1%) | 23 (11.3%) |
Disability Class: Cognitive Difficulty
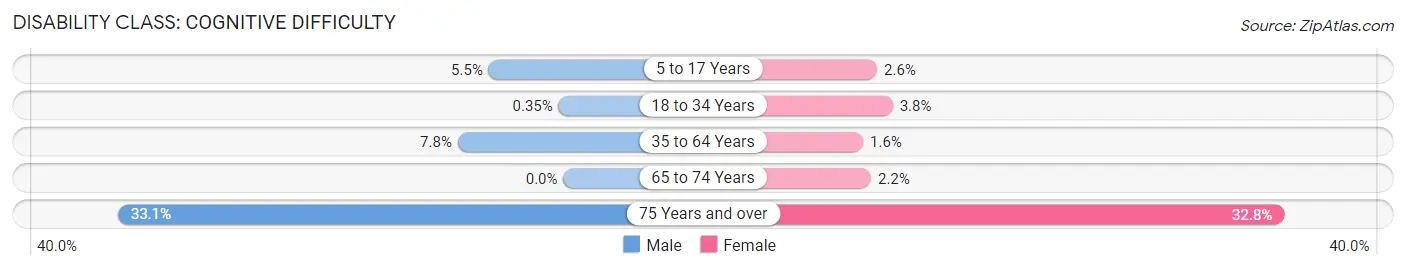
| Age Bracket | Male | Female |
| 5 to 17 Years | 45 (5.5%) | 31 (2.6%) |
| 18 to 34 Years | 6 (0.4%) | 78 (3.8%) |
| 35 to 64 Years | 160 (7.8%) | 19 (1.6%) |
| 65 to 74 Years | 0 (0.0%) | 7 (2.2%) |
| 75 Years and over | 43 (33.1%) | 67 (32.8%) |
Disability Class: Ambulatory Difficulty
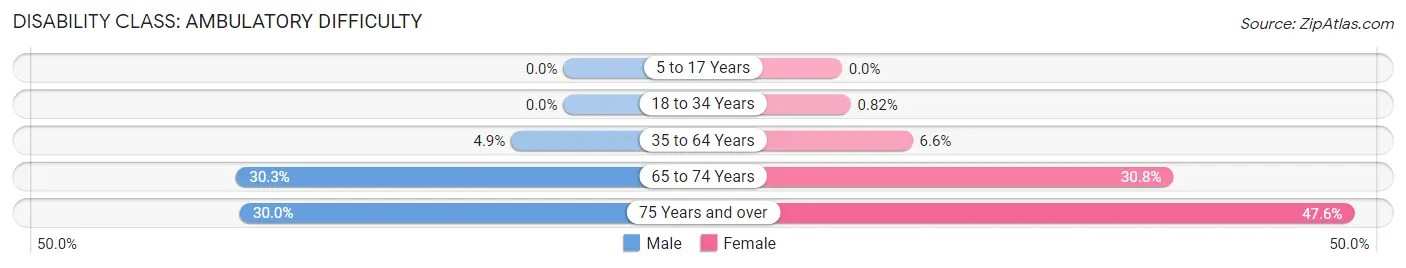
| Age Bracket | Male | Female |
| 5 to 17 Years | 0 (0.0%) | 0 (0.0%) |
| 18 to 34 Years | 0 (0.0%) | 17 (0.8%) |
| 35 to 64 Years | 99 (4.9%) | 79 (6.6%) |
| 65 to 74 Years | 44 (30.3%) | 99 (30.7%) |
| 75 Years and over | 39 (30.0%) | 97 (47.5%) |
Disability Class: Self-Care Difficulty
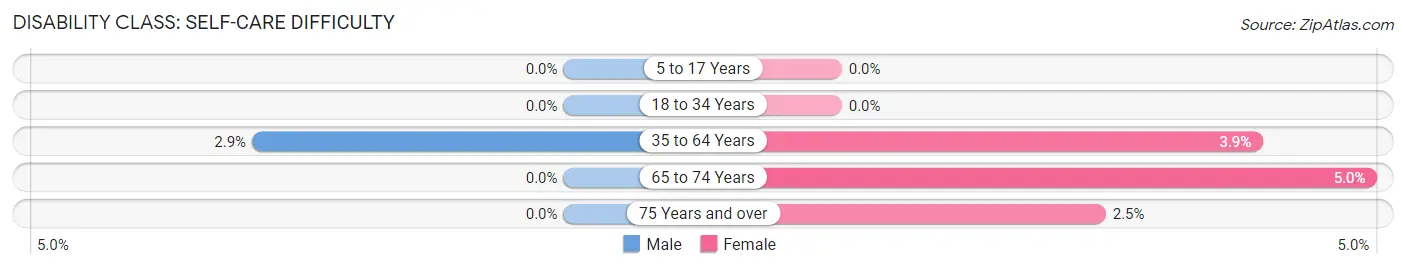
| Age Bracket | Male | Female |
| 5 to 17 Years | 0 (0.0%) | 0 (0.0%) |
| 18 to 34 Years | 0 (0.0%) | 0 (0.0%) |
| 35 to 64 Years | 59 (2.9%) | 47 (3.9%) |
| 65 to 74 Years | 0 (0.0%) | 16 (5.0%) |
| 75 Years and over | 0 (0.0%) | 5 (2.5%) |
Technology Access in Box Elder
Computing Device Access in Box Elder
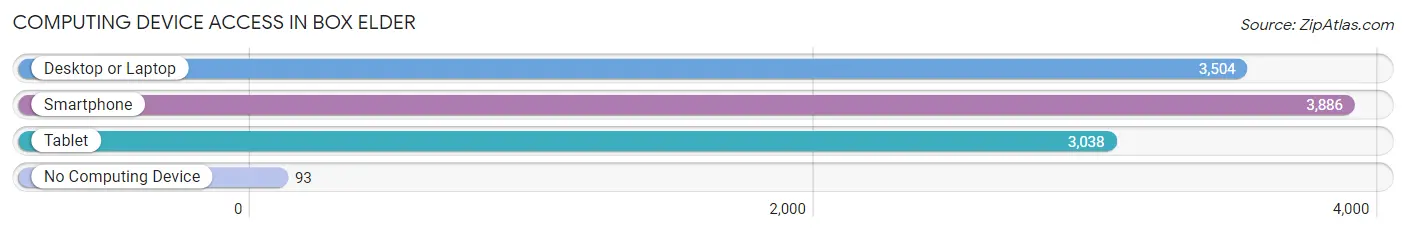
| Device Type | # Households | % Households |
| Desktop or Laptop | 3,504 | 85.1% |
| Smartphone | 3,886 | 94.3% |
| Tablet | 3,038 | 73.7% |
| No Computing Device | 93 | 2.3% |
| Total | 4,120 | 100.0% |
Internet Access in Box Elder
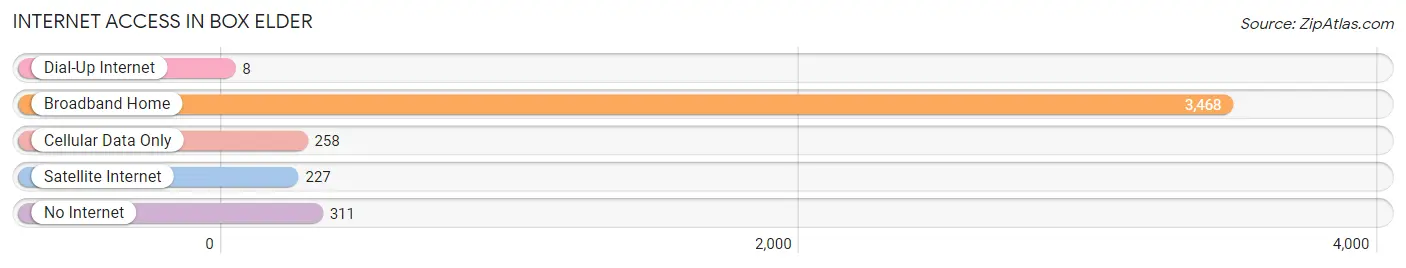
| Internet Type | # Households | % Households |
| Dial-Up Internet | 8 | 0.2% |
| Broadband Home | 3,468 | 84.2% |
| Cellular Data Only | 258 | 6.3% |
| Satellite Internet | 227 | 5.5% |
| No Internet | 311 | 7.5% |
| Total | 4,120 | 100.0% |
Box Elder Summary
History
Box Elder, South Dakota is a small city located in Pennington County, South Dakota. It is situated in the Black Hills region of the state, and is the county seat of Pennington County. The city was founded in 1876, and was named after the box elder trees that were found in the area. The city was originally a trading post for the Native Americans in the area, and was later used as a supply point for miners and settlers.
The city was incorporated in 1883, and the first mayor was elected in 1884. The city was a major hub for the mining industry in the late 19th and early 20th centuries, and was home to several large mines. The city also had a large lumber industry, and was home to several sawmills.
In the early 20th century, the city began to experience a decline in its mining and lumber industries, and the population began to decline. The city was hit hard by the Great Depression, and many of the businesses in the city closed. The city was able to recover in the 1940s and 1950s, and the population began to grow again.
The city experienced a boom in the 1960s and 1970s, as the city became a popular tourist destination. The city was home to several tourist attractions, including the Black Hills National Forest, Mount Rushmore, and the Crazy Horse Memorial. The city also became a popular destination for outdoor recreation, and the city was home to several ski resorts.
The city experienced a decline in the 1980s and 1990s, as the mining and lumber industries continued to decline. The city was also hit hard by the recession of the early 2000s, and the population began to decline again. The city has since recovered, and the population has been steadily increasing since the mid-2000s.
Geography
Box Elder is located in the Black Hills region of South Dakota, and is situated in Pennington County. The city is located at an elevation of 4,890 feet, and is located at the intersection of US Highway 16 and South Dakota Highway 79. The city is located approximately 25 miles east of Rapid City, and is located approximately 50 miles west of Pierre.
The city is located in a semi-arid climate, and experiences hot summers and cold winters. The average high temperature in the summer is around 85 degrees Fahrenheit, and the average low temperature in the winter is around 10 degrees Fahrenheit. The city receives an average of 16 inches of precipitation per year, and the average snowfall is around 30 inches per year.
Economy
The economy of Box Elder is largely based on tourism and outdoor recreation. The city is home to several tourist attractions, including the Black Hills National Forest, Mount Rushmore, and the Crazy Horse Memorial. The city is also home to several ski resorts, and is a popular destination for outdoor recreation.
The city is also home to several manufacturing companies, including a furniture manufacturer, a plastics manufacturer, and a metal fabrication company. The city is also home to several retail stores, restaurants, and other businesses.
Demographics
As of the 2010 census, the population of Box Elder was 2,945. The population is largely white, with a small percentage of Native American and African American residents. The median household income in the city is $41,944, and the median age is 39.7 years. The city has a poverty rate of 16.3%, and the unemployment rate is 4.2%.
Common Questions
What is Per Capita Income in Box Elder?
Per Capita income in Box Elder is $30,710.
What is the Median Family Income in Box Elder?
Median Family Income in Box Elder is $73,995.
What is the Median Household income in Box Elder?
Median Household Income in Box Elder is $71,532.
What is Income or Wage Gap in Box Elder?
Income or Wage Gap in Box Elder is 36.9%.
Women in Box Elder earn 63.1 cents for every dollar earned by a man.
What is Inequality or Gini Index in Box Elder?
Inequality or Gini Index in Box Elder is 0.36.
What is the Total Population of Box Elder?
Total Population of Box Elder is 11,905.
What is the Total Male Population of Box Elder?
Total Male Population of Box Elder is 6,374.
What is the Total Female Population of Box Elder?
Total Female Population of Box Elder is 5,531.
What is the Ratio of Males per 100 Females in Box Elder?
There are 115.24 Males per 100 Females in Box Elder.
What is the Ratio of Females per 100 Males in Box Elder?
There are 86.77 Females per 100 Males in Box Elder.
What is the Median Population Age in Box Elder?
Median Population Age in Box Elder is 28.6 Years.
What is the Average Family Size in Box Elder
Average Family Size in Box Elder is 3.2 People.
What is the Average Household Size in Box Elder
Average Household Size in Box Elder is 2.8 People.
How Large is the Labor Force in Box Elder?
There are 7,080 People in the Labor Forcein in Box Elder.
What is the Percentage of People in the Labor Force in Box Elder?
77.5% of People are in the Labor Force in Box Elder.
What is the Unemployment Rate in Box Elder?
Unemployment Rate in Box Elder is 5.0%.