Canton, SD Map & Demographics
Canton Map
Canton Overview
$43,803
PER CAPITA INCOME
$96,821
AVG FAMILY INCOME
$71,064
AVG HOUSEHOLD INCOME
38.6%
WAGE / INCOME GAP [ % ]
61.4¢/ $1
WAGE / INCOME GAP [ $ ]
0.44
INEQUALITY / GINI INDEX
3,060
TOTAL POPULATION
1,451
MALE POPULATION
1,609
FEMALE POPULATION
90.18
MALES / 100 FEMALES
110.89
FEMALES / 100 MALES
43.6
MEDIAN AGE
2.8
AVG FAMILY SIZE
2.1
AVG HOUSEHOLD SIZE
1,683
LABOR FORCE [ PEOPLE ]
69.9%
PERCENT IN LABOR FORCE
5.6%
UNEMPLOYMENT RATE
Canton Zip Codes
Canton Area Codes
Income in Canton
Income Overview in Canton
Per Capita Income in Canton is $43,803, while median incomes of families and households are $96,821 and $71,064 respectively.
| Characteristic | Number | Measure |
| Per Capita Income | 3,060 | $43,803 |
| Median Family Income | 791 | $96,821 |
| Mean Family Income | 791 | $125,811 |
| Median Household Income | 1,330 | $71,064 |
| Mean Household Income | 1,330 | $95,257 |
| Income Deficit | 791 | $0 |
| Wage / Income Gap (%) | 3,060 | 38.64% |
| Wage / Income Gap ($) | 3,060 | 61.36¢ per $1 |
| Gini / Inequality Index | 3,060 | 0.44 |
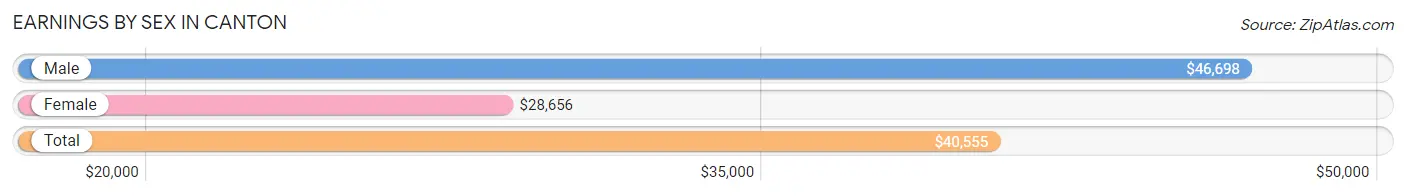
Earnings by Sex in Canton
Average Earnings in Canton are $40,555, $46,698 for men and $28,656 for women, a difference of 38.6%.
| Sex | Number | Average Earnings |
| Male | 936 (52.3%) | $46,698 |
| Female | 853 (47.7%) | $28,656 |
| Total | 1,789 (100.0%) | $40,555 |
Earnings by Sex by Income Bracket in Canton
The most common earnings brackets in Canton are $100,000+ for men (192 | 20.5%) and $40,000 to $44,999 for women (106 | 12.4%).
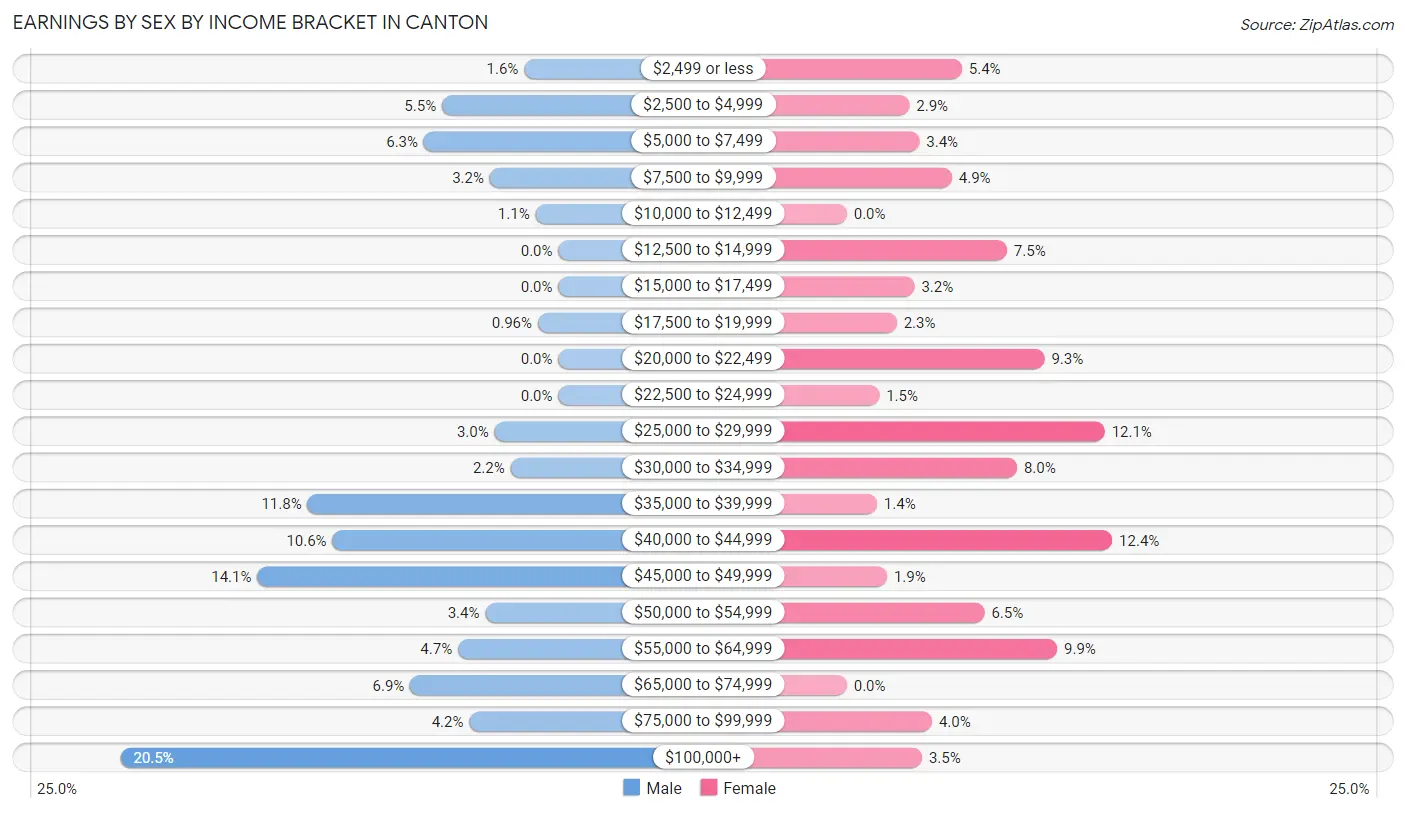
| Income | Male | Female |
| $2,499 or less | 15 (1.6%) | 46 (5.4%) |
| $2,500 to $4,999 | 51 (5.4%) | 25 (2.9%) |
| $5,000 to $7,499 | 59 (6.3%) | 29 (3.4%) |
| $7,500 to $9,999 | 30 (3.2%) | 42 (4.9%) |
| $10,000 to $12,499 | 10 (1.1%) | 0 (0.0%) |
| $12,500 to $14,999 | 0 (0.0%) | 64 (7.5%) |
| $15,000 to $17,499 | 0 (0.0%) | 27 (3.2%) |
| $17,500 to $19,999 | 9 (1.0%) | 20 (2.3%) |
| $20,000 to $22,499 | 0 (0.0%) | 79 (9.3%) |
| $22,500 to $24,999 | 0 (0.0%) | 13 (1.5%) |
| $25,000 to $29,999 | 28 (3.0%) | 103 (12.1%) |
| $30,000 to $34,999 | 21 (2.2%) | 68 (8.0%) |
| $35,000 to $39,999 | 110 (11.7%) | 12 (1.4%) |
| $40,000 to $44,999 | 99 (10.6%) | 106 (12.4%) |
| $45,000 to $49,999 | 132 (14.1%) | 16 (1.9%) |
| $50,000 to $54,999 | 32 (3.4%) | 55 (6.5%) |
| $55,000 to $64,999 | 44 (4.7%) | 84 (9.9%) |
| $65,000 to $74,999 | 65 (6.9%) | 0 (0.0%) |
| $75,000 to $99,999 | 39 (4.2%) | 34 (4.0%) |
| $100,000+ | 192 (20.5%) | 30 (3.5%) |
| Total | 936 (100.0%) | 853 (100.0%) |
Earnings by Sex by Educational Attainment in Canton
Average earnings in Canton are $47,429 for men and $31,500 for women, a difference of 33.6%. Men with an educational attainment of graduate degree enjoy the highest average annual earnings of $70,938, while those with high school diploma education earn the least with $44,196. Women with an educational attainment of bachelor's degree earn the most with the average annual earnings of $51,731, while those with less than high school education have the smallest earnings of $14,000.
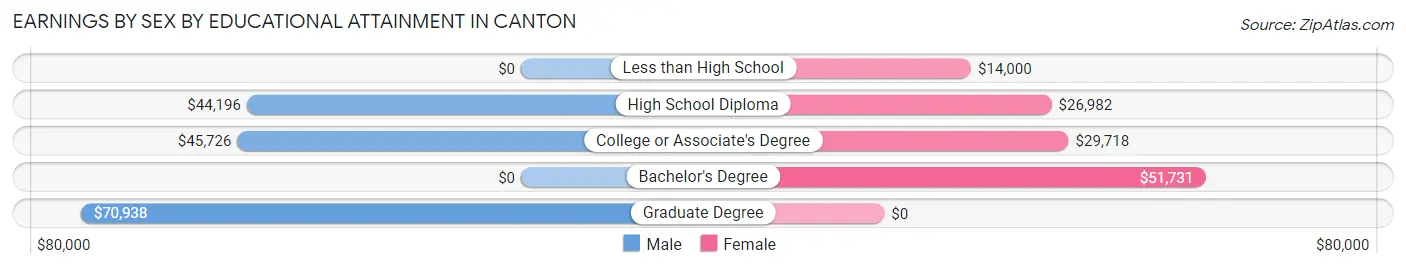
| Educational Attainment | Male Income | Female Income |
| Less than High School | - | - |
| High School Diploma | $44,196 | $26,982 |
| College or Associate's Degree | $45,726 | $29,718 |
| Bachelor's Degree | - | - |
| Graduate Degree | $70,938 | $0 |
| Total | $47,429 | $31,500 |
Family Income in Canton
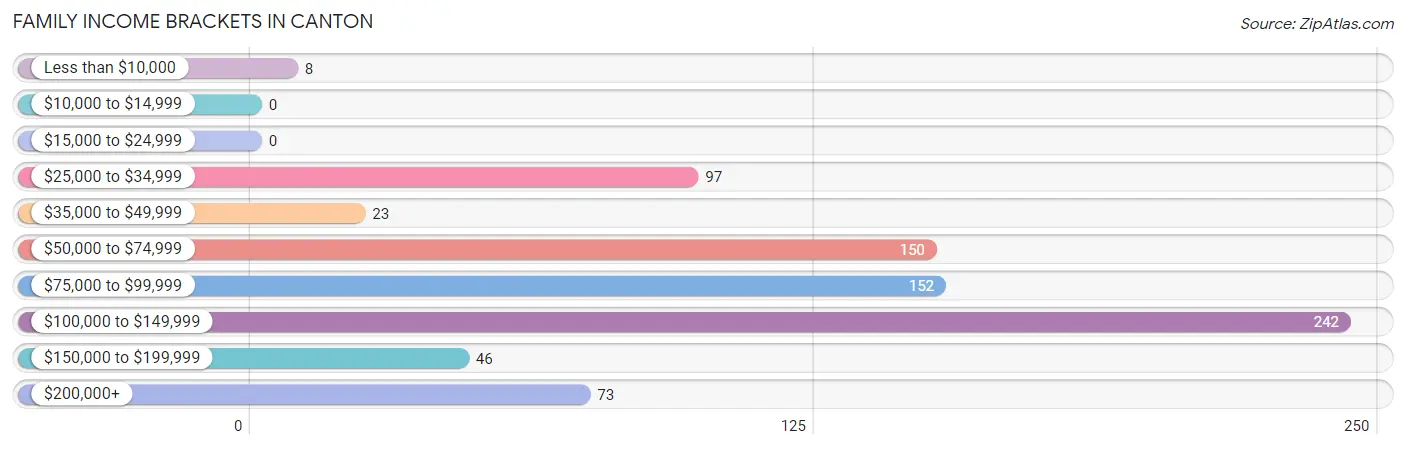
Family Income Brackets in Canton
According to the Canton family income data, there are 242 families falling into the $100,000 to $149,999 income range, which is the most common income bracket and makes up 30.6% of all families.
| Income Bracket | # Families | % Families |
| Less than $10,000 | 8 | 1.0% |
| $10,000 to $14,999 | 0 | 0.0% |
| $15,000 to $24,999 | 0 | 0.0% |
| $25,000 to $34,999 | 97 | 12.3% |
| $35,000 to $49,999 | 23 | 2.9% |
| $50,000 to $74,999 | 150 | 19.0% |
| $75,000 to $99,999 | 152 | 19.2% |
| $100,000 to $149,999 | 242 | 30.6% |
| $150,000 to $199,999 | 46 | 5.8% |
| $200,000+ | 73 | 9.2% |
Family Income by Famaliy Size in Canton
3-person families (245 | 31.0%) account for the highest median family income in Canton with $113,325 per family, while 2-person families (379 | 47.9%) have the highest median income of $45,404 per family member.
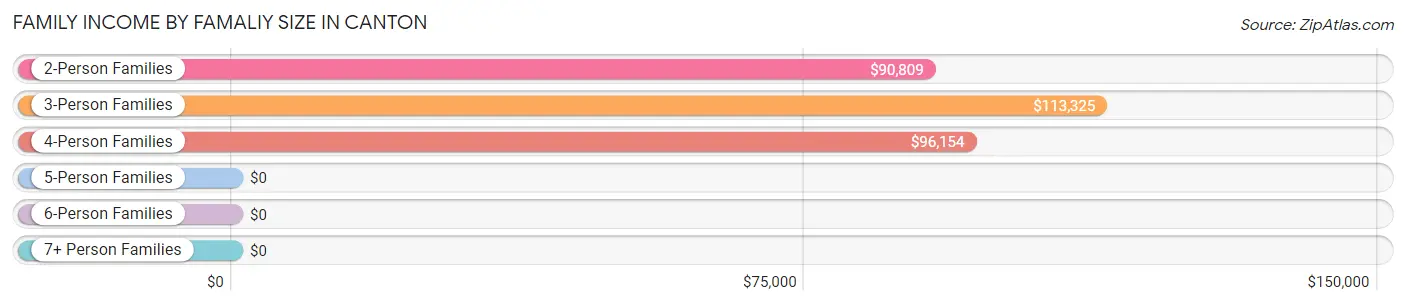
| Income Bracket | # Families | Median Income |
| 2-Person Families | 379 (47.9%) | $90,809 |
| 3-Person Families | 245 (31.0%) | $113,325 |
| 4-Person Families | 124 (15.7%) | $96,154 |
| 5-Person Families | 8 (1.0%) | $0 |
| 6-Person Families | 23 (2.9%) | $0 |
| 7+ Person Families | 12 (1.5%) | $0 |
| Total | 791 (100.0%) | $96,821 |
Family Income by Number of Earners in Canton
The median family income in Canton is $96,821, with families comprising 3+ earners (101) having the highest median family income of $139,464, while families with 1 earner (330) have the lowest median family income of $74,853, accounting for 12.8% and 41.7% of families, respectively.
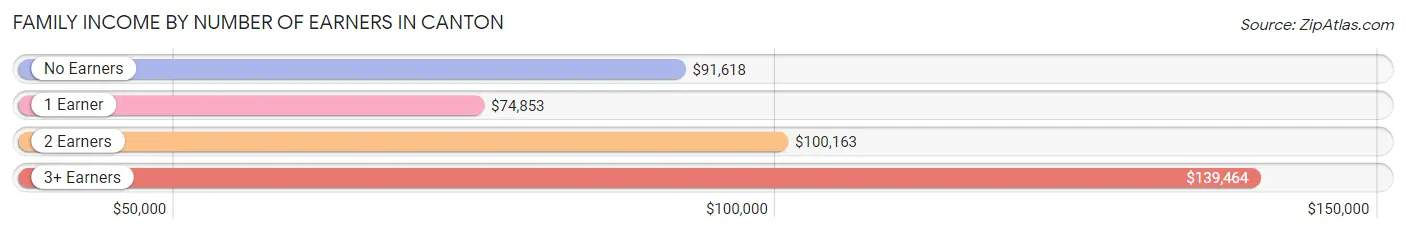
| Number of Earners | # Families | Median Income |
| No Earners | 40 (5.1%) | $91,618 |
| 1 Earner | 330 (41.7%) | $74,853 |
| 2 Earners | 320 (40.5%) | $100,163 |
| 3+ Earners | 101 (12.8%) | $139,464 |
| Total | 791 (100.0%) | $96,821 |
Household Income in Canton
Household Income Brackets in Canton
With 289 households falling in the category, the $50,000 to $74,999 income range is the most frequent in Canton, accounting for 21.7% of all households.
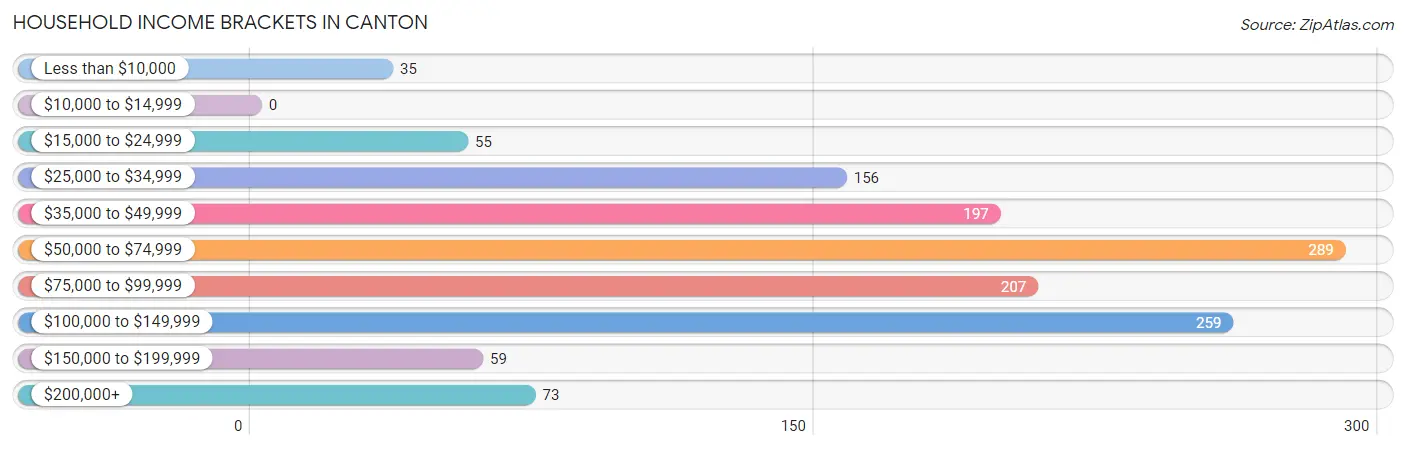
| Income Bracket | # Households | % Households |
| Less than $10,000 | 35 | 2.6% |
| $10,000 to $14,999 | 0 | 0.0% |
| $15,000 to $24,999 | 55 | 4.1% |
| $25,000 to $34,999 | 156 | 11.7% |
| $35,000 to $49,999 | 197 | 14.8% |
| $50,000 to $74,999 | 289 | 21.7% |
| $75,000 to $99,999 | 207 | 15.6% |
| $100,000 to $149,999 | 259 | 19.5% |
| $150,000 to $199,999 | 59 | 4.4% |
| $200,000+ | 73 | 5.5% |
Household Income by Householder Age in Canton
The median household income in Canton is $71,064, with the highest median household income of $96,731 found in the 25 to 44 years age bracket for the primary householder. A total of 394 households (29.6%) fall into this category. Meanwhile, the 65+ years age bracket for the primary householder has the lowest median household income of $52,455, with 481 households (36.2%) in this group.
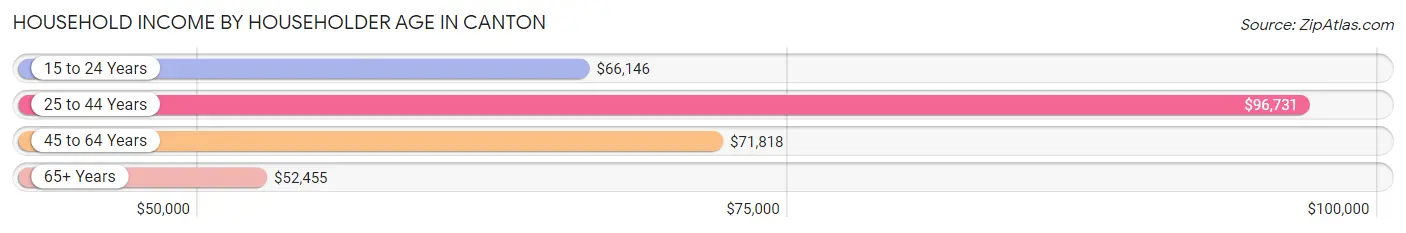
| Income Bracket | # Households | Median Income |
| 15 to 24 Years | 29 (2.2%) | $66,146 |
| 25 to 44 Years | 394 (29.6%) | $96,731 |
| 45 to 64 Years | 426 (32.0%) | $71,818 |
| 65+ Years | 481 (36.2%) | $52,455 |
| Total | 1,330 (100.0%) | $71,064 |
Poverty in Canton
Income Below Poverty by Sex and Age in Canton
With 7.4% poverty level for males and 7.4% for females among the residents of Canton, 45 to 54 year old males and under 5 year old females are the most vulnerable to poverty, with 60 males (34.1%) and 15 females (23.8%) in their respective age groups living below the poverty level.
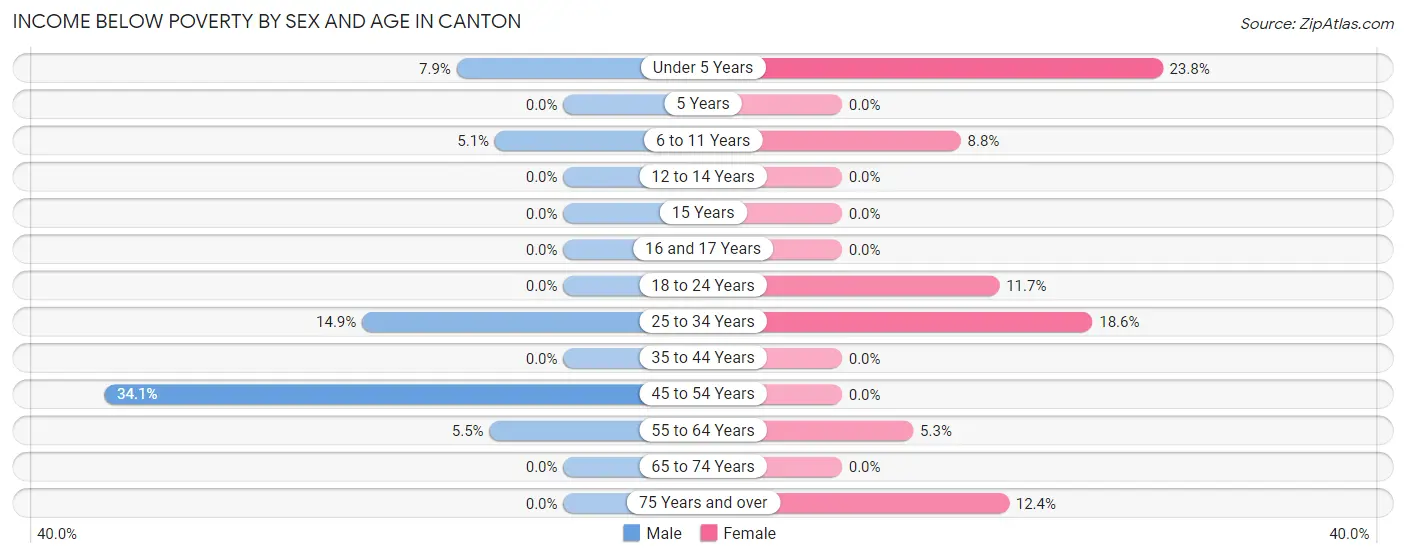
| Age Bracket | Male | Female |
| Under 5 Years | 8 (7.9%) | 15 (23.8%) |
| 5 Years | 0 (0.0%) | 0 (0.0%) |
| 6 to 11 Years | 6 (5.1%) | 9 (8.8%) |
| 12 to 14 Years | 0 (0.0%) | 0 (0.0%) |
| 15 Years | 0 (0.0%) | 0 (0.0%) |
| 16 and 17 Years | 0 (0.0%) | 0 (0.0%) |
| 18 to 24 Years | 0 (0.0%) | 9 (11.7%) |
| 25 to 34 Years | 13 (14.9%) | 45 (18.6%) |
| 35 to 44 Years | 0 (0.0%) | 0 (0.0%) |
| 45 to 54 Years | 60 (34.1%) | 0 (0.0%) |
| 55 to 64 Years | 19 (5.5%) | 8 (5.3%) |
| 65 to 74 Years | 0 (0.0%) | 0 (0.0%) |
| 75 Years and over | 0 (0.0%) | 30 (12.4%) |
| Total | 106 (7.4%) | 116 (7.4%) |
Income Above Poverty by Sex and Age in Canton
According to the poverty statistics in Canton, males aged 5 years and females aged 5 years are the age groups that are most secure financially, with 100.0% of males and 100.0% of females in these age groups living above the poverty line.
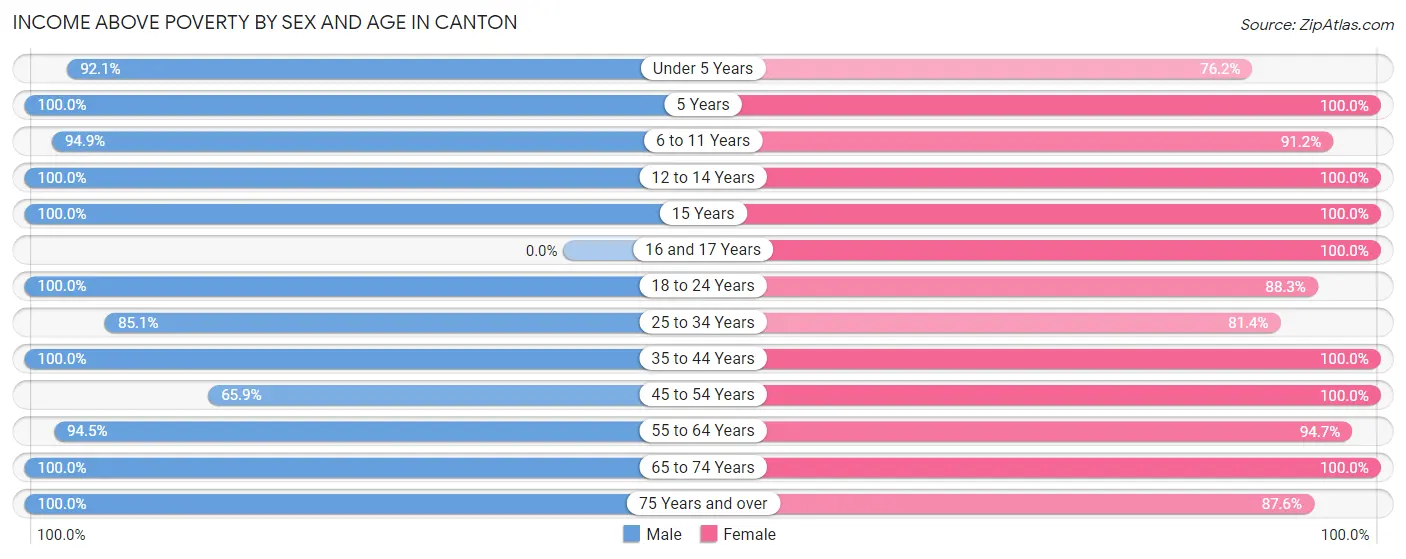
| Age Bracket | Male | Female |
| Under 5 Years | 93 (92.1%) | 48 (76.2%) |
| 5 Years | 29 (100.0%) | 26 (100.0%) |
| 6 to 11 Years | 112 (94.9%) | 93 (91.2%) |
| 12 to 14 Years | 98 (100.0%) | 97 (100.0%) |
| 15 Years | 7 (100.0%) | 11 (100.0%) |
| 16 and 17 Years | 0 (0.0%) | 74 (100.0%) |
| 18 to 24 Years | 31 (100.0%) | 68 (88.3%) |
| 25 to 34 Years | 74 (85.1%) | 197 (81.4%) |
| 35 to 44 Years | 220 (100.0%) | 168 (100.0%) |
| 45 to 54 Years | 116 (65.9%) | 94 (100.0%) |
| 55 to 64 Years | 327 (94.5%) | 143 (94.7%) |
| 65 to 74 Years | 110 (100.0%) | 226 (100.0%) |
| 75 Years and over | 103 (100.0%) | 212 (87.6%) |
| Total | 1,320 (92.6%) | 1,457 (92.6%) |
Income Below Poverty Among Married-Couple Families in Canton
The poverty statistics for married-couple families in Canton show that 1.6% or 9 of the total 566 families live below the poverty line. Families with 3 or 4 children have the highest poverty rate of 39.1%, comprising of 9 families. On the other hand, families with no children have the lowest poverty rate of 0.0%, which includes 0 families.
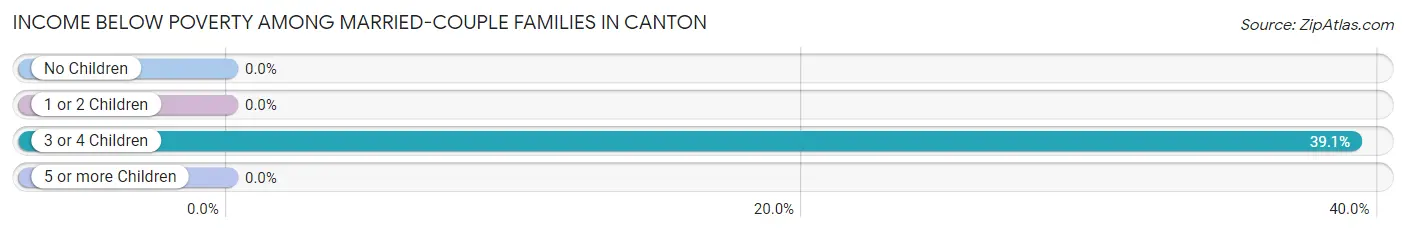
| Children | Above Poverty | Below Poverty |
| No Children | 310 (100.0%) | 0 (0.0%) |
| 1 or 2 Children | 221 (100.0%) | 0 (0.0%) |
| 3 or 4 Children | 14 (60.9%) | 9 (39.1%) |
| 5 or more Children | 12 (100.0%) | 0 (0.0%) |
| Total | 557 (98.4%) | 9 (1.6%) |
Income Below Poverty Among Single-Parent Households in Canton
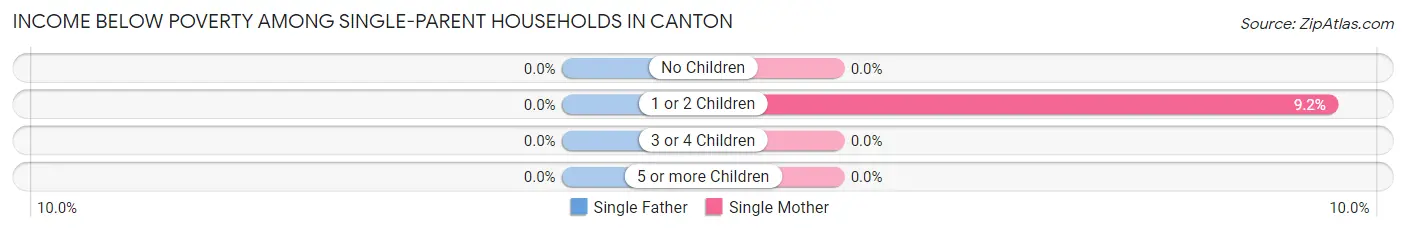
| Children | Single Father | Single Mother |
| No Children | 0 (0.0%) | 0 (0.0%) |
| 1 or 2 Children | 0 (0.0%) | 8 (9.2%) |
| 3 or 4 Children | 0 (0.0%) | 0 (0.0%) |
| 5 or more Children | 0 (0.0%) | 0 (0.0%) |
| Total | 0 (0.0%) | 8 (5.4%) |
Income Below Poverty Among Married-Couple vs Single-Parent Households in Canton
The poverty data for Canton shows that 9 of the married-couple family households (1.6%) and 8 of the single-parent households (3.6%) are living below the poverty level. Within the married-couple family households, those with 3 or 4 children have the highest poverty rate, with 9 households (39.1%) falling below the poverty line. Among the single-parent households, those with 1 or 2 children have the highest poverty rate, with 8 household (5.7%) living below poverty.
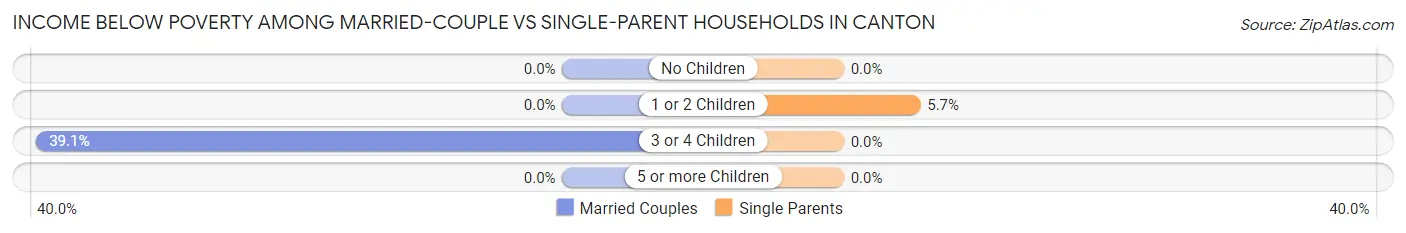
| Children | Married-Couple Families | Single-Parent Households |
| No Children | 0 (0.0%) | 0 (0.0%) |
| 1 or 2 Children | 0 (0.0%) | 8 (5.7%) |
| 3 or 4 Children | 9 (39.1%) | 0 (0.0%) |
| 5 or more Children | 0 (0.0%) | 0 (0.0%) |
| Total | 9 (1.6%) | 8 (3.6%) |
Race in Canton
The most populous races in Canton are White / Caucasian (2,859 | 93.4%), Two or more Races (139 | 4.5%), and Native / Alaskan (55 | 1.8%).
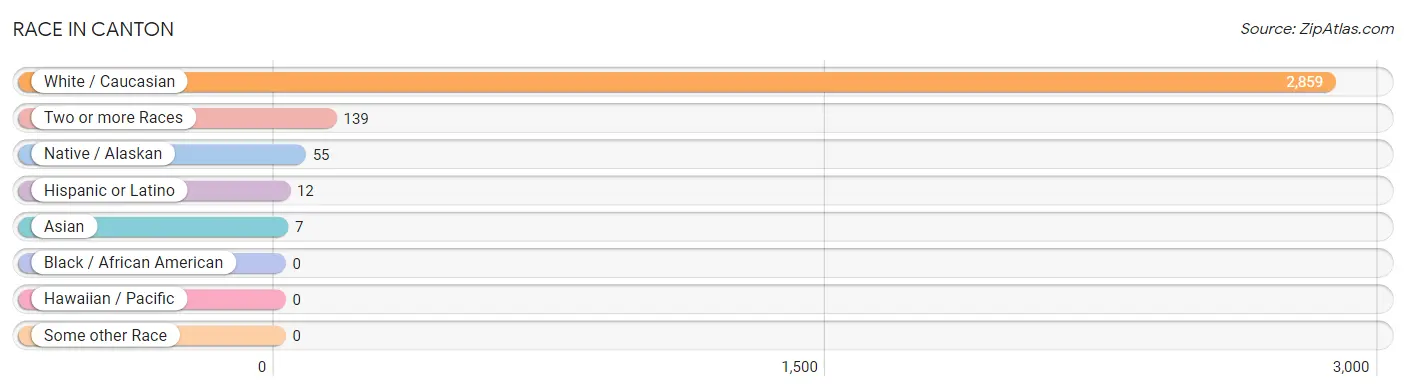
| Race | # Population | % Population |
| Asian | 7 | 0.2% |
| Black / African American | 0 | 0.0% |
| Hawaiian / Pacific | 0 | 0.0% |
| Hispanic or Latino | 12 | 0.4% |
| Native / Alaskan | 55 | 1.8% |
| White / Caucasian | 2,859 | 93.4% |
| Two or more Races | 139 | 4.5% |
| Some other Race | 0 | 0.0% |
| Total | 3,060 | 100.0% |
Ancestry in Canton
The most populous ancestries reported in Canton are German (998 | 32.6%), Norwegian (498 | 16.3%), American (482 | 15.8%), Dutch (232 | 7.6%), and Irish (141 | 4.6%), together accounting for 76.8% of all Canton residents.
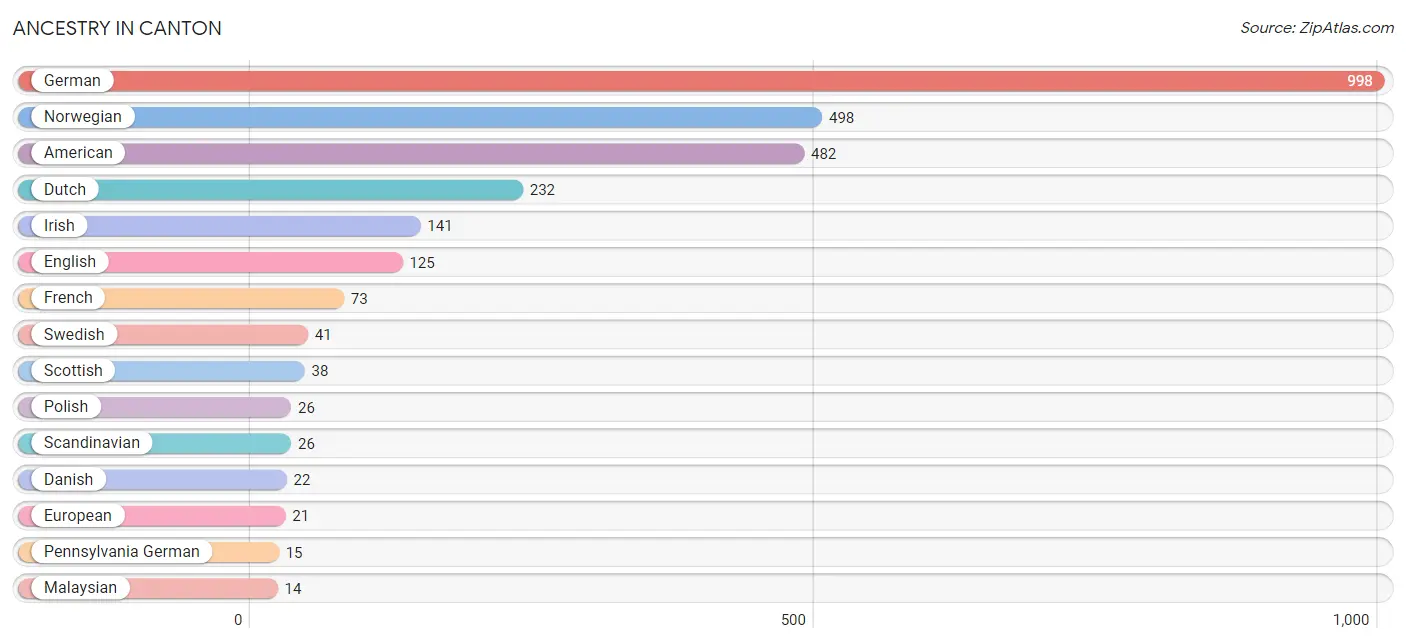
| Ancestry | # Population | % Population |
| American | 482 | 15.8% |
| Burmese | 7 | 0.2% |
| Cherokee | 6 | 0.2% |
| Croatian | 11 | 0.4% |
| Danish | 22 | 0.7% |
| Dutch | 232 | 7.6% |
| English | 125 | 4.1% |
| European | 21 | 0.7% |
| French | 73 | 2.4% |
| French Canadian | 13 | 0.4% |
| German | 998 | 32.6% |
| Irish | 141 | 4.6% |
| Malaysian | 14 | 0.5% |
| Mexican | 12 | 0.4% |
| Norwegian | 498 | 16.3% |
| Pennsylvania German | 15 | 0.5% |
| Polish | 26 | 0.9% |
| Russian | 11 | 0.4% |
| Scandinavian | 26 | 0.9% |
| Scotch-Irish | 12 | 0.4% |
| Scottish | 38 | 1.2% |
| Swedish | 41 | 1.3% |
| Welsh | 12 | 0.4% | View All 23 Rows |
Immigrants in Canton
The most numerous immigrant groups reported in Canton came from Canada (13 | 0.4%), Asia (7 | 0.2%), Eastern Asia (7 | 0.2%), and Korea (7 | 0.2%), together accounting for 1.1% of all Canton residents.
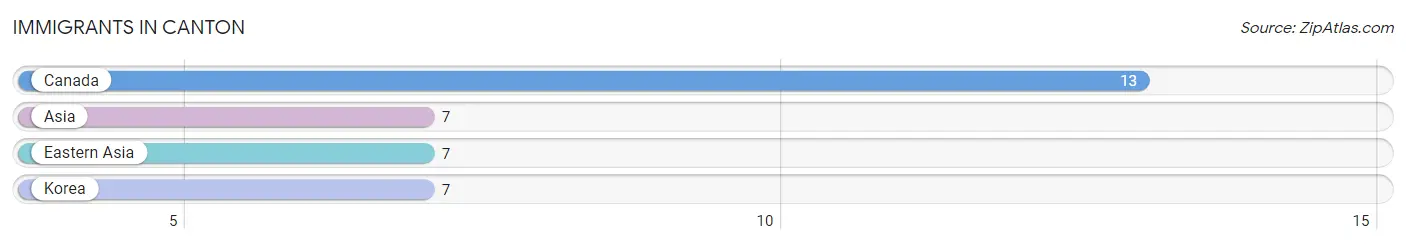
| Immigration Origin | # Population | % Population |
| Asia | 7 | 0.2% |
| Canada | 13 | 0.4% |
| Eastern Asia | 7 | 0.2% |
| Korea | 7 | 0.2% | View All 4 Rows |
Sex and Age in Canton
Sex and Age in Canton
The most populous age groups in Canton are 60 to 64 Years (192 | 13.2%) for men and 85 Years and over (158 | 9.8%) for women.
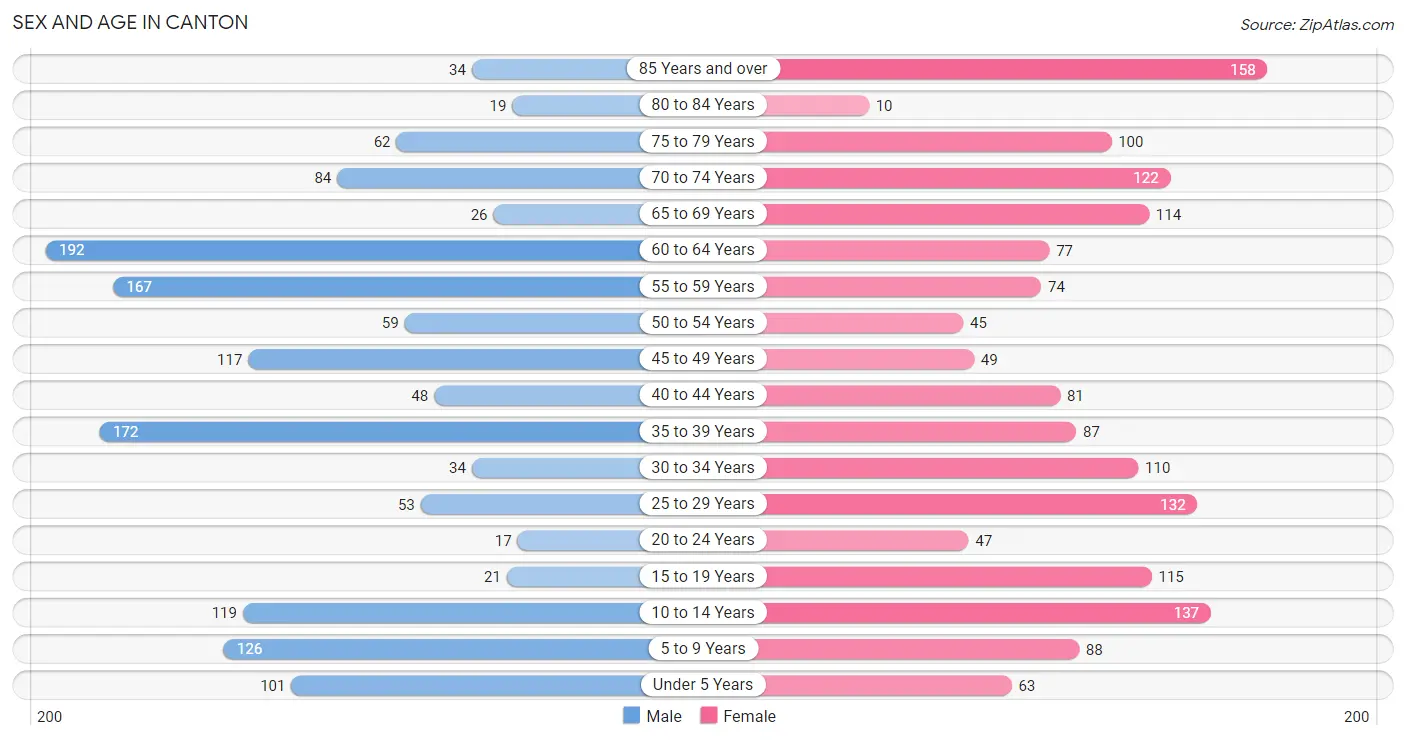
| Age Bracket | Male | Female |
| Under 5 Years | 101 (7.0%) | 63 (3.9%) |
| 5 to 9 Years | 126 (8.7%) | 88 (5.5%) |
| 10 to 14 Years | 119 (8.2%) | 137 (8.5%) |
| 15 to 19 Years | 21 (1.5%) | 115 (7.1%) |
| 20 to 24 Years | 17 (1.2%) | 47 (2.9%) |
| 25 to 29 Years | 53 (3.6%) | 132 (8.2%) |
| 30 to 34 Years | 34 (2.3%) | 110 (6.8%) |
| 35 to 39 Years | 172 (11.8%) | 87 (5.4%) |
| 40 to 44 Years | 48 (3.3%) | 81 (5.0%) |
| 45 to 49 Years | 117 (8.1%) | 49 (3.0%) |
| 50 to 54 Years | 59 (4.1%) | 45 (2.8%) |
| 55 to 59 Years | 167 (11.5%) | 74 (4.6%) |
| 60 to 64 Years | 192 (13.2%) | 77 (4.8%) |
| 65 to 69 Years | 26 (1.8%) | 114 (7.1%) |
| 70 to 74 Years | 84 (5.8%) | 122 (7.6%) |
| 75 to 79 Years | 62 (4.3%) | 100 (6.2%) |
| 80 to 84 Years | 19 (1.3%) | 10 (0.6%) |
| 85 Years and over | 34 (2.3%) | 158 (9.8%) |
| Total | 1,451 (100.0%) | 1,609 (100.0%) |
Families and Households in Canton
Median Family Size in Canton
The median family size in Canton is 2.82 persons per family, with married-couple families (566 | 71.6%) accounting for the largest median family size of 2.95 persons per family. On the other hand, single female/mother families (148 | 18.7%) represent the smallest median family size with 2.39 persons per family.
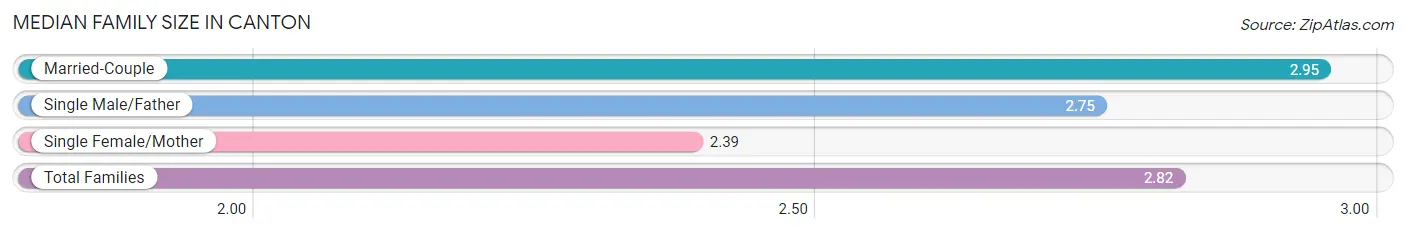
| Family Type | # Families | Family Size |
| Married-Couple | 566 (71.6%) | 2.95 |
| Single Male/Father | 77 (9.7%) | 2.75 |
| Single Female/Mother | 148 (18.7%) | 2.39 |
| Total Families | 791 (100.0%) | 2.82 |
Median Household Size in Canton
The median household size in Canton is 2.14 persons per household, with married-couple households (566 | 42.6%) accounting for the largest median household size of 2.95 persons per household. non-family households (539 | 40.5%) represent the smallest median household size with 1.12 persons per household.
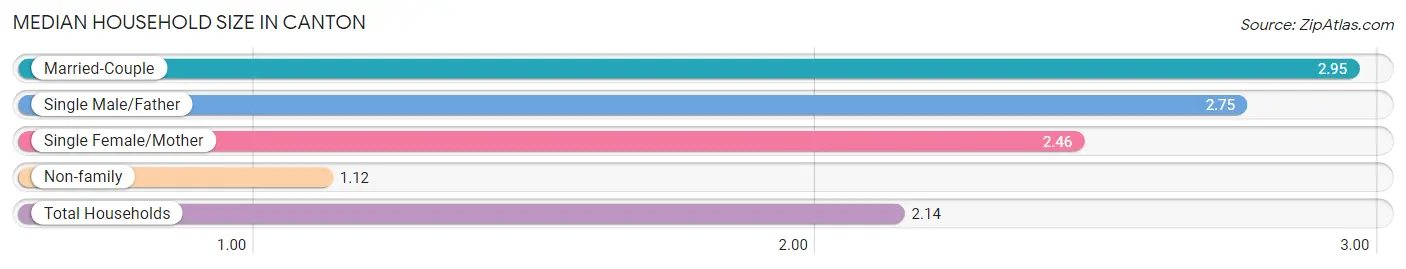
| Household Type | # Households | Household Size |
| Married-Couple | 566 (42.6%) | 2.95 |
| Single Male/Father | 77 (5.8%) | 2.75 |
| Single Female/Mother | 148 (11.1%) | 2.46 |
| Non-family | 539 (40.5%) | 1.12 |
| Total Households | 1,330 (100.0%) | 2.14 |
Household Size by Marriage Status in Canton
Out of a total of 1,330 households in Canton, 791 (59.5%) are family households, while 539 (40.5%) are nonfamily households. The most numerous type of family households are 2-person households, comprising 379, and the most common type of nonfamily households are 1-person households, comprising 484.
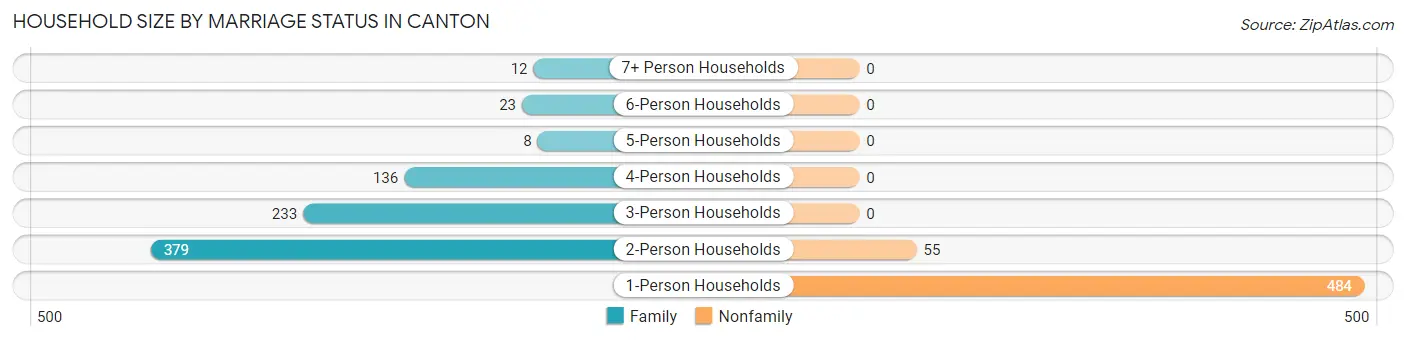
| Household Size | Family Households | Nonfamily Households |
| 1-Person Households | - | 484 (36.4%) |
| 2-Person Households | 379 (28.5%) | 55 (4.1%) |
| 3-Person Households | 233 (17.5%) | 0 (0.0%) |
| 4-Person Households | 136 (10.2%) | 0 (0.0%) |
| 5-Person Households | 8 (0.6%) | 0 (0.0%) |
| 6-Person Households | 23 (1.7%) | 0 (0.0%) |
| 7+ Person Households | 12 (0.9%) | 0 (0.0%) |
| Total | 791 (59.5%) | 539 (40.5%) |
Female Fertility in Canton
Fertility by Age in Canton
Average fertility rate in Canton is 31.0 births per 1,000 women. Women in the age bracket of 20 to 34 years have the highest fertility rate with 69.0 births per 1,000 women. Women in the age bracket of 20 to 34 years acount for 100.0% of all women with births.
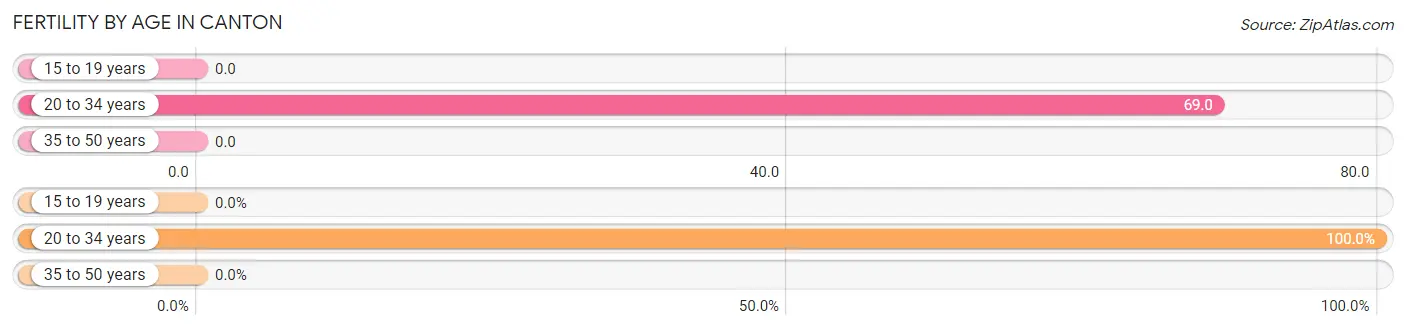
| Age Bracket | Women with Births | Births / 1,000 Women |
| 15 to 19 years | 0 (0.0%) | 0.0 |
| 20 to 34 years | 20 (100.0%) | 69.0 |
| 35 to 50 years | 0 (0.0%) | 0.0 |
| Total | 20 (100.0%) | 31.0 |
Fertility by Age by Marriage Status in Canton
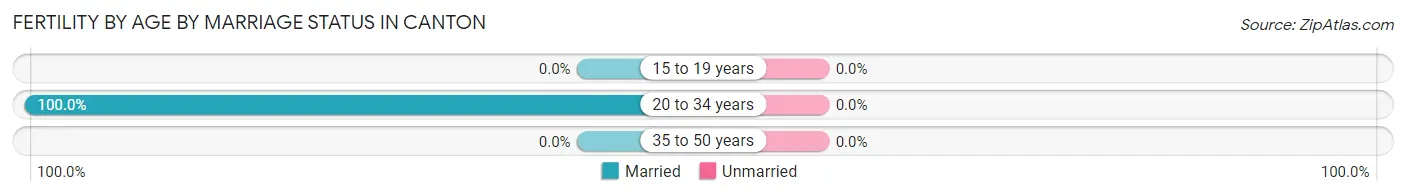
| Age Bracket | Married | Unmarried |
| 15 to 19 years | 0 (0.0%) | 0 (0.0%) |
| 20 to 34 years | 20 (100.0%) | 0 (0.0%) |
| 35 to 50 years | 0 (0.0%) | 0 (0.0%) |
| Total | 20 (100.0%) | 0 (0.0%) |
Fertility by Education in Canton
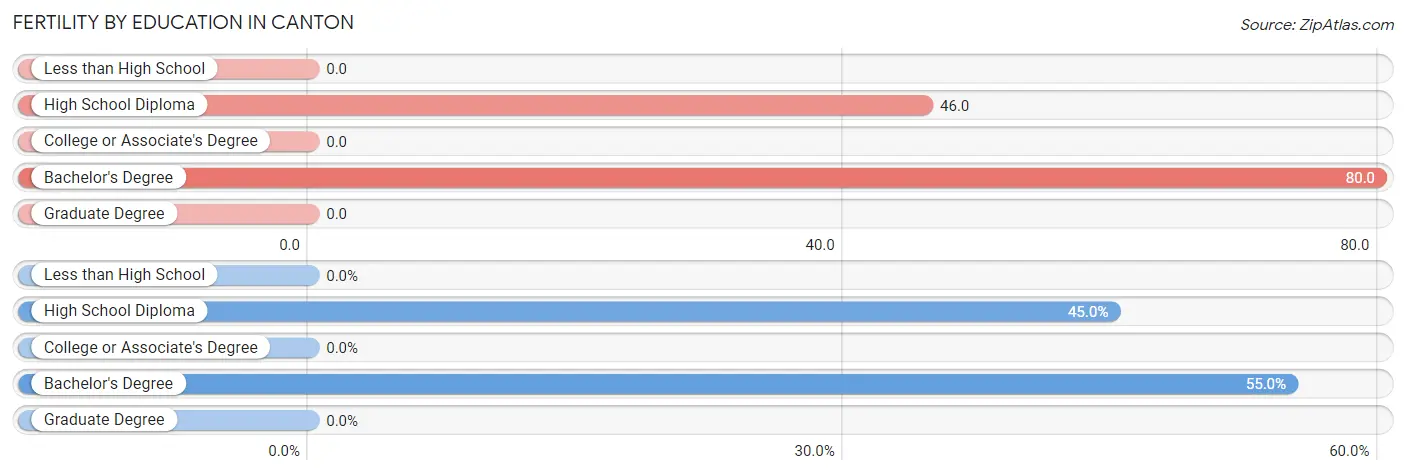
| Educational Attainment | Women with Births | Births / 1,000 Women |
| Less than High School | 0 (0.0%) | 0.0 |
| High School Diploma | 9 (45.0%) | 46.0 |
| College or Associate's Degree | 0 (0.0%) | 0.0 |
| Bachelor's Degree | 11 (55.0%) | 80.0 |
| Graduate Degree | 0 (0.0%) | 0.0 |
| Total | 20 (100.0%) | 31.0 |
Fertility by Education by Marriage Status in Canton
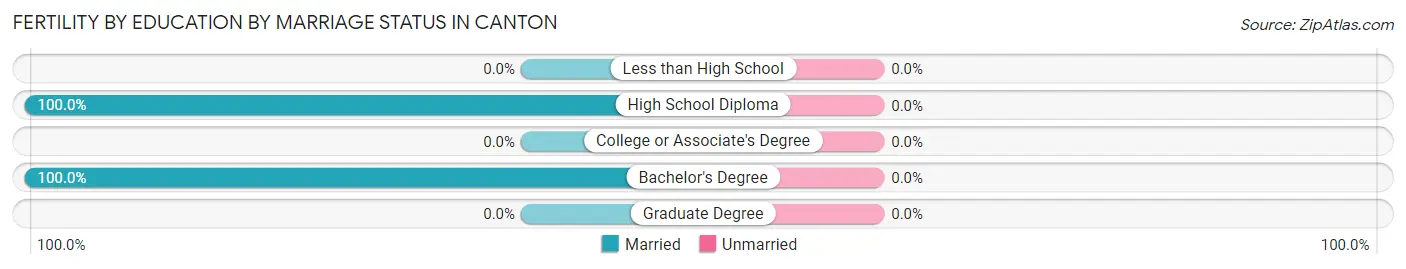
| Educational Attainment | Married | Unmarried |
| Less than High School | 0 (0.0%) | 0 (0.0%) |
| High School Diploma | 9 (100.0%) | 0 (0.0%) |
| College or Associate's Degree | 0 (0.0%) | 0 (0.0%) |
| Bachelor's Degree | 11 (100.0%) | 0 (0.0%) |
| Graduate Degree | 0 (0.0%) | 0 (0.0%) |
| Total | 20 (100.0%) | 0 (0.0%) |
Employment Characteristics in Canton
Employment by Class of Employer in Canton
Among the 1,569 employed individuals in Canton, private company employees (977 | 62.3%), self-employed (not incorporated) (203 | 12.9%), and not-for-profit organizations (185 | 11.8%) make up the most common classes of employment.
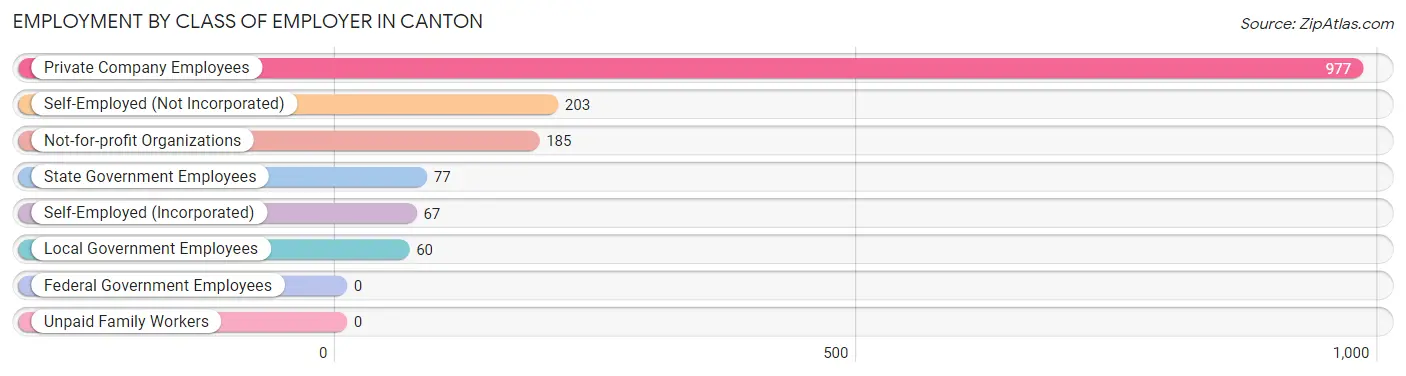
| Employer Class | # Employees | % Employees |
| Private Company Employees | 977 | 62.3% |
| Self-Employed (Incorporated) | 67 | 4.3% |
| Self-Employed (Not Incorporated) | 203 | 12.9% |
| Not-for-profit Organizations | 185 | 11.8% |
| Local Government Employees | 60 | 3.8% |
| State Government Employees | 77 | 4.9% |
| Federal Government Employees | 0 | 0.0% |
| Unpaid Family Workers | 0 | 0.0% |
| Total | 1,569 | 100.0% |
Employment Status by Age in Canton
According to the labor force statistics for Canton, out of the total population over 16 years of age (2,408), 69.9% or 1,683 individuals are in the labor force, with 5.6% or 94 of them unemployed. The age group with the highest labor force participation rate is 20 to 24 years, with 100.0% or 64 individuals in the labor force. Within the labor force, the 75 years and over age range has the highest percentage of unemployed individuals, with 35.1% or 26 of them being unemployed.
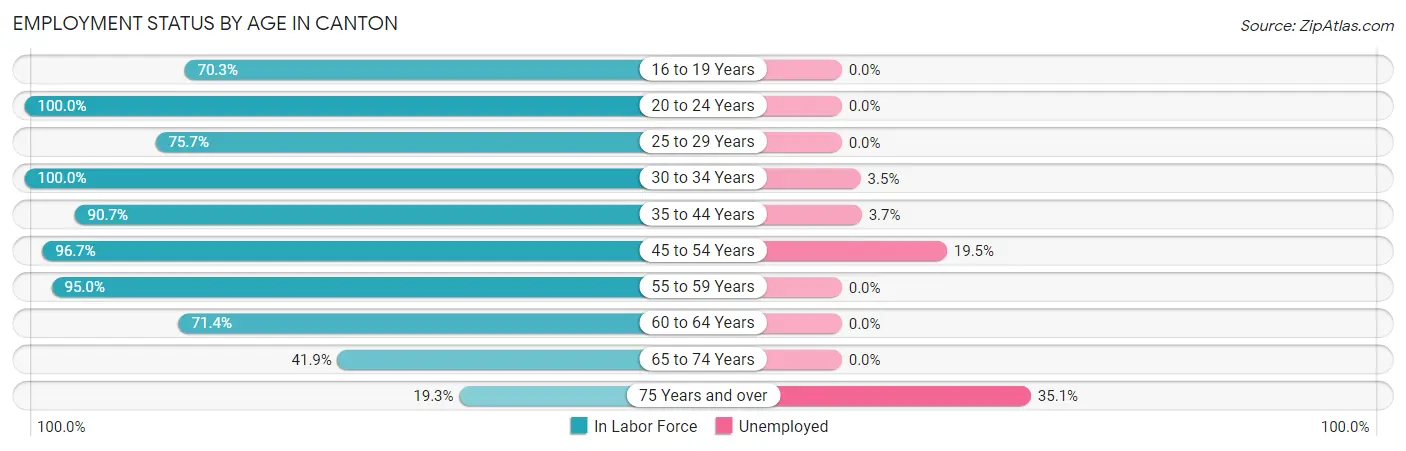
| Age Bracket | In Labor Force | Unemployed |
| 16 to 19 Years | 83 (70.3%) | 0 (0.0%) |
| 20 to 24 Years | 64 (100.0%) | 0 (0.0%) |
| 25 to 29 Years | 140 (75.7%) | 0 (0.0%) |
| 30 to 34 Years | 144 (100.0%) | 5 (3.5%) |
| 35 to 44 Years | 352 (90.7%) | 13 (3.7%) |
| 45 to 54 Years | 261 (96.7%) | 51 (19.5%) |
| 55 to 59 Years | 229 (95.0%) | 0 (0.0%) |
| 60 to 64 Years | 192 (71.4%) | 0 (0.0%) |
| 65 to 74 Years | 145 (41.9%) | 0 (0.0%) |
| 75 Years and over | 74 (19.3%) | 26 (35.1%) |
| Total | 1,683 (69.9%) | 94 (5.6%) |
Employment Status by Educational Attainment in Canton
According to labor force statistics for Canton, 88.0% of individuals (1,317) out of the total population between 25 and 64 years of age (1,497) are in the labor force, with 5.2% or 68 of them being unemployed. The group with the highest labor force participation rate are those with the educational attainment of college / associate degree, with 94.2% or 423 individuals in the labor force. Within the labor force, individuals with less than high school education have the highest percentage of unemployment, with 15.1% or 13 of them being unemployed.
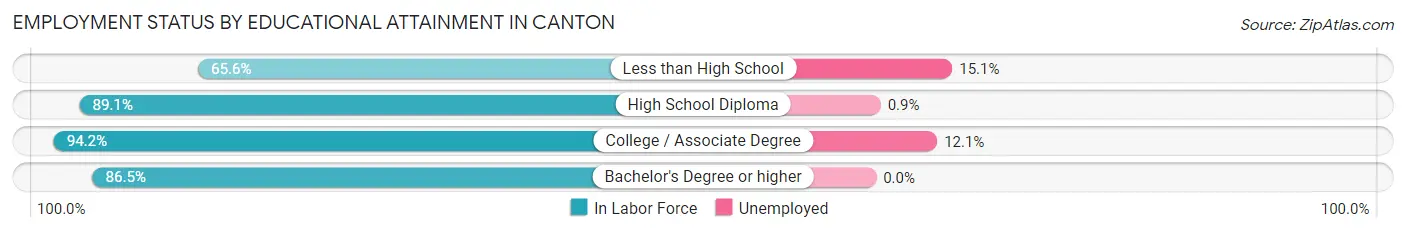
| Educational Attainment | In Labor Force | Unemployed |
| Less than High School | 86 (65.6%) | 20 (15.1%) |
| High School Diploma | 539 (89.1%) | 5 (0.9%) |
| College / Associate Degree | 423 (94.2%) | 54 (12.1%) |
| Bachelor's Degree or higher | 270 (86.5%) | 0 (0.0%) |
| Total | 1,317 (88.0%) | 78 (5.2%) |
Employment Occupations by Sex in Canton
Management, Business, Science and Arts Occupations
The most common Management, Business, Science and Arts occupations in Canton are Community & Social Service (156 | 9.8%), Management (154 | 9.7%), Health Diagnosing & Treating (119 | 7.5%), Business & Financial (88 | 5.5%), and Education Instruction & Library (81 | 5.1%).
Management, Business, Science and Arts Occupations by Sex
Within the Management, Business, Science and Arts occupations in Canton, the most male-oriented occupations are Architecture & Engineering (100.0%), Arts, Media & Entertainment (100.0%), and Computers, Engineering & Science (87.8%), while the most female-oriented occupations are Education Instruction & Library (87.6%), Health Diagnosing & Treating (76.5%), and Community & Social Service (69.9%).
| Occupation | Male | Female |
| Management | 96 (62.3%) | 58 (37.7%) |
| Business & Financial | 30 (34.1%) | 58 (65.9%) |
| Computers, Engineering & Science | 36 (87.8%) | 5 (12.2%) |
| Computers & Mathematics | 10 (66.7%) | 5 (33.3%) |
| Architecture & Engineering | 26 (100.0%) | 0 (0.0%) |
| Life, Physical & Social Science | 0 (0.0%) | 0 (0.0%) |
| Community & Social Service | 47 (30.1%) | 109 (69.9%) |
| Education, Arts & Media | 26 (40.6%) | 38 (59.4%) |
| Legal Services & Support | 0 (0.0%) | 0 (0.0%) |
| Education Instruction & Library | 10 (12.3%) | 71 (87.6%) |
| Arts, Media & Entertainment | 11 (100.0%) | 0 (0.0%) |
| Health Diagnosing & Treating | 28 (23.5%) | 91 (76.5%) |
| Health Technologists | 17 (36.2%) | 30 (63.8%) |
| Total (Category) | 237 (42.5%) | 321 (57.5%) |
| Total (Overall) | 831 (52.3%) | 758 (47.7%) |
Services Occupations
The most common Services occupations in Canton are Personal Care & Service (68 | 4.3%), Cleaning & Maintenance (62 | 3.9%), Food Preparation & Serving (61 | 3.8%), Healthcare Support (36 | 2.3%), and Security & Protection (36 | 2.3%).
Services Occupations by Sex
Within the Services occupations in Canton, the most male-oriented occupations are Security & Protection (100.0%), Firefighting & Prevention (100.0%), and Law Enforcement (100.0%), while the most female-oriented occupations are Personal Care & Service (82.4%), Healthcare Support (77.8%), and Food Preparation & Serving (77.0%).
| Occupation | Male | Female |
| Healthcare Support | 8 (22.2%) | 28 (77.8%) |
| Security & Protection | 36 (100.0%) | 0 (0.0%) |
| Firefighting & Prevention | 31 (100.0%) | 0 (0.0%) |
| Law Enforcement | 5 (100.0%) | 0 (0.0%) |
| Food Preparation & Serving | 14 (23.0%) | 47 (77.0%) |
| Cleaning & Maintenance | 54 (87.1%) | 8 (12.9%) |
| Personal Care & Service | 12 (17.6%) | 56 (82.4%) |
| Total (Category) | 124 (47.1%) | 139 (52.8%) |
| Total (Overall) | 831 (52.3%) | 758 (47.7%) |
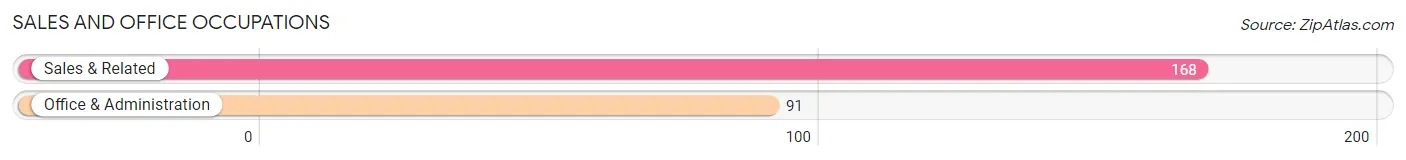
Sales and Office Occupations
The most common Sales and Office occupations in Canton are Sales & Related (168 | 10.6%), and Office & Administration (91 | 5.7%).
Sales and Office Occupations by Sex
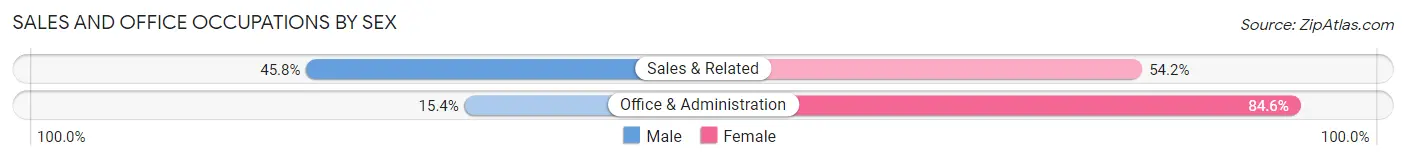
| Occupation | Male | Female |
| Sales & Related | 77 (45.8%) | 91 (54.2%) |
| Office & Administration | 14 (15.4%) | 77 (84.6%) |
| Total (Category) | 91 (35.1%) | 168 (64.9%) |
| Total (Overall) | 831 (52.3%) | 758 (47.7%) |
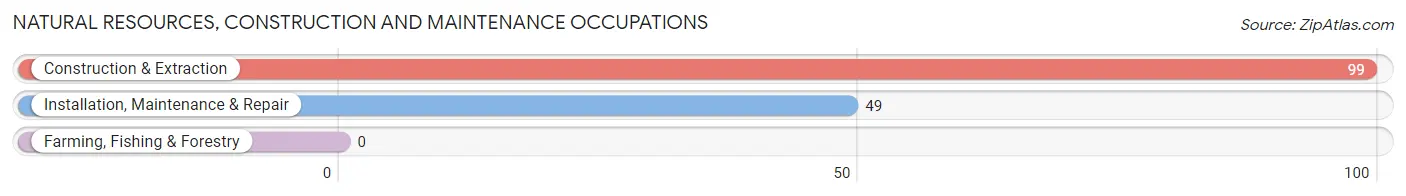
Natural Resources, Construction and Maintenance Occupations
The most common Natural Resources, Construction and Maintenance occupations in Canton are Construction & Extraction (99 | 6.2%), and Installation, Maintenance & Repair (49 | 3.1%).
Natural Resources, Construction and Maintenance Occupations by Sex
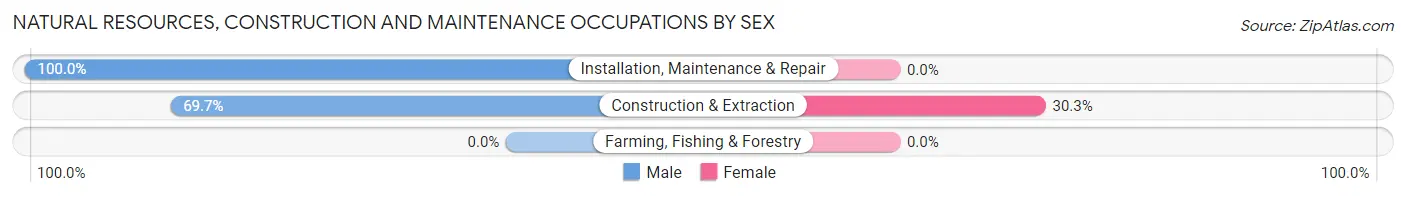
| Occupation | Male | Female |
| Farming, Fishing & Forestry | 0 (0.0%) | 0 (0.0%) |
| Construction & Extraction | 69 (69.7%) | 30 (30.3%) |
| Installation, Maintenance & Repair | 49 (100.0%) | 0 (0.0%) |
| Total (Category) | 118 (79.7%) | 30 (20.3%) |
| Total (Overall) | 831 (52.3%) | 758 (47.7%) |
Production, Transportation and Moving Occupations
The most common Production, Transportation and Moving occupations in Canton are Production (241 | 15.2%), Transportation (61 | 3.8%), and Material Moving (59 | 3.7%).
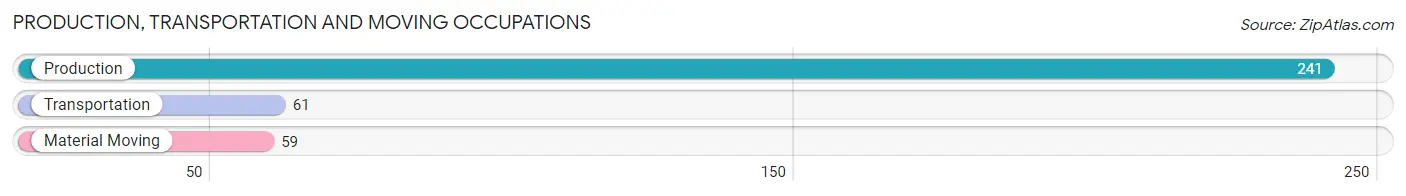
Production, Transportation and Moving Occupations by Sex
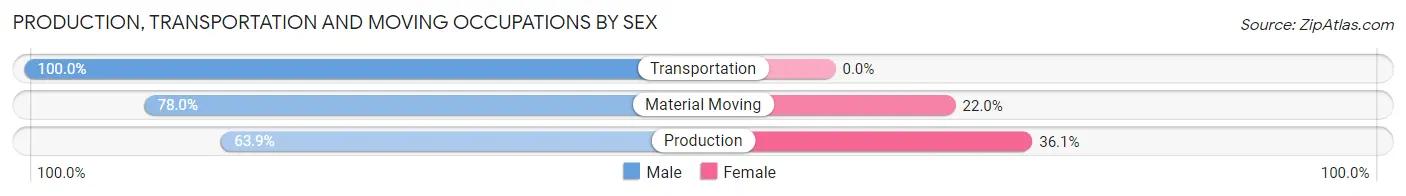
| Occupation | Male | Female |
| Production | 154 (63.9%) | 87 (36.1%) |
| Transportation | 61 (100.0%) | 0 (0.0%) |
| Material Moving | 46 (78.0%) | 13 (22.0%) |
| Total (Category) | 261 (72.3%) | 100 (27.7%) |
| Total (Overall) | 831 (52.3%) | 758 (47.7%) |
Employment Industries by Sex in Canton
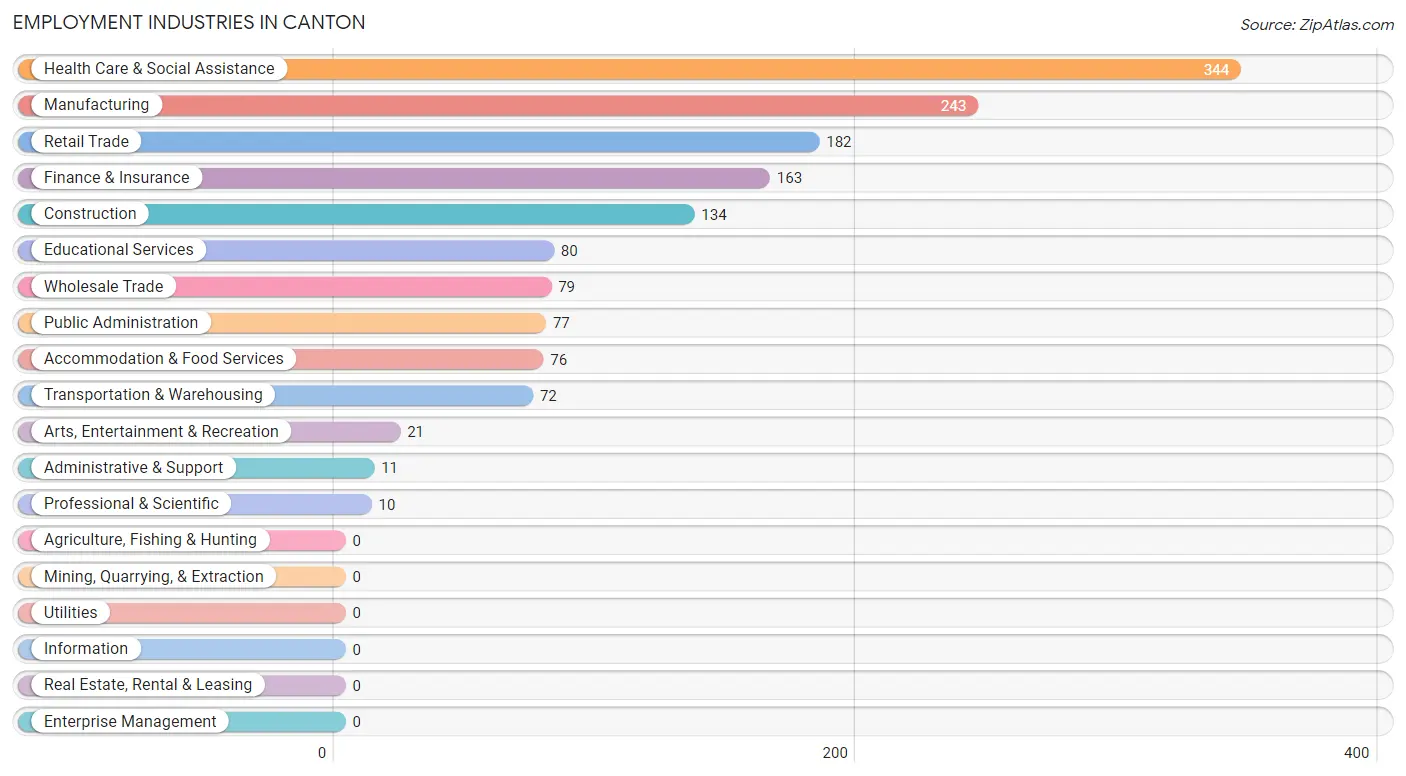
Employment Industries in Canton
The major employment industries in Canton include Health Care & Social Assistance (344 | 21.6%), Manufacturing (243 | 15.3%), Retail Trade (182 | 11.5%), Finance & Insurance (163 | 10.3%), and Construction (134 | 8.4%).
Employment Industries by Sex in Canton
The Canton industries that see more men than women are Professional & Scientific (100.0%), Administrative & Support (100.0%), and Wholesale Trade (88.6%), whereas the industries that tend to have a higher number of women are Health Care & Social Assistance (93.0%), Accommodation & Food Services (67.1%), and Finance & Insurance (64.4%).
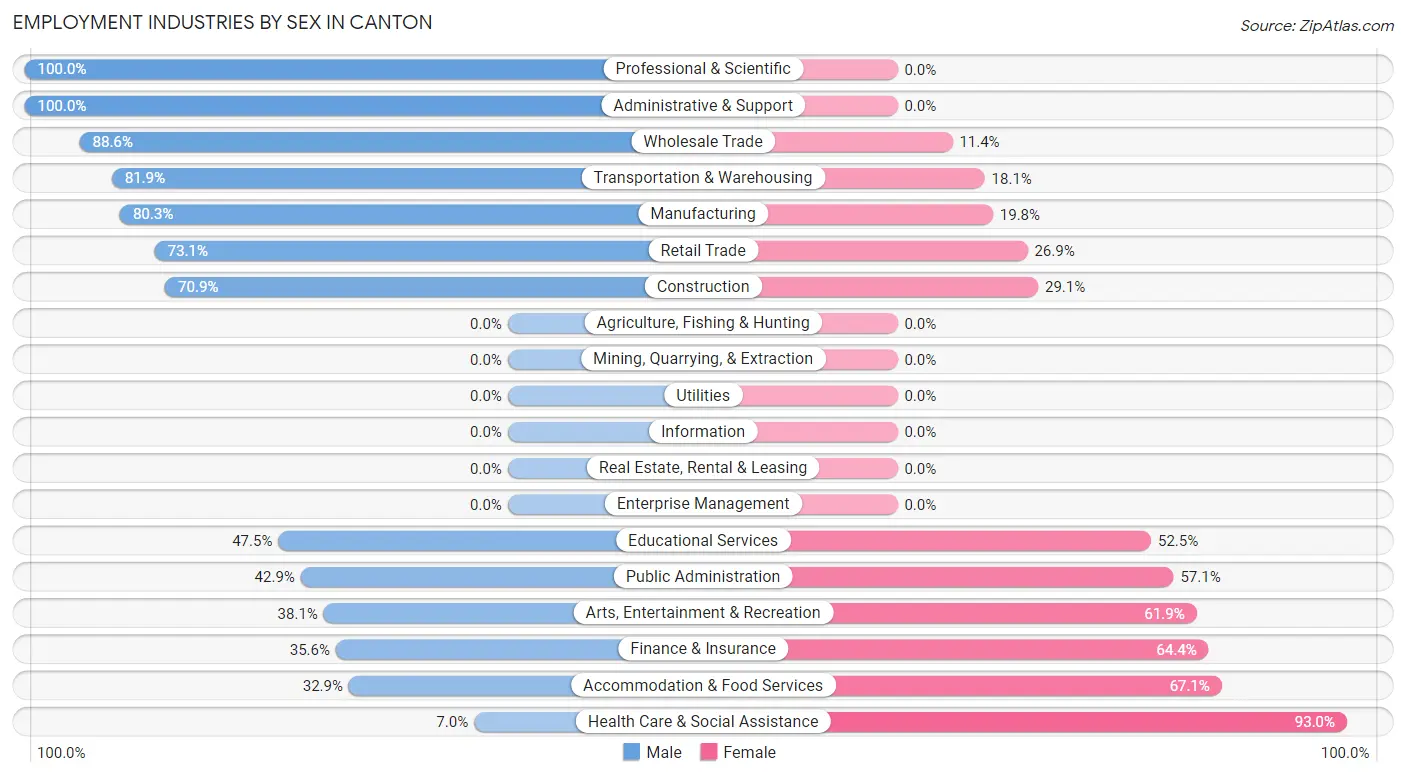
| Industry | Male | Female |
| Agriculture, Fishing & Hunting | 0 (0.0%) | 0 (0.0%) |
| Mining, Quarrying, & Extraction | 0 (0.0%) | 0 (0.0%) |
| Construction | 95 (70.9%) | 39 (29.1%) |
| Manufacturing | 195 (80.2%) | 48 (19.8%) |
| Wholesale Trade | 70 (88.6%) | 9 (11.4%) |
| Retail Trade | 133 (73.1%) | 49 (26.9%) |
| Transportation & Warehousing | 59 (81.9%) | 13 (18.1%) |
| Utilities | 0 (0.0%) | 0 (0.0%) |
| Information | 0 (0.0%) | 0 (0.0%) |
| Finance & Insurance | 58 (35.6%) | 105 (64.4%) |
| Real Estate, Rental & Leasing | 0 (0.0%) | 0 (0.0%) |
| Professional & Scientific | 10 (100.0%) | 0 (0.0%) |
| Enterprise Management | 0 (0.0%) | 0 (0.0%) |
| Administrative & Support | 11 (100.0%) | 0 (0.0%) |
| Educational Services | 38 (47.5%) | 42 (52.5%) |
| Health Care & Social Assistance | 24 (7.0%) | 320 (93.0%) |
| Arts, Entertainment & Recreation | 8 (38.1%) | 13 (61.9%) |
| Accommodation & Food Services | 25 (32.9%) | 51 (67.1%) |
| Public Administration | 33 (42.9%) | 44 (57.1%) |
| Total | 831 (52.3%) | 758 (47.7%) |
Education in Canton
School Enrollment in Canton
The most common levels of schooling among the 700 students in Canton are middle school (238 | 34.0%), elementary school (147 | 21.0%), and nursery / preschool (126 | 18.0%).
| School Level | # Students | % Students |
| Nursery / Preschool | 126 | 18.0% |
| Kindergarten | 14 | 2.0% |
| Elementary School | 147 | 21.0% |
| Middle School | 238 | 34.0% |
| High School | 119 | 17.0% |
| College / Undergraduate | 56 | 8.0% |
| Graduate / Professional | 0 | 0.0% |
| Total | 700 | 100.0% |
School Enrollment by Age by Funding Source in Canton
Out of a total of 700 students who are enrolled in schools in Canton, 110 (15.7%) attend a private institution, while the remaining 590 (84.3%) are enrolled in public schools. The age group of 20 to 24 year olds has the highest likelihood of being enrolled in private schools, with 22 (100.0% in the age bracket) enrolled. Conversely, the age group of 10 to 14 year olds has the lowest likelihood of being enrolled in a private school, with 256 (100.0% in the age bracket) attending a public institution.
| Age Bracket | Public School | Private School |
| 3 to 4 Year Olds | 64 (55.6%) | 51 (44.4%) |
| 5 to 9 Year Old | 124 (77.0%) | 37 (23.0%) |
| 10 to 14 Year Olds | 256 (100.0%) | 0 (0.0%) |
| 15 to 17 Year Olds | 85 (100.0%) | 0 (0.0%) |
| 18 to 19 Year Olds | 44 (100.0%) | 0 (0.0%) |
| 20 to 24 Year Olds | 0 (0.0%) | 22 (100.0%) |
| 25 to 34 Year Olds | 8 (100.0%) | 0 (0.0%) |
| 35 Years and over | 9 (100.0%) | 0 (0.0%) |
| Total | 590 (84.3%) | 110 (15.7%) |
Educational Attainment by Field of Study in Canton
Education (118 | 22.1%), science & technology (97 | 18.2%), bio, nature & agricultural (64 | 12.0%), business (62 | 11.6%), and communications (48 | 9.0%) are the most common fields of study among 533 individuals in Canton who have obtained a bachelor's degree or higher.
| Field of Study | # Graduates | % Graduates |
| Computers & Mathematics | 0 | 0.0% |
| Bio, Nature & Agricultural | 64 | 12.0% |
| Physical & Health Sciences | 5 | 0.9% |
| Psychology | 20 | 3.7% |
| Social Sciences | 29 | 5.4% |
| Engineering | 35 | 6.6% |
| Multidisciplinary Studies | 0 | 0.0% |
| Science & Technology | 97 | 18.2% |
| Business | 62 | 11.6% |
| Education | 118 | 22.1% |
| Literature & Languages | 11 | 2.1% |
| Liberal Arts & History | 22 | 4.1% |
| Visual & Performing Arts | 0 | 0.0% |
| Communications | 48 | 9.0% |
| Arts & Humanities | 22 | 4.1% |
| Total | 533 | 100.0% |
Transportation & Commute in Canton
Vehicle Availability by Sex in Canton
The most prevalent vehicle ownership categories in Canton are males with 2 vehicles (355, accounting for 43.1%) and females with 2 vehicles (238, making up 51.2%).
| Vehicles Available | Male | Female |
| No Vehicle | 29 (3.5%) | 0 (0.0%) |
| 1 Vehicle | 100 (12.1%) | 165 (23.8%) |
| 2 Vehicles | 355 (43.1%) | 238 (34.3%) |
| 3 Vehicles | 171 (20.8%) | 182 (26.3%) |
| 4 Vehicles | 111 (13.5%) | 81 (11.7%) |
| 5 or more Vehicles | 57 (6.9%) | 27 (3.9%) |
| Total | 823 (100.0%) | 693 (100.0%) |
Commute Time in Canton
The most frequently occuring commute durations in Canton are 5 to 9 minutes (451 commuters, 31.1%), 30 to 34 minutes (218 commuters, 15.0%), and less than 5 minutes (144 commuters, 9.9%).
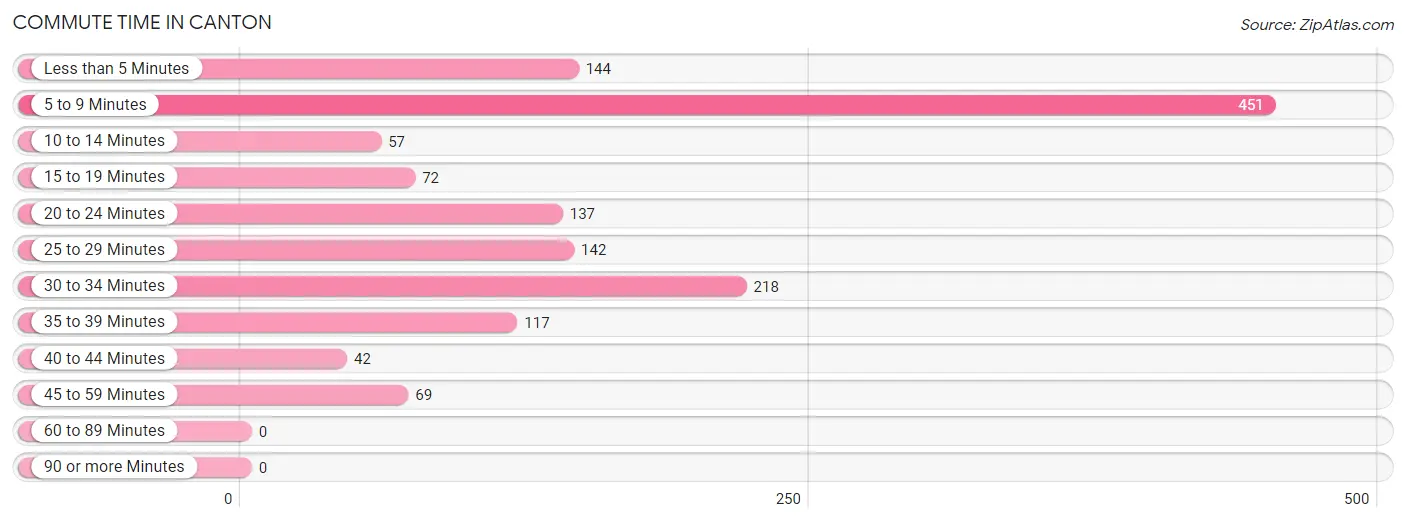
| Commute Time | # Commuters | % Commuters |
| Less than 5 Minutes | 144 | 9.9% |
| 5 to 9 Minutes | 451 | 31.1% |
| 10 to 14 Minutes | 57 | 3.9% |
| 15 to 19 Minutes | 72 | 5.0% |
| 20 to 24 Minutes | 137 | 9.5% |
| 25 to 29 Minutes | 142 | 9.8% |
| 30 to 34 Minutes | 218 | 15.0% |
| 35 to 39 Minutes | 117 | 8.1% |
| 40 to 44 Minutes | 42 | 2.9% |
| 45 to 59 Minutes | 69 | 4.8% |
| 60 to 89 Minutes | 0 | 0.0% |
| 90 or more Minutes | 0 | 0.0% |
Commute Time by Sex in Canton
The most common commute times in Canton are 5 to 9 minutes (289 commuters, 36.8%) for males and 5 to 9 minutes (162 commuters, 24.4%) for females.
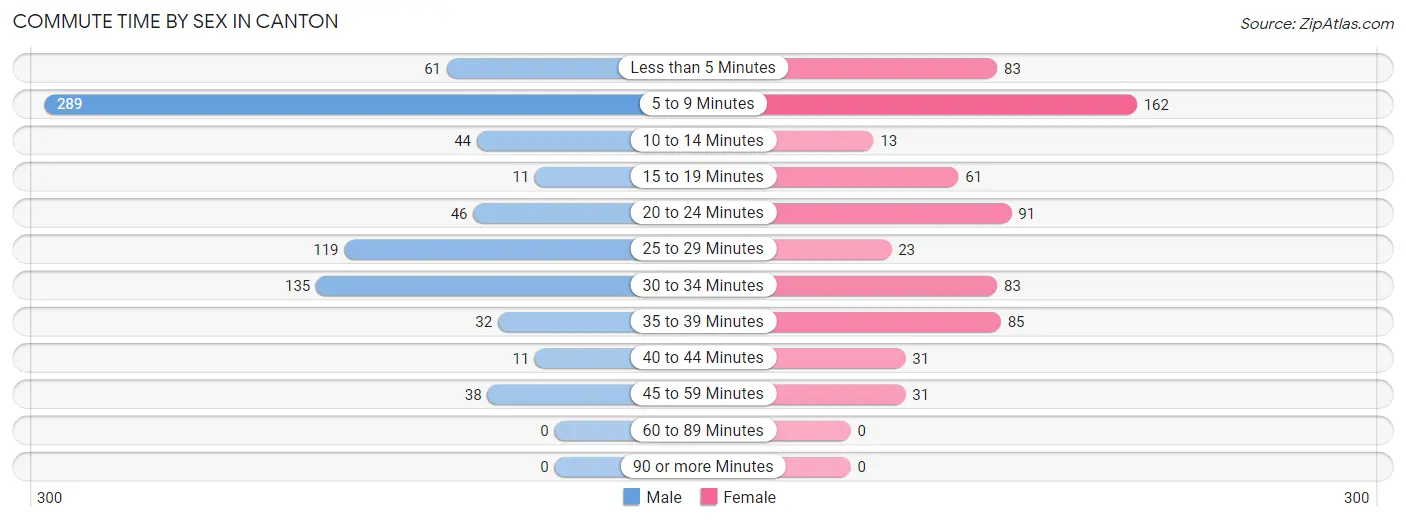
| Commute Time | Male | Female |
| Less than 5 Minutes | 61 (7.8%) | 83 (12.5%) |
| 5 to 9 Minutes | 289 (36.8%) | 162 (24.4%) |
| 10 to 14 Minutes | 44 (5.6%) | 13 (2.0%) |
| 15 to 19 Minutes | 11 (1.4%) | 61 (9.2%) |
| 20 to 24 Minutes | 46 (5.9%) | 91 (13.7%) |
| 25 to 29 Minutes | 119 (15.1%) | 23 (3.5%) |
| 30 to 34 Minutes | 135 (17.2%) | 83 (12.5%) |
| 35 to 39 Minutes | 32 (4.1%) | 85 (12.8%) |
| 40 to 44 Minutes | 11 (1.4%) | 31 (4.7%) |
| 45 to 59 Minutes | 38 (4.8%) | 31 (4.7%) |
| 60 to 89 Minutes | 0 (0.0%) | 0 (0.0%) |
| 90 or more Minutes | 0 (0.0%) | 0 (0.0%) |
Time of Departure to Work by Sex in Canton
The most frequent times of departure to work in Canton are 7:00 AM to 7:29 AM (165, 21.0%) for males and 7:30 AM to 7:59 AM (132, 19.9%) for females.
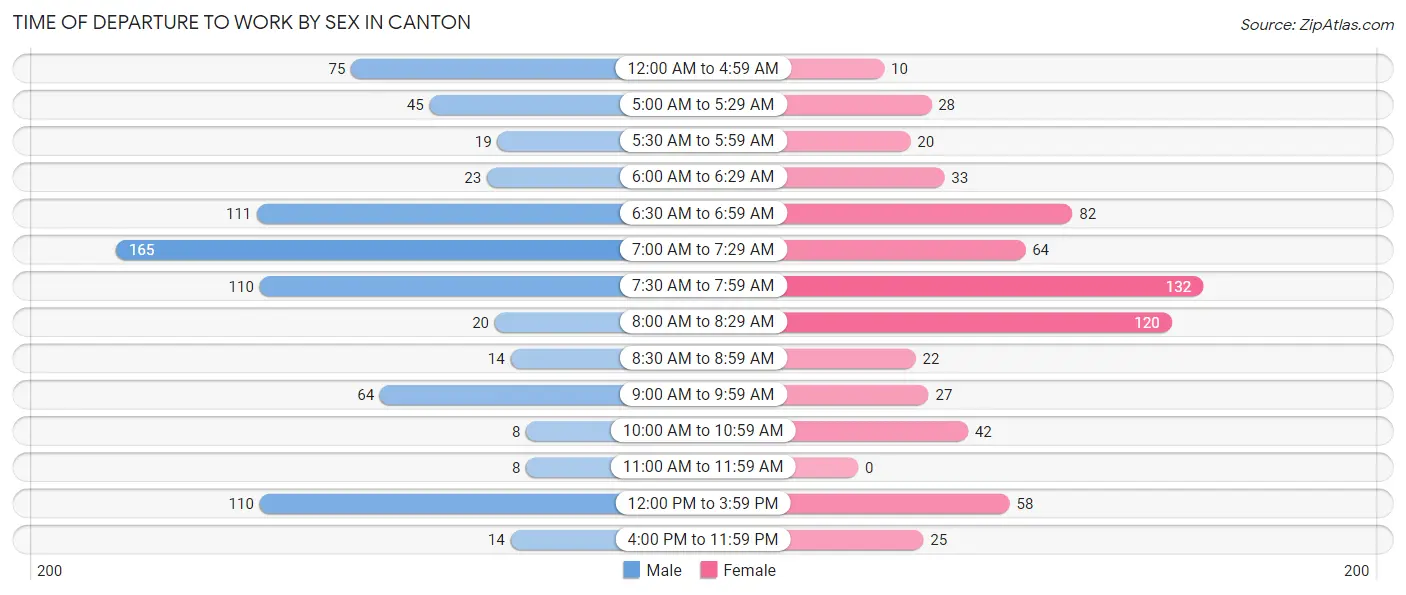
| Time of Departure | Male | Female |
| 12:00 AM to 4:59 AM | 75 (9.5%) | 10 (1.5%) |
| 5:00 AM to 5:29 AM | 45 (5.7%) | 28 (4.2%) |
| 5:30 AM to 5:59 AM | 19 (2.4%) | 20 (3.0%) |
| 6:00 AM to 6:29 AM | 23 (2.9%) | 33 (5.0%) |
| 6:30 AM to 6:59 AM | 111 (14.1%) | 82 (12.4%) |
| 7:00 AM to 7:29 AM | 165 (21.0%) | 64 (9.7%) |
| 7:30 AM to 7:59 AM | 110 (14.0%) | 132 (19.9%) |
| 8:00 AM to 8:29 AM | 20 (2.5%) | 120 (18.1%) |
| 8:30 AM to 8:59 AM | 14 (1.8%) | 22 (3.3%) |
| 9:00 AM to 9:59 AM | 64 (8.1%) | 27 (4.1%) |
| 10:00 AM to 10:59 AM | 8 (1.0%) | 42 (6.3%) |
| 11:00 AM to 11:59 AM | 8 (1.0%) | 0 (0.0%) |
| 12:00 PM to 3:59 PM | 110 (14.0%) | 58 (8.7%) |
| 4:00 PM to 11:59 PM | 14 (1.8%) | 25 (3.8%) |
| Total | 786 (100.0%) | 663 (100.0%) |
Housing Occupancy in Canton
Occupancy by Ownership in Canton
Of the total 1,330 dwellings in Canton, owner-occupied units account for 911 (68.5%), while renter-occupied units make up 419 (31.5%).
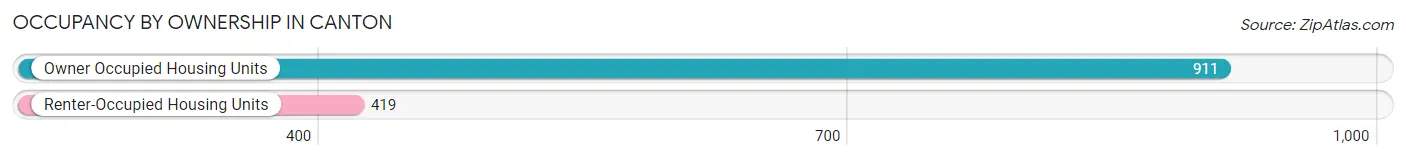
| Occupancy | # Housing Units | % Housing Units |
| Owner Occupied Housing Units | 911 | 68.5% |
| Renter-Occupied Housing Units | 419 | 31.5% |
| Total Occupied Housing Units | 1,330 | 100.0% |
Occupancy by Household Size in Canton
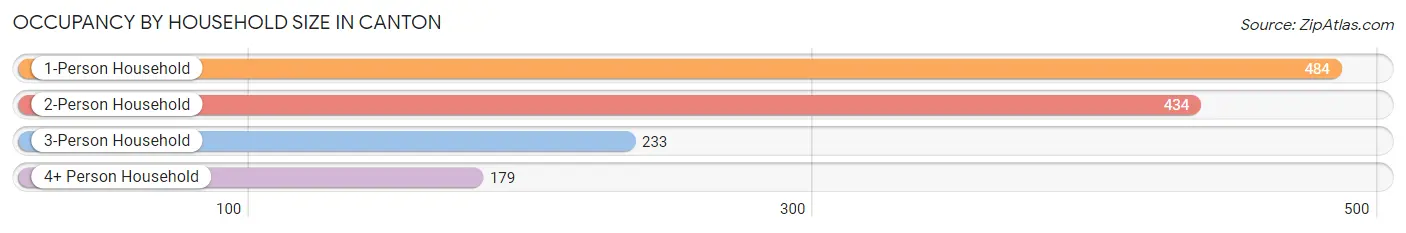
| Household Size | # Housing Units | % Housing Units |
| 1-Person Household | 484 | 36.4% |
| 2-Person Household | 434 | 32.6% |
| 3-Person Household | 233 | 17.5% |
| 4+ Person Household | 179 | 13.5% |
| Total Housing Units | 1,330 | 100.0% |
Occupancy by Ownership by Household Size in Canton
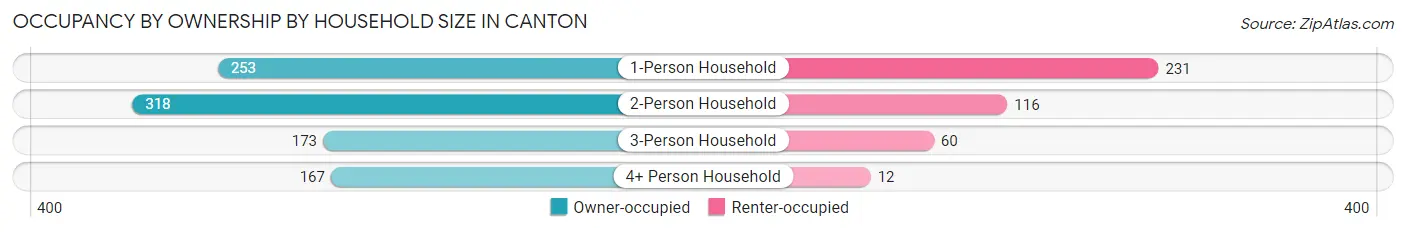
| Household Size | Owner-occupied | Renter-occupied |
| 1-Person Household | 253 (52.3%) | 231 (47.7%) |
| 2-Person Household | 318 (73.3%) | 116 (26.7%) |
| 3-Person Household | 173 (74.3%) | 60 (25.8%) |
| 4+ Person Household | 167 (93.3%) | 12 (6.7%) |
| Total Housing Units | 911 (68.5%) | 419 (31.5%) |
Occupancy by Educational Attainment in Canton
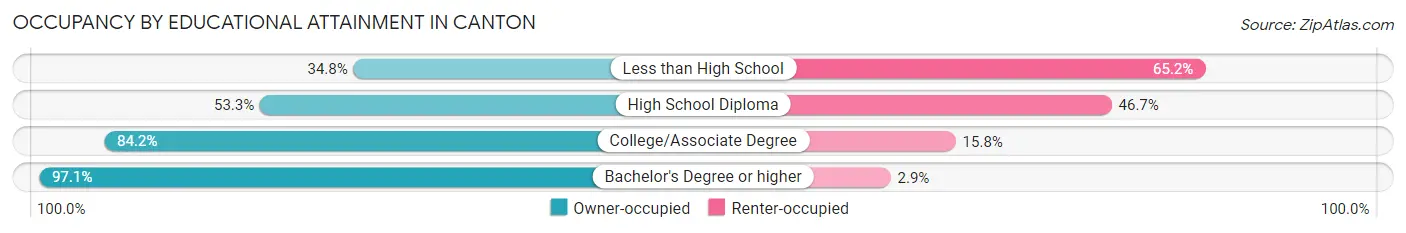
| Household Size | Owner-occupied | Renter-occupied |
| Less than High School | 32 (34.8%) | 60 (65.2%) |
| High School Diploma | 345 (53.3%) | 302 (46.7%) |
| College/Associate Degree | 262 (84.2%) | 49 (15.8%) |
| Bachelor's Degree or higher | 272 (97.1%) | 8 (2.9%) |
Occupancy by Age of Householder in Canton
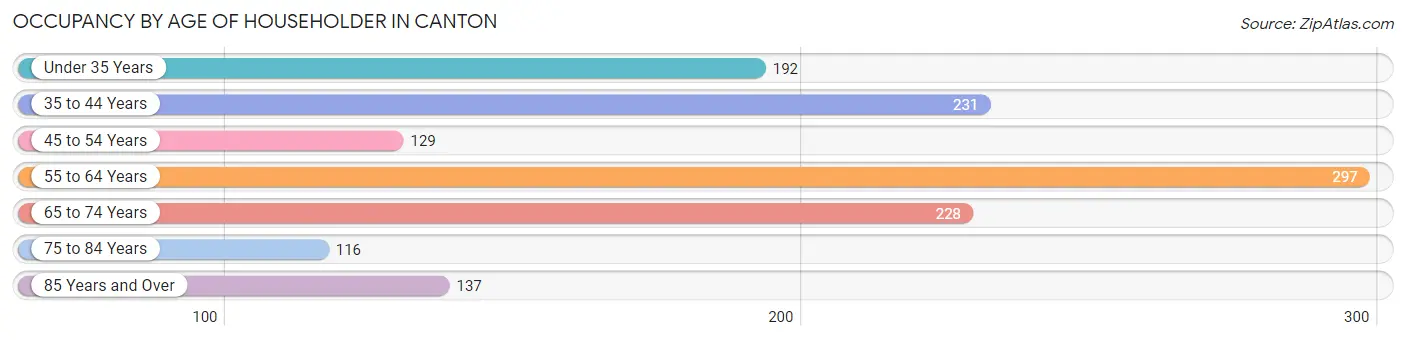
| Age Bracket | # Households | % Households |
| Under 35 Years | 192 | 14.4% |
| 35 to 44 Years | 231 | 17.4% |
| 45 to 54 Years | 129 | 9.7% |
| 55 to 64 Years | 297 | 22.3% |
| 65 to 74 Years | 228 | 17.1% |
| 75 to 84 Years | 116 | 8.7% |
| 85 Years and Over | 137 | 10.3% |
| Total | 1,330 | 100.0% |
Housing Finances in Canton
Median Income by Occupancy in Canton
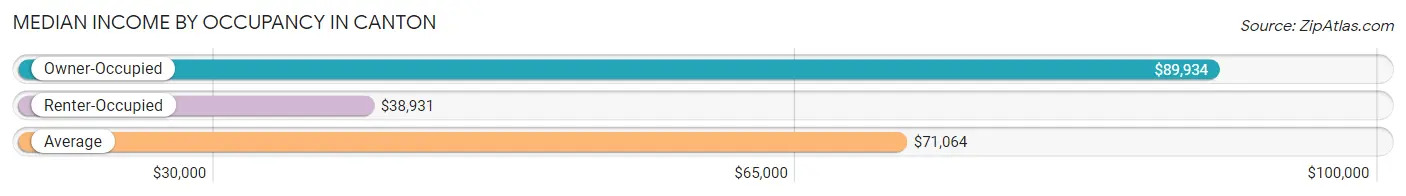
| Occupancy Type | # Households | Median Income |
| Owner-Occupied | 911 (68.5%) | $89,934 |
| Renter-Occupied | 419 (31.5%) | $38,931 |
| Average | 1,330 (100.0%) | $71,064 |
Occupancy by Householder Income Bracket in Canton
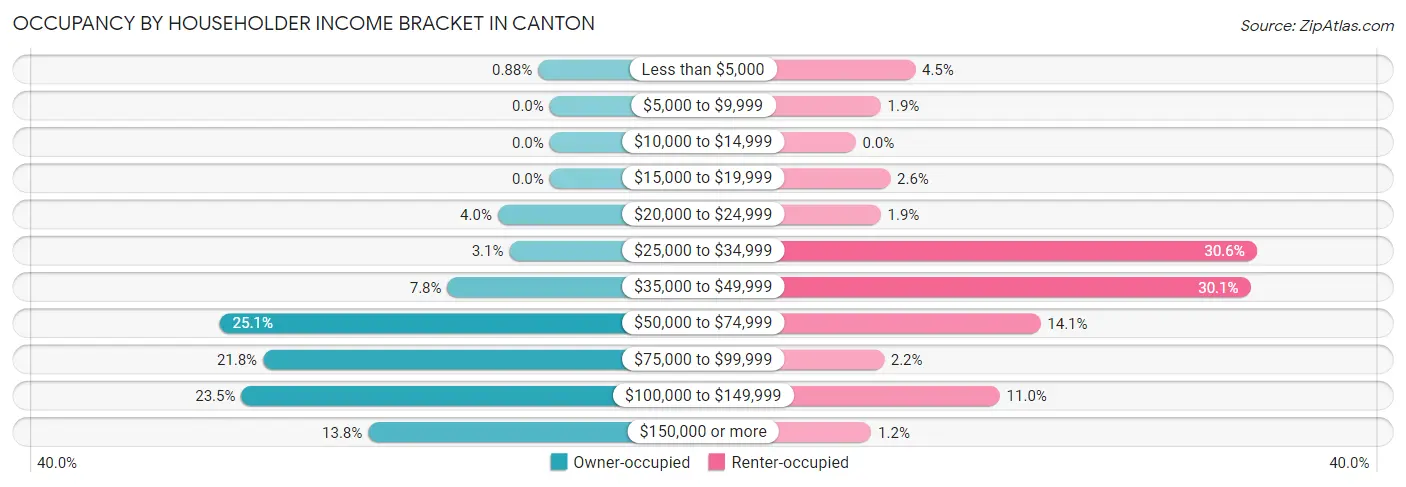
| Income Bracket | Owner-occupied | Renter-occupied |
| Less than $5,000 | 8 (0.9%) | 19 (4.5%) |
| $5,000 to $9,999 | 0 (0.0%) | 8 (1.9%) |
| $10,000 to $14,999 | 0 (0.0%) | 0 (0.0%) |
| $15,000 to $19,999 | 0 (0.0%) | 11 (2.6%) |
| $20,000 to $24,999 | 36 (4.0%) | 8 (1.9%) |
| $25,000 to $34,999 | 28 (3.1%) | 128 (30.5%) |
| $35,000 to $49,999 | 71 (7.8%) | 126 (30.1%) |
| $50,000 to $74,999 | 229 (25.1%) | 59 (14.1%) |
| $75,000 to $99,999 | 199 (21.8%) | 9 (2.1%) |
| $100,000 to $149,999 | 214 (23.5%) | 46 (11.0%) |
| $150,000 or more | 126 (13.8%) | 5 (1.2%) |
| Total | 911 (100.0%) | 419 (100.0%) |
Monthly Housing Cost Tiers in Canton
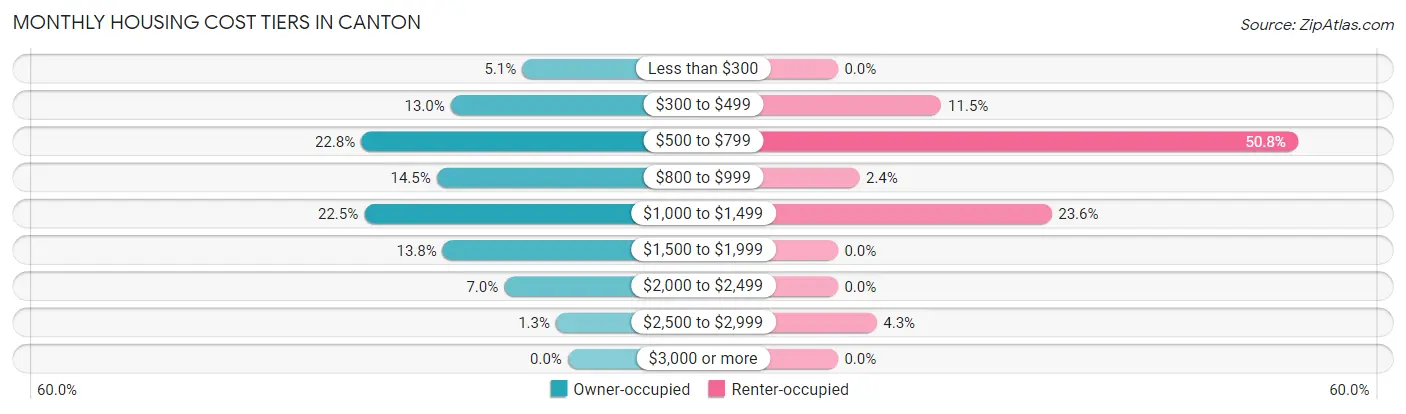
| Monthly Cost | Owner-occupied | Renter-occupied |
| Less than $300 | 46 (5.1%) | 0 (0.0%) |
| $300 to $499 | 118 (13.0%) | 48 (11.5%) |
| $500 to $799 | 208 (22.8%) | 213 (50.8%) |
| $800 to $999 | 132 (14.5%) | 10 (2.4%) |
| $1,000 to $1,499 | 205 (22.5%) | 99 (23.6%) |
| $1,500 to $1,999 | 126 (13.8%) | 0 (0.0%) |
| $2,000 to $2,499 | 64 (7.0%) | 0 (0.0%) |
| $2,500 to $2,999 | 12 (1.3%) | 18 (4.3%) |
| $3,000 or more | 0 (0.0%) | 0 (0.0%) |
| Total | 911 (100.0%) | 419 (100.0%) |
Physical Housing Characteristics in Canton
Housing Structures in Canton
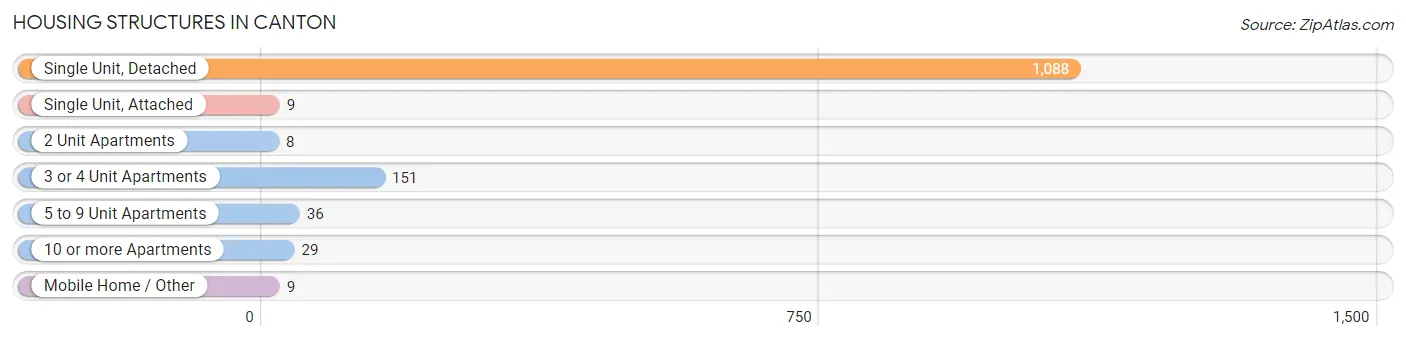
| Structure Type | # Housing Units | % Housing Units |
| Single Unit, Detached | 1,088 | 81.8% |
| Single Unit, Attached | 9 | 0.7% |
| 2 Unit Apartments | 8 | 0.6% |
| 3 or 4 Unit Apartments | 151 | 11.4% |
| 5 to 9 Unit Apartments | 36 | 2.7% |
| 10 or more Apartments | 29 | 2.2% |
| Mobile Home / Other | 9 | 0.7% |
| Total | 1,330 | 100.0% |
Housing Structures by Occupancy in Canton
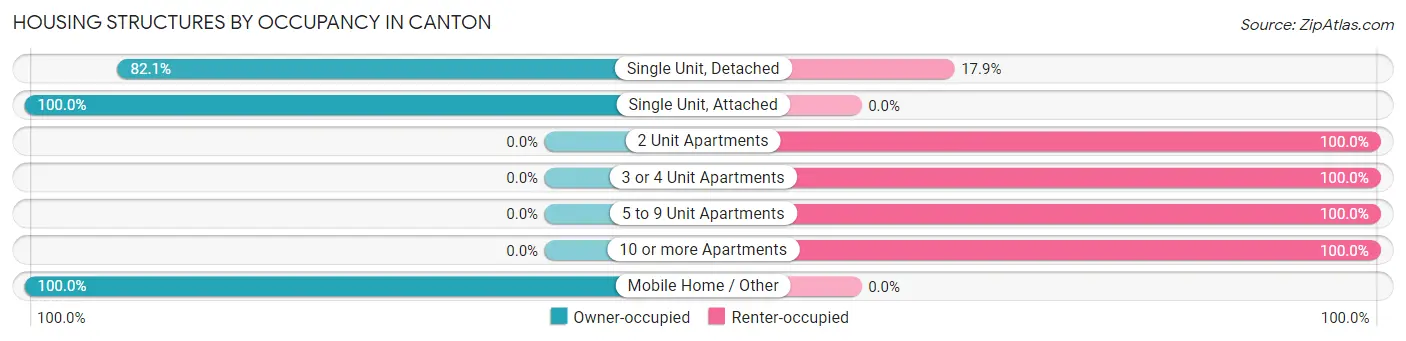
| Structure Type | Owner-occupied | Renter-occupied |
| Single Unit, Detached | 893 (82.1%) | 195 (17.9%) |
| Single Unit, Attached | 9 (100.0%) | 0 (0.0%) |
| 2 Unit Apartments | 0 (0.0%) | 8 (100.0%) |
| 3 or 4 Unit Apartments | 0 (0.0%) | 151 (100.0%) |
| 5 to 9 Unit Apartments | 0 (0.0%) | 36 (100.0%) |
| 10 or more Apartments | 0 (0.0%) | 29 (100.0%) |
| Mobile Home / Other | 9 (100.0%) | 0 (0.0%) |
| Total | 911 (68.5%) | 419 (31.5%) |
Housing Structures by Number of Rooms in Canton
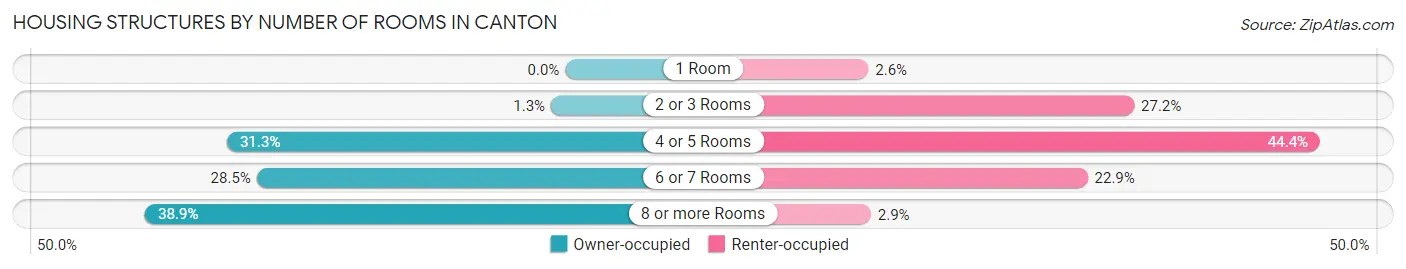
| Number of Rooms | Owner-occupied | Renter-occupied |
| 1 Room | 0 (0.0%) | 11 (2.6%) |
| 2 or 3 Rooms | 12 (1.3%) | 114 (27.2%) |
| 4 or 5 Rooms | 285 (31.3%) | 186 (44.4%) |
| 6 or 7 Rooms | 260 (28.5%) | 96 (22.9%) |
| 8 or more Rooms | 354 (38.9%) | 12 (2.9%) |
| Total | 911 (100.0%) | 419 (100.0%) |
Housing Structure by Heating Type in Canton
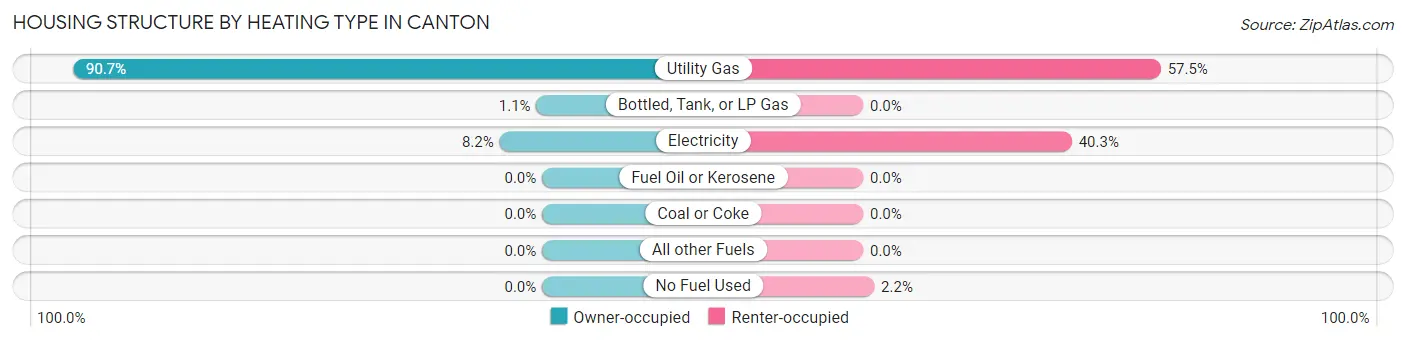
| Heating Type | Owner-occupied | Renter-occupied |
| Utility Gas | 826 (90.7%) | 241 (57.5%) |
| Bottled, Tank, or LP Gas | 10 (1.1%) | 0 (0.0%) |
| Electricity | 75 (8.2%) | 169 (40.3%) |
| Fuel Oil or Kerosene | 0 (0.0%) | 0 (0.0%) |
| Coal or Coke | 0 (0.0%) | 0 (0.0%) |
| All other Fuels | 0 (0.0%) | 0 (0.0%) |
| No Fuel Used | 0 (0.0%) | 9 (2.1%) |
| Total | 911 (100.0%) | 419 (100.0%) |
Household Vehicle Usage in Canton
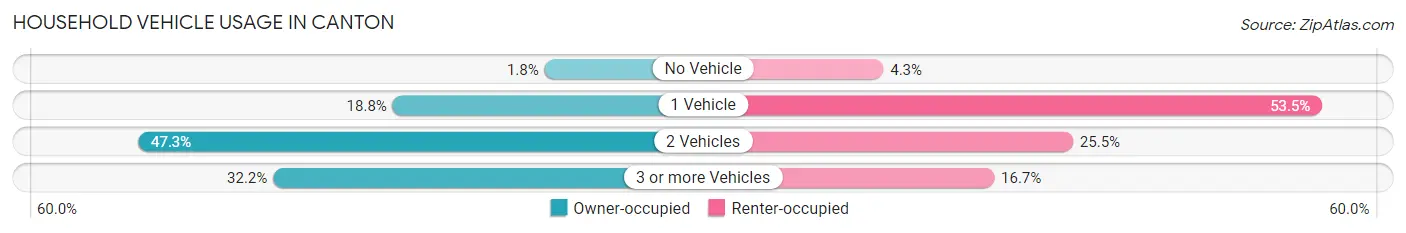
| Vehicles per Household | Owner-occupied | Renter-occupied |
| No Vehicle | 16 (1.8%) | 18 (4.3%) |
| 1 Vehicle | 171 (18.8%) | 224 (53.5%) |
| 2 Vehicles | 431 (47.3%) | 107 (25.5%) |
| 3 or more Vehicles | 293 (32.2%) | 70 (16.7%) |
| Total | 911 (100.0%) | 419 (100.0%) |
Real Estate & Mortgages in Canton
Real Estate and Mortgage Overview in Canton
| Characteristic | Without Mortgage | With Mortgage |
| Housing Units | 378 | 533 |
| Median Property Value | $170,800 | $180,400 |
| Median Household Income | $70,000 | $71 |
| Monthly Housing Costs | $562 | $0 |
| Real Estate Taxes | $2,534 | $12 |
Property Value by Mortgage Status in Canton
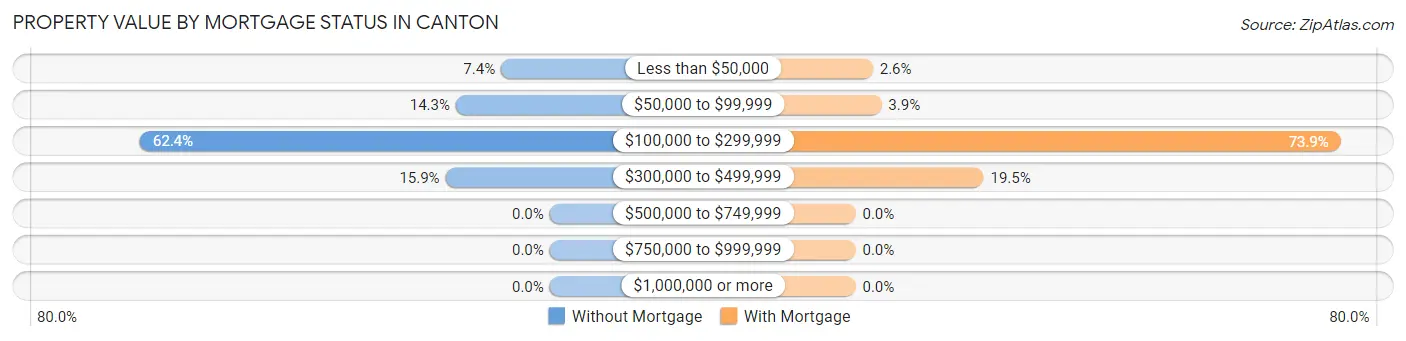
| Property Value | Without Mortgage | With Mortgage |
| Less than $50,000 | 28 (7.4%) | 14 (2.6%) |
| $50,000 to $99,999 | 54 (14.3%) | 21 (3.9%) |
| $100,000 to $299,999 | 236 (62.4%) | 394 (73.9%) |
| $300,000 to $499,999 | 60 (15.9%) | 104 (19.5%) |
| $500,000 to $749,999 | 0 (0.0%) | 0 (0.0%) |
| $750,000 to $999,999 | 0 (0.0%) | 0 (0.0%) |
| $1,000,000 or more | 0 (0.0%) | 0 (0.0%) |
| Total | 378 (100.0%) | 533 (100.0%) |
Household Income by Mortgage Status in Canton
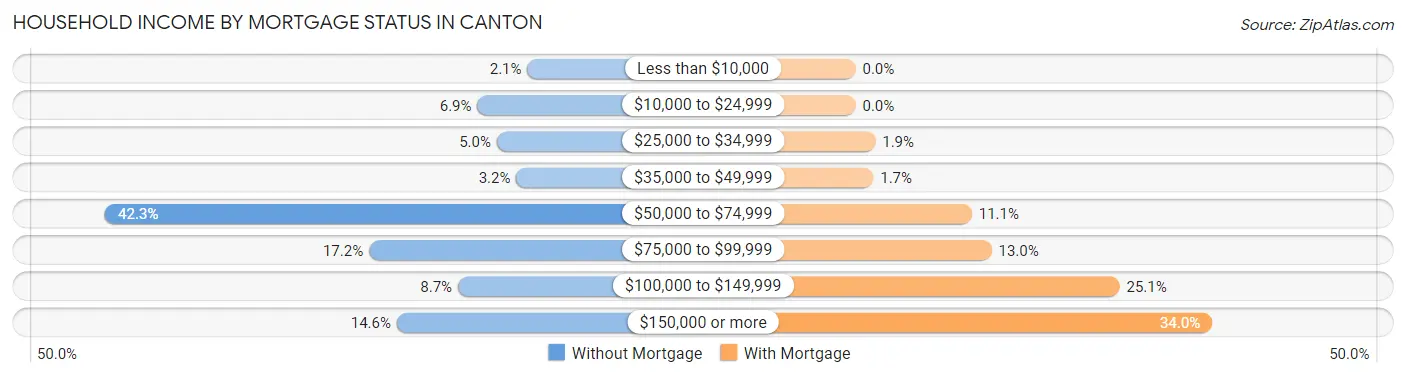
| Household Income | Without Mortgage | With Mortgage |
| Less than $10,000 | 8 (2.1%) | 0 (0.0%) |
| $10,000 to $24,999 | 26 (6.9%) | 0 (0.0%) |
| $25,000 to $34,999 | 19 (5.0%) | 10 (1.9%) |
| $35,000 to $49,999 | 12 (3.2%) | 9 (1.7%) |
| $50,000 to $74,999 | 160 (42.3%) | 59 (11.1%) |
| $75,000 to $99,999 | 65 (17.2%) | 69 (13.0%) |
| $100,000 to $149,999 | 33 (8.7%) | 134 (25.1%) |
| $150,000 or more | 55 (14.5%) | 181 (34.0%) |
| Total | 378 (100.0%) | 533 (100.0%) |
Property Value to Household Income Ratio in Canton
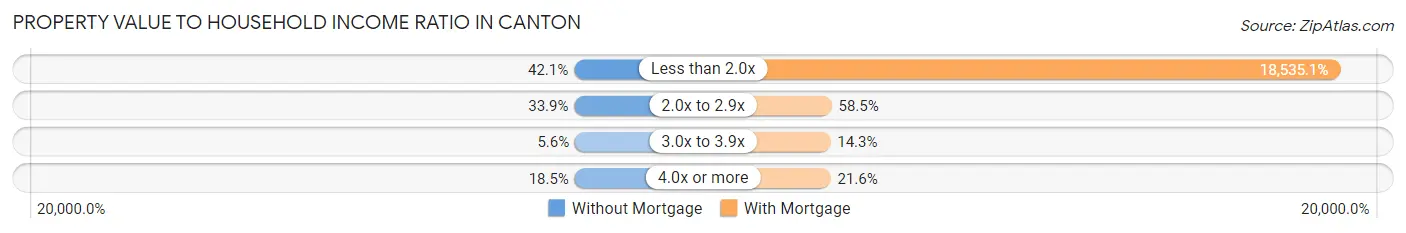
| Value-to-Income Ratio | Without Mortgage | With Mortgage |
| Less than 2.0x | 159 (42.1%) | 98,792 (18,535.1%) |
| 2.0x to 2.9x | 128 (33.9%) | 312 (58.5%) |
| 3.0x to 3.9x | 21 (5.6%) | 76 (14.3%) |
| 4.0x or more | 70 (18.5%) | 115 (21.6%) |
| Total | 378 (100.0%) | 533 (100.0%) |
Real Estate Taxes by Mortgage Status in Canton
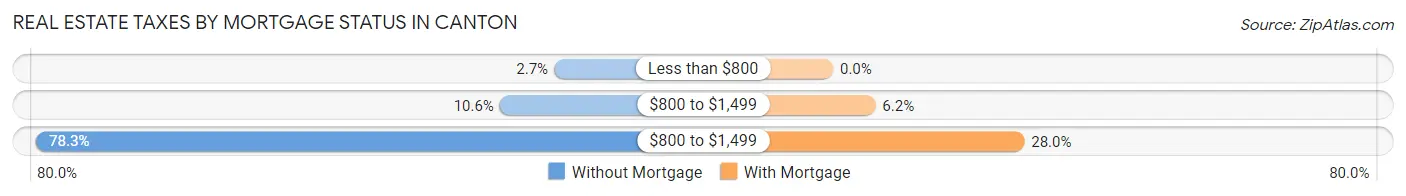
| Property Taxes | Without Mortgage | With Mortgage |
| Less than $800 | 10 (2.6%) | 0 (0.0%) |
| $800 to $1,499 | 40 (10.6%) | 33 (6.2%) |
| $800 to $1,499 | 296 (78.3%) | 149 (28.0%) |
| Total | 378 (100.0%) | 533 (100.0%) |
Health & Disability in Canton
Health Insurance Coverage by Age in Canton
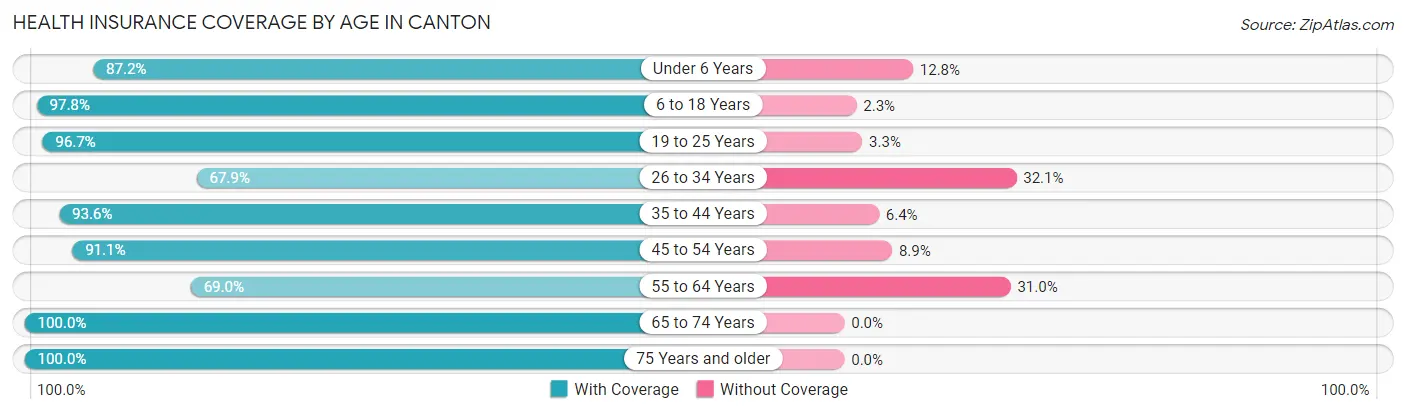
| Age Bracket | With Coverage | Without Coverage |
| Under 6 Years | 191 (87.2%) | 28 (12.8%) |
| 6 to 18 Years | 522 (97.8%) | 12 (2.2%) |
| 19 to 25 Years | 116 (96.7%) | 4 (3.3%) |
| 26 to 34 Years | 197 (67.9%) | 93 (32.1%) |
| 35 to 44 Years | 363 (93.6%) | 25 (6.4%) |
| 45 to 54 Years | 246 (91.1%) | 24 (8.9%) |
| 55 to 64 Years | 343 (69.0%) | 154 (31.0%) |
| 65 to 74 Years | 336 (100.0%) | 0 (0.0%) |
| 75 Years and older | 345 (100.0%) | 0 (0.0%) |
| Total | 2,659 (88.7%) | 340 (11.3%) |
Health Insurance Coverage by Citizenship Status in Canton
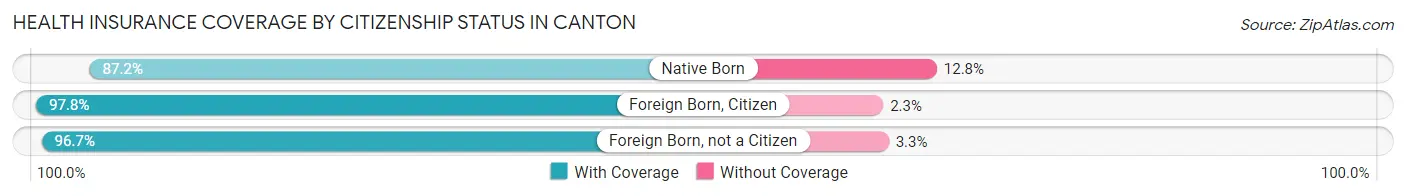
| Citizenship Status | With Coverage | Without Coverage |
| Native Born | 191 (87.2%) | 28 (12.8%) |
| Foreign Born, Citizen | 522 (97.8%) | 12 (2.2%) |
| Foreign Born, not a Citizen | 116 (96.7%) | 4 (3.3%) |
Health Insurance Coverage by Household Income in Canton
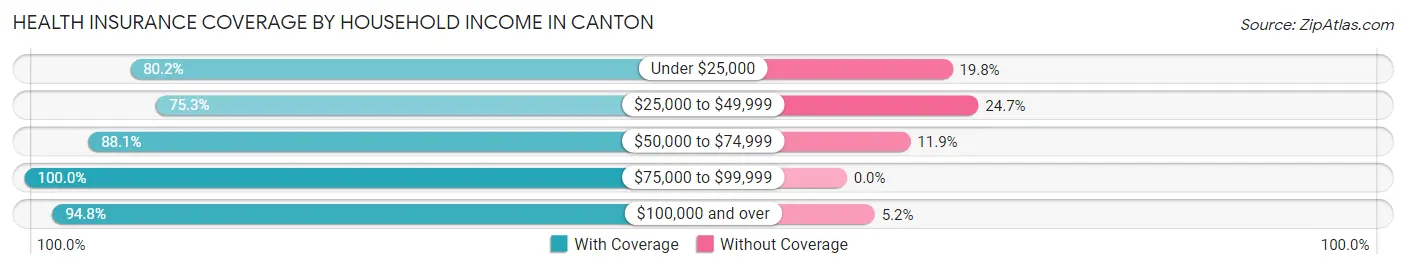
| Household Income | With Coverage | Without Coverage |
| Under $25,000 | 77 (80.2%) | 19 (19.8%) |
| $25,000 to $49,999 | 437 (75.3%) | 143 (24.7%) |
| $50,000 to $74,999 | 495 (88.1%) | 67 (11.9%) |
| $75,000 to $99,999 | 518 (100.0%) | 0 (0.0%) |
| $100,000 and over | 1,032 (94.8%) | 57 (5.2%) |
Public vs Private Health Insurance Coverage by Age in Canton
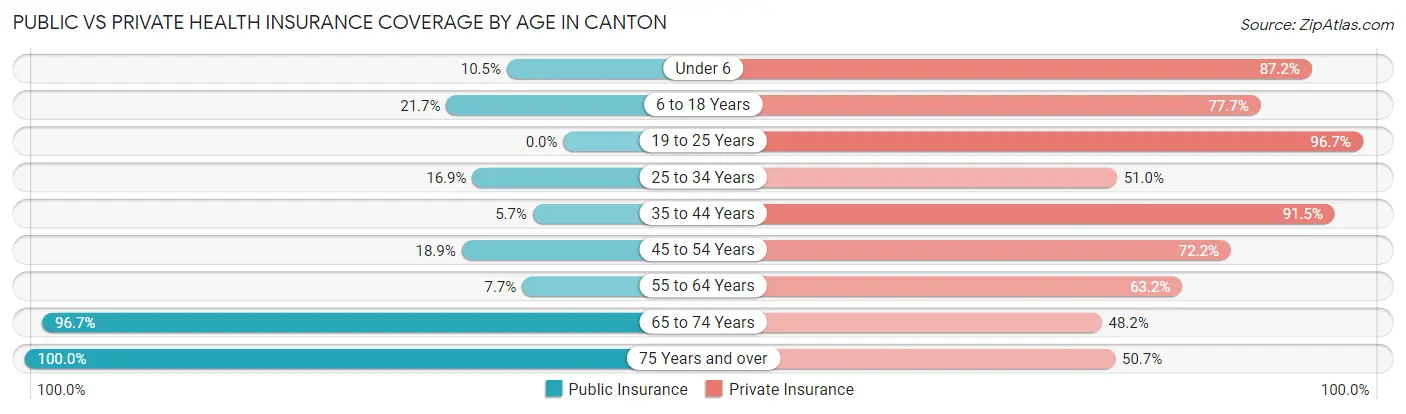
| Age Bracket | Public Insurance | Private Insurance |
| Under 6 | 23 (10.5%) | 191 (87.2%) |
| 6 to 18 Years | 116 (21.7%) | 415 (77.7%) |
| 19 to 25 Years | 0 (0.0%) | 116 (96.7%) |
| 25 to 34 Years | 49 (16.9%) | 148 (51.0%) |
| 35 to 44 Years | 22 (5.7%) | 355 (91.5%) |
| 45 to 54 Years | 51 (18.9%) | 195 (72.2%) |
| 55 to 64 Years | 38 (7.6%) | 314 (63.2%) |
| 65 to 74 Years | 325 (96.7%) | 162 (48.2%) |
| 75 Years and over | 345 (100.0%) | 175 (50.7%) |
| Total | 969 (32.3%) | 2,071 (69.1%) |
Disability Status by Sex by Age in Canton
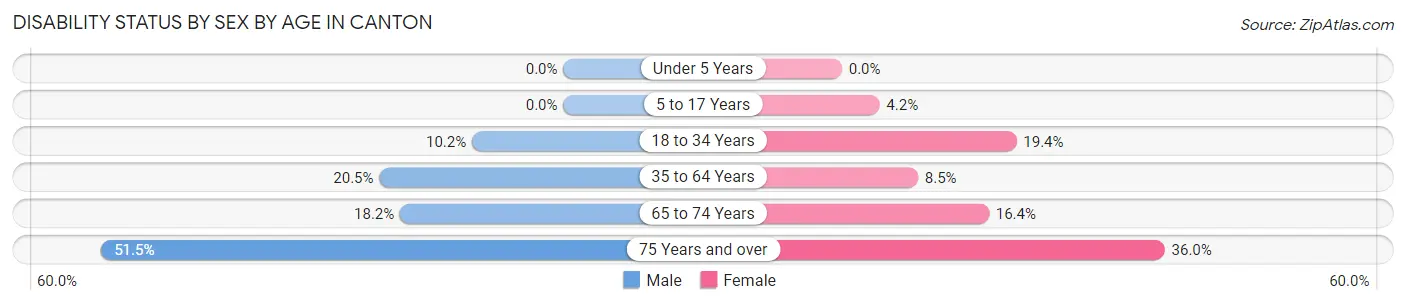
| Age Bracket | Male | Female |
| Under 5 Years | 0 (0.0%) | 0 (0.0%) |
| 5 to 17 Years | 0 (0.0%) | 13 (4.2%) |
| 18 to 34 Years | 12 (10.2%) | 62 (19.4%) |
| 35 to 64 Years | 152 (20.5%) | 35 (8.5%) |
| 65 to 74 Years | 20 (18.2%) | 37 (16.4%) |
| 75 Years and over | 53 (51.5%) | 87 (35.9%) |
Disability Class by Sex by Age in Canton
Disability Class: Hearing Difficulty
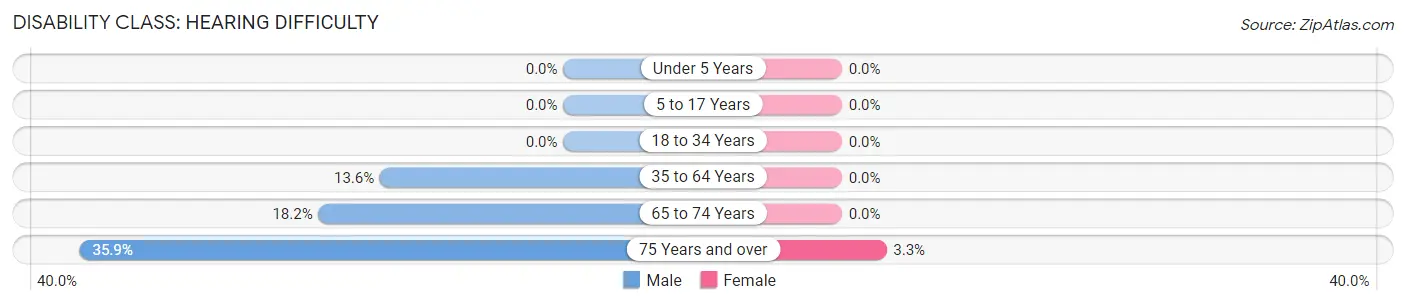
| Age Bracket | Male | Female |
| Under 5 Years | 0 (0.0%) | 0 (0.0%) |
| 5 to 17 Years | 0 (0.0%) | 0 (0.0%) |
| 18 to 34 Years | 0 (0.0%) | 0 (0.0%) |
| 35 to 64 Years | 101 (13.6%) | 0 (0.0%) |
| 65 to 74 Years | 20 (18.2%) | 0 (0.0%) |
| 75 Years and over | 37 (35.9%) | 8 (3.3%) |
Disability Class: Vision Difficulty
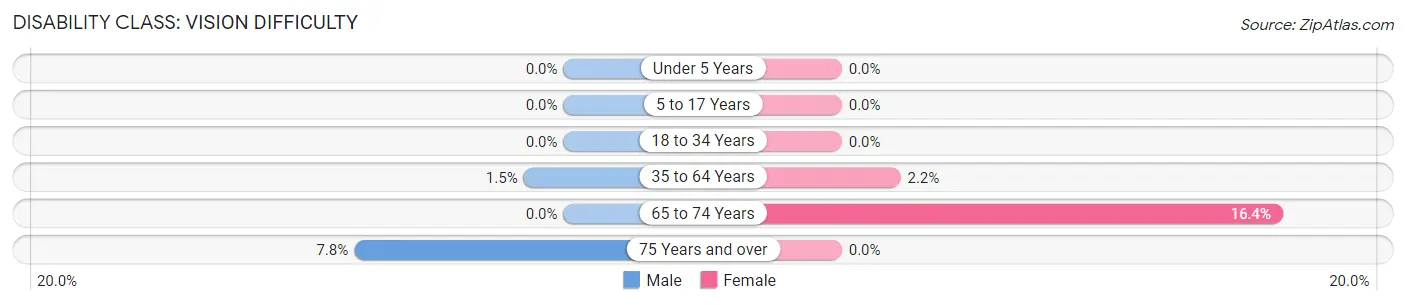
| Age Bracket | Male | Female |
| Under 5 Years | 0 (0.0%) | 0 (0.0%) |
| 5 to 17 Years | 0 (0.0%) | 0 (0.0%) |
| 18 to 34 Years | 0 (0.0%) | 0 (0.0%) |
| 35 to 64 Years | 11 (1.5%) | 9 (2.2%) |
| 65 to 74 Years | 0 (0.0%) | 37 (16.4%) |
| 75 Years and over | 8 (7.8%) | 0 (0.0%) |
Disability Class: Cognitive Difficulty
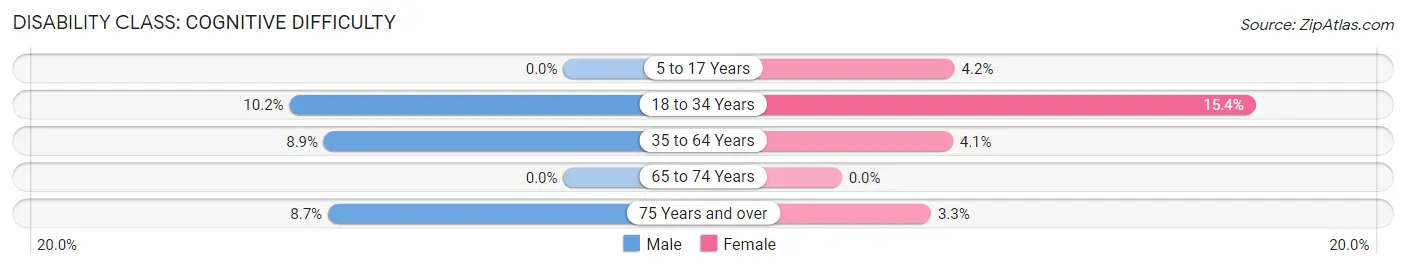
| Age Bracket | Male | Female |
| 5 to 17 Years | 0 (0.0%) | 13 (4.2%) |
| 18 to 34 Years | 12 (10.2%) | 49 (15.4%) |
| 35 to 64 Years | 66 (8.9%) | 17 (4.1%) |
| 65 to 74 Years | 0 (0.0%) | 0 (0.0%) |
| 75 Years and over | 9 (8.7%) | 8 (3.3%) |
Disability Class: Ambulatory Difficulty
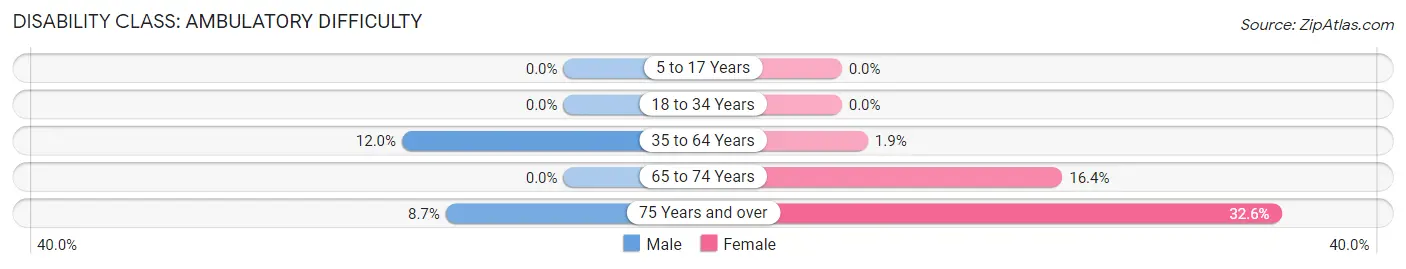
| Age Bracket | Male | Female |
| 5 to 17 Years | 0 (0.0%) | 0 (0.0%) |
| 18 to 34 Years | 0 (0.0%) | 0 (0.0%) |
| 35 to 64 Years | 89 (12.0%) | 8 (1.9%) |
| 65 to 74 Years | 0 (0.0%) | 37 (16.4%) |
| 75 Years and over | 9 (8.7%) | 79 (32.6%) |
Disability Class: Self-Care Difficulty
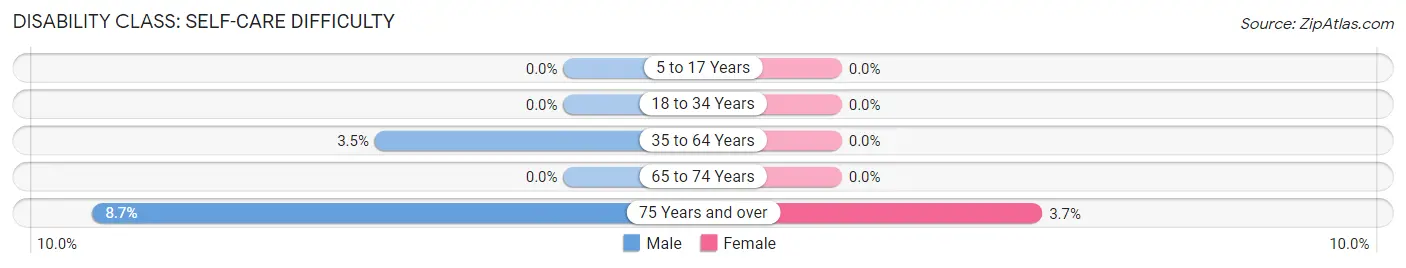
| Age Bracket | Male | Female |
| 5 to 17 Years | 0 (0.0%) | 0 (0.0%) |
| 18 to 34 Years | 0 (0.0%) | 0 (0.0%) |
| 35 to 64 Years | 26 (3.5%) | 0 (0.0%) |
| 65 to 74 Years | 0 (0.0%) | 0 (0.0%) |
| 75 Years and over | 9 (8.7%) | 9 (3.7%) |
Technology Access in Canton
Computing Device Access in Canton
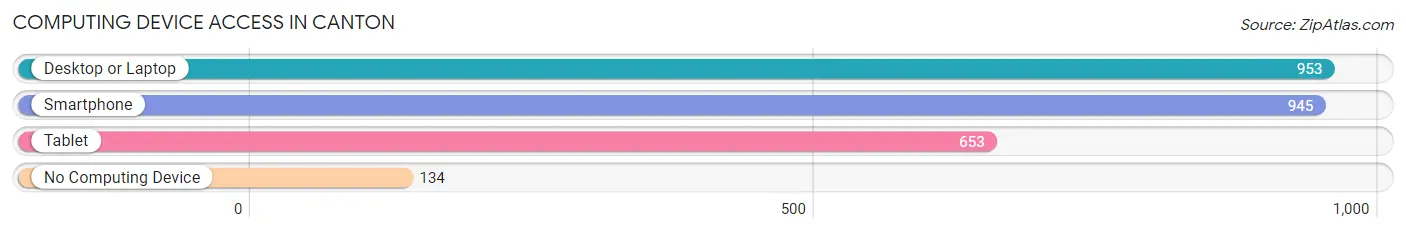
| Device Type | # Households | % Households |
| Desktop or Laptop | 953 | 71.7% |
| Smartphone | 945 | 71.1% |
| Tablet | 653 | 49.1% |
| No Computing Device | 134 | 10.1% |
| Total | 1,330 | 100.0% |
Internet Access in Canton
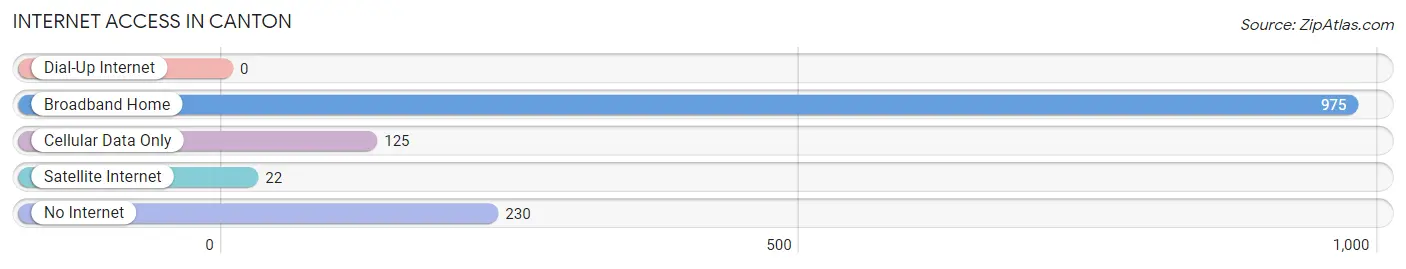
| Internet Type | # Households | % Households |
| Dial-Up Internet | 0 | 0.0% |
| Broadband Home | 975 | 73.3% |
| Cellular Data Only | 125 | 9.4% |
| Satellite Internet | 22 | 1.7% |
| No Internet | 230 | 17.3% |
| Total | 1,330 | 100.0% |
Canton Summary
Canton, South Dakota is a small city located in Lincoln County, in the southeastern part of the state. It is situated on the Big Sioux River, about 25 miles northwest of Sioux Falls. The city has a population of approximately 4,000 people, and is the county seat of Lincoln County.
History
Canton was founded in 1873 by a group of settlers from Canton, Ohio. The city was named after the Ohio city, and was incorporated in 1881. The city was originally a farming community, and the first railroad line was built in 1879. This allowed the city to become a major shipping point for agricultural products.
In the early 1900s, Canton began to experience a period of growth and development. The city was home to several businesses, including a flour mill, a creamery, a brickyard, and a lumberyard. The city also had a number of churches, schools, and other civic organizations.
In the 1950s, Canton began to experience a period of decline. The railroad line was abandoned, and many of the businesses closed. The city was also affected by the Great Depression, and many of the residents moved away.
Geography
Canton is located in the southeastern part of South Dakota, in Lincoln County. The city is situated on the Big Sioux River, about 25 miles northwest of Sioux Falls. The city has a total area of 2.3 square miles, all of which is land.
The city is located in a region of rolling hills and prairies. The climate is characterized by hot summers and cold winters. The average annual temperature is around 50 degrees Fahrenheit.
Economy
Canton’s economy is largely based on agriculture. The city is home to several farms, and the surrounding area is known for its production of corn, soybeans, and other crops. The city is also home to several manufacturing companies, including a furniture factory and a plastics plant.
The city is also home to several retail stores, restaurants, and other businesses. The city is served by the Canton-Inwood Airport, which provides air service to the region.
Demographics
As of the 2010 census, the population of Canton was 4,039. The racial makeup of the city was 94.3% White, 0.7% African American, 0.3% Native American, 0.3% Asian, 0.1% Pacific Islander, 2.2% from other races, and 2.3% from two or more races. Hispanic or Latino of any race were 4.2% of the population.
The median household income in Canton was $41,944, and the median family income was $50,917. The per capita income was $20,945. About 8.3% of families and 11.2% of the population were below the poverty line, including 15.2% of those under age 18 and 8.2% of those age 65 or over.
Canton is a small city with a rich history and a diverse economy. The city is home to several businesses, and the surrounding area is known for its agricultural production. The city is also home to a number of churches, schools, and other civic organizations. The city has a population of approximately 4,000 people, and is the county seat of Lincoln County.
Common Questions
What is Per Capita Income in Canton?
Per Capita income in Canton is $43,803.
What is the Median Family Income in Canton?
Median Family Income in Canton is $96,821.
What is the Median Household income in Canton?
Median Household Income in Canton is $71,064.
What is Income or Wage Gap in Canton?
Income or Wage Gap in Canton is 38.6%.
Women in Canton earn 61.4 cents for every dollar earned by a man.
What is Inequality or Gini Index in Canton?
Inequality or Gini Index in Canton is 0.44.
What is the Total Population of Canton?
Total Population of Canton is 3,060.
What is the Total Male Population of Canton?
Total Male Population of Canton is 1,451.
What is the Total Female Population of Canton?
Total Female Population of Canton is 1,609.
What is the Ratio of Males per 100 Females in Canton?
There are 90.18 Males per 100 Females in Canton.
What is the Ratio of Females per 100 Males in Canton?
There are 110.89 Females per 100 Males in Canton.
What is the Median Population Age in Canton?
Median Population Age in Canton is 43.6 Years.
What is the Average Family Size in Canton
Average Family Size in Canton is 2.8 People.
What is the Average Household Size in Canton
Average Household Size in Canton is 2.1 People.
How Large is the Labor Force in Canton?
There are 1,683 People in the Labor Forcein in Canton.
What is the Percentage of People in the Labor Force in Canton?
69.9% of People are in the Labor Force in Canton.
What is the Unemployment Rate in Canton?
Unemployment Rate in Canton is 5.6%.