Rapid City, SD Map & Demographics
Rapid City Map
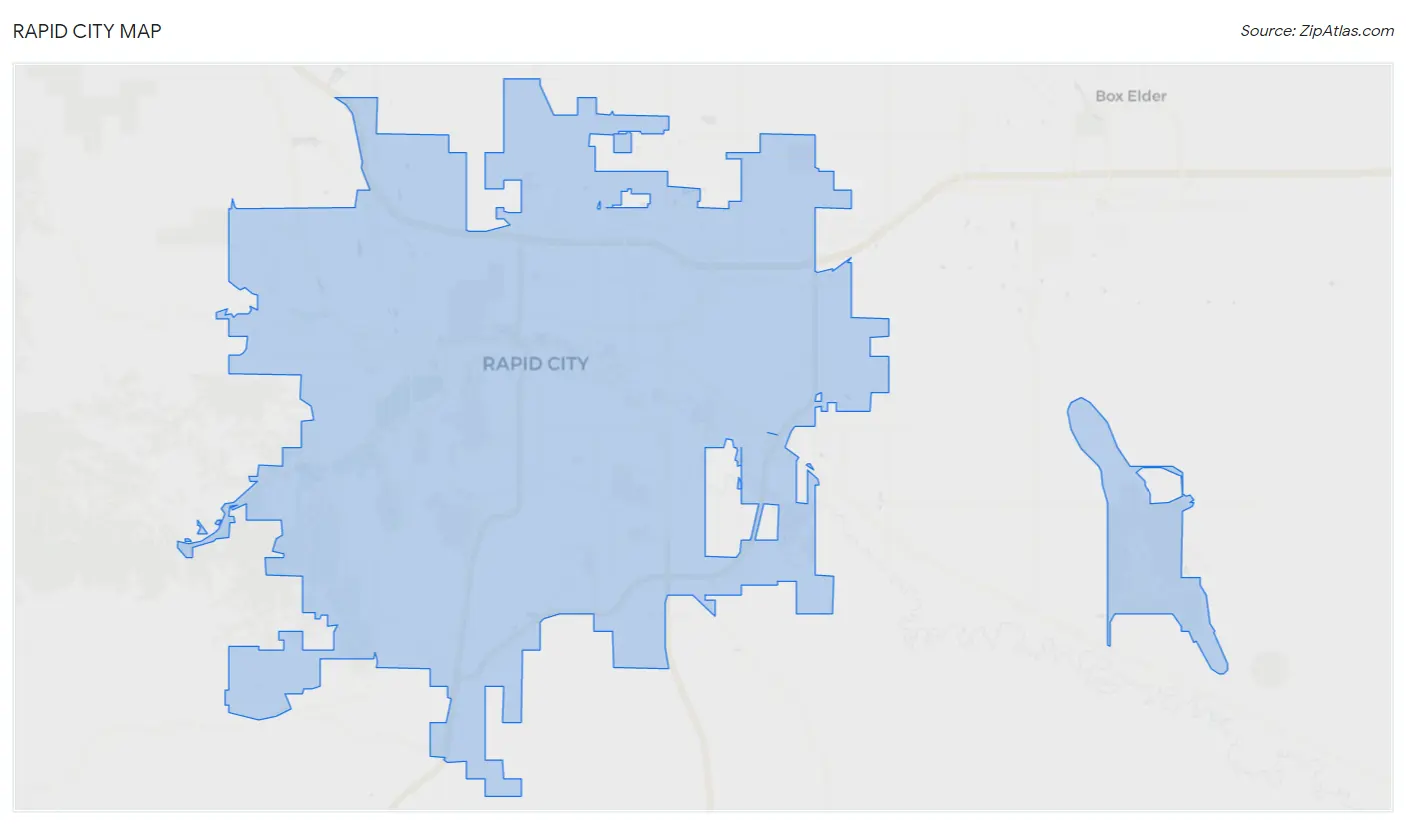
Rapid City Overview
$38,421
PER CAPITA INCOME
$83,972
AVG FAMILY INCOME
$62,784
AVG HOUSEHOLD INCOME
12.6%
WAGE / INCOME GAP [ % ]
87.4¢/ $1
WAGE / INCOME GAP [ $ ]
$11,624
FAMILY INCOME DEFICIT
0.48
INEQUALITY / GINI INDEX
75,632
TOTAL POPULATION
38,256
MALE POPULATION
37,376
FEMALE POPULATION
102.35
MALES / 100 FEMALES
97.70
FEMALES / 100 MALES
38.6
MEDIAN AGE
3.0
AVG FAMILY SIZE
2.3
AVG HOUSEHOLD SIZE
39,144
LABOR FORCE [ PEOPLE ]
64.2%
PERCENT IN LABOR FORCE
3.4%
UNEMPLOYMENT RATE
Rapid City Area Codes
Income in Rapid City
Income Overview in Rapid City
Per Capita Income in Rapid City is $38,421, while median incomes of families and households are $83,972 and $62,784 respectively.
| Characteristic | Number | Measure |
| Per Capita Income | 75,632 | $38,421 |
| Median Family Income | 17,308 | $83,972 |
| Mean Family Income | 17,308 | $113,189 |
| Median Household Income | 31,453 | $62,784 |
| Mean Household Income | 31,453 | $88,029 |
| Income Deficit | 17,308 | $11,624 |
| Wage / Income Gap (%) | 75,632 | 12.64% |
| Wage / Income Gap ($) | 75,632 | 87.36¢ per $1 |
| Gini / Inequality Index | 75,632 | 0.48 |
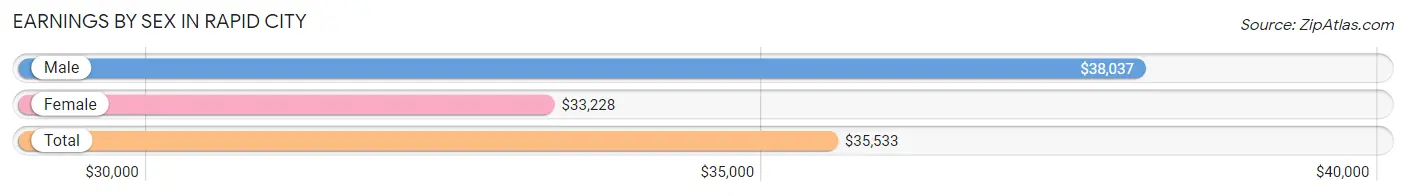
Earnings by Sex in Rapid City
Average Earnings in Rapid City are $35,533, $38,037 for men and $33,228 for women, a difference of 12.6%.
| Sex | Number | Average Earnings |
| Male | 22,853 (53.7%) | $38,037 |
| Female | 19,682 (46.3%) | $33,228 |
| Total | 42,535 (100.0%) | $35,533 |
Earnings by Sex by Income Bracket in Rapid City
The most common earnings brackets in Rapid City are $100,000+ for men (2,916 | 12.8%) and $35,000 to $39,999 for women (1,459 | 7.4%).
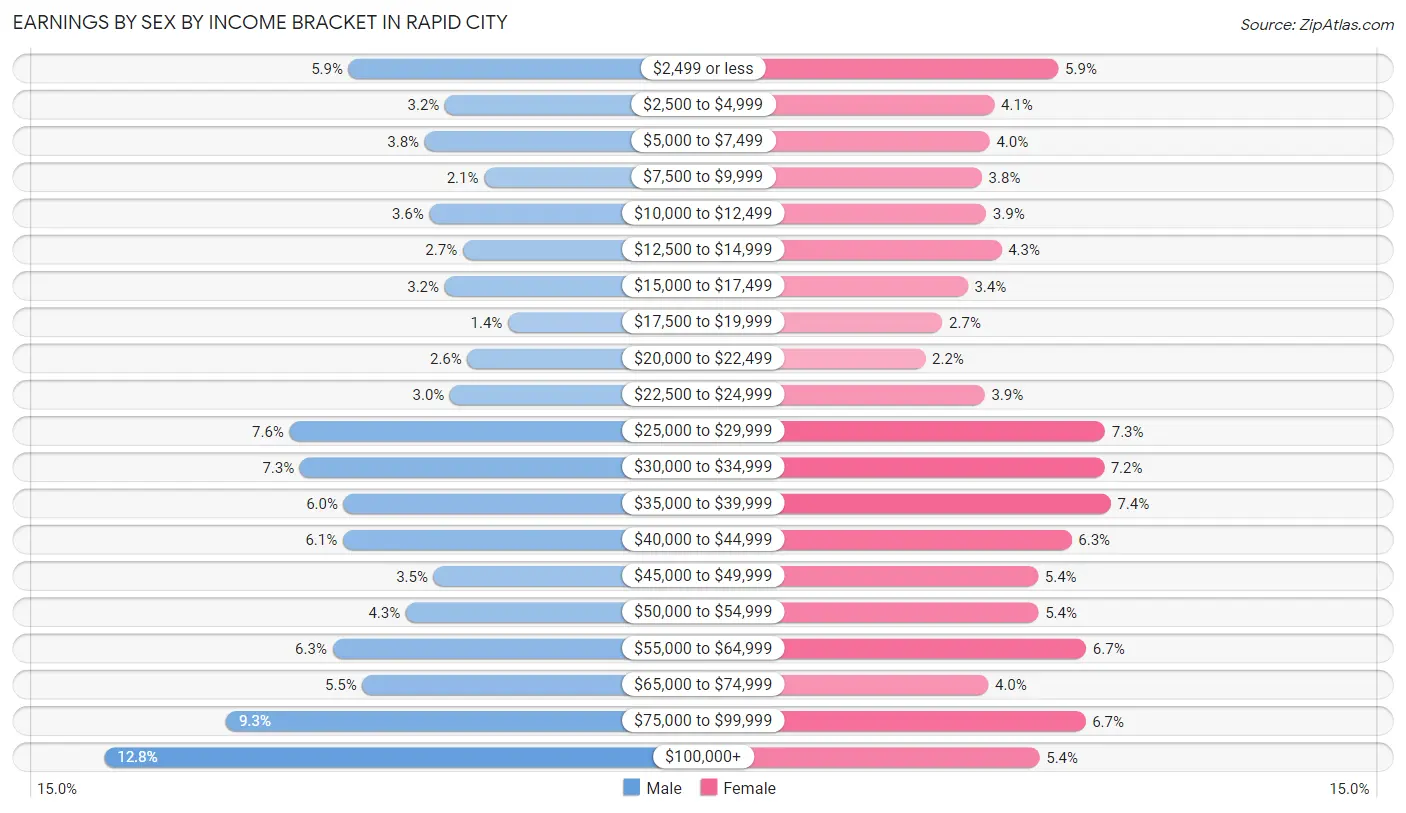
| Income | Male | Female |
| $2,499 or less | 1,347 (5.9%) | 1,169 (5.9%) |
| $2,500 to $4,999 | 727 (3.2%) | 814 (4.1%) |
| $5,000 to $7,499 | 857 (3.7%) | 789 (4.0%) |
| $7,500 to $9,999 | 475 (2.1%) | 746 (3.8%) |
| $10,000 to $12,499 | 827 (3.6%) | 769 (3.9%) |
| $12,500 to $14,999 | 613 (2.7%) | 854 (4.3%) |
| $15,000 to $17,499 | 728 (3.2%) | 667 (3.4%) |
| $17,500 to $19,999 | 322 (1.4%) | 528 (2.7%) |
| $20,000 to $22,499 | 582 (2.5%) | 433 (2.2%) |
| $22,500 to $24,999 | 695 (3.0%) | 762 (3.9%) |
| $25,000 to $29,999 | 1,726 (7.5%) | 1,426 (7.2%) |
| $30,000 to $34,999 | 1,659 (7.3%) | 1,422 (7.2%) |
| $35,000 to $39,999 | 1,379 (6.0%) | 1,459 (7.4%) |
| $40,000 to $44,999 | 1,382 (6.0%) | 1,242 (6.3%) |
| $45,000 to $49,999 | 800 (3.5%) | 1,057 (5.4%) |
| $50,000 to $54,999 | 978 (4.3%) | 1,059 (5.4%) |
| $55,000 to $64,999 | 1,450 (6.3%) | 1,322 (6.7%) |
| $65,000 to $74,999 | 1,256 (5.5%) | 781 (4.0%) |
| $75,000 to $99,999 | 2,134 (9.3%) | 1,318 (6.7%) |
| $100,000+ | 2,916 (12.8%) | 1,065 (5.4%) |
| Total | 22,853 (100.0%) | 19,682 (100.0%) |
Earnings by Sex by Educational Attainment in Rapid City
Average earnings in Rapid City are $44,765 for men and $37,742 for women, a difference of 15.7%. Men with an educational attainment of graduate degree enjoy the highest average annual earnings of $103,563, while those with less than high school education earn the least with $28,519. Women with an educational attainment of graduate degree earn the most with the average annual earnings of $66,307, while those with less than high school education have the smallest earnings of $20,060.
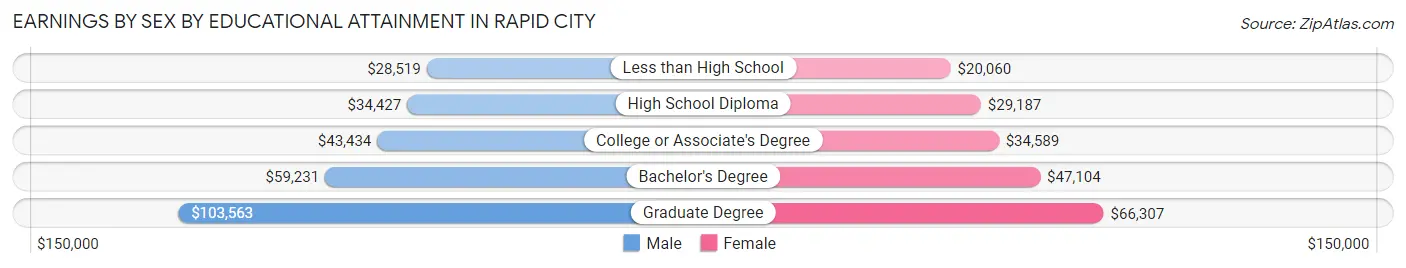
| Educational Attainment | Male Income | Female Income |
| Less than High School | $28,519 | $20,060 |
| High School Diploma | $34,427 | $29,187 |
| College or Associate's Degree | $43,434 | $34,589 |
| Bachelor's Degree | $59,231 | $47,104 |
| Graduate Degree | $103,563 | $66,307 |
| Total | $44,765 | $37,742 |
Family Income in Rapid City
Family Income Brackets in Rapid City
According to the Rapid City family income data, there are 3,531 families falling into the $100,000 to $149,999 income range, which is the most common income bracket and makes up 20.4% of all families. Conversely, the $10,000 to $14,999 income bracket is the least frequent group with only 329 families (1.9%) belonging to this category.
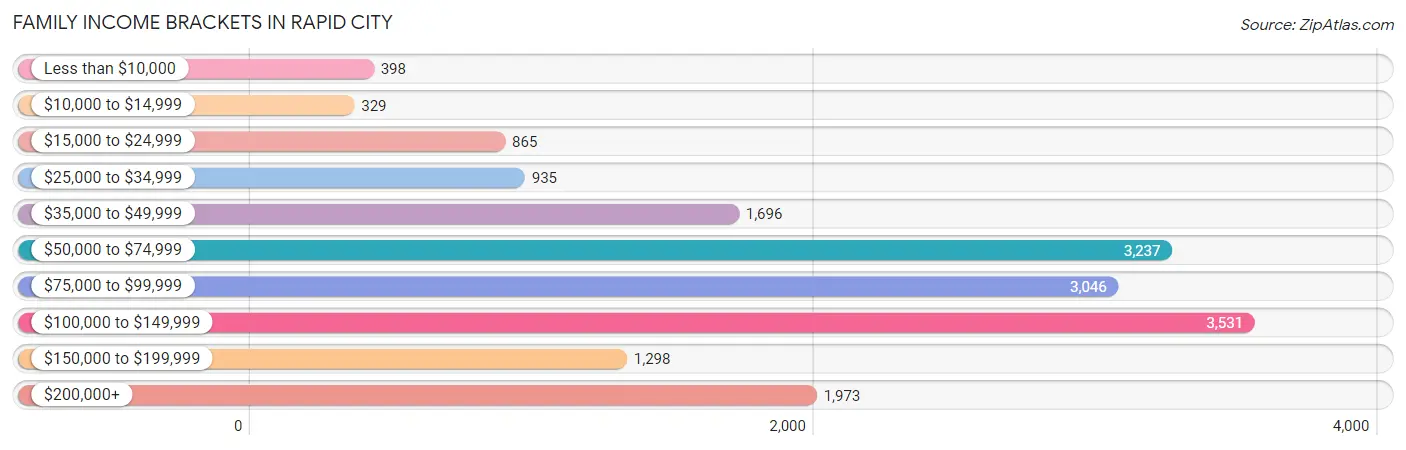
| Income Bracket | # Families | % Families |
| Less than $10,000 | 398 | 2.3% |
| $10,000 to $14,999 | 329 | 1.9% |
| $15,000 to $24,999 | 865 | 5.0% |
| $25,000 to $34,999 | 935 | 5.4% |
| $35,000 to $49,999 | 1,696 | 9.8% |
| $50,000 to $74,999 | 3,237 | 18.7% |
| $75,000 to $99,999 | 3,046 | 17.6% |
| $100,000 to $149,999 | 3,531 | 20.4% |
| $150,000 to $199,999 | 1,298 | 7.5% |
| $200,000+ | 1,973 | 11.4% |
Family Income by Famaliy Size in Rapid City
6-person families (358 | 2.1%) account for the highest median family income in Rapid City with $203,813 per family, while 2-person families (9,494 | 54.8%) have the highest median income of $40,594 per family member.
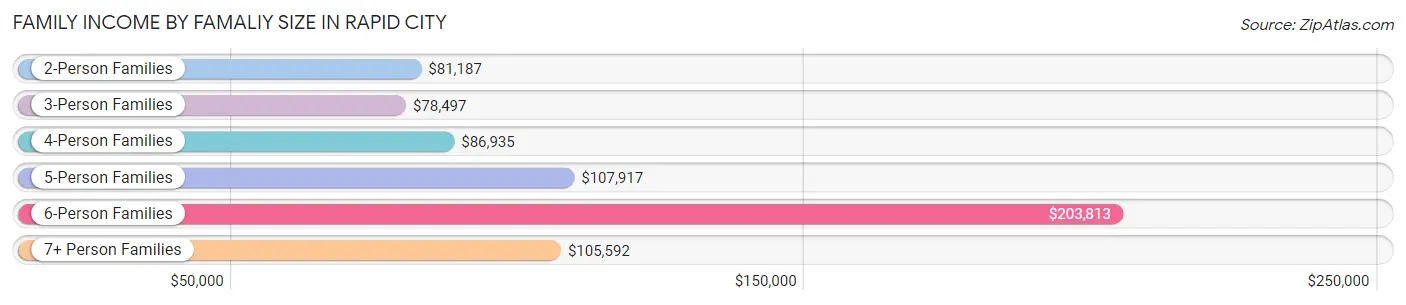
| Income Bracket | # Families | Median Income |
| 2-Person Families | 9,494 (54.8%) | $81,187 |
| 3-Person Families | 3,208 (18.5%) | $78,497 |
| 4-Person Families | 3,005 (17.4%) | $86,935 |
| 5-Person Families | 1,056 (6.1%) | $107,917 |
| 6-Person Families | 358 (2.1%) | $203,813 |
| 7+ Person Families | 187 (1.1%) | $105,592 |
| Total | 17,308 (100.0%) | $83,972 |
Family Income by Number of Earners in Rapid City
The median family income in Rapid City is $83,972, with families comprising 3+ earners (1,696) having the highest median family income of $124,380, while families with 1 earner (4,610) have the lowest median family income of $62,005, accounting for 9.8% and 26.6% of families, respectively.
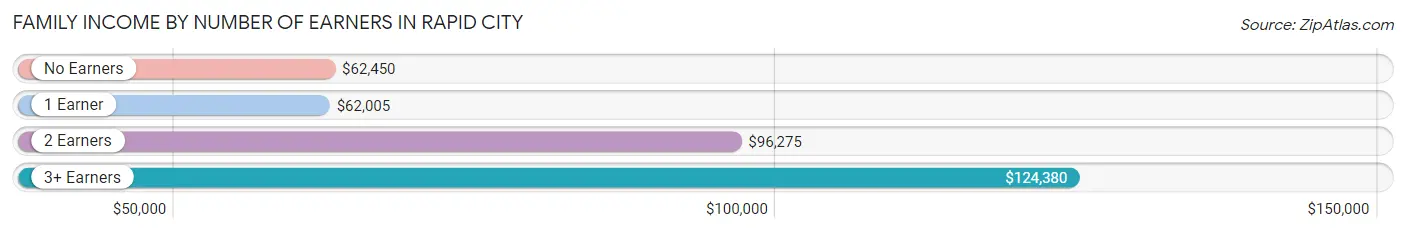
| Number of Earners | # Families | Median Income |
| No Earners | 3,033 (17.5%) | $62,450 |
| 1 Earner | 4,610 (26.6%) | $62,005 |
| 2 Earners | 7,969 (46.0%) | $96,275 |
| 3+ Earners | 1,696 (9.8%) | $124,380 |
| Total | 17,308 (100.0%) | $83,972 |
Household Income in Rapid City
Household Income Brackets in Rapid City
With 5,913 households falling in the category, the $50,000 to $74,999 income range is the most frequent in Rapid City, accounting for 18.8% of all households. In contrast, only 1,258 households (4.0%) fall into the less than $10,000 income bracket, making it the least populous group.
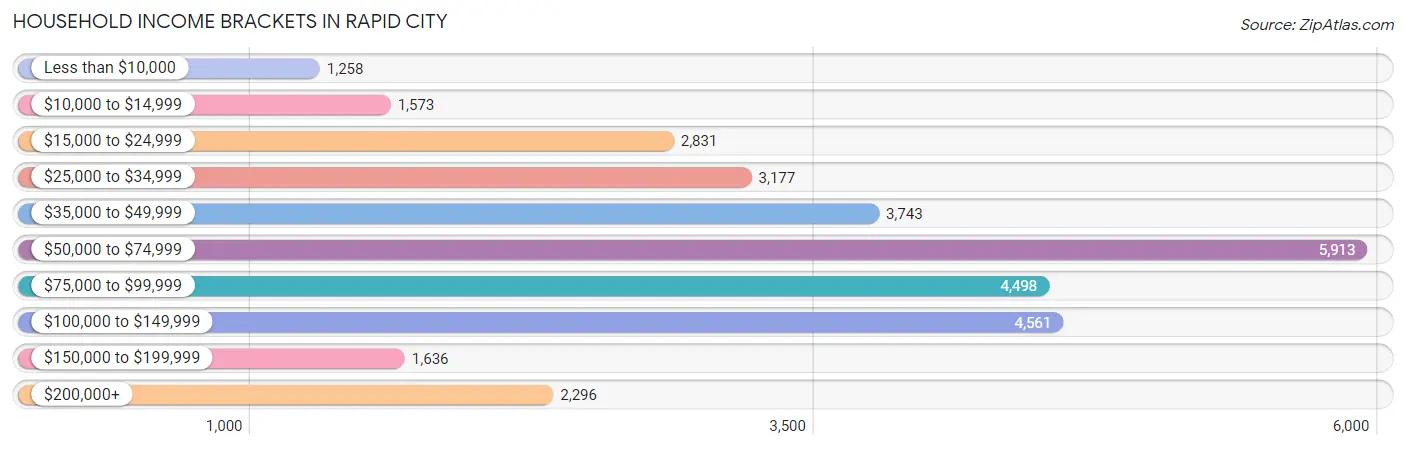
| Income Bracket | # Households | % Households |
| Less than $10,000 | 1,258 | 4.0% |
| $10,000 to $14,999 | 1,573 | 5.0% |
| $15,000 to $24,999 | 2,831 | 9.0% |
| $25,000 to $34,999 | 3,177 | 10.1% |
| $35,000 to $49,999 | 3,743 | 11.9% |
| $50,000 to $74,999 | 5,913 | 18.8% |
| $75,000 to $99,999 | 4,498 | 14.3% |
| $100,000 to $149,999 | 4,561 | 14.5% |
| $150,000 to $199,999 | 1,636 | 5.2% |
| $200,000+ | 2,296 | 7.3% |
Household Income by Householder Age in Rapid City
The median household income in Rapid City is $62,784, with the highest median household income of $77,785 found in the 45 to 64 years age bracket for the primary householder. A total of 9,760 households (31.0%) fall into this category. Meanwhile, the 15 to 24 years age bracket for the primary householder has the lowest median household income of $36,835, with 1,918 households (6.1%) in this group.
| Income Bracket | # Households | Median Income |
| 15 to 24 Years | 1,918 (6.1%) | $36,835 |
| 25 to 44 Years | 9,934 (31.6%) | $70,065 |
| 45 to 64 Years | 9,760 (31.0%) | $77,785 |
| 65+ Years | 9,841 (31.3%) | $49,935 |
| Total | 31,453 (100.0%) | $62,784 |
Poverty in Rapid City
Income Below Poverty by Sex and Age in Rapid City
With 11.5% poverty level for males and 15.4% for females among the residents of Rapid City, 5 year old males and 12 to 14 year old females are the most vulnerable to poverty, with 100 males (28.5%) and 317 females (27.5%) in their respective age groups living below the poverty level.
| Age Bracket | Male | Female |
| Under 5 Years | 266 (11.0%) | 491 (23.9%) |
| 5 Years | 100 (28.5%) | 50 (8.9%) |
| 6 to 11 Years | 700 (25.7%) | 502 (19.8%) |
| 12 to 14 Years | 190 (13.4%) | 317 (27.5%) |
| 15 Years | 76 (11.8%) | 78 (20.0%) |
| 16 and 17 Years | 191 (21.6%) | 231 (22.4%) |
| 18 to 24 Years | 476 (14.2%) | 590 (20.9%) |
| 25 to 34 Years | 580 (11.1%) | 705 (14.6%) |
| 35 to 44 Years | 278 (6.3%) | 538 (11.6%) |
| 45 to 54 Years | 448 (12.4%) | 348 (9.3%) |
| 55 to 64 Years | 411 (9.3%) | 814 (16.4%) |
| 65 to 74 Years | 357 (7.9%) | 431 (9.7%) |
| 75 Years and over | 94 (4.1%) | 485 (15.1%) |
| Total | 4,167 (11.5%) | 5,580 (15.4%) |
Income Above Poverty by Sex and Age in Rapid City
According to the poverty statistics in Rapid City, males aged 75 years and over and females aged 5 years are the age groups that are most secure financially, with 95.9% of males and 91.1% of females in these age groups living above the poverty line.
| Age Bracket | Male | Female |
| Under 5 Years | 2,164 (89.0%) | 1,559 (76.0%) |
| 5 Years | 251 (71.5%) | 513 (91.1%) |
| 6 to 11 Years | 2,026 (74.3%) | 2,037 (80.2%) |
| 12 to 14 Years | 1,228 (86.6%) | 836 (72.5%) |
| 15 Years | 570 (88.2%) | 312 (80.0%) |
| 16 and 17 Years | 695 (78.4%) | 802 (77.6%) |
| 18 to 24 Years | 2,868 (85.8%) | 2,229 (79.1%) |
| 25 to 34 Years | 4,644 (88.9%) | 4,117 (85.4%) |
| 35 to 44 Years | 4,104 (93.7%) | 4,083 (88.4%) |
| 45 to 54 Years | 3,168 (87.6%) | 3,404 (90.7%) |
| 55 to 64 Years | 4,022 (90.7%) | 4,142 (83.6%) |
| 65 to 74 Years | 4,148 (92.1%) | 3,995 (90.3%) |
| 75 Years and over | 2,217 (95.9%) | 2,724 (84.9%) |
| Total | 32,105 (88.5%) | 30,753 (84.6%) |
Income Below Poverty Among Married-Couple Families in Rapid City
The poverty statistics for married-couple families in Rapid City show that 2.7% or 354 of the total 12,901 families live below the poverty line. Families with 5 or more children have the highest poverty rate of 33.3%, comprising of 36 families. On the other hand, families with no children have the lowest poverty rate of 1.8%, which includes 145 families.
| Children | Above Poverty | Below Poverty |
| No Children | 8,095 (98.2%) | 145 (1.8%) |
| 1 or 2 Children | 3,524 (98.1%) | 70 (1.9%) |
| 3 or 4 Children | 856 (89.3%) | 103 (10.7%) |
| 5 or more Children | 72 (66.7%) | 36 (33.3%) |
| Total | 12,547 (97.3%) | 354 (2.7%) |
Income Below Poverty Among Single-Parent Households in Rapid City
According to the poverty data in Rapid City, 15.8% or 200 single-father households and 28.3% or 888 single-mother households are living below the poverty line. Among single-father households, those with 3 or 4 children have the highest poverty rate, with 40 households (37.7%) experiencing poverty. Likewise, among single-mother households, those with 5 or more children have the highest poverty rate, with 45 households (70.3%) falling below the poverty line.
| Children | Single Father | Single Mother |
| No Children | 0 (0.0%) | 91 (10.0%) |
| 1 or 2 Children | 160 (24.6%) | 412 (24.8%) |
| 3 or 4 Children | 40 (37.7%) | 340 (66.8%) |
| 5 or more Children | 0 (0.0%) | 45 (70.3%) |
| Total | 200 (15.8%) | 888 (28.3%) |
Income Below Poverty Among Married-Couple vs Single-Parent Households in Rapid City
The poverty data for Rapid City shows that 354 of the married-couple family households (2.7%) and 1,088 of the single-parent households (24.7%) are living below the poverty level. Within the married-couple family households, those with 5 or more children have the highest poverty rate, with 36 households (33.3%) falling below the poverty line. Among the single-parent households, those with 5 or more children have the highest poverty rate, with 45 household (70.3%) living below poverty.
| Children | Married-Couple Families | Single-Parent Households |
| No Children | 145 (1.8%) | 91 (6.4%) |
| 1 or 2 Children | 70 (1.9%) | 572 (24.8%) |
| 3 or 4 Children | 103 (10.7%) | 380 (61.8%) |
| 5 or more Children | 36 (33.3%) | 45 (70.3%) |
| Total | 354 (2.7%) | 1,088 (24.7%) |
Race in Rapid City
The most populous races in Rapid City are White / Caucasian (59,341 | 78.5%), Two or more Races (7,004 | 9.3%), and Native / Alaskan (6,440 | 8.5%).
| Race | # Population | % Population |
| Asian | 936 | 1.2% |
| Black / African American | 1,220 | 1.6% |
| Hawaiian / Pacific | 30 | 0.0% |
| Hispanic or Latino | 4,649 | 6.1% |
| Native / Alaskan | 6,440 | 8.5% |
| White / Caucasian | 59,341 | 78.5% |
| Two or more Races | 7,004 | 9.3% |
| Some other Race | 661 | 0.9% |
| Total | 75,632 | 100.0% |
Ancestry in Rapid City
The most populous ancestries reported in Rapid City are German (21,183 | 28.0%), Irish (9,171 | 12.1%), Sioux (7,957 | 10.5%), Norwegian (7,336 | 9.7%), and English (7,082 | 9.4%), together accounting for 69.7% of all Rapid City residents.
| Ancestry | # Population | % Population |
| African | 21 | 0.0% |
| Alaska Native | 93 | 0.1% |
| Albanian | 133 | 0.2% |
| Alsatian | 46 | 0.1% |
| American | 2,847 | 3.8% |
| Arab | 362 | 0.5% |
| Arapaho | 54 | 0.1% |
| Argentinean | 56 | 0.1% |
| Austrian | 56 | 0.1% |
| Basque | 22 | 0.0% |
| Belgian | 30 | 0.0% |
| Bhutanese | 193 | 0.3% |
| Blackfeet | 99 | 0.1% |
| British | 397 | 0.5% |
| Bulgarian | 6 | 0.0% |
| Burmese | 180 | 0.2% |
| Canadian | 302 | 0.4% |
| Central American | 272 | 0.4% |
| Central American Indian | 23 | 0.0% |
| Cherokee | 327 | 0.4% |
| Cheyenne | 70 | 0.1% |
| Chickasaw | 10 | 0.0% |
| Chippewa | 66 | 0.1% |
| Choctaw | 48 | 0.1% |
| Colombian | 18 | 0.0% |
| Comanche | 10 | 0.0% |
| Croatian | 14 | 0.0% |
| Czech | 1,441 | 1.9% |
| Czechoslovakian | 64 | 0.1% |
| Danish | 1,160 | 1.5% |
| Dutch | 1,427 | 1.9% |
| Eastern European | 155 | 0.2% |
| Egyptian | 104 | 0.1% |
| English | 7,082 | 9.4% |
| Ethiopian | 11 | 0.0% |
| European | 1,437 | 1.9% |
| Fijian | 12 | 0.0% |
| Finnish | 313 | 0.4% |
| French | 2,893 | 3.8% |
| French Canadian | 285 | 0.4% |
| German | 21,183 | 28.0% |
| German Russian | 25 | 0.0% |
| Greek | 324 | 0.4% |
| Guamanian / Chamorro | 49 | 0.1% |
| Guatemalan | 37 | 0.1% |
| Haitian | 151 | 0.2% |
| Honduran | 72 | 0.1% |
| Hungarian | 213 | 0.3% |
| Icelander | 33 | 0.0% |
| Indian (Asian) | 119 | 0.2% |
| Indonesian | 59 | 0.1% |
| Iranian | 35 | 0.1% |
| Irish | 9,171 | 12.1% |
| Iroquois | 22 | 0.0% |
| Italian | 1,585 | 2.1% |
| Jamaican | 71 | 0.1% |
| Kenyan | 25 | 0.0% |
| Korean | 644 | 0.9% |
| Laotian | 18 | 0.0% |
| Latvian | 20 | 0.0% |
| Lebanese | 140 | 0.2% |
| Lithuanian | 182 | 0.2% |
| Luxembourger | 27 | 0.0% |
| Mexican | 2,954 | 3.9% |
| Mexican American Indian | 23 | 0.0% |
| Native Hawaiian | 19 | 0.0% |
| Navajo | 85 | 0.1% |
| New Zealander | 9 | 0.0% |
| Nicaraguan | 127 | 0.2% |
| Nigerian | 16 | 0.0% |
| Northern European | 179 | 0.2% |
| Norwegian | 7,336 | 9.7% |
| Okinawan | 28 | 0.0% |
| Ottawa | 9 | 0.0% |
| Pakistani | 37 | 0.1% |
| Palestinian | 33 | 0.0% |
| Pennsylvania German | 94 | 0.1% |
| Peruvian | 150 | 0.2% |
| Polish | 1,316 | 1.7% |
| Portuguese | 116 | 0.2% |
| Potawatomi | 32 | 0.0% |
| Puerto Rican | 444 | 0.6% |
| Romanian | 34 | 0.0% |
| Russian | 799 | 1.1% |
| Salvadoran | 36 | 0.1% |
| Scandinavian | 978 | 1.3% |
| Scotch-Irish | 852 | 1.1% |
| Scottish | 2,003 | 2.6% |
| Seminole | 28 | 0.0% |
| Serbian | 16 | 0.0% |
| Sioux | 7,957 | 10.5% |
| Slavic | 4 | 0.0% |
| Slovak | 94 | 0.1% |
| Slovene | 22 | 0.0% |
| Somali | 1 | 0.0% |
| South American | 224 | 0.3% |
| Spaniard | 196 | 0.3% |
| Spanish | 192 | 0.3% |
| Sri Lankan | 31 | 0.0% |
| Subsaharan African | 102 | 0.1% |
| Sudanese | 28 | 0.0% |
| Swedish | 2,163 | 2.9% |
| Swiss | 289 | 0.4% |
| Thai | 116 | 0.2% |
| Tlingit-Haida | 26 | 0.0% |
| Turkish | 31 | 0.0% |
| Ukrainian | 16 | 0.0% |
| Vietnamese | 20 | 0.0% |
| Welsh | 674 | 0.9% | View All 109 Rows |
Immigrants in Rapid City
The most numerous immigrant groups reported in Rapid City came from Asia (815 | 1.1%), Europe (447 | 0.6%), South Eastern Asia (342 | 0.4%), Latin America (298 | 0.4%), and Philippines (266 | 0.4%), together accounting for 2.9% of all Rapid City residents.
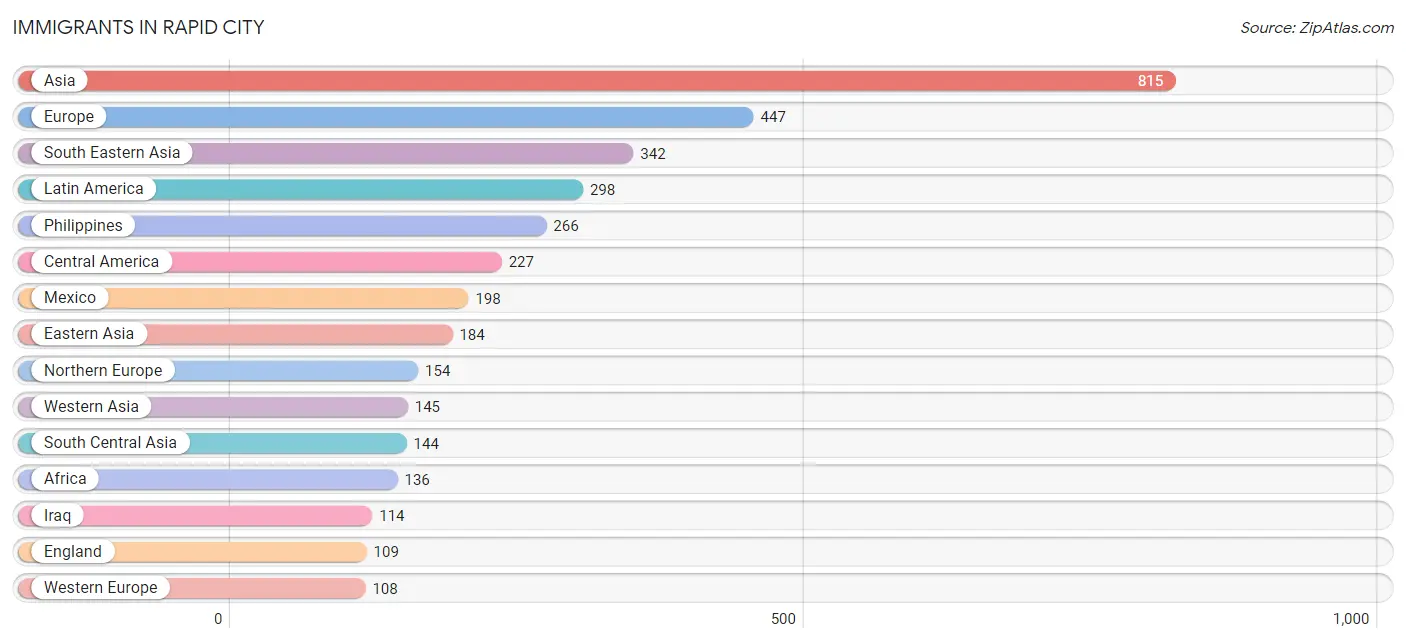
| Immigration Origin | # Population | % Population |
| Africa | 136 | 0.2% |
| Albania | 42 | 0.1% |
| Asia | 815 | 1.1% |
| Bangladesh | 20 | 0.0% |
| Canada | 49 | 0.1% |
| Caribbean | 71 | 0.1% |
| Central America | 227 | 0.3% |
| China | 49 | 0.1% |
| Eastern Africa | 15 | 0.0% |
| Eastern Asia | 184 | 0.2% |
| Eastern Europe | 92 | 0.1% |
| Egypt | 104 | 0.1% |
| El Salvador | 19 | 0.0% |
| England | 109 | 0.1% |
| Ethiopia | 15 | 0.0% |
| Europe | 447 | 0.6% |
| France | 7 | 0.0% |
| Germany | 85 | 0.1% |
| Honduras | 4 | 0.0% |
| India | 47 | 0.1% |
| Iran | 9 | 0.0% |
| Iraq | 114 | 0.2% |
| Italy | 9 | 0.0% |
| Jamaica | 71 | 0.1% |
| Japan | 29 | 0.0% |
| Korea | 106 | 0.1% |
| Latin America | 298 | 0.4% |
| Mexico | 198 | 0.3% |
| Nepal | 68 | 0.1% |
| Nigeria | 9 | 0.0% |
| Northern Africa | 104 | 0.1% |
| Northern Europe | 154 | 0.2% |
| Panama | 6 | 0.0% |
| Philippines | 266 | 0.4% |
| Poland | 32 | 0.0% |
| Portugal | 29 | 0.0% |
| Russia | 18 | 0.0% |
| Scotland | 13 | 0.0% |
| South Central Asia | 144 | 0.2% |
| South Eastern Asia | 342 | 0.4% |
| Southern Europe | 93 | 0.1% |
| Spain | 55 | 0.1% |
| Switzerland | 16 | 0.0% |
| Thailand | 17 | 0.0% |
| Turkey | 31 | 0.0% |
| Western Africa | 17 | 0.0% |
| Western Asia | 145 | 0.2% |
| Western Europe | 108 | 0.1% | View All 48 Rows |
Sex and Age in Rapid City
Sex and Age in Rapid City
The most populous age groups in Rapid City are 20 to 24 Years (2,945 | 7.7%) for men and 35 to 39 Years (2,804 | 7.5%) for women.
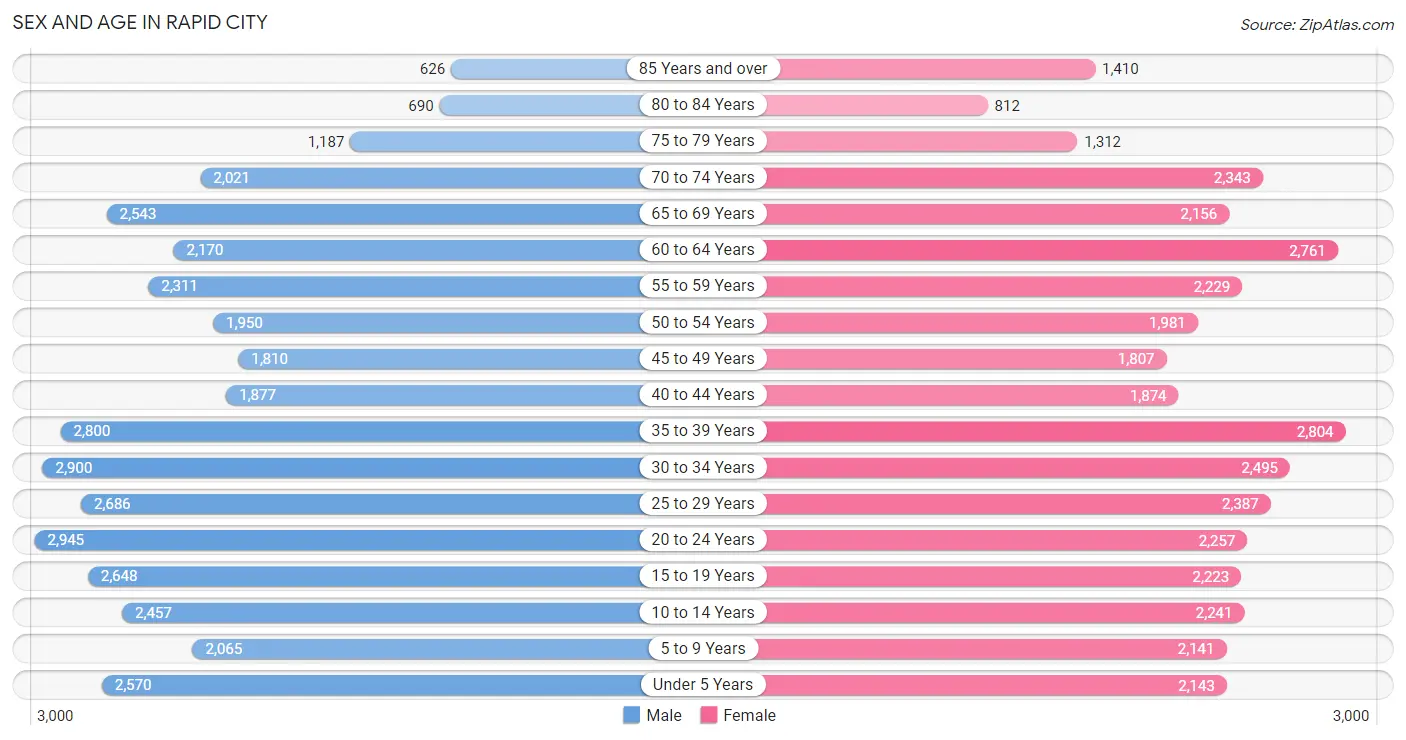
| Age Bracket | Male | Female |
| Under 5 Years | 2,570 (6.7%) | 2,143 (5.7%) |
| 5 to 9 Years | 2,065 (5.4%) | 2,141 (5.7%) |
| 10 to 14 Years | 2,457 (6.4%) | 2,241 (6.0%) |
| 15 to 19 Years | 2,648 (6.9%) | 2,223 (5.9%) |
| 20 to 24 Years | 2,945 (7.7%) | 2,257 (6.0%) |
| 25 to 29 Years | 2,686 (7.0%) | 2,387 (6.4%) |
| 30 to 34 Years | 2,900 (7.6%) | 2,495 (6.7%) |
| 35 to 39 Years | 2,800 (7.3%) | 2,804 (7.5%) |
| 40 to 44 Years | 1,877 (4.9%) | 1,874 (5.0%) |
| 45 to 49 Years | 1,810 (4.7%) | 1,807 (4.8%) |
| 50 to 54 Years | 1,950 (5.1%) | 1,981 (5.3%) |
| 55 to 59 Years | 2,311 (6.0%) | 2,229 (6.0%) |
| 60 to 64 Years | 2,170 (5.7%) | 2,761 (7.4%) |
| 65 to 69 Years | 2,543 (6.7%) | 2,156 (5.8%) |
| 70 to 74 Years | 2,021 (5.3%) | 2,343 (6.3%) |
| 75 to 79 Years | 1,187 (3.1%) | 1,312 (3.5%) |
| 80 to 84 Years | 690 (1.8%) | 812 (2.2%) |
| 85 Years and over | 626 (1.6%) | 1,410 (3.8%) |
| Total | 38,256 (100.0%) | 37,376 (100.0%) |
Families and Households in Rapid City
Median Family Size in Rapid City
The median family size in Rapid City is 3.03 persons per family, with single female/mother families (3,141 | 18.1%) accounting for the largest median family size of 3.33 persons per family. On the other hand, single male/father families (1,266 | 7.3%) represent the smallest median family size with 2.91 persons per family.
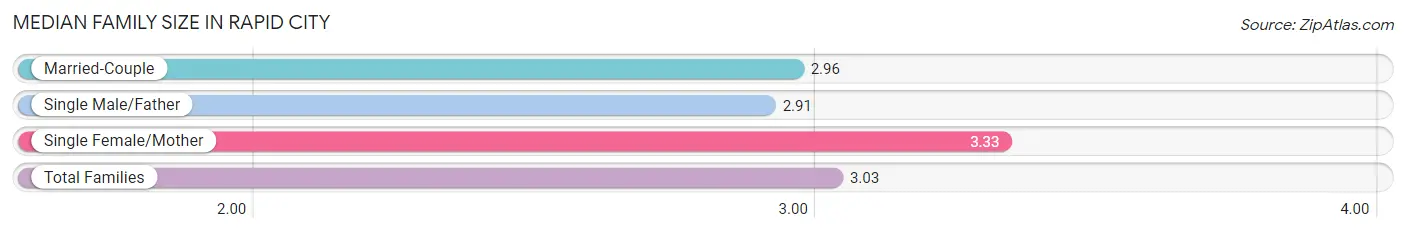
| Family Type | # Families | Family Size |
| Married-Couple | 12,901 (74.5%) | 2.96 |
| Single Male/Father | 1,266 (7.3%) | 2.91 |
| Single Female/Mother | 3,141 (18.1%) | 3.33 |
| Total Families | 17,308 (100.0%) | 3.03 |
Median Household Size in Rapid City
The median household size in Rapid City is 2.29 persons per household, with single male/father households (1,266 | 4.0%) accounting for the largest median household size of 3.51 persons per household. non-family households (14,145 | 45.0%) represent the smallest median household size with 1.27 persons per household.
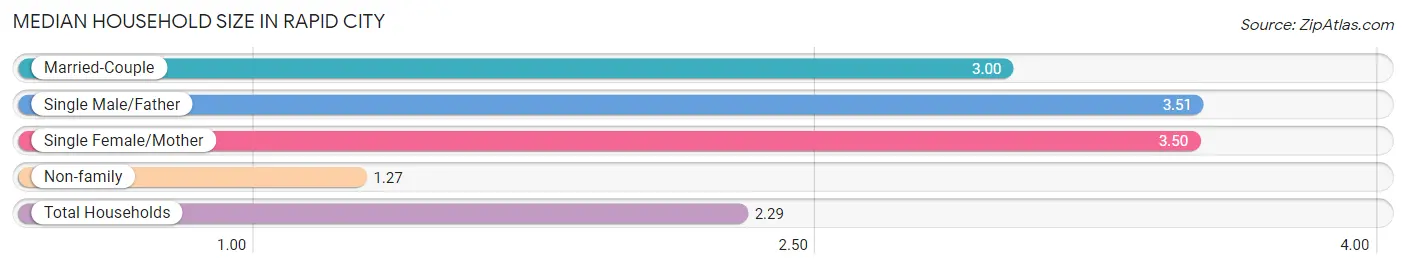
| Household Type | # Households | Household Size |
| Married-Couple | 12,901 (41.0%) | 3.00 |
| Single Male/Father | 1,266 (4.0%) | 3.51 |
| Single Female/Mother | 3,141 (10.0%) | 3.50 |
| Non-family | 14,145 (45.0%) | 1.27 |
| Total Households | 31,453 (100.0%) | 2.29 |
Household Size by Marriage Status in Rapid City
Out of a total of 31,453 households in Rapid City, 17,308 (55.0%) are family households, while 14,145 (45.0%) are nonfamily households. The most numerous type of family households are 2-person households, comprising 8,998, and the most common type of nonfamily households are 1-person households, comprising 11,452.
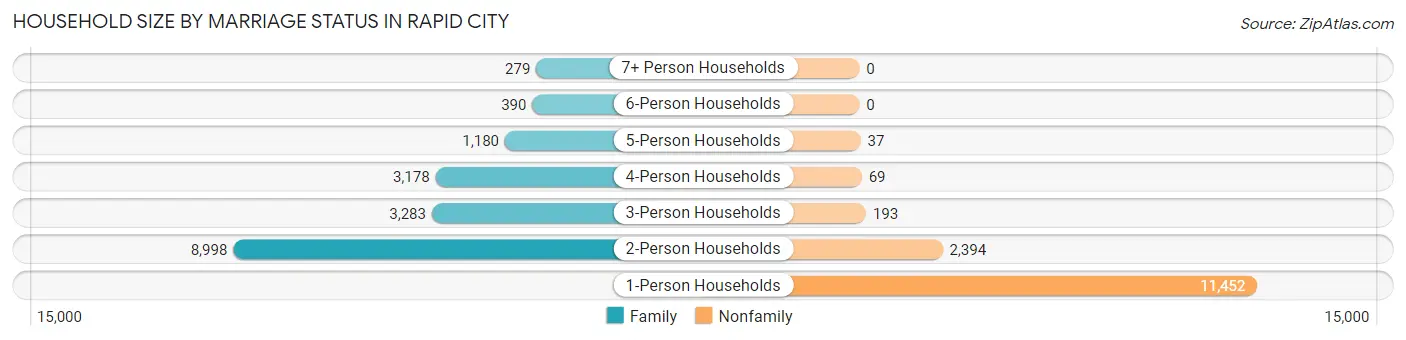
| Household Size | Family Households | Nonfamily Households |
| 1-Person Households | - | 11,452 (36.4%) |
| 2-Person Households | 8,998 (28.6%) | 2,394 (7.6%) |
| 3-Person Households | 3,283 (10.4%) | 193 (0.6%) |
| 4-Person Households | 3,178 (10.1%) | 69 (0.2%) |
| 5-Person Households | 1,180 (3.7%) | 37 (0.1%) |
| 6-Person Households | 390 (1.2%) | 0 (0.0%) |
| 7+ Person Households | 279 (0.9%) | 0 (0.0%) |
| Total | 17,308 (55.0%) | 14,145 (45.0%) |
Female Fertility in Rapid City
Fertility by Age in Rapid City
Average fertility rate in Rapid City is 63.0 births per 1,000 women. Women in the age bracket of 20 to 34 years have the highest fertility rate with 107.0 births per 1,000 women. Women in the age bracket of 20 to 34 years acount for 74.9% of all women with births.
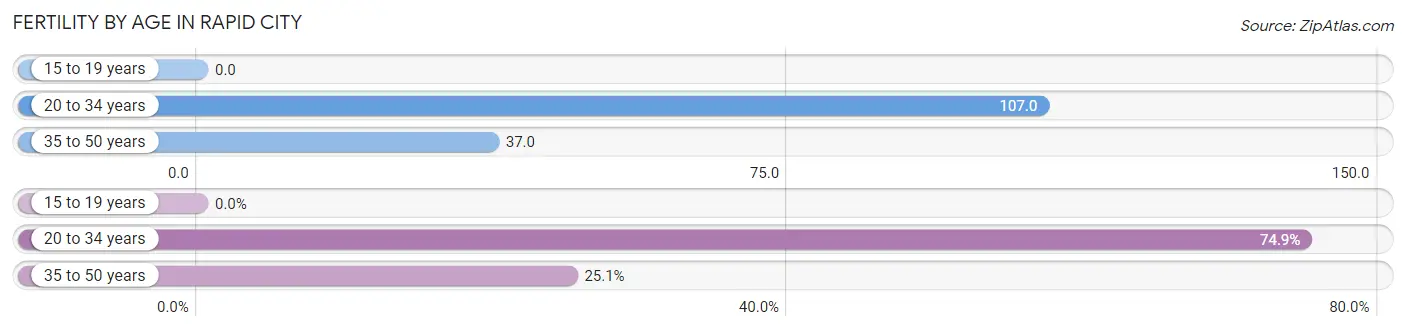
| Age Bracket | Women with Births | Births / 1,000 Women |
| 15 to 19 years | 0 (0.0%) | 0.0 |
| 20 to 34 years | 765 (74.9%) | 107.0 |
| 35 to 50 years | 256 (25.1%) | 37.0 |
| Total | 1,021 (100.0%) | 63.0 |
Fertility by Age by Marriage Status in Rapid City
67.2% of women with births (1,021) in Rapid City are married. The highest percentage of unmarried women with births falls into 35 to 50 years age bracket with 34.4% of them unmarried at the time of birth, while the lowest percentage of unmarried women with births belong to 20 to 34 years age bracket with 32.3% of them unmarried.
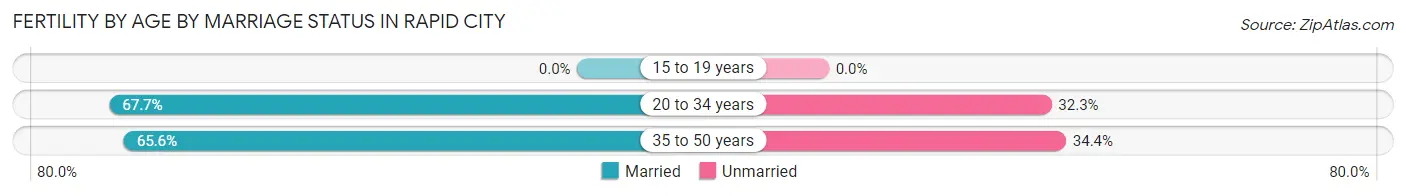
| Age Bracket | Married | Unmarried |
| 15 to 19 years | 0 (0.0%) | 0 (0.0%) |
| 20 to 34 years | 518 (67.7%) | 247 (32.3%) |
| 35 to 50 years | 168 (65.6%) | 88 (34.4%) |
| Total | 686 (67.2%) | 335 (32.8%) |
Fertility by Education in Rapid City
Average fertility rate in Rapid City is 63.0 births per 1,000 women. Women with the education attainment of graduate degree have the highest fertility rate of 114.0 births per 1,000 women, while women with the education attainment of high school diploma have the lowest fertility at 46.0 births per 1,000 women. Women with the education attainment of college or associate's degree represent 27.4% of all women with births.
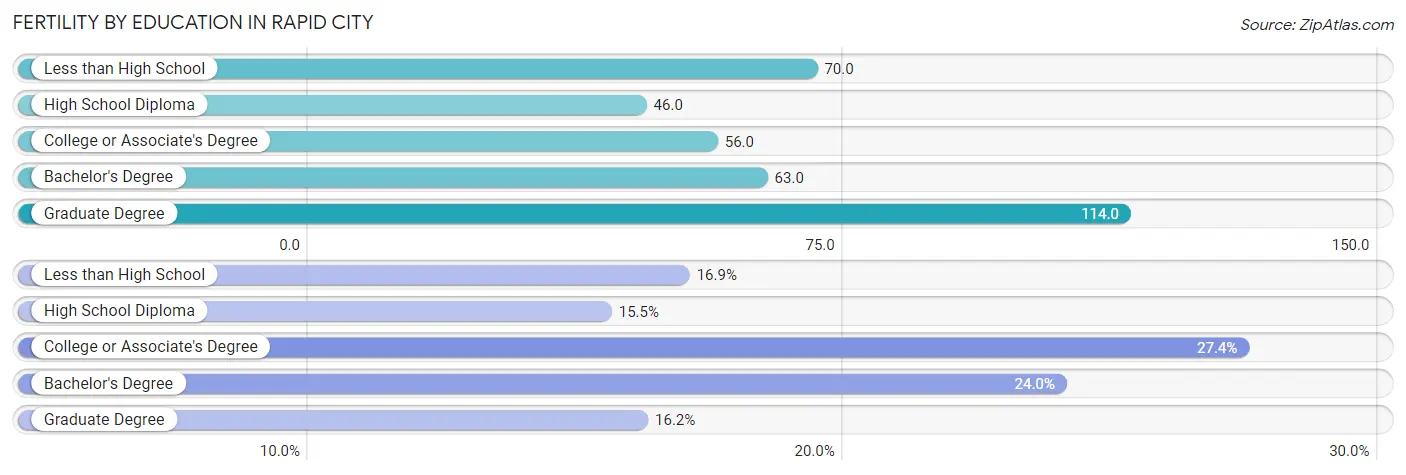
| Educational Attainment | Women with Births | Births / 1,000 Women |
| Less than High School | 173 (16.9%) | 70.0 |
| High School Diploma | 158 (15.5%) | 46.0 |
| College or Associate's Degree | 280 (27.4%) | 56.0 |
| Bachelor's Degree | 245 (24.0%) | 63.0 |
| Graduate Degree | 165 (16.2%) | 114.0 |
| Total | 1,021 (100.0%) | 63.0 |
Fertility by Education by Marriage Status in Rapid City
32.8% of women with births in Rapid City are unmarried. Women with the educational attainment of graduate degree are most likely to be married with 100.0% of them married at childbirth, while women with the educational attainment of less than high school are least likely to be married with 87.3% of them unmarried at childbirth.
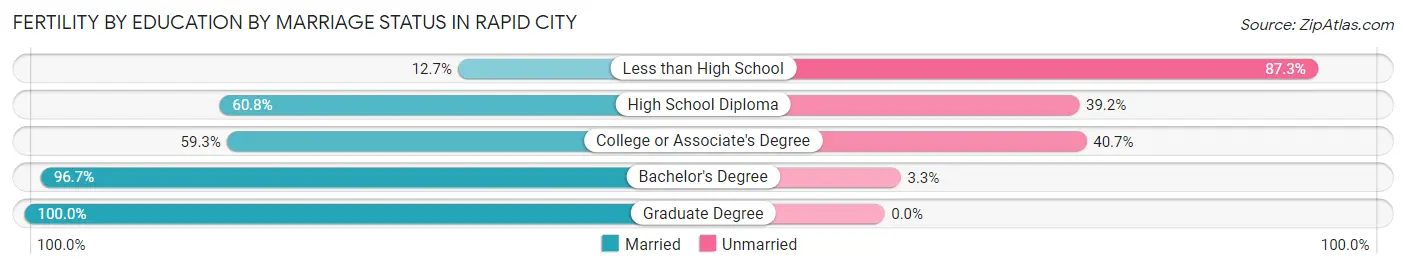
| Educational Attainment | Married | Unmarried |
| Less than High School | 22 (12.7%) | 151 (87.3%) |
| High School Diploma | 96 (60.8%) | 62 (39.2%) |
| College or Associate's Degree | 166 (59.3%) | 114 (40.7%) |
| Bachelor's Degree | 237 (96.7%) | 8 (3.3%) |
| Graduate Degree | 165 (100.0%) | 0 (0.0%) |
| Total | 686 (67.2%) | 335 (32.8%) |
Employment Characteristics in Rapid City
Employment by Class of Employer in Rapid City
Among the 37,275 employed individuals in Rapid City, private company employees (22,587 | 60.6%), not-for-profit organizations (4,568 | 12.2%), and local government employees (2,433 | 6.5%) make up the most common classes of employment.
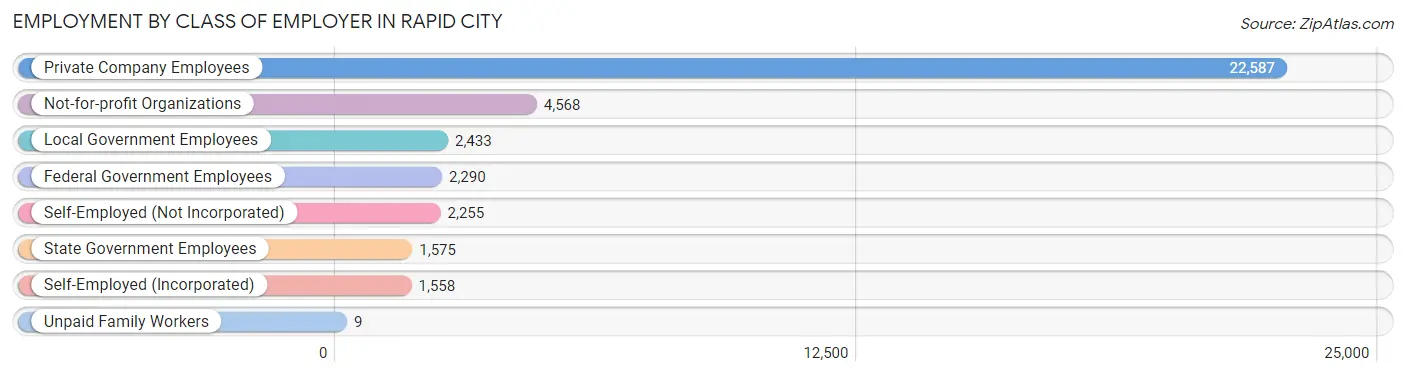
| Employer Class | # Employees | % Employees |
| Private Company Employees | 22,587 | 60.6% |
| Self-Employed (Incorporated) | 1,558 | 4.2% |
| Self-Employed (Not Incorporated) | 2,255 | 6.0% |
| Not-for-profit Organizations | 4,568 | 12.2% |
| Local Government Employees | 2,433 | 6.5% |
| State Government Employees | 1,575 | 4.2% |
| Federal Government Employees | 2,290 | 6.1% |
| Unpaid Family Workers | 9 | 0.0% |
| Total | 37,275 | 100.0% |
Employment Status by Age in Rapid City
According to the labor force statistics for Rapid City, out of the total population over 16 years of age (60,972), 64.2% or 39,144 individuals are in the labor force, with 3.4% or 1,331 of them unemployed. The age group with the highest labor force participation rate is 30 to 34 years, with 86.6% or 4,672 individuals in the labor force. Within the labor force, the 16 to 19 years age range has the highest percentage of unemployed individuals, with 15.4% or 333 of them being unemployed.
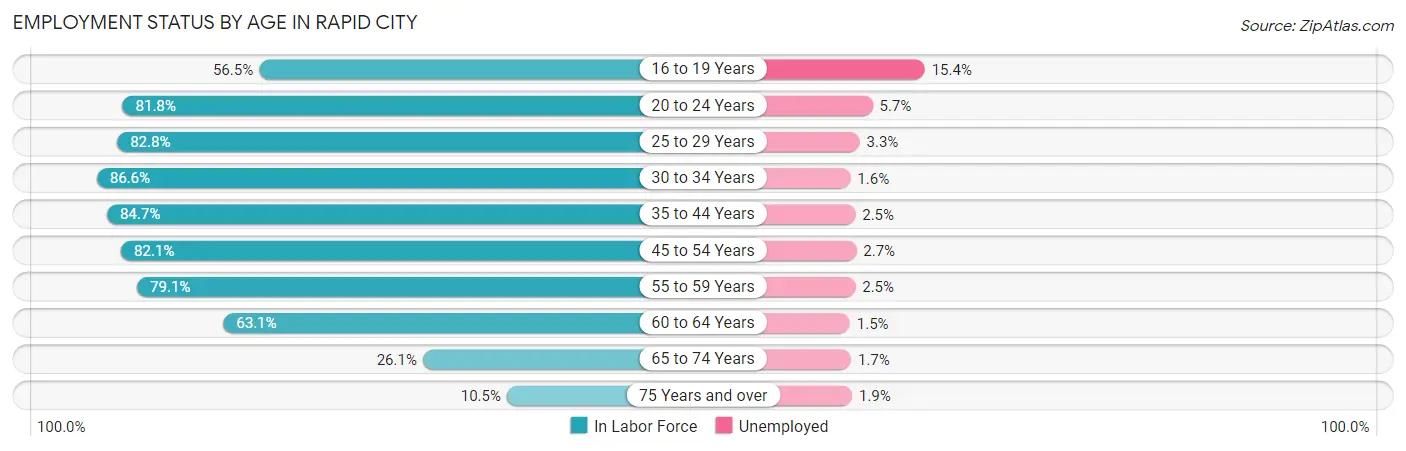
| Age Bracket | In Labor Force | Unemployed |
| 16 to 19 Years | 2,163 (56.5%) | 333 (15.4%) |
| 20 to 24 Years | 4,255 (81.8%) | 243 (5.7%) |
| 25 to 29 Years | 4,200 (82.8%) | 139 (3.3%) |
| 30 to 34 Years | 4,672 (86.6%) | 75 (1.6%) |
| 35 to 44 Years | 7,924 (84.7%) | 198 (2.5%) |
| 45 to 54 Years | 6,197 (82.1%) | 167 (2.7%) |
| 55 to 59 Years | 3,591 (79.1%) | 90 (2.5%) |
| 60 to 64 Years | 3,111 (63.1%) | 47 (1.5%) |
| 65 to 74 Years | 2,365 (26.1%) | 40 (1.7%) |
| 75 Years and over | 634 (10.5%) | 12 (1.9%) |
| Total | 39,144 (64.2%) | 1,331 (3.4%) |
Employment Status by Educational Attainment in Rapid City
According to labor force statistics for Rapid City, 80.6% of individuals (29,695) out of the total population between 25 and 64 years of age (36,842) are in the labor force, with 2.4% or 713 of them being unemployed. The group with the highest labor force participation rate are those with the educational attainment of bachelor's degree or higher, with 89.4% or 11,917 individuals in the labor force. Within the labor force, individuals with less than high school education have the highest percentage of unemployment, with 9.3% or 102 of them being unemployed.
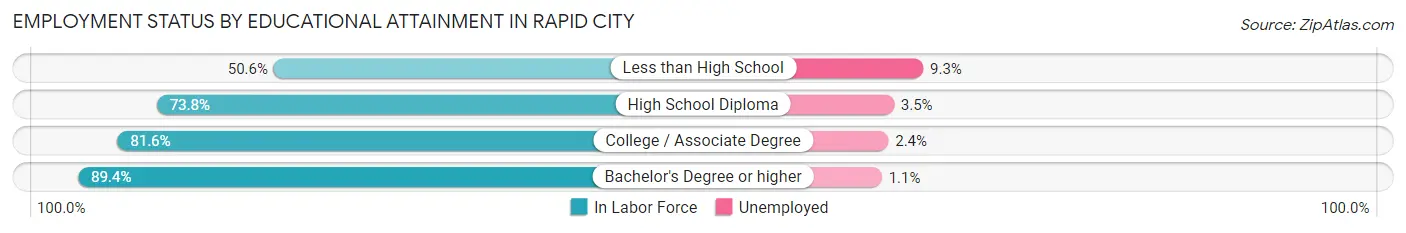
| Educational Attainment | In Labor Force | Unemployed |
| Less than High School | 1,094 (50.6%) | 201 (9.3%) |
| High School Diploma | 6,941 (73.8%) | 329 (3.5%) |
| College / Associate Degree | 9,747 (81.6%) | 287 (2.4%) |
| Bachelor's Degree or higher | 11,917 (89.4%) | 147 (1.1%) |
| Total | 29,695 (80.6%) | 884 (2.4%) |
Employment Occupations by Sex in Rapid City
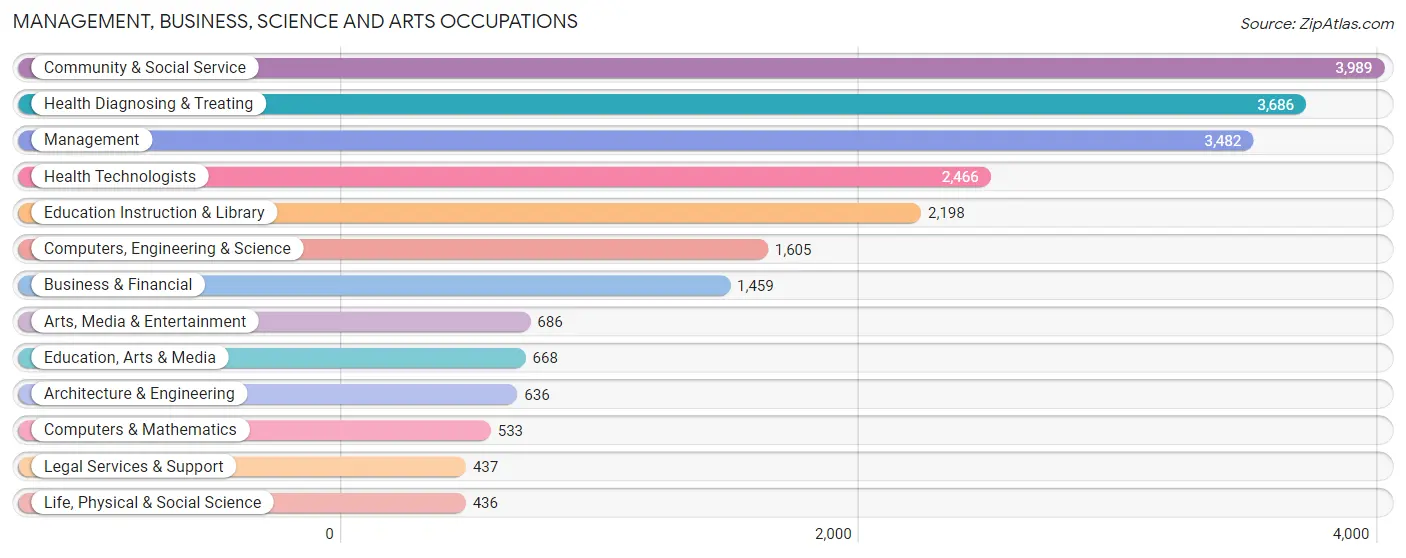
Management, Business, Science and Arts Occupations
The most common Management, Business, Science and Arts occupations in Rapid City are Community & Social Service (3,989 | 10.7%), Health Diagnosing & Treating (3,686 | 9.9%), Management (3,482 | 9.4%), Health Technologists (2,466 | 6.6%), and Education Instruction & Library (2,198 | 5.9%).
Management, Business, Science and Arts Occupations by Sex
Within the Management, Business, Science and Arts occupations in Rapid City, the most male-oriented occupations are Computers & Mathematics (74.1%), Architecture & Engineering (72.2%), and Computers, Engineering & Science (68.3%), while the most female-oriented occupations are Education Instruction & Library (73.5%), Health Diagnosing & Treating (68.4%), and Education, Arts & Media (65.9%).
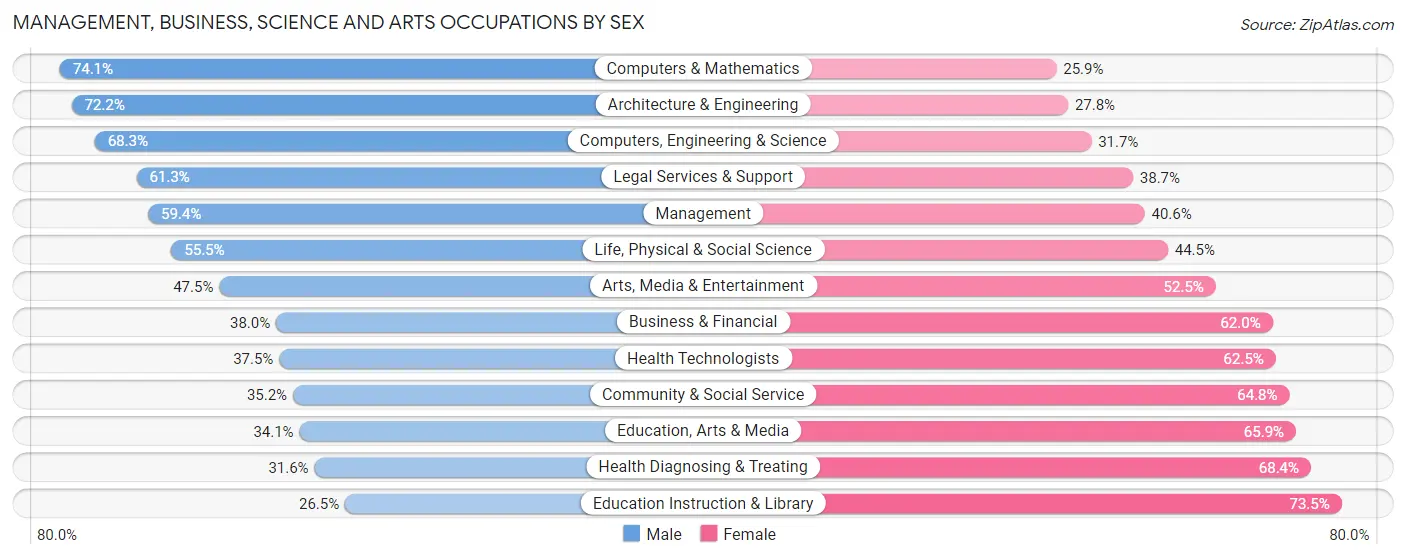
| Occupation | Male | Female |
| Management | 2,068 (59.4%) | 1,414 (40.6%) |
| Business & Financial | 555 (38.0%) | 904 (62.0%) |
| Computers, Engineering & Science | 1,096 (68.3%) | 509 (31.7%) |
| Computers & Mathematics | 395 (74.1%) | 138 (25.9%) |
| Architecture & Engineering | 459 (72.2%) | 177 (27.8%) |
| Life, Physical & Social Science | 242 (55.5%) | 194 (44.5%) |
| Community & Social Service | 1,405 (35.2%) | 2,584 (64.8%) |
| Education, Arts & Media | 228 (34.1%) | 440 (65.9%) |
| Legal Services & Support | 268 (61.3%) | 169 (38.7%) |
| Education Instruction & Library | 583 (26.5%) | 1,615 (73.5%) |
| Arts, Media & Entertainment | 326 (47.5%) | 360 (52.5%) |
| Health Diagnosing & Treating | 1,166 (31.6%) | 2,520 (68.4%) |
| Health Technologists | 925 (37.5%) | 1,541 (62.5%) |
| Total (Category) | 6,290 (44.2%) | 7,931 (55.8%) |
| Total (Overall) | 19,322 (52.0%) | 17,833 (48.0%) |
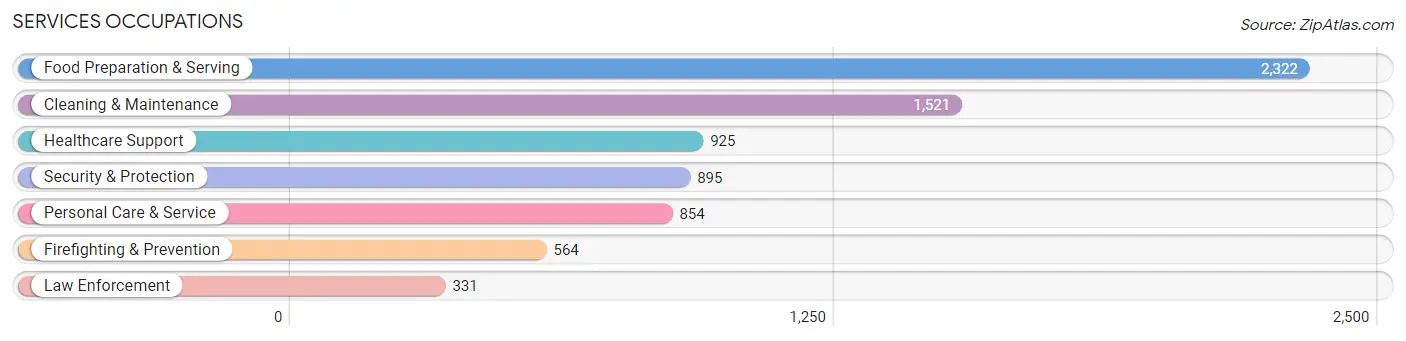
Services Occupations
The most common Services occupations in Rapid City are Food Preparation & Serving (2,322 | 6.2%), Cleaning & Maintenance (1,521 | 4.1%), Healthcare Support (925 | 2.5%), Security & Protection (895 | 2.4%), and Personal Care & Service (854 | 2.3%).
Services Occupations by Sex
Within the Services occupations in Rapid City, the most male-oriented occupations are Firefighting & Prevention (87.6%), Security & Protection (82.6%), and Law Enforcement (74.0%), while the most female-oriented occupations are Personal Care & Service (90.4%), Healthcare Support (87.8%), and Cleaning & Maintenance (44.6%).
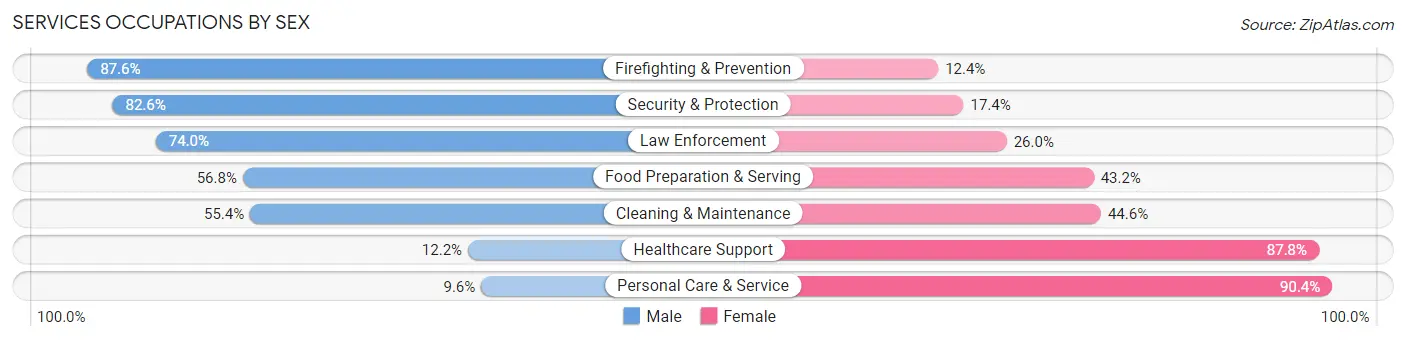
| Occupation | Male | Female |
| Healthcare Support | 113 (12.2%) | 812 (87.8%) |
| Security & Protection | 739 (82.6%) | 156 (17.4%) |
| Firefighting & Prevention | 494 (87.6%) | 70 (12.4%) |
| Law Enforcement | 245 (74.0%) | 86 (26.0%) |
| Food Preparation & Serving | 1,319 (56.8%) | 1,003 (43.2%) |
| Cleaning & Maintenance | 842 (55.4%) | 679 (44.6%) |
| Personal Care & Service | 82 (9.6%) | 772 (90.4%) |
| Total (Category) | 3,095 (47.5%) | 3,422 (52.5%) |
| Total (Overall) | 19,322 (52.0%) | 17,833 (48.0%) |
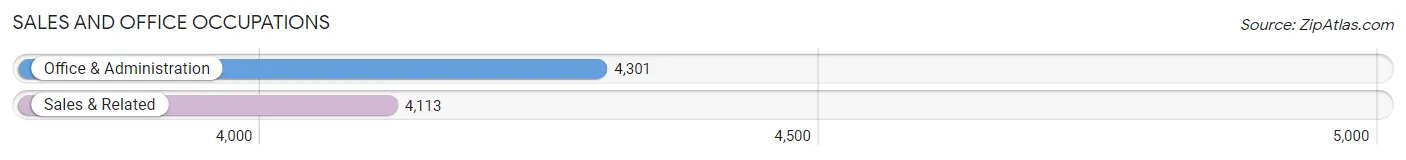
Sales and Office Occupations
The most common Sales and Office occupations in Rapid City are Office & Administration (4,301 | 11.6%), and Sales & Related (4,113 | 11.1%).
Sales and Office Occupations by Sex
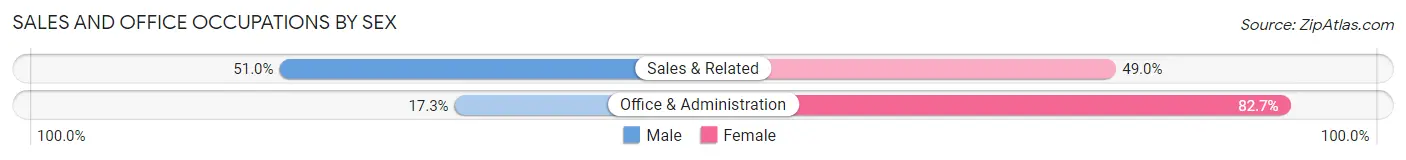
| Occupation | Male | Female |
| Sales & Related | 2,098 (51.0%) | 2,015 (49.0%) |
| Office & Administration | 746 (17.3%) | 3,555 (82.7%) |
| Total (Category) | 2,844 (33.8%) | 5,570 (66.2%) |
| Total (Overall) | 19,322 (52.0%) | 17,833 (48.0%) |
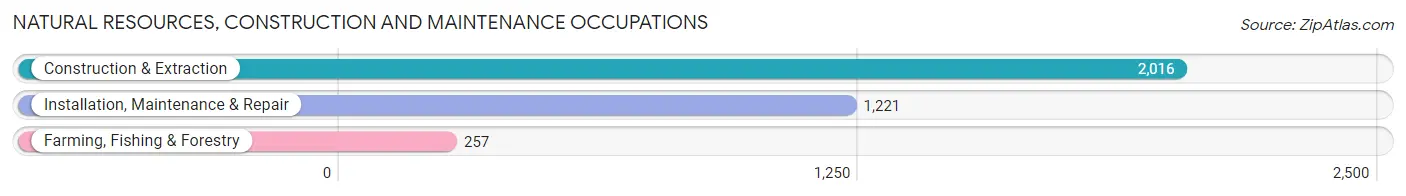
Natural Resources, Construction and Maintenance Occupations
The most common Natural Resources, Construction and Maintenance occupations in Rapid City are Construction & Extraction (2,016 | 5.4%), Installation, Maintenance & Repair (1,221 | 3.3%), and Farming, Fishing & Forestry (257 | 0.7%).
Natural Resources, Construction and Maintenance Occupations by Sex
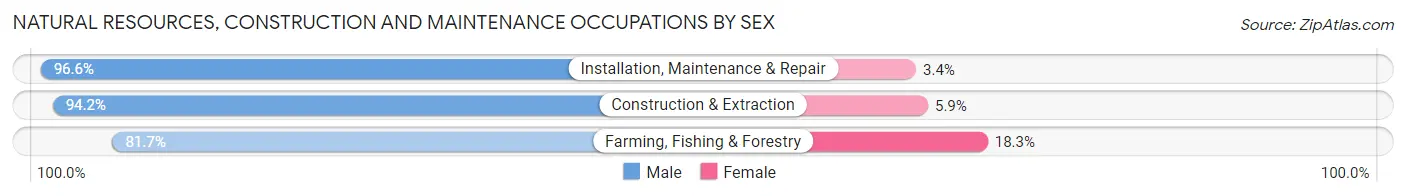
| Occupation | Male | Female |
| Farming, Fishing & Forestry | 210 (81.7%) | 47 (18.3%) |
| Construction & Extraction | 1,898 (94.2%) | 118 (5.9%) |
| Installation, Maintenance & Repair | 1,180 (96.6%) | 41 (3.4%) |
| Total (Category) | 3,288 (94.1%) | 206 (5.9%) |
| Total (Overall) | 19,322 (52.0%) | 17,833 (48.0%) |
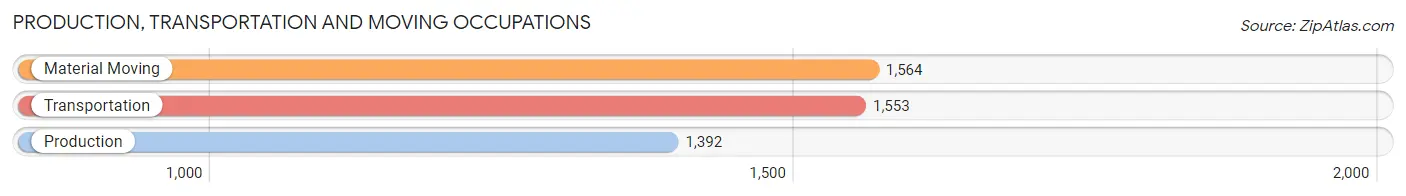
Production, Transportation and Moving Occupations
The most common Production, Transportation and Moving occupations in Rapid City are Material Moving (1,564 | 4.2%), Transportation (1,553 | 4.2%), and Production (1,392 | 3.7%).
Production, Transportation and Moving Occupations by Sex
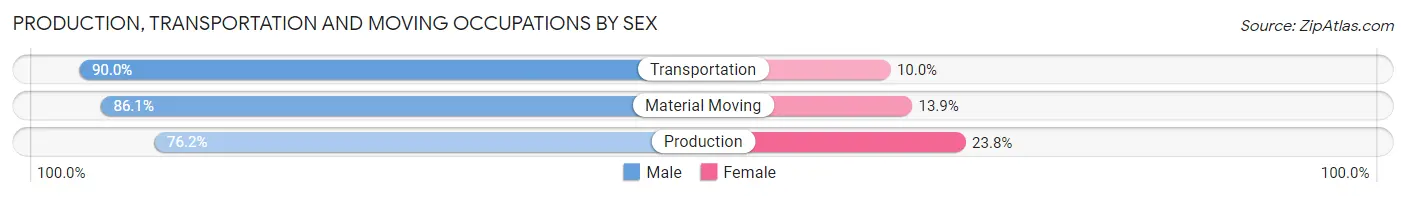
| Occupation | Male | Female |
| Production | 1,061 (76.2%) | 331 (23.8%) |
| Transportation | 1,398 (90.0%) | 155 (10.0%) |
| Material Moving | 1,346 (86.1%) | 218 (13.9%) |
| Total (Category) | 3,805 (84.4%) | 704 (15.6%) |
| Total (Overall) | 19,322 (52.0%) | 17,833 (48.0%) |
Employment Industries by Sex in Rapid City
Employment Industries in Rapid City
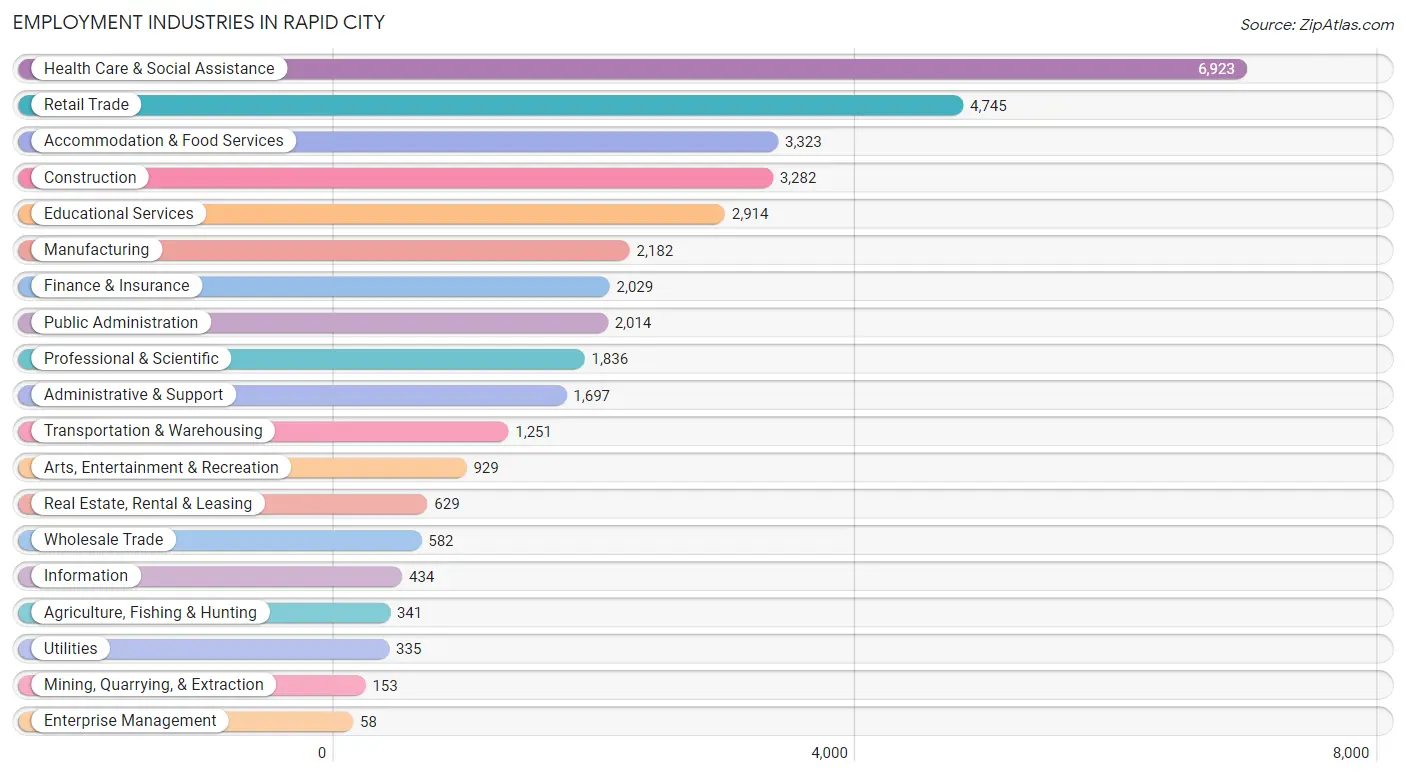
The major employment industries in Rapid City include Health Care & Social Assistance (6,923 | 18.6%), Retail Trade (4,745 | 12.8%), Accommodation & Food Services (3,323 | 8.9%), Construction (3,282 | 8.8%), and Educational Services (2,914 | 7.8%).
Employment Industries by Sex in Rapid City
The Rapid City industries that see more men than women are Wholesale Trade (90.5%), Enterprise Management (87.9%), and Construction (84.6%), whereas the industries that tend to have a higher number of women are Health Care & Social Assistance (73.4%), Finance & Insurance (67.8%), and Educational Services (67.0%).
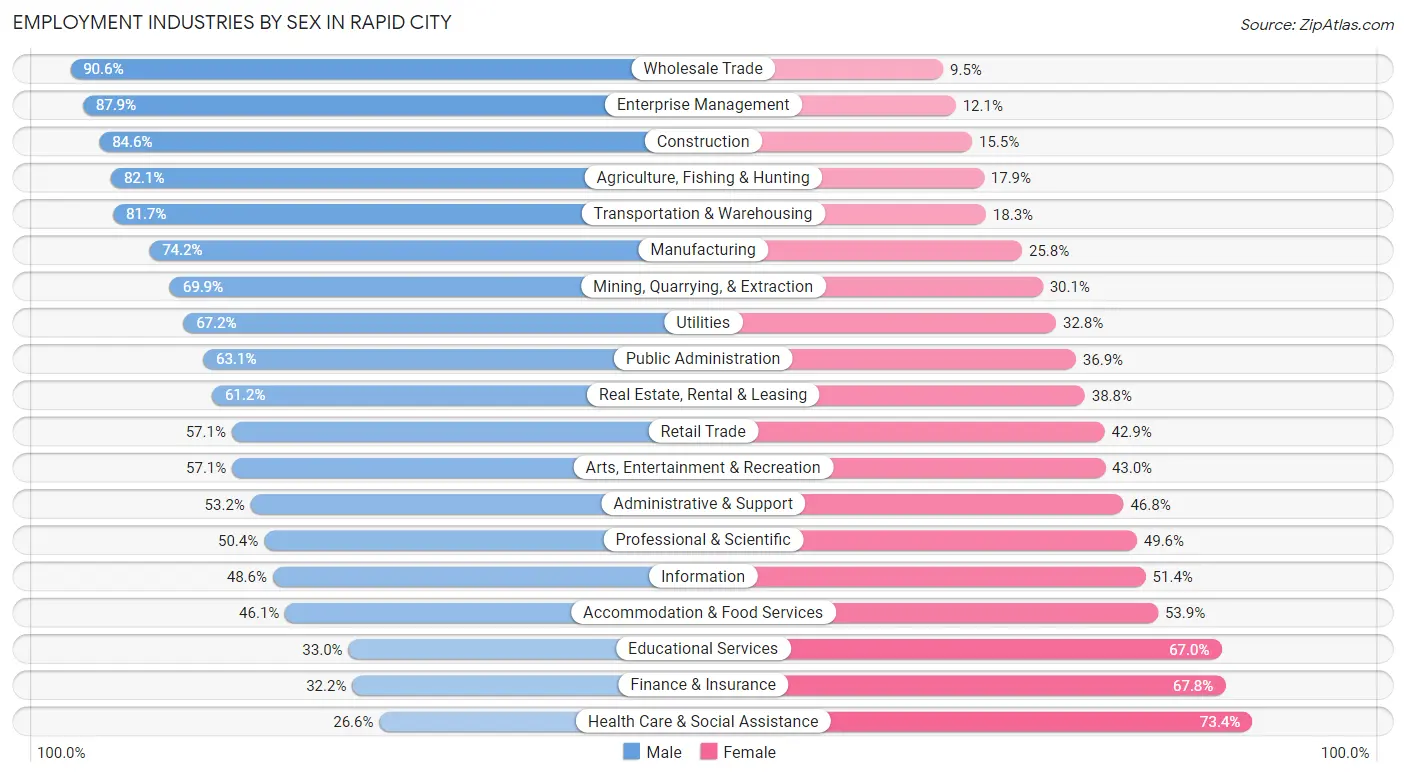
| Industry | Male | Female |
| Agriculture, Fishing & Hunting | 280 (82.1%) | 61 (17.9%) |
| Mining, Quarrying, & Extraction | 107 (69.9%) | 46 (30.1%) |
| Construction | 2,775 (84.6%) | 507 (15.4%) |
| Manufacturing | 1,619 (74.2%) | 563 (25.8%) |
| Wholesale Trade | 527 (90.5%) | 55 (9.5%) |
| Retail Trade | 2,711 (57.1%) | 2,034 (42.9%) |
| Transportation & Warehousing | 1,022 (81.7%) | 229 (18.3%) |
| Utilities | 225 (67.2%) | 110 (32.8%) |
| Information | 211 (48.6%) | 223 (51.4%) |
| Finance & Insurance | 653 (32.2%) | 1,376 (67.8%) |
| Real Estate, Rental & Leasing | 385 (61.2%) | 244 (38.8%) |
| Professional & Scientific | 926 (50.4%) | 910 (49.6%) |
| Enterprise Management | 51 (87.9%) | 7 (12.1%) |
| Administrative & Support | 903 (53.2%) | 794 (46.8%) |
| Educational Services | 961 (33.0%) | 1,953 (67.0%) |
| Health Care & Social Assistance | 1,840 (26.6%) | 5,083 (73.4%) |
| Arts, Entertainment & Recreation | 530 (57.1%) | 399 (42.9%) |
| Accommodation & Food Services | 1,531 (46.1%) | 1,792 (53.9%) |
| Public Administration | 1,270 (63.1%) | 744 (36.9%) |
| Total | 19,322 (52.0%) | 17,833 (48.0%) |
Education in Rapid City
School Enrollment in Rapid City
The most common levels of schooling among the 16,884 students in Rapid City are middle school (3,717 | 22.0%), elementary school (3,596 | 21.3%), and high school (3,528 | 20.9%).
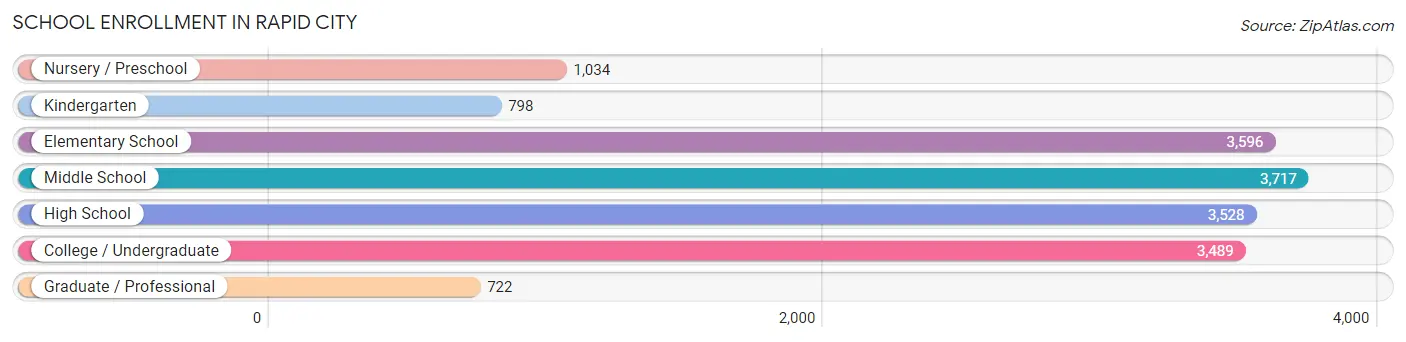
| School Level | # Students | % Students |
| Nursery / Preschool | 1,034 | 6.1% |
| Kindergarten | 798 | 4.7% |
| Elementary School | 3,596 | 21.3% |
| Middle School | 3,717 | 22.0% |
| High School | 3,528 | 20.9% |
| College / Undergraduate | 3,489 | 20.7% |
| Graduate / Professional | 722 | 4.3% |
| Total | 16,884 | 100.0% |
School Enrollment by Age by Funding Source in Rapid City
Out of a total of 16,884 students who are enrolled in schools in Rapid City, 3,056 (18.1%) attend a private institution, while the remaining 13,828 (81.9%) are enrolled in public schools. The age group of 3 to 4 year olds has the highest likelihood of being enrolled in private schools, with 277 (49.0% in the age bracket) enrolled. Conversely, the age group of 20 to 24 year olds has the lowest likelihood of being enrolled in a private school, with 1,329 (90.3% in the age bracket) attending a public institution.
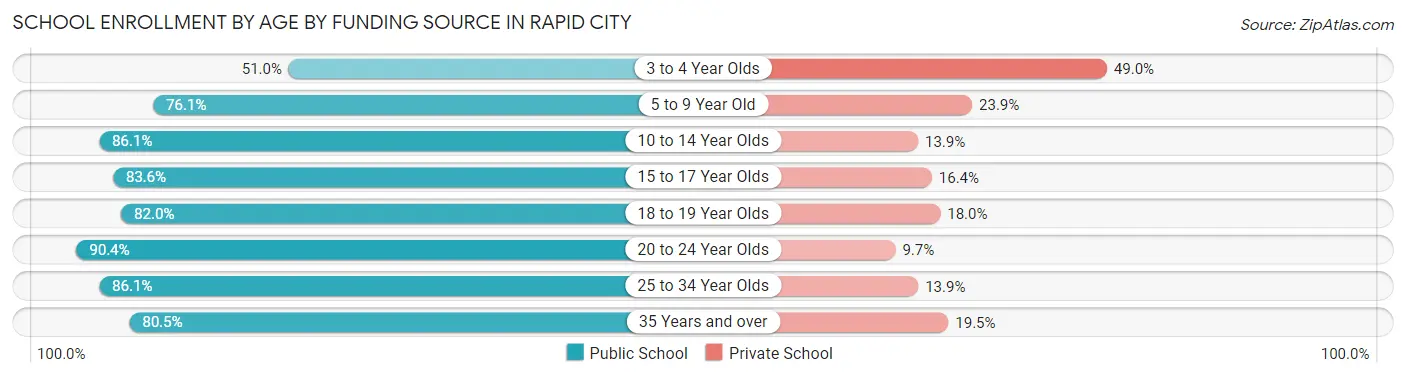
| Age Bracket | Public School | Private School |
| 3 to 4 Year Olds | 288 (51.0%) | 277 (49.0%) |
| 5 to 9 Year Old | 3,076 (76.1%) | 967 (23.9%) |
| 10 to 14 Year Olds | 3,965 (86.1%) | 638 (13.9%) |
| 15 to 17 Year Olds | 2,432 (83.6%) | 478 (16.4%) |
| 18 to 19 Year Olds | 1,012 (82.0%) | 222 (18.0%) |
| 20 to 24 Year Olds | 1,329 (90.3%) | 142 (9.7%) |
| 25 to 34 Year Olds | 1,048 (86.1%) | 169 (13.9%) |
| 35 Years and over | 677 (80.5%) | 164 (19.5%) |
| Total | 13,828 (81.9%) | 3,056 (18.1%) |
Educational Attainment by Field of Study in Rapid City
Business (3,200 | 15.6%), education (2,955 | 14.4%), science & technology (2,486 | 12.1%), bio, nature & agricultural (1,629 | 7.9%), and social sciences (1,593 | 7.7%) are the most common fields of study among 20,562 individuals in Rapid City who have obtained a bachelor's degree or higher.
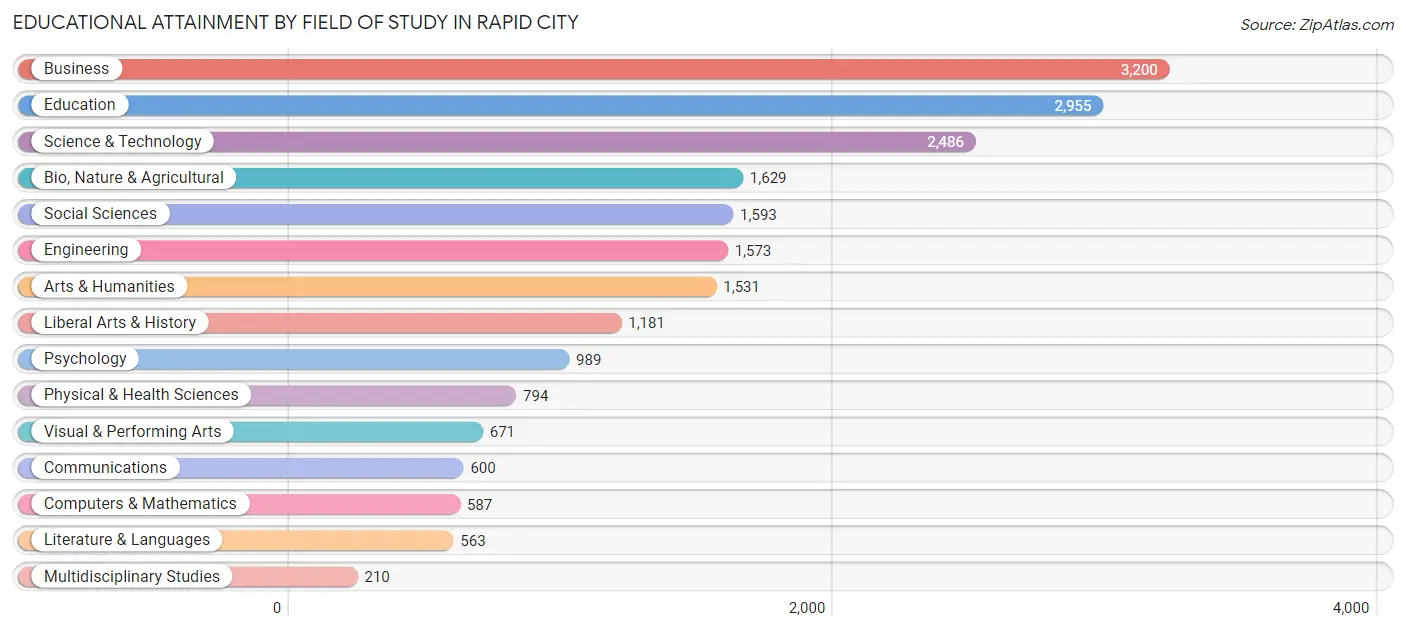
| Field of Study | # Graduates | % Graduates |
| Computers & Mathematics | 587 | 2.9% |
| Bio, Nature & Agricultural | 1,629 | 7.9% |
| Physical & Health Sciences | 794 | 3.9% |
| Psychology | 989 | 4.8% |
| Social Sciences | 1,593 | 7.7% |
| Engineering | 1,573 | 7.6% |
| Multidisciplinary Studies | 210 | 1.0% |
| Science & Technology | 2,486 | 12.1% |
| Business | 3,200 | 15.6% |
| Education | 2,955 | 14.4% |
| Literature & Languages | 563 | 2.7% |
| Liberal Arts & History | 1,181 | 5.7% |
| Visual & Performing Arts | 671 | 3.3% |
| Communications | 600 | 2.9% |
| Arts & Humanities | 1,531 | 7.4% |
| Total | 20,562 | 100.0% |
Transportation & Commute in Rapid City
Vehicle Availability by Sex in Rapid City
The most prevalent vehicle ownership categories in Rapid City are males with 2 vehicles (7,777, accounting for 40.3%) and females with 2 vehicles (6,858, making up 44.6%).
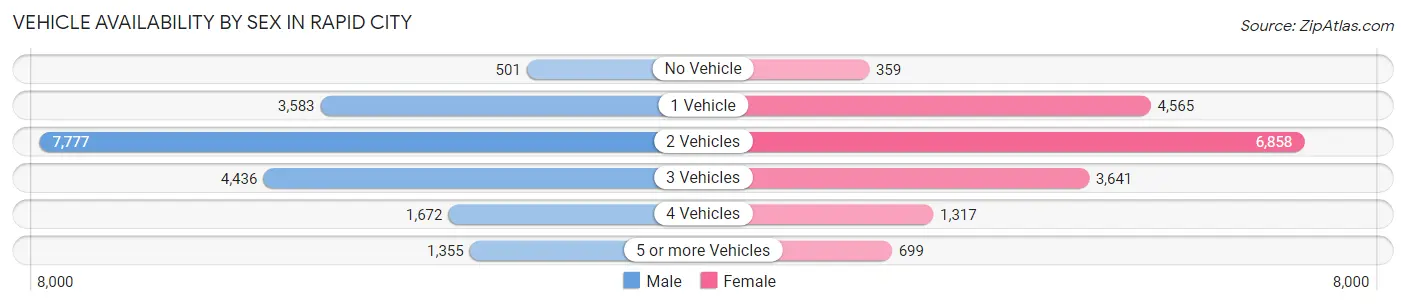
| Vehicles Available | Male | Female |
| No Vehicle | 501 (2.6%) | 359 (2.1%) |
| 1 Vehicle | 3,583 (18.5%) | 4,565 (26.2%) |
| 2 Vehicles | 7,777 (40.3%) | 6,858 (39.3%) |
| 3 Vehicles | 4,436 (23.0%) | 3,641 (20.9%) |
| 4 Vehicles | 1,672 (8.6%) | 1,317 (7.5%) |
| 5 or more Vehicles | 1,355 (7.0%) | 699 (4.0%) |
| Total | 19,324 (100.0%) | 17,439 (100.0%) |
Commute Time in Rapid City
The most frequently occuring commute durations in Rapid City are 15 to 19 minutes (9,119 commuters, 26.9%), 10 to 14 minutes (8,781 commuters, 25.9%), and 5 to 9 minutes (5,500 commuters, 16.2%).
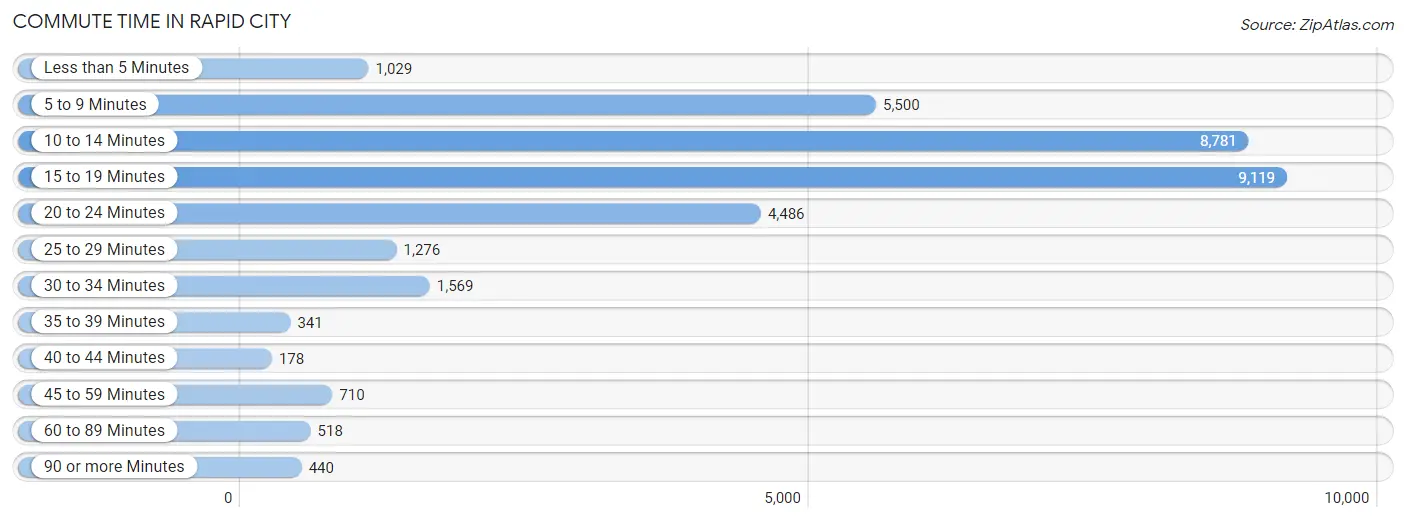
| Commute Time | # Commuters | % Commuters |
| Less than 5 Minutes | 1,029 | 3.0% |
| 5 to 9 Minutes | 5,500 | 16.2% |
| 10 to 14 Minutes | 8,781 | 25.9% |
| 15 to 19 Minutes | 9,119 | 26.9% |
| 20 to 24 Minutes | 4,486 | 13.2% |
| 25 to 29 Minutes | 1,276 | 3.8% |
| 30 to 34 Minutes | 1,569 | 4.6% |
| 35 to 39 Minutes | 341 | 1.0% |
| 40 to 44 Minutes | 178 | 0.5% |
| 45 to 59 Minutes | 710 | 2.1% |
| 60 to 89 Minutes | 518 | 1.5% |
| 90 or more Minutes | 440 | 1.3% |
Commute Time by Sex in Rapid City
The most common commute times in Rapid City are 15 to 19 minutes (4,937 commuters, 27.0%) for males and 15 to 19 minutes (4,182 commuters, 26.7%) for females.
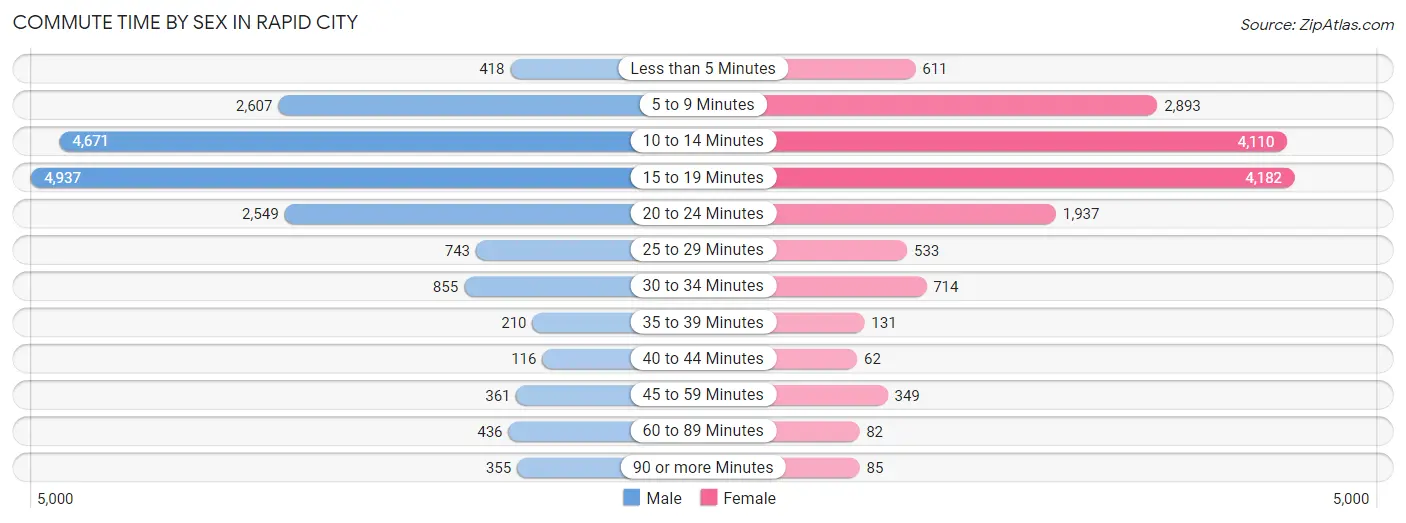
| Commute Time | Male | Female |
| Less than 5 Minutes | 418 (2.3%) | 611 (3.9%) |
| 5 to 9 Minutes | 2,607 (14.3%) | 2,893 (18.4%) |
| 10 to 14 Minutes | 4,671 (25.6%) | 4,110 (26.2%) |
| 15 to 19 Minutes | 4,937 (27.0%) | 4,182 (26.7%) |
| 20 to 24 Minutes | 2,549 (14.0%) | 1,937 (12.3%) |
| 25 to 29 Minutes | 743 (4.1%) | 533 (3.4%) |
| 30 to 34 Minutes | 855 (4.7%) | 714 (4.5%) |
| 35 to 39 Minutes | 210 (1.1%) | 131 (0.8%) |
| 40 to 44 Minutes | 116 (0.6%) | 62 (0.4%) |
| 45 to 59 Minutes | 361 (2.0%) | 349 (2.2%) |
| 60 to 89 Minutes | 436 (2.4%) | 82 (0.5%) |
| 90 or more Minutes | 355 (1.9%) | 85 (0.5%) |
Time of Departure to Work by Sex in Rapid City
The most frequent times of departure to work in Rapid City are 7:00 AM to 7:29 AM (2,584, 14.1%) for males and 7:30 AM to 7:59 AM (2,964, 18.9%) for females.
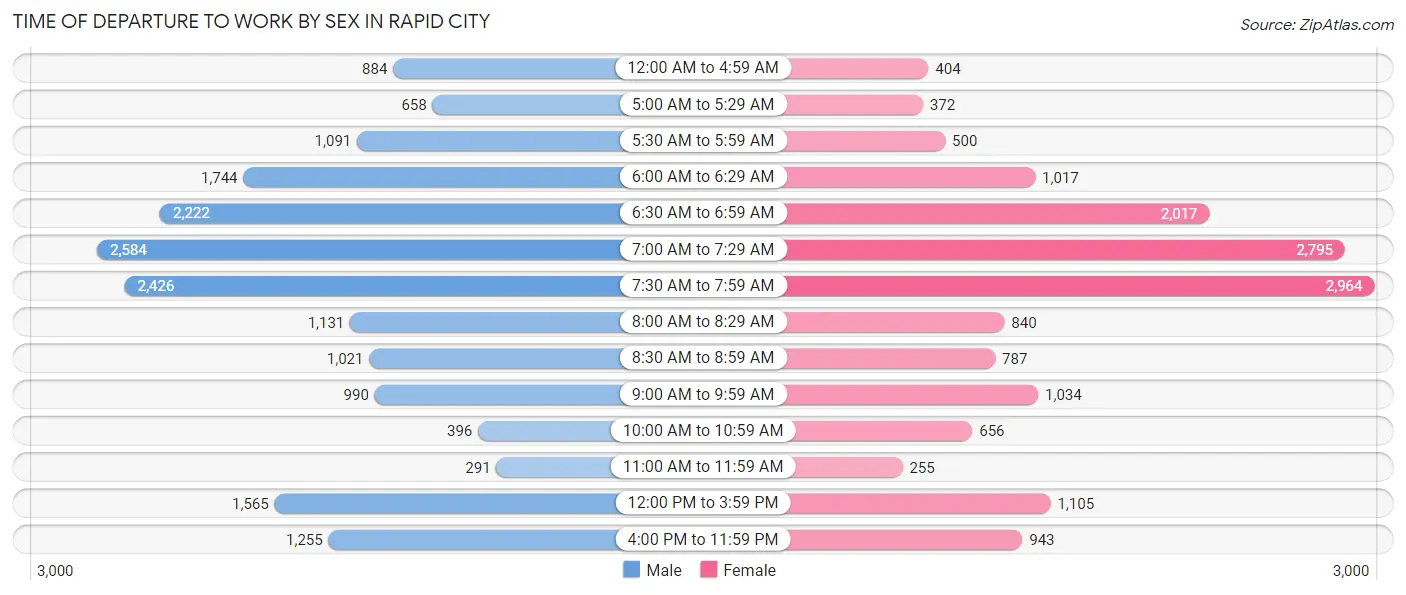
| Time of Departure | Male | Female |
| 12:00 AM to 4:59 AM | 884 (4.8%) | 404 (2.6%) |
| 5:00 AM to 5:29 AM | 658 (3.6%) | 372 (2.4%) |
| 5:30 AM to 5:59 AM | 1,091 (6.0%) | 500 (3.2%) |
| 6:00 AM to 6:29 AM | 1,744 (9.6%) | 1,017 (6.5%) |
| 6:30 AM to 6:59 AM | 2,222 (12.2%) | 2,017 (12.9%) |
| 7:00 AM to 7:29 AM | 2,584 (14.1%) | 2,795 (17.8%) |
| 7:30 AM to 7:59 AM | 2,426 (13.3%) | 2,964 (18.9%) |
| 8:00 AM to 8:29 AM | 1,131 (6.2%) | 840 (5.3%) |
| 8:30 AM to 8:59 AM | 1,021 (5.6%) | 787 (5.0%) |
| 9:00 AM to 9:59 AM | 990 (5.4%) | 1,034 (6.6%) |
| 10:00 AM to 10:59 AM | 396 (2.2%) | 656 (4.2%) |
| 11:00 AM to 11:59 AM | 291 (1.6%) | 255 (1.6%) |
| 12:00 PM to 3:59 PM | 1,565 (8.6%) | 1,105 (7.0%) |
| 4:00 PM to 11:59 PM | 1,255 (6.9%) | 943 (6.0%) |
| Total | 18,258 (100.0%) | 15,689 (100.0%) |
Housing Occupancy in Rapid City
Occupancy by Ownership in Rapid City
Of the total 31,453 dwellings in Rapid City, owner-occupied units account for 19,412 (61.7%), while renter-occupied units make up 12,041 (38.3%).
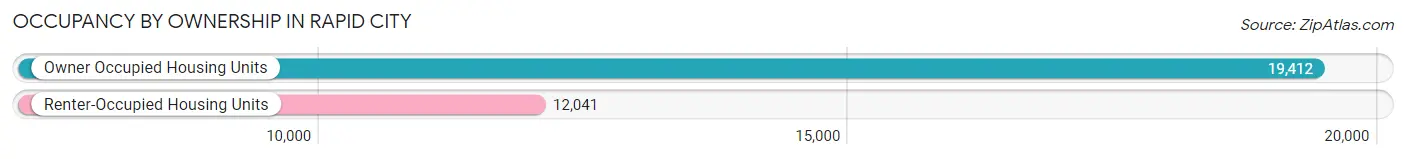
| Occupancy | # Housing Units | % Housing Units |
| Owner Occupied Housing Units | 19,412 | 61.7% |
| Renter-Occupied Housing Units | 12,041 | 38.3% |
| Total Occupied Housing Units | 31,453 | 100.0% |
Occupancy by Household Size in Rapid City
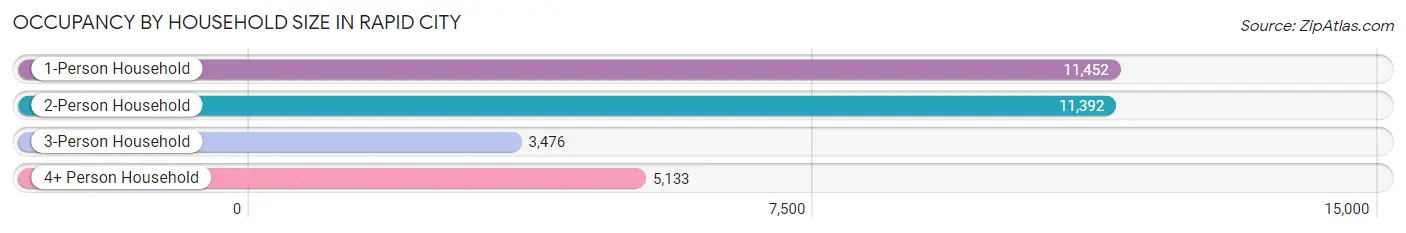
| Household Size | # Housing Units | % Housing Units |
| 1-Person Household | 11,452 | 36.4% |
| 2-Person Household | 11,392 | 36.2% |
| 3-Person Household | 3,476 | 11.1% |
| 4+ Person Household | 5,133 | 16.3% |
| Total Housing Units | 31,453 | 100.0% |
Occupancy by Ownership by Household Size in Rapid City
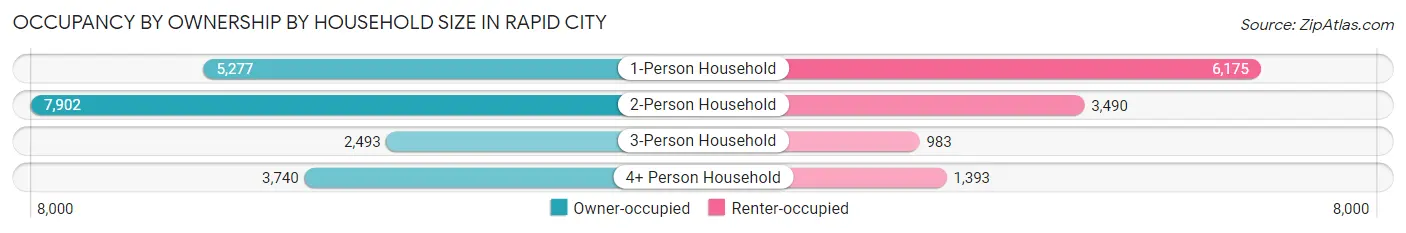
| Household Size | Owner-occupied | Renter-occupied |
| 1-Person Household | 5,277 (46.1%) | 6,175 (53.9%) |
| 2-Person Household | 7,902 (69.4%) | 3,490 (30.6%) |
| 3-Person Household | 2,493 (71.7%) | 983 (28.3%) |
| 4+ Person Household | 3,740 (72.9%) | 1,393 (27.1%) |
| Total Housing Units | 19,412 (61.7%) | 12,041 (38.3%) |
Occupancy by Educational Attainment in Rapid City
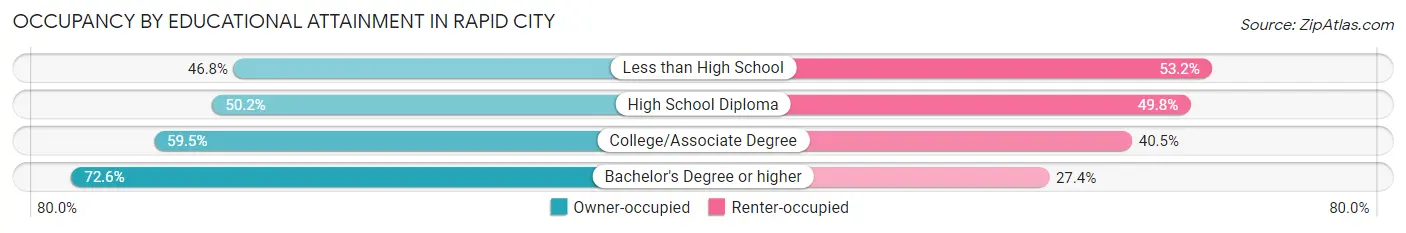
| Household Size | Owner-occupied | Renter-occupied |
| Less than High School | 653 (46.8%) | 742 (53.2%) |
| High School Diploma | 3,665 (50.2%) | 3,634 (49.8%) |
| College/Associate Degree | 6,461 (59.5%) | 4,405 (40.5%) |
| Bachelor's Degree or higher | 8,633 (72.6%) | 3,260 (27.4%) |
Occupancy by Age of Householder in Rapid City
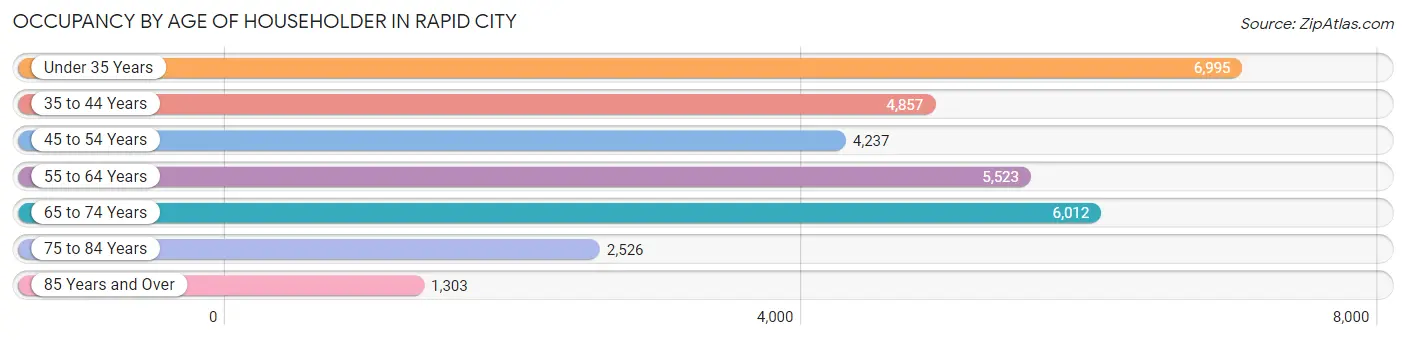
| Age Bracket | # Households | % Households |
| Under 35 Years | 6,995 | 22.2% |
| 35 to 44 Years | 4,857 | 15.4% |
| 45 to 54 Years | 4,237 | 13.5% |
| 55 to 64 Years | 5,523 | 17.6% |
| 65 to 74 Years | 6,012 | 19.1% |
| 75 to 84 Years | 2,526 | 8.0% |
| 85 Years and Over | 1,303 | 4.1% |
| Total | 31,453 | 100.0% |
Housing Finances in Rapid City
Median Income by Occupancy in Rapid City
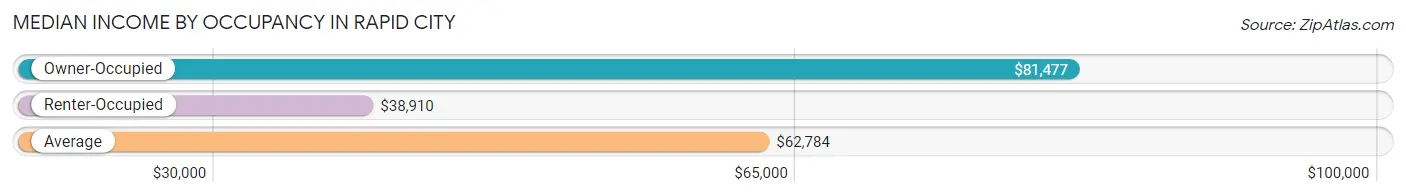
| Occupancy Type | # Households | Median Income |
| Owner-Occupied | 19,412 (61.7%) | $81,477 |
| Renter-Occupied | 12,041 (38.3%) | $38,910 |
| Average | 31,453 (100.0%) | $62,784 |
Occupancy by Householder Income Bracket in Rapid City
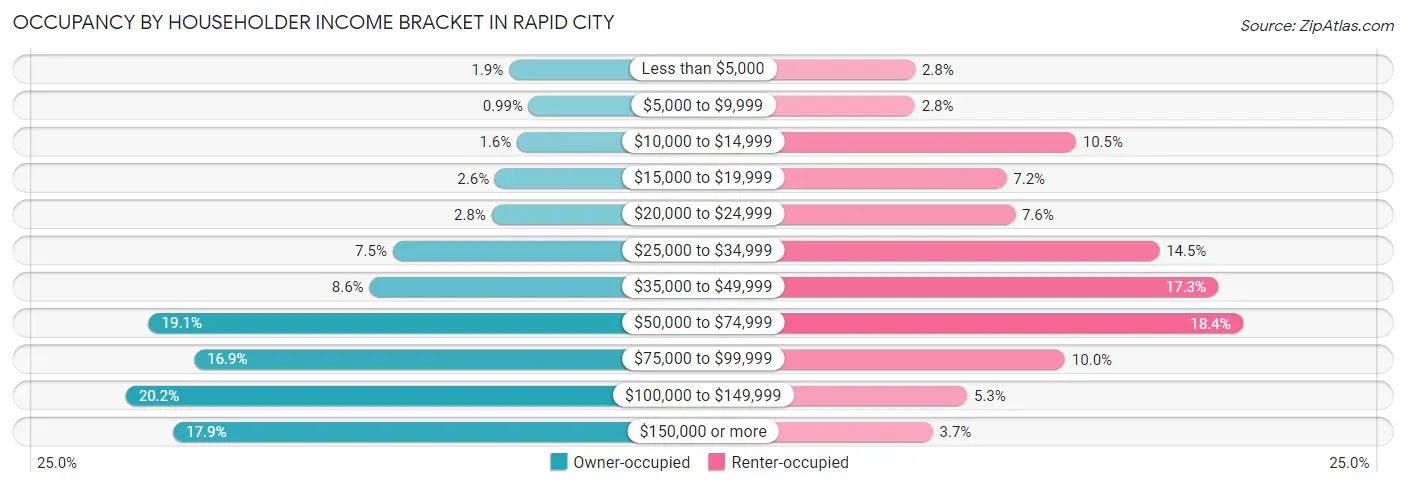
| Income Bracket | Owner-occupied | Renter-occupied |
| Less than $5,000 | 375 (1.9%) | 341 (2.8%) |
| $5,000 to $9,999 | 192 (1.0%) | 339 (2.8%) |
| $10,000 to $14,999 | 300 (1.5%) | 1,263 (10.5%) |
| $15,000 to $19,999 | 504 (2.6%) | 865 (7.2%) |
| $20,000 to $24,999 | 536 (2.8%) | 914 (7.6%) |
| $25,000 to $34,999 | 1,451 (7.5%) | 1,741 (14.5%) |
| $35,000 to $49,999 | 1,666 (8.6%) | 2,077 (17.2%) |
| $50,000 to $74,999 | 3,705 (19.1%) | 2,219 (18.4%) |
| $75,000 to $99,999 | 3,287 (16.9%) | 1,201 (10.0%) |
| $100,000 to $149,999 | 3,917 (20.2%) | 639 (5.3%) |
| $150,000 or more | 3,479 (17.9%) | 442 (3.7%) |
| Total | 19,412 (100.0%) | 12,041 (100.0%) |
Monthly Housing Cost Tiers in Rapid City
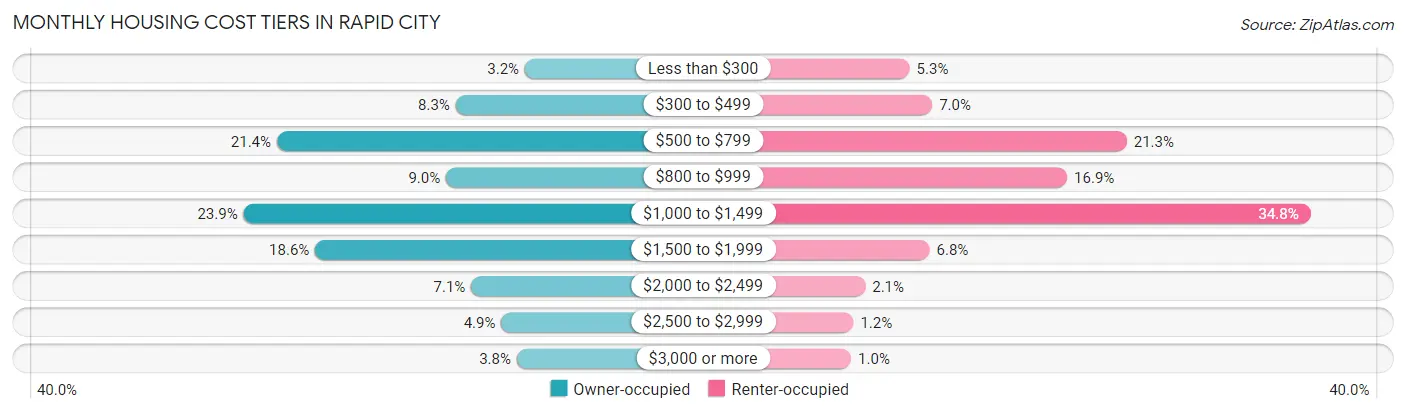
| Monthly Cost | Owner-occupied | Renter-occupied |
| Less than $300 | 611 (3.2%) | 641 (5.3%) |
| $300 to $499 | 1,601 (8.3%) | 840 (7.0%) |
| $500 to $799 | 4,158 (21.4%) | 2,566 (21.3%) |
| $800 to $999 | 1,739 (9.0%) | 2,037 (16.9%) |
| $1,000 to $1,499 | 4,635 (23.9%) | 4,195 (34.8%) |
| $1,500 to $1,999 | 3,611 (18.6%) | 817 (6.8%) |
| $2,000 to $2,499 | 1,380 (7.1%) | 247 (2.1%) |
| $2,500 to $2,999 | 950 (4.9%) | 142 (1.2%) |
| $3,000 or more | 727 (3.7%) | 122 (1.0%) |
| Total | 19,412 (100.0%) | 12,041 (100.0%) |
Physical Housing Characteristics in Rapid City
Housing Structures in Rapid City
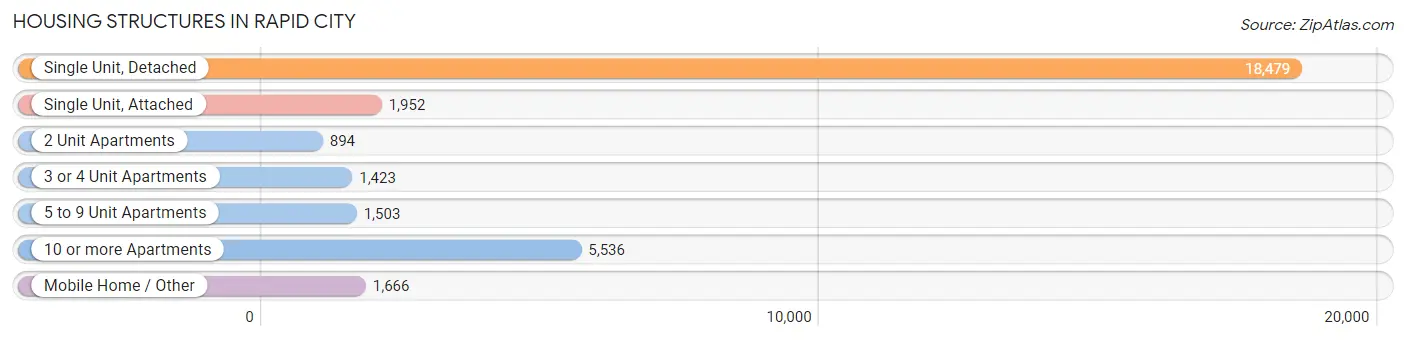
| Structure Type | # Housing Units | % Housing Units |
| Single Unit, Detached | 18,479 | 58.8% |
| Single Unit, Attached | 1,952 | 6.2% |
| 2 Unit Apartments | 894 | 2.8% |
| 3 or 4 Unit Apartments | 1,423 | 4.5% |
| 5 to 9 Unit Apartments | 1,503 | 4.8% |
| 10 or more Apartments | 5,536 | 17.6% |
| Mobile Home / Other | 1,666 | 5.3% |
| Total | 31,453 | 100.0% |
Housing Structures by Occupancy in Rapid City
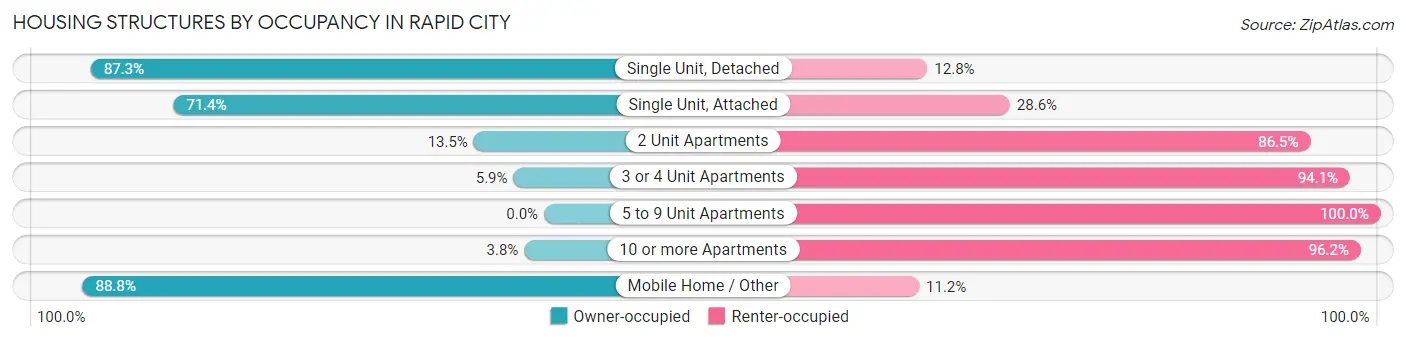
| Structure Type | Owner-occupied | Renter-occupied |
| Single Unit, Detached | 16,123 (87.3%) | 2,356 (12.8%) |
| Single Unit, Attached | 1,393 (71.4%) | 559 (28.6%) |
| 2 Unit Apartments | 121 (13.5%) | 773 (86.5%) |
| 3 or 4 Unit Apartments | 84 (5.9%) | 1,339 (94.1%) |
| 5 to 9 Unit Apartments | 0 (0.0%) | 1,503 (100.0%) |
| 10 or more Apartments | 211 (3.8%) | 5,325 (96.2%) |
| Mobile Home / Other | 1,480 (88.8%) | 186 (11.2%) |
| Total | 19,412 (61.7%) | 12,041 (38.3%) |
Housing Structures by Number of Rooms in Rapid City
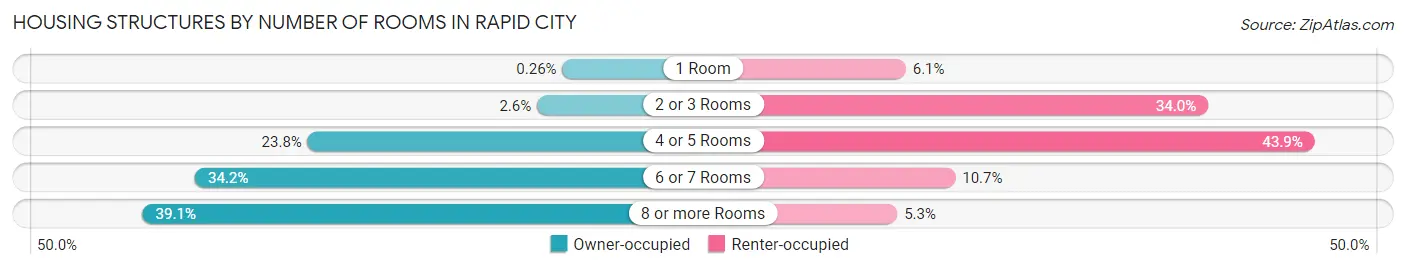
| Number of Rooms | Owner-occupied | Renter-occupied |
| 1 Room | 51 (0.3%) | 733 (6.1%) |
| 2 or 3 Rooms | 507 (2.6%) | 4,099 (34.0%) |
| 4 or 5 Rooms | 4,623 (23.8%) | 5,286 (43.9%) |
| 6 or 7 Rooms | 6,644 (34.2%) | 1,285 (10.7%) |
| 8 or more Rooms | 7,587 (39.1%) | 638 (5.3%) |
| Total | 19,412 (100.0%) | 12,041 (100.0%) |
Housing Structure by Heating Type in Rapid City
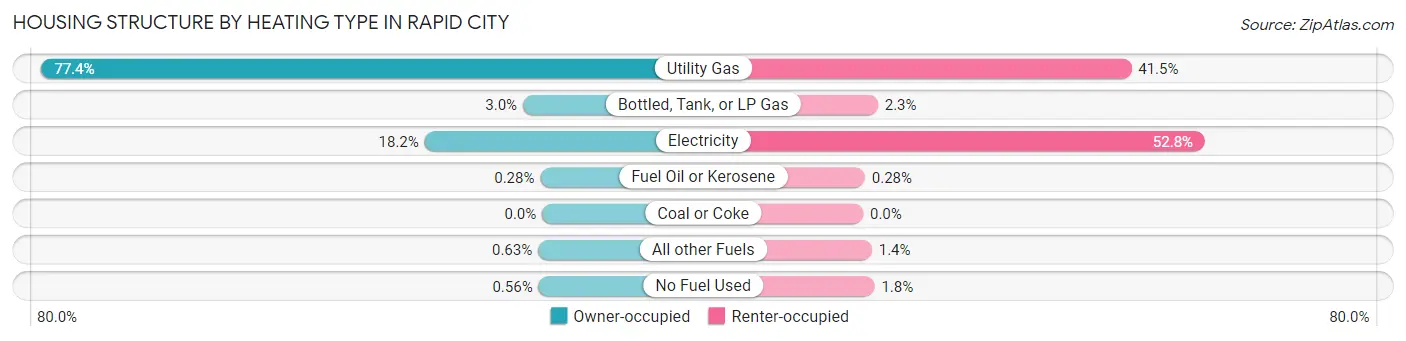
| Heating Type | Owner-occupied | Renter-occupied |
| Utility Gas | 15,027 (77.4%) | 4,994 (41.5%) |
| Bottled, Tank, or LP Gas | 575 (3.0%) | 275 (2.3%) |
| Electricity | 3,525 (18.2%) | 6,362 (52.8%) |
| Fuel Oil or Kerosene | 55 (0.3%) | 34 (0.3%) |
| Coal or Coke | 0 (0.0%) | 0 (0.0%) |
| All other Fuels | 122 (0.6%) | 163 (1.3%) |
| No Fuel Used | 108 (0.6%) | 213 (1.8%) |
| Total | 19,412 (100.0%) | 12,041 (100.0%) |
Household Vehicle Usage in Rapid City
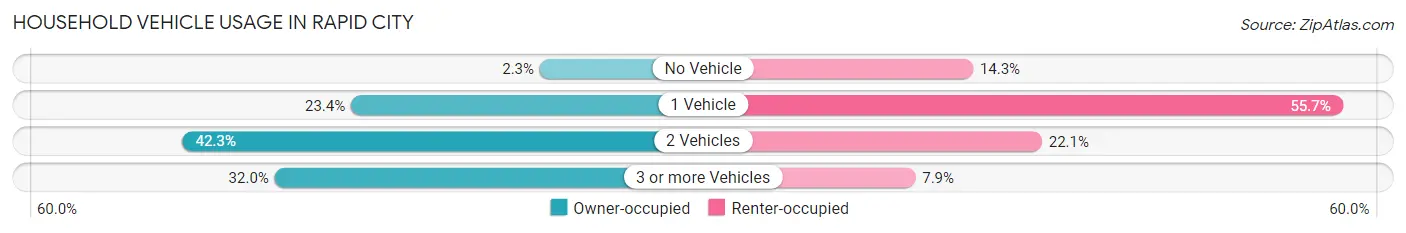
| Vehicles per Household | Owner-occupied | Renter-occupied |
| No Vehicle | 442 (2.3%) | 1,727 (14.3%) |
| 1 Vehicle | 4,549 (23.4%) | 6,710 (55.7%) |
| 2 Vehicles | 8,212 (42.3%) | 2,655 (22.1%) |
| 3 or more Vehicles | 6,209 (32.0%) | 949 (7.9%) |
| Total | 19,412 (100.0%) | 12,041 (100.0%) |
Real Estate & Mortgages in Rapid City
Real Estate and Mortgage Overview in Rapid City
| Characteristic | Without Mortgage | With Mortgage |
| Housing Units | 7,820 | 11,592 |
| Median Property Value | $226,200 | $255,300 |
| Median Household Income | $70,570 | $2,313 |
| Monthly Housing Costs | $628 | $727 |
| Real Estate Taxes | $2,963 | $97 |
Property Value by Mortgage Status in Rapid City
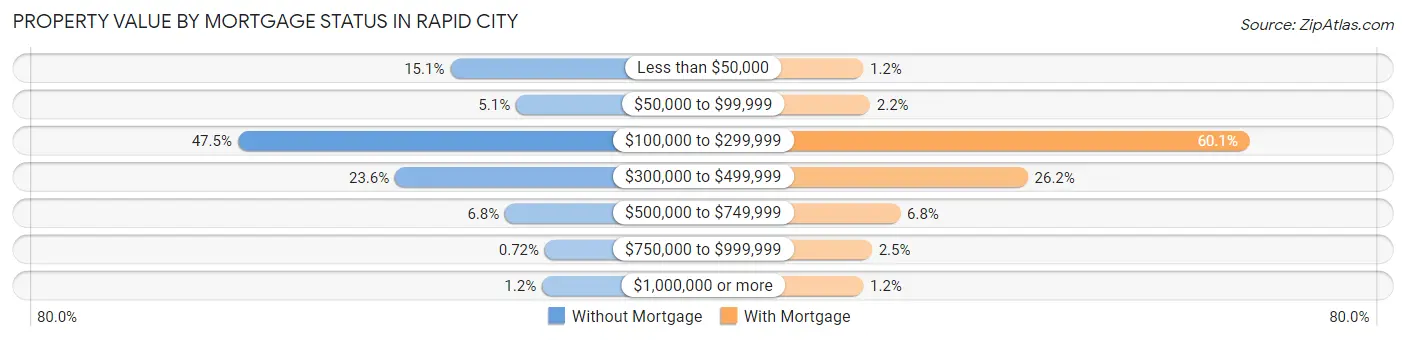
| Property Value | Without Mortgage | With Mortgage |
| Less than $50,000 | 1,184 (15.1%) | 133 (1.1%) |
| $50,000 to $99,999 | 400 (5.1%) | 253 (2.2%) |
| $100,000 to $299,999 | 3,716 (47.5%) | 6,962 (60.1%) |
| $300,000 to $499,999 | 1,842 (23.5%) | 3,039 (26.2%) |
| $500,000 to $749,999 | 531 (6.8%) | 787 (6.8%) |
| $750,000 to $999,999 | 56 (0.7%) | 285 (2.5%) |
| $1,000,000 or more | 91 (1.2%) | 133 (1.1%) |
| Total | 7,820 (100.0%) | 11,592 (100.0%) |
Household Income by Mortgage Status in Rapid City
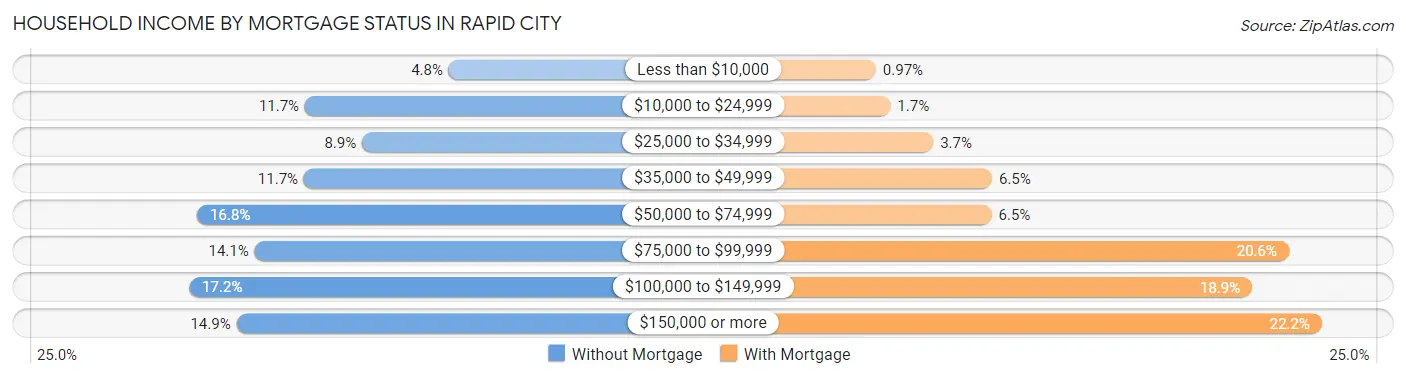
| Household Income | Without Mortgage | With Mortgage |
| Less than $10,000 | 375 (4.8%) | 112 (1.0%) |
| $10,000 to $24,999 | 911 (11.7%) | 192 (1.7%) |
| $25,000 to $34,999 | 698 (8.9%) | 429 (3.7%) |
| $35,000 to $49,999 | 915 (11.7%) | 753 (6.5%) |
| $50,000 to $74,999 | 1,313 (16.8%) | 751 (6.5%) |
| $75,000 to $99,999 | 1,099 (14.1%) | 2,392 (20.6%) |
| $100,000 to $149,999 | 1,343 (17.2%) | 2,188 (18.9%) |
| $150,000 or more | 1,166 (14.9%) | 2,574 (22.2%) |
| Total | 7,820 (100.0%) | 11,592 (100.0%) |
Property Value to Household Income Ratio in Rapid City
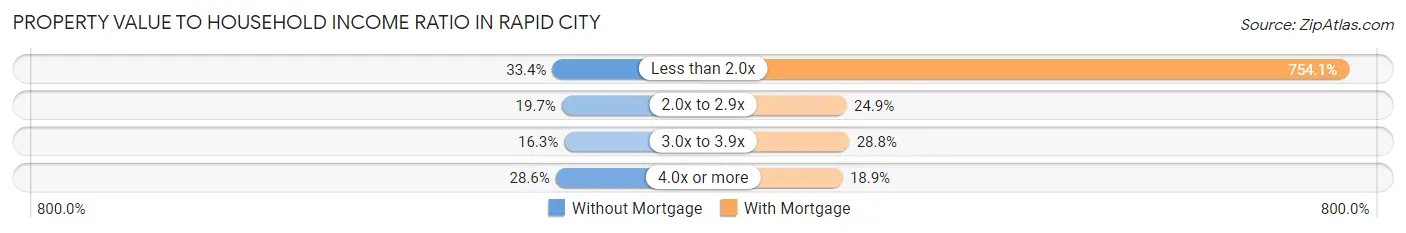
| Value-to-Income Ratio | Without Mortgage | With Mortgage |
| Less than 2.0x | 2,608 (33.4%) | 87,417 (754.1%) |
| 2.0x to 2.9x | 1,542 (19.7%) | 2,888 (24.9%) |
| 3.0x to 3.9x | 1,271 (16.3%) | 3,342 (28.8%) |
| 4.0x or more | 2,234 (28.6%) | 2,195 (18.9%) |
| Total | 7,820 (100.0%) | 11,592 (100.0%) |
Real Estate Taxes by Mortgage Status in Rapid City
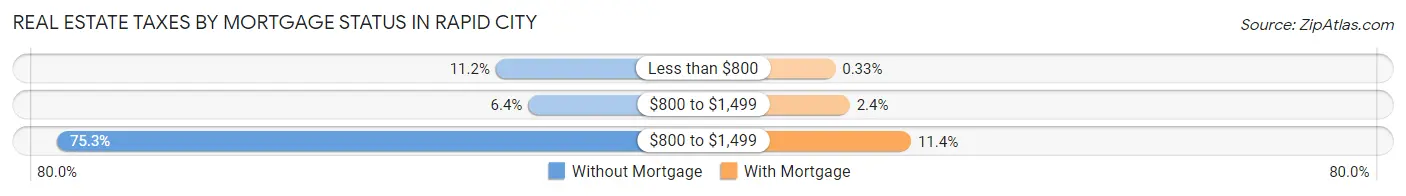
| Property Taxes | Without Mortgage | With Mortgage |
| Less than $800 | 873 (11.2%) | 38 (0.3%) |
| $800 to $1,499 | 502 (6.4%) | 283 (2.4%) |
| $800 to $1,499 | 5,886 (75.3%) | 1,320 (11.4%) |
| Total | 7,820 (100.0%) | 11,592 (100.0%) |
Health & Disability in Rapid City
Health Insurance Coverage by Age in Rapid City
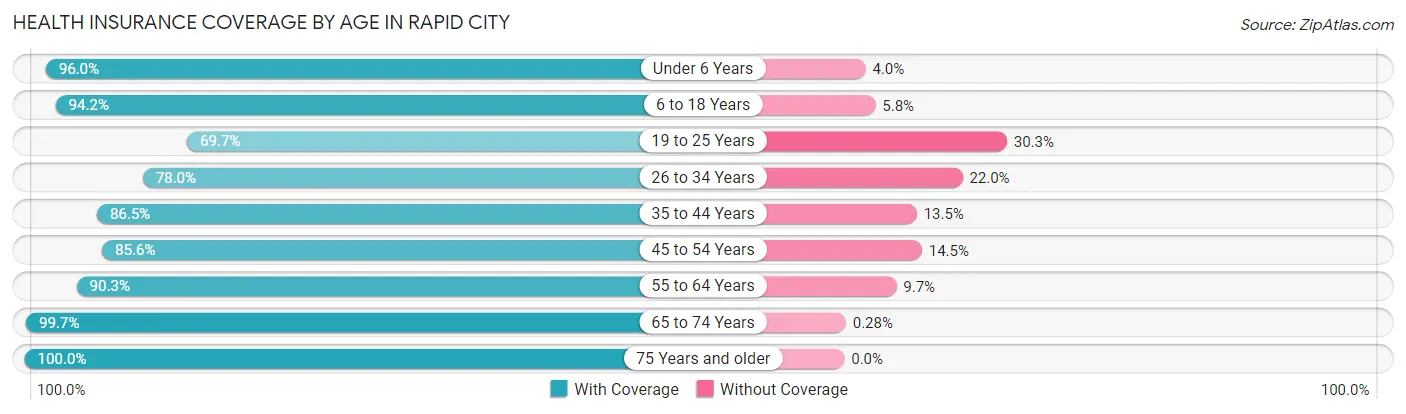
| Age Bracket | With Coverage | Without Coverage |
| Under 6 Years | 5,404 (96.0%) | 223 (4.0%) |
| 6 to 18 Years | 11,092 (94.2%) | 682 (5.8%) |
| 19 to 25 Years | 4,739 (69.7%) | 2,062 (30.3%) |
| 26 to 34 Years | 6,830 (78.0%) | 1,930 (22.0%) |
| 35 to 44 Years | 7,700 (86.5%) | 1,202 (13.5%) |
| 45 to 54 Years | 6,291 (85.6%) | 1,063 (14.4%) |
| 55 to 64 Years | 8,478 (90.3%) | 911 (9.7%) |
| 65 to 74 Years | 8,906 (99.7%) | 25 (0.3%) |
| 75 Years and older | 5,520 (100.0%) | 0 (0.0%) |
| Total | 64,960 (88.9%) | 8,098 (11.1%) |
Health Insurance Coverage by Citizenship Status in Rapid City
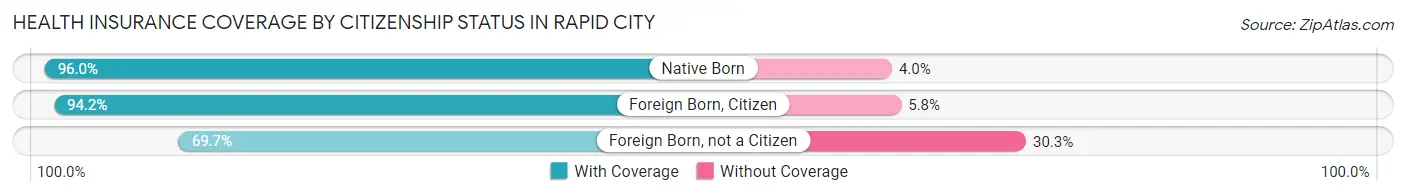
| Citizenship Status | With Coverage | Without Coverage |
| Native Born | 5,404 (96.0%) | 223 (4.0%) |
| Foreign Born, Citizen | 11,092 (94.2%) | 682 (5.8%) |
| Foreign Born, not a Citizen | 4,739 (69.7%) | 2,062 (30.3%) |
Health Insurance Coverage by Household Income in Rapid City
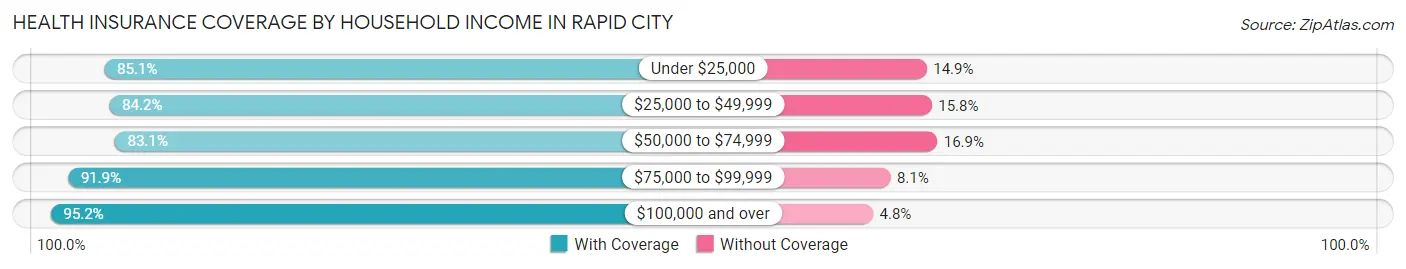
| Household Income | With Coverage | Without Coverage |
| Under $25,000 | 7,846 (85.1%) | 1,373 (14.9%) |
| $25,000 to $49,999 | 10,748 (84.2%) | 2,022 (15.8%) |
| $50,000 to $74,999 | 10,982 (83.1%) | 2,227 (16.9%) |
| $75,000 to $99,999 | 9,778 (91.9%) | 861 (8.1%) |
| $100,000 and over | 24,414 (95.2%) | 1,242 (4.8%) |
Public vs Private Health Insurance Coverage by Age in Rapid City
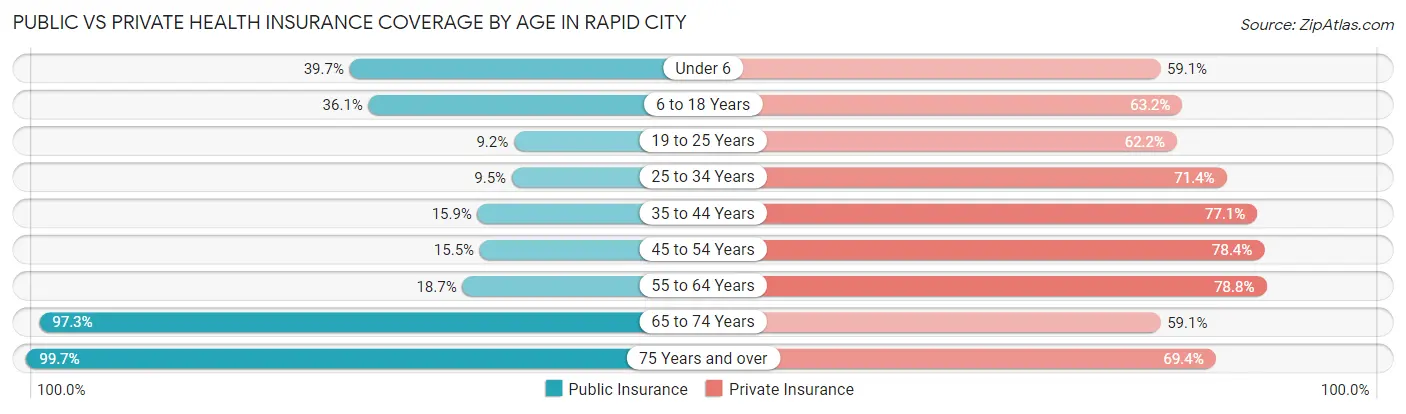
| Age Bracket | Public Insurance | Private Insurance |
| Under 6 | 2,231 (39.7%) | 3,323 (59.1%) |
| 6 to 18 Years | 4,255 (36.1%) | 7,442 (63.2%) |
| 19 to 25 Years | 622 (9.1%) | 4,229 (62.2%) |
| 25 to 34 Years | 836 (9.5%) | 6,253 (71.4%) |
| 35 to 44 Years | 1,415 (15.9%) | 6,862 (77.1%) |
| 45 to 54 Years | 1,139 (15.5%) | 5,764 (78.4%) |
| 55 to 64 Years | 1,758 (18.7%) | 7,397 (78.8%) |
| 65 to 74 Years | 8,685 (97.3%) | 5,279 (59.1%) |
| 75 Years and over | 5,502 (99.7%) | 3,829 (69.4%) |
| Total | 26,443 (36.2%) | 50,378 (69.0%) |
Disability Status by Sex by Age in Rapid City
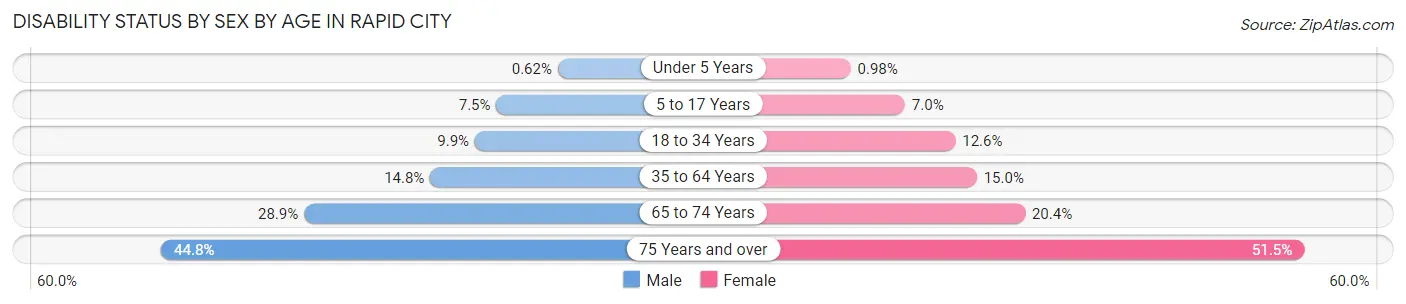
| Age Bracket | Male | Female |
| Under 5 Years | 16 (0.6%) | 21 (1.0%) |
| 5 to 17 Years | 451 (7.5%) | 408 (7.0%) |
| 18 to 34 Years | 850 (9.9%) | 982 (12.6%) |
| 35 to 64 Years | 1,827 (14.8%) | 2,004 (15.0%) |
| 65 to 74 Years | 1,301 (28.9%) | 903 (20.4%) |
| 75 Years and over | 1,035 (44.8%) | 1,652 (51.5%) |
Disability Class by Sex by Age in Rapid City
Disability Class: Hearing Difficulty
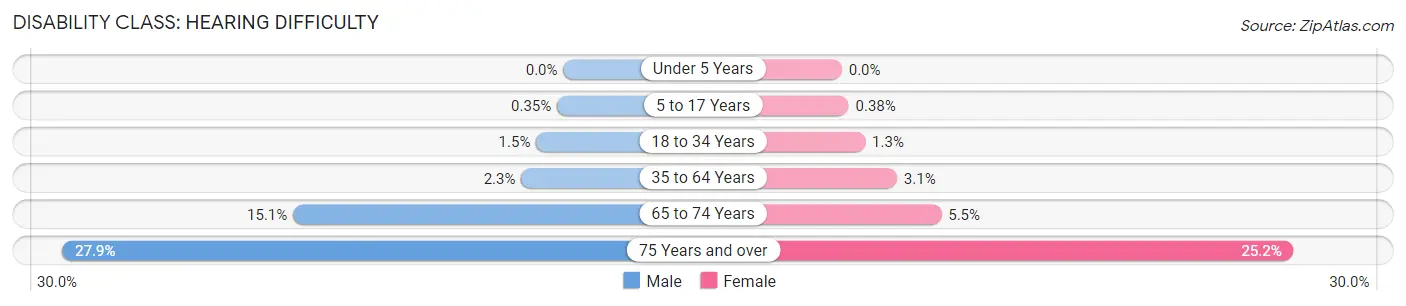
| Age Bracket | Male | Female |
| Under 5 Years | 0 (0.0%) | 0 (0.0%) |
| 5 to 17 Years | 21 (0.4%) | 22 (0.4%) |
| 18 to 34 Years | 130 (1.5%) | 101 (1.3%) |
| 35 to 64 Years | 288 (2.3%) | 409 (3.1%) |
| 65 to 74 Years | 678 (15.0%) | 245 (5.5%) |
| 75 Years and over | 645 (27.9%) | 807 (25.2%) |
Disability Class: Vision Difficulty
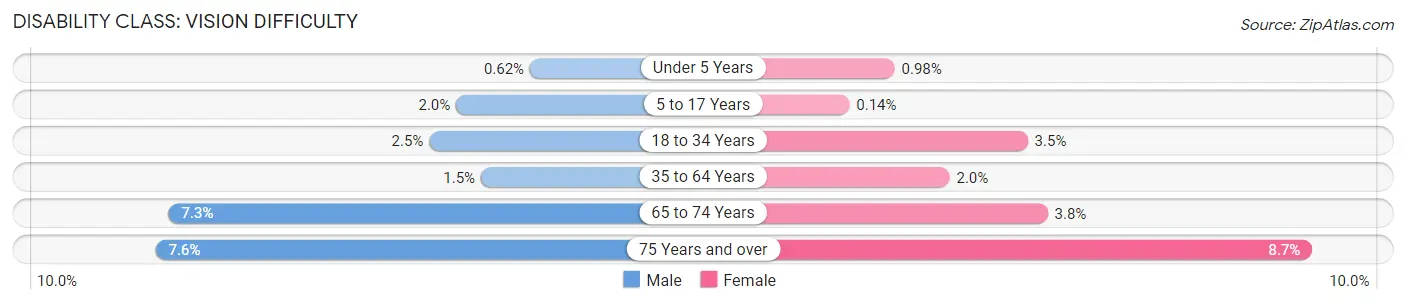
| Age Bracket | Male | Female |
| Under 5 Years | 16 (0.6%) | 21 (1.0%) |
| 5 to 17 Years | 120 (2.0%) | 8 (0.1%) |
| 18 to 34 Years | 215 (2.5%) | 268 (3.5%) |
| 35 to 64 Years | 188 (1.5%) | 266 (2.0%) |
| 65 to 74 Years | 330 (7.3%) | 169 (3.8%) |
| 75 Years and over | 175 (7.6%) | 280 (8.7%) |
Disability Class: Cognitive Difficulty
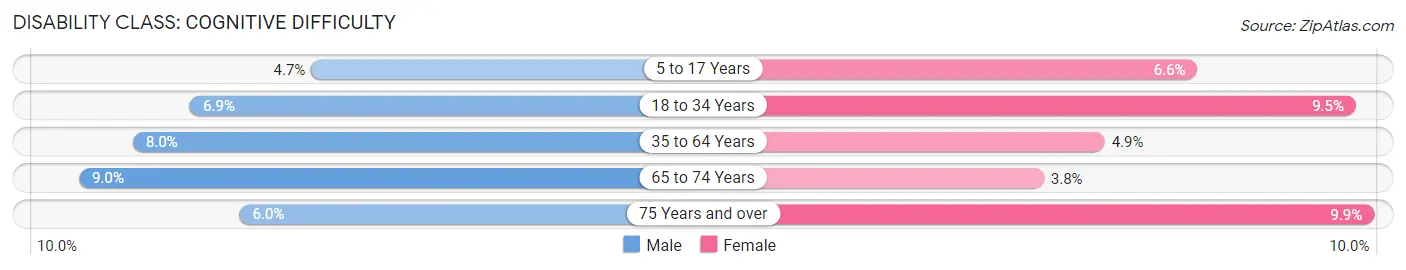
| Age Bracket | Male | Female |
| 5 to 17 Years | 283 (4.7%) | 383 (6.6%) |
| 18 to 34 Years | 598 (6.9%) | 741 (9.5%) |
| 35 to 64 Years | 984 (8.0%) | 651 (4.9%) |
| 65 to 74 Years | 405 (9.0%) | 166 (3.7%) |
| 75 Years and over | 139 (6.0%) | 317 (9.9%) |
Disability Class: Ambulatory Difficulty
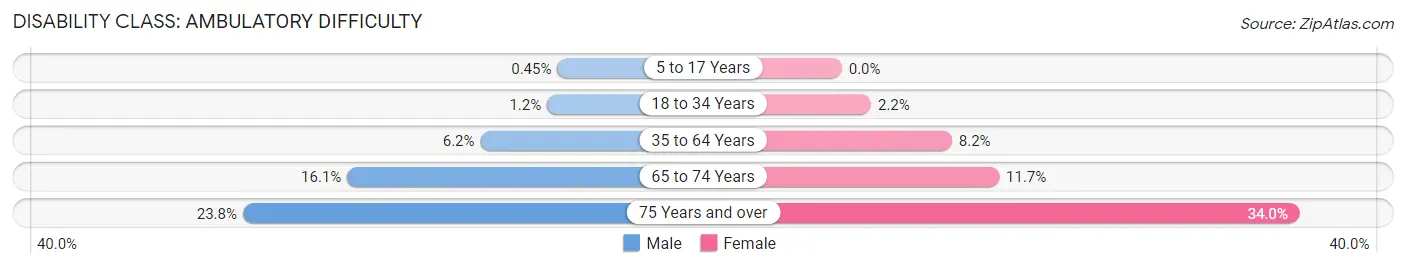
| Age Bracket | Male | Female |
| 5 to 17 Years | 27 (0.4%) | 0 (0.0%) |
| 18 to 34 Years | 104 (1.2%) | 169 (2.2%) |
| 35 to 64 Years | 759 (6.2%) | 1,089 (8.2%) |
| 65 to 74 Years | 723 (16.1%) | 517 (11.7%) |
| 75 Years and over | 550 (23.8%) | 1,091 (34.0%) |
Disability Class: Self-Care Difficulty
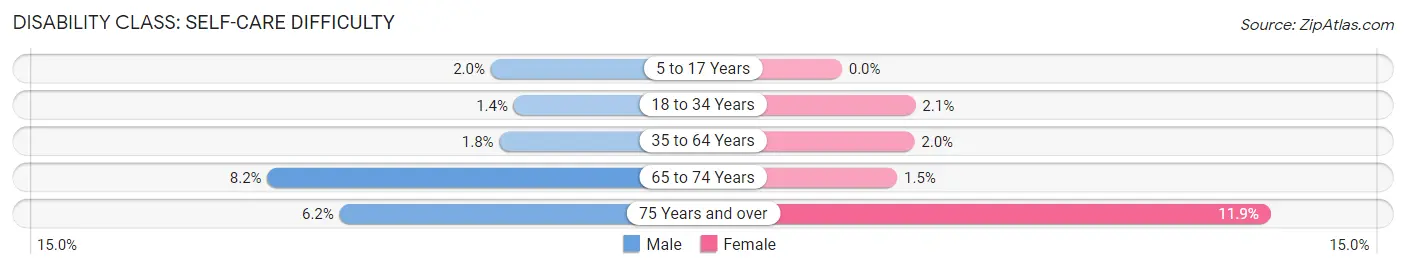
| Age Bracket | Male | Female |
| 5 to 17 Years | 122 (2.0%) | 0 (0.0%) |
| 18 to 34 Years | 119 (1.4%) | 159 (2.1%) |
| 35 to 64 Years | 219 (1.8%) | 269 (2.0%) |
| 65 to 74 Years | 371 (8.2%) | 68 (1.5%) |
| 75 Years and over | 144 (6.2%) | 383 (11.9%) |
Technology Access in Rapid City
Computing Device Access in Rapid City
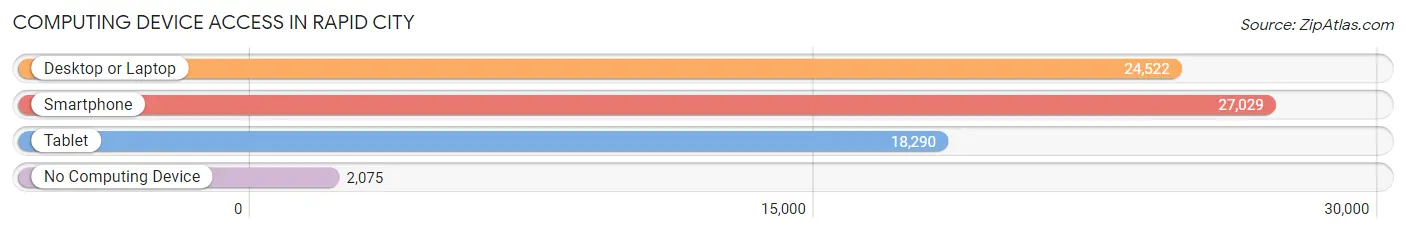
| Device Type | # Households | % Households |
| Desktop or Laptop | 24,522 | 78.0% |
| Smartphone | 27,029 | 85.9% |
| Tablet | 18,290 | 58.2% |
| No Computing Device | 2,075 | 6.6% |
| Total | 31,453 | 100.0% |
Internet Access in Rapid City
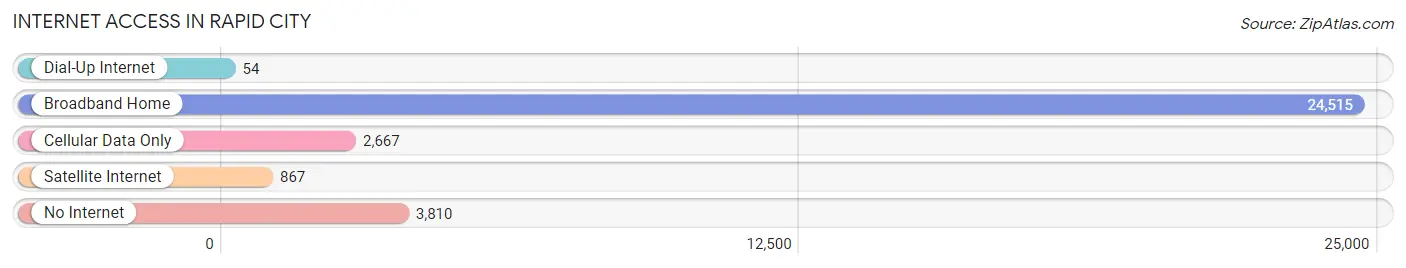
| Internet Type | # Households | % Households |
| Dial-Up Internet | 54 | 0.2% |
| Broadband Home | 24,515 | 77.9% |
| Cellular Data Only | 2,667 | 8.5% |
| Satellite Internet | 867 | 2.8% |
| No Internet | 3,810 | 12.1% |
| Total | 31,453 | 100.0% |
Rapid City Summary
Rapid City, South Dakota is a city located in the Black Hills region of the state. It is the second largest city in South Dakota, with a population of 67,956 as of the 2010 census. The city is the county seat of Pennington County and is the economic and cultural hub of the region. Rapid City is known for its rich history, diverse geography, vibrant economy, and diverse demographics.
History
Rapid City was founded in 1876 by a group of miners and ranchers who were looking for gold in the Black Hills. The city was originally named “Hay Camp” after the nearby creek, but was later renamed “Rapid City” due to the fast-flowing water in the creek. The city quickly grew and became an important trading center for the region. In 1889, the city was incorporated and the first mayor was elected.
Rapid City experienced a period of rapid growth in the early 20th century, due to the discovery of gold in the area. The city was also the site of the famous Mount Rushmore National Memorial, which was completed in 1941. The city continued to grow throughout the 20th century, and by the 2000 census, the population had grown to 59,607.
Geography
Rapid City is located in the Black Hills region of South Dakota, in the western part of the state. The city is situated at an elevation of 3,200 feet, and is surrounded by the Black Hills National Forest. The city is located at the intersection of Interstate 90 and US Route 16, and is about 60 miles east of the Wyoming border.
The city is located in a semi-arid climate, with hot summers and cold winters. The average annual temperature is 48.3 degrees Fahrenheit, and the average annual precipitation is 17.3 inches.
Economy
Rapid City’s economy is largely based on tourism, with the city being a popular destination for visitors to the Black Hills region. The city is also home to several major employers, including Ellsworth Air Force Base, the South Dakota School of Mines and Technology, and the Regional Health System.
The city’s economy is also supported by a variety of industries, including healthcare, retail, manufacturing, and government. The city is also home to several major retail stores, including Walmart, Target, and Best Buy.
Demographics
As of the 2010 census, the population of Rapid City was 67,956. The city has a diverse population, with the largest racial group being white (77.2%), followed by Native American (7.3%), African American (4.2%), Asian (2.2%), and Hispanic or Latino (2.1%).
The median household income in the city is $45,945, and the median home value is $164,400. The city has a poverty rate of 13.3%, and the unemployment rate is 3.7%.
Rapid City is a vibrant city with a rich history, diverse geography, vibrant economy, and diverse demographics. The city is a popular destination for tourists, and is home to several major employers. The city has a diverse population, with the largest racial group being white, followed by Native American, African American, Asian, and Hispanic or Latino. The city has a median household income of $45,945, and a median home value of $164,400. The city has a poverty rate of 13.3%, and the unemployment rate is 3.7%.
Common Questions
What is Per Capita Income in Rapid City?
Per Capita income in Rapid City is $38,421.
What is the Median Family Income in Rapid City?
Median Family Income in Rapid City is $83,972.
What is the Median Household income in Rapid City?
Median Household Income in Rapid City is $62,784.
What is Income or Wage Gap in Rapid City?
Income or Wage Gap in Rapid City is 12.6%.
Women in Rapid City earn 87.4 cents for every dollar earned by a man.
What is Family Income Deficit in Rapid City?
Family Income Deficit in Rapid City is $11,624.
Families that are below poverty line in Rapid City earn $11,624 less on average than the poverty threshold level.
What is Inequality or Gini Index in Rapid City?
Inequality or Gini Index in Rapid City is 0.48.
What is the Total Population of Rapid City?
Total Population of Rapid City is 75,632.
What is the Total Male Population of Rapid City?
Total Male Population of Rapid City is 38,256.
What is the Total Female Population of Rapid City?
Total Female Population of Rapid City is 37,376.
What is the Ratio of Males per 100 Females in Rapid City?
There are 102.35 Males per 100 Females in Rapid City.
What is the Ratio of Females per 100 Males in Rapid City?
There are 97.70 Females per 100 Males in Rapid City.
What is the Median Population Age in Rapid City?
Median Population Age in Rapid City is 38.6 Years.
What is the Average Family Size in Rapid City
Average Family Size in Rapid City is 3.0 People.
What is the Average Household Size in Rapid City
Average Household Size in Rapid City is 2.3 People.
How Large is the Labor Force in Rapid City?
There are 39,144 People in the Labor Forcein in Rapid City.
What is the Percentage of People in the Labor Force in Rapid City?
64.2% of People are in the Labor Force in Rapid City.
What is the Unemployment Rate in Rapid City?
Unemployment Rate in Rapid City is 3.4%.