Vermillion, SD Map & Demographics
Vermillion Map
Vermillion Overview
$24,781
PER CAPITA INCOME
$87,645
AVG FAMILY INCOME
$47,813
AVG HOUSEHOLD INCOME
48.3%
WAGE / INCOME GAP [ % ]
51.7¢/ $1
WAGE / INCOME GAP [ $ ]
$14,991
FAMILY INCOME DEFICIT
0.48
INEQUALITY / GINI INDEX
11,667
TOTAL POPULATION
5,657
MALE POPULATION
6,010
FEMALE POPULATION
94.13
MALES / 100 FEMALES
106.24
FEMALES / 100 MALES
23.0
MEDIAN AGE
3.0
AVG FAMILY SIZE
2.3
AVG HOUSEHOLD SIZE
6,856
LABOR FORCE [ PEOPLE ]
68.9%
PERCENT IN LABOR FORCE
10.0%
UNEMPLOYMENT RATE
Vermillion Zip Codes
Vermillion Area Codes
Income in Vermillion
Income Overview in Vermillion
Per Capita Income in Vermillion is $24,781, while median incomes of families and households are $87,645 and $47,813 respectively.
| Characteristic | Number | Measure |
| Per Capita Income | 11,667 | $24,781 |
| Median Family Income | 1,816 | $87,645 |
| Mean Family Income | 1,816 | $96,548 |
| Median Household Income | 4,038 | $47,813 |
| Mean Household Income | 4,038 | $65,838 |
| Income Deficit | 1,816 | $14,991 |
| Wage / Income Gap (%) | 11,667 | 48.32% |
| Wage / Income Gap ($) | 11,667 | 51.68¢ per $1 |
| Gini / Inequality Index | 11,667 | 0.48 |
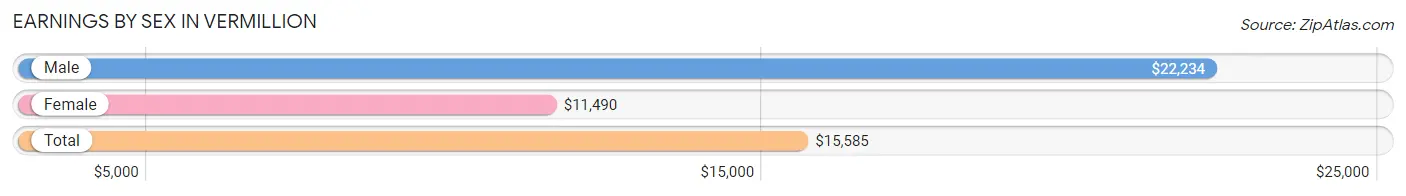
Earnings by Sex in Vermillion
Average Earnings in Vermillion are $15,585, $22,234 for men and $11,490 for women, a difference of 48.3%.
| Sex | Number | Average Earnings |
| Male | 3,882 (48.4%) | $22,234 |
| Female | 4,133 (51.6%) | $11,490 |
| Total | 8,015 (100.0%) | $15,585 |
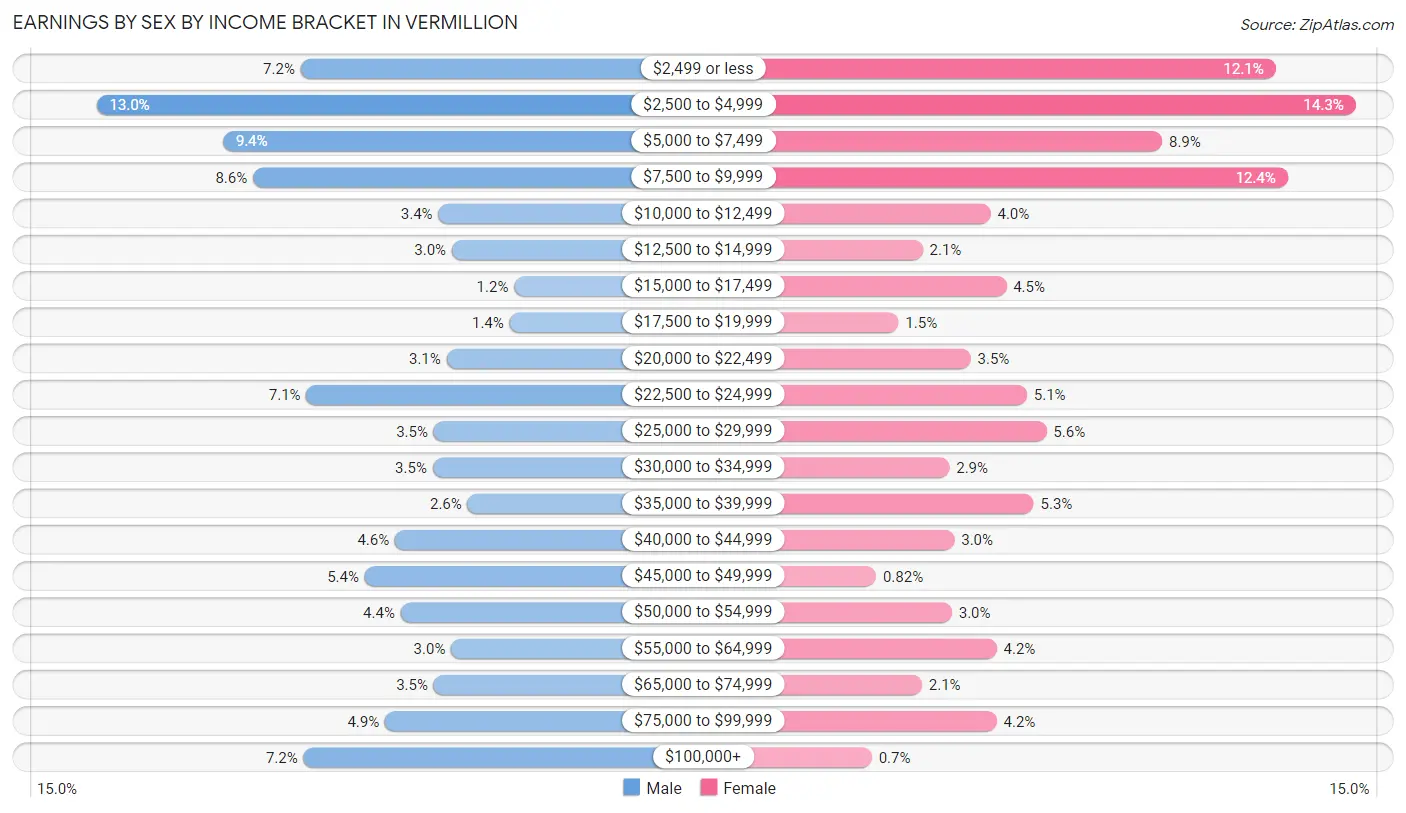
Earnings by Sex by Income Bracket in Vermillion
The most common earnings brackets in Vermillion are $2,500 to $4,999 for men (504 | 13.0%) and $2,500 to $4,999 for women (591 | 14.3%).
| Income | Male | Female |
| $2,499 or less | 281 (7.2%) | 498 (12.0%) |
| $2,500 to $4,999 | 504 (13.0%) | 591 (14.3%) |
| $5,000 to $7,499 | 366 (9.4%) | 366 (8.9%) |
| $7,500 to $9,999 | 333 (8.6%) | 512 (12.4%) |
| $10,000 to $12,499 | 131 (3.4%) | 167 (4.0%) |
| $12,500 to $14,999 | 116 (3.0%) | 88 (2.1%) |
| $15,000 to $17,499 | 48 (1.2%) | 185 (4.5%) |
| $17,500 to $19,999 | 53 (1.4%) | 60 (1.5%) |
| $20,000 to $22,499 | 122 (3.1%) | 144 (3.5%) |
| $22,500 to $24,999 | 275 (7.1%) | 209 (5.1%) |
| $25,000 to $29,999 | 136 (3.5%) | 232 (5.6%) |
| $30,000 to $34,999 | 137 (3.5%) | 119 (2.9%) |
| $35,000 to $39,999 | 99 (2.5%) | 217 (5.2%) |
| $40,000 to $44,999 | 178 (4.6%) | 125 (3.0%) |
| $45,000 to $49,999 | 211 (5.4%) | 34 (0.8%) |
| $50,000 to $54,999 | 172 (4.4%) | 122 (2.9%) |
| $55,000 to $64,999 | 117 (3.0%) | 174 (4.2%) |
| $65,000 to $74,999 | 136 (3.5%) | 87 (2.1%) |
| $75,000 to $99,999 | 189 (4.9%) | 174 (4.2%) |
| $100,000+ | 278 (7.2%) | 29 (0.7%) |
| Total | 3,882 (100.0%) | 4,133 (100.0%) |
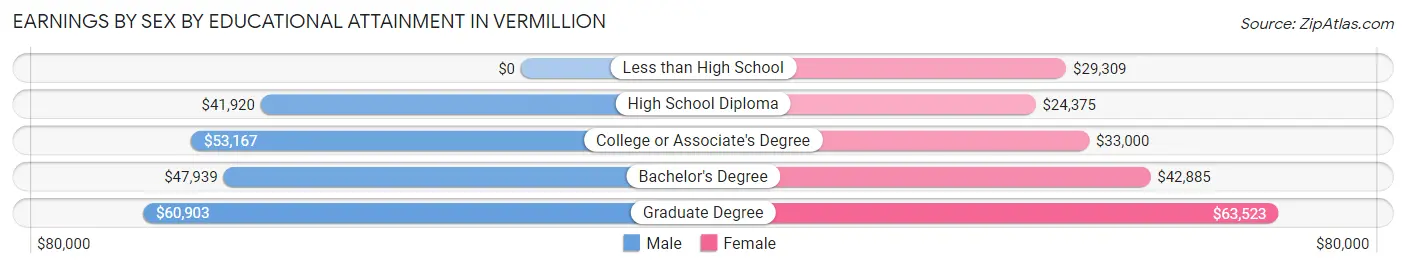
Earnings by Sex by Educational Attainment in Vermillion
Average earnings in Vermillion are $46,796 for men and $36,108 for women, a difference of 22.8%. Men with an educational attainment of graduate degree enjoy the highest average annual earnings of $60,903, while those with high school diploma education earn the least with $41,920. Women with an educational attainment of graduate degree earn the most with the average annual earnings of $63,523, while those with high school diploma education have the smallest earnings of $24,375.
| Educational Attainment | Male Income | Female Income |
| Less than High School | - | - |
| High School Diploma | $41,920 | $24,375 |
| College or Associate's Degree | $53,167 | $33,000 |
| Bachelor's Degree | $47,939 | $42,885 |
| Graduate Degree | $60,903 | $63,523 |
| Total | $46,796 | $36,108 |
Family Income in Vermillion
Family Income Brackets in Vermillion
According to the Vermillion family income data, there are 439 families falling into the $100,000 to $149,999 income range, which is the most common income bracket and makes up 24.2% of all families. Conversely, the $15,000 to $24,999 income bracket is the least frequent group with only 25 families (1.4%) belonging to this category.
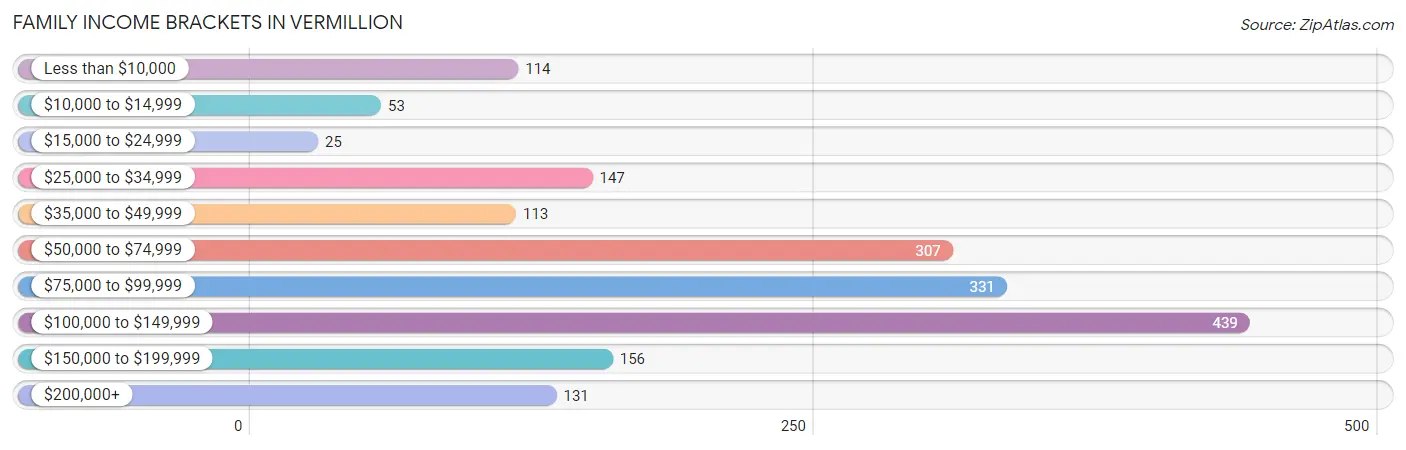
| Income Bracket | # Families | % Families |
| Less than $10,000 | 114 | 6.3% |
| $10,000 to $14,999 | 53 | 2.9% |
| $15,000 to $24,999 | 25 | 1.4% |
| $25,000 to $34,999 | 147 | 8.1% |
| $35,000 to $49,999 | 113 | 6.2% |
| $50,000 to $74,999 | 307 | 16.9% |
| $75,000 to $99,999 | 331 | 18.2% |
| $100,000 to $149,999 | 439 | 24.2% |
| $150,000 to $199,999 | 156 | 8.6% |
| $200,000+ | 131 | 7.2% |
Family Income by Famaliy Size in Vermillion
5-person families (119 | 6.6%) account for the highest median family income in Vermillion with $181,903 per family, while 2-person families (823 | 45.3%) have the highest median income of $44,021 per family member.
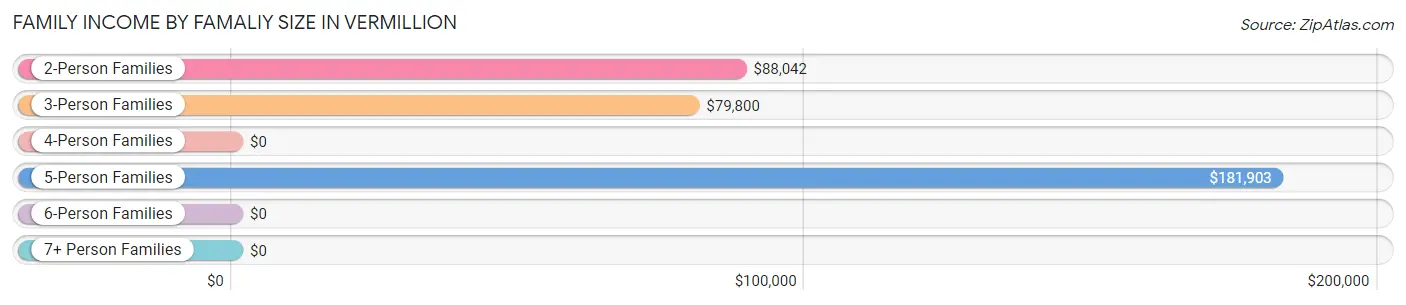
| Income Bracket | # Families | Median Income |
| 2-Person Families | 823 (45.3%) | $88,042 |
| 3-Person Families | 540 (29.7%) | $79,800 |
| 4-Person Families | 284 (15.6%) | $0 |
| 5-Person Families | 119 (6.6%) | $181,903 |
| 6-Person Families | 41 (2.3%) | $0 |
| 7+ Person Families | 9 (0.5%) | $0 |
| Total | 1,816 (100.0%) | $87,645 |
Family Income by Number of Earners in Vermillion
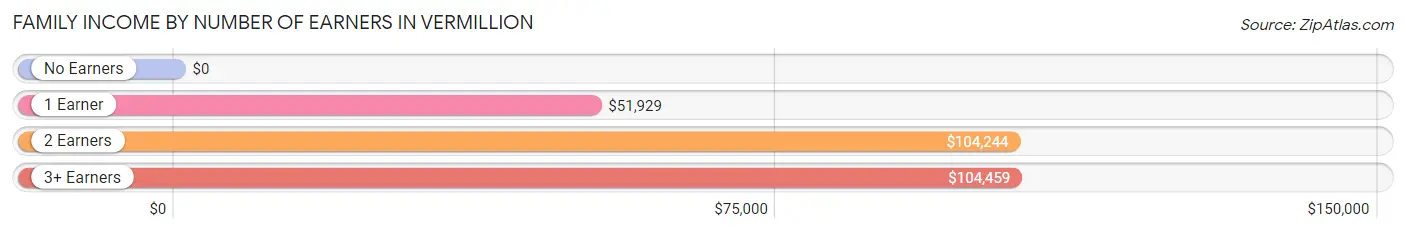
| Number of Earners | # Families | Median Income |
| No Earners | 293 (16.1%) | $0 |
| 1 Earner | 568 (31.3%) | $51,929 |
| 2 Earners | 859 (47.3%) | $104,244 |
| 3+ Earners | 96 (5.3%) | $104,459 |
| Total | 1,816 (100.0%) | $87,645 |
Household Income in Vermillion
Household Income Brackets in Vermillion
With 614 households falling in the category, the $50,000 to $74,999 income range is the most frequent in Vermillion, accounting for 15.2% of all households. In contrast, only 137 households (3.4%) fall into the $200,000+ income bracket, making it the least populous group.
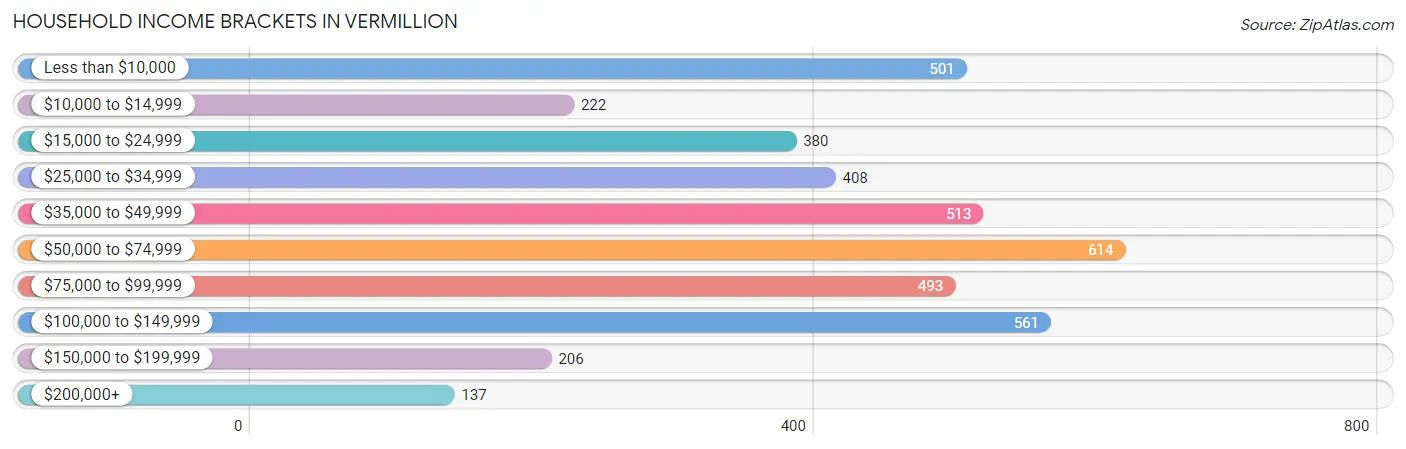
| Income Bracket | # Households | % Households |
| Less than $10,000 | 501 | 12.4% |
| $10,000 to $14,999 | 222 | 5.5% |
| $15,000 to $24,999 | 380 | 9.4% |
| $25,000 to $34,999 | 408 | 10.1% |
| $35,000 to $49,999 | 513 | 12.7% |
| $50,000 to $74,999 | 614 | 15.2% |
| $75,000 to $99,999 | 493 | 12.2% |
| $100,000 to $149,999 | 561 | 13.9% |
| $150,000 to $199,999 | 206 | 5.1% |
| $200,000+ | 137 | 3.4% |
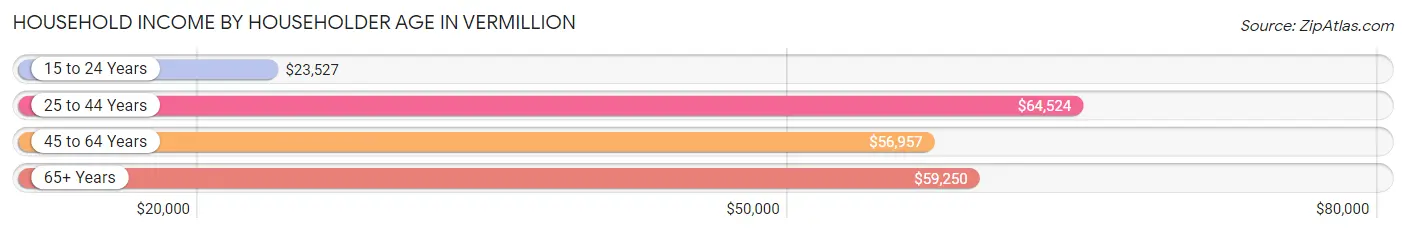
Household Income by Householder Age in Vermillion
The median household income in Vermillion is $47,813, with the highest median household income of $64,524 found in the 25 to 44 years age bracket for the primary householder. A total of 1,454 households (36.0%) fall into this category. Meanwhile, the 15 to 24 years age bracket for the primary householder has the lowest median household income of $23,527, with 1,098 households (27.2%) in this group.
| Income Bracket | # Households | Median Income |
| 15 to 24 Years | 1,098 (27.2%) | $23,527 |
| 25 to 44 Years | 1,454 (36.0%) | $64,524 |
| 45 to 64 Years | 886 (21.9%) | $56,957 |
| 65+ Years | 600 (14.9%) | $59,250 |
| Total | 4,038 (100.0%) | $47,813 |
Poverty in Vermillion
Income Below Poverty by Sex and Age in Vermillion
With 23.2% poverty level for males and 29.2% for females among the residents of Vermillion, under 5 year old males and 18 to 24 year old females are the most vulnerable to poverty, with 114 males (50.2%) and 969 females (62.6%) in their respective age groups living below the poverty level.
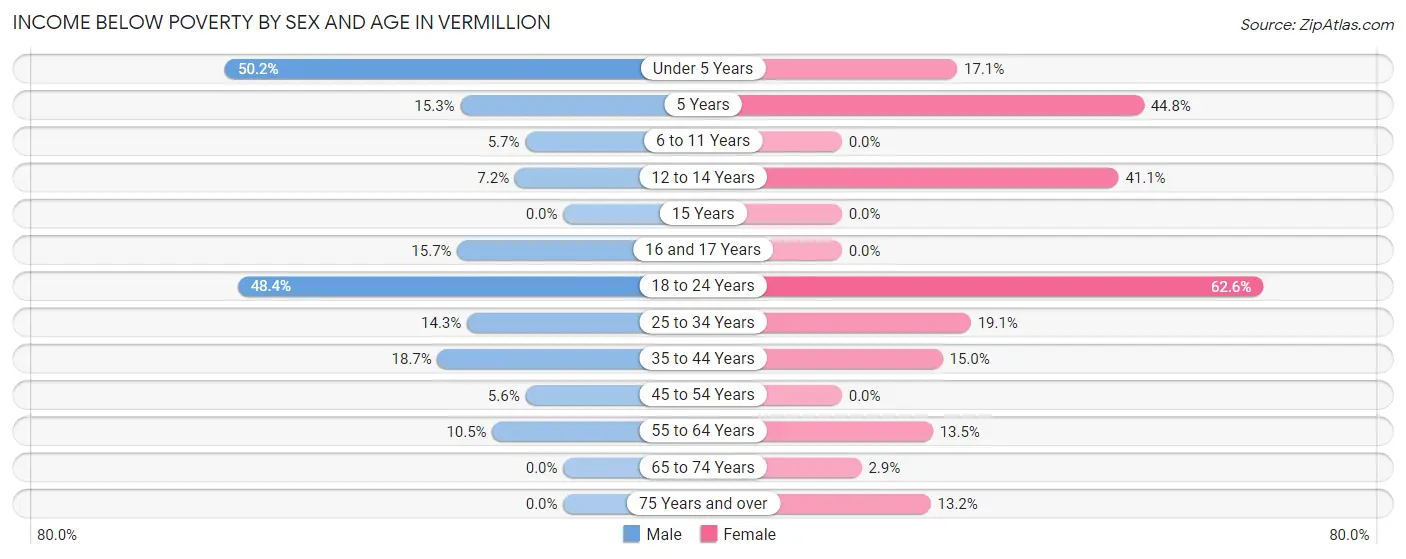
| Age Bracket | Male | Female |
| Under 5 Years | 114 (50.2%) | 51 (17.1%) |
| 5 Years | 13 (15.3%) | 13 (44.8%) |
| 6 to 11 Years | 13 (5.7%) | 0 (0.0%) |
| 12 to 14 Years | 15 (7.2%) | 76 (41.1%) |
| 15 Years | 0 (0.0%) | 0 (0.0%) |
| 16 and 17 Years | 14 (15.7%) | 0 (0.0%) |
| 18 to 24 Years | 644 (48.3%) | 969 (62.6%) |
| 25 to 34 Years | 123 (14.3%) | 120 (19.1%) |
| 35 to 44 Years | 104 (18.7%) | 63 (15.0%) |
| 45 to 54 Years | 18 (5.6%) | 0 (0.0%) |
| 55 to 64 Years | 36 (10.5%) | 66 (13.5%) |
| 65 to 74 Years | 0 (0.0%) | 9 (2.9%) |
| 75 Years and over | 0 (0.0%) | 24 (13.2%) |
| Total | 1,094 (23.2%) | 1,391 (29.2%) |
Income Above Poverty by Sex and Age in Vermillion
According to the poverty statistics in Vermillion, males aged 15 years and females aged 6 to 11 years are the age groups that are most secure financially, with 100.0% of males and 100.0% of females in these age groups living above the poverty line.
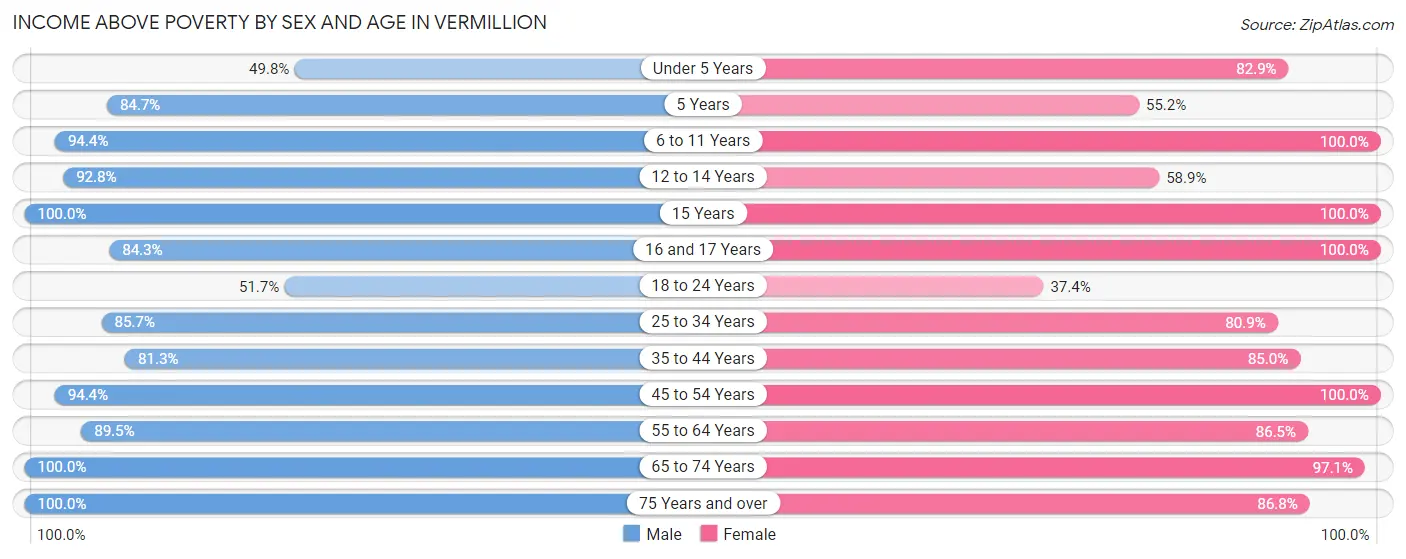
| Age Bracket | Male | Female |
| Under 5 Years | 113 (49.8%) | 247 (82.9%) |
| 5 Years | 72 (84.7%) | 16 (55.2%) |
| 6 to 11 Years | 217 (94.4%) | 377 (100.0%) |
| 12 to 14 Years | 194 (92.8%) | 109 (58.9%) |
| 15 Years | 32 (100.0%) | 9 (100.0%) |
| 16 and 17 Years | 75 (84.3%) | 64 (100.0%) |
| 18 to 24 Years | 688 (51.6%) | 580 (37.4%) |
| 25 to 34 Years | 738 (85.7%) | 507 (80.9%) |
| 35 to 44 Years | 453 (81.3%) | 358 (85.0%) |
| 45 to 54 Years | 302 (94.4%) | 221 (100.0%) |
| 55 to 64 Years | 306 (89.5%) | 423 (86.5%) |
| 65 to 74 Years | 296 (100.0%) | 299 (97.1%) |
| 75 Years and over | 133 (100.0%) | 158 (86.8%) |
| Total | 3,619 (76.8%) | 3,368 (70.8%) |
Income Below Poverty Among Married-Couple Families in Vermillion
The poverty statistics for married-couple families in Vermillion show that 4.7% or 62 of the total 1,320 families live below the poverty line. Families with 5 or more children have the highest poverty rate of 100.0%, comprising of 9 families. On the other hand, families with 3 or 4 children have the lowest poverty rate of 0.0%, which includes 0 families.
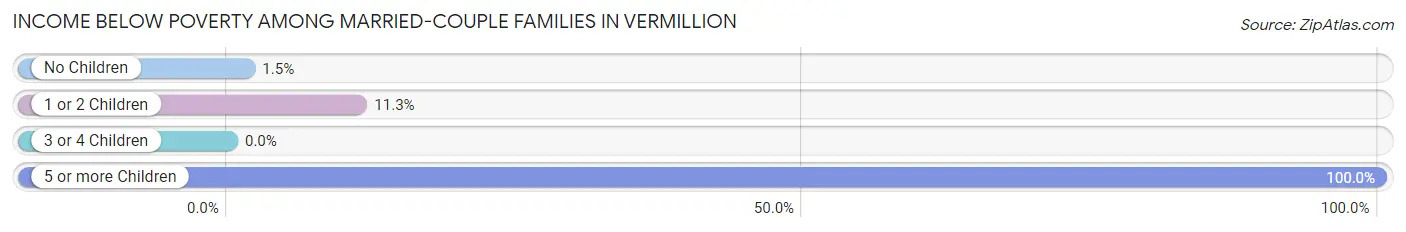
| Children | Above Poverty | Below Poverty |
| No Children | 785 (98.5%) | 12 (1.5%) |
| 1 or 2 Children | 323 (88.7%) | 41 (11.3%) |
| 3 or 4 Children | 150 (100.0%) | 0 (0.0%) |
| 5 or more Children | 0 (0.0%) | 9 (100.0%) |
| Total | 1,258 (95.3%) | 62 (4.7%) |
Income Below Poverty Among Single-Parent Households in Vermillion
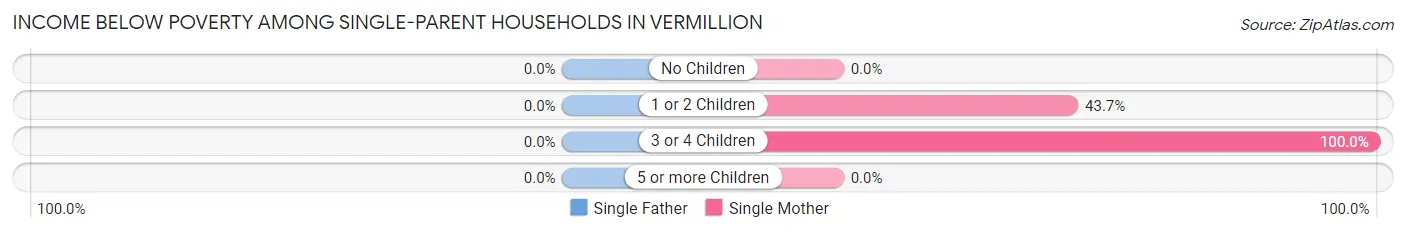
| Children | Single Father | Single Mother |
| No Children | 0 (0.0%) | 0 (0.0%) |
| 1 or 2 Children | 0 (0.0%) | 107 (43.7%) |
| 3 or 4 Children | 0 (0.0%) | 10 (100.0%) |
| 5 or more Children | 0 (0.0%) | 0 (0.0%) |
| Total | 0 (0.0%) | 117 (36.6%) |
Income Below Poverty Among Married-Couple vs Single-Parent Households in Vermillion
The poverty data for Vermillion shows that 62 of the married-couple family households (4.7%) and 117 of the single-parent households (23.6%) are living below the poverty level. Within the married-couple family households, those with 5 or more children have the highest poverty rate, with 9 households (100.0%) falling below the poverty line. Among the single-parent households, those with 1 or 2 children have the highest poverty rate, with 107 household (36.3%) living below poverty.
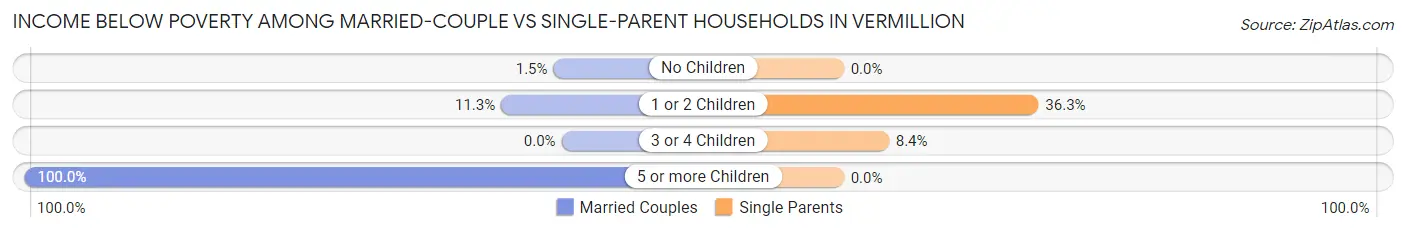
| Children | Married-Couple Families | Single-Parent Households |
| No Children | 12 (1.5%) | 0 (0.0%) |
| 1 or 2 Children | 41 (11.3%) | 107 (36.3%) |
| 3 or 4 Children | 0 (0.0%) | 10 (8.4%) |
| 5 or more Children | 9 (100.0%) | 0 (0.0%) |
| Total | 62 (4.7%) | 117 (23.6%) |
Race in Vermillion
The most populous races in Vermillion are White / Caucasian (9,842 | 84.4%), Native / Alaskan (486 | 4.2%), and Asian (445 | 3.8%).
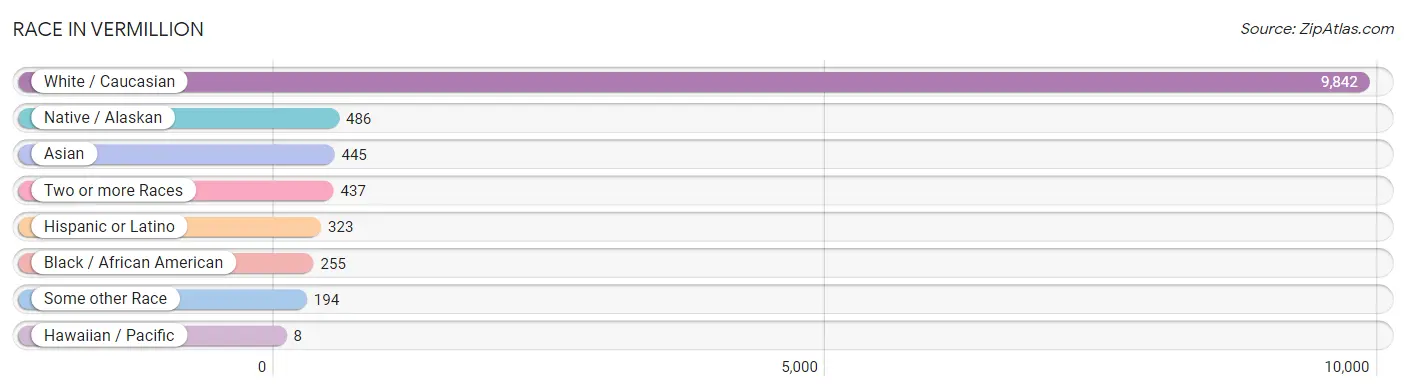
| Race | # Population | % Population |
| Asian | 445 | 3.8% |
| Black / African American | 255 | 2.2% |
| Hawaiian / Pacific | 8 | 0.1% |
| Hispanic or Latino | 323 | 2.8% |
| Native / Alaskan | 486 | 4.2% |
| White / Caucasian | 9,842 | 84.4% |
| Two or more Races | 437 | 3.7% |
| Some other Race | 194 | 1.7% |
| Total | 11,667 | 100.0% |
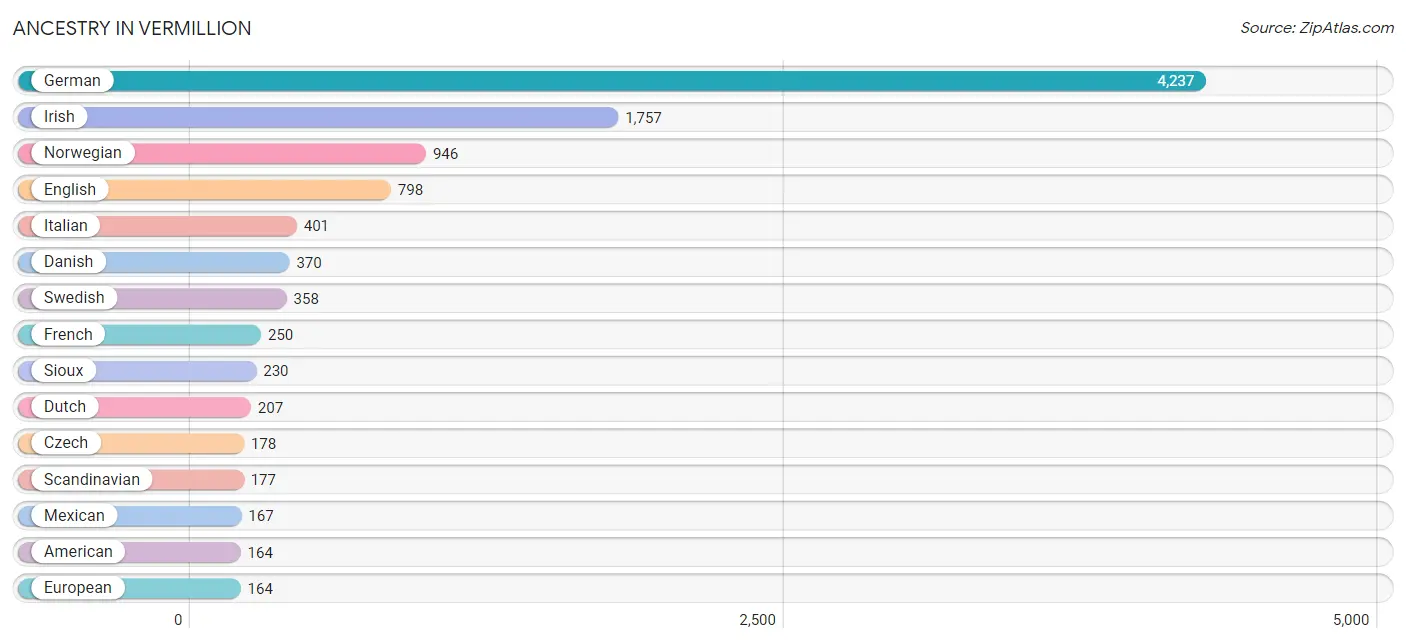
Ancestry in Vermillion
The most populous ancestries reported in Vermillion are German (4,237 | 36.3%), Irish (1,757 | 15.1%), Norwegian (946 | 8.1%), English (798 | 6.8%), and Italian (401 | 3.4%), together accounting for 69.8% of all Vermillion residents.
| Ancestry | # Population | % Population |
| African | 15 | 0.1% |
| American | 164 | 1.4% |
| Arab | 83 | 0.7% |
| Austrian | 4 | 0.0% |
| Belgian | 24 | 0.2% |
| Belizean | 3 | 0.0% |
| Brazilian | 2 | 0.0% |
| British | 35 | 0.3% |
| Burmese | 6 | 0.1% |
| Central American | 120 | 1.0% |
| Central American Indian | 19 | 0.2% |
| Cherokee | 75 | 0.6% |
| Chippewa | 17 | 0.2% |
| Cuban | 4 | 0.0% |
| Czech | 178 | 1.5% |
| Danish | 370 | 3.2% |
| Dutch | 207 | 1.8% |
| English | 798 | 6.8% |
| Ethiopian | 10 | 0.1% |
| European | 164 | 1.4% |
| Finnish | 42 | 0.4% |
| French | 250 | 2.1% |
| French Canadian | 40 | 0.3% |
| German | 4,237 | 36.3% |
| Greek | 60 | 0.5% |
| Guatemalan | 3 | 0.0% |
| Haitian | 37 | 0.3% |
| Indian (Asian) | 146 | 1.3% |
| Irish | 1,757 | 15.1% |
| Iroquois | 27 | 0.2% |
| Israeli | 12 | 0.1% |
| Italian | 401 | 3.4% |
| Korean | 16 | 0.1% |
| Lebanese | 12 | 0.1% |
| Luxembourger | 9 | 0.1% |
| Malaysian | 5 | 0.0% |
| Mexican | 167 | 1.4% |
| Native Hawaiian | 3 | 0.0% |
| Nicaraguan | 117 | 1.0% |
| Nigerian | 21 | 0.2% |
| Northern European | 20 | 0.2% |
| Norwegian | 946 | 8.1% |
| Peruvian | 23 | 0.2% |
| Polish | 73 | 0.6% |
| Portuguese | 34 | 0.3% |
| Puerto Rican | 4 | 0.0% |
| Romanian | 8 | 0.1% |
| Russian | 65 | 0.6% |
| Samoan | 4 | 0.0% |
| Scandinavian | 177 | 1.5% |
| Scotch-Irish | 108 | 0.9% |
| Scottish | 146 | 1.3% |
| Sioux | 230 | 2.0% |
| Slovak | 22 | 0.2% |
| South African | 23 | 0.2% |
| South American | 23 | 0.2% |
| Sri Lankan | 72 | 0.6% |
| Subsaharan African | 80 | 0.7% |
| Sudanese | 11 | 0.1% |
| Swedish | 358 | 3.1% |
| Swiss | 28 | 0.2% |
| Thai | 120 | 1.0% |
| Tongan | 8 | 0.1% |
| Ukrainian | 38 | 0.3% |
| Welsh | 89 | 0.8% |
| Yugoslavian | 149 | 1.3% | View All 66 Rows |
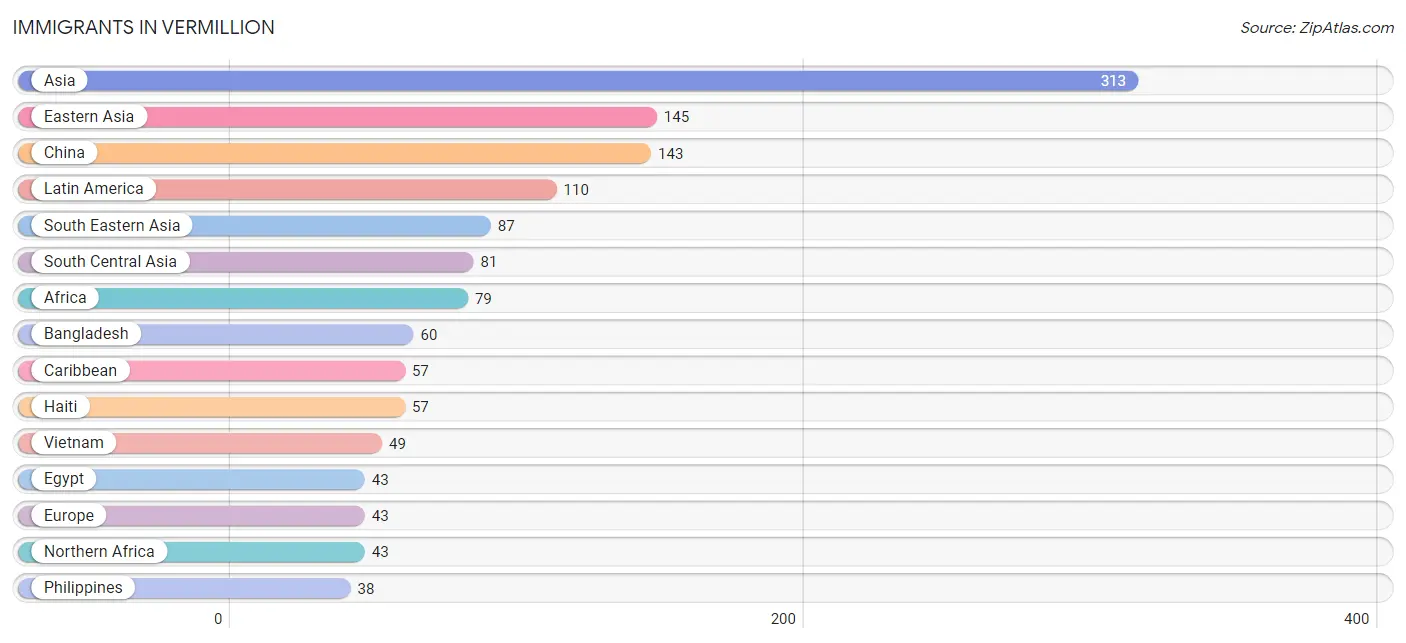
Immigrants in Vermillion
The most numerous immigrant groups reported in Vermillion came from Asia (313 | 2.7%), Eastern Asia (145 | 1.2%), China (143 | 1.2%), Latin America (110 | 0.9%), and South Eastern Asia (87 | 0.7%), together accounting for 6.8% of all Vermillion residents.
| Immigration Origin | # Population | % Population |
| Africa | 79 | 0.7% |
| Asia | 313 | 2.7% |
| Bangladesh | 60 | 0.5% |
| Belize | 22 | 0.2% |
| Canada | 23 | 0.2% |
| Caribbean | 57 | 0.5% |
| Central America | 30 | 0.3% |
| China | 143 | 1.2% |
| Eastern Africa | 4 | 0.0% |
| Eastern Asia | 145 | 1.2% |
| Eastern Europe | 24 | 0.2% |
| Egypt | 43 | 0.4% |
| England | 3 | 0.0% |
| Ethiopia | 4 | 0.0% |
| Europe | 43 | 0.4% |
| Germany | 12 | 0.1% |
| Haiti | 57 | 0.5% |
| India | 18 | 0.2% |
| Korea | 2 | 0.0% |
| Latin America | 110 | 0.9% |
| Mexico | 8 | 0.1% |
| Nepal | 3 | 0.0% |
| Netherlands | 4 | 0.0% |
| Nigeria | 21 | 0.2% |
| Northern Africa | 43 | 0.4% |
| Northern Europe | 3 | 0.0% |
| Peru | 23 | 0.2% |
| Philippines | 38 | 0.3% |
| South America | 23 | 0.2% |
| South Central Asia | 81 | 0.7% |
| South Eastern Asia | 87 | 0.7% |
| Vietnam | 49 | 0.4% |
| Western Africa | 32 | 0.3% |
| Western Europe | 16 | 0.1% | View All 34 Rows |
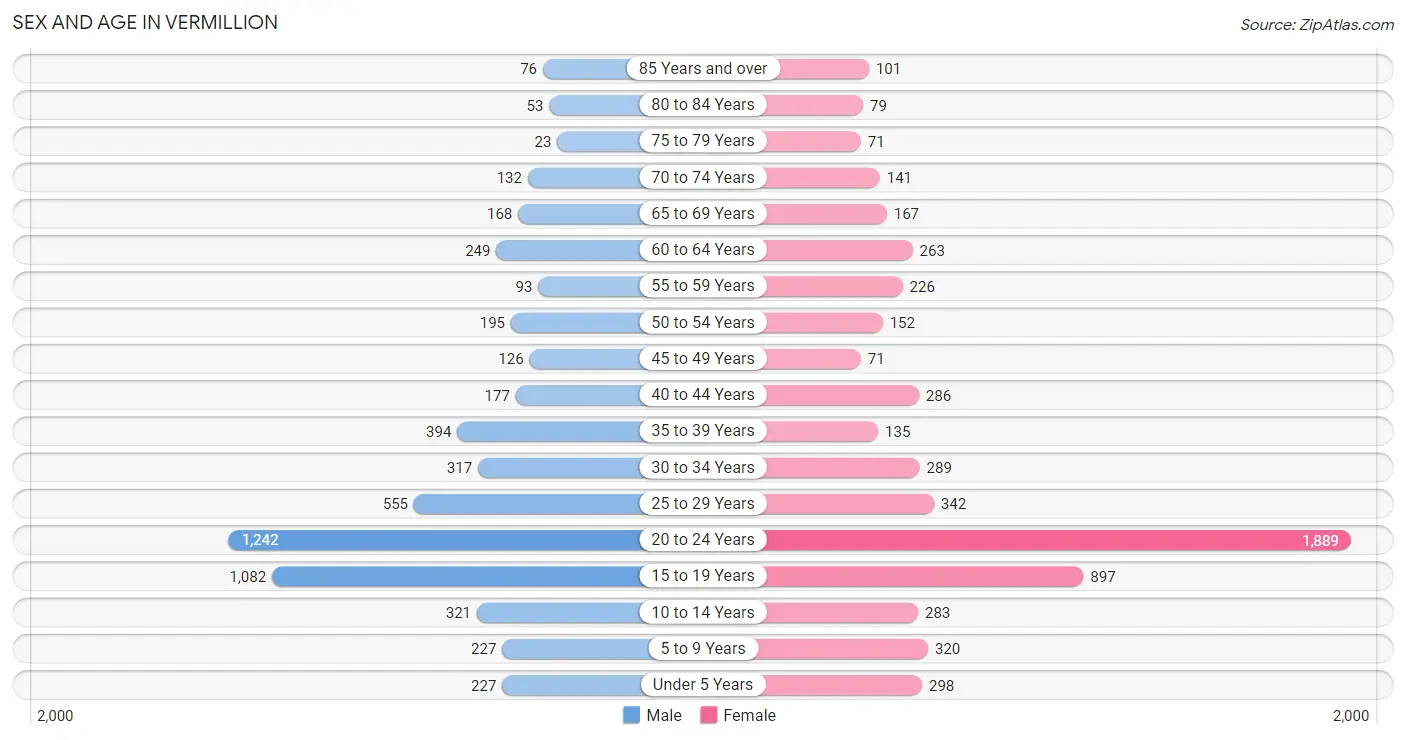
Sex and Age in Vermillion
Sex and Age in Vermillion
The most populous age groups in Vermillion are 20 to 24 Years (1,242 | 22.0%) for men and 20 to 24 Years (1,889 | 31.4%) for women.
| Age Bracket | Male | Female |
| Under 5 Years | 227 (4.0%) | 298 (5.0%) |
| 5 to 9 Years | 227 (4.0%) | 320 (5.3%) |
| 10 to 14 Years | 321 (5.7%) | 283 (4.7%) |
| 15 to 19 Years | 1,082 (19.1%) | 897 (14.9%) |
| 20 to 24 Years | 1,242 (22.0%) | 1,889 (31.4%) |
| 25 to 29 Years | 555 (9.8%) | 342 (5.7%) |
| 30 to 34 Years | 317 (5.6%) | 289 (4.8%) |
| 35 to 39 Years | 394 (7.0%) | 135 (2.2%) |
| 40 to 44 Years | 177 (3.1%) | 286 (4.8%) |
| 45 to 49 Years | 126 (2.2%) | 71 (1.2%) |
| 50 to 54 Years | 195 (3.5%) | 152 (2.5%) |
| 55 to 59 Years | 93 (1.6%) | 226 (3.8%) |
| 60 to 64 Years | 249 (4.4%) | 263 (4.4%) |
| 65 to 69 Years | 168 (3.0%) | 167 (2.8%) |
| 70 to 74 Years | 132 (2.3%) | 141 (2.4%) |
| 75 to 79 Years | 23 (0.4%) | 71 (1.2%) |
| 80 to 84 Years | 53 (0.9%) | 79 (1.3%) |
| 85 Years and over | 76 (1.3%) | 101 (1.7%) |
| Total | 5,657 (100.0%) | 6,010 (100.0%) |
Families and Households in Vermillion
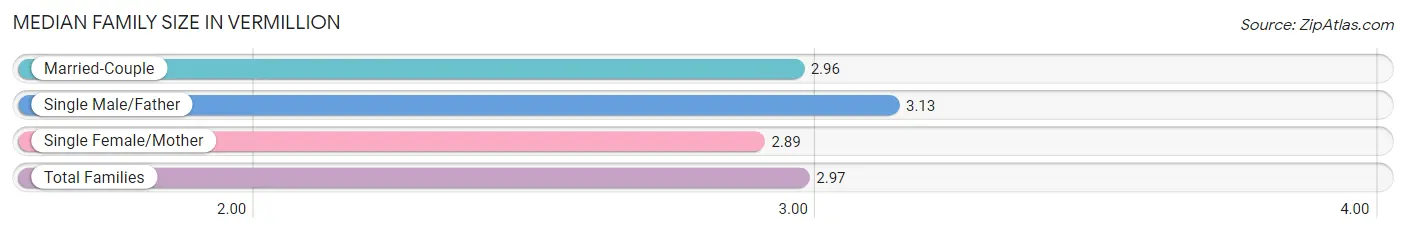
Median Family Size in Vermillion
The median family size in Vermillion is 2.97 persons per family, with single male/father families (176 | 9.7%) accounting for the largest median family size of 3.13 persons per family. On the other hand, single female/mother families (320 | 17.6%) represent the smallest median family size with 2.89 persons per family.
| Family Type | # Families | Family Size |
| Married-Couple | 1,320 (72.7%) | 2.96 |
| Single Male/Father | 176 (9.7%) | 3.13 |
| Single Female/Mother | 320 (17.6%) | 2.89 |
| Total Families | 1,816 (100.0%) | 2.97 |
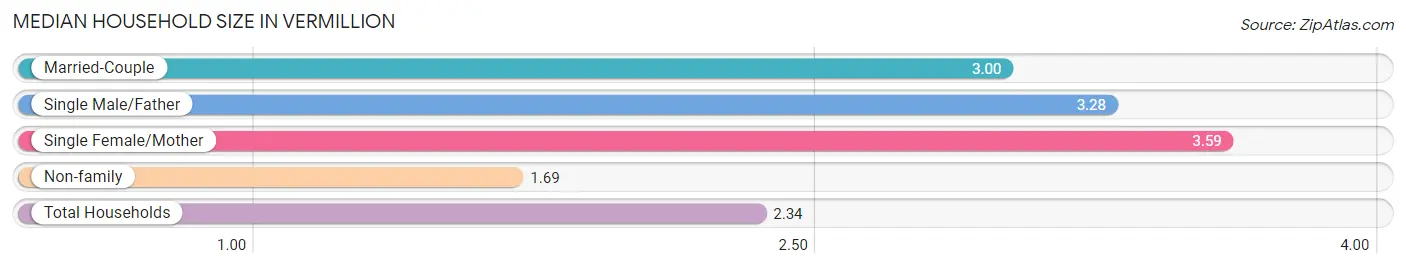
Median Household Size in Vermillion
The median household size in Vermillion is 2.34 persons per household, with single female/mother households (320 | 7.9%) accounting for the largest median household size of 3.59 persons per household. non-family households (2,222 | 55.0%) represent the smallest median household size with 1.69 persons per household.
| Household Type | # Households | Household Size |
| Married-Couple | 1,320 (32.7%) | 3.00 |
| Single Male/Father | 176 (4.4%) | 3.28 |
| Single Female/Mother | 320 (7.9%) | 3.59 |
| Non-family | 2,222 (55.0%) | 1.69 |
| Total Households | 4,038 (100.0%) | 2.34 |
Household Size by Marriage Status in Vermillion
Out of a total of 4,038 households in Vermillion, 1,816 (45.0%) are family households, while 2,222 (55.0%) are nonfamily households. The most numerous type of family households are 2-person households, comprising 733, and the most common type of nonfamily households are 1-person households, comprising 1,437.
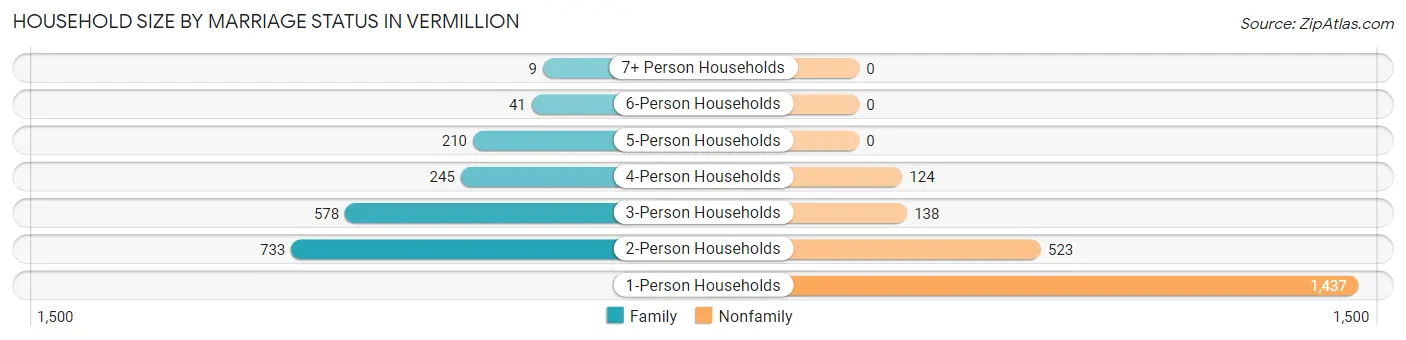
| Household Size | Family Households | Nonfamily Households |
| 1-Person Households | - | 1,437 (35.6%) |
| 2-Person Households | 733 (18.1%) | 523 (13.0%) |
| 3-Person Households | 578 (14.3%) | 138 (3.4%) |
| 4-Person Households | 245 (6.1%) | 124 (3.1%) |
| 5-Person Households | 210 (5.2%) | 0 (0.0%) |
| 6-Person Households | 41 (1.0%) | 0 (0.0%) |
| 7+ Person Households | 9 (0.2%) | 0 (0.0%) |
| Total | 1,816 (45.0%) | 2,222 (55.0%) |
Female Fertility in Vermillion
Fertility by Age in Vermillion
Average fertility rate in Vermillion is 33.0 births per 1,000 women. Women in the age bracket of 35 to 50 years have the highest fertility rate with 74.0 births per 1,000 women. Women in the age bracket of 20 to 34 years acount for 64.1% of all women with births.
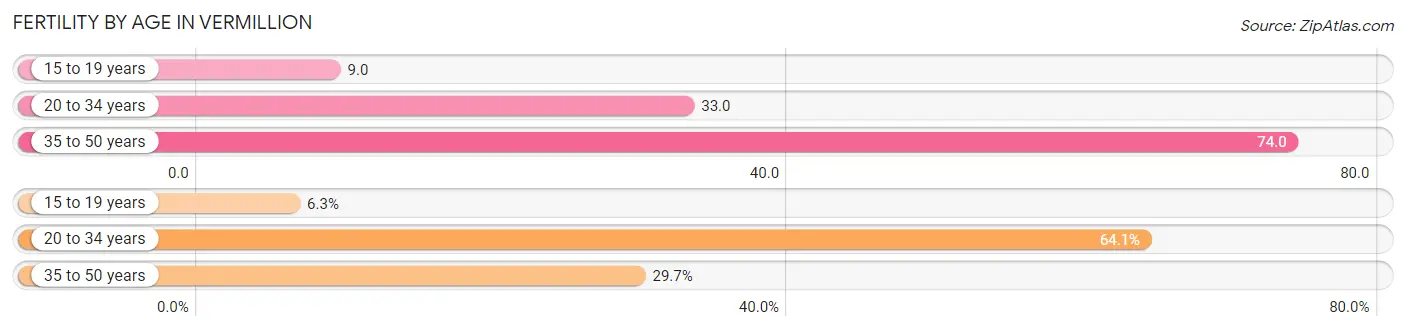
| Age Bracket | Women with Births | Births / 1,000 Women |
| 15 to 19 years | 8 (6.2%) | 9.0 |
| 20 to 34 years | 82 (64.1%) | 33.0 |
| 35 to 50 years | 38 (29.7%) | 74.0 |
| Total | 128 (100.0%) | 33.0 |
Fertility by Age by Marriage Status in Vermillion
51.6% of women with births (128) in Vermillion are married. The highest percentage of unmarried women with births falls into 15 to 19 years age bracket with 100.0% of them unmarried at the time of birth, while the lowest percentage of unmarried women with births belong to 20 to 34 years age bracket with 39.0% of them unmarried.
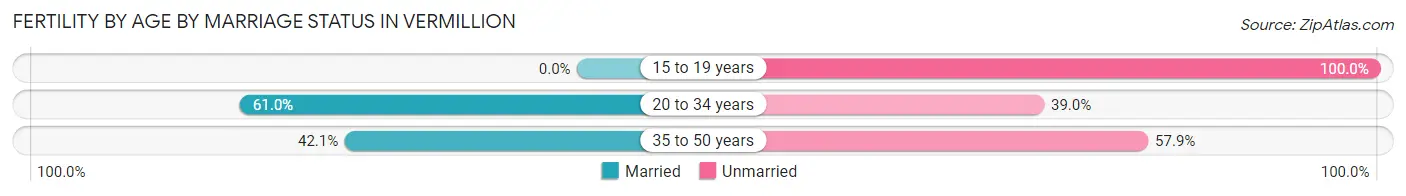
| Age Bracket | Married | Unmarried |
| 15 to 19 years | 0 (0.0%) | 8 (100.0%) |
| 20 to 34 years | 50 (61.0%) | 32 (39.0%) |
| 35 to 50 years | 16 (42.1%) | 22 (57.9%) |
| Total | 66 (51.6%) | 62 (48.4%) |
Fertility by Education in Vermillion
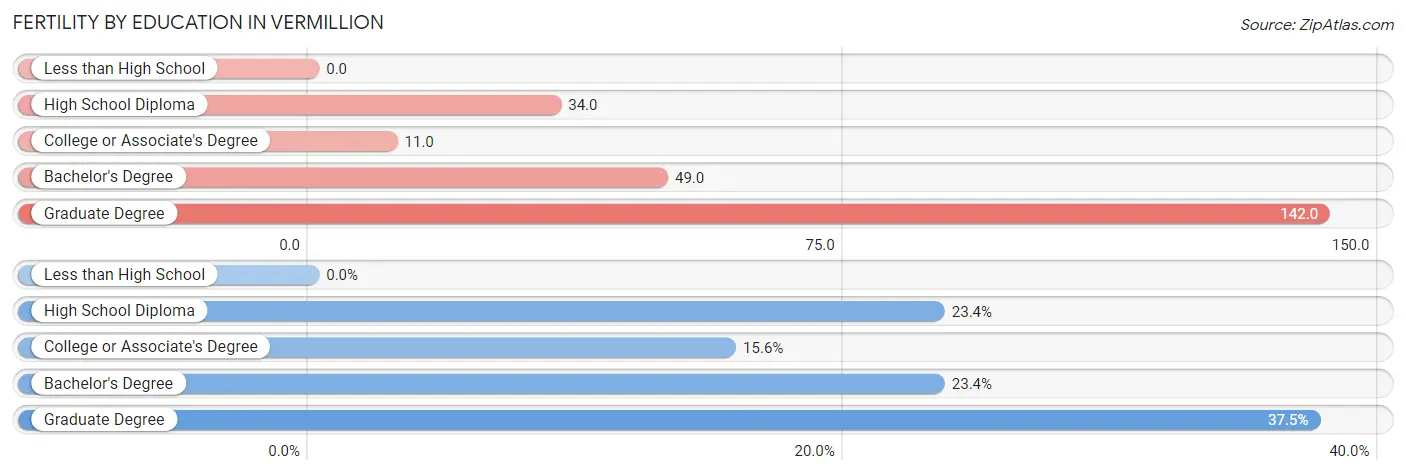
| Educational Attainment | Women with Births | Births / 1,000 Women |
| Less than High School | 0 (0.0%) | 0.0 |
| High School Diploma | 30 (23.4%) | 34.0 |
| College or Associate's Degree | 20 (15.6%) | 11.0 |
| Bachelor's Degree | 30 (23.4%) | 49.0 |
| Graduate Degree | 48 (37.5%) | 142.0 |
| Total | 128 (100.0%) | 33.0 |
Fertility by Education by Marriage Status in Vermillion
48.4% of women with births in Vermillion are unmarried. Women with the educational attainment of graduate degree are most likely to be married with 100.0% of them married at childbirth, while women with the educational attainment of high school diploma are least likely to be married with 100.0% of them unmarried at childbirth.
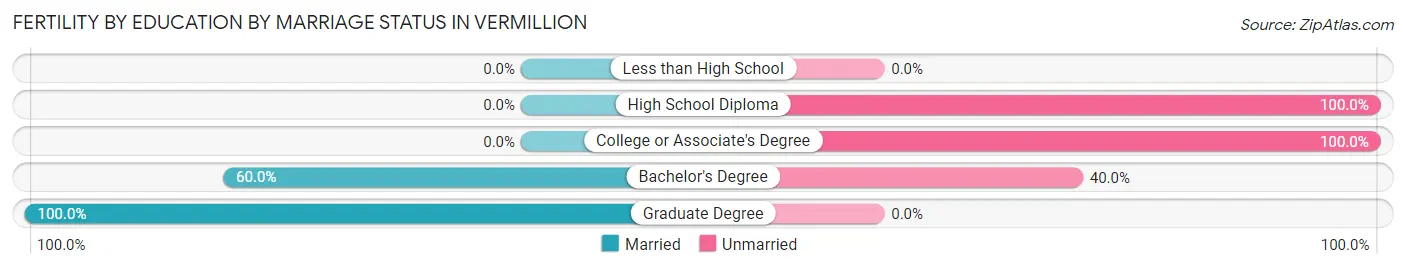
| Educational Attainment | Married | Unmarried |
| Less than High School | 0 (0.0%) | 0 (0.0%) |
| High School Diploma | 0 (0.0%) | 30 (100.0%) |
| College or Associate's Degree | 0 (0.0%) | 20 (100.0%) |
| Bachelor's Degree | 18 (60.0%) | 12 (40.0%) |
| Graduate Degree | 48 (100.0%) | 0 (0.0%) |
| Total | 66 (51.6%) | 62 (48.4%) |
Employment Characteristics in Vermillion
Employment by Class of Employer in Vermillion
Among the 5,661 employed individuals in Vermillion, private company employees (2,899 | 51.2%), state government employees (1,271 | 22.5%), and not-for-profit organizations (769 | 13.6%) make up the most common classes of employment.
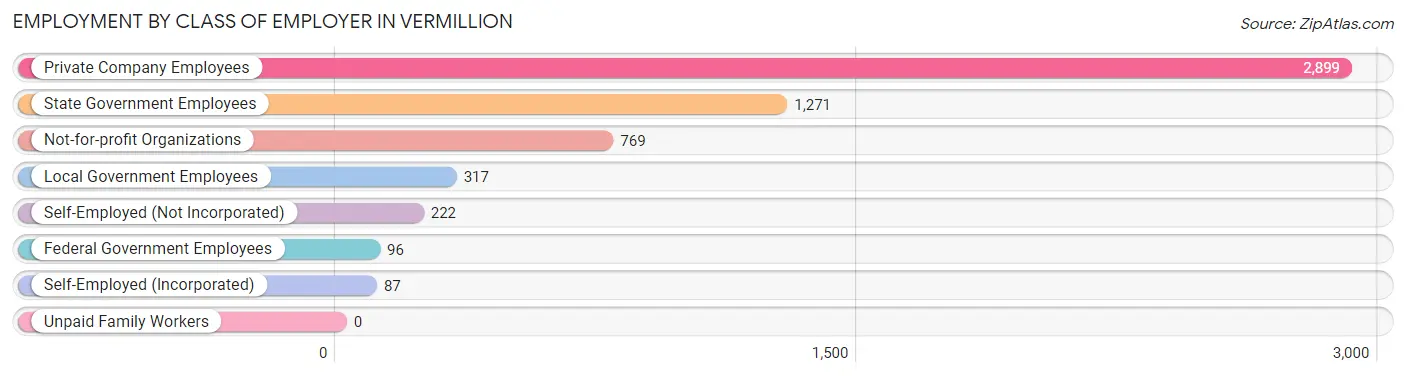
| Employer Class | # Employees | % Employees |
| Private Company Employees | 2,899 | 51.2% |
| Self-Employed (Incorporated) | 87 | 1.5% |
| Self-Employed (Not Incorporated) | 222 | 3.9% |
| Not-for-profit Organizations | 769 | 13.6% |
| Local Government Employees | 317 | 5.6% |
| State Government Employees | 1,271 | 22.5% |
| Federal Government Employees | 96 | 1.7% |
| Unpaid Family Workers | 0 | 0.0% |
| Total | 5,661 | 100.0% |
Employment Status by Age in Vermillion
According to the labor force statistics for Vermillion, out of the total population over 16 years of age (9,950), 68.9% or 6,856 individuals are in the labor force, with 10.0% or 686 of them unemployed. The age group with the highest labor force participation rate is 45 to 54 years, with 96.1% or 523 individuals in the labor force. Within the labor force, the 16 to 19 years age range has the highest percentage of unemployed individuals, with 32.4% or 452 of them being unemployed.
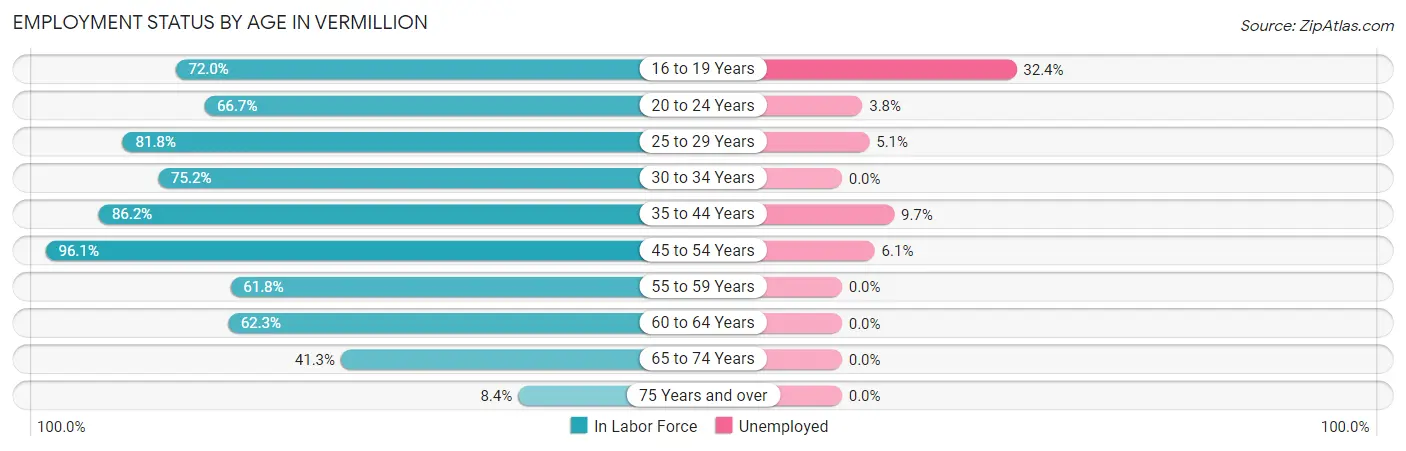
| Age Bracket | In Labor Force | Unemployed |
| 16 to 19 Years | 1,395 (72.0%) | 452 (32.4%) |
| 20 to 24 Years | 2,088 (66.7%) | 79 (3.8%) |
| 25 to 29 Years | 734 (81.8%) | 37 (5.1%) |
| 30 to 34 Years | 456 (75.2%) | 0 (0.0%) |
| 35 to 44 Years | 855 (86.2%) | 83 (9.7%) |
| 45 to 54 Years | 523 (96.1%) | 32 (6.1%) |
| 55 to 59 Years | 197 (61.8%) | 0 (0.0%) |
| 60 to 64 Years | 319 (62.3%) | 0 (0.0%) |
| 65 to 74 Years | 251 (41.3%) | 0 (0.0%) |
| 75 Years and over | 34 (8.4%) | 0 (0.0%) |
| Total | 6,856 (68.9%) | 686 (10.0%) |
Employment Status by Educational Attainment in Vermillion
According to labor force statistics for Vermillion, 79.7% of individuals (3,084) out of the total population between 25 and 64 years of age (3,870) are in the labor force, with 5.0% or 154 of them being unemployed. The group with the highest labor force participation rate are those with the educational attainment of bachelor's degree or higher, with 89.7% or 1,641 individuals in the labor force. Within the labor force, individuals with high school diploma education have the highest percentage of unemployment, with 13.3% or 90 of them being unemployed.
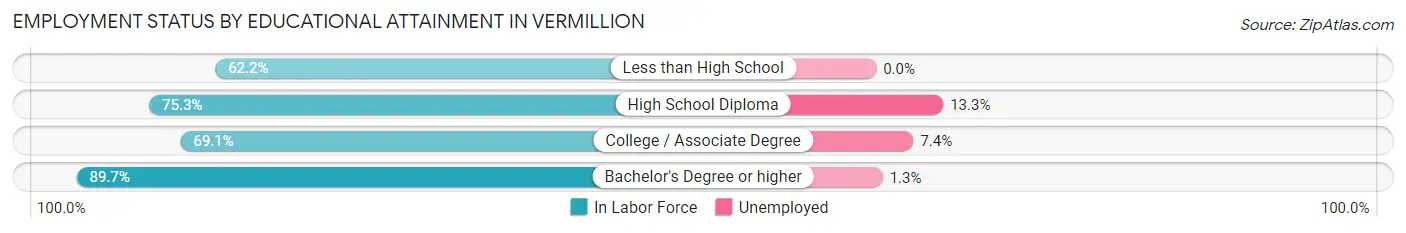
| Educational Attainment | In Labor Force | Unemployed |
| Less than High School | 201 (62.2%) | 0 (0.0%) |
| High School Diploma | 679 (75.3%) | 120 (13.3%) |
| College / Associate Degree | 564 (69.1%) | 60 (7.4%) |
| Bachelor's Degree or higher | 1,641 (89.7%) | 24 (1.3%) |
| Total | 3,084 (79.7%) | 194 (5.0%) |
Employment Occupations by Sex in Vermillion
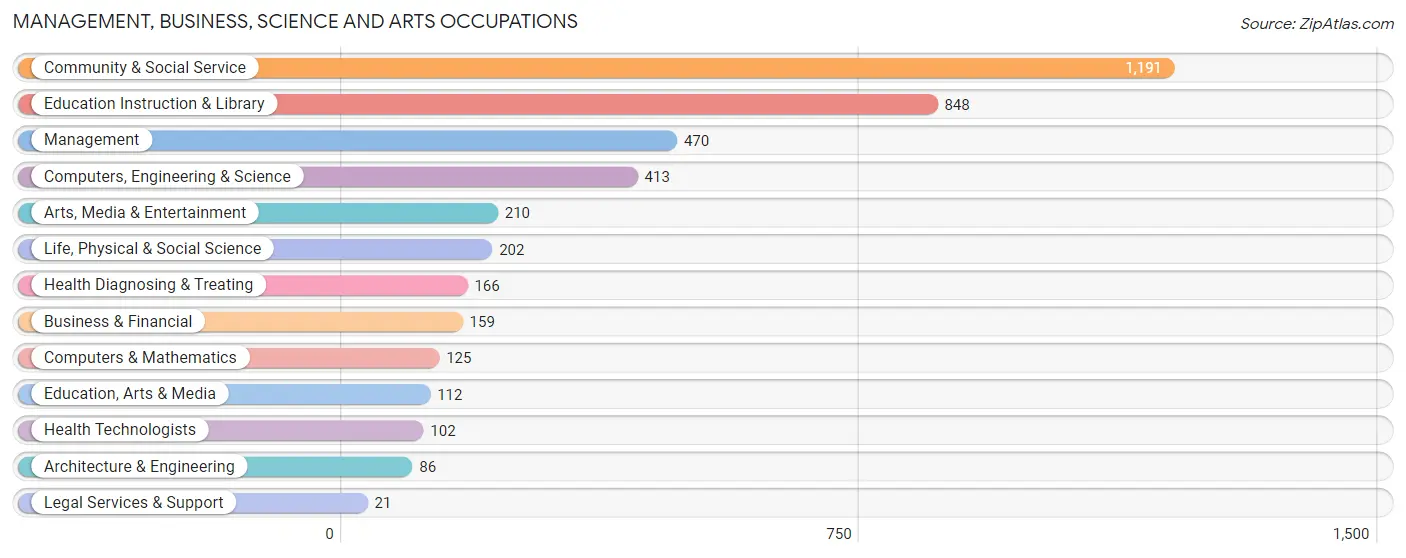
Management, Business, Science and Arts Occupations
The most common Management, Business, Science and Arts occupations in Vermillion are Community & Social Service (1,191 | 19.4%), Education Instruction & Library (848 | 13.8%), Management (470 | 7.7%), Computers, Engineering & Science (413 | 6.7%), and Arts, Media & Entertainment (210 | 3.4%).
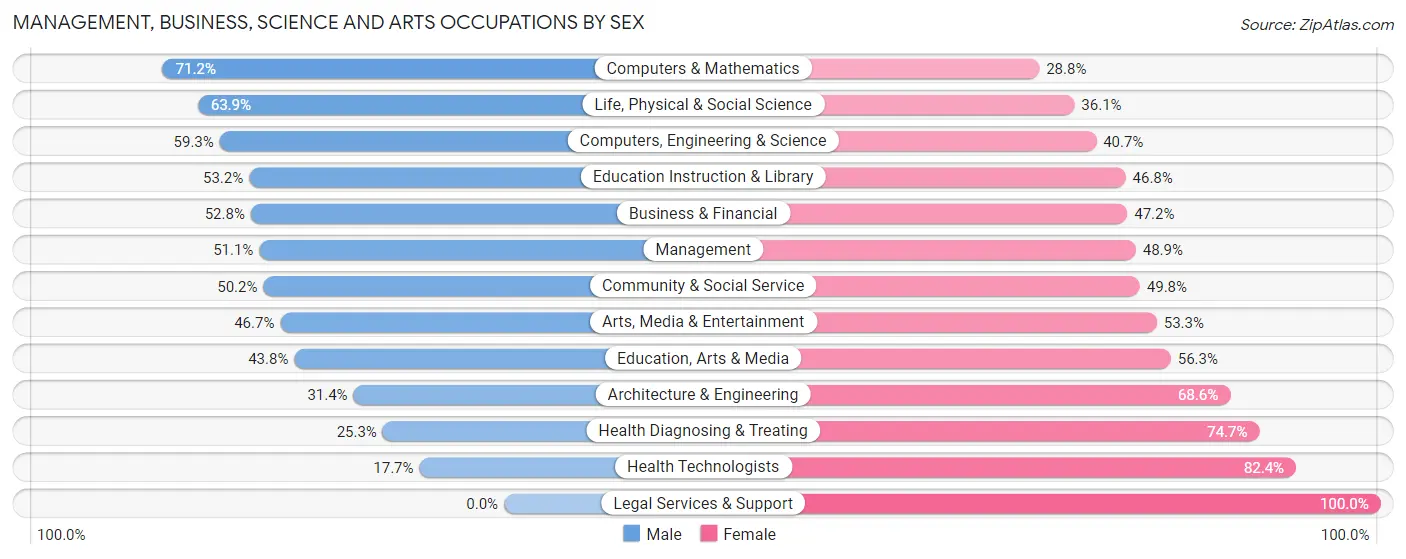
Management, Business, Science and Arts Occupations by Sex
Within the Management, Business, Science and Arts occupations in Vermillion, the most male-oriented occupations are Computers & Mathematics (71.2%), Life, Physical & Social Science (63.9%), and Computers, Engineering & Science (59.3%), while the most female-oriented occupations are Legal Services & Support (100.0%), Health Technologists (82.4%), and Health Diagnosing & Treating (74.7%).
| Occupation | Male | Female |
| Management | 240 (51.1%) | 230 (48.9%) |
| Business & Financial | 84 (52.8%) | 75 (47.2%) |
| Computers, Engineering & Science | 245 (59.3%) | 168 (40.7%) |
| Computers & Mathematics | 89 (71.2%) | 36 (28.8%) |
| Architecture & Engineering | 27 (31.4%) | 59 (68.6%) |
| Life, Physical & Social Science | 129 (63.9%) | 73 (36.1%) |
| Community & Social Service | 598 (50.2%) | 593 (49.8%) |
| Education, Arts & Media | 49 (43.8%) | 63 (56.2%) |
| Legal Services & Support | 0 (0.0%) | 21 (100.0%) |
| Education Instruction & Library | 451 (53.2%) | 397 (46.8%) |
| Arts, Media & Entertainment | 98 (46.7%) | 112 (53.3%) |
| Health Diagnosing & Treating | 42 (25.3%) | 124 (74.7%) |
| Health Technologists | 18 (17.6%) | 84 (82.4%) |
| Total (Category) | 1,209 (50.4%) | 1,190 (49.6%) |
| Total (Overall) | 2,975 (48.5%) | 3,164 (51.5%) |
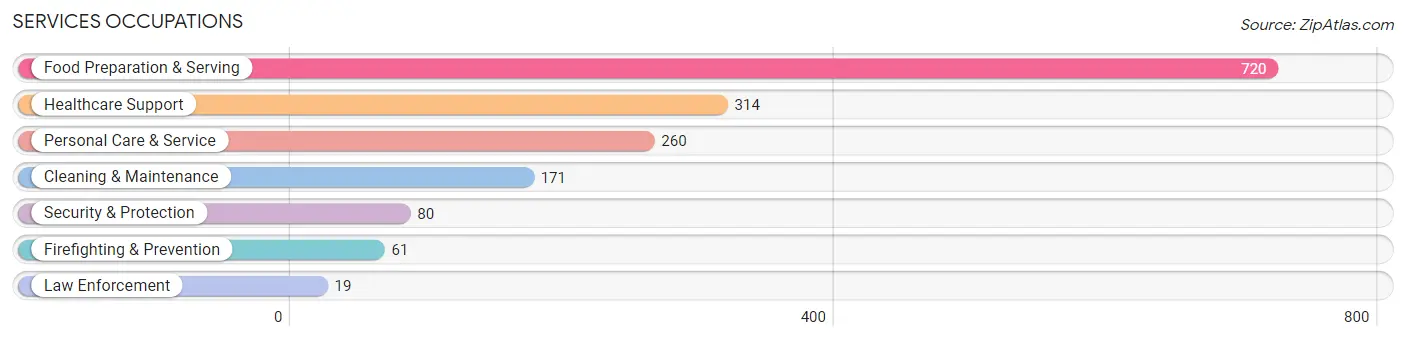
Services Occupations
The most common Services occupations in Vermillion are Food Preparation & Serving (720 | 11.7%), Healthcare Support (314 | 5.1%), Personal Care & Service (260 | 4.2%), Cleaning & Maintenance (171 | 2.8%), and Security & Protection (80 | 1.3%).
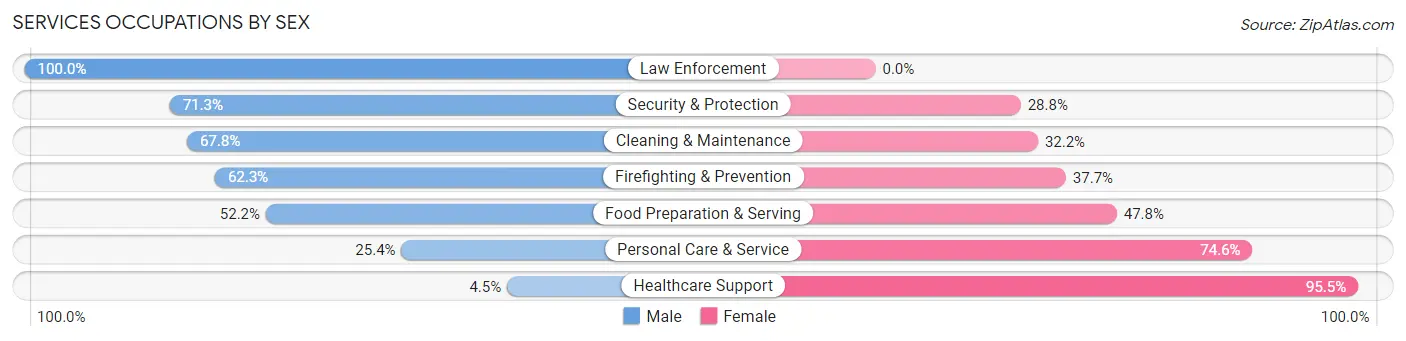
Services Occupations by Sex
Within the Services occupations in Vermillion, the most male-oriented occupations are Law Enforcement (100.0%), Security & Protection (71.3%), and Cleaning & Maintenance (67.8%), while the most female-oriented occupations are Healthcare Support (95.5%), Personal Care & Service (74.6%), and Food Preparation & Serving (47.8%).
| Occupation | Male | Female |
| Healthcare Support | 14 (4.5%) | 300 (95.5%) |
| Security & Protection | 57 (71.3%) | 23 (28.7%) |
| Firefighting & Prevention | 38 (62.3%) | 23 (37.7%) |
| Law Enforcement | 19 (100.0%) | 0 (0.0%) |
| Food Preparation & Serving | 376 (52.2%) | 344 (47.8%) |
| Cleaning & Maintenance | 116 (67.8%) | 55 (32.2%) |
| Personal Care & Service | 66 (25.4%) | 194 (74.6%) |
| Total (Category) | 629 (40.7%) | 916 (59.3%) |
| Total (Overall) | 2,975 (48.5%) | 3,164 (51.5%) |
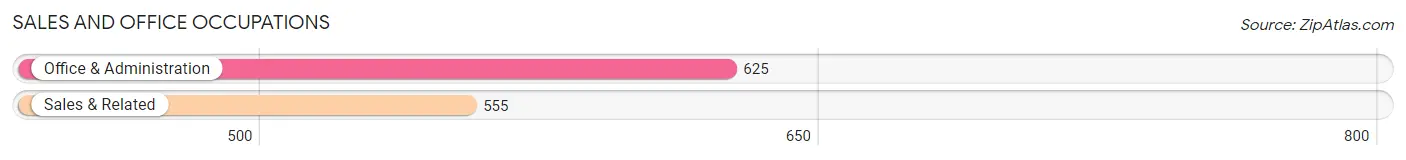
Sales and Office Occupations
The most common Sales and Office occupations in Vermillion are Office & Administration (625 | 10.2%), and Sales & Related (555 | 9.0%).
Sales and Office Occupations by Sex
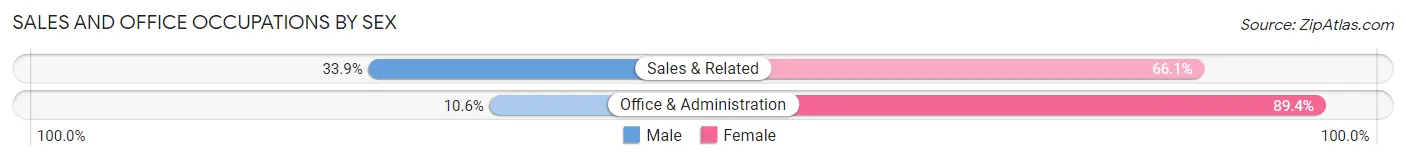
| Occupation | Male | Female |
| Sales & Related | 188 (33.9%) | 367 (66.1%) |
| Office & Administration | 66 (10.6%) | 559 (89.4%) |
| Total (Category) | 254 (21.5%) | 926 (78.5%) |
| Total (Overall) | 2,975 (48.5%) | 3,164 (51.5%) |
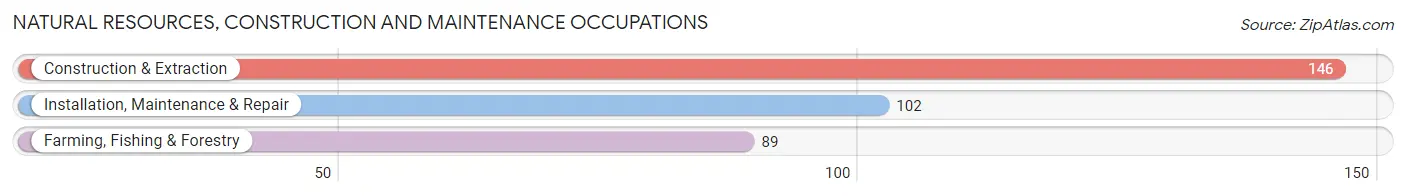
Natural Resources, Construction and Maintenance Occupations
The most common Natural Resources, Construction and Maintenance occupations in Vermillion are Construction & Extraction (146 | 2.4%), Installation, Maintenance & Repair (102 | 1.7%), and Farming, Fishing & Forestry (89 | 1.5%).
Natural Resources, Construction and Maintenance Occupations by Sex
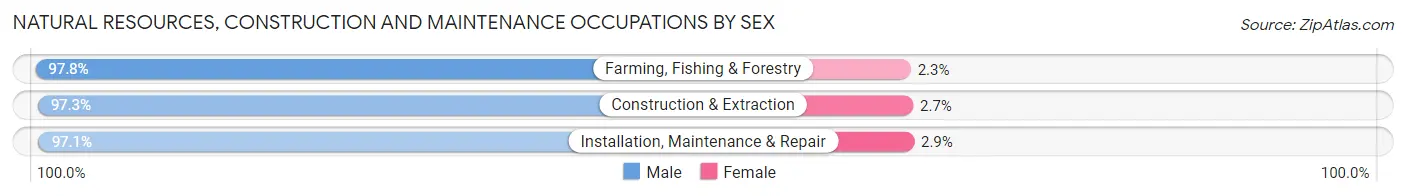
| Occupation | Male | Female |
| Farming, Fishing & Forestry | 87 (97.8%) | 2 (2.2%) |
| Construction & Extraction | 142 (97.3%) | 4 (2.7%) |
| Installation, Maintenance & Repair | 99 (97.1%) | 3 (2.9%) |
| Total (Category) | 328 (97.3%) | 9 (2.7%) |
| Total (Overall) | 2,975 (48.5%) | 3,164 (51.5%) |
Production, Transportation and Moving Occupations
The most common Production, Transportation and Moving occupations in Vermillion are Material Moving (321 | 5.2%), Production (224 | 3.6%), and Transportation (133 | 2.2%).
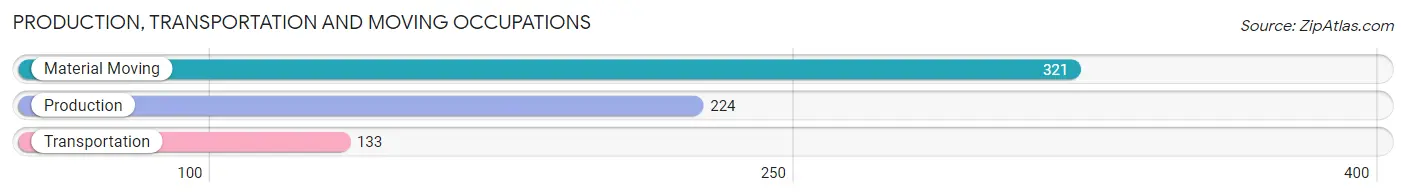
Production, Transportation and Moving Occupations by Sex
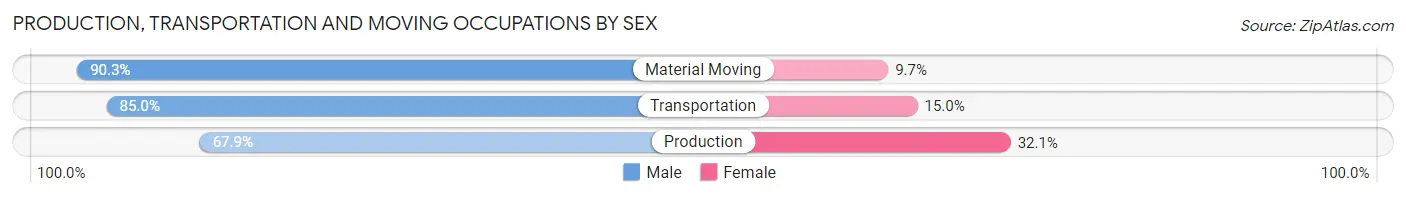
| Occupation | Male | Female |
| Production | 152 (67.9%) | 72 (32.1%) |
| Transportation | 113 (85.0%) | 20 (15.0%) |
| Material Moving | 290 (90.3%) | 31 (9.7%) |
| Total (Category) | 555 (81.9%) | 123 (18.1%) |
| Total (Overall) | 2,975 (48.5%) | 3,164 (51.5%) |
Employment Industries by Sex in Vermillion
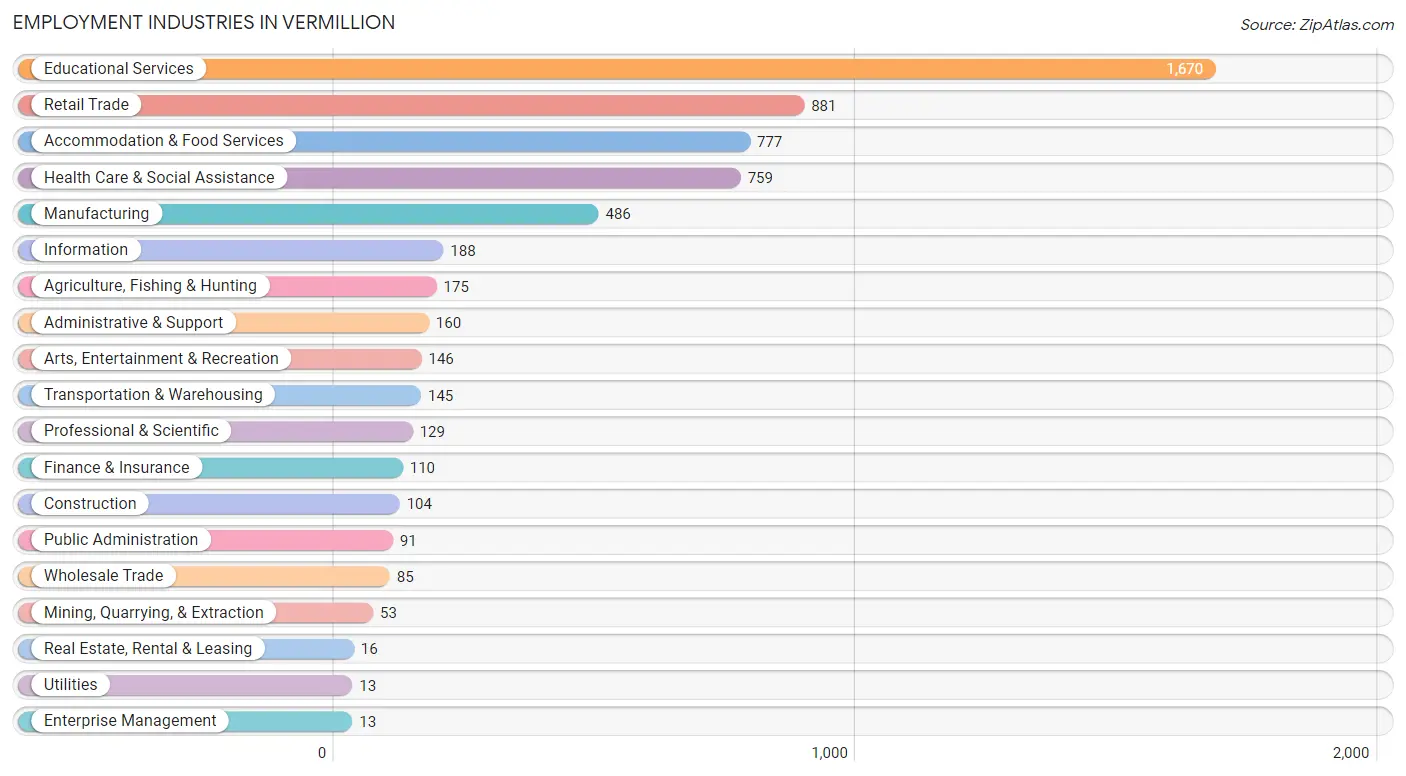
Employment Industries in Vermillion
The major employment industries in Vermillion include Educational Services (1,670 | 27.2%), Retail Trade (881 | 14.3%), Accommodation & Food Services (777 | 12.7%), Health Care & Social Assistance (759 | 12.4%), and Manufacturing (486 | 7.9%).
Employment Industries by Sex in Vermillion
The Vermillion industries that see more men than women are Construction (100.0%), Utilities (100.0%), and Enterprise Management (100.0%), whereas the industries that tend to have a higher number of women are Real Estate, Rental & Leasing (100.0%), Finance & Insurance (79.1%), and Health Care & Social Assistance (75.5%).
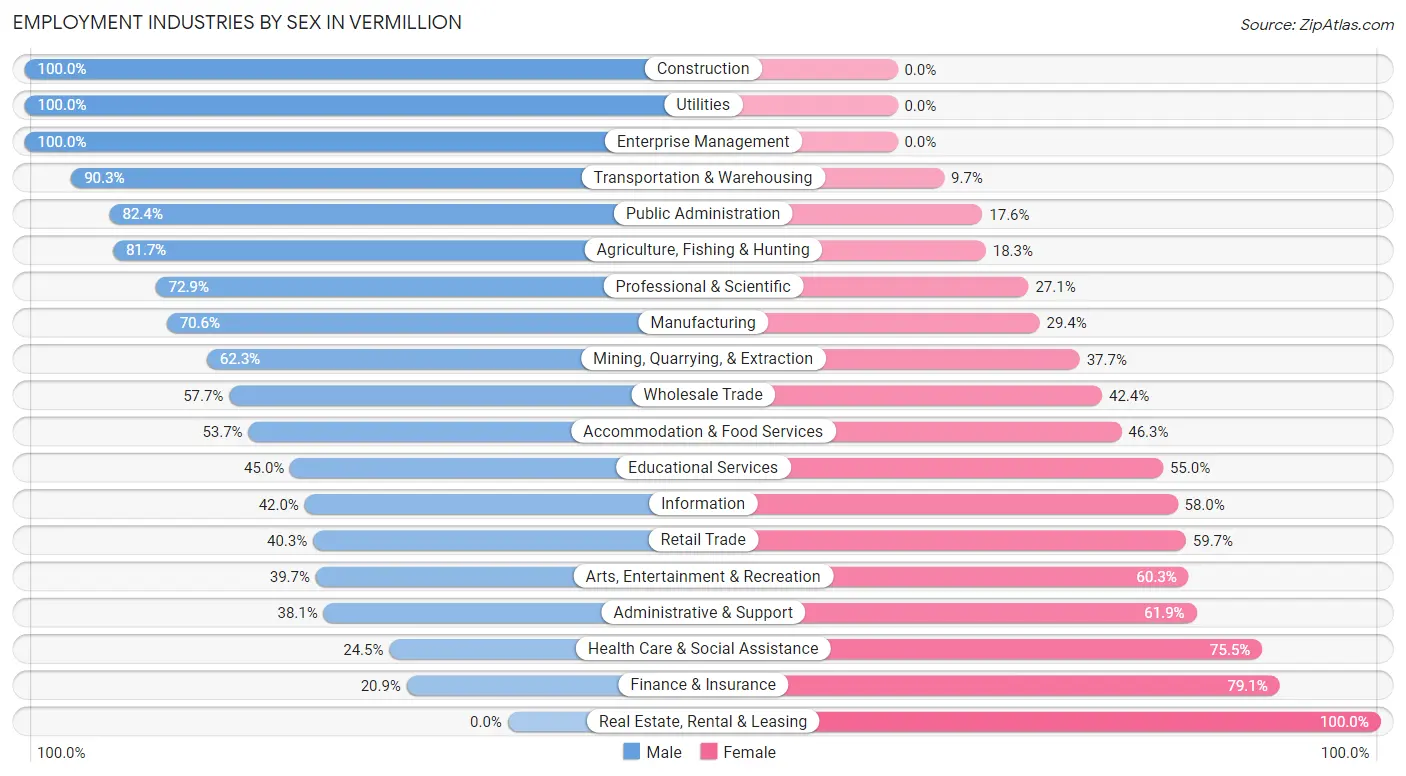
| Industry | Male | Female |
| Agriculture, Fishing & Hunting | 143 (81.7%) | 32 (18.3%) |
| Mining, Quarrying, & Extraction | 33 (62.3%) | 20 (37.7%) |
| Construction | 104 (100.0%) | 0 (0.0%) |
| Manufacturing | 343 (70.6%) | 143 (29.4%) |
| Wholesale Trade | 49 (57.7%) | 36 (42.3%) |
| Retail Trade | 355 (40.3%) | 526 (59.7%) |
| Transportation & Warehousing | 131 (90.3%) | 14 (9.7%) |
| Utilities | 13 (100.0%) | 0 (0.0%) |
| Information | 79 (42.0%) | 109 (58.0%) |
| Finance & Insurance | 23 (20.9%) | 87 (79.1%) |
| Real Estate, Rental & Leasing | 0 (0.0%) | 16 (100.0%) |
| Professional & Scientific | 94 (72.9%) | 35 (27.1%) |
| Enterprise Management | 13 (100.0%) | 0 (0.0%) |
| Administrative & Support | 61 (38.1%) | 99 (61.9%) |
| Educational Services | 752 (45.0%) | 918 (55.0%) |
| Health Care & Social Assistance | 186 (24.5%) | 573 (75.5%) |
| Arts, Entertainment & Recreation | 58 (39.7%) | 88 (60.3%) |
| Accommodation & Food Services | 417 (53.7%) | 360 (46.3%) |
| Public Administration | 75 (82.4%) | 16 (17.6%) |
| Total | 2,975 (48.5%) | 3,164 (51.5%) |
Education in Vermillion
School Enrollment in Vermillion
The most common levels of schooling among the 5,923 students in Vermillion are college / undergraduate (3,732 | 63.0%), graduate / professional (591 | 10.0%), and middle school (529 | 8.9%).
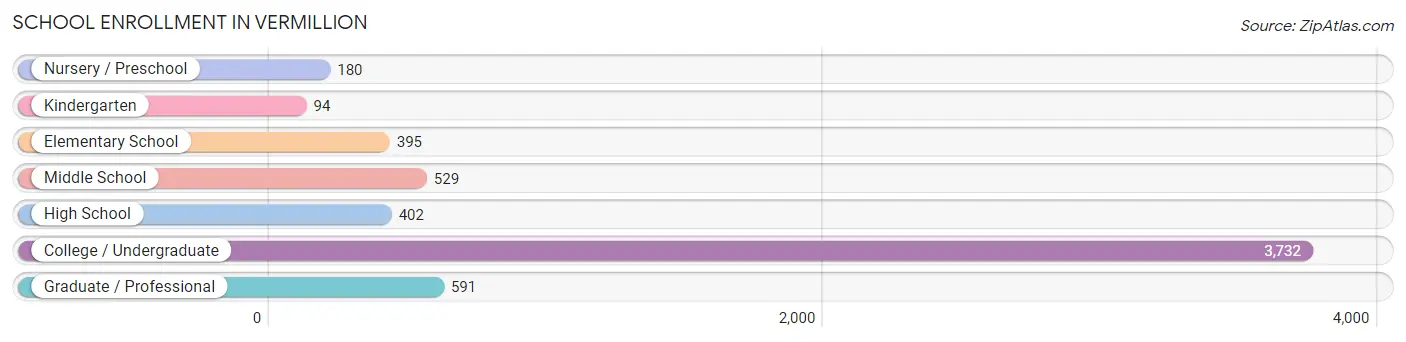
| School Level | # Students | % Students |
| Nursery / Preschool | 180 | 3.0% |
| Kindergarten | 94 | 1.6% |
| Elementary School | 395 | 6.7% |
| Middle School | 529 | 8.9% |
| High School | 402 | 6.8% |
| College / Undergraduate | 3,732 | 63.0% |
| Graduate / Professional | 591 | 10.0% |
| Total | 5,923 | 100.0% |
School Enrollment by Age by Funding Source in Vermillion
Out of a total of 5,923 students who are enrolled in schools in Vermillion, 261 (4.4%) attend a private institution, while the remaining 5,662 (95.6%) are enrolled in public schools. The age group of 35 years and over has the highest likelihood of being enrolled in private schools, with 34 (20.2% in the age bracket) enrolled. Conversely, the age group of 10 to 14 year olds has the lowest likelihood of being enrolled in a private school, with 603 (100.0% in the age bracket) attending a public institution.
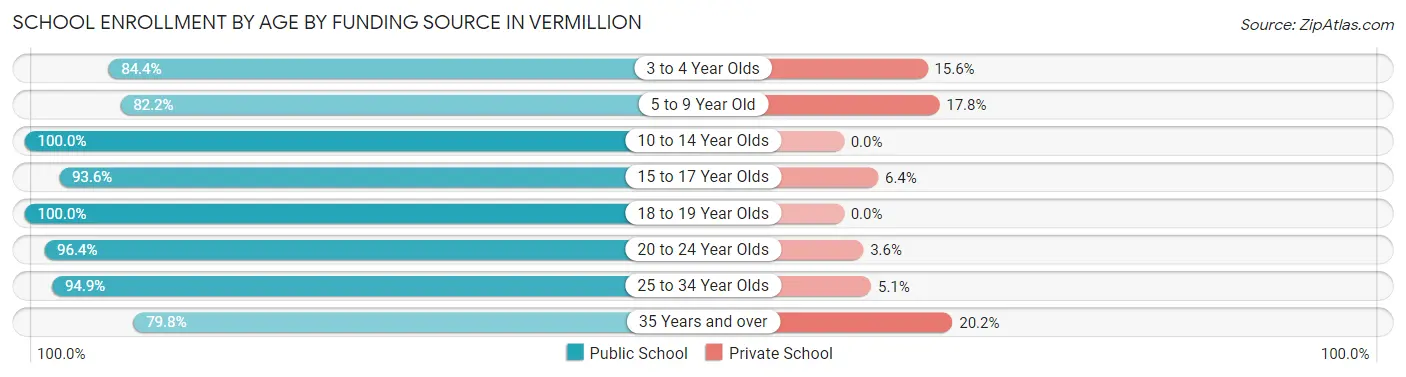
| Age Bracket | Public School | Private School |
| 3 to 4 Year Olds | 119 (84.4%) | 22 (15.6%) |
| 5 to 9 Year Old | 420 (82.2%) | 91 (17.8%) |
| 10 to 14 Year Olds | 603 (100.0%) | 0 (0.0%) |
| 15 to 17 Year Olds | 190 (93.6%) | 13 (6.4%) |
| 18 to 19 Year Olds | 1,587 (100.0%) | 0 (0.0%) |
| 20 to 24 Year Olds | 2,460 (96.4%) | 93 (3.6%) |
| 25 to 34 Year Olds | 149 (94.9%) | 8 (5.1%) |
| 35 Years and over | 134 (79.8%) | 34 (20.2%) |
| Total | 5,662 (95.6%) | 261 (4.4%) |
Educational Attainment by Field of Study in Vermillion
Education (391 | 16.2%), business (362 | 15.0%), science & technology (299 | 12.4%), bio, nature & agricultural (247 | 10.2%), and social sciences (216 | 8.9%) are the most common fields of study among 2,417 individuals in Vermillion who have obtained a bachelor's degree or higher.
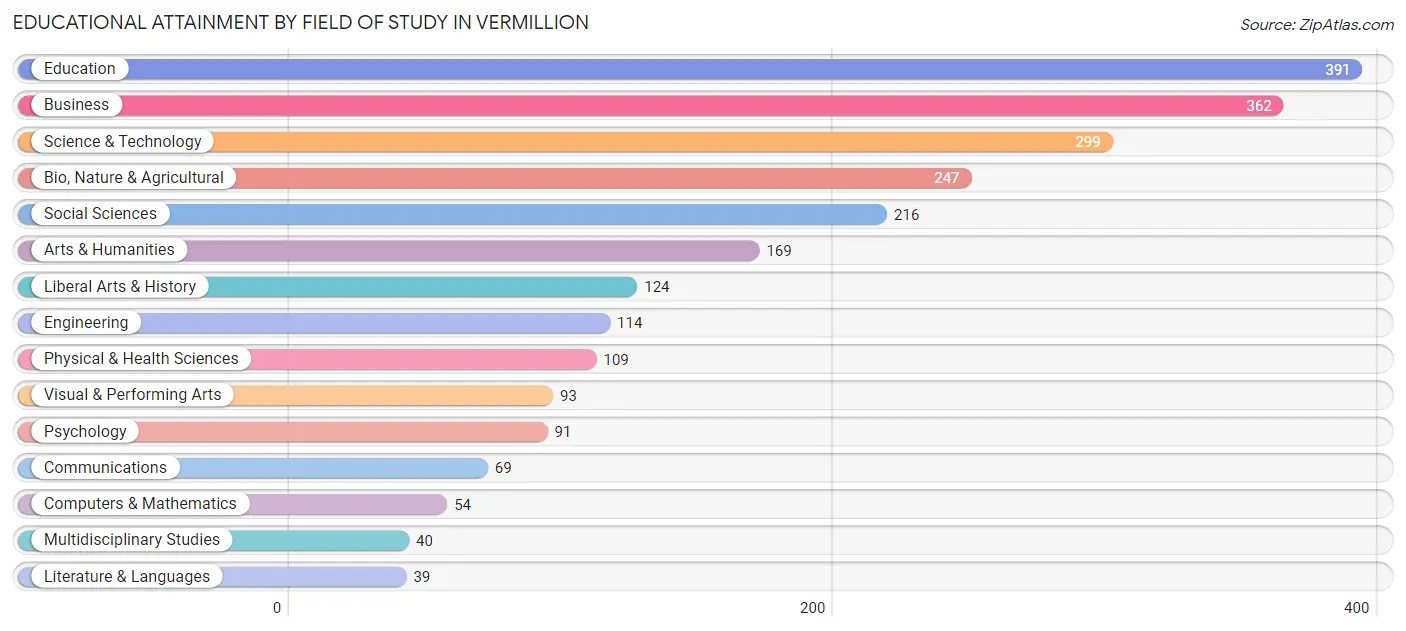
| Field of Study | # Graduates | % Graduates |
| Computers & Mathematics | 54 | 2.2% |
| Bio, Nature & Agricultural | 247 | 10.2% |
| Physical & Health Sciences | 109 | 4.5% |
| Psychology | 91 | 3.8% |
| Social Sciences | 216 | 8.9% |
| Engineering | 114 | 4.7% |
| Multidisciplinary Studies | 40 | 1.7% |
| Science & Technology | 299 | 12.4% |
| Business | 362 | 15.0% |
| Education | 391 | 16.2% |
| Literature & Languages | 39 | 1.6% |
| Liberal Arts & History | 124 | 5.1% |
| Visual & Performing Arts | 93 | 3.8% |
| Communications | 69 | 2.9% |
| Arts & Humanities | 169 | 7.0% |
| Total | 2,417 | 100.0% |
Transportation & Commute in Vermillion
Vehicle Availability by Sex in Vermillion
The most prevalent vehicle ownership categories in Vermillion are males with 2 vehicles (973, accounting for 40.6%) and females with 2 vehicles (686, making up 40.8%).
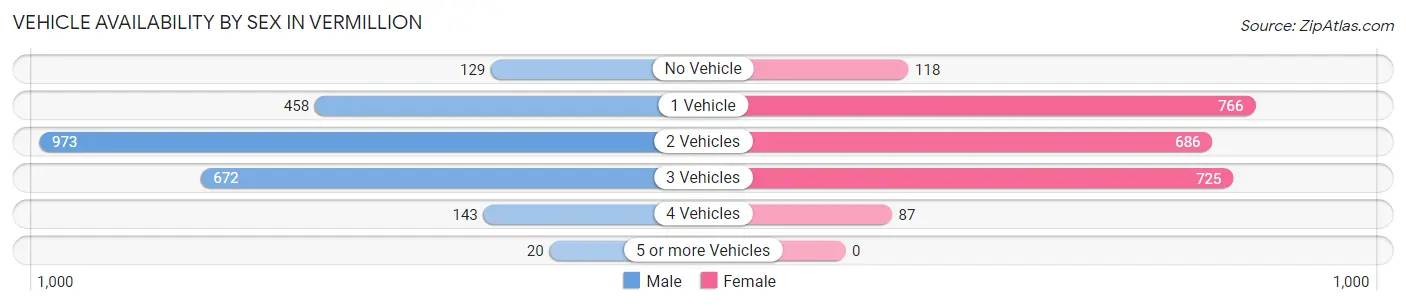
| Vehicles Available | Male | Female |
| No Vehicle | 129 (5.4%) | 118 (5.0%) |
| 1 Vehicle | 458 (19.1%) | 766 (32.2%) |
| 2 Vehicles | 973 (40.6%) | 686 (28.8%) |
| 3 Vehicles | 672 (28.1%) | 725 (30.4%) |
| 4 Vehicles | 143 (6.0%) | 87 (3.6%) |
| 5 or more Vehicles | 20 (0.8%) | 0 (0.0%) |
| Total | 2,395 (100.0%) | 2,382 (100.0%) |
Commute Time in Vermillion
The most frequently occuring commute durations in Vermillion are 5 to 9 minutes (2,116 commuters, 39.7%), 10 to 14 minutes (869 commuters, 16.3%), and less than 5 minutes (812 commuters, 15.2%).
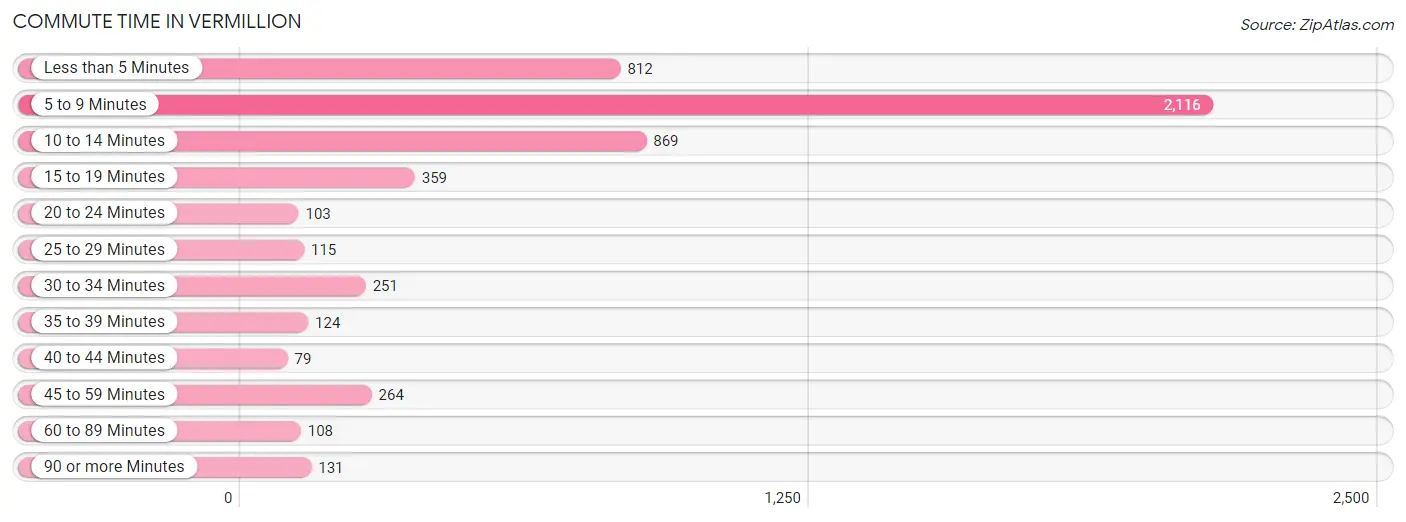
| Commute Time | # Commuters | % Commuters |
| Less than 5 Minutes | 812 | 15.2% |
| 5 to 9 Minutes | 2,116 | 39.7% |
| 10 to 14 Minutes | 869 | 16.3% |
| 15 to 19 Minutes | 359 | 6.7% |
| 20 to 24 Minutes | 103 | 1.9% |
| 25 to 29 Minutes | 115 | 2.2% |
| 30 to 34 Minutes | 251 | 4.7% |
| 35 to 39 Minutes | 124 | 2.3% |
| 40 to 44 Minutes | 79 | 1.5% |
| 45 to 59 Minutes | 264 | 5.0% |
| 60 to 89 Minutes | 108 | 2.0% |
| 90 or more Minutes | 131 | 2.5% |
Commute Time by Sex in Vermillion
The most common commute times in Vermillion are 5 to 9 minutes (1,033 commuters, 40.4%) for males and 5 to 9 minutes (1,083 commuters, 39.0%) for females.
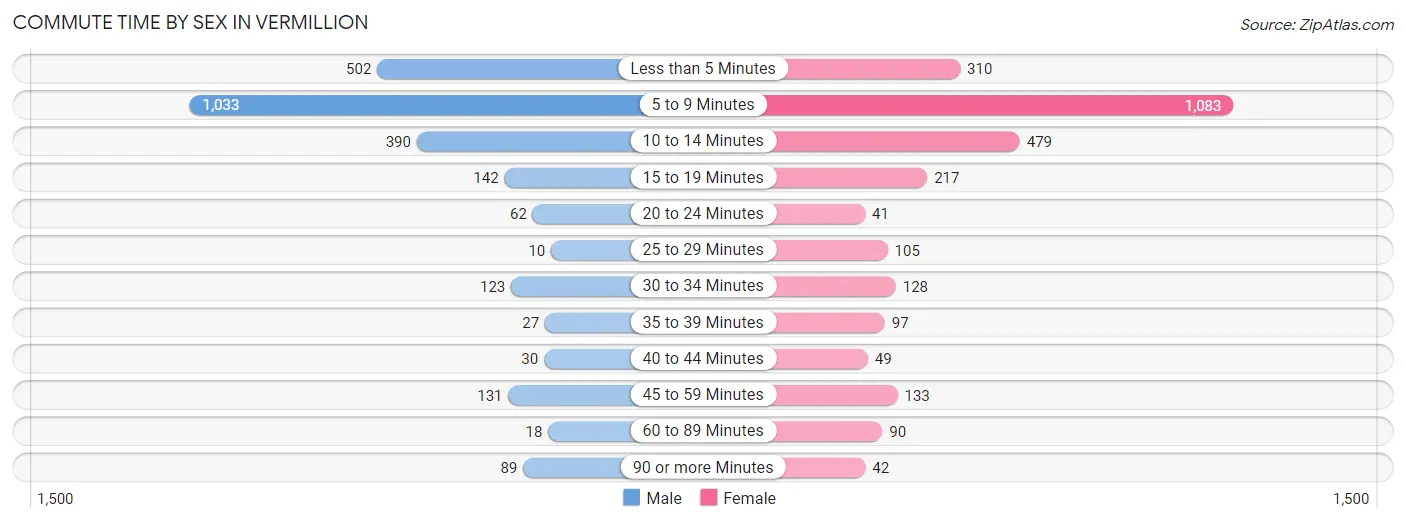
| Commute Time | Male | Female |
| Less than 5 Minutes | 502 (19.6%) | 310 (11.2%) |
| 5 to 9 Minutes | 1,033 (40.4%) | 1,083 (39.0%) |
| 10 to 14 Minutes | 390 (15.2%) | 479 (17.3%) |
| 15 to 19 Minutes | 142 (5.6%) | 217 (7.8%) |
| 20 to 24 Minutes | 62 (2.4%) | 41 (1.5%) |
| 25 to 29 Minutes | 10 (0.4%) | 105 (3.8%) |
| 30 to 34 Minutes | 123 (4.8%) | 128 (4.6%) |
| 35 to 39 Minutes | 27 (1.1%) | 97 (3.5%) |
| 40 to 44 Minutes | 30 (1.2%) | 49 (1.8%) |
| 45 to 59 Minutes | 131 (5.1%) | 133 (4.8%) |
| 60 to 89 Minutes | 18 (0.7%) | 90 (3.2%) |
| 90 or more Minutes | 89 (3.5%) | 42 (1.5%) |
Time of Departure to Work by Sex in Vermillion
The most frequent times of departure to work in Vermillion are 8:00 AM to 8:29 AM (454, 17.8%) for males and 7:30 AM to 7:59 AM (529, 19.1%) for females.
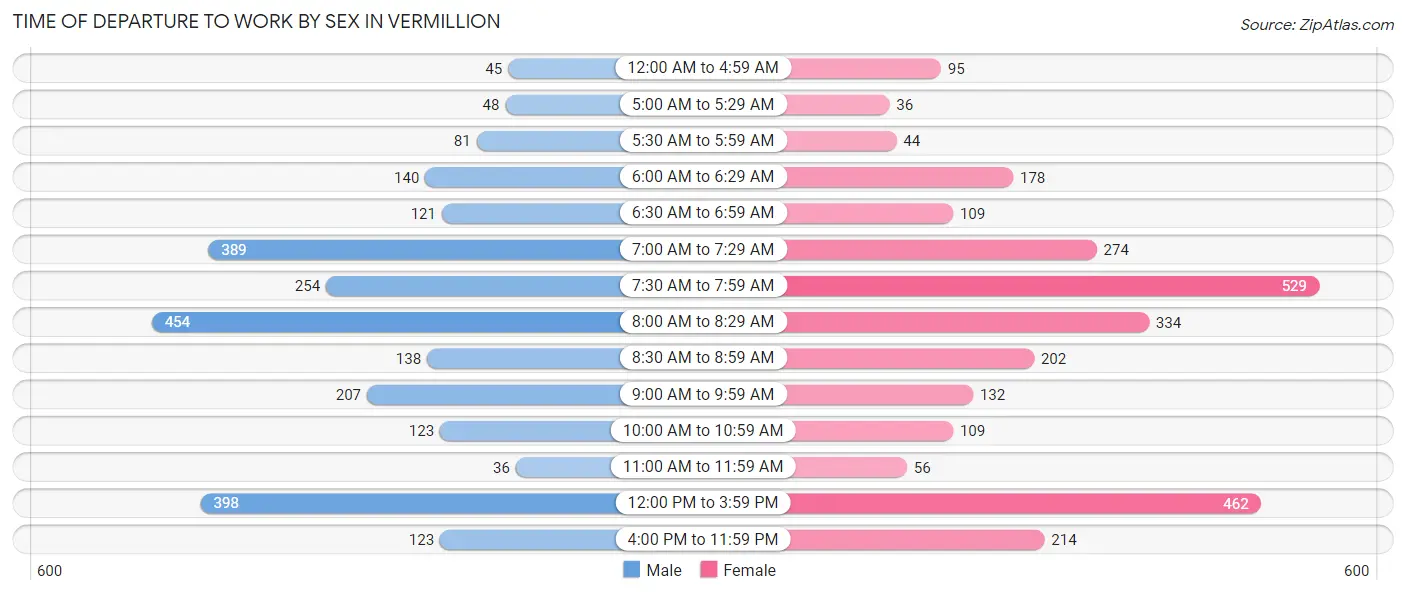
| Time of Departure | Male | Female |
| 12:00 AM to 4:59 AM | 45 (1.8%) | 95 (3.4%) |
| 5:00 AM to 5:29 AM | 48 (1.9%) | 36 (1.3%) |
| 5:30 AM to 5:59 AM | 81 (3.2%) | 44 (1.6%) |
| 6:00 AM to 6:29 AM | 140 (5.5%) | 178 (6.4%) |
| 6:30 AM to 6:59 AM | 121 (4.7%) | 109 (3.9%) |
| 7:00 AM to 7:29 AM | 389 (15.2%) | 274 (9.9%) |
| 7:30 AM to 7:59 AM | 254 (9.9%) | 529 (19.1%) |
| 8:00 AM to 8:29 AM | 454 (17.8%) | 334 (12.0%) |
| 8:30 AM to 8:59 AM | 138 (5.4%) | 202 (7.3%) |
| 9:00 AM to 9:59 AM | 207 (8.1%) | 132 (4.8%) |
| 10:00 AM to 10:59 AM | 123 (4.8%) | 109 (3.9%) |
| 11:00 AM to 11:59 AM | 36 (1.4%) | 56 (2.0%) |
| 12:00 PM to 3:59 PM | 398 (15.6%) | 462 (16.7%) |
| 4:00 PM to 11:59 PM | 123 (4.8%) | 214 (7.7%) |
| Total | 2,557 (100.0%) | 2,774 (100.0%) |
Housing Occupancy in Vermillion
Occupancy by Ownership in Vermillion
Of the total 4,038 dwellings in Vermillion, owner-occupied units account for 1,654 (41.0%), while renter-occupied units make up 2,384 (59.0%).
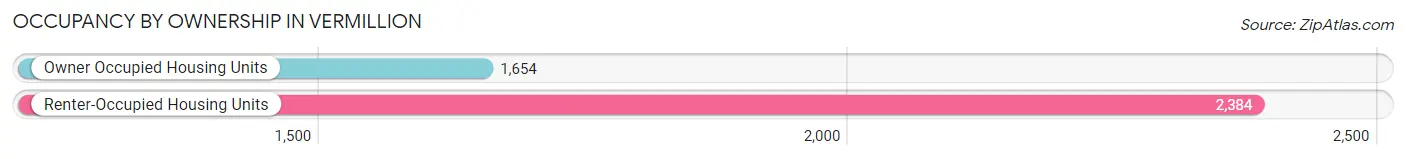
| Occupancy | # Housing Units | % Housing Units |
| Owner Occupied Housing Units | 1,654 | 41.0% |
| Renter-Occupied Housing Units | 2,384 | 59.0% |
| Total Occupied Housing Units | 4,038 | 100.0% |
Occupancy by Household Size in Vermillion
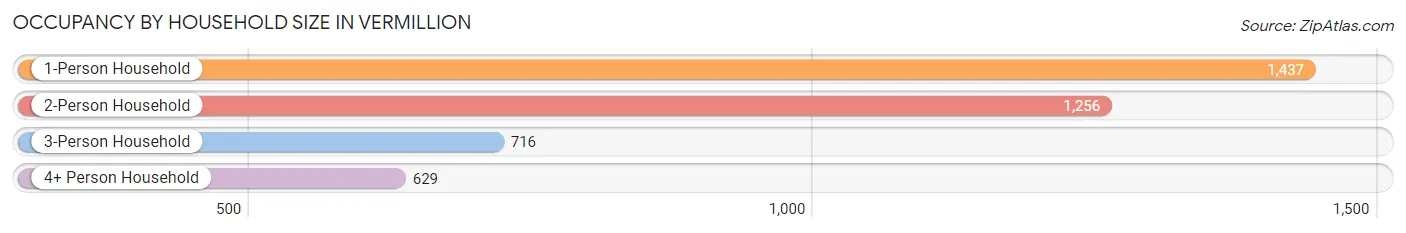
| Household Size | # Housing Units | % Housing Units |
| 1-Person Household | 1,437 | 35.6% |
| 2-Person Household | 1,256 | 31.1% |
| 3-Person Household | 716 | 17.7% |
| 4+ Person Household | 629 | 15.6% |
| Total Housing Units | 4,038 | 100.0% |
Occupancy by Ownership by Household Size in Vermillion
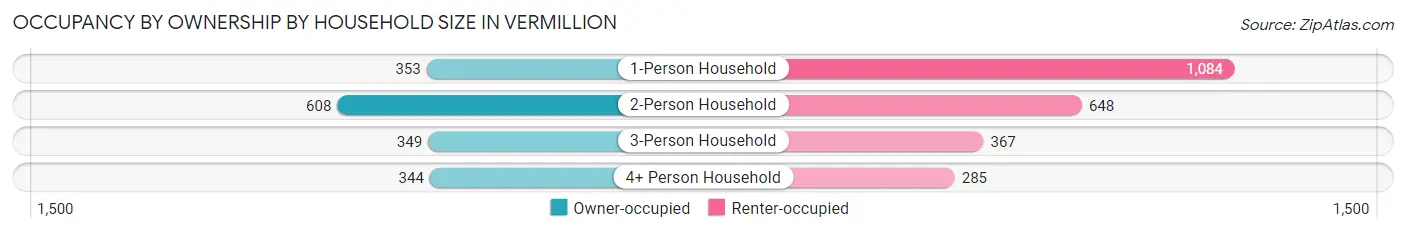
| Household Size | Owner-occupied | Renter-occupied |
| 1-Person Household | 353 (24.6%) | 1,084 (75.4%) |
| 2-Person Household | 608 (48.4%) | 648 (51.6%) |
| 3-Person Household | 349 (48.7%) | 367 (51.3%) |
| 4+ Person Household | 344 (54.7%) | 285 (45.3%) |
| Total Housing Units | 1,654 (41.0%) | 2,384 (59.0%) |
Occupancy by Educational Attainment in Vermillion
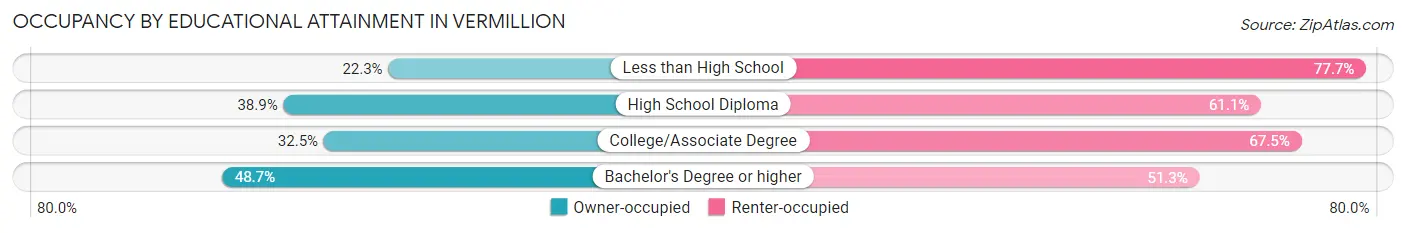
| Household Size | Owner-occupied | Renter-occupied |
| Less than High School | 39 (22.3%) | 136 (77.7%) |
| High School Diploma | 338 (38.9%) | 530 (61.1%) |
| College/Associate Degree | 366 (32.5%) | 759 (67.5%) |
| Bachelor's Degree or higher | 911 (48.7%) | 959 (51.3%) |
Occupancy by Age of Householder in Vermillion
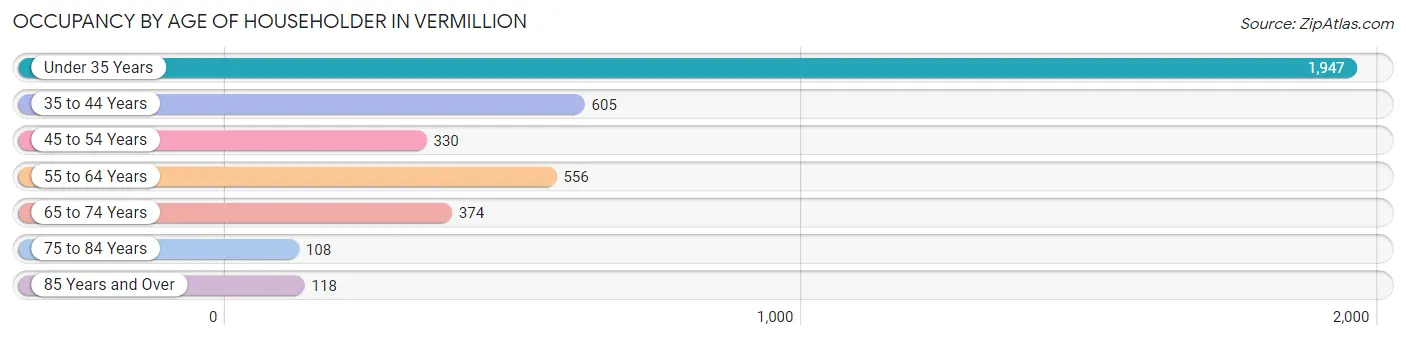
| Age Bracket | # Households | % Households |
| Under 35 Years | 1,947 | 48.2% |
| 35 to 44 Years | 605 | 15.0% |
| 45 to 54 Years | 330 | 8.2% |
| 55 to 64 Years | 556 | 13.8% |
| 65 to 74 Years | 374 | 9.3% |
| 75 to 84 Years | 108 | 2.7% |
| 85 Years and Over | 118 | 2.9% |
| Total | 4,038 | 100.0% |
Housing Finances in Vermillion
Median Income by Occupancy in Vermillion
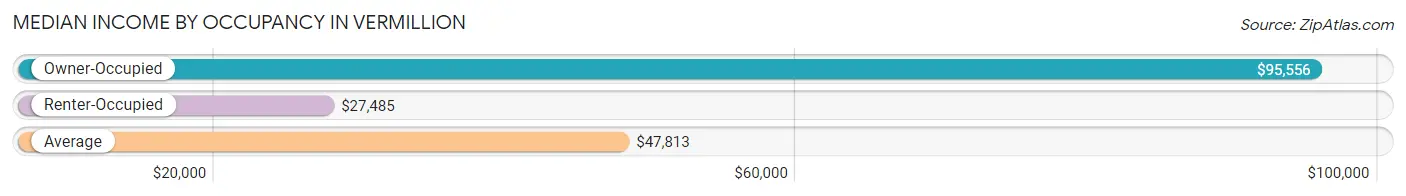
| Occupancy Type | # Households | Median Income |
| Owner-Occupied | 1,654 (41.0%) | $95,556 |
| Renter-Occupied | 2,384 (59.0%) | $27,485 |
| Average | 4,038 (100.0%) | $47,813 |
Occupancy by Householder Income Bracket in Vermillion
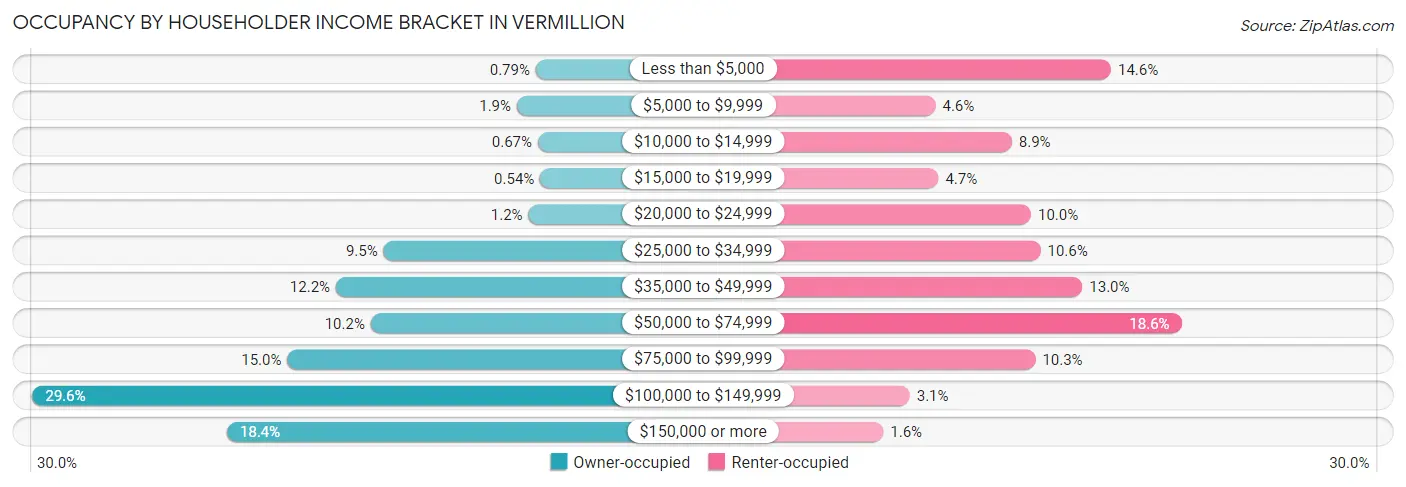
| Income Bracket | Owner-occupied | Renter-occupied |
| Less than $5,000 | 13 (0.8%) | 348 (14.6%) |
| $5,000 to $9,999 | 31 (1.9%) | 109 (4.6%) |
| $10,000 to $14,999 | 11 (0.7%) | 213 (8.9%) |
| $15,000 to $19,999 | 9 (0.5%) | 113 (4.7%) |
| $20,000 to $24,999 | 20 (1.2%) | 239 (10.0%) |
| $25,000 to $34,999 | 157 (9.5%) | 252 (10.6%) |
| $35,000 to $49,999 | 202 (12.2%) | 309 (13.0%) |
| $50,000 to $74,999 | 169 (10.2%) | 444 (18.6%) |
| $75,000 to $99,999 | 248 (15.0%) | 245 (10.3%) |
| $100,000 to $149,999 | 489 (29.6%) | 74 (3.1%) |
| $150,000 or more | 305 (18.4%) | 38 (1.6%) |
| Total | 1,654 (100.0%) | 2,384 (100.0%) |
Monthly Housing Cost Tiers in Vermillion
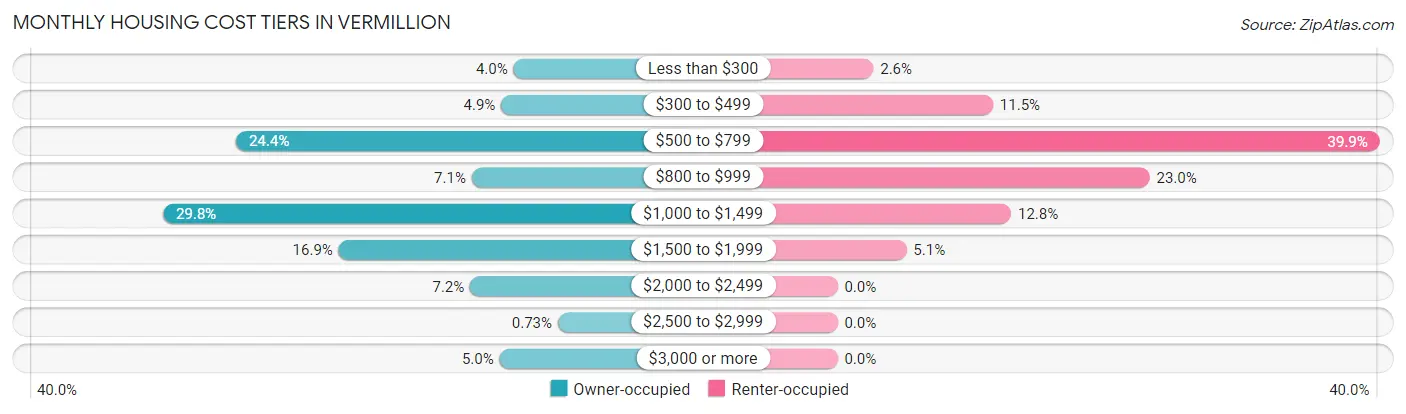
| Monthly Cost | Owner-occupied | Renter-occupied |
| Less than $300 | 66 (4.0%) | 63 (2.6%) |
| $300 to $499 | 81 (4.9%) | 273 (11.5%) |
| $500 to $799 | 404 (24.4%) | 952 (39.9%) |
| $800 to $999 | 117 (7.1%) | 548 (23.0%) |
| $1,000 to $1,499 | 493 (29.8%) | 305 (12.8%) |
| $1,500 to $1,999 | 279 (16.9%) | 121 (5.1%) |
| $2,000 to $2,499 | 119 (7.2%) | 0 (0.0%) |
| $2,500 to $2,999 | 12 (0.7%) | 0 (0.0%) |
| $3,000 or more | 83 (5.0%) | 0 (0.0%) |
| Total | 1,654 (100.0%) | 2,384 (100.0%) |
Physical Housing Characteristics in Vermillion
Housing Structures in Vermillion
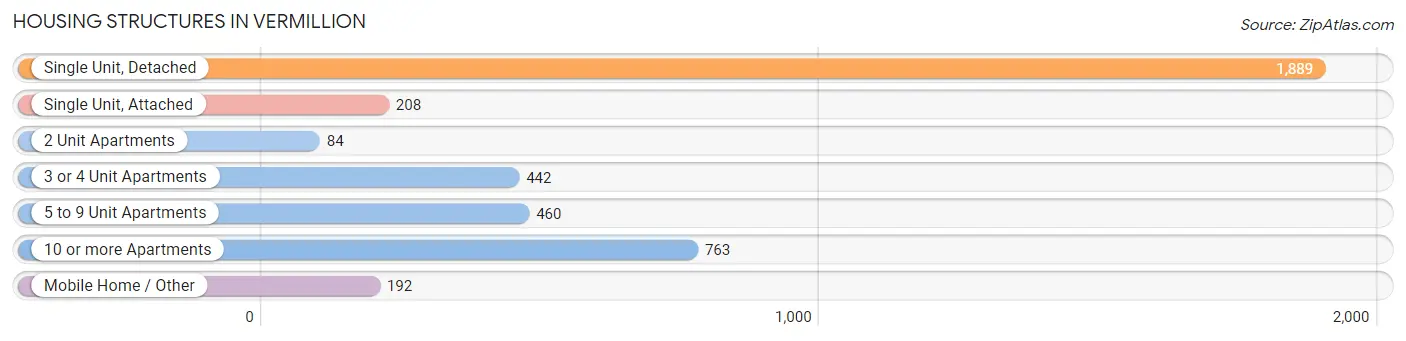
| Structure Type | # Housing Units | % Housing Units |
| Single Unit, Detached | 1,889 | 46.8% |
| Single Unit, Attached | 208 | 5.1% |
| 2 Unit Apartments | 84 | 2.1% |
| 3 or 4 Unit Apartments | 442 | 11.0% |
| 5 to 9 Unit Apartments | 460 | 11.4% |
| 10 or more Apartments | 763 | 18.9% |
| Mobile Home / Other | 192 | 4.8% |
| Total | 4,038 | 100.0% |
Housing Structures by Occupancy in Vermillion
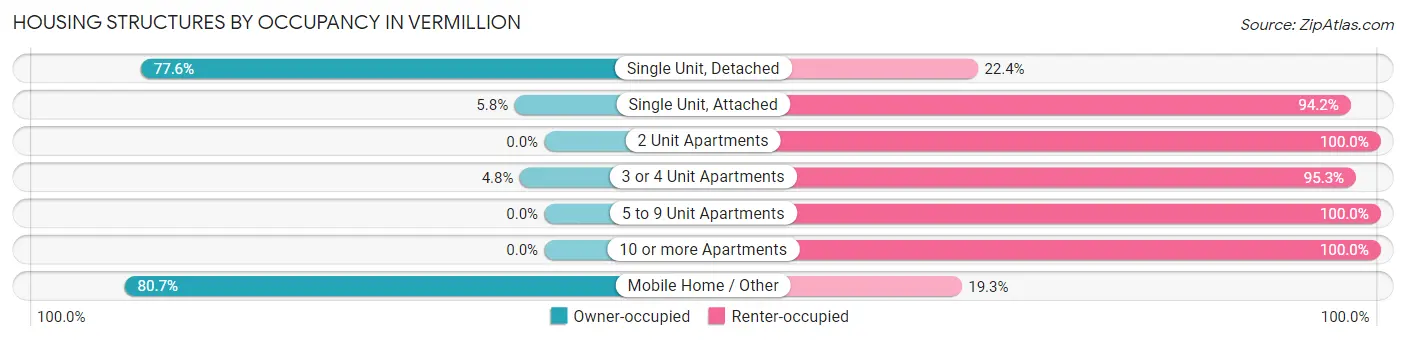
| Structure Type | Owner-occupied | Renter-occupied |
| Single Unit, Detached | 1,466 (77.6%) | 423 (22.4%) |
| Single Unit, Attached | 12 (5.8%) | 196 (94.2%) |
| 2 Unit Apartments | 0 (0.0%) | 84 (100.0%) |
| 3 or 4 Unit Apartments | 21 (4.8%) | 421 (95.3%) |
| 5 to 9 Unit Apartments | 0 (0.0%) | 460 (100.0%) |
| 10 or more Apartments | 0 (0.0%) | 763 (100.0%) |
| Mobile Home / Other | 155 (80.7%) | 37 (19.3%) |
| Total | 1,654 (41.0%) | 2,384 (59.0%) |
Housing Structures by Number of Rooms in Vermillion
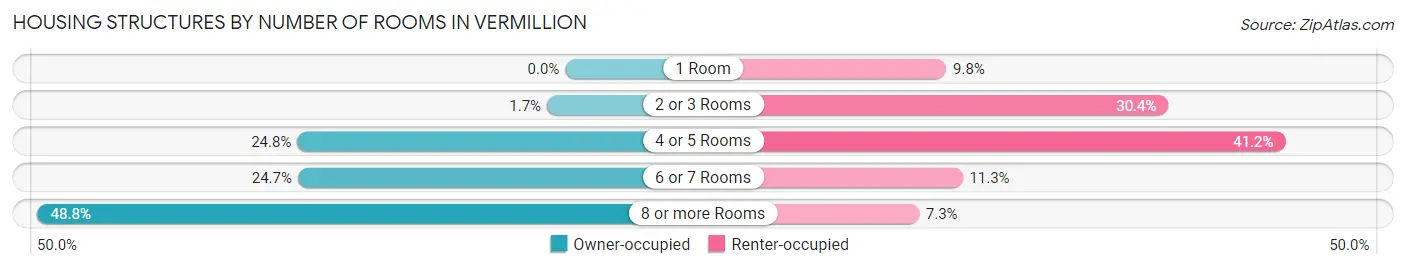
| Number of Rooms | Owner-occupied | Renter-occupied |
| 1 Room | 0 (0.0%) | 234 (9.8%) |
| 2 or 3 Rooms | 28 (1.7%) | 724 (30.4%) |
| 4 or 5 Rooms | 410 (24.8%) | 982 (41.2%) |
| 6 or 7 Rooms | 409 (24.7%) | 270 (11.3%) |
| 8 or more Rooms | 807 (48.8%) | 174 (7.3%) |
| Total | 1,654 (100.0%) | 2,384 (100.0%) |
Housing Structure by Heating Type in Vermillion
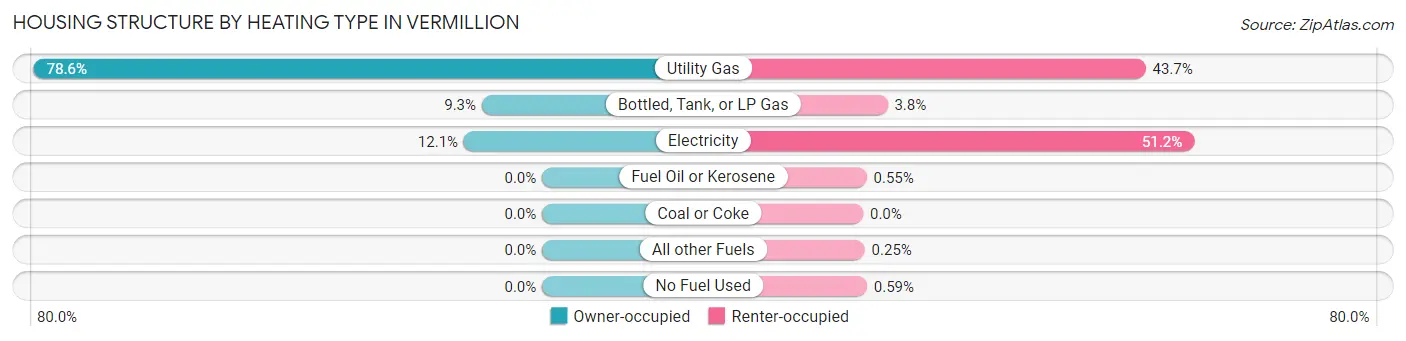
| Heating Type | Owner-occupied | Renter-occupied |
| Utility Gas | 1,300 (78.6%) | 1,041 (43.7%) |
| Bottled, Tank, or LP Gas | 154 (9.3%) | 90 (3.8%) |
| Electricity | 200 (12.1%) | 1,220 (51.2%) |
| Fuel Oil or Kerosene | 0 (0.0%) | 13 (0.5%) |
| Coal or Coke | 0 (0.0%) | 0 (0.0%) |
| All other Fuels | 0 (0.0%) | 6 (0.3%) |
| No Fuel Used | 0 (0.0%) | 14 (0.6%) |
| Total | 1,654 (100.0%) | 2,384 (100.0%) |
Household Vehicle Usage in Vermillion
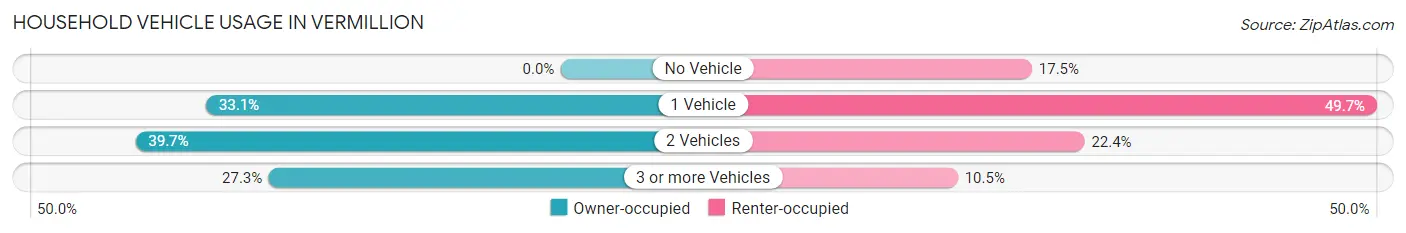
| Vehicles per Household | Owner-occupied | Renter-occupied |
| No Vehicle | 0 (0.0%) | 416 (17.4%) |
| 1 Vehicle | 547 (33.1%) | 1,184 (49.7%) |
| 2 Vehicles | 656 (39.7%) | 533 (22.4%) |
| 3 or more Vehicles | 451 (27.3%) | 251 (10.5%) |
| Total | 1,654 (100.0%) | 2,384 (100.0%) |
Real Estate & Mortgages in Vermillion
Real Estate and Mortgage Overview in Vermillion
| Characteristic | Without Mortgage | With Mortgage |
| Housing Units | 631 | 1,023 |
| Median Property Value | $164,700 | $206,000 |
| Median Household Income | $79,205 | $247 |
| Monthly Housing Costs | $636 | $83 |
| Real Estate Taxes | $3,355 | $24 |
Property Value by Mortgage Status in Vermillion
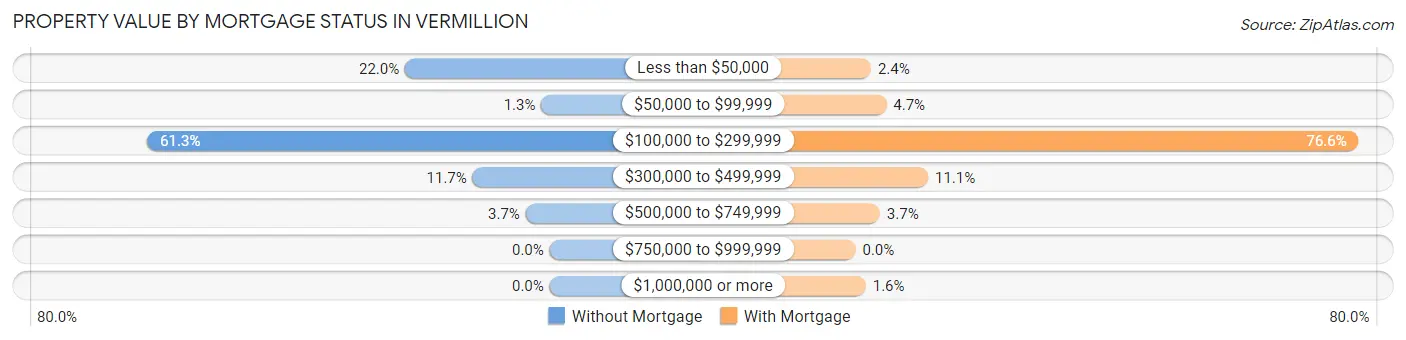
| Property Value | Without Mortgage | With Mortgage |
| Less than $50,000 | 139 (22.0%) | 24 (2.4%) |
| $50,000 to $99,999 | 8 (1.3%) | 48 (4.7%) |
| $100,000 to $299,999 | 387 (61.3%) | 784 (76.6%) |
| $300,000 to $499,999 | 74 (11.7%) | 113 (11.1%) |
| $500,000 to $749,999 | 23 (3.6%) | 38 (3.7%) |
| $750,000 to $999,999 | 0 (0.0%) | 0 (0.0%) |
| $1,000,000 or more | 0 (0.0%) | 16 (1.6%) |
| Total | 631 (100.0%) | 1,023 (100.0%) |
Household Income by Mortgage Status in Vermillion
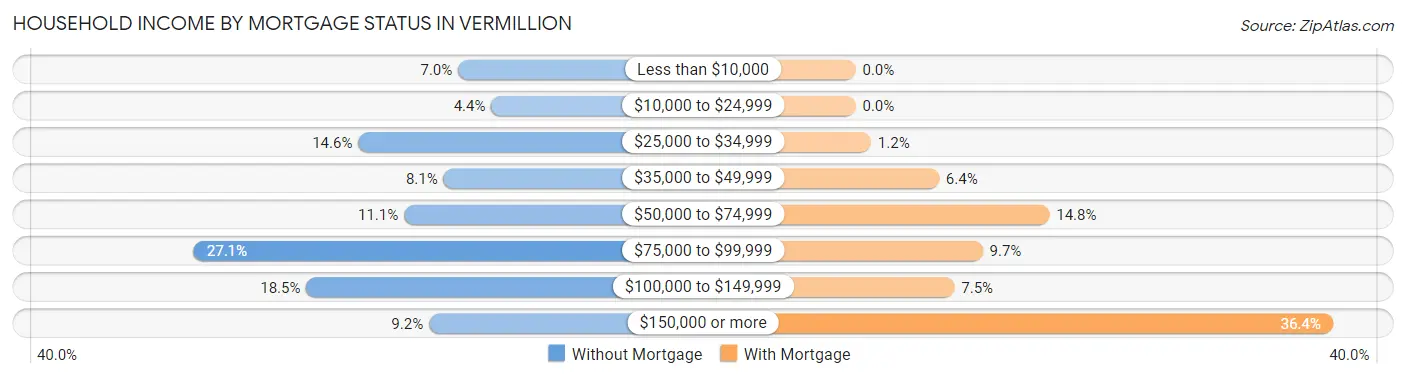
| Household Income | Without Mortgage | With Mortgage |
| Less than $10,000 | 44 (7.0%) | 0 (0.0%) |
| $10,000 to $24,999 | 28 (4.4%) | 0 (0.0%) |
| $25,000 to $34,999 | 92 (14.6%) | 12 (1.2%) |
| $35,000 to $49,999 | 51 (8.1%) | 65 (6.4%) |
| $50,000 to $74,999 | 70 (11.1%) | 151 (14.8%) |
| $75,000 to $99,999 | 171 (27.1%) | 99 (9.7%) |
| $100,000 to $149,999 | 117 (18.5%) | 77 (7.5%) |
| $150,000 or more | 58 (9.2%) | 372 (36.4%) |
| Total | 631 (100.0%) | 1,023 (100.0%) |
Property Value to Household Income Ratio in Vermillion
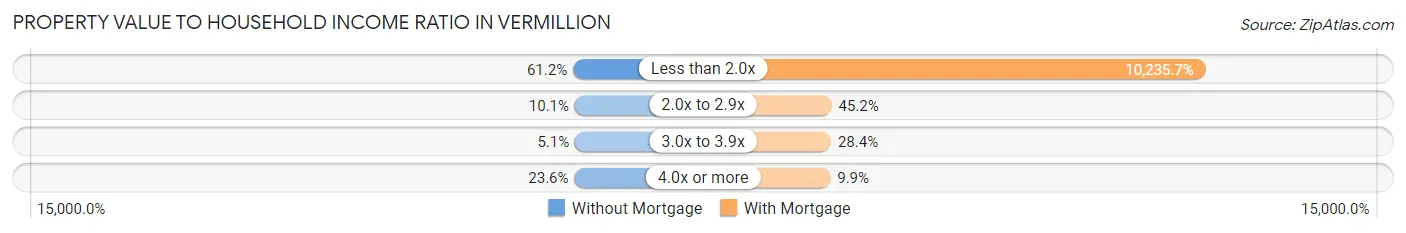
| Value-to-Income Ratio | Without Mortgage | With Mortgage |
| Less than 2.0x | 386 (61.2%) | 104,711 (10,235.7%) |
| 2.0x to 2.9x | 64 (10.1%) | 462 (45.2%) |
| 3.0x to 3.9x | 32 (5.1%) | 290 (28.3%) |
| 4.0x or more | 149 (23.6%) | 101 (9.9%) |
| Total | 631 (100.0%) | 1,023 (100.0%) |
Real Estate Taxes by Mortgage Status in Vermillion
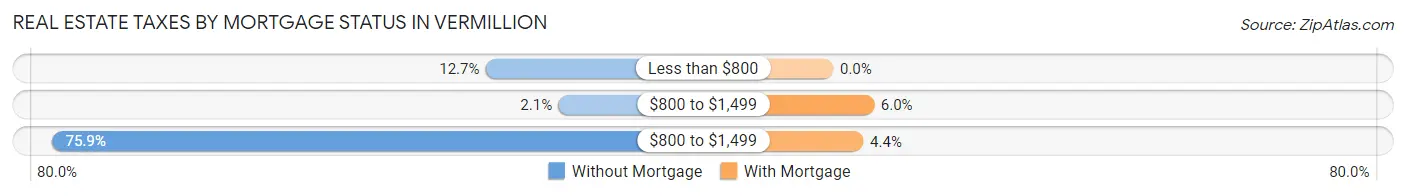
| Property Taxes | Without Mortgage | With Mortgage |
| Less than $800 | 80 (12.7%) | 0 (0.0%) |
| $800 to $1,499 | 13 (2.1%) | 61 (6.0%) |
| $800 to $1,499 | 479 (75.9%) | 45 (4.4%) |
| Total | 631 (100.0%) | 1,023 (100.0%) |
Health & Disability in Vermillion
Health Insurance Coverage by Age in Vermillion
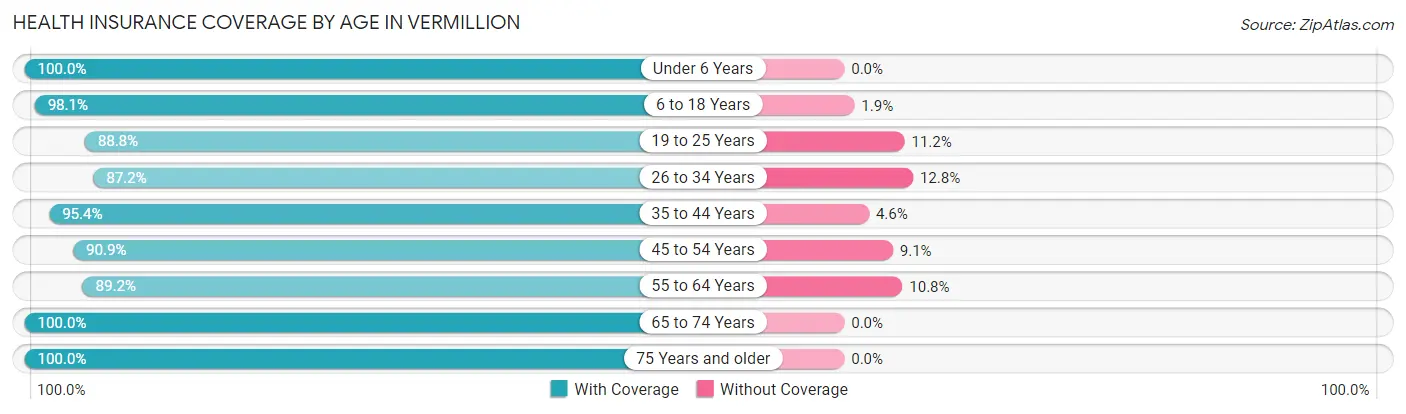
| Age Bracket | With Coverage | Without Coverage |
| Under 6 Years | 639 (100.0%) | 0 (0.0%) |
| 6 to 18 Years | 1,812 (98.1%) | 35 (1.9%) |
| 19 to 25 Years | 4,027 (88.8%) | 510 (11.2%) |
| 26 to 34 Years | 1,062 (87.2%) | 156 (12.8%) |
| 35 to 44 Years | 933 (95.4%) | 45 (4.6%) |
| 45 to 54 Years | 492 (90.9%) | 49 (9.1%) |
| 55 to 64 Years | 741 (89.2%) | 90 (10.8%) |
| 65 to 74 Years | 604 (100.0%) | 0 (0.0%) |
| 75 Years and older | 315 (100.0%) | 0 (0.0%) |
| Total | 10,625 (92.3%) | 885 (7.7%) |
Health Insurance Coverage by Citizenship Status in Vermillion
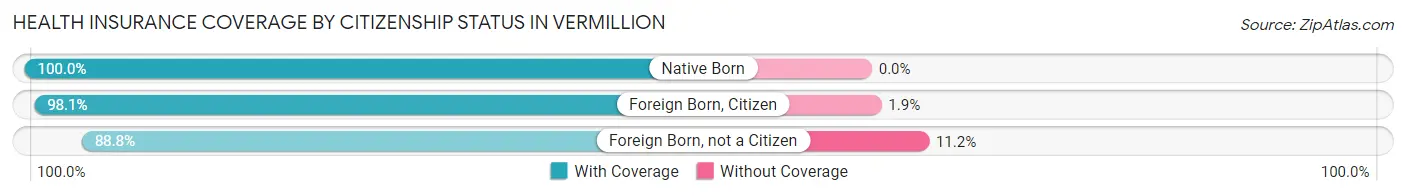
| Citizenship Status | With Coverage | Without Coverage |
| Native Born | 639 (100.0%) | 0 (0.0%) |
| Foreign Born, Citizen | 1,812 (98.1%) | 35 (1.9%) |
| Foreign Born, not a Citizen | 4,027 (88.8%) | 510 (11.2%) |
Health Insurance Coverage by Household Income in Vermillion
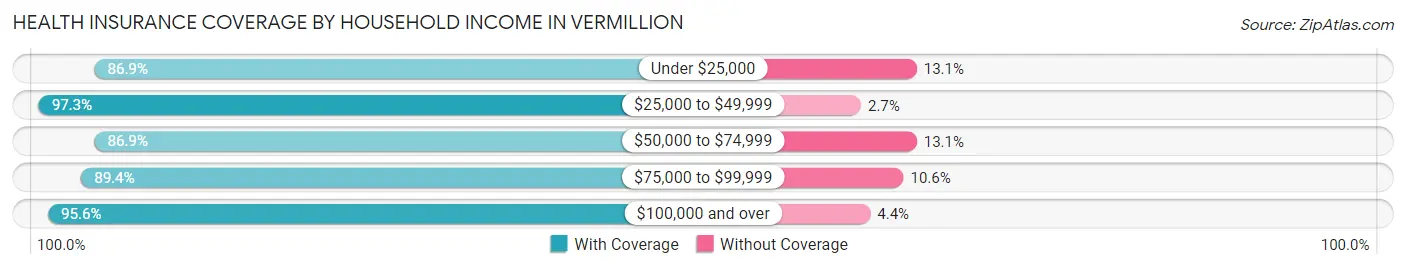
| Household Income | With Coverage | Without Coverage |
| Under $25,000 | 1,708 (86.9%) | 258 (13.1%) |
| $25,000 to $49,999 | 1,786 (97.3%) | 49 (2.7%) |
| $50,000 to $74,999 | 1,465 (86.9%) | 221 (13.1%) |
| $75,000 to $99,999 | 1,186 (89.4%) | 141 (10.6%) |
| $100,000 and over | 2,488 (95.6%) | 115 (4.4%) |
Public vs Private Health Insurance Coverage by Age in Vermillion
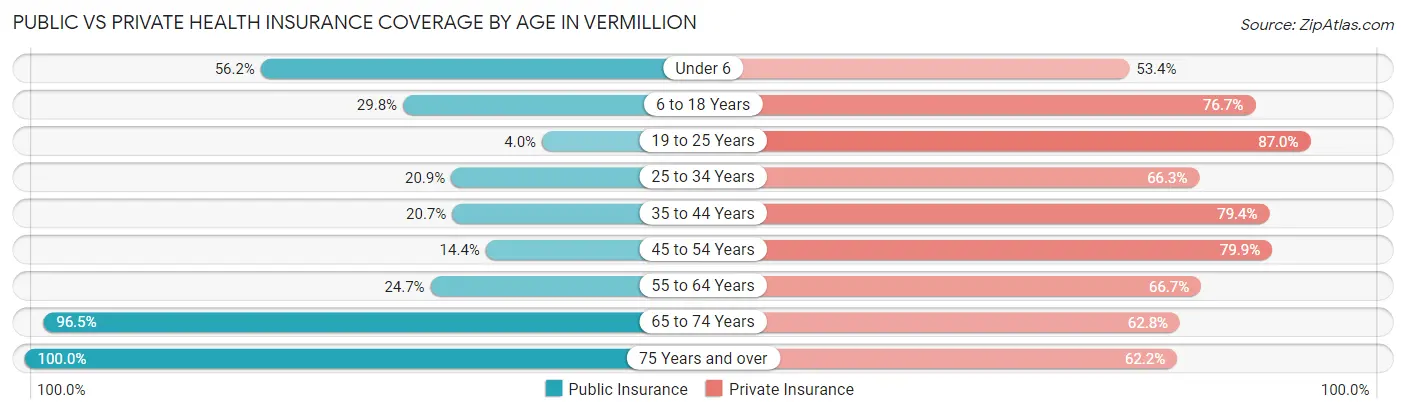
| Age Bracket | Public Insurance | Private Insurance |
| Under 6 | 359 (56.2%) | 341 (53.4%) |
| 6 to 18 Years | 550 (29.8%) | 1,417 (76.7%) |
| 19 to 25 Years | 180 (4.0%) | 3,945 (87.0%) |
| 25 to 34 Years | 254 (20.8%) | 808 (66.3%) |
| 35 to 44 Years | 202 (20.6%) | 776 (79.3%) |
| 45 to 54 Years | 78 (14.4%) | 432 (79.8%) |
| 55 to 64 Years | 205 (24.7%) | 554 (66.7%) |
| 65 to 74 Years | 583 (96.5%) | 379 (62.7%) |
| 75 Years and over | 315 (100.0%) | 196 (62.2%) |
| Total | 2,726 (23.7%) | 8,848 (76.9%) |
Disability Status by Sex by Age in Vermillion
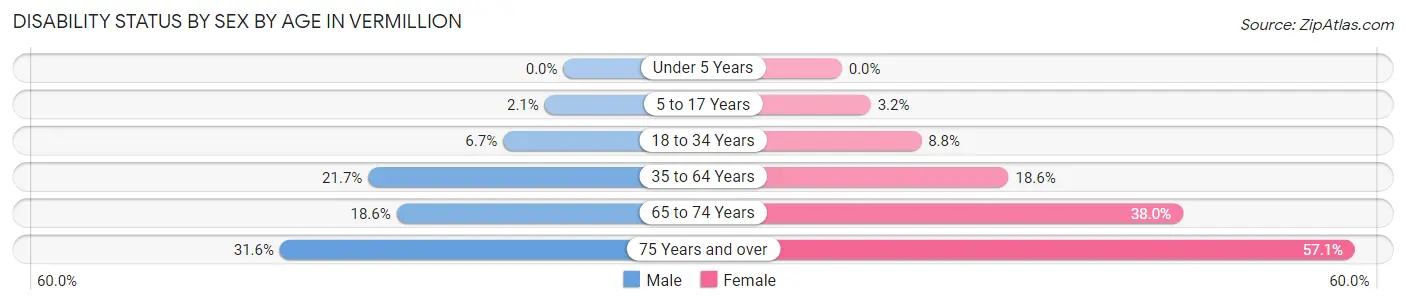
| Age Bracket | Male | Female |
| Under 5 Years | 0 (0.0%) | 0 (0.0%) |
| 5 to 17 Years | 14 (2.1%) | 22 (3.2%) |
| 18 to 34 Years | 204 (6.7%) | 294 (8.8%) |
| 35 to 64 Years | 265 (21.7%) | 210 (18.6%) |
| 65 to 74 Years | 55 (18.6%) | 117 (38.0%) |
| 75 Years and over | 42 (31.6%) | 104 (57.1%) |
Disability Class by Sex by Age in Vermillion
Disability Class: Hearing Difficulty
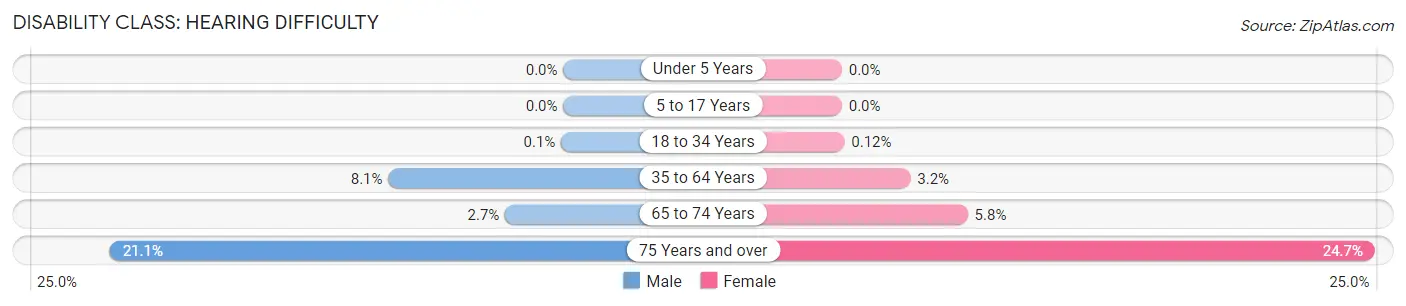
| Age Bracket | Male | Female |
| Under 5 Years | 0 (0.0%) | 0 (0.0%) |
| 5 to 17 Years | 0 (0.0%) | 0 (0.0%) |
| 18 to 34 Years | 3 (0.1%) | 4 (0.1%) |
| 35 to 64 Years | 99 (8.1%) | 36 (3.2%) |
| 65 to 74 Years | 8 (2.7%) | 18 (5.8%) |
| 75 Years and over | 28 (21.0%) | 45 (24.7%) |
Disability Class: Vision Difficulty
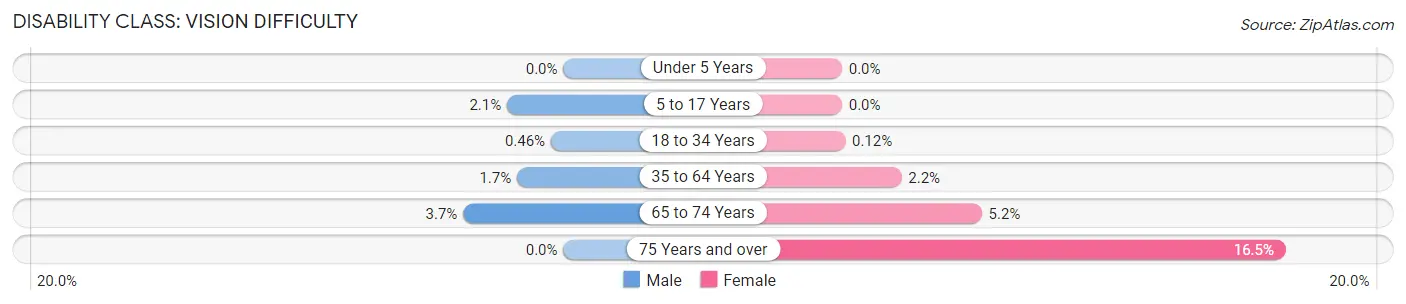
| Age Bracket | Male | Female |
| Under 5 Years | 0 (0.0%) | 0 (0.0%) |
| 5 to 17 Years | 14 (2.1%) | 0 (0.0%) |
| 18 to 34 Years | 14 (0.5%) | 4 (0.1%) |
| 35 to 64 Years | 21 (1.7%) | 25 (2.2%) |
| 65 to 74 Years | 11 (3.7%) | 16 (5.2%) |
| 75 Years and over | 0 (0.0%) | 30 (16.5%) |
Disability Class: Cognitive Difficulty
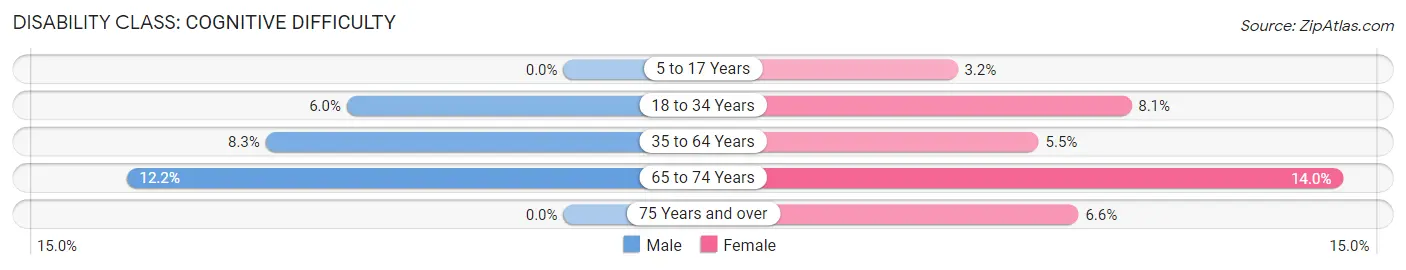
| Age Bracket | Male | Female |
| 5 to 17 Years | 0 (0.0%) | 22 (3.2%) |
| 18 to 34 Years | 183 (6.0%) | 268 (8.1%) |
| 35 to 64 Years | 101 (8.3%) | 62 (5.5%) |
| 65 to 74 Years | 36 (12.2%) | 43 (14.0%) |
| 75 Years and over | 0 (0.0%) | 12 (6.6%) |
Disability Class: Ambulatory Difficulty
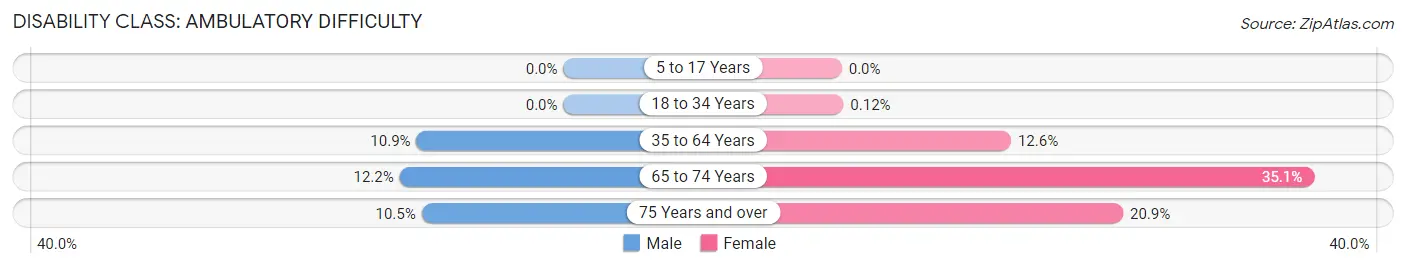
| Age Bracket | Male | Female |
| 5 to 17 Years | 0 (0.0%) | 0 (0.0%) |
| 18 to 34 Years | 0 (0.0%) | 4 (0.1%) |
| 35 to 64 Years | 133 (10.9%) | 142 (12.6%) |
| 65 to 74 Years | 36 (12.2%) | 108 (35.1%) |
| 75 Years and over | 14 (10.5%) | 38 (20.9%) |
Disability Class: Self-Care Difficulty
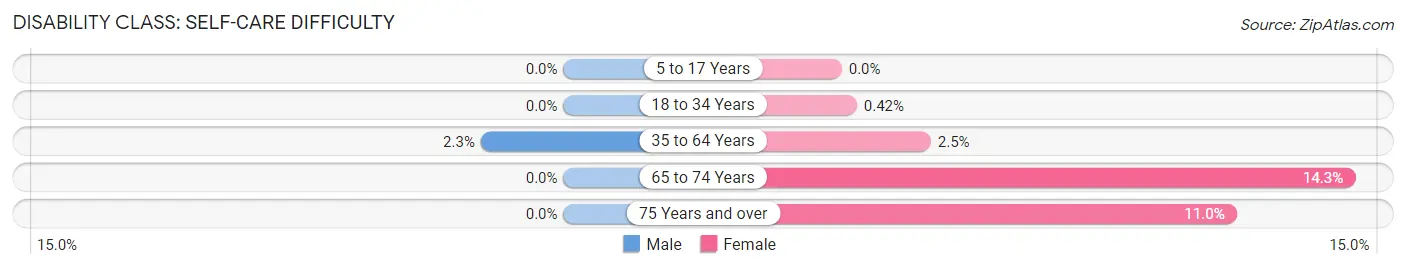
| Age Bracket | Male | Female |
| 5 to 17 Years | 0 (0.0%) | 0 (0.0%) |
| 18 to 34 Years | 0 (0.0%) | 14 (0.4%) |
| 35 to 64 Years | 28 (2.3%) | 28 (2.5%) |
| 65 to 74 Years | 0 (0.0%) | 44 (14.3%) |
| 75 Years and over | 0 (0.0%) | 20 (11.0%) |
Technology Access in Vermillion
Computing Device Access in Vermillion
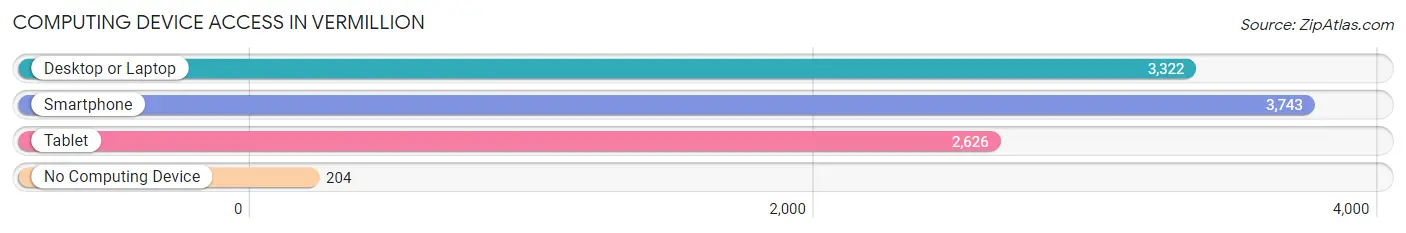
| Device Type | # Households | % Households |
| Desktop or Laptop | 3,322 | 82.3% |
| Smartphone | 3,743 | 92.7% |
| Tablet | 2,626 | 65.0% |
| No Computing Device | 204 | 5.1% |
| Total | 4,038 | 100.0% |
Internet Access in Vermillion
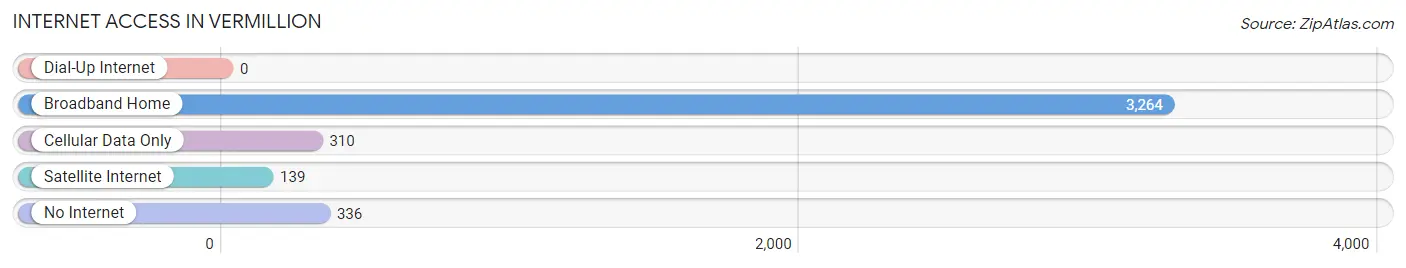
| Internet Type | # Households | % Households |
| Dial-Up Internet | 0 | 0.0% |
| Broadband Home | 3,264 | 80.8% |
| Cellular Data Only | 310 | 7.7% |
| Satellite Internet | 139 | 3.4% |
| No Internet | 336 | 8.3% |
| Total | 4,038 | 100.0% |
Vermillion Summary
Vermillion, South Dakota is a small city located in the southeastern corner of the state. It is the county seat of Clay County and is home to the University of South Dakota. The city has a population of approximately 10,000 people and is located on the Missouri River.
History
Vermillion was founded in 1859 by a group of settlers from Iowa. The city was named after the nearby Vermillion River, which was named by French explorers in the late 1700s. The city was incorporated in 1873 and was the first city in South Dakota to be incorporated.
The city was an important trading center for the area and was the site of the first post office in the state. The city was also the site of the first newspaper in the state, the Vermillion Plain Talk.
The city was also the site of the first college in the state, the University of South Dakota, which was founded in 1862. The university has grown to become the largest university in the state and is a major economic driver for the city.
Geography
Vermillion is located in the southeastern corner of South Dakota, on the Missouri River. The city is located in the Loess Hills region of the state, which is characterized by rolling hills and fertile soil. The city is located in Clay County and is surrounded by Union County to the north, Yankton County to the east, and Hutchinson County to the south.
The city has a total area of 4.2 square miles, all of which is land. The city has a humid continental climate, with hot summers and cold winters. The average annual temperature is 48.3 degrees Fahrenheit, and the average annual precipitation is 24.3 inches.
Economy
Vermillion’s economy is largely driven by the University of South Dakota, which is the largest employer in the city. Other major employers in the city include the Clay County government, the Vermillion Public School District, and the Vermillion Medical Center.
The city also has a thriving retail sector, with several major retailers located in the city. The city also has a vibrant arts and culture scene, with several galleries, museums, and theaters located in the city.
Demographics
As of the 2010 census, the population of Vermillion was 10,571. The racial makeup of the city was 91.2% White, 4.2% African American, 0.7% Native American, 1.2% Asian, 0.1% Pacific Islander, 1.2% from other races, and 1.5% from two or more races. Hispanic or Latino of any race were 3.2% of the population.
The median income for a household in the city was $37,917, and the median income for a family was $50,917. The per capita income for the city was $20,917. About 11.2% of families and 17.2% of the population were below the poverty line, including 22.2% of those under age 18 and 8.2% of those age 65 or over.
Vermillion is a small city with a rich history and a vibrant economy. The city is home to the University of South Dakota, which is the largest employer in the city and a major economic driver. The city also has a diverse population and a thriving retail sector.
Common Questions
What is Per Capita Income in Vermillion?
Per Capita income in Vermillion is $24,781.
What is the Median Family Income in Vermillion?
Median Family Income in Vermillion is $87,645.
What is the Median Household income in Vermillion?
Median Household Income in Vermillion is $47,813.
What is Income or Wage Gap in Vermillion?
Income or Wage Gap in Vermillion is 48.3%.
Women in Vermillion earn 51.7 cents for every dollar earned by a man.
What is Family Income Deficit in Vermillion?
Family Income Deficit in Vermillion is $14,991.
Families that are below poverty line in Vermillion earn $14,991 less on average than the poverty threshold level.
What is Inequality or Gini Index in Vermillion?
Inequality or Gini Index in Vermillion is 0.48.
What is the Total Population of Vermillion?
Total Population of Vermillion is 11,667.
What is the Total Male Population of Vermillion?
Total Male Population of Vermillion is 5,657.
What is the Total Female Population of Vermillion?
Total Female Population of Vermillion is 6,010.
What is the Ratio of Males per 100 Females in Vermillion?
There are 94.13 Males per 100 Females in Vermillion.
What is the Ratio of Females per 100 Males in Vermillion?
There are 106.24 Females per 100 Males in Vermillion.
What is the Median Population Age in Vermillion?
Median Population Age in Vermillion is 23.0 Years.
What is the Average Family Size in Vermillion
Average Family Size in Vermillion is 3.0 People.
What is the Average Household Size in Vermillion
Average Household Size in Vermillion is 2.3 People.
How Large is the Labor Force in Vermillion?
There are 6,856 People in the Labor Forcein in Vermillion.
What is the Percentage of People in the Labor Force in Vermillion?
68.9% of People are in the Labor Force in Vermillion.
What is the Unemployment Rate in Vermillion?
Unemployment Rate in Vermillion is 10.0%.