Area Code 605 Map & Demographics
Area Code 605 Map
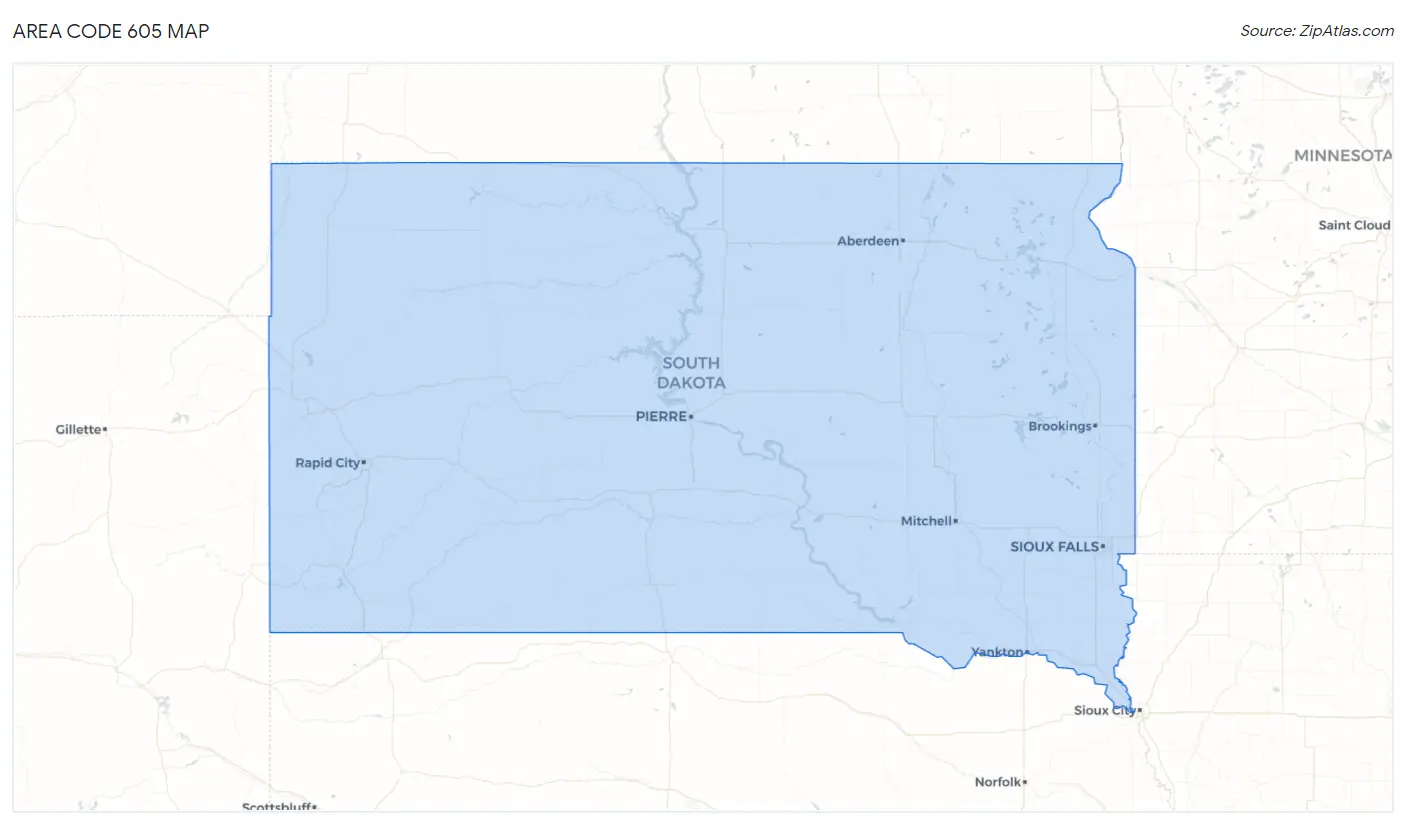
Area Code 605 Overview
$36,174
PER CAPITA INCOME
$83,759
AVG FAMILY INCOME
$68,422
AVG HOUSEHOLD INCOME
31.7%
WAGE / INCOME GAP [ % ]
68.3¢/ $1
WAGE / INCOME GAP [ $ ]
$11,980
FAMILY INCOME DEFICIT
148.53
INEQUALITY / GINI INDEX
889,030
TOTAL POPULATION
451,081
MALE POPULATION
437,949
FEMALE POPULATION
103.00
MALES / 100 FEMALES
97.09
FEMALES / 100 MALES
42.1
MEDIAN AGE
3.2
AVG FAMILY SIZE
2.7
AVG HOUSEHOLD SIZE
441,993
LABOR FORCE [ PEOPLE ]
63.4%
PERCENT IN LABOR FORCE
6.4%
UNEMPLOYMENT RATE
Income in Area Code 605
Income Overview in Area Code 605
Per Capita Income in Area Code 605 is $36,174, while median incomes of families and households are $83,759 and $68,422 respectively.
| Characteristic | Number | Measure |
| Per Capita Income | 889,030 | $36,174 |
| Median Family Income | 218,142 | $83,759 |
| Mean Family Income | 218,142 | $35,971,311 |
| Median Household Income | 350,767 | $68,422 |
| Mean Household Income | 350,767 | $31,770,812 |
| Income Deficit | 218,142 | $11,980 |
| Wage / Income Gap (%) | 889,030 | 31.65% |
| Wage / Income Gap ($) | 889,030 | 68.35¢ per $1 |
| Gini / Inequality Index | 889,030 | 148.53 |
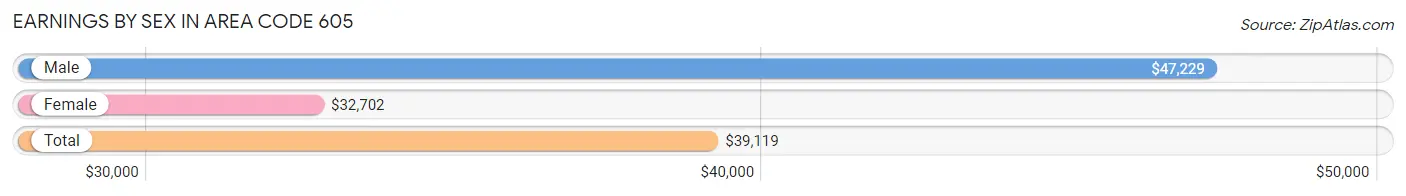
Earnings by Sex in Area Code 605
Average Earnings in Area Code 605 are $39,119, $47,229 for men and $32,702 for women, a difference of 30.8%.
| Sex | Number | Average Earnings |
| Male | 270,346 (53.6%) | $47,229 |
| Female | 234,184 (46.4%) | $32,702 |
| Total | 504,530 (100.0%) | $39,119 |
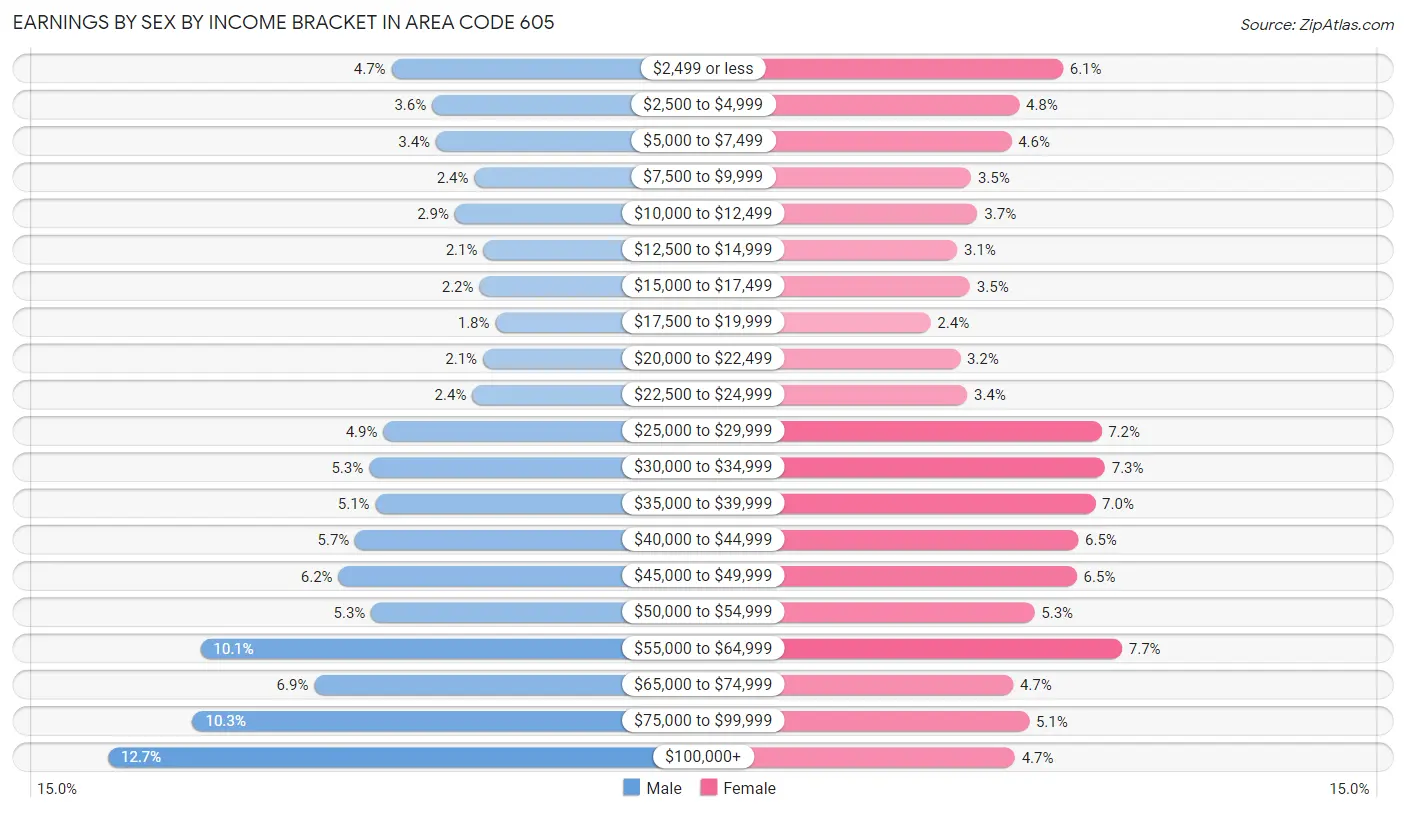
Earnings by Sex by Income Bracket in Area Code 605
The most common earnings brackets in Area Code 605 are $100,000+ for men (34,226 | 12.7%) and $55,000 to $64,999 for women (18,107 | 7.7%).
| Income | Male | Female |
| $2,499 or less | 12,685 (4.7%) | 14,224 (6.1%) |
| $2,500 to $4,999 | 9,588 (3.5%) | 11,340 (4.8%) |
| $5,000 to $7,499 | 9,310 (3.4%) | 10,819 (4.6%) |
| $7,500 to $9,999 | 6,386 (2.4%) | 8,165 (3.5%) |
| $10,000 to $12,499 | 7,874 (2.9%) | 8,593 (3.7%) |
| $12,500 to $14,999 | 5,702 (2.1%) | 7,256 (3.1%) |
| $15,000 to $17,499 | 6,000 (2.2%) | 8,097 (3.5%) |
| $17,500 to $19,999 | 4,792 (1.8%) | 5,493 (2.4%) |
| $20,000 to $22,499 | 5,734 (2.1%) | 7,446 (3.2%) |
| $22,500 to $24,999 | 6,553 (2.4%) | 7,912 (3.4%) |
| $25,000 to $29,999 | 13,311 (4.9%) | 16,750 (7.1%) |
| $30,000 to $34,999 | 14,378 (5.3%) | 16,970 (7.2%) |
| $35,000 to $39,999 | 13,890 (5.1%) | 16,344 (7.0%) |
| $40,000 to $44,999 | 15,431 (5.7%) | 15,215 (6.5%) |
| $45,000 to $49,999 | 16,713 (6.2%) | 15,117 (6.5%) |
| $50,000 to $54,999 | 14,221 (5.3%) | 12,339 (5.3%) |
| $55,000 to $64,999 | 27,206 (10.1%) | 18,107 (7.7%) |
| $65,000 to $74,999 | 18,556 (6.9%) | 10,948 (4.7%) |
| $75,000 to $99,999 | 27,790 (10.3%) | 11,990 (5.1%) |
| $100,000+ | 34,226 (12.7%) | 11,059 (4.7%) |
| Total | 270,346 (100.0%) | 234,184 (100.0%) |
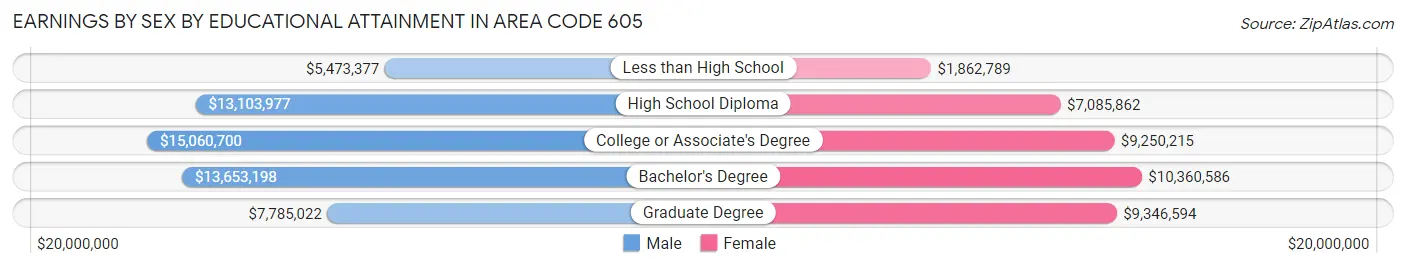
Earnings by Sex by Educational Attainment in Area Code 605
Average earnings in Area Code 605 are $16,819,402 for men and $11,222,206 for women, a difference of 33.3%. Men with an educational attainment of college or associate's degree enjoy the highest average annual earnings of $15,060,700, while those with less than high school education earn the least with $5,473,377. Women with an educational attainment of bachelor's degree earn the most with the average annual earnings of $10,360,586, while those with less than high school education have the smallest earnings of $1,862,789.
| Educational Attainment | Male Income | Female Income |
| Less than High School | $5,473,377 | $1,862,789 |
| High School Diploma | $13,103,977 | $7,085,862 |
| College or Associate's Degree | $15,060,700 | $9,250,215 |
| Bachelor's Degree | $13,653,198 | $10,360,586 |
| Graduate Degree | $7,785,022 | $9,346,594 |
| Total | $16,819,402 | $11,222,206 |
Family Income in Area Code 605
Family Income Brackets in Area Code 605
According to the Area Code 605 family income data, there are 16,829,873 families falling into the $100,000 to $149,999 income range, which is the most common income bracket and makes up 7,715.1% of all families. Conversely, the $10,000 to $14,999 income bracket is the least frequent group with only 1,632,793 families (748.5%) belonging to this category.
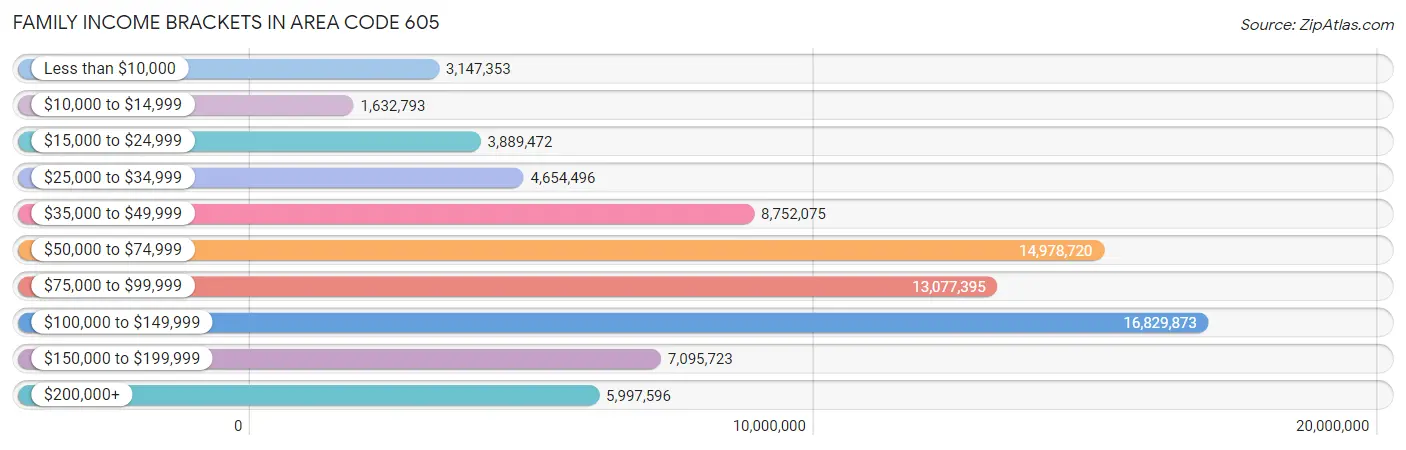
| Income Bracket | # Families | % Families |
| Less than $10,000 | 3,147,353 | 1,442.8% |
| $10,000 to $14,999 | 1,632,793 | 748.5% |
| $15,000 to $24,999 | 3,889,472 | 1,783.0% |
| $25,000 to $34,999 | 4,654,496 | 2,133.7% |
| $35,000 to $49,999 | 8,752,075 | 4,012.1% |
| $50,000 to $74,999 | 14,978,720 | 6,866.5% |
| $75,000 to $99,999 | 13,077,395 | 5,994.9% |
| $100,000 to $149,999 | 16,829,873 | 7,715.1% |
| $150,000 to $199,999 | 7,095,723 | 3,252.8% |
| $200,000+ | 5,997,596 | 2,749.4% |
Family Income by Famaliy Size in Area Code 605
5-person families (19,270 | 8.8%) account for the highest median family income in Area Code 605 with $110,262 per family, while 2-person families (113,111 | 51.8%) have the highest median income of $41,635 per family member.
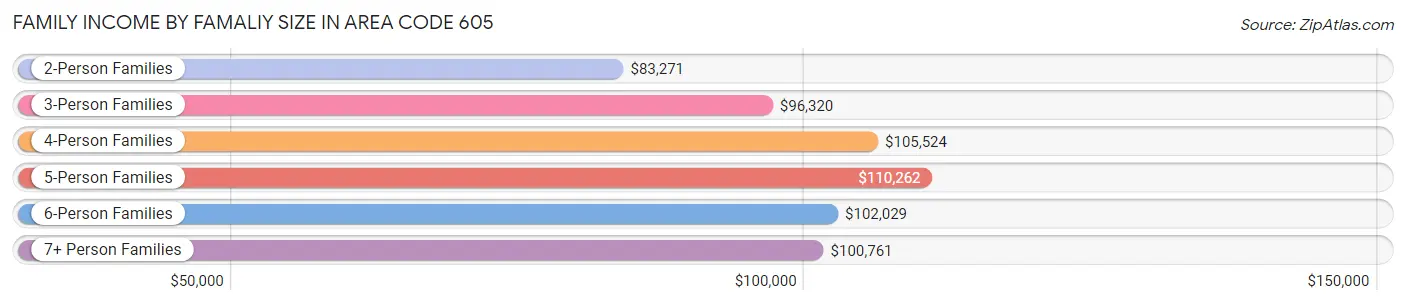
| Income Bracket | # Families | Median Income |
| 2-Person Families | 113,111 (51.8%) | $83,271 |
| 3-Person Families | 39,829 (18.3%) | $96,320 |
| 4-Person Families | 35,278 (16.2%) | $105,524 |
| 5-Person Families | 19,270 (8.8%) | $110,262 |
| 6-Person Families | 6,574 (3.0%) | $102,029 |
| 7+ Person Families | 4,080 (1.9%) | $100,761 |
| Total | 218,142 (100.0%) | $83,759 |
Family Income by Number of Earners in Area Code 605
The median family income in Area Code 605 is $83,759, with families comprising 3+ earners (24,475) having the highest median family income of $137,602, while families with no earners (29,193) have the lowest median family income of $52,340, accounting for 11.2% and 13.4% of families, respectively.
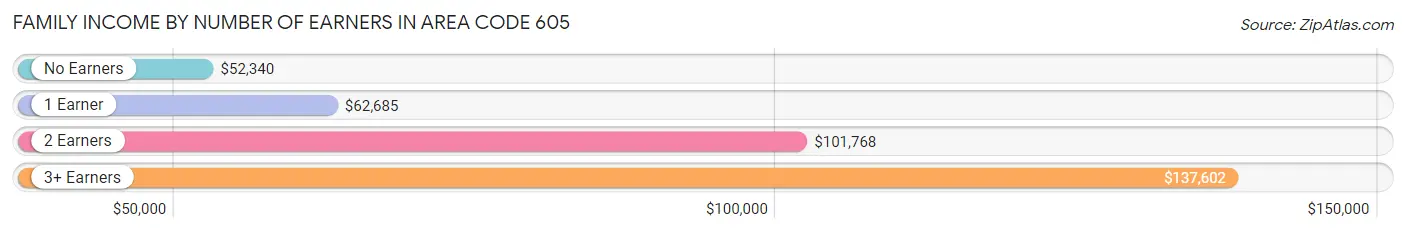
| Number of Earners | # Families | Median Income |
| No Earners | 29,193 (13.4%) | $52,340 |
| 1 Earner | 58,817 (27.0%) | $62,685 |
| 2 Earners | 105,657 (48.4%) | $101,768 |
| 3+ Earners | 24,475 (11.2%) | $137,602 |
| Total | 218,142 (100.0%) | $83,759 |
Household Income in Area Code 605
Household Income Brackets in Area Code 605
With 24,007,897 households falling in the category, the $50,000 to $74,999 income range is the most frequent in Area Code 605, accounting for 6,844.4% of all households. In contrast, only 5,265,714 households (1,501.2%) fall into the $10,000 to $14,999 income bracket, making it the least populous group.
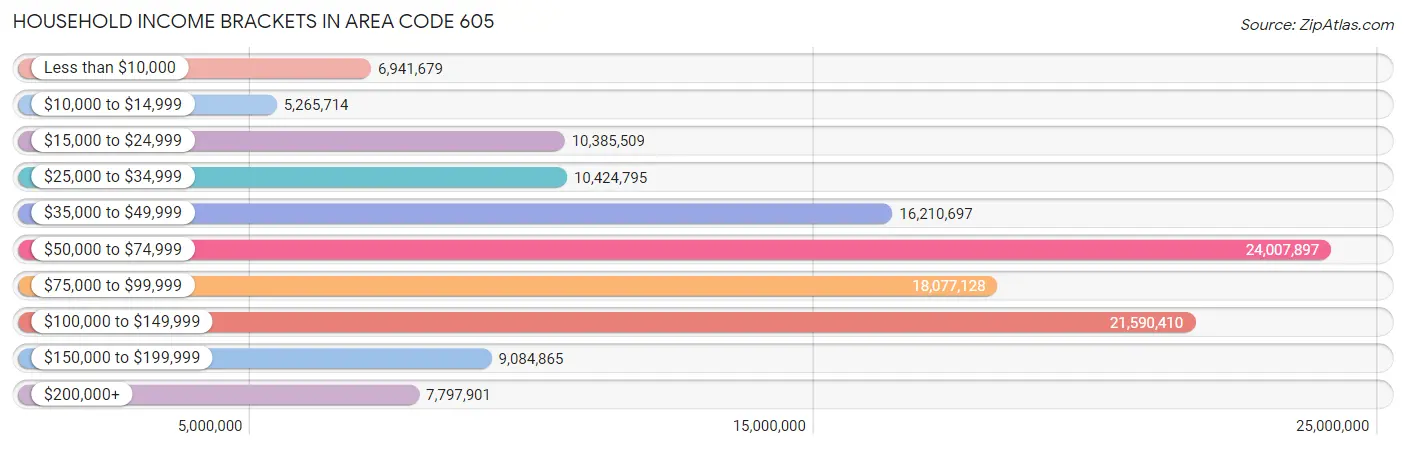
| Income Bracket | # Households | % Households |
| Less than $10,000 | 6,941,679 | 1,979.0% |
| $10,000 to $14,999 | 5,265,714 | 1,501.2% |
| $15,000 to $24,999 | 10,385,509 | 2,960.8% |
| $25,000 to $34,999 | 10,424,795 | 2,972.0% |
| $35,000 to $49,999 | 16,210,697 | 4,621.5% |
| $50,000 to $74,999 | 24,007,897 | 6,844.4% |
| $75,000 to $99,999 | 18,077,128 | 5,153.6% |
| $100,000 to $149,999 | 21,590,410 | 6,155.2% |
| $150,000 to $199,999 | 9,084,865 | 2,590.0% |
| $200,000+ | 7,797,901 | 2,223.1% |
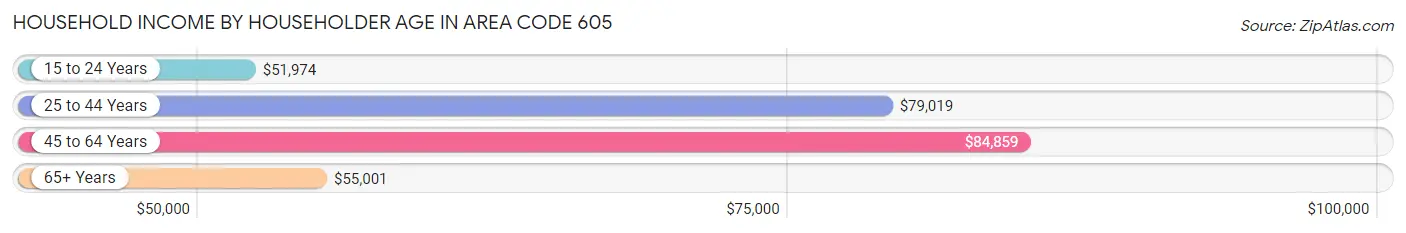
Household Income by Householder Age in Area Code 605
The median household income in Area Code 605 is $68,422, with the highest median household income of $84,859 found in the 45 to 64 years age bracket for the primary householder. A total of 119,386 households (34.0%) fall into this category. Meanwhile, the 15 to 24 years age bracket for the primary householder has the lowest median household income of $51,974, with 21,491 households (6.1%) in this group.
| Income Bracket | # Households | Median Income |
| 15 to 24 Years | 21,491 (6.1%) | $51,974 |
| 25 to 44 Years | 113,843 (32.5%) | $79,019 |
| 45 to 64 Years | 119,386 (34.0%) | $84,859 |
| 65+ Years | 96,047 (27.4%) | $55,001 |
| Total | 350,767 (100.0%) | $68,422 |
Poverty in Area Code 605
Income Below Poverty by Sex and Age in Area Code 605
With 11.0% poverty level for males and 13.5% for females among the residents of Area Code 605, 5 year old males and 18 to 24 year old females are the most vulnerable to poverty, with 1,177 males (19.7%) and 10,064 females (28.1%) in their respective age groups living below the poverty level.
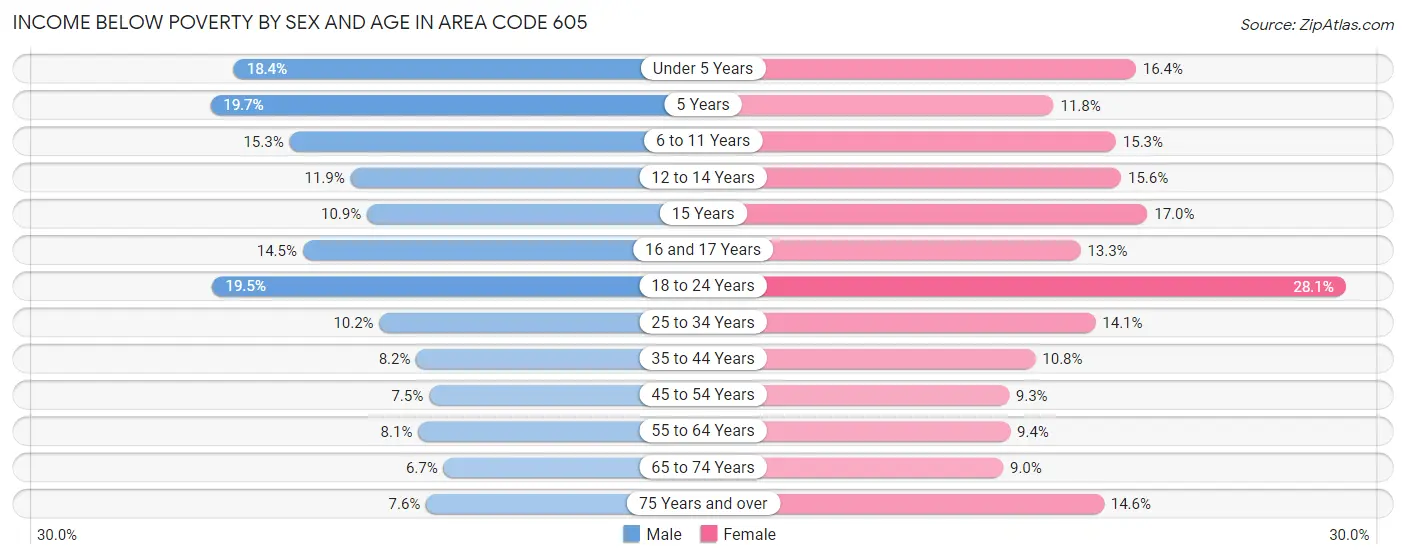
| Age Bracket | Male | Female |
| Under 5 Years | 5,270 (18.3%) | 4,619 (16.4%) |
| 5 Years | 1,177 (19.7%) | 670 (11.8%) |
| 6 to 11 Years | 5,572 (15.2%) | 5,300 (15.3%) |
| 12 to 14 Years | 2,193 (11.8%) | 2,805 (15.5%) |
| 15 Years | 683 (10.9%) | 906 (17.0%) |
| 16 and 17 Years | 1,701 (14.5%) | 1,582 (13.3%) |
| 18 to 24 Years | 7,429 (19.5%) | 10,064 (28.1%) |
| 25 to 34 Years | 5,915 (10.2%) | 7,561 (14.1%) |
| 35 to 44 Years | 4,579 (8.2%) | 5,583 (10.8%) |
| 45 to 54 Years | 3,621 (7.5%) | 4,249 (9.3%) |
| 55 to 64 Years | 4,663 (8.1%) | 5,334 (9.4%) |
| 65 to 74 Years | 3,054 (6.7%) | 4,029 (9.0%) |
| 75 Years and over | 1,804 (7.6%) | 4,683 (14.6%) |
| Total | 47,661 (11.0%) | 57,385 (13.5%) |
Income Above Poverty by Sex and Age in Area Code 605
According to the poverty statistics in Area Code 605, males aged 65 to 74 years and females aged 65 to 74 years are the age groups that are most secure financially, with 93.3% of males and 91.0% of females in these age groups living above the poverty line.
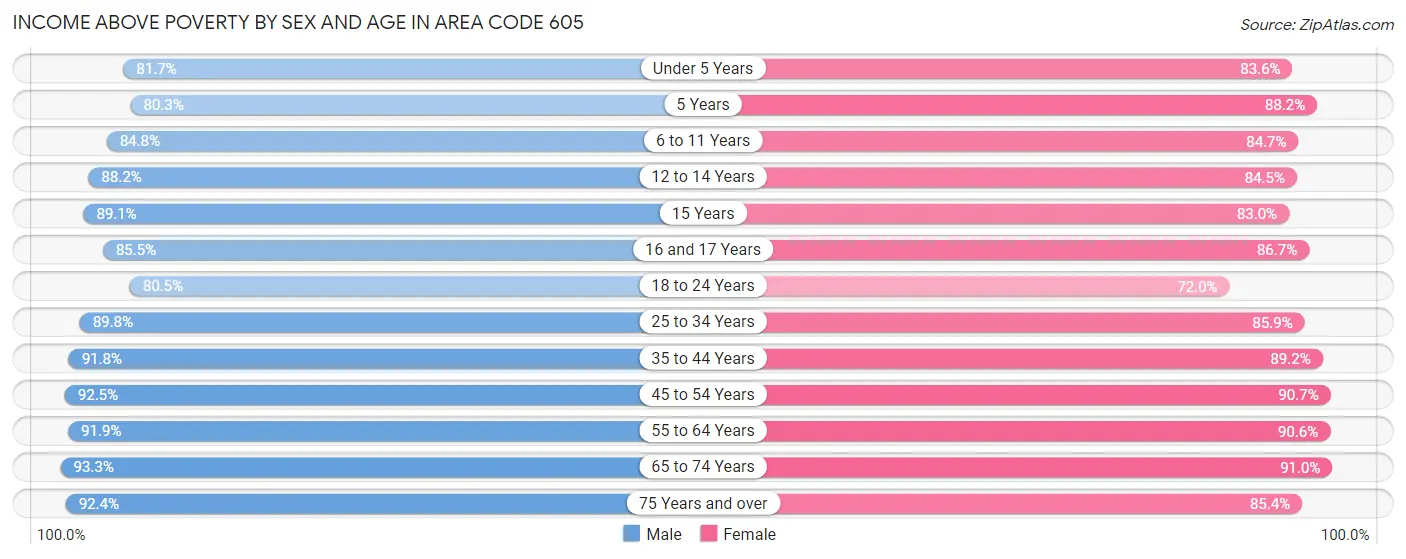
| Age Bracket | Male | Female |
| Under 5 Years | 23,453 (81.7%) | 23,590 (83.6%) |
| 5 Years | 4,809 (80.3%) | 5,012 (88.2%) |
| 6 to 11 Years | 30,954 (84.8%) | 29,440 (84.7%) |
| 12 to 14 Years | 16,315 (88.1%) | 15,229 (84.5%) |
| 15 Years | 5,563 (89.1%) | 4,420 (83.0%) |
| 16 and 17 Years | 10,018 (85.5%) | 10,324 (86.7%) |
| 18 to 24 Years | 30,607 (80.5%) | 25,815 (72.0%) |
| 25 to 34 Years | 51,840 (89.8%) | 45,997 (85.9%) |
| 35 to 44 Years | 51,341 (91.8%) | 46,201 (89.2%) |
| 45 to 54 Years | 44,807 (92.5%) | 41,416 (90.7%) |
| 55 to 64 Years | 53,053 (91.9%) | 51,592 (90.6%) |
| 65 to 74 Years | 42,708 (93.3%) | 40,830 (91.0%) |
| 75 Years and over | 21,808 (92.4%) | 27,414 (85.4%) |
| Total | 387,276 (89.0%) | 367,280 (86.5%) |
Income Below Poverty Among Married-Couple Families in Area Code 605
The poverty statistics for married-couple families in Area Code 605 show that 3.4% or 5,772 of the total 172,250 families live below the poverty line. Families with 5 or more children have the highest poverty rate of 20.4%, comprising of 412 families. On the other hand, families with 1 or 2 children have the lowest poverty rate of 2.5%, which includes 1,231 families.
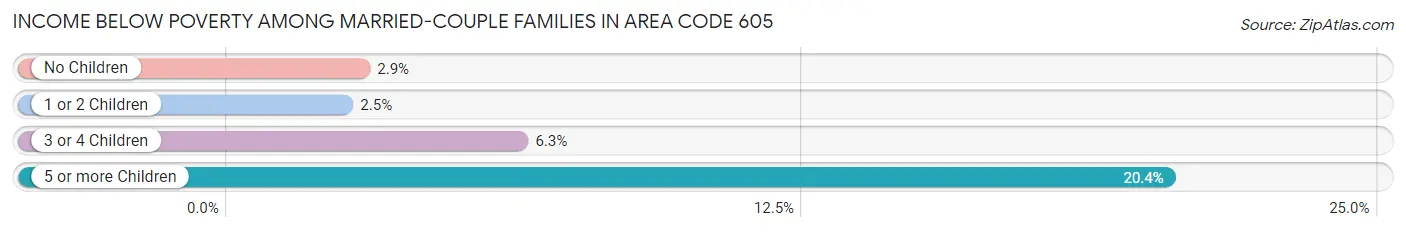
| Children | Above Poverty | Below Poverty |
| No Children | 99,632 (97.1%) | 2,953 (2.9%) |
| 1 or 2 Children | 47,811 (97.5%) | 1,231 (2.5%) |
| 3 or 4 Children | 17,427 (93.7%) | 1,176 (6.3%) |
| 5 or more Children | 1,608 (79.6%) | 412 (20.4%) |
| Total | 166,478 (96.7%) | 5,772 (3.4%) |
Income Below Poverty Among Single-Parent Households in Area Code 605
According to the poverty data in Area Code 605, 13.1% or 2,126 single-father households and 28.5% or 8,446 single-mother households are living below the poverty line. Among single-father households, those with 5 or more children have the highest poverty rate, with 63 households (40.9%) experiencing poverty. Likewise, among single-mother households, those with 5 or more children have the highest poverty rate, with 614 households (77.2%) falling below the poverty line.
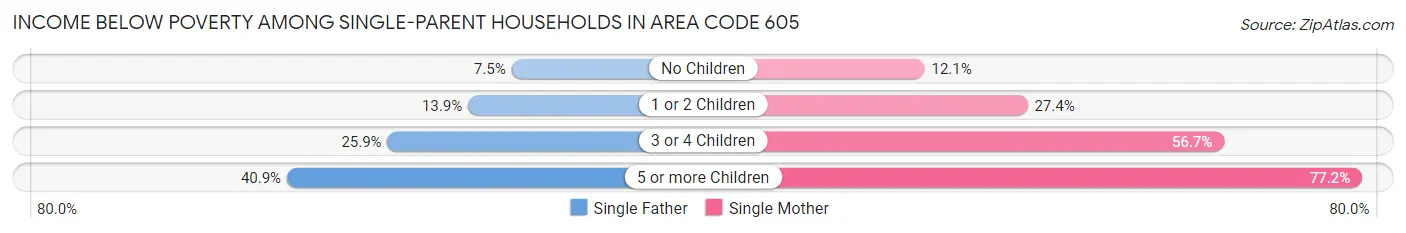
| Children | Single Father | Single Mother |
| No Children | 438 (7.4%) | 997 (12.0%) |
| 1 or 2 Children | 1,187 (13.9%) | 4,516 (27.4%) |
| 3 or 4 Children | 438 (25.9%) | 2,319 (56.7%) |
| 5 or more Children | 63 (40.9%) | 614 (77.2%) |
| Total | 2,126 (13.1%) | 8,446 (28.5%) |
Income Below Poverty Among Married-Couple vs Single-Parent Households in Area Code 605
The poverty data for Area Code 605 shows that 5,772 of the married-couple family households (3.4%) and 10,572 of the single-parent households (23.0%) are living below the poverty level. Within the married-couple family households, those with 5 or more children have the highest poverty rate, with 412 households (20.4%) falling below the poverty line. Among the single-parent households, those with 5 or more children have the highest poverty rate, with 677 household (71.3%) living below poverty.
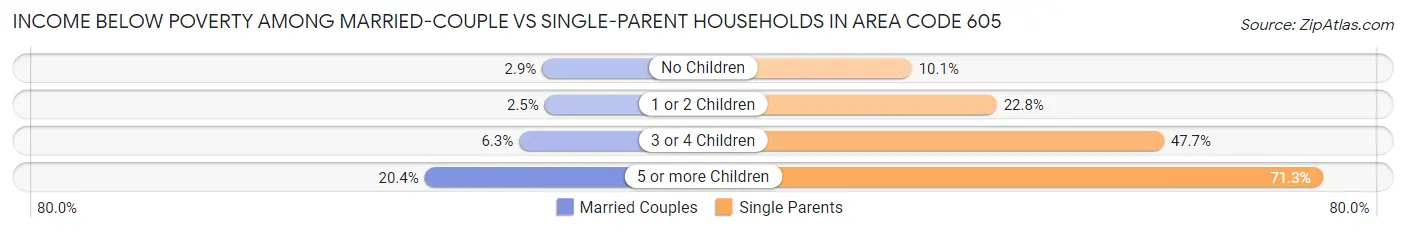
| Children | Married-Couple Families | Single-Parent Households |
| No Children | 2,953 (2.9%) | 1,435 (10.1%) |
| 1 or 2 Children | 1,231 (2.5%) | 5,703 (22.8%) |
| 3 or 4 Children | 1,176 (6.3%) | 2,757 (47.7%) |
| 5 or more Children | 412 (20.4%) | 677 (71.3%) |
| Total | 5,772 (3.4%) | 10,572 (23.0%) |
Race in Area Code 605
The most populous races in Area Code 605 are White / Caucasian (730,900 | 82.2%), Native / Alaskan (70,362 | 7.9%), and Two or more Races (44,434 | 5.0%).
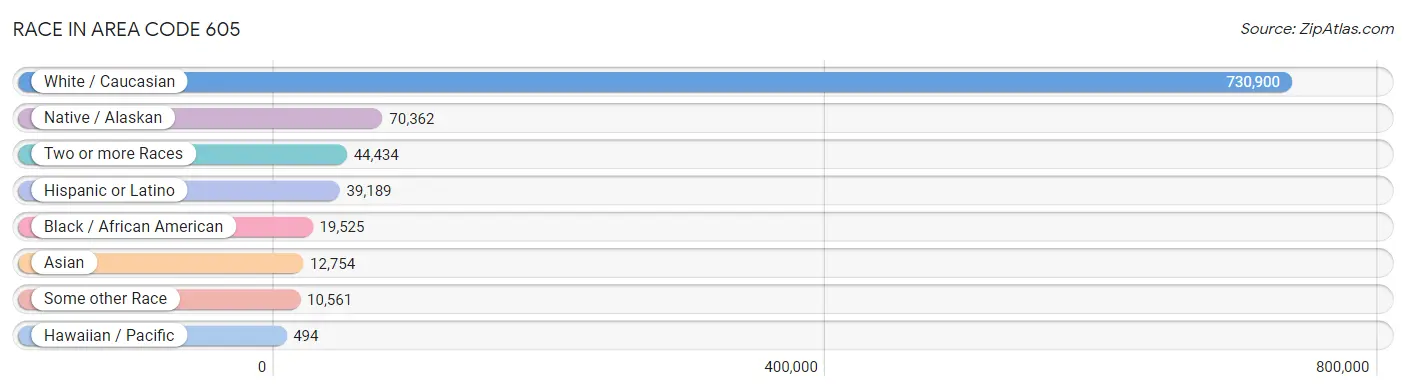
| Race | # Population | % Population |
| Asian | 12,754 | 1.4% |
| Black / African American | 19,525 | 2.2% |
| Hawaiian / Pacific | 494 | 0.1% |
| Hispanic or Latino | 39,189 | 4.4% |
| Native / Alaskan | 70,362 | 7.9% |
| White / Caucasian | 730,900 | 82.2% |
| Two or more Races | 44,434 | 5.0% |
| Some other Race | 10,561 | 1.2% |
| Total | 889,030 | 100.0% |
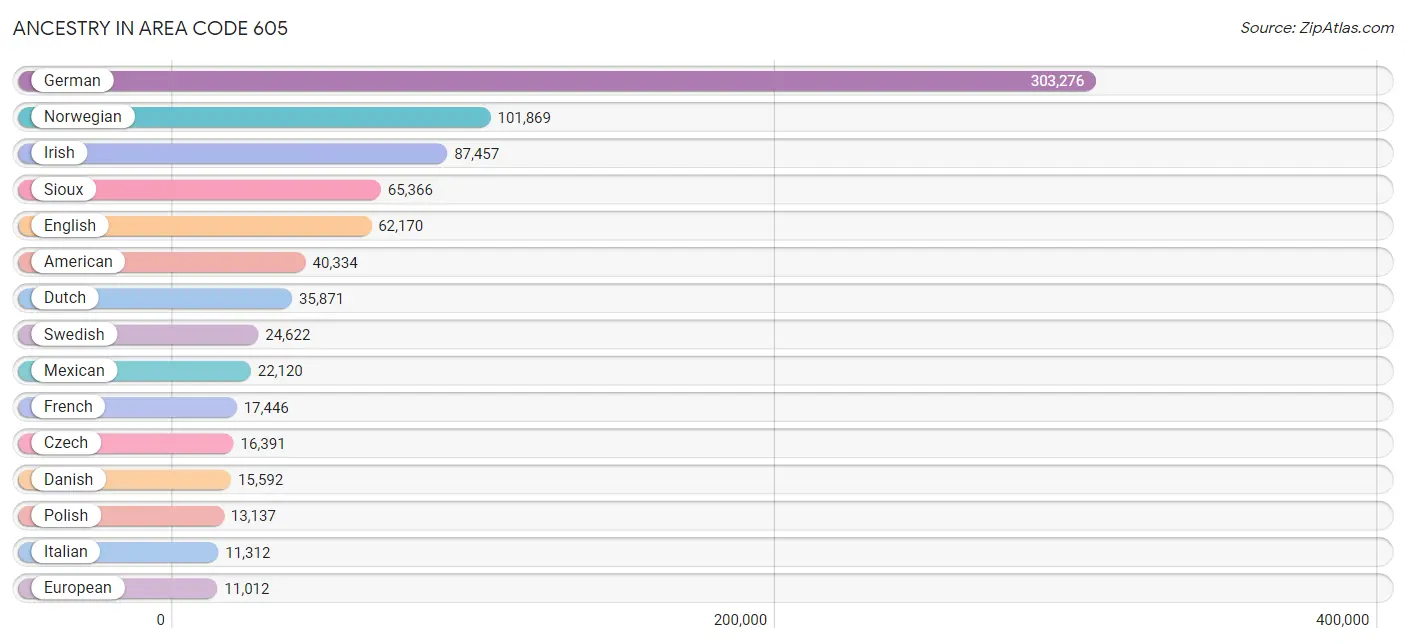
Ancestry in Area Code 605
The most populous ancestries reported in Area Code 605 are German (303,276 | 34.1%), Norwegian (101,869 | 11.5%), Irish (87,457 | 9.8%), Sioux (65,366 | 7.3%), and English (62,170 | 7.0%), together accounting for 69.8% of all Area Code 605 residents.
| Ancestry | # Population | % Population |
| Afghan | 166 | 0.0% |
| African | 3,001 | 0.3% |
| Alaska Native | 114 | 0.0% |
| Alaskan Athabascan | 14 | 0.0% |
| Albanian | 267 | 0.0% |
| Aleut | 13 | 0.0% |
| Alsatian | 49 | 0.0% |
| American | 40,334 | 4.5% |
| Apache | 218 | 0.0% |
| Arab | 1,994 | 0.2% |
| Arapaho | 296 | 0.0% |
| Argentinean | 63 | 0.0% |
| Armenian | 114 | 0.0% |
| Australian | 28 | 0.0% |
| Austrian | 1,558 | 0.2% |
| Bahamian | 13 | 0.0% |
| Bangladeshi | 403 | 0.1% |
| Barbadian | 21 | 0.0% |
| Basque | 110 | 0.0% |
| Belgian | 1,592 | 0.2% |
| Belizean | 6 | 0.0% |
| Bermudan | 51 | 0.0% |
| Bhutanese | 1,308 | 0.2% |
| Blackfeet | 310 | 0.0% |
| Bolivian | 53 | 0.0% |
| Brazilian | 306 | 0.0% |
| British | 2,497 | 0.3% |
| British West Indian | 15 | 0.0% |
| Bulgarian | 61 | 0.0% |
| Burmese | 1,869 | 0.2% |
| Cajun | 15 | 0.0% |
| Cambodian | 16 | 0.0% |
| Canadian | 982 | 0.1% |
| Carpatho Rusyn | 14 | 0.0% |
| Celtic | 131 | 0.0% |
| Central American | 6,938 | 0.8% |
| Central American Indian | 123 | 0.0% |
| Cherokee | 1,290 | 0.2% |
| Cheyenne | 675 | 0.1% |
| Chickasaw | 10 | 0.0% |
| Chilean | 329 | 0.0% |
| Chippewa | 1,204 | 0.1% |
| Choctaw | 340 | 0.0% |
| Colombian | 227 | 0.0% |
| Comanche | 15 | 0.0% |
| Costa Rican | 38 | 0.0% |
| Cree | 8 | 0.0% |
| Creek | 86 | 0.0% |
| Croatian | 413 | 0.1% |
| Crow | 198 | 0.0% |
| Cuban | 871 | 0.1% |
| Cypriot | 6 | 0.0% |
| Czech | 16,391 | 1.8% |
| Czechoslovakian | 1,202 | 0.1% |
| Danish | 15,592 | 1.8% |
| Dominican | 466 | 0.1% |
| Dutch | 35,871 | 4.0% |
| Dutch West Indian | 2 | 0.0% |
| Eastern European | 1,026 | 0.1% |
| Ecuadorian | 27 | 0.0% |
| Egyptian | 228 | 0.0% |
| English | 62,170 | 7.0% |
| Estonian | 64 | 0.0% |
| Ethiopian | 3,212 | 0.4% |
| European | 11,012 | 1.2% |
| Fijian | 29 | 0.0% |
| Filipino | 4 | 0.0% |
| Finnish | 4,202 | 0.5% |
| French | 17,446 | 2.0% |
| French American Indian | 124 | 0.0% |
| French Canadian | 3,204 | 0.4% |
| German | 303,276 | 34.1% |
| German Russian | 397 | 0.0% |
| Ghanaian | 81 | 0.0% |
| Greek | 1,225 | 0.1% |
| Guamanian / Chamorro | 209 | 0.0% |
| Guatemalan | 3,873 | 0.4% |
| Guyanese | 33 | 0.0% |
| Haitian | 334 | 0.0% |
| Honduran | 399 | 0.0% |
| Hopi | 4 | 0.0% |
| Hungarian | 1,099 | 0.1% |
| Icelander | 348 | 0.0% |
| Indian (Asian) | 1,784 | 0.2% |
| Indonesian | 1,507 | 0.2% |
| Inupiat | 65 | 0.0% |
| Iranian | 76 | 0.0% |
| Iraqi | 143 | 0.0% |
| Irish | 87,457 | 9.8% |
| Iroquois | 277 | 0.0% |
| Israeli | 12 | 0.0% |
| Italian | 11,312 | 1.3% |
| Jamaican | 193 | 0.0% |
| Japanese | 218 | 0.0% |
| Jordanian | 13 | 0.0% |
| Kenyan | 43 | 0.0% |
| Kiowa | 5 | 0.0% |
| Korean | 3,893 | 0.4% |
| Laotian | 94 | 0.0% |
| Latvian | 157 | 0.0% |
| Lebanese | 708 | 0.1% |
| Liberian | 978 | 0.1% |
| Lithuanian | 422 | 0.1% |
| Lumbee | 6 | 0.0% |
| Luxembourger | 540 | 0.1% |
| Macedonian | 9 | 0.0% |
| Malaysian | 343 | 0.0% |
| Maltese | 14 | 0.0% |
| Menominee | 32 | 0.0% |
| Mexican | 22,120 | 2.5% |
| Mexican American Indian | 402 | 0.1% |
| Mongolian | 7 | 0.0% |
| Moroccan | 39 | 0.0% |
| Native Hawaiian | 445 | 0.1% |
| Navajo | 415 | 0.1% |
| New Zealander | 17 | 0.0% |
| Nicaraguan | 503 | 0.1% |
| Nigerian | 122 | 0.0% |
| Northern European | 1,510 | 0.2% |
| Norwegian | 101,869 | 11.5% |
| Okinawan | 28 | 0.0% |
| Ottawa | 9 | 0.0% |
| Paiute | 18 | 0.0% |
| Pakistani | 673 | 0.1% |
| Palestinian | 52 | 0.0% |
| Panamanian | 19 | 0.0% |
| Paraguayan | 1 | 0.0% |
| Pennsylvania German | 558 | 0.1% |
| Peruvian | 272 | 0.0% |
| Pima | 24 | 0.0% |
| Polish | 13,137 | 1.5% |
| Portuguese | 775 | 0.1% |
| Potawatomi | 48 | 0.0% |
| Pueblo | 72 | 0.0% |
| Puerto Rican | 3,791 | 0.4% |
| Puget Sound Salish | 56 | 0.0% |
| Romanian | 261 | 0.0% |
| Russian | 8,529 | 1.0% |
| Salvadoran | 2,105 | 0.2% |
| Samoan | 87 | 0.0% |
| Scandinavian | 9,233 | 1.0% |
| Scotch-Irish | 4,788 | 0.5% |
| Scottish | 9,608 | 1.1% |
| Seminole | 65 | 0.0% |
| Serbian | 247 | 0.0% |
| Shoshone | 37 | 0.0% |
| Sioux | 65,366 | 7.3% |
| Slavic | 175 | 0.0% |
| Slovak | 578 | 0.1% |
| Slovene | 118 | 0.0% |
| Somali | 918 | 0.1% |
| South African | 236 | 0.0% |
| South American | 1,025 | 0.1% |
| South American Indian | 22 | 0.0% |
| Spaniard | 660 | 0.1% |
| Spanish | 1,231 | 0.1% |
| Spanish American | 8 | 0.0% |
| Spanish American Indian | 7 | 0.0% |
| Sri Lankan | 1,286 | 0.1% |
| Subsaharan African | 9,945 | 1.1% |
| Sudanese | 767 | 0.1% |
| Swedish | 24,622 | 2.8% |
| Swiss | 2,962 | 0.3% |
| Syrian | 111 | 0.0% |
| Thai | 2,705 | 0.3% |
| Tlingit-Haida | 37 | 0.0% |
| Tohono O'Odham | 42 | 0.0% |
| Tongan | 12 | 0.0% |
| Turkish | 117 | 0.0% |
| U.S. Virgin Islander | 2 | 0.0% |
| Ugandan | 24 | 0.0% |
| Ukrainian | 2,180 | 0.3% |
| Ute | 50 | 0.0% |
| Venezuelan | 53 | 0.0% |
| Vietnamese | 28 | 0.0% |
| Welsh | 3,873 | 0.4% |
| West Indian | 484 | 0.1% |
| Yaqui | 12 | 0.0% |
| Yugoslavian | 692 | 0.1% |
| Yuman | 32 | 0.0% | View All 180 Rows |
Immigrants in Area Code 605
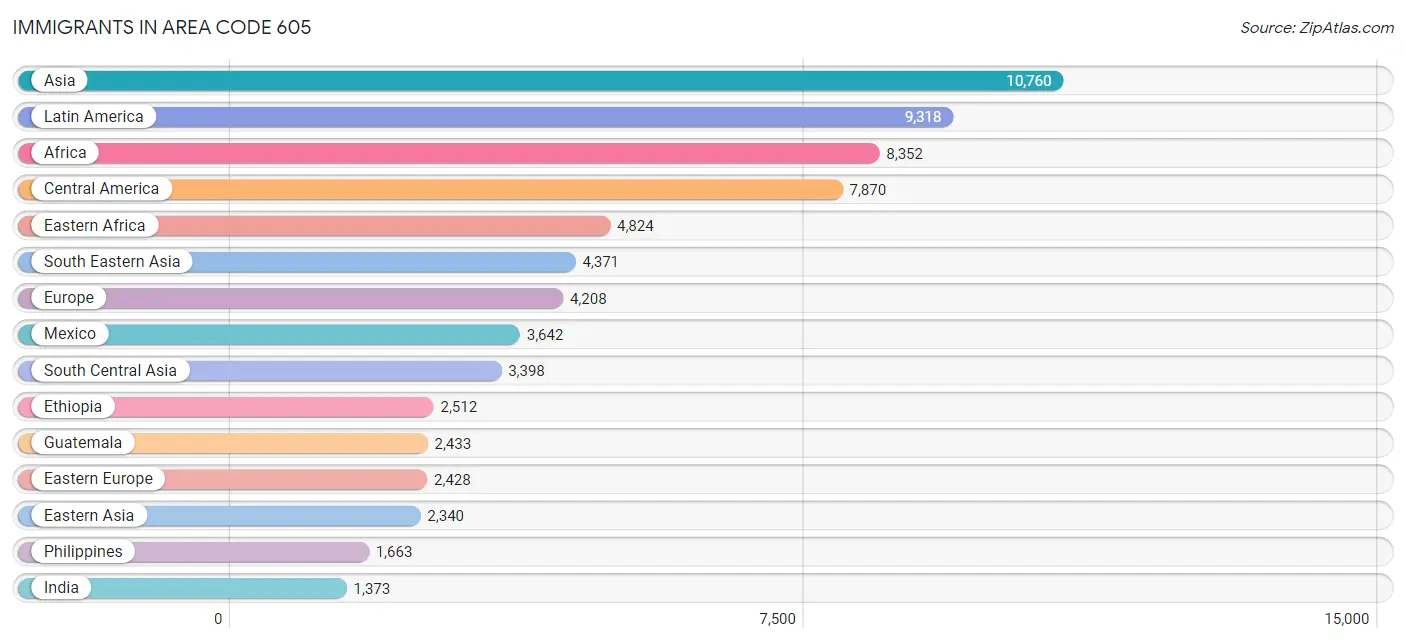
The most numerous immigrant groups reported in Area Code 605 came from Asia (10,760 | 1.2%), Latin America (9,318 | 1.1%), Africa (8,352 | 0.9%), Central America (7,870 | 0.9%), and Eastern Africa (4,824 | 0.5%), together accounting for 4.6% of all Area Code 605 residents.
| Immigration Origin | # Population | % Population |
| Afghanistan | 114 | 0.0% |
| Africa | 8,352 | 0.9% |
| Albania | 130 | 0.0% |
| Argentina | 6 | 0.0% |
| Armenia | 2 | 0.0% |
| Asia | 10,760 | 1.2% |
| Australia | 17 | 0.0% |
| Austria | 12 | 0.0% |
| Bahamas | 9 | 0.0% |
| Bangladesh | 134 | 0.0% |
| Belarus | 103 | 0.0% |
| Belgium | 11 | 0.0% |
| Belize | 22 | 0.0% |
| Bolivia | 18 | 0.0% |
| Bosnia and Herzegovina | 91 | 0.0% |
| Brazil | 116 | 0.0% |
| Cambodia | 192 | 0.0% |
| Cameroon | 2 | 0.0% |
| Canada | 1,119 | 0.1% |
| Caribbean | 829 | 0.1% |
| Central America | 7,870 | 0.9% |
| Chile | 130 | 0.0% |
| China | 970 | 0.1% |
| Colombia | 86 | 0.0% |
| Congo | 405 | 0.1% |
| Costa Rica | 12 | 0.0% |
| Croatia | 119 | 0.0% |
| Cuba | 304 | 0.0% |
| Czechoslovakia | 79 | 0.0% |
| Denmark | 24 | 0.0% |
| Dominican Republic | 208 | 0.0% |
| Eastern Africa | 4,824 | 0.5% |
| Eastern Asia | 2,340 | 0.3% |
| Eastern Europe | 2,428 | 0.3% |
| Ecuador | 113 | 0.0% |
| Egypt | 325 | 0.0% |
| El Salvador | 1,337 | 0.2% |
| England | 365 | 0.0% |
| Eritrea | 975 | 0.1% |
| Ethiopia | 2,512 | 0.3% |
| Europe | 4,208 | 0.5% |
| Fiji | 5 | 0.0% |
| France | 49 | 0.0% |
| Germany | 624 | 0.1% |
| Ghana | 81 | 0.0% |
| Greece | 13 | 0.0% |
| Guatemala | 2,433 | 0.3% |
| Haiti | 75 | 0.0% |
| Honduras | 205 | 0.0% |
| Hong Kong | 32 | 0.0% |
| Hungary | 7 | 0.0% |
| India | 1,373 | 0.2% |
| Indonesia | 49 | 0.0% |
| Iran | 48 | 0.0% |
| Iraq | 393 | 0.0% |
| Ireland | 9 | 0.0% |
| Israel | 13 | 0.0% |
| Italy | 24 | 0.0% |
| Jamaica | 111 | 0.0% |
| Japan | 474 | 0.1% |
| Jordan | 13 | 0.0% |
| Kazakhstan | 25 | 0.0% |
| Kenya | 152 | 0.0% |
| Korea | 896 | 0.1% |
| Laos | 221 | 0.0% |
| Latin America | 9,318 | 1.1% |
| Latvia | 5 | 0.0% |
| Lebanon | 105 | 0.0% |
| Liberia | 978 | 0.1% |
| Malaysia | 36 | 0.0% |
| Mexico | 3,642 | 0.4% |
| Middle Africa | 1,079 | 0.1% |
| Moldova | 30 | 0.0% |
| Morocco | 37 | 0.0% |
| Nepal | 1,180 | 0.1% |
| Netherlands | 134 | 0.0% |
| Nicaragua | 126 | 0.0% |
| Nigeria | 152 | 0.0% |
| Northern Africa | 721 | 0.1% |
| Northern Europe | 750 | 0.1% |
| Norway | 35 | 0.0% |
| Oceania | 327 | 0.0% |
| Pakistan | 75 | 0.0% |
| Panama | 91 | 0.0% |
| Peru | 125 | 0.0% |
| Philippines | 1,663 | 0.2% |
| Poland | 49 | 0.0% |
| Portugal | 29 | 0.0% |
| Romania | 24 | 0.0% |
| Russia | 199 | 0.0% |
| Scotland | 63 | 0.0% |
| Serbia | 21 | 0.0% |
| Singapore | 20 | 0.0% |
| Somalia | 455 | 0.1% |
| South Africa | 346 | 0.0% |
| South America | 619 | 0.1% |
| South Central Asia | 3,398 | 0.4% |
| South Eastern Asia | 4,371 | 0.5% |
| Southern Europe | 166 | 0.0% |
| Spain | 70 | 0.0% |
| St. Vincent and the Grenadines | 61 | 0.0% |
| Sudan | 257 | 0.0% |
| Sweden | 36 | 0.0% |
| Switzerland | 34 | 0.0% |
| Taiwan | 33 | 0.0% |
| Thailand | 847 | 0.1% |
| Turkey | 37 | 0.0% |
| Uganda | 73 | 0.0% |
| Ukraine | 1,241 | 0.1% |
| Uzbekistan | 13 | 0.0% |
| Venezuela | 21 | 0.0% |
| Vietnam | 510 | 0.1% |
| Western Africa | 1,349 | 0.2% |
| Western Asia | 632 | 0.1% |
| Western Europe | 864 | 0.1% |
| Zaire | 672 | 0.1% |
| Zimbabwe | 18 | 0.0% | View All 117 Rows |
Sex and Age in Area Code 605
Sex and Age in Area Code 605
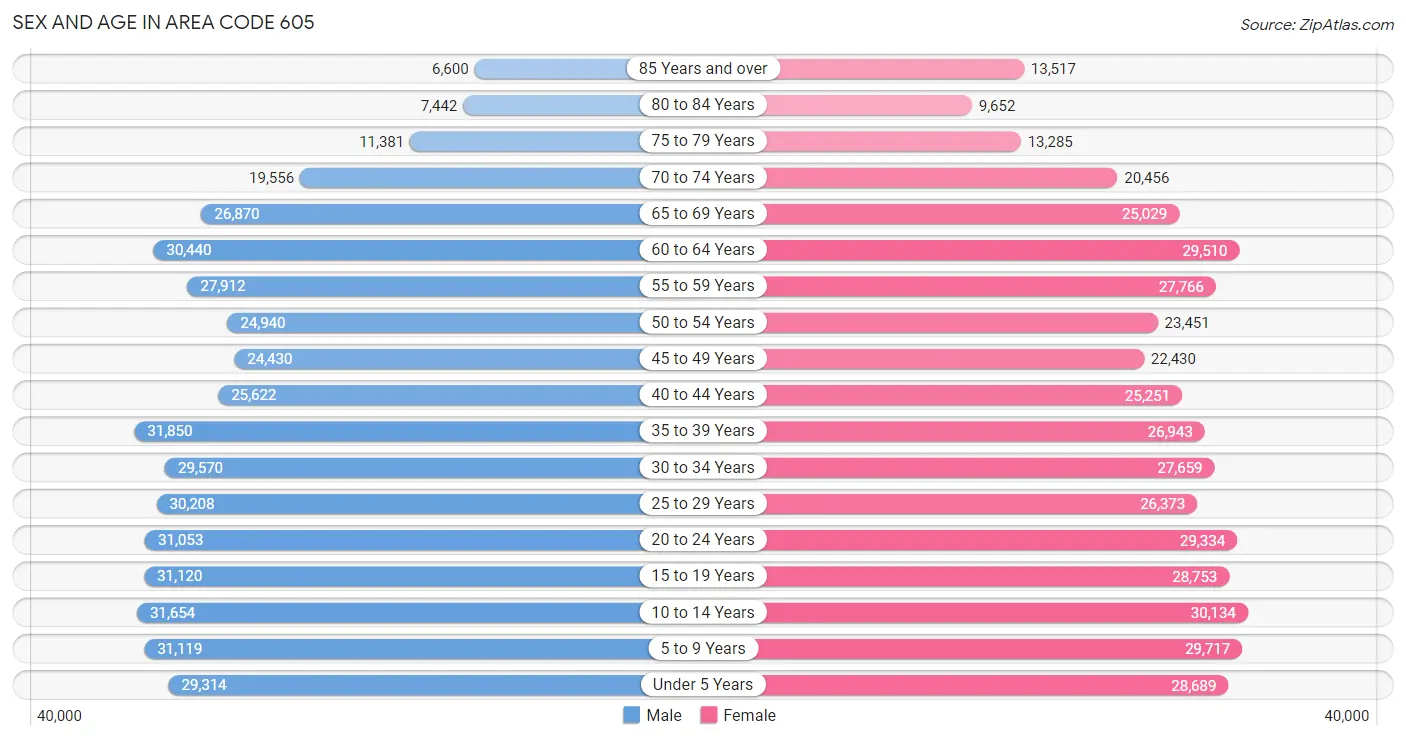
The most populous age groups in Area Code 605 are 35 to 39 Years (31,850 | 7.1%) for men and 10 to 14 Years (30,134 | 6.9%) for women.
| Age Bracket | Male | Female |
| Under 5 Years | 29,314 (6.5%) | 28,689 (6.6%) |
| 5 to 9 Years | 31,119 (6.9%) | 29,717 (6.8%) |
| 10 to 14 Years | 31,654 (7.0%) | 30,134 (6.9%) |
| 15 to 19 Years | 31,120 (6.9%) | 28,753 (6.6%) |
| 20 to 24 Years | 31,053 (6.9%) | 29,334 (6.7%) |
| 25 to 29 Years | 30,208 (6.7%) | 26,373 (6.0%) |
| 30 to 34 Years | 29,570 (6.6%) | 27,659 (6.3%) |
| 35 to 39 Years | 31,850 (7.1%) | 26,943 (6.1%) |
| 40 to 44 Years | 25,622 (5.7%) | 25,251 (5.8%) |
| 45 to 49 Years | 24,430 (5.4%) | 22,430 (5.1%) |
| 50 to 54 Years | 24,940 (5.5%) | 23,451 (5.3%) |
| 55 to 59 Years | 27,912 (6.2%) | 27,766 (6.3%) |
| 60 to 64 Years | 30,440 (6.8%) | 29,510 (6.7%) |
| 65 to 69 Years | 26,870 (6.0%) | 25,029 (5.7%) |
| 70 to 74 Years | 19,556 (4.3%) | 20,456 (4.7%) |
| 75 to 79 Years | 11,381 (2.5%) | 13,285 (3.0%) |
| 80 to 84 Years | 7,442 (1.7%) | 9,652 (2.2%) |
| 85 Years and over | 6,600 (1.5%) | 13,517 (3.1%) |
| Total | 451,081 (100.0%) | 437,949 (100.0%) |
Families and Households in Area Code 605
Median Family Size in Area Code 605
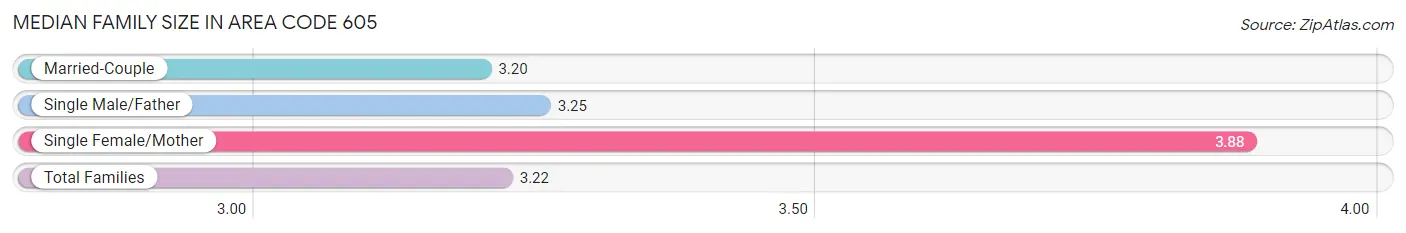
The median family size in Area Code 605 is 3.22 persons per family, with single female/mother families (29,650 | 13.6%) accounting for the largest median family size of 3.88353 persons per family. On the other hand, married-couple families (172,250 | 79.0%) represent the smallest median family size with 3.20 persons per family.
| Family Type | # Families | Family Size |
| Married-Couple | 172,250 (79.0%) | 3.20 |
| Single Male/Father | 16,242 (7.4%) | 3.25 |
| Single Female/Mother | 29,650 (13.6%) | 3.88 |
| Total Families | 218,142 (100.0%) | 3.22 |
Median Household Size in Area Code 605
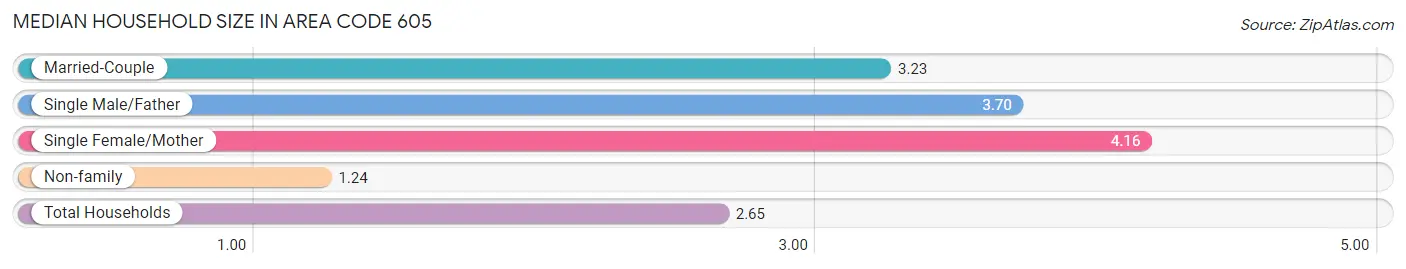
The median household size in Area Code 605 is 2.65 persons per household, with single female/mother households (29,650 | 8.5%) accounting for the largest median household size of 4.16277 persons per household. non-family households (132,625 | 37.8%) represent the smallest median household size with 1.24 persons per household.
| Household Type | # Households | Household Size |
| Married-Couple | 172,250 (49.1%) | 3.23 |
| Single Male/Father | 16,242 (4.6%) | 3.70 |
| Single Female/Mother | 29,650 (8.5%) | 4.16 |
| Non-family | 132,625 (37.8%) | 1.24 |
| Total Households | 350,767 (100.0%) | 2.65 |
Household Size by Marriage Status in Area Code 605
Out of a total of 350,767 households in Area Code 605, 218,142 (62.2%) are family households, while 132,625 (37.8%) are nonfamily households. The most numerous type of family households are 2-person households, comprising 107,012, and the most common type of nonfamily households are 1-person households, comprising 108,169.
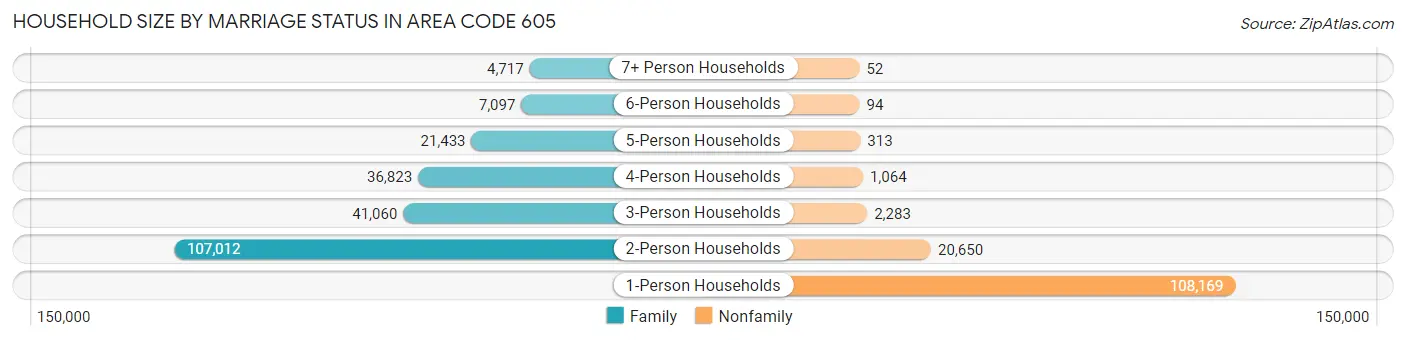
| Household Size | Family Households | Nonfamily Households |
| 1-Person Households | - | 108,169 (30.8%) |
| 2-Person Households | 107,012 (30.5%) | 20,650 (5.9%) |
| 3-Person Households | 41,060 (11.7%) | 2,283 (0.6%) |
| 4-Person Households | 36,823 (10.5%) | 1,064 (0.3%) |
| 5-Person Households | 21,433 (6.1%) | 313 (0.1%) |
| 6-Person Households | 7,097 (2.0%) | 94 (0.0%) |
| 7+ Person Households | 4,717 (1.3%) | 52 (0.0%) |
| Total | 218,142 (62.2%) | 132,625 (37.8%) |
Female Fertility in Area Code 605
Fertility by Age in Area Code 605
Average fertility rate in Area Code 605 is 112.4 births per 1,000 women. Women in the age bracket of 20 to 34 years have the highest fertility rate with 214.2 births per 1,000 women. Women in the age bracket of 20 to 34 years acount for 75.1% of all women with births.
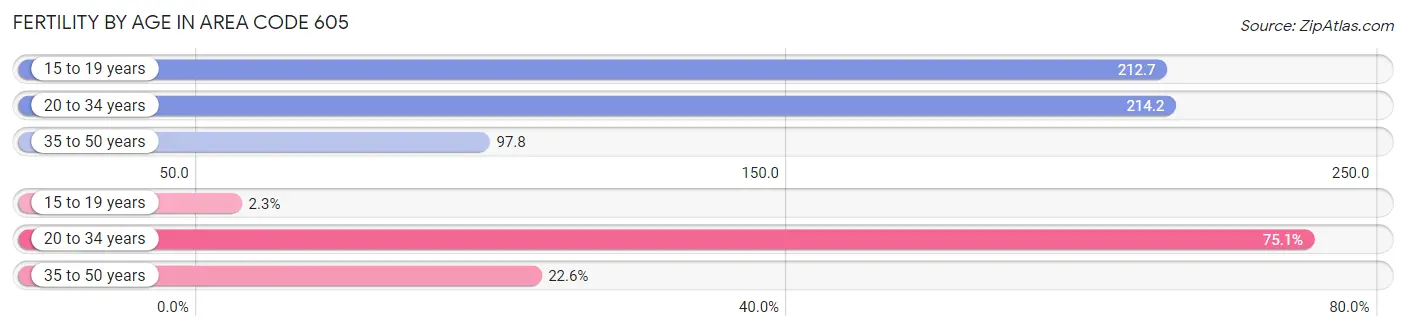
| Age Bracket | Women with Births | Births / 1,000 Women |
| 15 to 19 years | 277 (2.3%) | 212.7 |
| 20 to 34 years | 9,145 (75.1%) | 214.2 |
| 35 to 50 years | 2,752 (22.6%) | 97.8 |
| Total | 12,174 (100.0%) | 112.4 |
Fertility by Age by Marriage Status in Area Code 605
50.3% of women with births (12,174) in Area Code 605 are married. The highest percentage of unmarried women with births falls into 15 to 19 years age bracket with 98.9% of them unmarried at the time of birth, while the lowest percentage of unmarried women with births belong to 20 to 34 years age bracket with 50.3% of them unmarried.
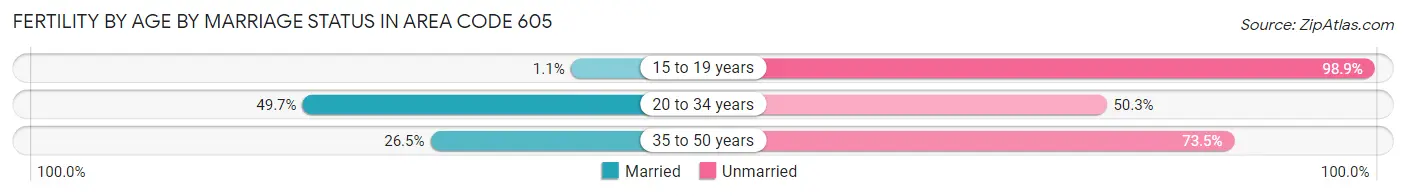
| Age Bracket | Married | Unmarried |
| 15 to 19 years | 3 (1.1%) | 274 (98.9%) |
| 20 to 34 years | 4,542 (49.7%) | 4,603 (50.3%) |
| 35 to 50 years | 729 (26.5%) | 2,023 (73.5%) |
| Total | 6,123 (50.3%) | 6,051 (49.7%) |
Fertility by Education in Area Code 605
Average fertility rate in Area Code 605 is 112.4 births per 1,000 women. Women with the education attainment of graduate degree have the highest fertility rate of 264.5 births per 1,000 women, while women with the education attainment of college or associate's degree have the lowest fertility at 169.6 births per 1,000 women. Women with the education attainment of college or associate's degree represent 30.0% of all women with births.
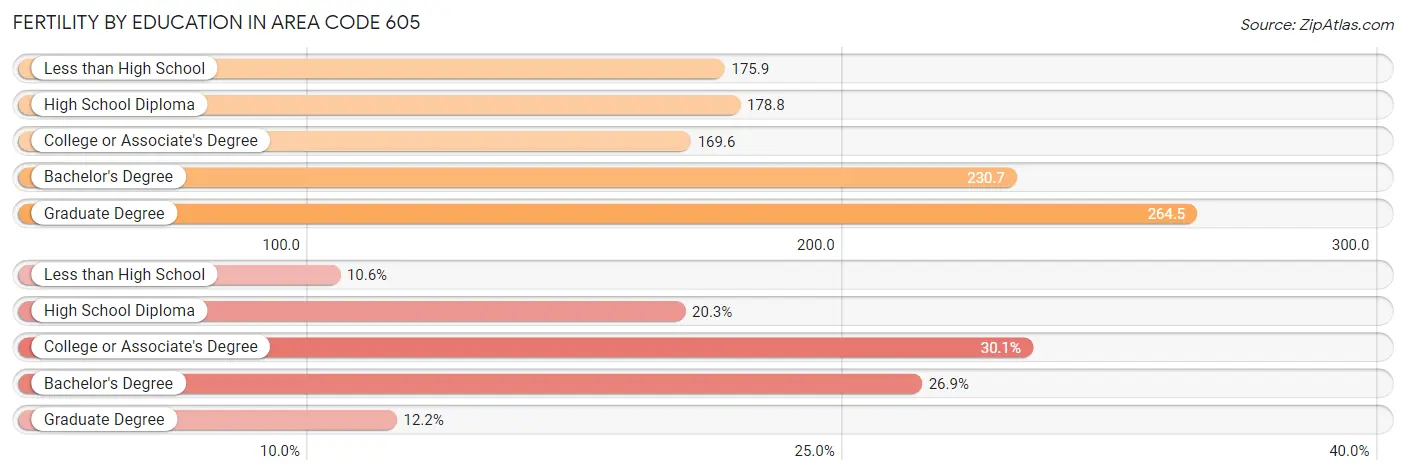
| Educational Attainment | Women with Births | Births / 1,000 Women |
| Less than High School | 1,288 (10.6%) | 175.9 |
| High School Diploma | 2,469 (20.3%) | 178.8 |
| College or Associate's Degree | 3,658 (30.0%) | 169.6 |
| Bachelor's Degree | 3,278 (26.9%) | 230.7 |
| Graduate Degree | 1,481 (12.2%) | 264.5 |
| Total | 12,174 (100.0%) | 112.4 |
Fertility by Education by Marriage Status in Area Code 605
49.7% of women with births in Area Code 605 are unmarried. Women with the educational attainment of bachelor's degree are most likely to be married with 44.5% of them married at childbirth, while women with the educational attainment of less than high school are least likely to be married with 85.0% of them unmarried at childbirth.
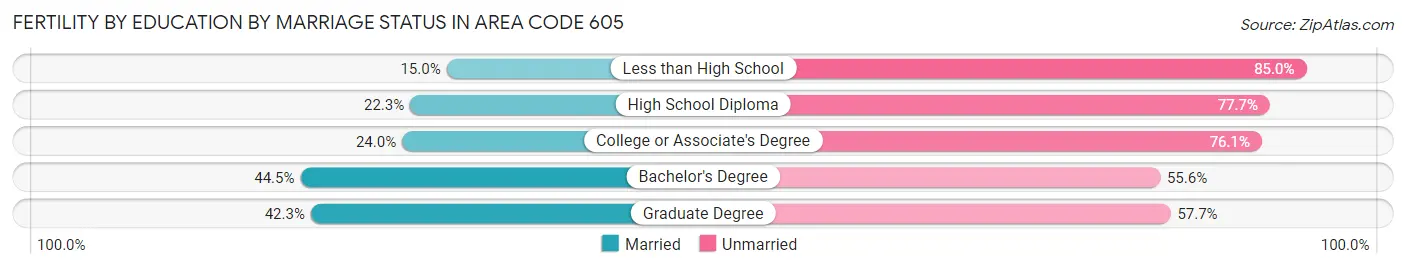
| Educational Attainment | Married | Unmarried |
| Less than High School | 193 (15.0%) | 1,095 (85.0%) |
| High School Diploma | 551 (22.3%) | 1,918 (77.7%) |
| College or Associate's Degree | 876 (23.9%) | 2,782 (76.0%) |
| Bachelor's Degree | 1,457 (44.5%) | 1,821 (55.5%) |
| Graduate Degree | 627 (42.3%) | 854 (57.7%) |
| Total | 6,123 (50.3%) | 6,051 (49.7%) |
Employment Characteristics in Area Code 605
Employment by Class of Employer in Area Code 605
Among the 448,754 employed individuals in Area Code 605, private company employees (270,515 | 60.3%), not-for-profit organizations (51,046 | 11.4%), and self-employed (not incorporated) (35,297 | 7.9%) make up the most common classes of employment.
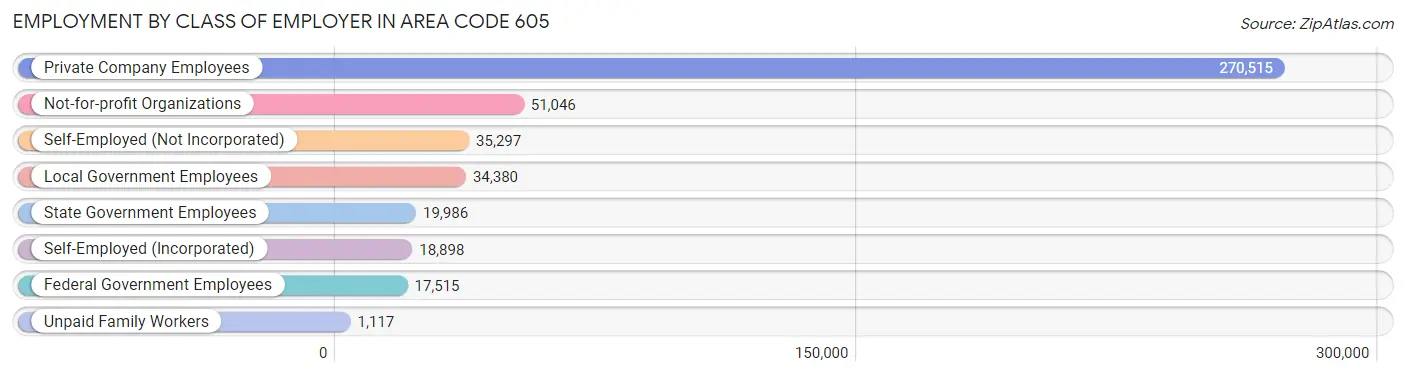
| Employer Class | # Employees | % Employees |
| Private Company Employees | 270,515 | 60.3% |
| Self-Employed (Incorporated) | 18,898 | 4.2% |
| Self-Employed (Not Incorporated) | 35,297 | 7.9% |
| Not-for-profit Organizations | 51,046 | 11.4% |
| Local Government Employees | 34,380 | 7.7% |
| State Government Employees | 19,986 | 4.4% |
| Federal Government Employees | 17,515 | 3.9% |
| Unpaid Family Workers | 1,117 | 0.3% |
| Total | 448,754 | 100.0% |
Employment Status by Age in Area Code 605
According to the labor force statistics for Area Code 605, out of the total population over 16 years of age (696,743), 63.4% or 442,014 individuals are in the labor force, with 6.4% or 28,289 of them unemployed. The age group with the highest labor force participation rate is 35 to 44 years, with 86.9% or 95,289 individuals in the labor force. Within the labor force, the 16 to 19 years age range has the highest percentage of unemployed individuals, with 2,956.8% or 725,480 of them being unemployed.
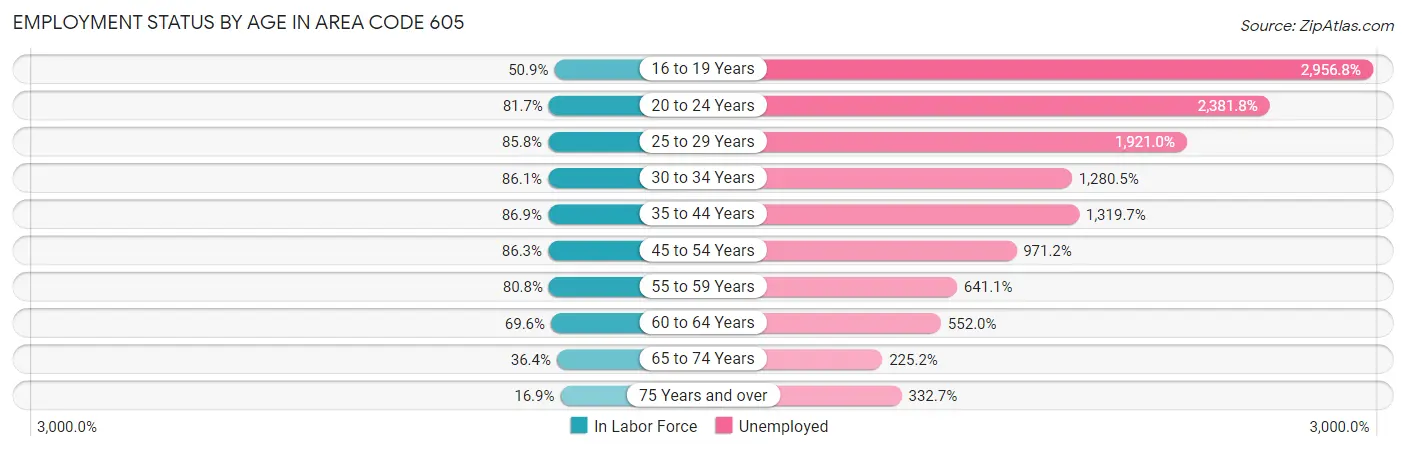
| Age Bracket | In Labor Force | Unemployed |
| 16 to 19 Years | 24,536 (50.9%) | 725,480 (2,956.8%) |
| 20 to 24 Years | 49,321 (81.7%) | 1,174,656 (2,381.8%) |
| 25 to 29 Years | 48,544 (85.8%) | 932,569 (1,921.0%) |
| 30 to 34 Years | 49,252 (86.1%) | 630,659 (1,280.5%) |
| 35 to 44 Years | 95,286 (86.9%) | 1,257,529 (1,319.7%) |
| 45 to 54 Years | 82,213 (86.3%) | 798,433 (971.2%) |
| 55 to 59 Years | 44,997 (80.8%) | 288,489 (641.1%) |
| 60 to 64 Years | 41,729 (69.6%) | 230,355 (552.0%) |
| 65 to 74 Years | 33,479 (36.4%) | 75,404 (225.2%) |
| 75 Years and over | 10,480 (16.9%) | 34,874 (332.7%) |
| Total | 441,993 (63.4%) | 28,279 (6.4%) |
Employment Status by Educational Attainment in Area Code 605
According to labor force statistics for Area Code 605, 80.9% of individuals (351,437) out of the total population between 25 and 64 years of age (434,355) are in the labor force, with 1,306.9% or 4,592,930 of them being unemployed. The group with the highest labor force participation rate are those with the educational attainment of bachelor's degree or higher, with 89.4% or 124,389 individuals in the labor force. Within the labor force, individuals with less than high school education have the highest percentage of unemployment, with 2,576.0% or 553,119 of them being unemployed.
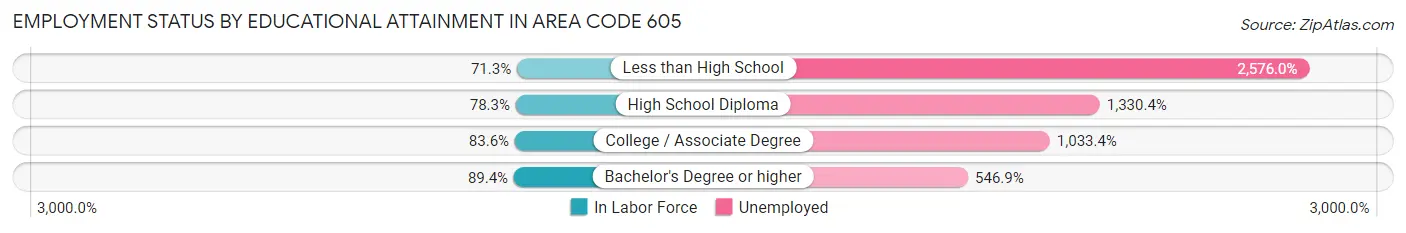
| Educational Attainment | In Labor Force | Unemployed |
| Less than High School | 21,472 (71.3%) | 775,531 (2,576.0%) |
| High School Diploma | 93,771 (78.3%) | 1,592,582 (1,330.4%) |
| College / Associate Degree | 121,595 (83.6%) | 1,502,770 (1,033.4%) |
| Bachelor's Degree or higher | 124,384 (89.4%) | 760,858 (546.9%) |
| Total | 351,454 (80.9%) | 5,676,585 (1,306.9%) |
Employment Occupations by Sex in Area Code 605
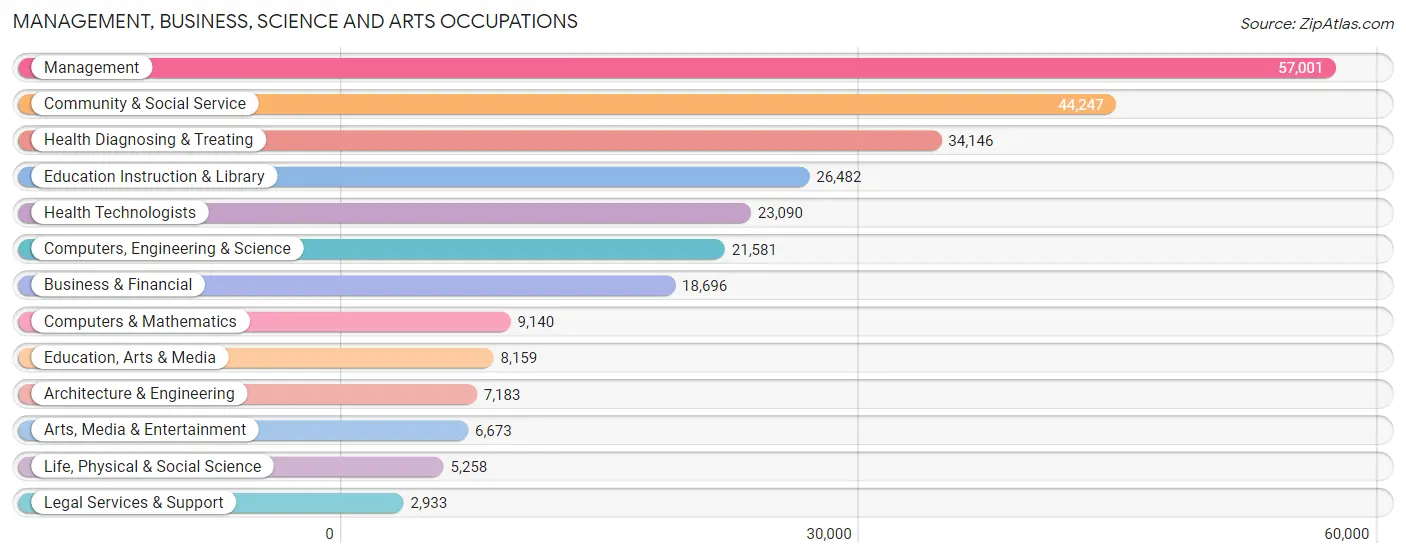
Management, Business, Science and Arts Occupations
The most common Management, Business, Science and Arts occupations in Area Code 605 are Management (57,001 | 12.6%), Community & Social Service (44,247 | 9.8%), Health Diagnosing & Treating (34,146 | 7.5%), Education Instruction & Library (26,482 | 5.8%), and Health Technologists (23,090 | 5.1%).
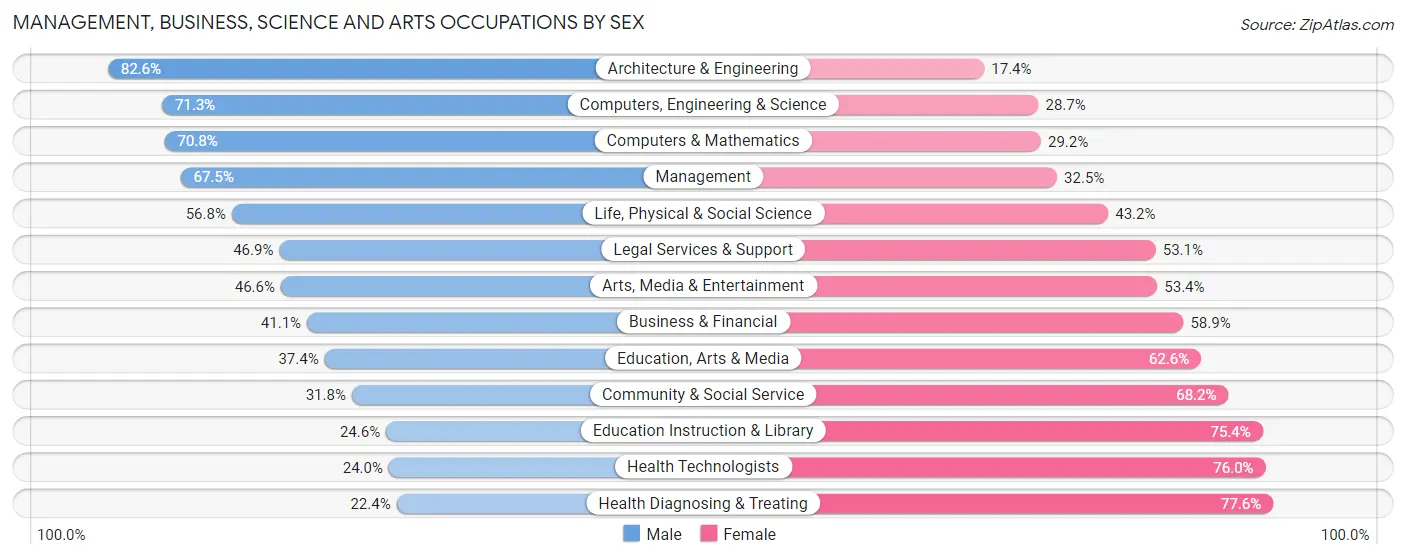
Management, Business, Science and Arts Occupations by Sex
Within the Management, Business, Science and Arts occupations in Area Code 605, the most male-oriented occupations are Architecture & Engineering (82.6%), Computers, Engineering & Science (71.3%), and Computers & Mathematics (70.8%), while the most female-oriented occupations are Health Diagnosing & Treating (77.6%), Health Technologists (76.0%), and Education Instruction & Library (75.4%).
| Occupation | Male | Female |
| Management | 38,451 (67.5%) | 18,550 (32.5%) |
| Business & Financial | 7,685 (41.1%) | 11,011 (58.9%) |
| Computers, Engineering & Science | 15,395 (71.3%) | 6,186 (28.7%) |
| Computers & Mathematics | 6,473 (70.8%) | 2,667 (29.2%) |
| Architecture & Engineering | 5,936 (82.6%) | 1,247 (17.4%) |
| Life, Physical & Social Science | 2,986 (56.8%) | 2,272 (43.2%) |
| Community & Social Service | 14,055 (31.8%) | 30,192 (68.2%) |
| Education, Arts & Media | 3,055 (37.4%) | 5,104 (62.6%) |
| Legal Services & Support | 1,375 (46.9%) | 1,558 (53.1%) |
| Education Instruction & Library | 6,518 (24.6%) | 19,964 (75.4%) |
| Arts, Media & Entertainment | 3,107 (46.6%) | 3,566 (53.4%) |
| Health Diagnosing & Treating | 7,657 (22.4%) | 26,489 (77.6%) |
| Health Technologists | 5,549 (24.0%) | 17,541 (76.0%) |
| Total (Category) | 83,243 (47.4%) | 92,428 (52.6%) |
| Total (Overall) | 239,778 (52.9%) | 213,349 (47.1%) |
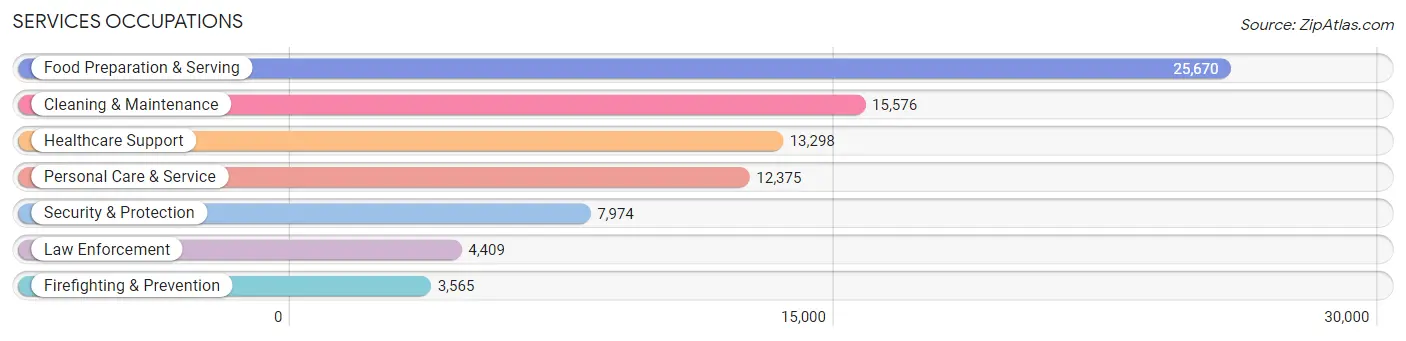
Services Occupations
The most common Services occupations in Area Code 605 are Food Preparation & Serving (25,670 | 5.7%), Cleaning & Maintenance (15,576 | 3.4%), Healthcare Support (13,298 | 2.9%), Personal Care & Service (12,375 | 2.7%), and Security & Protection (7,974 | 1.8%).
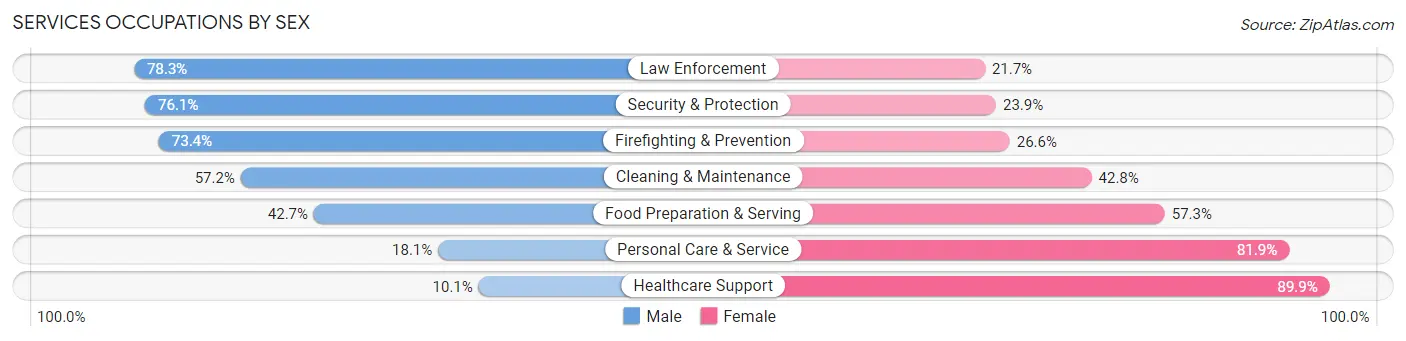
Services Occupations by Sex
Within the Services occupations in Area Code 605, the most male-oriented occupations are Law Enforcement (78.3%), Security & Protection (76.1%), and Firefighting & Prevention (73.4%), while the most female-oriented occupations are Healthcare Support (89.9%), Personal Care & Service (81.9%), and Food Preparation & Serving (57.3%).
| Occupation | Male | Female |
| Healthcare Support | 1,343 (10.1%) | 11,955 (89.9%) |
| Security & Protection | 6,071 (76.1%) | 1,903 (23.9%) |
| Firefighting & Prevention | 2,617 (73.4%) | 948 (26.6%) |
| Law Enforcement | 3,454 (78.3%) | 955 (21.7%) |
| Food Preparation & Serving | 10,965 (42.7%) | 14,705 (57.3%) |
| Cleaning & Maintenance | 8,911 (57.2%) | 6,665 (42.8%) |
| Personal Care & Service | 2,242 (18.1%) | 10,133 (81.9%) |
| Total (Category) | 29,532 (39.4%) | 45,361 (60.6%) |
| Total (Overall) | 239,778 (52.9%) | 213,349 (47.1%) |
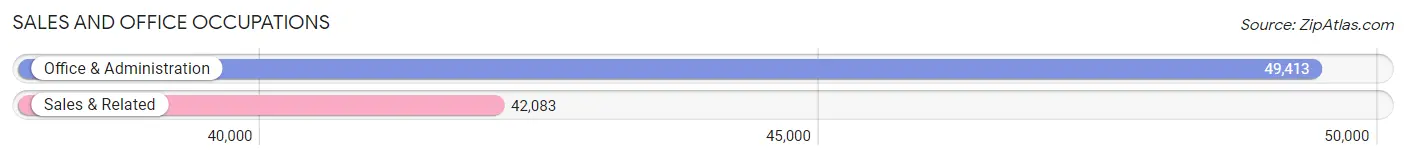
Sales and Office Occupations
The most common Sales and Office occupations in Area Code 605 are Office & Administration (49,413 | 10.9%), and Sales & Related (42,083 | 9.3%).
Sales and Office Occupations by Sex
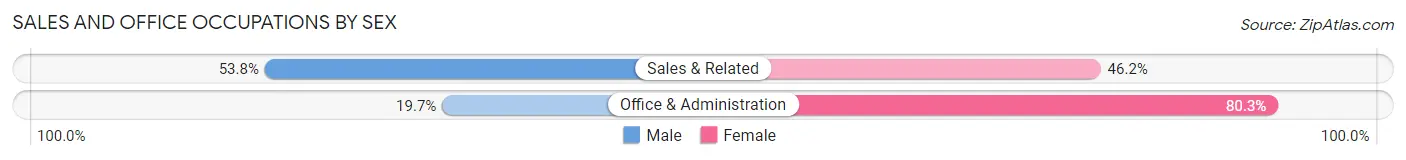
| Occupation | Male | Female |
| Sales & Related | 22,651 (53.8%) | 19,432 (46.2%) |
| Office & Administration | 9,735 (19.7%) | 39,678 (80.3%) |
| Total (Category) | 32,386 (35.4%) | 59,110 (64.6%) |
| Total (Overall) | 239,778 (52.9%) | 213,349 (47.1%) |
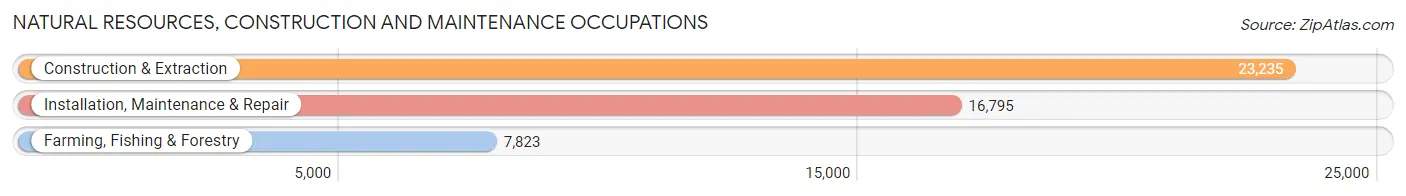
Natural Resources, Construction and Maintenance Occupations
The most common Natural Resources, Construction and Maintenance occupations in Area Code 605 are Construction & Extraction (23,235 | 5.1%), Installation, Maintenance & Repair (16,795 | 3.7%), and Farming, Fishing & Forestry (7,823 | 1.7%).
Natural Resources, Construction and Maintenance Occupations by Sex
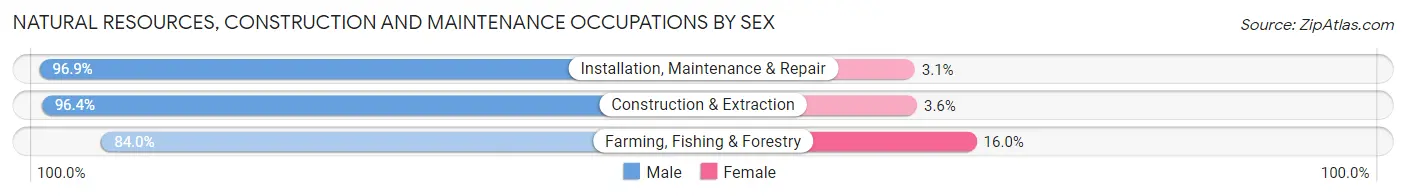
| Occupation | Male | Female |
| Farming, Fishing & Forestry | 6,574 (84.0%) | 1,249 (16.0%) |
| Construction & Extraction | 22,408 (96.4%) | 827 (3.6%) |
| Installation, Maintenance & Repair | 16,274 (96.9%) | 521 (3.1%) |
| Total (Category) | 45,256 (94.6%) | 2,597 (5.4%) |
| Total (Overall) | 239,778 (52.9%) | 213,349 (47.1%) |
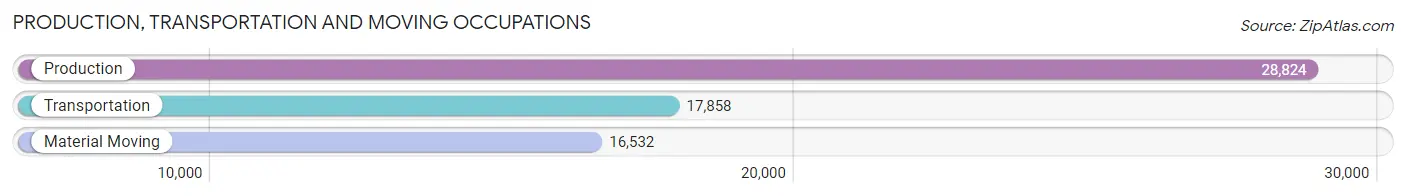
Production, Transportation and Moving Occupations
The most common Production, Transportation and Moving occupations in Area Code 605 are Production (28,824 | 6.4%), Transportation (17,858 | 3.9%), and Material Moving (16,532 | 3.6%).
Production, Transportation and Moving Occupations by Sex
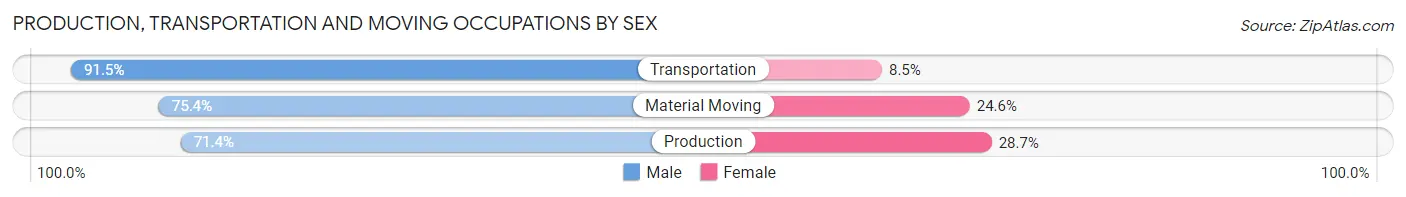
| Occupation | Male | Female |
| Production | 20,567 (71.4%) | 8,257 (28.6%) |
| Transportation | 16,335 (91.5%) | 1,523 (8.5%) |
| Material Moving | 12,459 (75.4%) | 4,073 (24.6%) |
| Total (Category) | 49,361 (78.1%) | 13,853 (21.9%) |
| Total (Overall) | 239,778 (52.9%) | 213,349 (47.1%) |
Employment Industries by Sex in Area Code 605
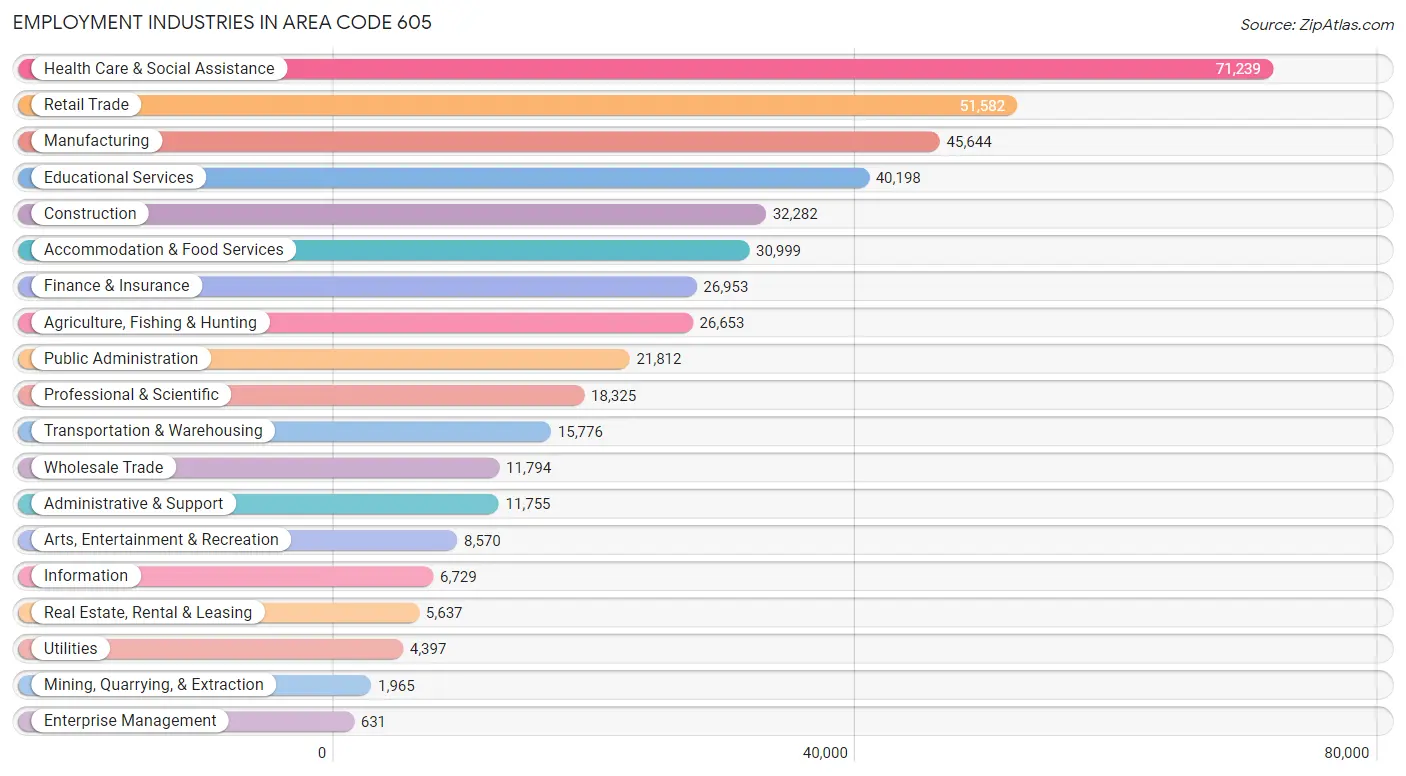
Employment Industries in Area Code 605
The major employment industries in Area Code 605 include Health Care & Social Assistance (71,239 | 15.7%), Retail Trade (51,582 | 11.4%), Manufacturing (45,644 | 10.1%), Educational Services (40,198 | 8.9%), and Construction (32,282 | 7.1%).
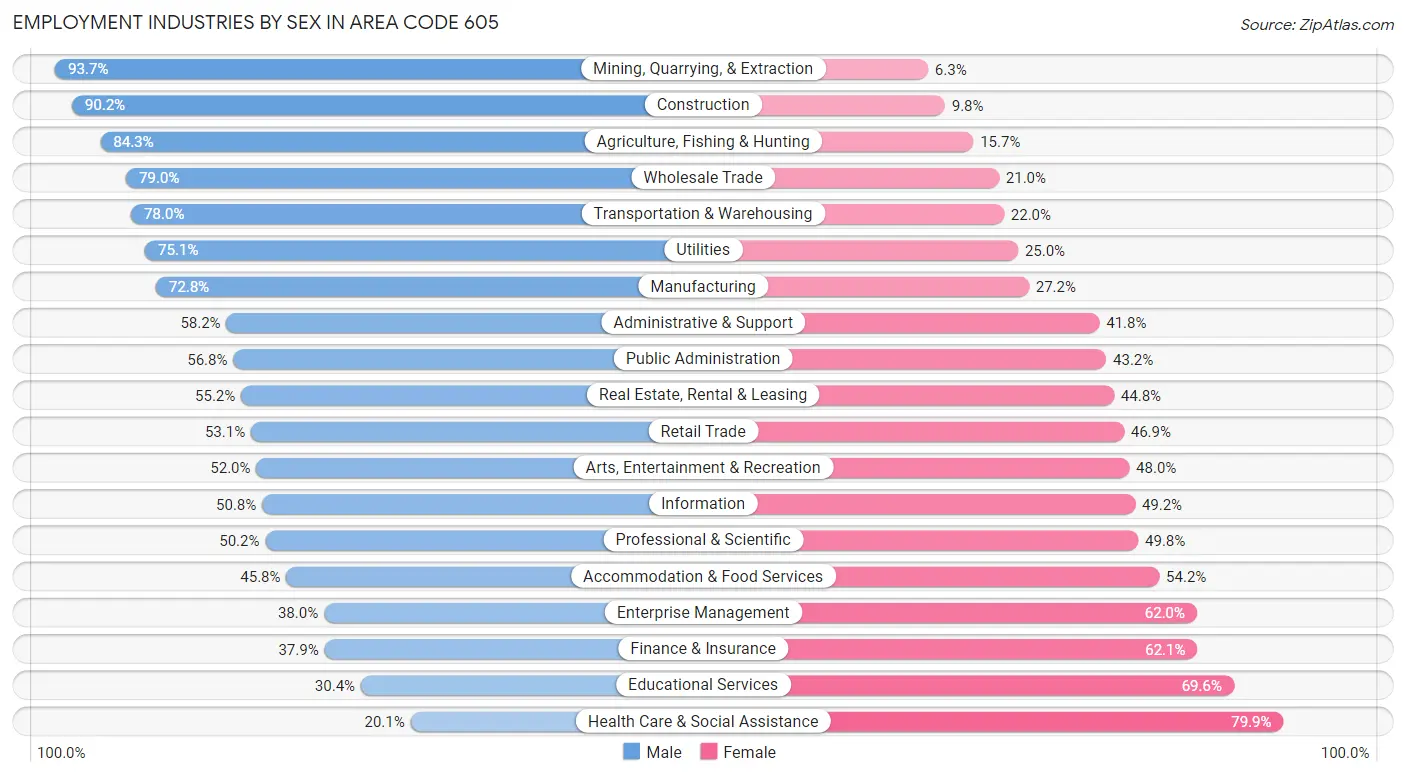
Employment Industries by Sex in Area Code 605
The Area Code 605 industries that see more men than women are Mining, Quarrying, & Extraction (93.7%), Construction (90.2%), and Agriculture, Fishing & Hunting (84.3%), whereas the industries that tend to have a higher number of women are Health Care & Social Assistance (79.9%), Educational Services (69.6%), and Finance & Insurance (62.1%).
| Industry | Male | Female |
| Agriculture, Fishing & Hunting | 22,472 (84.3%) | 4,181 (15.7%) |
| Mining, Quarrying, & Extraction | 1,841 (93.7%) | 124 (6.3%) |
| Construction | 29,118 (90.2%) | 3,164 (9.8%) |
| Manufacturing | 33,233 (72.8%) | 12,411 (27.2%) |
| Wholesale Trade | 9,319 (79.0%) | 2,475 (21.0%) |
| Retail Trade | 27,410 (53.1%) | 24,172 (46.9%) |
| Transportation & Warehousing | 12,301 (78.0%) | 3,475 (22.0%) |
| Utilities | 3,300 (75.0%) | 1,097 (24.9%) |
| Information | 3,421 (50.8%) | 3,308 (49.2%) |
| Finance & Insurance | 10,224 (37.9%) | 16,729 (62.1%) |
| Real Estate, Rental & Leasing | 3,111 (55.2%) | 2,526 (44.8%) |
| Professional & Scientific | 9,196 (50.2%) | 9,129 (49.8%) |
| Enterprise Management | 240 (38.0%) | 391 (62.0%) |
| Administrative & Support | 6,844 (58.2%) | 4,911 (41.8%) |
| Educational Services | 12,218 (30.4%) | 27,980 (69.6%) |
| Health Care & Social Assistance | 14,332 (20.1%) | 56,907 (79.9%) |
| Arts, Entertainment & Recreation | 4,459 (52.0%) | 4,111 (48.0%) |
| Accommodation & Food Services | 14,205 (45.8%) | 16,794 (54.2%) |
| Public Administration | 12,390 (56.8%) | 9,422 (43.2%) |
| Total | 239,778 (52.9%) | 213,349 (47.1%) |
Education in Area Code 605
School Enrollment in Area Code 605
The most common levels of schooling among the 215,041 students in Area Code 605 are middle school (48,099 | 22.4%), elementary school (47,929 | 22.3%), and high school (45,632 | 21.2%).
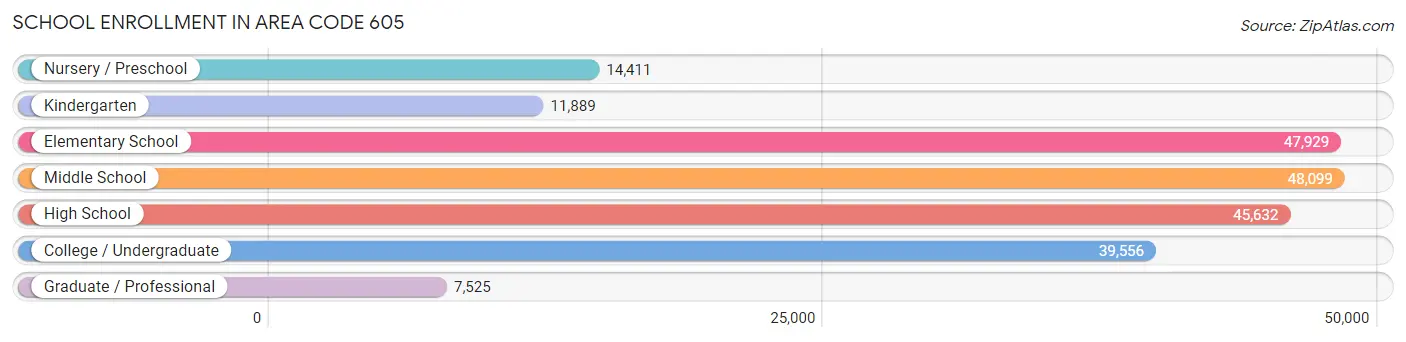
| School Level | # Students | % Students |
| Nursery / Preschool | 14,411 | 6.7% |
| Kindergarten | 11,889 | 5.5% |
| Elementary School | 47,929 | 22.3% |
| Middle School | 48,099 | 22.4% |
| High School | 45,632 | 21.2% |
| College / Undergraduate | 39,556 | 18.4% |
| Graduate / Professional | 7,525 | 3.5% |
| Total | 215,041 | 100.0% |
School Enrollment by Age by Funding Source in Area Code 605
Out of a total of 215,041 students who are enrolled in schools in Area Code 605, 28,150 (13.1%) attend a private institution, while the remaining 186,891 (86.9%) are enrolled in public schools. The age group of 3 to 4 year olds has the highest likelihood of being enrolled in private schools, with 2,647 (29.9% in the age bracket) enrolled. Conversely, the age group of 15 to 17 year olds has the lowest likelihood of being enrolled in a private school, with 31,069 (91.4% in the age bracket) attending a public institution.
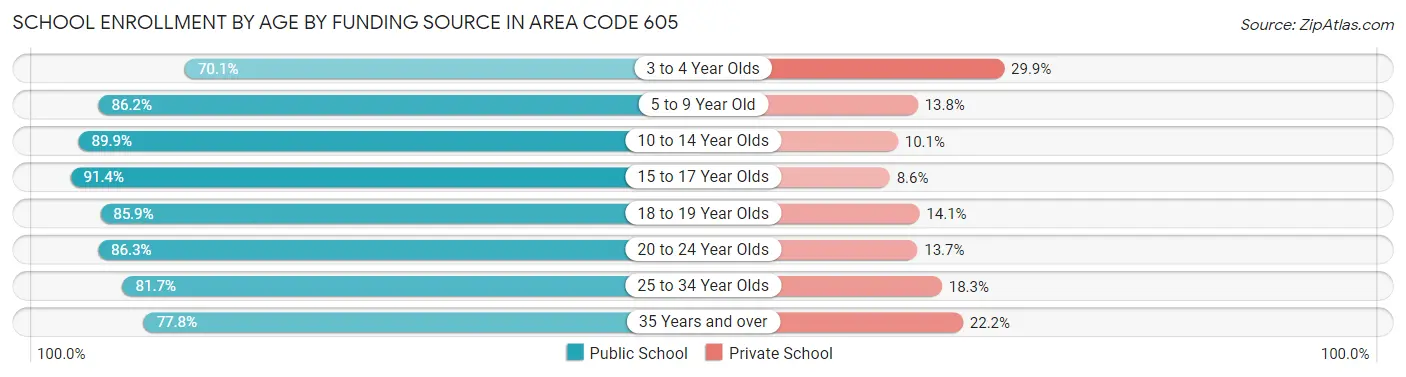
| Age Bracket | Public School | Private School |
| 3 to 4 Year Olds | 6,212 (70.1%) | 2,647 (29.9%) |
| 5 to 9 Year Old | 48,742 (86.2%) | 7,798 (13.8%) |
| 10 to 14 Year Olds | 54,183 (89.9%) | 6,072 (10.1%) |
| 15 to 17 Year Olds | 31,069 (91.4%) | 2,915 (8.6%) |
| 18 to 19 Year Olds | 15,210 (85.9%) | 2,499 (14.1%) |
| 20 to 24 Year Olds | 18,304 (86.3%) | 2,909 (13.7%) |
| 25 to 34 Year Olds | 7,133 (81.7%) | 1,595 (18.3%) |
| 35 Years and over | 6,032 (77.8%) | 1,721 (22.2%) |
| Total | 186,891 (86.9%) | 28,150 (13.1%) |
Educational Attainment by Field of Study in Area Code 605
Education (36,873 | 18.8%), business (34,889 | 17.8%), science & technology (25,057 | 12.8%), bio, nature & agricultural (17,917 | 9.1%), and arts & humanities (13,878 | 7.1%) are the most common fields of study among 196,340 individuals in Area Code 605 who have obtained a bachelor's degree or higher.
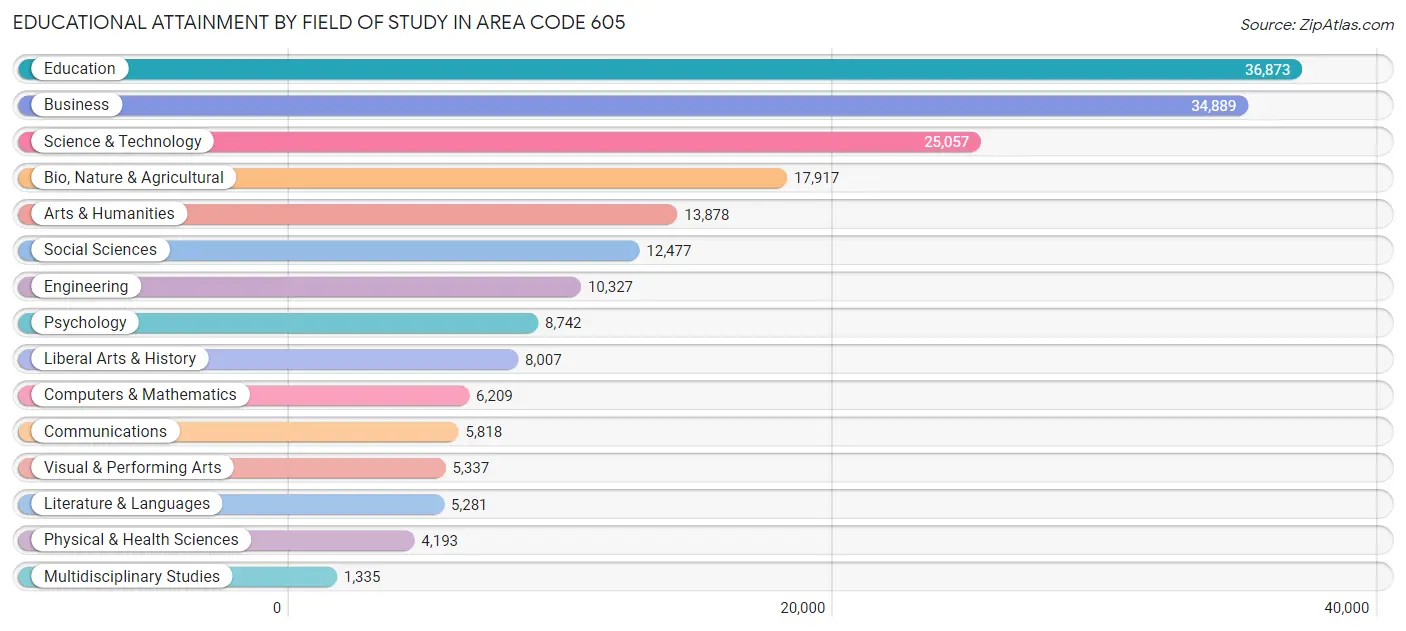
| Field of Study | # Graduates | % Graduates |
| Computers & Mathematics | 6,209 | 3.2% |
| Bio, Nature & Agricultural | 17,917 | 9.1% |
| Physical & Health Sciences | 4,193 | 2.1% |
| Psychology | 8,742 | 4.4% |
| Social Sciences | 12,477 | 6.4% |
| Engineering | 10,327 | 5.3% |
| Multidisciplinary Studies | 1,335 | 0.7% |
| Science & Technology | 25,057 | 12.8% |
| Business | 34,889 | 17.8% |
| Education | 36,873 | 18.8% |
| Literature & Languages | 5,281 | 2.7% |
| Liberal Arts & History | 8,007 | 4.1% |
| Visual & Performing Arts | 5,337 | 2.7% |
| Communications | 5,818 | 3.0% |
| Arts & Humanities | 13,878 | 7.1% |
| Total | 196,340 | 100.0% |
Transportation & Commute in Area Code 605
Vehicle Availability by Sex in Area Code 605
The most prevalent vehicle ownership categories in Area Code 605 are males with 2 vehicles (90,887, accounting for 38.7%) and females with 2 vehicles (76,362, making up 44.0%).
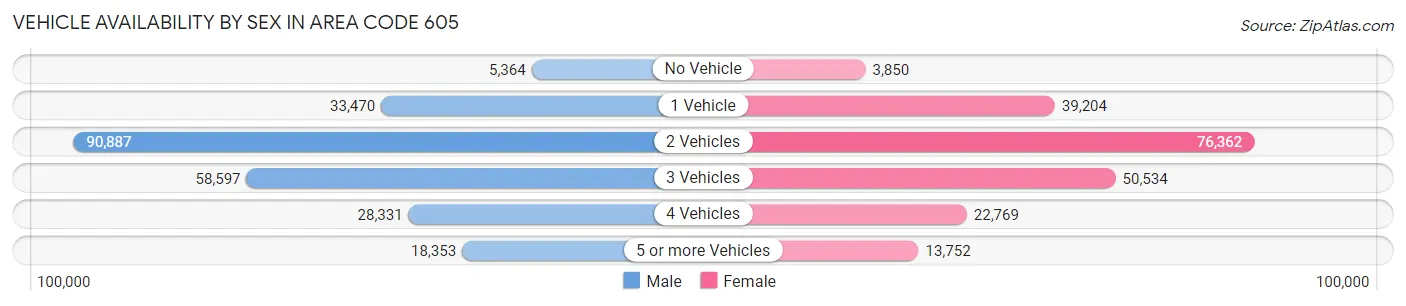
| Vehicles Available | Male | Female |
| No Vehicle | 5,364 (2.3%) | 3,850 (1.9%) |
| 1 Vehicle | 33,470 (14.2%) | 39,204 (19.0%) |
| 2 Vehicles | 90,887 (38.7%) | 76,362 (37.0%) |
| 3 Vehicles | 58,597 (24.9%) | 50,534 (24.5%) |
| 4 Vehicles | 28,331 (12.1%) | 22,769 (11.0%) |
| 5 or more Vehicles | 18,353 (7.8%) | 13,752 (6.7%) |
| Total | 235,002 (100.0%) | 206,471 (100.0%) |
Commute Time in Area Code 605
The most frequently occuring commute durations in Area Code 605 are 10 to 14 minutes (84,193 commuters, 20.5%), 5 to 9 minutes (81,110 commuters, 19.8%), and 15 to 19 minutes (75,052 commuters, 18.3%).
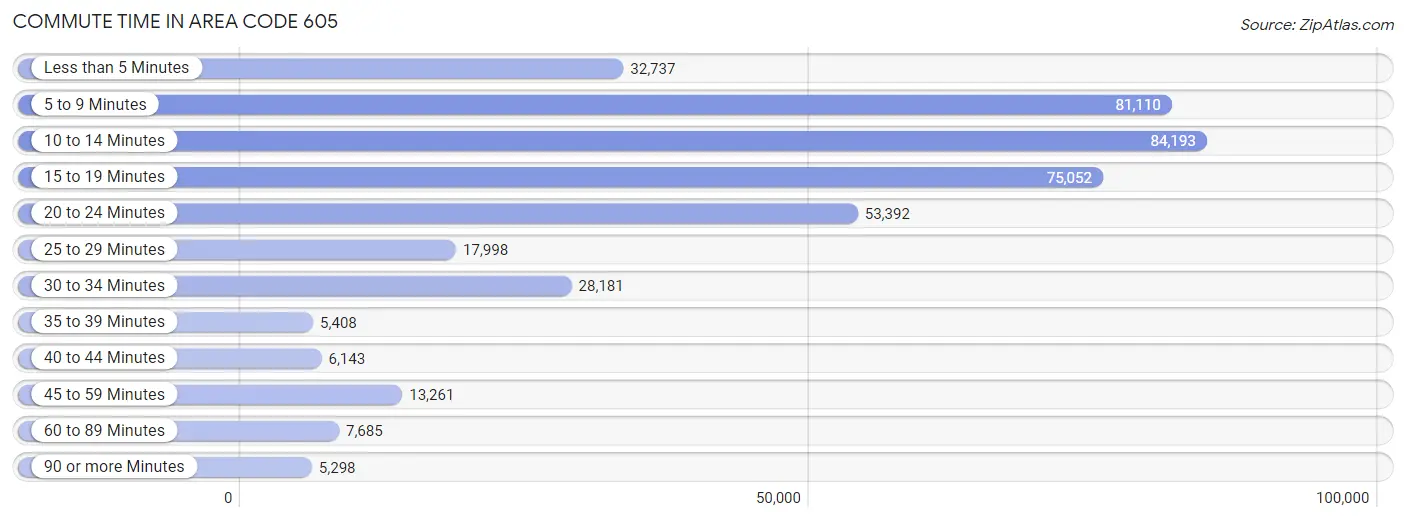
| Commute Time | # Commuters | % Commuters |
| Less than 5 Minutes | 32,737 | 8.0% |
| 5 to 9 Minutes | 81,110 | 19.8% |
| 10 to 14 Minutes | 84,193 | 20.5% |
| 15 to 19 Minutes | 75,052 | 18.3% |
| 20 to 24 Minutes | 53,392 | 13.0% |
| 25 to 29 Minutes | 17,998 | 4.4% |
| 30 to 34 Minutes | 28,181 | 6.9% |
| 35 to 39 Minutes | 5,408 | 1.3% |
| 40 to 44 Minutes | 6,143 | 1.5% |
| 45 to 59 Minutes | 13,261 | 3.2% |
| 60 to 89 Minutes | 7,685 | 1.9% |
| 90 or more Minutes | 5,298 | 1.3% |
Commute Time by Sex in Area Code 605
The most common commute times in Area Code 605 are 10 to 14 minutes (44,291 commuters, 20.2%) for males and 5 to 9 minutes (40,760 commuters, 21.4%) for females.
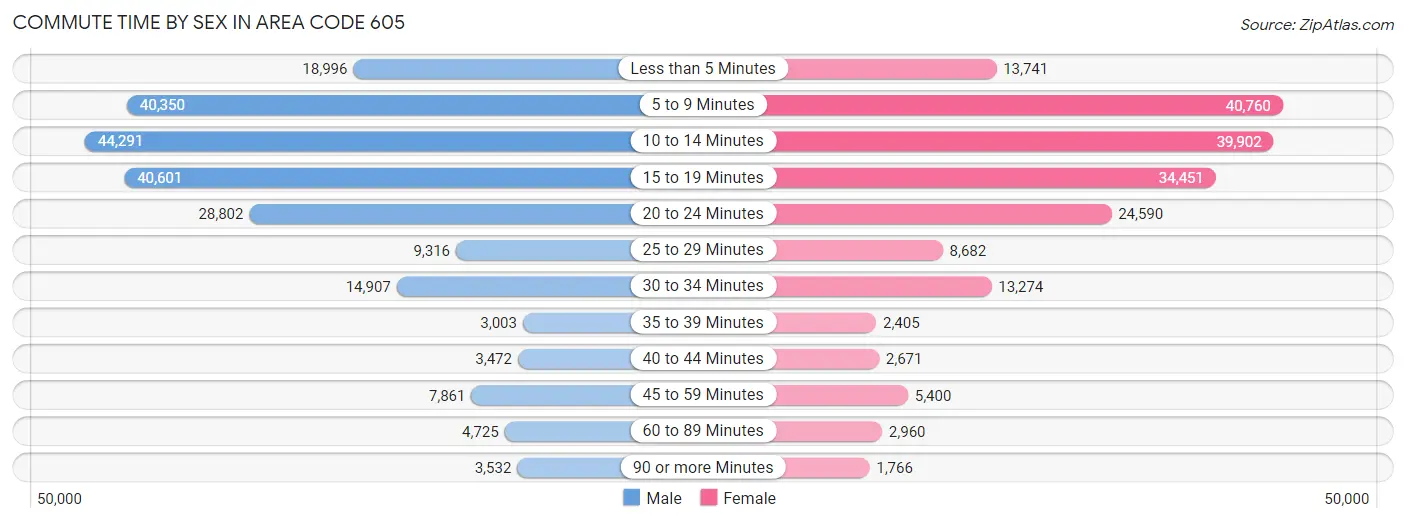
| Commute Time | Male | Female |
| Less than 5 Minutes | 18,996 (8.6%) | 13,741 (7.2%) |
| 5 to 9 Minutes | 40,350 (18.3%) | 40,760 (21.4%) |
| 10 to 14 Minutes | 44,291 (20.2%) | 39,902 (20.9%) |
| 15 to 19 Minutes | 40,601 (18.5%) | 34,451 (18.1%) |
| 20 to 24 Minutes | 28,802 (13.1%) | 24,590 (12.9%) |
| 25 to 29 Minutes | 9,316 (4.2%) | 8,682 (4.6%) |
| 30 to 34 Minutes | 14,907 (6.8%) | 13,274 (7.0%) |
| 35 to 39 Minutes | 3,003 (1.4%) | 2,405 (1.3%) |
| 40 to 44 Minutes | 3,472 (1.6%) | 2,671 (1.4%) |
| 45 to 59 Minutes | 7,861 (3.6%) | 5,400 (2.8%) |
| 60 to 89 Minutes | 4,725 (2.1%) | 2,960 (1.5%) |
| 90 or more Minutes | 3,532 (1.6%) | 1,766 (0.9%) |
Time of Departure to Work by Sex in Area Code 605
The most frequent times of departure to work in Area Code 605 are 7:30 AM to 7:59 AM (41,492, 18.9%) for males and 7:30 AM to 7:59 AM (44,598, 23.4%) for females.
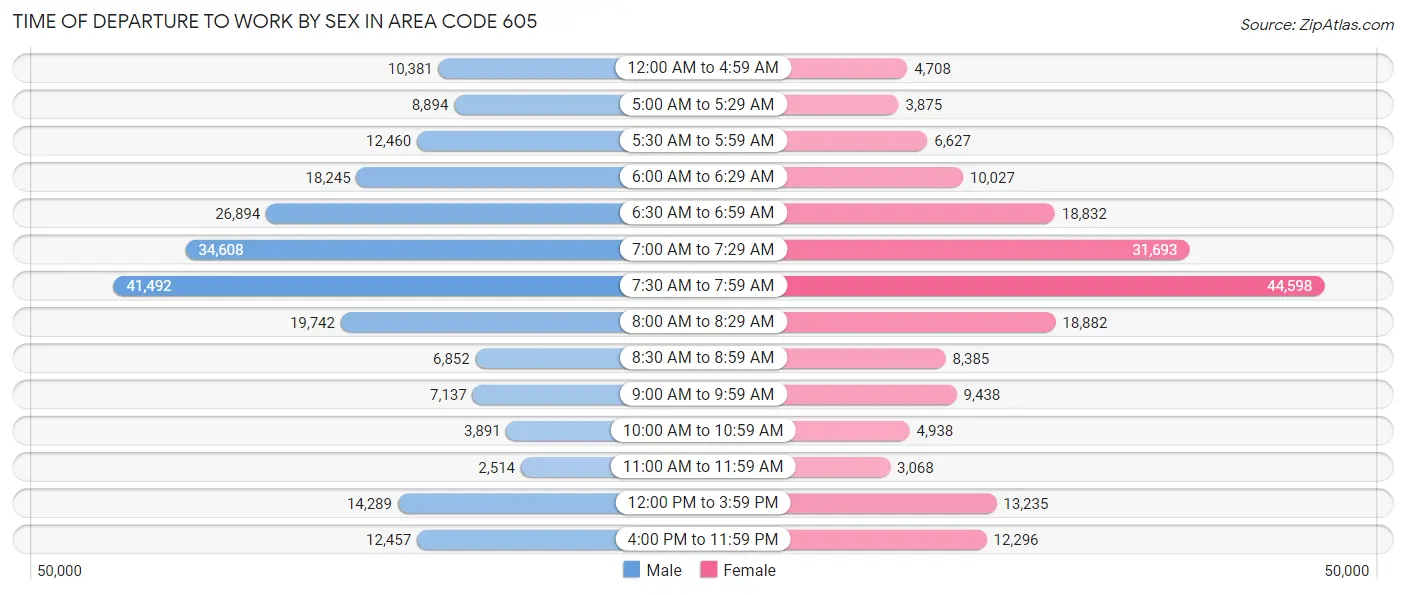
| Time of Departure | Male | Female |
| 12:00 AM to 4:59 AM | 10,381 (4.7%) | 4,708 (2.5%) |
| 5:00 AM to 5:29 AM | 8,894 (4.1%) | 3,875 (2.0%) |
| 5:30 AM to 5:59 AM | 12,460 (5.7%) | 6,627 (3.5%) |
| 6:00 AM to 6:29 AM | 18,245 (8.3%) | 10,027 (5.3%) |
| 6:30 AM to 6:59 AM | 26,894 (12.2%) | 18,832 (9.9%) |
| 7:00 AM to 7:29 AM | 34,608 (15.7%) | 31,693 (16.6%) |
| 7:30 AM to 7:59 AM | 41,492 (18.9%) | 44,598 (23.4%) |
| 8:00 AM to 8:29 AM | 19,742 (9.0%) | 18,882 (9.9%) |
| 8:30 AM to 8:59 AM | 6,852 (3.1%) | 8,385 (4.4%) |
| 9:00 AM to 9:59 AM | 7,137 (3.3%) | 9,438 (5.0%) |
| 10:00 AM to 10:59 AM | 3,891 (1.8%) | 4,938 (2.6%) |
| 11:00 AM to 11:59 AM | 2,514 (1.1%) | 3,068 (1.6%) |
| 12:00 PM to 3:59 PM | 14,289 (6.5%) | 13,235 (6.9%) |
| 4:00 PM to 11:59 PM | 12,457 (5.7%) | 12,296 (6.5%) |
| Total | 219,856 (100.0%) | 190,602 (100.0%) |
Housing Occupancy in Area Code 605
Occupancy by Ownership in Area Code 605
Of the total 350,767 dwellings in Area Code 605, owner-occupied units account for 240,129 (68.5%), while renter-occupied units make up 110,638 (31.5%).
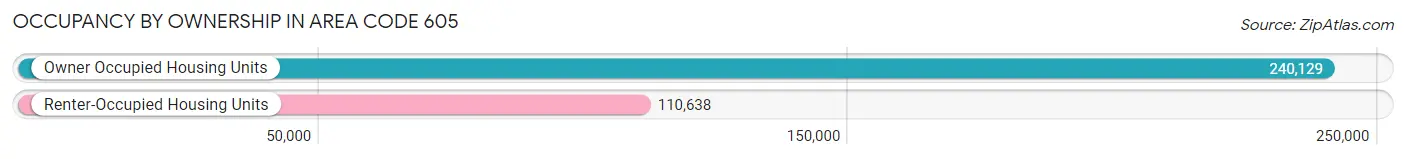
| Occupancy | # Housing Units | % Housing Units |
| Owner Occupied Housing Units | 240,129 | 68.5% |
| Renter-Occupied Housing Units | 110,638 | 31.5% |
| Total Occupied Housing Units | 350,767 | 100.0% |
Occupancy by Household Size in Area Code 605
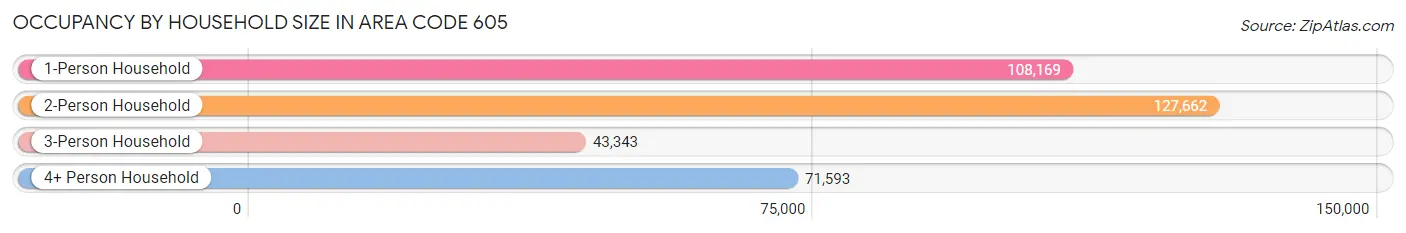
| Household Size | # Housing Units | % Housing Units |
| 1-Person Household | 108,169 | 30.8% |
| 2-Person Household | 127,662 | 36.4% |
| 3-Person Household | 43,343 | 12.4% |
| 4+ Person Household | 71,593 | 20.4% |
| Total Housing Units | 350,767 | 100.0% |
Occupancy by Ownership by Household Size in Area Code 605
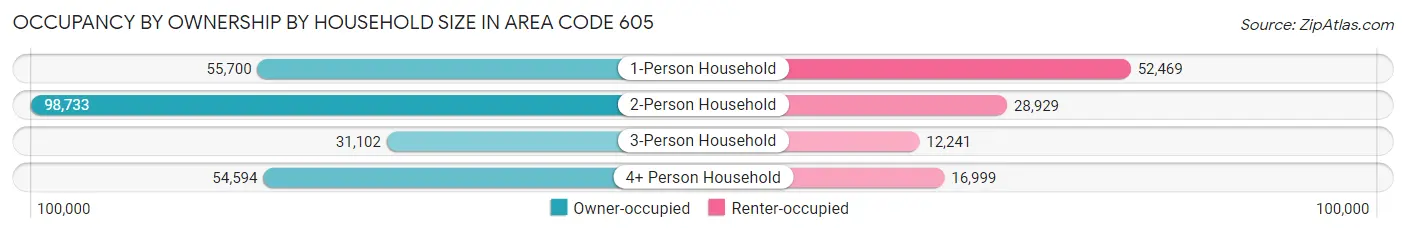
| Household Size | Owner-occupied | Renter-occupied |
| 1-Person Household | 55,700 (51.5%) | 52,469 (48.5%) |
| 2-Person Household | 98,733 (77.3%) | 28,929 (22.7%) |
| 3-Person Household | 31,102 (71.8%) | 12,241 (28.2%) |
| 4+ Person Household | 54,594 (76.3%) | 16,999 (23.7%) |
| Total Housing Units | 240,129 (68.5%) | 110,638 (31.5%) |
Occupancy by Educational Attainment in Area Code 605
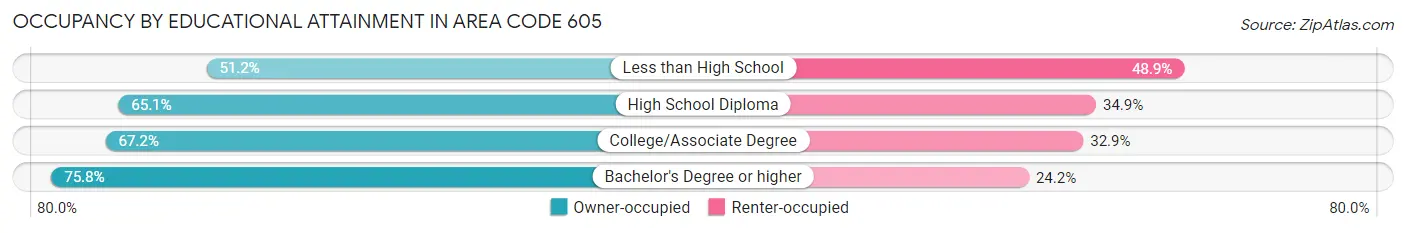
| Household Size | Owner-occupied | Renter-occupied |
| Less than High School | 10,120 (51.1%) | 9,665 (48.8%) |
| High School Diploma | 63,928 (65.1%) | 34,245 (34.9%) |
| College/Associate Degree | 80,333 (67.1%) | 39,298 (32.9%) |
| Bachelor's Degree or higher | 85,748 (75.8%) | 27,430 (24.2%) |
Occupancy by Age of Householder in Area Code 605
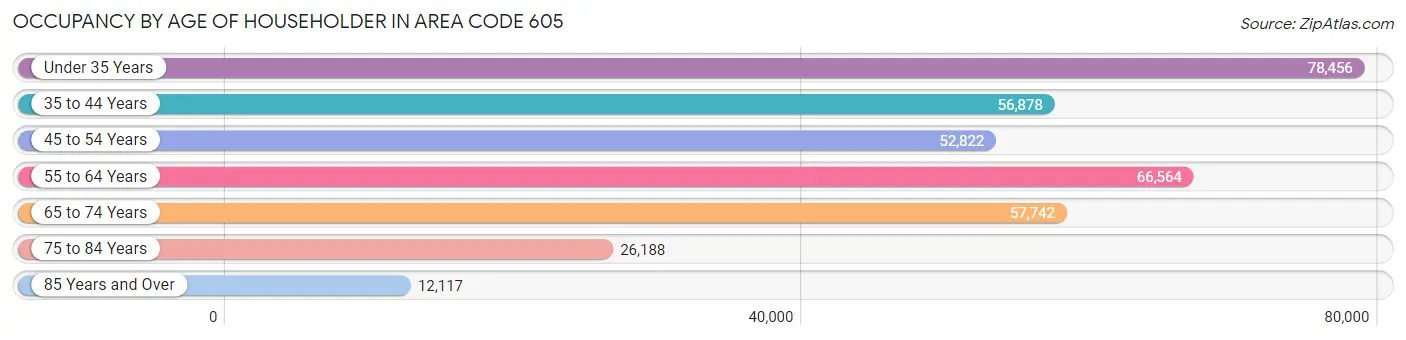
| Age Bracket | # Households | % Households |
| Under 35 Years | 78,456 | 22.4% |
| 35 to 44 Years | 56,878 | 16.2% |
| 45 to 54 Years | 52,822 | 15.1% |
| 55 to 64 Years | 66,564 | 19.0% |
| 65 to 74 Years | 57,742 | 16.5% |
| 75 to 84 Years | 26,188 | 7.5% |
| 85 Years and Over | 12,117 | 3.5% |
| Total | 350,767 | 100.0% |
Housing Finances in Area Code 605
Median Income by Occupancy in Area Code 605
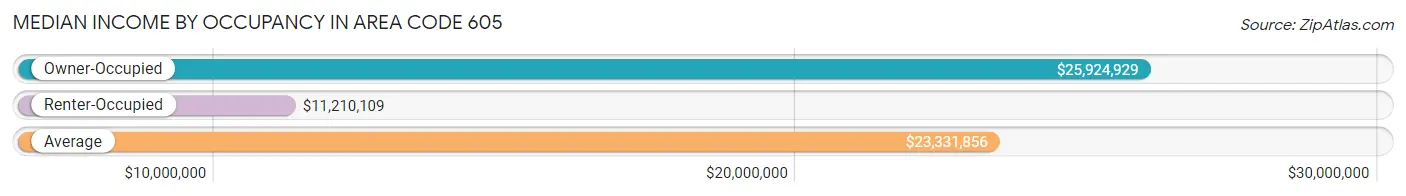
| Occupancy Type | # Households | Median Income |
| Owner-Occupied | 240,129 (68.5%) | $25,924,929 |
| Renter-Occupied | 110,638 (31.5%) | $11,210,109 |
| Average | 350,767 (100.0%) | $23,331,856 |
Occupancy by Householder Income Bracket in Area Code 605
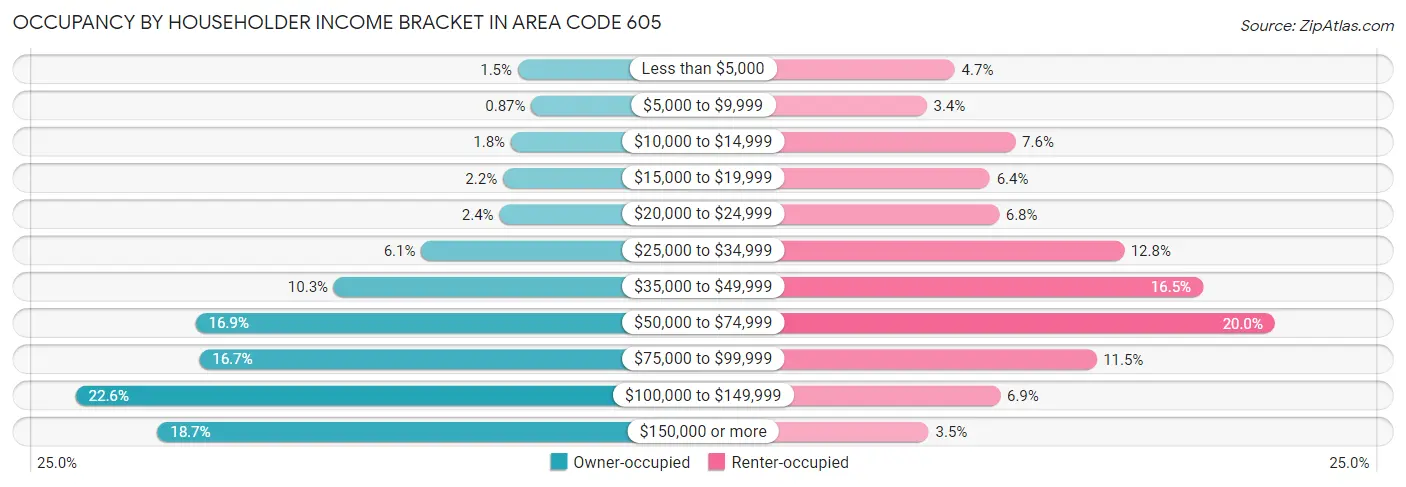
| Income Bracket | Owner-occupied | Renter-occupied |
| Less than $5,000 | 3,620 (1.5%) | 5,221 (4.7%) |
| $5,000 to $9,999 | 2,093 (0.9%) | 3,735 (3.4%) |
| $10,000 to $14,999 | 4,423 (1.8%) | 8,414 (7.6%) |
| $15,000 to $19,999 | 5,324 (2.2%) | 7,075 (6.4%) |
| $20,000 to $24,999 | 5,733 (2.4%) | 7,541 (6.8%) |
| $25,000 to $34,999 | 14,663 (6.1%) | 14,124 (12.8%) |
| $35,000 to $49,999 | 24,657 (10.3%) | 18,304 (16.5%) |
| $50,000 to $74,999 | 40,494 (16.9%) | 22,084 (20.0%) |
| $75,000 to $99,999 | 40,065 (16.7%) | 12,675 (11.5%) |
| $100,000 to $149,999 | 54,193 (22.6%) | 7,617 (6.9%) |
| $150,000 or more | 44,864 (18.7%) | 3,848 (3.5%) |
| Total | 240,129 (100.0%) | 110,638 (100.0%) |
Monthly Housing Cost Tiers in Area Code 605
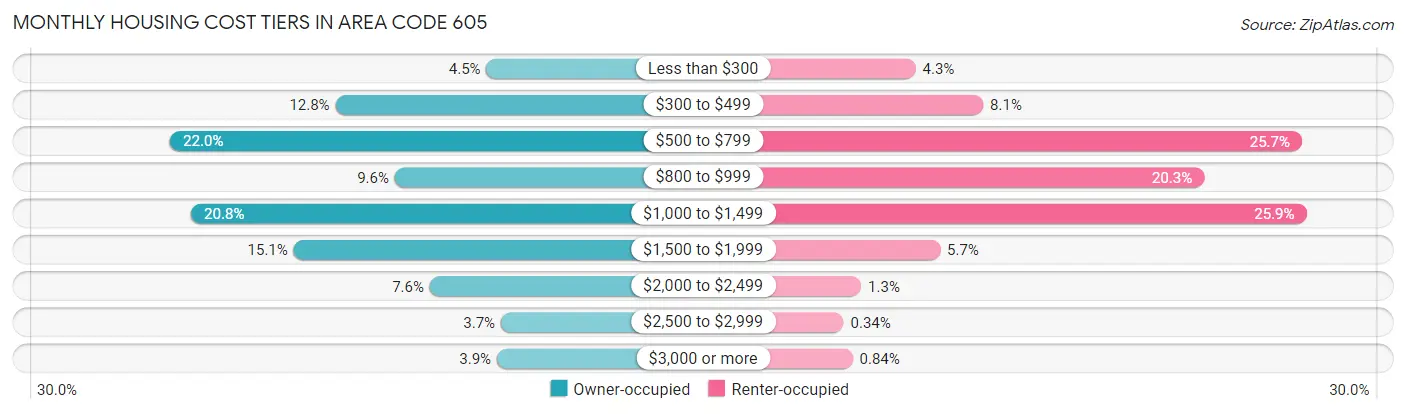
| Monthly Cost | Owner-occupied | Renter-occupied |
| Less than $300 | 10,791 (4.5%) | 4,785 (4.3%) |
| $300 to $499 | 30,819 (12.8%) | 8,911 (8.1%) |
| $500 to $799 | 52,729 (22.0%) | 28,380 (25.7%) |
| $800 to $999 | 22,934 (9.6%) | 22,407 (20.3%) |
| $1,000 to $1,499 | 49,943 (20.8%) | 28,653 (25.9%) |
| $1,500 to $1,999 | 36,354 (15.1%) | 6,273 (5.7%) |
| $2,000 to $2,499 | 18,297 (7.6%) | 1,447 (1.3%) |
| $2,500 to $2,999 | 8,863 (3.7%) | 373 (0.3%) |
| $3,000 or more | 9,399 (3.9%) | 930 (0.8%) |
| Total | 240,129 (100.0%) | 110,638 (100.0%) |
Physical Housing Characteristics in Area Code 605
Housing Structures in Area Code 605
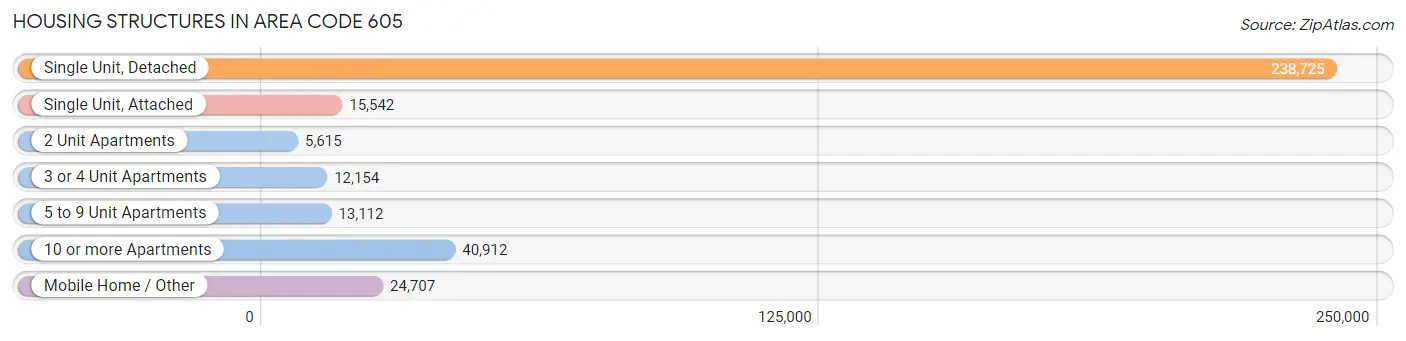
| Structure Type | # Housing Units | % Housing Units |
| Single Unit, Detached | 238,725 | 68.1% |
| Single Unit, Attached | 15,542 | 4.4% |
| 2 Unit Apartments | 5,615 | 1.6% |
| 3 or 4 Unit Apartments | 12,154 | 3.5% |
| 5 to 9 Unit Apartments | 13,112 | 3.7% |
| 10 or more Apartments | 40,912 | 11.7% |
| Mobile Home / Other | 24,707 | 7.0% |
| Total | 350,767 | 100.0% |
Housing Structures by Occupancy in Area Code 605
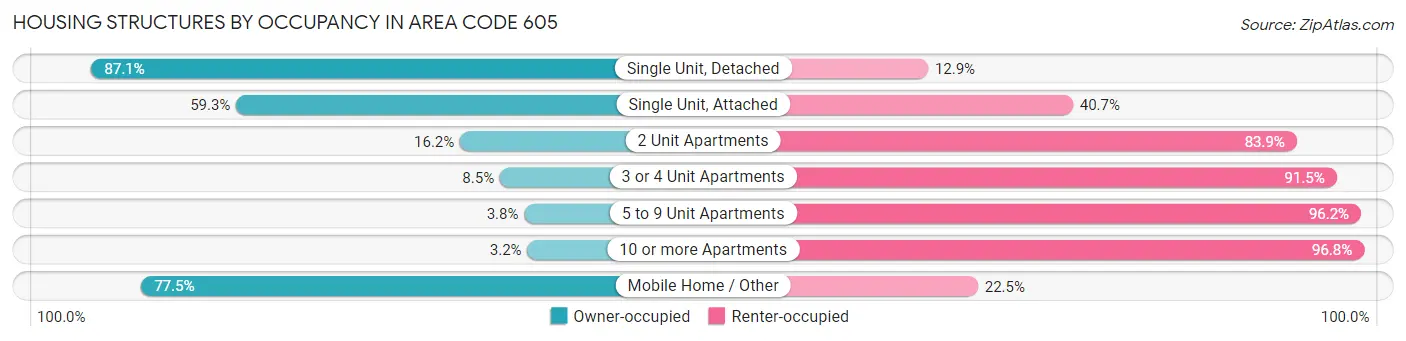
| Structure Type | Owner-occupied | Renter-occupied |
| Single Unit, Detached | 208,022 (87.1%) | 30,703 (12.9%) |
| Single Unit, Attached | 9,210 (59.3%) | 6,332 (40.7%) |
| 2 Unit Apartments | 907 (16.2%) | 4,708 (83.9%) |
| 3 or 4 Unit Apartments | 1,030 (8.5%) | 11,124 (91.5%) |
| 5 to 9 Unit Apartments | 496 (3.8%) | 12,616 (96.2%) |
| 10 or more Apartments | 1,306 (3.2%) | 39,606 (96.8%) |
| Mobile Home / Other | 19,158 (77.5%) | 5,549 (22.5%) |
| Total | 240,129 (68.5%) | 110,638 (31.5%) |
Housing Structures by Number of Rooms in Area Code 605
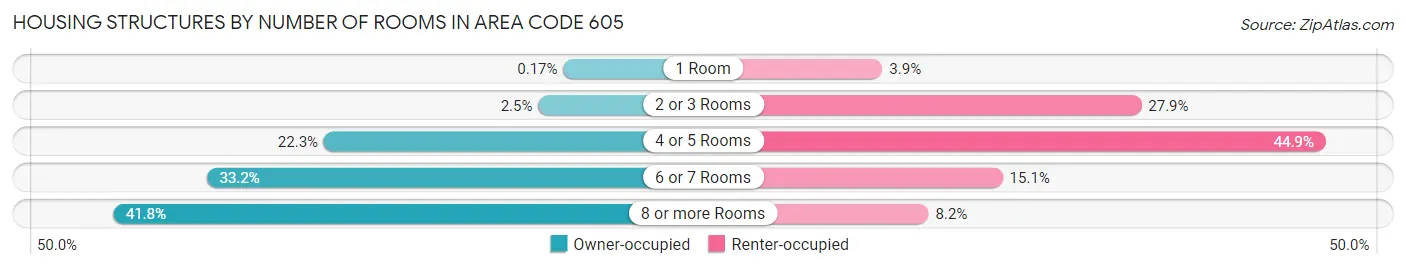
| Number of Rooms | Owner-occupied | Renter-occupied |
| 1 Room | 417 (0.2%) | 4,350 (3.9%) |
| 2 or 3 Rooms | 5,983 (2.5%) | 30,844 (27.9%) |
| 4 or 5 Rooms | 53,585 (22.3%) | 49,716 (44.9%) |
| 6 or 7 Rooms | 79,679 (33.2%) | 16,655 (15.0%) |
| 8 or more Rooms | 100,465 (41.8%) | 9,073 (8.2%) |
| Total | 240,129 (100.0%) | 110,638 (100.0%) |
Housing Structure by Heating Type in Area Code 605
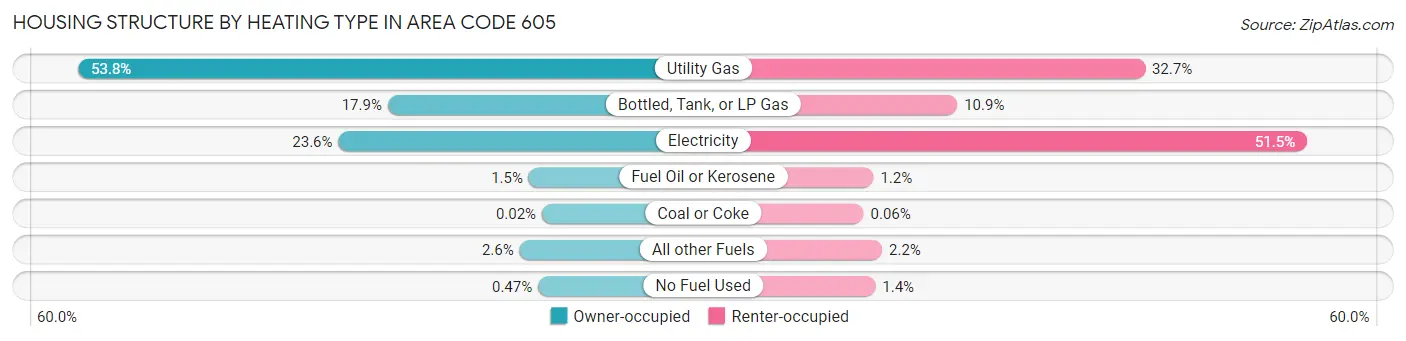
| Heating Type | Owner-occupied | Renter-occupied |
| Utility Gas | 129,218 (53.8%) | 36,166 (32.7%) |
| Bottled, Tank, or LP Gas | 42,995 (17.9%) | 12,084 (10.9%) |
| Electricity | 56,717 (23.6%) | 56,947 (51.5%) |
| Fuel Oil or Kerosene | 3,704 (1.5%) | 1,341 (1.2%) |
| Coal or Coke | 54 (0.0%) | 64 (0.1%) |
| All other Fuels | 6,302 (2.6%) | 2,450 (2.2%) |
| No Fuel Used | 1,139 (0.5%) | 1,586 (1.4%) |
| Total | 240,129 (100.0%) | 110,638 (100.0%) |
Household Vehicle Usage in Area Code 605
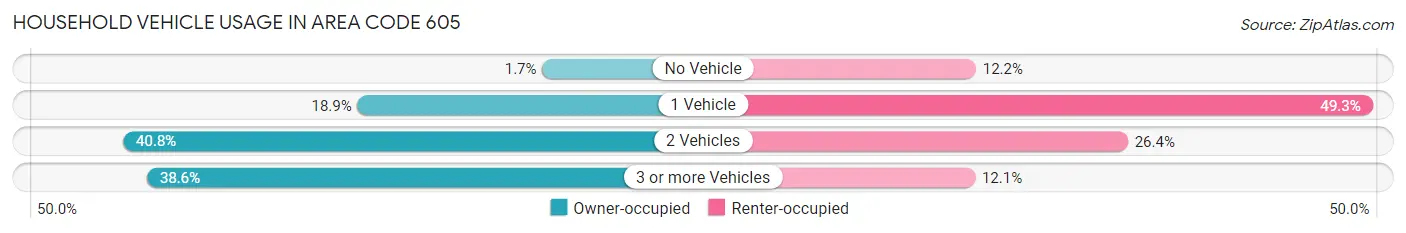
| Vehicles per Household | Owner-occupied | Renter-occupied |
| No Vehicle | 4,021 (1.7%) | 13,519 (12.2%) |
| 1 Vehicle | 45,438 (18.9%) | 54,486 (49.2%) |
| 2 Vehicles | 98,015 (40.8%) | 29,206 (26.4%) |
| 3 or more Vehicles | 92,655 (38.6%) | 13,427 (12.1%) |
| Total | 240,129 (100.0%) | 110,638 (100.0%) |
Real Estate & Mortgages in Area Code 605
Real Estate and Mortgage Overview in Area Code 605
| Characteristic | Without Mortgage | With Mortgage |
| Housing Units | 108,409 | 131,720 |
| Median Property Value | $44,473,197 | $51,917,600 |
| Median Household Income | $21,590,381 | $29,281 |
| Monthly Housing Costs | $188,941 | $9,275 |
| Real Estate Taxes | $490,157 | $2,704 |
Property Value by Mortgage Status in Area Code 605
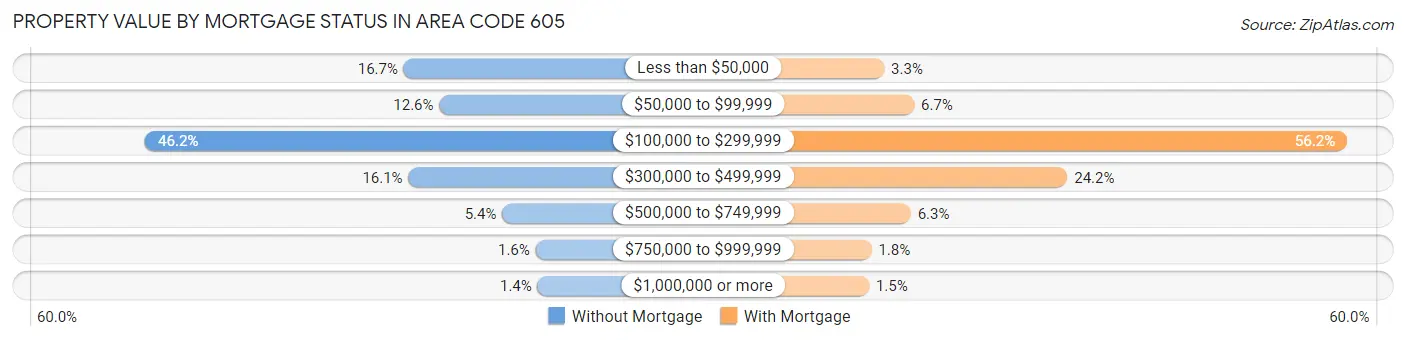
| Property Value | Without Mortgage | With Mortgage |
| Less than $50,000 | 18,065 (16.7%) | 4,301 (3.3%) |
| $50,000 to $99,999 | 13,664 (12.6%) | 8,815 (6.7%) |
| $100,000 to $299,999 | 50,108 (46.2%) | 74,000 (56.2%) |
| $300,000 to $499,999 | 17,489 (16.1%) | 31,872 (24.2%) |
| $500,000 to $749,999 | 5,869 (5.4%) | 8,311 (6.3%) |
| $750,000 to $999,999 | 1,732 (1.6%) | 2,401 (1.8%) |
| $1,000,000 or more | 1,482 (1.4%) | 2,020 (1.5%) |
| Total | 108,409 (100.0%) | 131,720 (100.0%) |
Household Income by Mortgage Status in Area Code 605
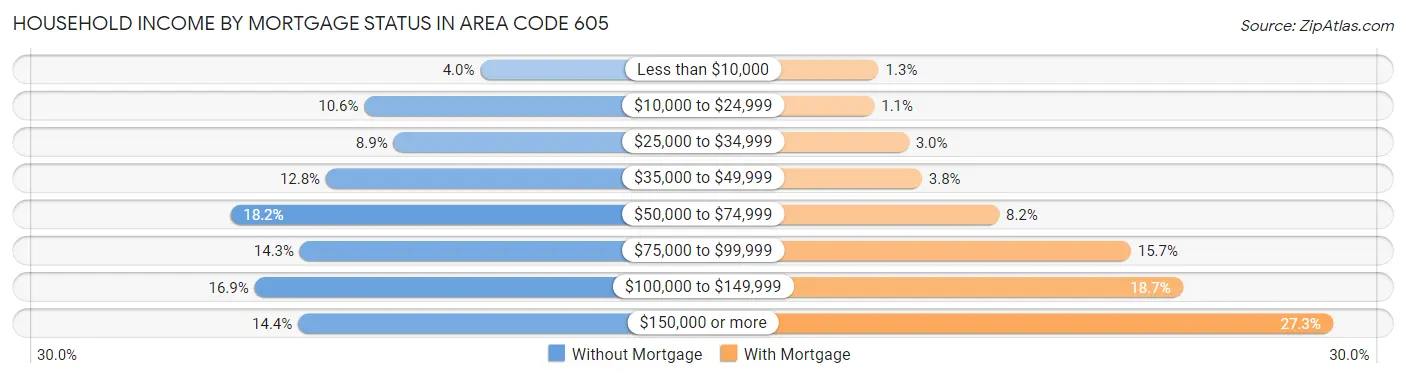
| Household Income | Without Mortgage | With Mortgage |
| Less than $10,000 | 4,298 (4.0%) | 1,737 (1.3%) |
| $10,000 to $24,999 | 11,479 (10.6%) | 1,415 (1.1%) |
| $25,000 to $34,999 | 9,672 (8.9%) | 4,001 (3.0%) |
| $35,000 to $49,999 | 13,859 (12.8%) | 4,991 (3.8%) |
| $50,000 to $74,999 | 19,774 (18.2%) | 10,798 (8.2%) |
| $75,000 to $99,999 | 15,465 (14.3%) | 20,720 (15.7%) |
| $100,000 to $149,999 | 18,279 (16.9%) | 24,600 (18.7%) |
| $150,000 or more | 15,583 (14.4%) | 35,914 (27.3%) |
| Total | 108,409 (100.0%) | 131,720 (100.0%) |
Property Value to Household Income Ratio in Area Code 605
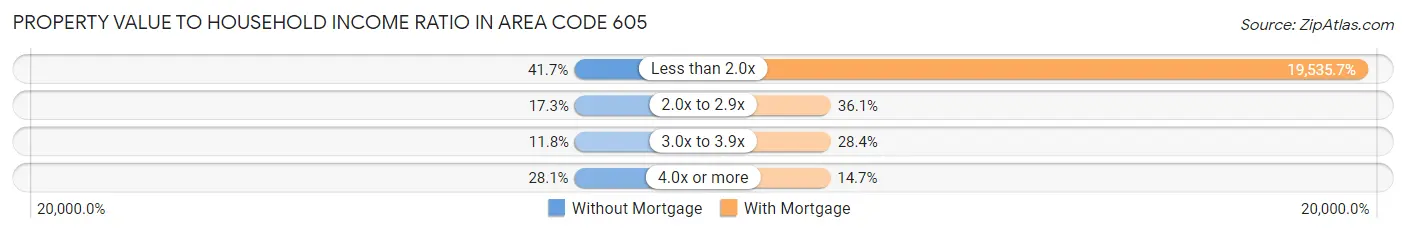
| Value-to-Income Ratio | Without Mortgage | With Mortgage |
| Less than 2.0x | 45,197 (41.7%) | 25,732,387 (19,535.7%) |
| 2.0x to 2.9x | 18,792 (17.3%) | 47,593 (36.1%) |
| 3.0x to 3.9x | 12,786 (11.8%) | 37,378 (28.4%) |
| 4.0x or more | 30,418 (28.1%) | 19,417 (14.7%) |
| Total | 108,409 (100.0%) | 131,720 (100.0%) |
Real Estate Taxes by Mortgage Status in Area Code 605
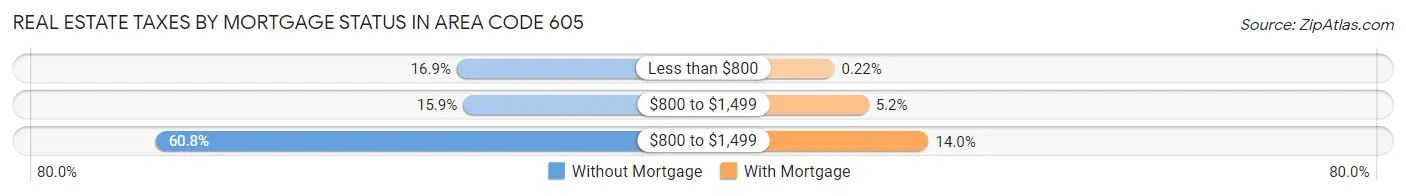
| Property Taxes | Without Mortgage | With Mortgage |
| Less than $800 | 18,282 (16.9%) | 289 (0.2%) |
| $800 to $1,499 | 17,276 (15.9%) | 6,859 (5.2%) |
| $800 to $1,499 | 65,951 (60.8%) | 18,385 (14.0%) |
| Total | 108,409 (100.0%) | 131,720 (100.0%) |
Health & Disability in Area Code 605
Health Insurance Coverage by Age in Area Code 605
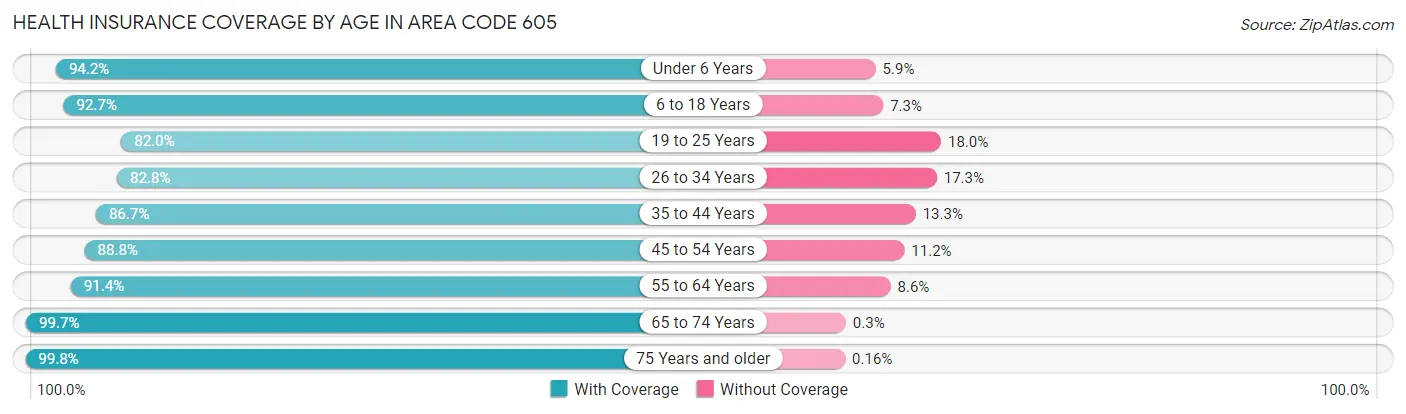
| Age Bracket | With Coverage | Without Coverage |
| Under 6 Years | 65,873 (94.2%) | 4,092 (5.9%) |
| 6 to 18 Years | 145,926 (92.7%) | 11,430 (7.3%) |
| 19 to 25 Years | 66,340 (82.0%) | 14,602 (18.0%) |
| 26 to 34 Years | 82,630 (82.8%) | 17,230 (17.2%) |
| 35 to 44 Years | 92,671 (86.7%) | 14,240 (13.3%) |
| 45 to 54 Years | 83,242 (88.8%) | 10,509 (11.2%) |
| 55 to 64 Years | 104,732 (91.4%) | 9,899 (8.6%) |
| 65 to 74 Years | 90,347 (99.7%) | 274 (0.3%) |
| 75 Years and older | 55,618 (99.8%) | 91 (0.2%) |
| Total | 787,379 (90.5%) | 82,367 (9.5%) |
Health Insurance Coverage by Citizenship Status in Area Code 605
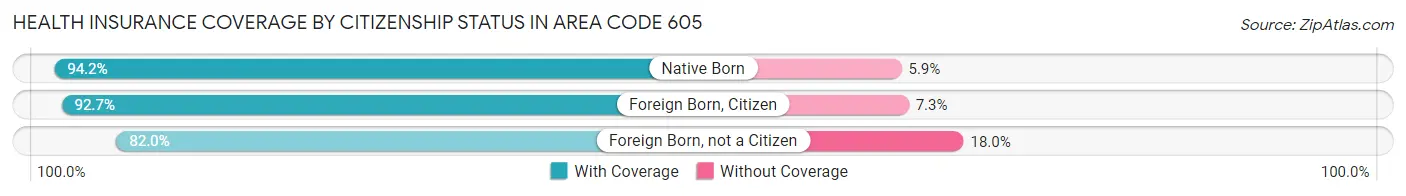
| Citizenship Status | With Coverage | Without Coverage |
| Native Born | 65,873 (94.2%) | 4,092 (5.9%) |
| Foreign Born, Citizen | 145,926 (92.7%) | 11,430 (7.3%) |
| Foreign Born, not a Citizen | 66,340 (82.0%) | 14,602 (18.0%) |
Health Insurance Coverage by Household Income in Area Code 605
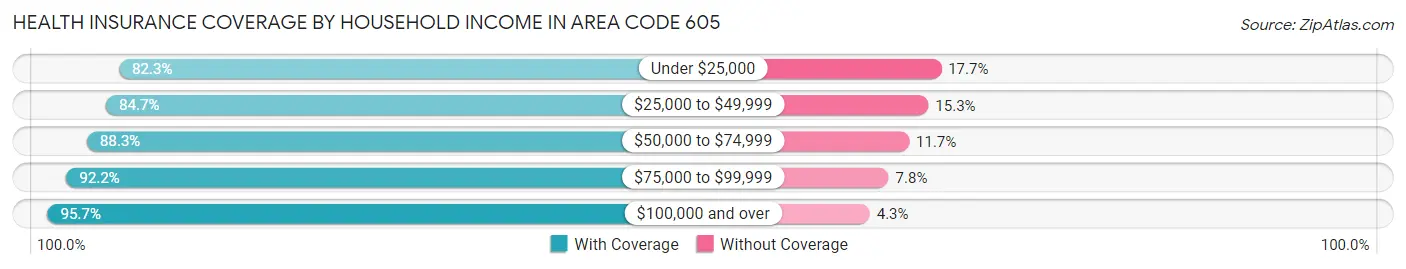
| Household Income | With Coverage | Without Coverage |
| Under $25,000 | 76,109 (82.3%) | 16,356 (17.7%) |
| $25,000 to $49,999 | 118,202 (84.7%) | 21,337 (15.3%) |
| $50,000 to $74,999 | 126,985 (88.3%) | 16,797 (11.7%) |
| $75,000 to $99,999 | 127,572 (92.2%) | 10,854 (7.8%) |
| $100,000 and over | 325,275 (95.7%) | 14,660 (4.3%) |
Public vs Private Health Insurance Coverage by Age in Area Code 605
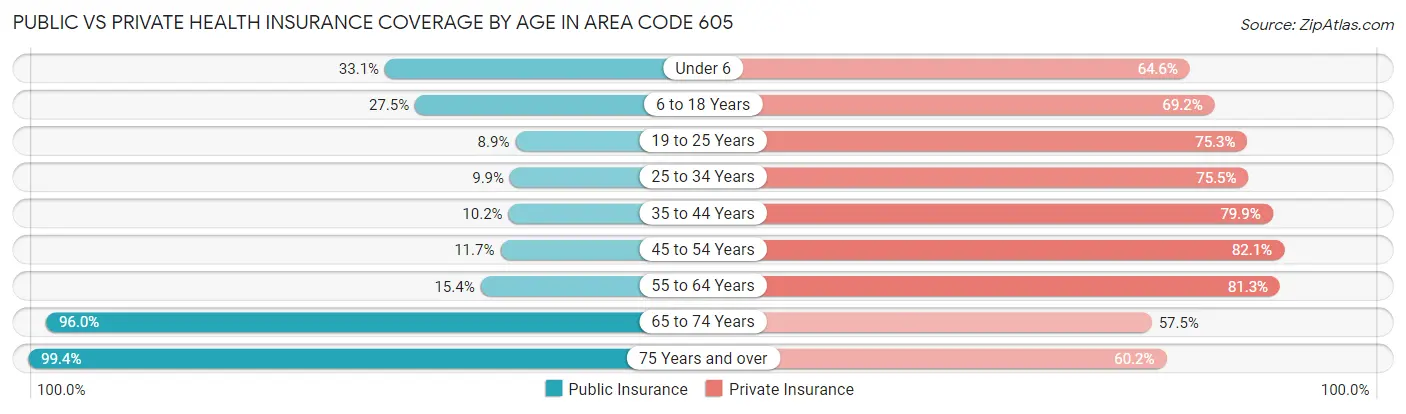
| Age Bracket | Public Insurance | Private Insurance |
| Under 6 | 23,174 (33.1%) | 45,190 (64.6%) |
| 6 to 18 Years | 43,322 (27.5%) | 108,869 (69.2%) |
| 19 to 25 Years | 7,231 (8.9%) | 60,915 (75.3%) |
| 25 to 34 Years | 9,917 (9.9%) | 75,357 (75.5%) |
| 35 to 44 Years | 10,904 (10.2%) | 85,467 (79.9%) |
| 45 to 54 Years | 10,988 (11.7%) | 76,932 (82.1%) |
| 55 to 64 Years | 17,627 (15.4%) | 93,223 (81.3%) |
| 65 to 74 Years | 87,027 (96.0%) | 52,128 (57.5%) |
| 75 Years and over | 55,346 (99.4%) | 33,561 (60.2%) |
| Total | 265,536 (30.5%) | 631,642 (72.6%) |
Disability Status by Sex by Age in Area Code 605
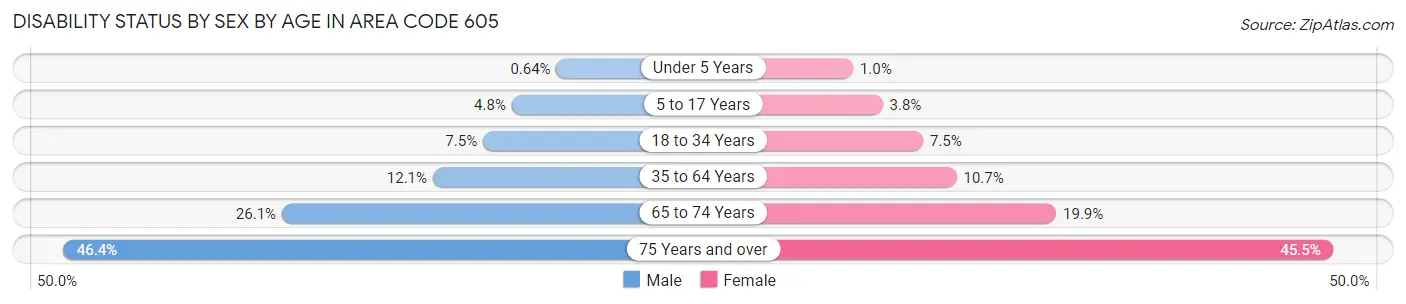
| Age Bracket | Male | Female |
| Under 5 Years | 187 (0.6%) | 297 (1.0%) |
| 5 to 17 Years | 3,861 (4.8%) | 2,917 (3.8%) |
| 18 to 34 Years | 7,365 (7.5%) | 7,065 (7.5%) |
| 35 to 64 Years | 19,498 (12.1%) | 16,423 (10.6%) |
| 65 to 74 Years | 11,952 (26.1%) | 8,923 (19.9%) |
| 75 Years and over | 10,944 (46.4%) | 14,616 (45.5%) |
Disability Class by Sex by Age in Area Code 605
Disability Class: Hearing Difficulty
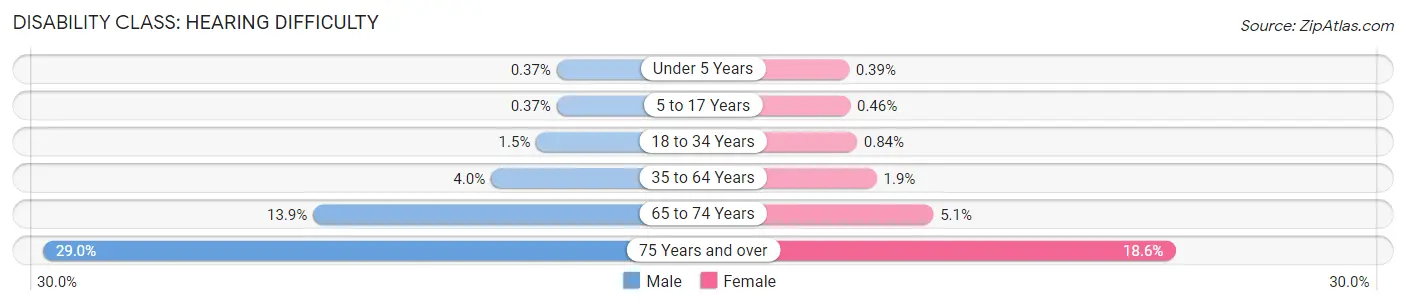
| Age Bracket | Male | Female |
| Under 5 Years | 109 (0.4%) | 111 (0.4%) |
| 5 to 17 Years | 295 (0.4%) | 351 (0.5%) |
| 18 to 34 Years | 1,490 (1.5%) | 793 (0.8%) |
| 35 to 64 Years | 6,489 (4.0%) | 2,986 (1.9%) |
| 65 to 74 Years | 6,378 (13.9%) | 2,284 (5.1%) |
| 75 Years and over | 6,842 (29.0%) | 5,957 (18.6%) |
Disability Class: Vision Difficulty
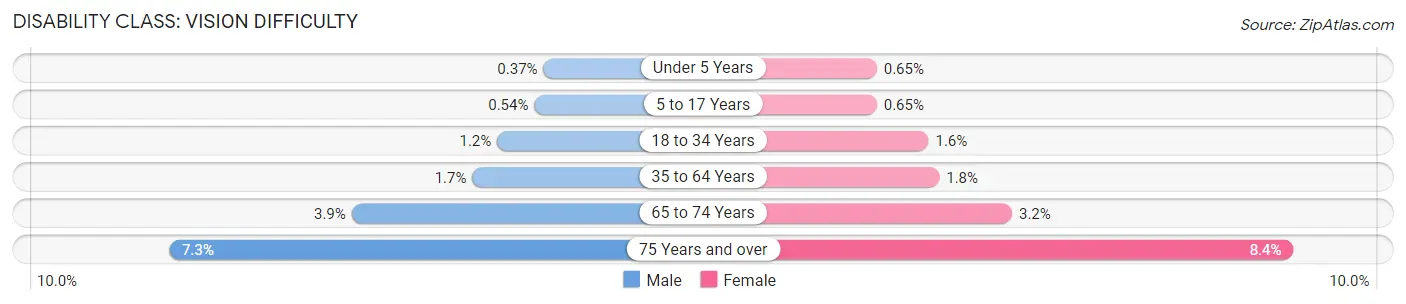
| Age Bracket | Male | Female |
| Under 5 Years | 107 (0.4%) | 186 (0.6%) |
| 5 to 17 Years | 433 (0.5%) | 499 (0.6%) |
| 18 to 34 Years | 1,216 (1.2%) | 1,513 (1.6%) |
| 35 to 64 Years | 2,718 (1.7%) | 2,789 (1.8%) |
| 65 to 74 Years | 1,798 (3.9%) | 1,416 (3.2%) |
| 75 Years and over | 1,728 (7.3%) | 2,689 (8.4%) |
Disability Class: Cognitive Difficulty
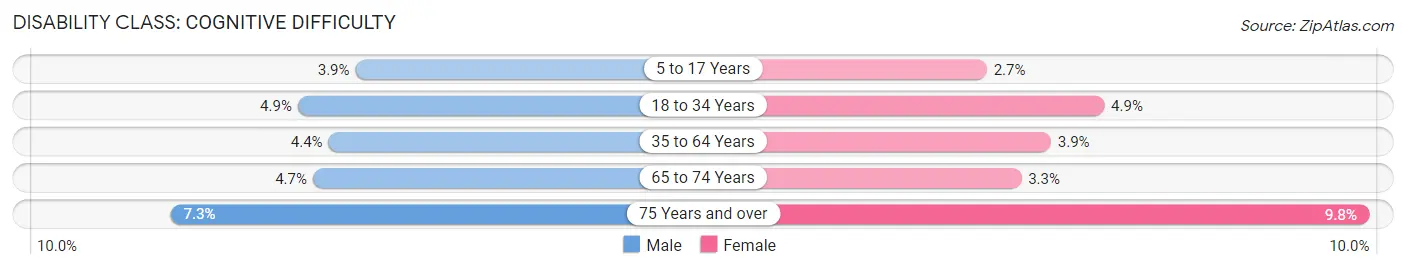
| Age Bracket | Male | Female |
| 5 to 17 Years | 3,108 (3.9%) | 2,068 (2.7%) |
| 18 to 34 Years | 4,871 (4.9%) | 4,568 (4.9%) |
| 35 to 64 Years | 7,020 (4.4%) | 5,990 (3.9%) |
| 65 to 74 Years | 2,126 (4.6%) | 1,494 (3.3%) |
| 75 Years and over | 1,722 (7.3%) | 3,138 (9.8%) |
Disability Class: Ambulatory Difficulty
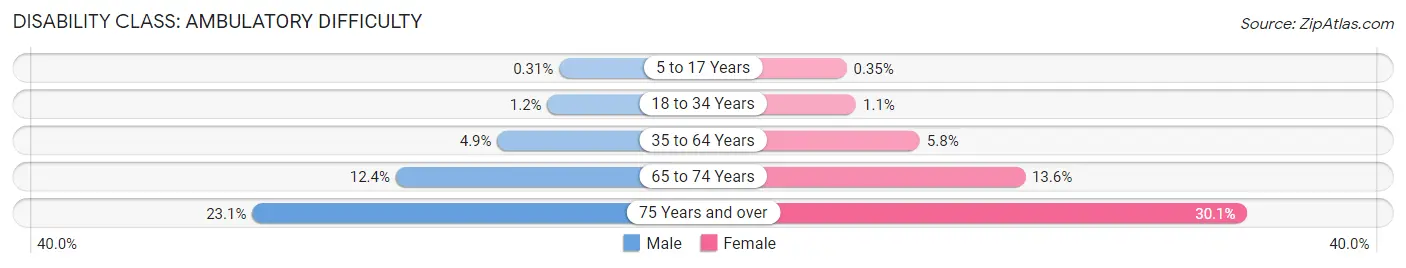
| Age Bracket | Male | Female |
| 5 to 17 Years | 249 (0.3%) | 273 (0.4%) |
| 18 to 34 Years | 1,163 (1.2%) | 991 (1.1%) |
| 35 to 64 Years | 7,889 (4.9%) | 8,950 (5.8%) |
| 65 to 74 Years | 5,694 (12.4%) | 6,103 (13.6%) |
| 75 Years and over | 5,454 (23.1%) | 9,666 (30.1%) |
Disability Class: Self-Care Difficulty
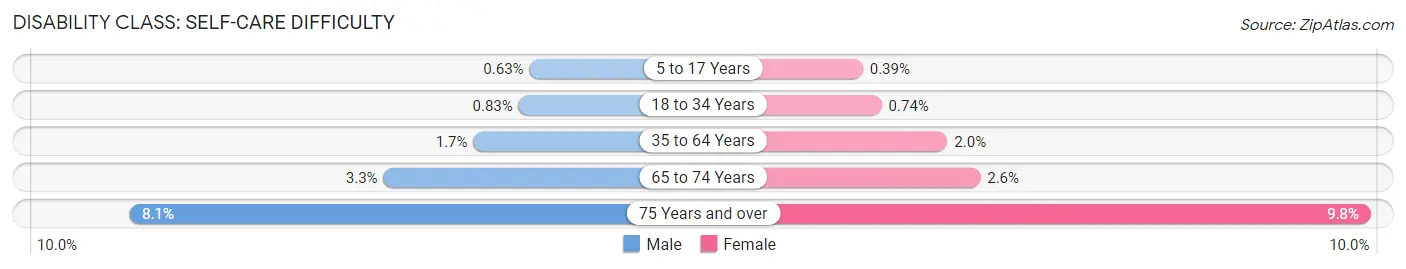
| Age Bracket | Male | Female |
| 5 to 17 Years | 504 (0.6%) | 300 (0.4%) |
| 18 to 34 Years | 823 (0.8%) | 696 (0.7%) |
| 35 to 64 Years | 2,684 (1.7%) | 3,026 (2.0%) |
| 65 to 74 Years | 1,530 (3.3%) | 1,154 (2.6%) |
| 75 Years and over | 1,904 (8.1%) | 3,151 (9.8%) |
Technology Access in Area Code 605
Computing Device Access in Area Code 605
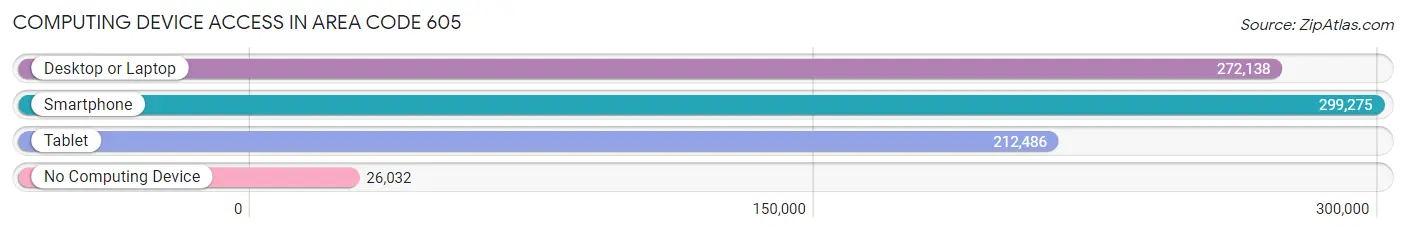
| Device Type | # Households | % Households |
| Desktop or Laptop | 272,138 | 77.6% |
| Smartphone | 299,275 | 85.3% |
| Tablet | 212,486 | 60.6% |
| No Computing Device | 26,032 | 7.4% |
| Total | 350,767 | 100.0% |
Internet Access in Area Code 605
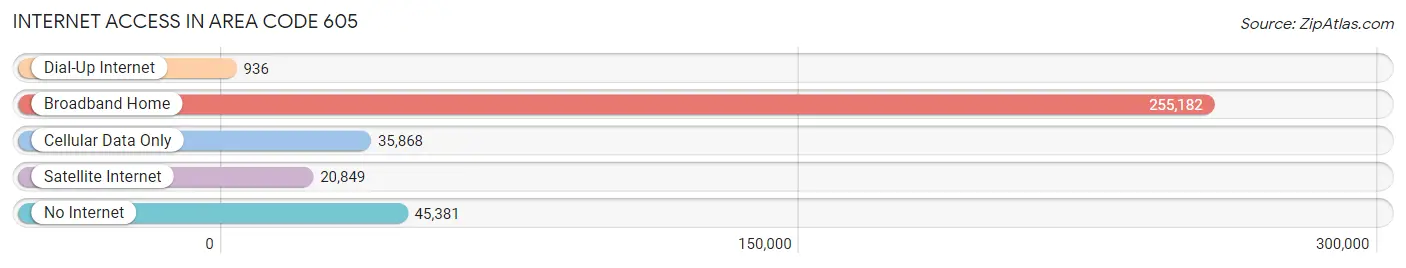
| Internet Type | # Households | % Households |
| Dial-Up Internet | 936 | 0.3% |
| Broadband Home | 255,182 | 72.8% |
| Cellular Data Only | 35,868 | 10.2% |
| Satellite Internet | 20,849 | 5.9% |
| No Internet | 45,381 | 12.9% |
| Total | 350,767 | 100.0% |
Area Code 605 Summary
Geography
Area code 605 is a telephone area code in the North American Numbering Plan (NANP) for the state of South Dakota. It was created in 1947 as one of the original 86 area codes. It covers the entire state of South Dakota, including the cities of Sioux Falls, Rapid City, Aberdeen, and Watertown.
Social
Area code 605 is a source of pride for South Dakotans, as it is the only area code that covers the entire state. It is also a source of connection, as it allows people to stay in touch with friends and family across the state.
Economics
Area code 605 is an important part of the South Dakota economy. It is used by businesses to reach customers, and by individuals to stay connected with their networks. It is also used by government agencies to provide services to citizens.
Demographics
Area code 605 is home to a diverse population. According to the U.S. Census Bureau, the population of South Dakota is approximately 882,235, with a median age of 38.7 years. The population is predominantly white (84.3%), with the remaining population made up of Native American (8.7%), African American (2.2%), Asian (1.3%), and other races (3.5%).
Common Questions
What is Per Capita Income in Area Code 605?
Per Capita income in Area Code 605 is $36,174.
What is the Median Family Income in Area Code 605?
Median Family Income in Area Code 605 is $83,759.
What is the Median Household income in Area Code 605?
Median Household Income in Area Code 605 is $68,422.
What is Income or Wage Gap in Area Code 605?
Income or Wage Gap in Area Code 605 is 31.7%.
Women in Area Code 605 earn 68.3 cents for every dollar earned by a man.
What is Family Income Deficit in Area Code 605?
Family Income Deficit in Area Code 605 is $11,980.
Families that are below poverty line in Area Code 605 earn $11,980 less on average than the poverty threshold level.
What is Inequality or Gini Index in Area Code 605?
Inequality or Gini Index in Area Code 605 is 148.53.
What is the Total Population of Area Code 605?
Total Population of Area Code 605 is 889,030.
What is the Total Male Population of Area Code 605?
Total Male Population of Area Code 605 is 451,081.
What is the Total Female Population of Area Code 605?
Total Female Population of Area Code 605 is 437,949.
What is the Ratio of Males per 100 Females in Area Code 605?
There are 103.00 Males per 100 Females in Area Code 605.
What is the Ratio of Females per 100 Males in Area Code 605?
There are 97.09 Females per 100 Males in Area Code 605.
What is the Median Population Age in Area Code 605?
Median Population Age in Area Code 605 is 42.1 Years.
What is the Average Family Size in Area Code 605
Average Family Size in Area Code 605 is 3.2 People.
What is the Average Household Size in Area Code 605
Average Household Size in Area Code 605 is 2.7 People.
How Large is the Labor Force in Area Code 605?
There are 441,993 People in the Labor Forcein in Area Code 605.
What is the Percentage of People in the Labor Force in Area Code 605?
63.4% of People are in the Labor Force in Area Code 605.
What is the Unemployment Rate in Area Code 605?
Unemployment Rate in Area Code 605 is 6.4%.