Brookings, SD Map & Demographics
Brookings Map
Brookings Overview
$29,284
PER CAPITA INCOME
$95,804
AVG FAMILY INCOME
$57,824
AVG HOUSEHOLD INCOME
24.6%
WAGE / INCOME GAP [ % ]
75.4¢/ $1
WAGE / INCOME GAP [ $ ]
0.41
INEQUALITY / GINI INDEX
23,530
TOTAL POPULATION
12,005
MALE POPULATION
11,525
FEMALE POPULATION
104.16
MALES / 100 FEMALES
96.00
FEMALES / 100 MALES
24.5
MEDIAN AGE
3.2
AVG FAMILY SIZE
2.3
AVG HOUSEHOLD SIZE
13,921
LABOR FORCE [ PEOPLE ]
70.1%
PERCENT IN LABOR FORCE
5.1%
UNEMPLOYMENT RATE
Brookings Area Codes
Income in Brookings
Income Overview in Brookings
Per Capita Income in Brookings is $29,284, while median incomes of families and households are $95,804 and $57,824 respectively.
| Characteristic | Number | Measure |
| Per Capita Income | 23,530 | $29,284 |
| Median Family Income | 3,819 | $95,804 |
| Mean Family Income | 3,819 | $104,006 |
| Median Household Income | 8,766 | $57,824 |
| Mean Household Income | 8,766 | $75,173 |
| Income Deficit | 3,819 | $0 |
| Wage / Income Gap (%) | 23,530 | 24.63% |
| Wage / Income Gap ($) | 23,530 | 75.37¢ per $1 |
| Gini / Inequality Index | 23,530 | 0.41 |
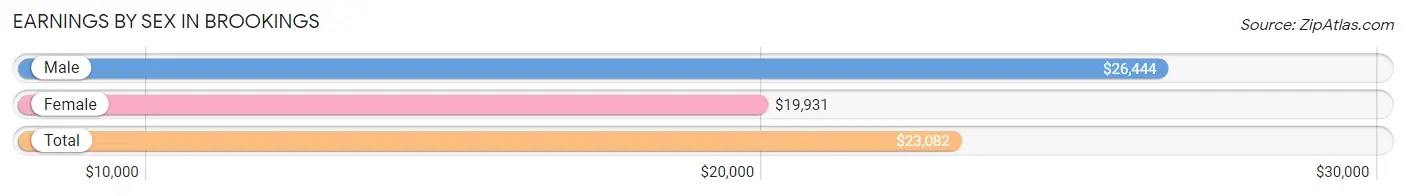
Earnings by Sex in Brookings
Average Earnings in Brookings are $23,082, $26,444 for men and $19,931 for women, a difference of 24.6%.
| Sex | Number | Average Earnings |
| Male | 8,534 (52.8%) | $26,444 |
| Female | 7,635 (47.2%) | $19,931 |
| Total | 16,169 (100.0%) | $23,082 |
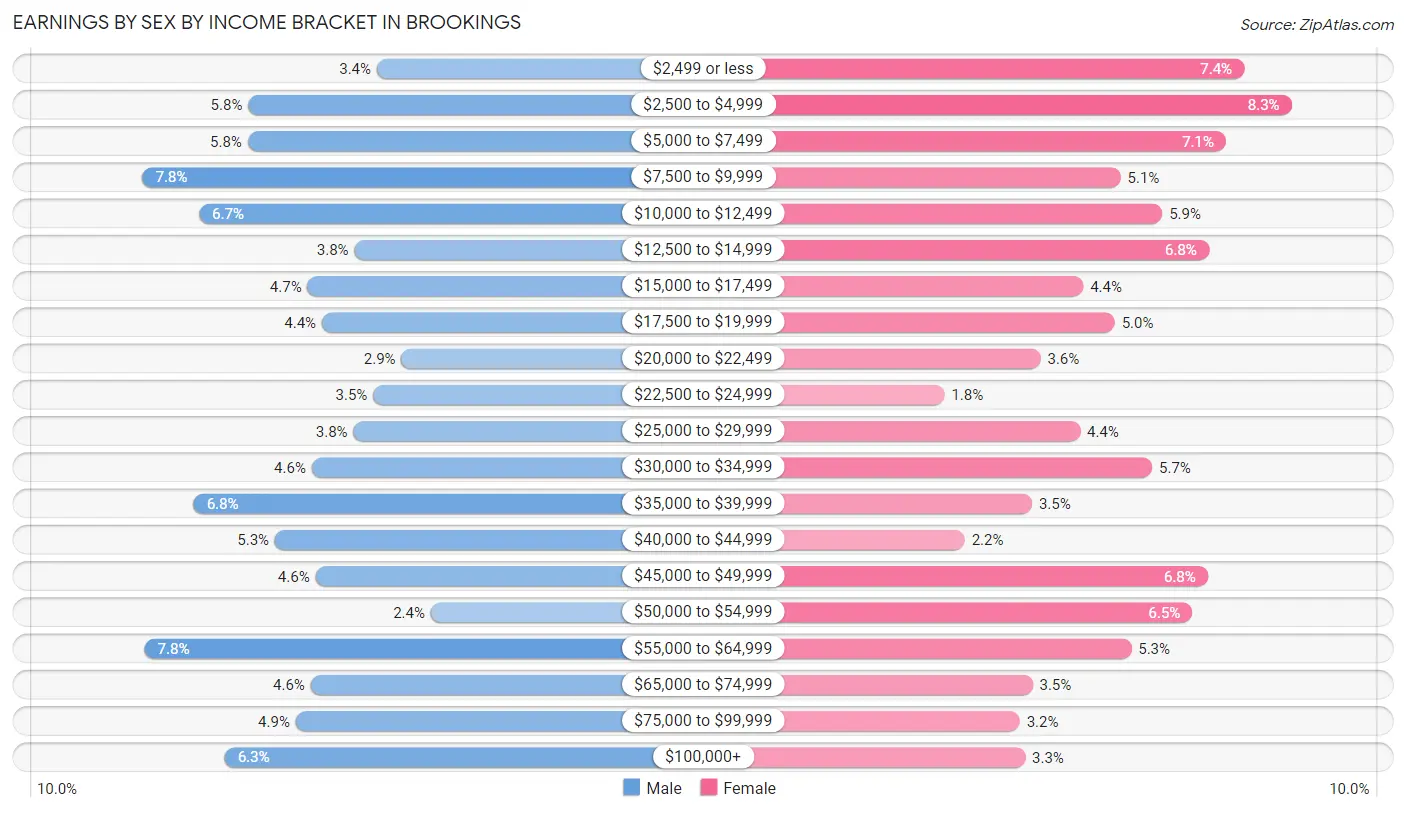
Earnings by Sex by Income Bracket in Brookings
The most common earnings brackets in Brookings are $7,500 to $9,999 for men (665 | 7.8%) and $2,500 to $4,999 for women (636 | 8.3%).
| Income | Male | Female |
| $2,499 or less | 290 (3.4%) | 568 (7.4%) |
| $2,500 to $4,999 | 496 (5.8%) | 636 (8.3%) |
| $5,000 to $7,499 | 497 (5.8%) | 542 (7.1%) |
| $7,500 to $9,999 | 665 (7.8%) | 392 (5.1%) |
| $10,000 to $12,499 | 574 (6.7%) | 451 (5.9%) |
| $12,500 to $14,999 | 326 (3.8%) | 518 (6.8%) |
| $15,000 to $17,499 | 401 (4.7%) | 338 (4.4%) |
| $17,500 to $19,999 | 378 (4.4%) | 383 (5.0%) |
| $20,000 to $22,499 | 251 (2.9%) | 277 (3.6%) |
| $22,500 to $24,999 | 296 (3.5%) | 140 (1.8%) |
| $25,000 to $29,999 | 328 (3.8%) | 334 (4.4%) |
| $30,000 to $34,999 | 394 (4.6%) | 437 (5.7%) |
| $35,000 to $39,999 | 583 (6.8%) | 265 (3.5%) |
| $40,000 to $44,999 | 453 (5.3%) | 169 (2.2%) |
| $45,000 to $49,999 | 388 (4.5%) | 516 (6.8%) |
| $50,000 to $54,999 | 204 (2.4%) | 494 (6.5%) |
| $55,000 to $64,999 | 661 (7.7%) | 407 (5.3%) |
| $65,000 to $74,999 | 396 (4.6%) | 266 (3.5%) |
| $75,000 to $99,999 | 420 (4.9%) | 247 (3.2%) |
| $100,000+ | 533 (6.2%) | 255 (3.3%) |
| Total | 8,534 (100.0%) | 7,635 (100.0%) |
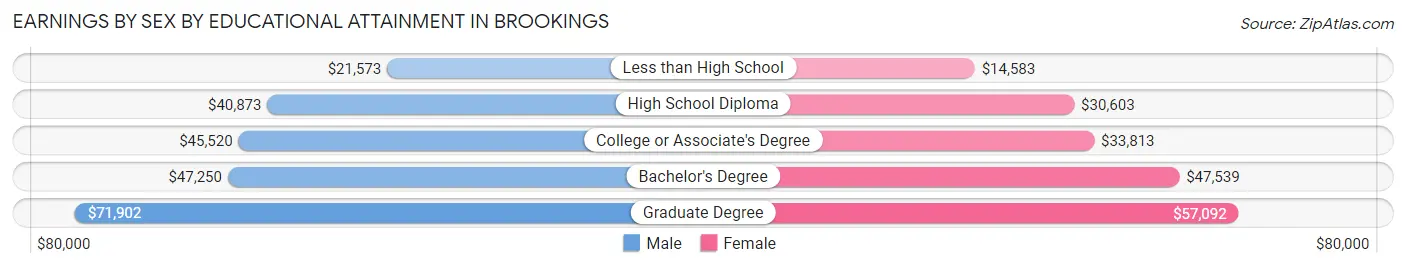
Earnings by Sex by Educational Attainment in Brookings
Average earnings in Brookings are $46,845 for men and $43,764 for women, a difference of 6.6%. Men with an educational attainment of graduate degree enjoy the highest average annual earnings of $71,902, while those with less than high school education earn the least with $21,573. Women with an educational attainment of graduate degree earn the most with the average annual earnings of $57,092, while those with less than high school education have the smallest earnings of $14,583.
| Educational Attainment | Male Income | Female Income |
| Less than High School | $21,573 | $14,583 |
| High School Diploma | $40,873 | $30,603 |
| College or Associate's Degree | $45,520 | $33,813 |
| Bachelor's Degree | $47,250 | $47,539 |
| Graduate Degree | $71,902 | $57,092 |
| Total | $46,845 | $43,764 |
Family Income in Brookings
Family Income Brackets in Brookings
According to the Brookings family income data, there are 1,100 families falling into the $100,000 to $149,999 income range, which is the most common income bracket and makes up 28.8% of all families. Conversely, the $10,000 to $14,999 income bracket is the least frequent group with only 31 families (0.8%) belonging to this category.
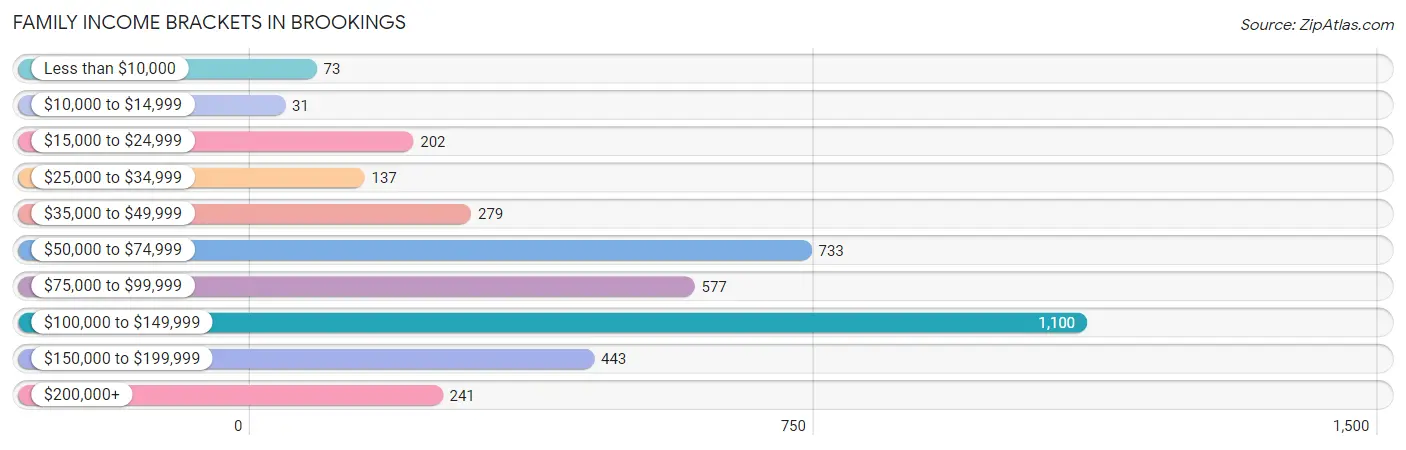
| Income Bracket | # Families | % Families |
| Less than $10,000 | 73 | 1.9% |
| $10,000 to $14,999 | 31 | 0.8% |
| $15,000 to $24,999 | 202 | 5.3% |
| $25,000 to $34,999 | 137 | 3.6% |
| $35,000 to $49,999 | 279 | 7.3% |
| $50,000 to $74,999 | 733 | 19.2% |
| $75,000 to $99,999 | 577 | 15.1% |
| $100,000 to $149,999 | 1,100 | 28.8% |
| $150,000 to $199,999 | 443 | 11.6% |
| $200,000+ | 241 | 6.3% |
Family Income by Famaliy Size in Brookings
4-person families (860 | 22.5%) account for the highest median family income in Brookings with $115,547 per family, while 2-person families (1,677 | 43.9%) have the highest median income of $43,760 per family member.
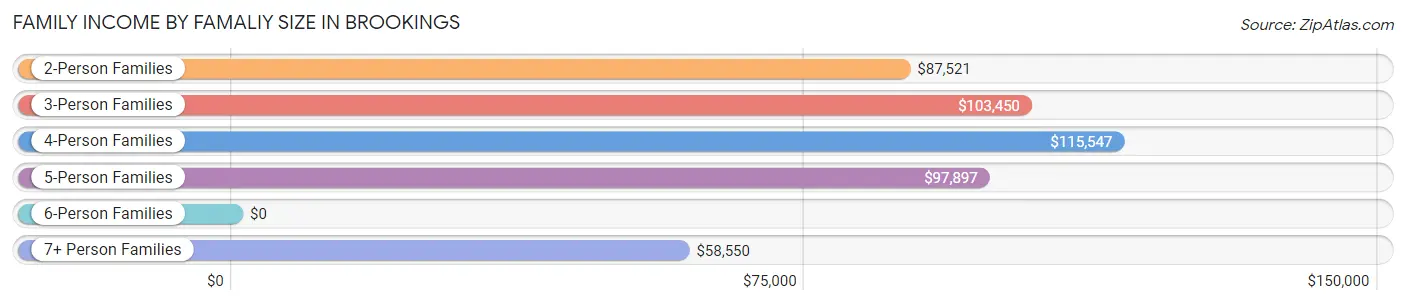
| Income Bracket | # Families | Median Income |
| 2-Person Families | 1,677 (43.9%) | $87,521 |
| 3-Person Families | 680 (17.8%) | $103,450 |
| 4-Person Families | 860 (22.5%) | $115,547 |
| 5-Person Families | 464 (12.1%) | $97,897 |
| 6-Person Families | 71 (1.9%) | $0 |
| 7+ Person Families | 67 (1.8%) | $58,550 |
| Total | 3,819 (100.0%) | $95,804 |
Family Income by Number of Earners in Brookings
The median family income in Brookings is $95,804, with families comprising 3+ earners (534) having the highest median family income of $145,153, while families with 1 earner (1,139) have the lowest median family income of $51,219, accounting for 14.0% and 29.8% of families, respectively.
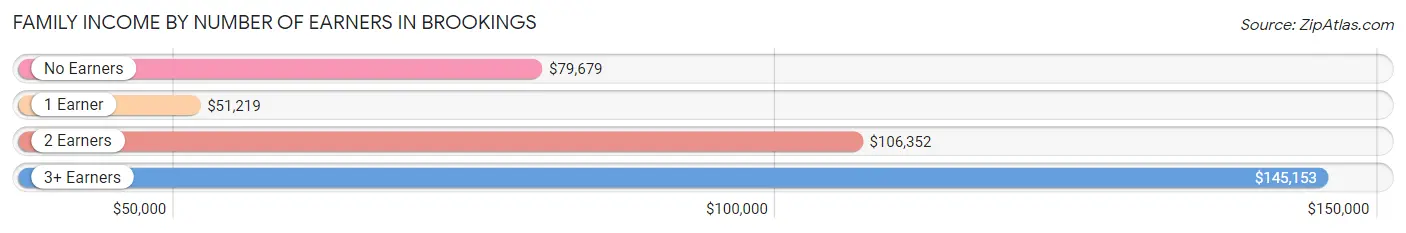
| Number of Earners | # Families | Median Income |
| No Earners | 409 (10.7%) | $79,679 |
| 1 Earner | 1,139 (29.8%) | $51,219 |
| 2 Earners | 1,737 (45.5%) | $106,352 |
| 3+ Earners | 534 (14.0%) | $145,153 |
| Total | 3,819 (100.0%) | $95,804 |
Household Income in Brookings
Household Income Brackets in Brookings
With 2,078 households falling in the category, the $50,000 to $74,999 income range is the most frequent in Brookings, accounting for 23.7% of all households. In contrast, only 254 households (2.9%) fall into the $200,000+ income bracket, making it the least populous group.
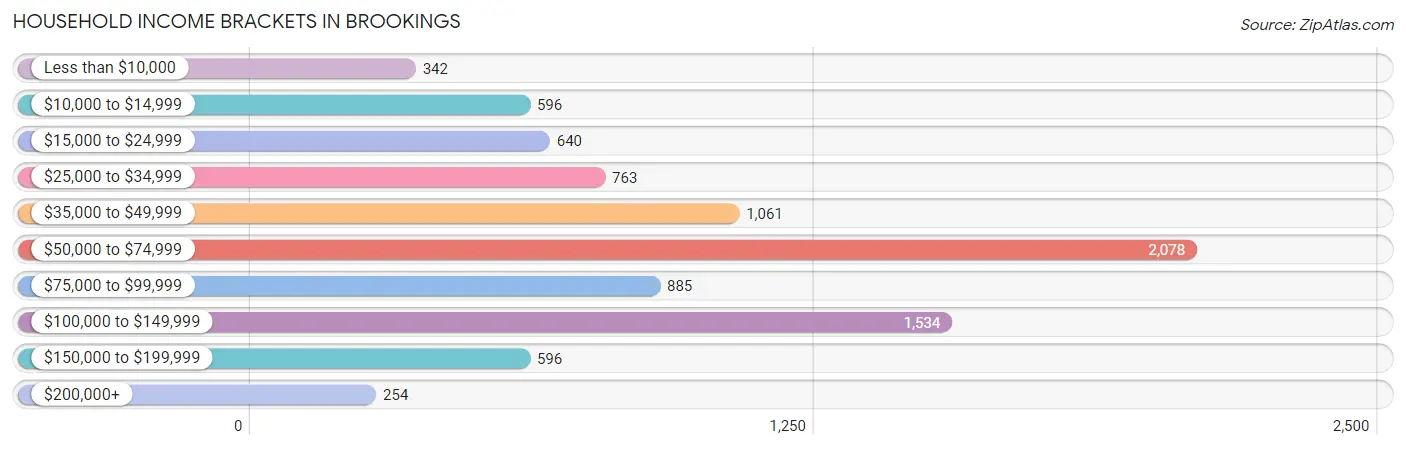
| Income Bracket | # Households | % Households |
| Less than $10,000 | 342 | 3.9% |
| $10,000 to $14,999 | 596 | 6.8% |
| $15,000 to $24,999 | 640 | 7.3% |
| $25,000 to $34,999 | 763 | 8.7% |
| $35,000 to $49,999 | 1,061 | 12.1% |
| $50,000 to $74,999 | 2,078 | 23.7% |
| $75,000 to $99,999 | 885 | 10.1% |
| $100,000 to $149,999 | 1,534 | 17.5% |
| $150,000 to $199,999 | 596 | 6.8% |
| $200,000+ | 254 | 2.9% |
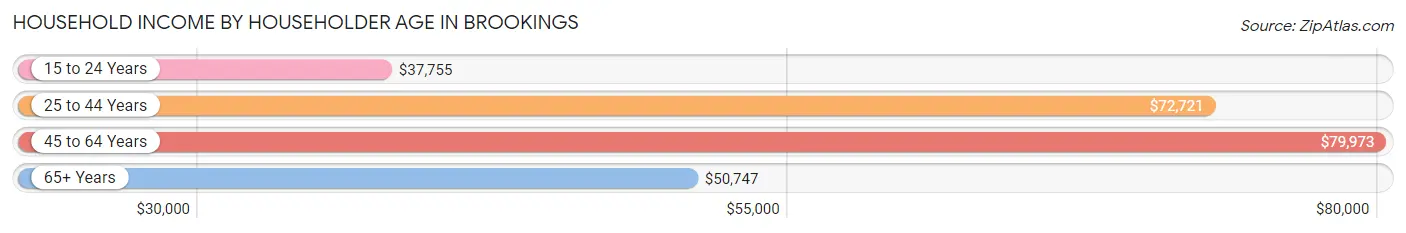
Household Income by Householder Age in Brookings
The median household income in Brookings is $57,824, with the highest median household income of $79,973 found in the 45 to 64 years age bracket for the primary householder. A total of 2,215 households (25.3%) fall into this category. Meanwhile, the 15 to 24 years age bracket for the primary householder has the lowest median household income of $37,755, with 2,122 households (24.2%) in this group.
| Income Bracket | # Households | Median Income |
| 15 to 24 Years | 2,122 (24.2%) | $37,755 |
| 25 to 44 Years | 2,867 (32.7%) | $72,721 |
| 45 to 64 Years | 2,215 (25.3%) | $79,973 |
| 65+ Years | 1,562 (17.8%) | $50,747 |
| Total | 8,766 (100.0%) | $57,824 |
Poverty in Brookings
Income Below Poverty by Sex and Age in Brookings
With 15.7% poverty level for males and 17.3% for females among the residents of Brookings, 18 to 24 year old males and 18 to 24 year old females are the most vulnerable to poverty, with 888 males (34.6%) and 1,037 females (43.6%) in their respective age groups living below the poverty level.
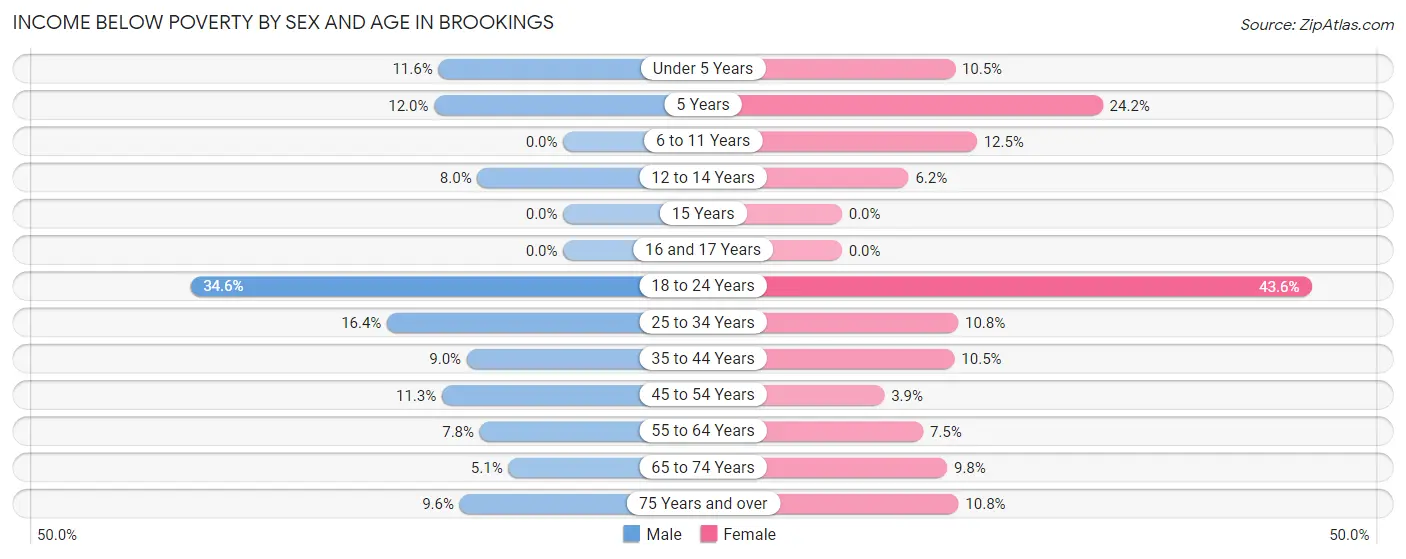
| Age Bracket | Male | Female |
| Under 5 Years | 72 (11.6%) | 53 (10.5%) |
| 5 Years | 23 (12.0%) | 23 (24.2%) |
| 6 to 11 Years | 0 (0.0%) | 98 (12.5%) |
| 12 to 14 Years | 22 (8.0%) | 24 (6.2%) |
| 15 Years | 0 (0.0%) | 0 (0.0%) |
| 16 and 17 Years | 0 (0.0%) | 0 (0.0%) |
| 18 to 24 Years | 888 (34.6%) | 1,037 (43.6%) |
| 25 to 34 Years | 284 (16.4%) | 122 (10.8%) |
| 35 to 44 Years | 113 (8.9%) | 132 (10.4%) |
| 45 to 54 Years | 93 (11.3%) | 31 (3.9%) |
| 55 to 64 Years | 67 (7.7%) | 67 (7.5%) |
| 65 to 74 Years | 35 (5.1%) | 63 (9.8%) |
| 75 Years and over | 44 (9.6%) | 65 (10.8%) |
| Total | 1,641 (15.7%) | 1,715 (17.3%) |
Income Above Poverty by Sex and Age in Brookings
According to the poverty statistics in Brookings, males aged 6 to 11 years and females aged 15 years are the age groups that are most secure financially, with 100.0% of males and 100.0% of females in these age groups living above the poverty line.
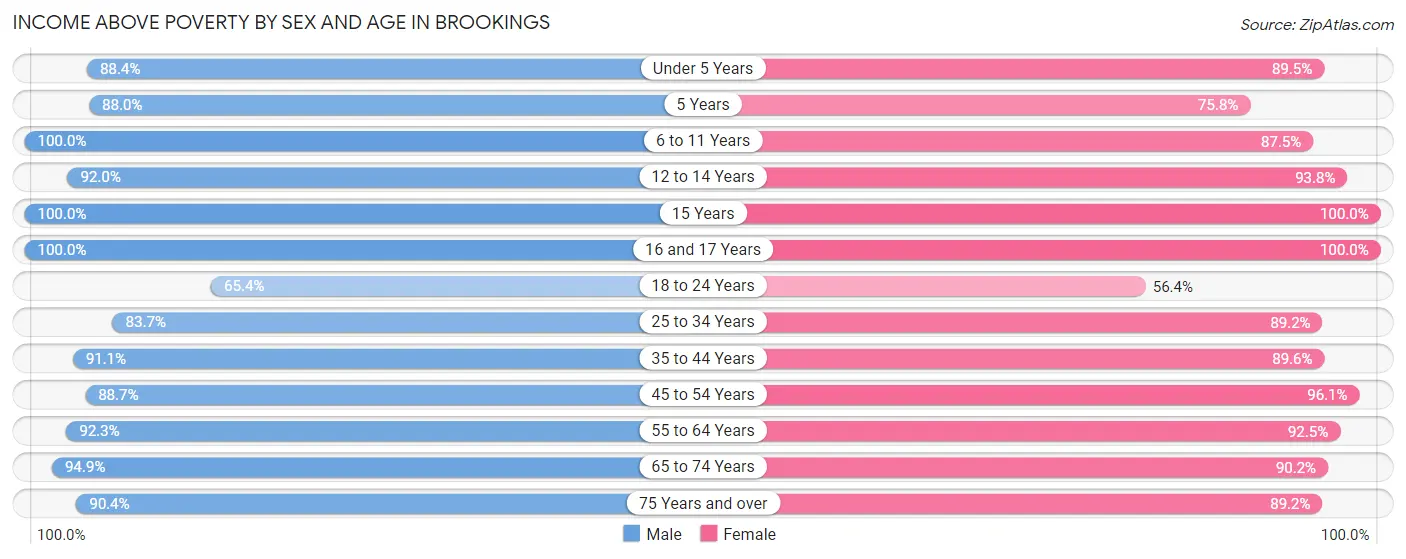
| Age Bracket | Male | Female |
| Under 5 Years | 549 (88.4%) | 452 (89.5%) |
| 5 Years | 169 (88.0%) | 72 (75.8%) |
| 6 to 11 Years | 634 (100.0%) | 685 (87.5%) |
| 12 to 14 Years | 254 (92.0%) | 364 (93.8%) |
| 15 Years | 79 (100.0%) | 65 (100.0%) |
| 16 and 17 Years | 244 (100.0%) | 377 (100.0%) |
| 18 to 24 Years | 1,676 (65.4%) | 1,343 (56.4%) |
| 25 to 34 Years | 1,453 (83.7%) | 1,009 (89.2%) |
| 35 to 44 Years | 1,149 (91.0%) | 1,131 (89.5%) |
| 45 to 54 Years | 733 (88.7%) | 756 (96.1%) |
| 55 to 64 Years | 798 (92.2%) | 823 (92.5%) |
| 65 to 74 Years | 653 (94.9%) | 582 (90.2%) |
| 75 Years and over | 414 (90.4%) | 536 (89.2%) |
| Total | 8,805 (84.3%) | 8,195 (82.7%) |
Income Below Poverty Among Married-Couple Families in Brookings
The poverty statistics for married-couple families in Brookings show that 4.4% or 138 of the total 3,132 families live below the poverty line. Families with 1 or 2 children have the highest poverty rate of 6.7%, comprising of 81 families. On the other hand, families with 3 or 4 children have the lowest poverty rate of 0.0%, which includes 0 families.
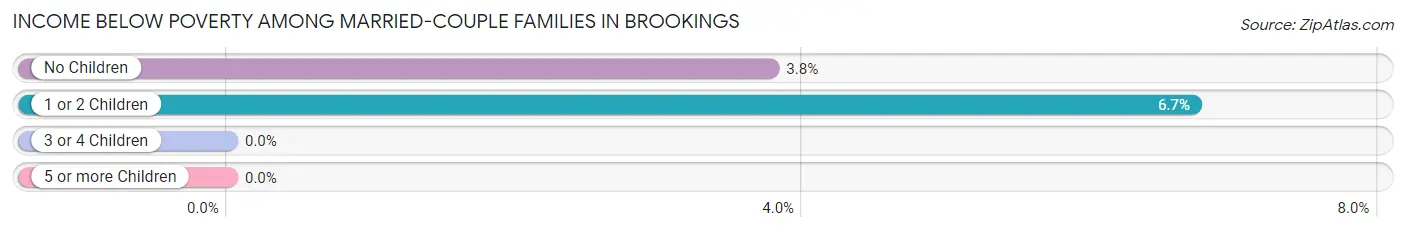
| Children | Above Poverty | Below Poverty |
| No Children | 1,455 (96.2%) | 57 (3.8%) |
| 1 or 2 Children | 1,126 (93.3%) | 81 (6.7%) |
| 3 or 4 Children | 379 (100.0%) | 0 (0.0%) |
| 5 or more Children | 34 (100.0%) | 0 (0.0%) |
| Total | 2,994 (95.6%) | 138 (4.4%) |
Income Below Poverty Among Single-Parent Households in Brookings
According to the poverty data in Brookings, 16.8% or 57 single-father households and 15.5% or 54 single-mother households are living below the poverty line. Among single-father households, those with no children have the highest poverty rate, with 57 households (40.7%) experiencing poverty. Likewise, among single-mother households, those with 5 or more children have the highest poverty rate, with 23 households (100.0%) falling below the poverty line.
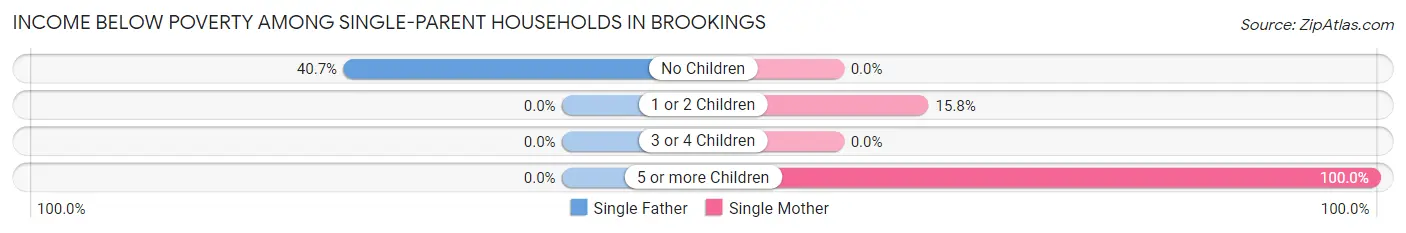
| Children | Single Father | Single Mother |
| No Children | 57 (40.7%) | 0 (0.0%) |
| 1 or 2 Children | 0 (0.0%) | 31 (15.8%) |
| 3 or 4 Children | 0 (0.0%) | 0 (0.0%) |
| 5 or more Children | 0 (0.0%) | 23 (100.0%) |
| Total | 57 (16.8%) | 54 (15.5%) |
Income Below Poverty Among Married-Couple vs Single-Parent Households in Brookings
The poverty data for Brookings shows that 138 of the married-couple family households (4.4%) and 111 of the single-parent households (16.2%) are living below the poverty level. Within the married-couple family households, those with 1 or 2 children have the highest poverty rate, with 81 households (6.7%) falling below the poverty line. Among the single-parent households, those with 5 or more children have the highest poverty rate, with 23 household (100.0%) living below poverty.
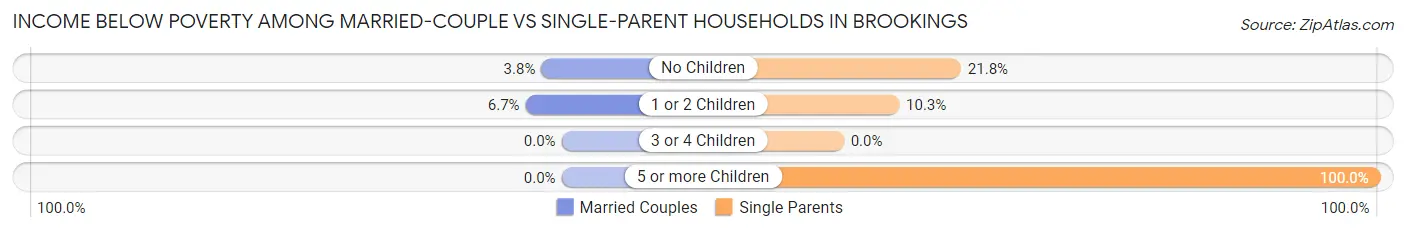
| Children | Married-Couple Families | Single-Parent Households |
| No Children | 57 (3.8%) | 57 (21.8%) |
| 1 or 2 Children | 81 (6.7%) | 31 (10.3%) |
| 3 or 4 Children | 0 (0.0%) | 0 (0.0%) |
| 5 or more Children | 0 (0.0%) | 23 (100.0%) |
| Total | 138 (4.4%) | 111 (16.2%) |
Race in Brookings
The most populous races in Brookings are White / Caucasian (20,532 | 87.3%), Asian (1,020 | 4.3%), and Hispanic or Latino (908 | 3.9%).
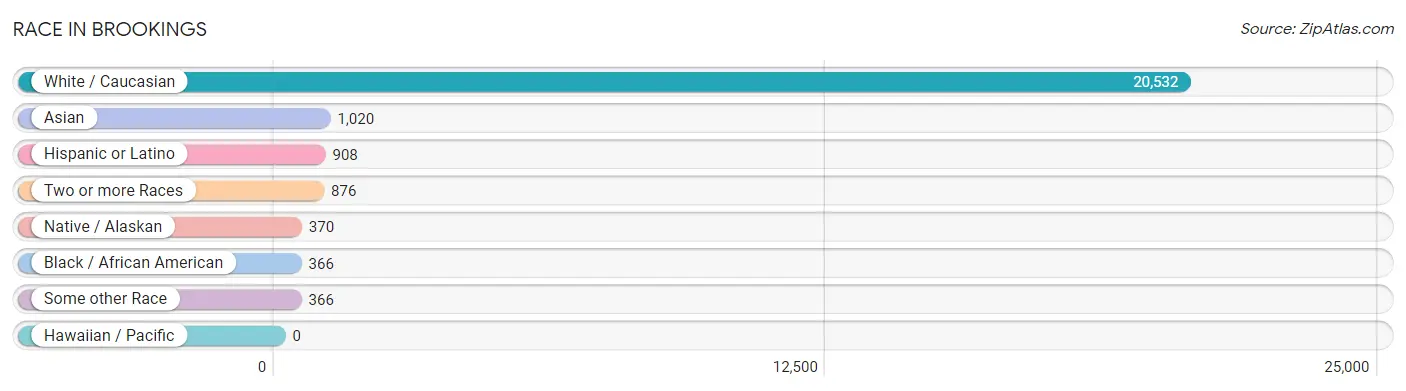
| Race | # Population | % Population |
| Asian | 1,020 | 4.3% |
| Black / African American | 366 | 1.6% |
| Hawaiian / Pacific | 0 | 0.0% |
| Hispanic or Latino | 908 | 3.9% |
| Native / Alaskan | 370 | 1.6% |
| White / Caucasian | 20,532 | 87.3% |
| Two or more Races | 876 | 3.7% |
| Some other Race | 366 | 1.6% |
| Total | 23,530 | 100.0% |
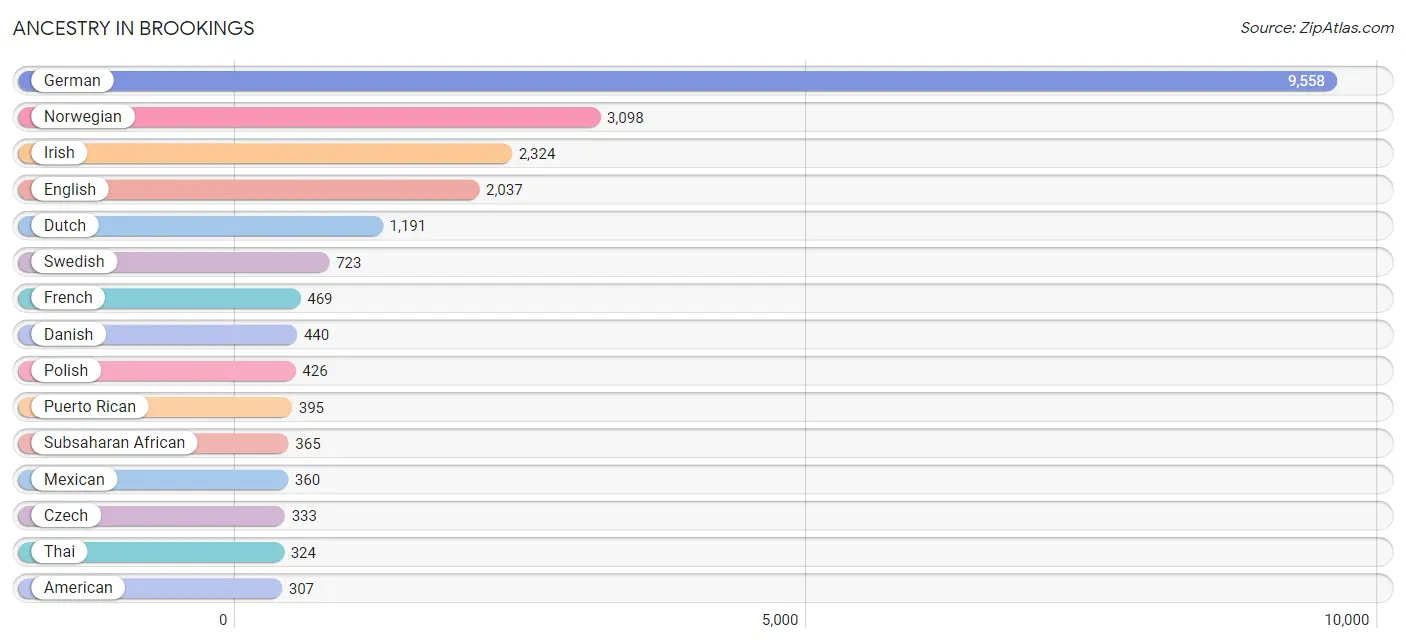
Ancestry in Brookings
The most populous ancestries reported in Brookings are German (9,558 | 40.6%), Norwegian (3,098 | 13.2%), Irish (2,324 | 9.9%), English (2,037 | 8.7%), and Dutch (1,191 | 5.1%), together accounting for 77.4% of all Brookings residents.
| Ancestry | # Population | % Population |
| African | 83 | 0.4% |
| Alsatian | 3 | 0.0% |
| American | 307 | 1.3% |
| Arab | 168 | 0.7% |
| Armenian | 15 | 0.1% |
| Austrian | 72 | 0.3% |
| Bahamian | 9 | 0.0% |
| Bangladeshi | 1 | 0.0% |
| Belgian | 94 | 0.4% |
| Bhutanese | 46 | 0.2% |
| Blackfeet | 3 | 0.0% |
| Bolivian | 3 | 0.0% |
| Brazilian | 40 | 0.2% |
| British | 62 | 0.3% |
| Burmese | 158 | 0.7% |
| Central American | 47 | 0.2% |
| Central American Indian | 21 | 0.1% |
| Cherokee | 25 | 0.1% |
| Chippewa | 10 | 0.0% |
| Colombian | 65 | 0.3% |
| Croatian | 6 | 0.0% |
| Czech | 333 | 1.4% |
| Czechoslovakian | 10 | 0.0% |
| Danish | 440 | 1.9% |
| Dominican | 6 | 0.0% |
| Dutch | 1,191 | 5.1% |
| Ecuadorian | 8 | 0.0% |
| Egyptian | 47 | 0.2% |
| English | 2,037 | 8.7% |
| Ethiopian | 71 | 0.3% |
| European | 232 | 1.0% |
| Filipino | 1 | 0.0% |
| Finnish | 21 | 0.1% |
| French | 469 | 2.0% |
| French Canadian | 147 | 0.6% |
| German | 9,558 | 40.6% |
| German Russian | 55 | 0.2% |
| Ghanaian | 81 | 0.3% |
| Greek | 10 | 0.0% |
| Guatemalan | 25 | 0.1% |
| Haitian | 7 | 0.0% |
| Honduran | 22 | 0.1% |
| Hungarian | 2 | 0.0% |
| Icelander | 2 | 0.0% |
| Indian (Asian) | 96 | 0.4% |
| Indonesian | 1 | 0.0% |
| Iranian | 11 | 0.1% |
| Iraqi | 55 | 0.2% |
| Irish | 2,324 | 9.9% |
| Italian | 265 | 1.1% |
| Jamaican | 15 | 0.1% |
| Korean | 115 | 0.5% |
| Laotian | 3 | 0.0% |
| Lebanese | 62 | 0.3% |
| Lithuanian | 5 | 0.0% |
| Luxembourger | 6 | 0.0% |
| Mexican | 360 | 1.5% |
| Mexican American Indian | 141 | 0.6% |
| Native Hawaiian | 49 | 0.2% |
| Northern European | 42 | 0.2% |
| Norwegian | 3,098 | 13.2% |
| Palestinian | 4 | 0.0% |
| Peruvian | 3 | 0.0% |
| Polish | 426 | 1.8% |
| Portuguese | 3 | 0.0% |
| Puerto Rican | 395 | 1.7% |
| Russian | 210 | 0.9% |
| Scandinavian | 252 | 1.1% |
| Scotch-Irish | 118 | 0.5% |
| Scottish | 140 | 0.6% |
| Serbian | 46 | 0.2% |
| Sioux | 219 | 0.9% |
| Slavic | 17 | 0.1% |
| Somali | 105 | 0.4% |
| South African | 22 | 0.1% |
| South American | 82 | 0.4% |
| Spaniard | 18 | 0.1% |
| Sri Lankan | 40 | 0.2% |
| Subsaharan African | 365 | 1.5% |
| Swedish | 723 | 3.1% |
| Thai | 324 | 1.4% |
| Ukrainian | 21 | 0.1% |
| Venezuelan | 3 | 0.0% |
| Welsh | 108 | 0.5% |
| Yugoslavian | 5 | 0.0% | View All 85 Rows |
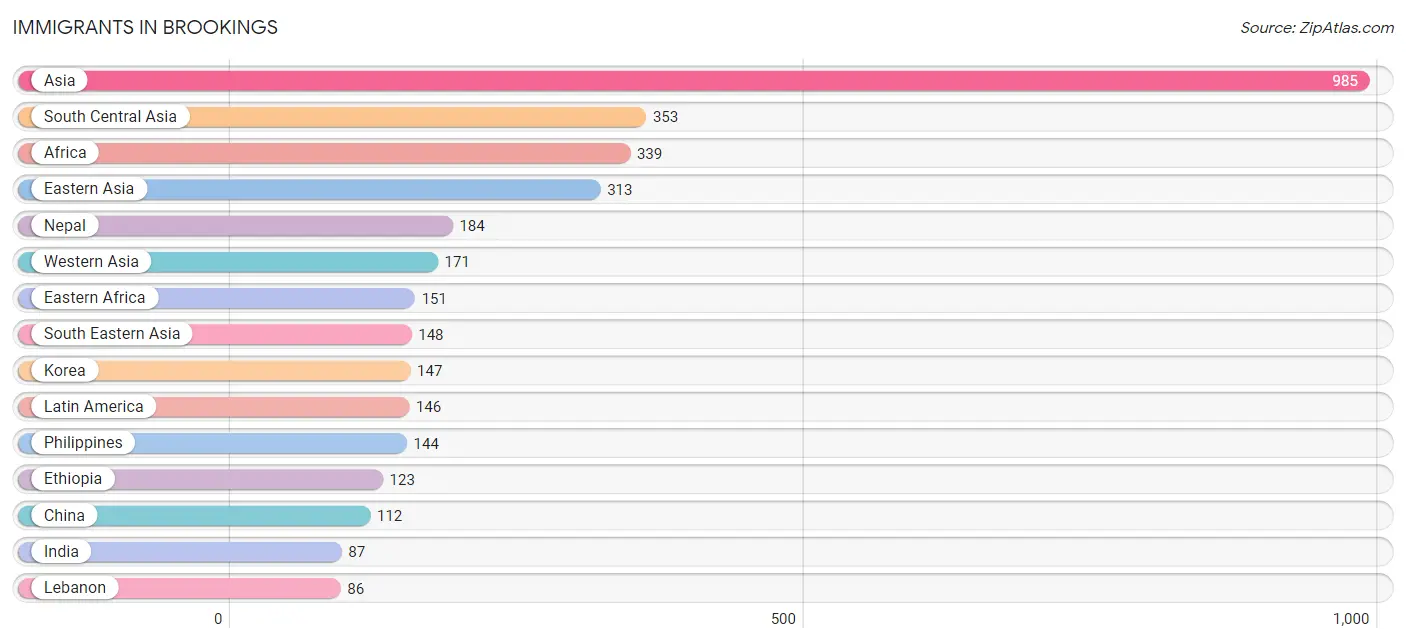
Immigrants in Brookings
The most numerous immigrant groups reported in Brookings came from Asia (985 | 4.2%), South Central Asia (353 | 1.5%), Africa (339 | 1.4%), Eastern Asia (313 | 1.3%), and Nepal (184 | 0.8%), together accounting for 9.2% of all Brookings residents.
| Immigration Origin | # Population | % Population |
| Africa | 339 | 1.4% |
| Asia | 985 | 4.2% |
| Bahamas | 9 | 0.0% |
| Bangladesh | 32 | 0.1% |
| Bolivia | 3 | 0.0% |
| Brazil | 26 | 0.1% |
| Canada | 3 | 0.0% |
| Caribbean | 16 | 0.1% |
| Central America | 72 | 0.3% |
| China | 112 | 0.5% |
| Colombia | 26 | 0.1% |
| Eastern Africa | 151 | 0.6% |
| Eastern Asia | 313 | 1.3% |
| Eastern Europe | 30 | 0.1% |
| Egypt | 47 | 0.2% |
| Ethiopia | 123 | 0.5% |
| Europe | 52 | 0.2% |
| Ghana | 81 | 0.3% |
| Guatemala | 21 | 0.1% |
| Haiti | 7 | 0.0% |
| Honduras | 18 | 0.1% |
| India | 87 | 0.4% |
| Indonesia | 3 | 0.0% |
| Iran | 11 | 0.1% |
| Iraq | 40 | 0.2% |
| Japan | 54 | 0.2% |
| Korea | 147 | 0.6% |
| Latin America | 146 | 0.6% |
| Lebanon | 86 | 0.4% |
| Mexico | 33 | 0.1% |
| Nepal | 184 | 0.8% |
| Netherlands | 22 | 0.1% |
| Northern Africa | 47 | 0.2% |
| Oceania | 49 | 0.2% |
| Pakistan | 26 | 0.1% |
| Philippines | 144 | 0.6% |
| South Africa | 57 | 0.2% |
| South America | 58 | 0.3% |
| South Central Asia | 353 | 1.5% |
| South Eastern Asia | 148 | 0.6% |
| Thailand | 1 | 0.0% |
| Ukraine | 21 | 0.1% |
| Uzbekistan | 13 | 0.1% |
| Western Africa | 84 | 0.4% |
| Western Asia | 171 | 0.7% |
| Western Europe | 22 | 0.1% | View All 46 Rows |
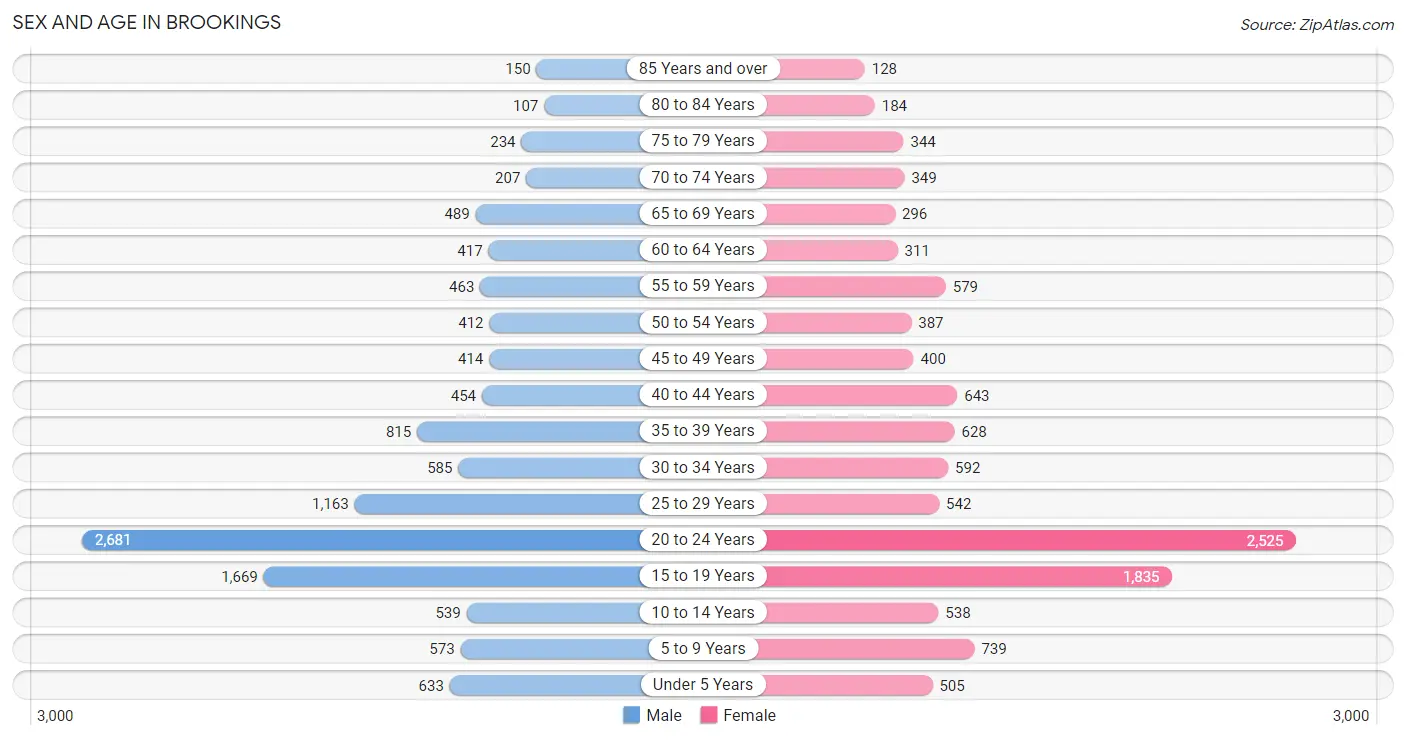
Sex and Age in Brookings
Sex and Age in Brookings
The most populous age groups in Brookings are 20 to 24 Years (2,681 | 22.3%) for men and 20 to 24 Years (2,525 | 21.9%) for women.
| Age Bracket | Male | Female |
| Under 5 Years | 633 (5.3%) | 505 (4.4%) |
| 5 to 9 Years | 573 (4.8%) | 739 (6.4%) |
| 10 to 14 Years | 539 (4.5%) | 538 (4.7%) |
| 15 to 19 Years | 1,669 (13.9%) | 1,835 (15.9%) |
| 20 to 24 Years | 2,681 (22.3%) | 2,525 (21.9%) |
| 25 to 29 Years | 1,163 (9.7%) | 542 (4.7%) |
| 30 to 34 Years | 585 (4.9%) | 592 (5.1%) |
| 35 to 39 Years | 815 (6.8%) | 628 (5.4%) |
| 40 to 44 Years | 454 (3.8%) | 643 (5.6%) |
| 45 to 49 Years | 414 (3.5%) | 400 (3.5%) |
| 50 to 54 Years | 412 (3.4%) | 387 (3.4%) |
| 55 to 59 Years | 463 (3.9%) | 579 (5.0%) |
| 60 to 64 Years | 417 (3.5%) | 311 (2.7%) |
| 65 to 69 Years | 489 (4.1%) | 296 (2.6%) |
| 70 to 74 Years | 207 (1.7%) | 349 (3.0%) |
| 75 to 79 Years | 234 (1.9%) | 344 (3.0%) |
| 80 to 84 Years | 107 (0.9%) | 184 (1.6%) |
| 85 Years and over | 150 (1.3%) | 128 (1.1%) |
| Total | 12,005 (100.0%) | 11,525 (100.0%) |
Families and Households in Brookings
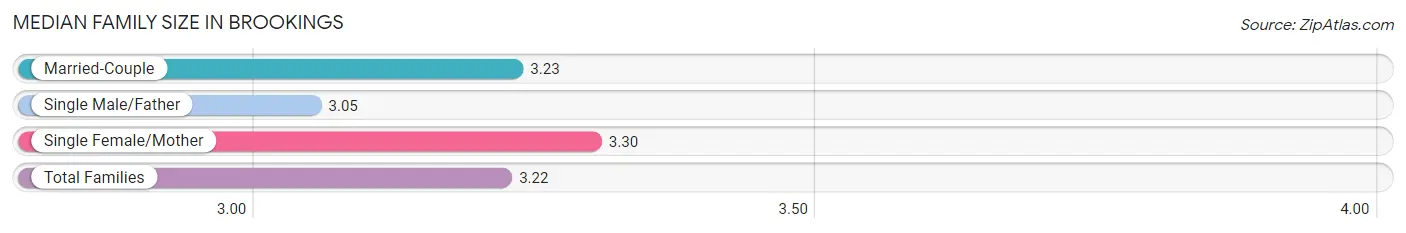
Median Family Size in Brookings
The median family size in Brookings is 3.22 persons per family, with single female/mother families (348 | 9.1%) accounting for the largest median family size of 3.3 persons per family. On the other hand, single male/father families (339 | 8.9%) represent the smallest median family size with 3.05 persons per family.
| Family Type | # Families | Family Size |
| Married-Couple | 3,132 (82.0%) | 3.23 |
| Single Male/Father | 339 (8.9%) | 3.05 |
| Single Female/Mother | 348 (9.1%) | 3.30 |
| Total Families | 3,819 (100.0%) | 3.22 |
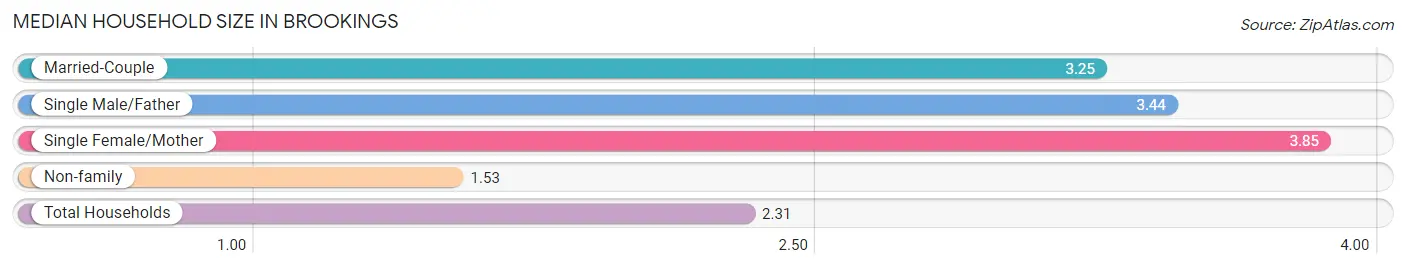
Median Household Size in Brookings
The median household size in Brookings is 2.31 persons per household, with single female/mother households (348 | 4.0%) accounting for the largest median household size of 3.85 persons per household. non-family households (4,947 | 56.4%) represent the smallest median household size with 1.53 persons per household.
| Household Type | # Households | Household Size |
| Married-Couple | 3,132 (35.7%) | 3.25 |
| Single Male/Father | 339 (3.9%) | 3.44 |
| Single Female/Mother | 348 (4.0%) | 3.85 |
| Non-family | 4,947 (56.4%) | 1.53 |
| Total Households | 8,766 (100.0%) | 2.31 |
Household Size by Marriage Status in Brookings
Out of a total of 8,766 households in Brookings, 3,819 (43.6%) are family households, while 4,947 (56.4%) are nonfamily households. The most numerous type of family households are 2-person households, comprising 1,553, and the most common type of nonfamily households are 1-person households, comprising 3,488.
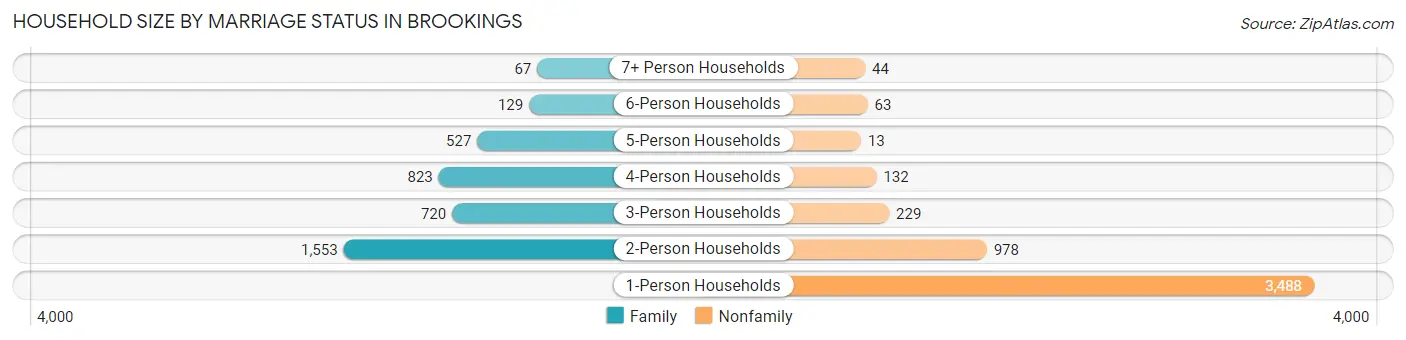
| Household Size | Family Households | Nonfamily Households |
| 1-Person Households | - | 3,488 (39.8%) |
| 2-Person Households | 1,553 (17.7%) | 978 (11.2%) |
| 3-Person Households | 720 (8.2%) | 229 (2.6%) |
| 4-Person Households | 823 (9.4%) | 132 (1.5%) |
| 5-Person Households | 527 (6.0%) | 13 (0.2%) |
| 6-Person Households | 129 (1.5%) | 63 (0.7%) |
| 7+ Person Households | 67 (0.8%) | 44 (0.5%) |
| Total | 3,819 (43.6%) | 4,947 (56.4%) |
Female Fertility in Brookings
Fertility by Age in Brookings
Average fertility rate in Brookings is 18.0 births per 1,000 women. Women in the age bracket of 35 to 50 years have the highest fertility rate with 33.0 births per 1,000 women. Women in the age bracket of 20 to 34 years acount for 55.6% of all women with births.
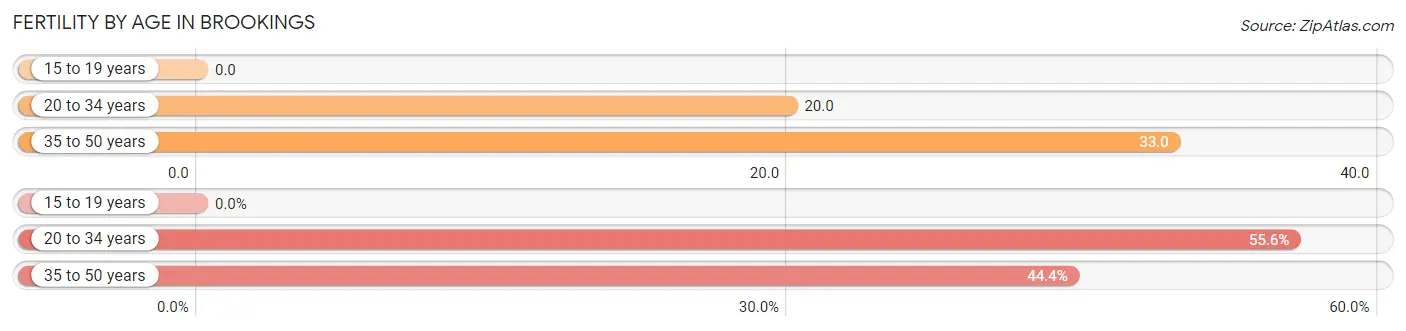
| Age Bracket | Women with Births | Births / 1,000 Women |
| 15 to 19 years | 0 (0.0%) | 0.0 |
| 20 to 34 years | 74 (55.6%) | 20.0 |
| 35 to 50 years | 59 (44.4%) | 33.0 |
| Total | 133 (100.0%) | 18.0 |
Fertility by Age by Marriage Status in Brookings
94.0% of women with births (133) in Brookings are married. The highest percentage of unmarried women with births falls into 20 to 34 years age bracket with 10.8% of them unmarried at the time of birth, while the lowest percentage of unmarried women with births belong to 35 to 50 years age bracket with 0.0% of them unmarried.
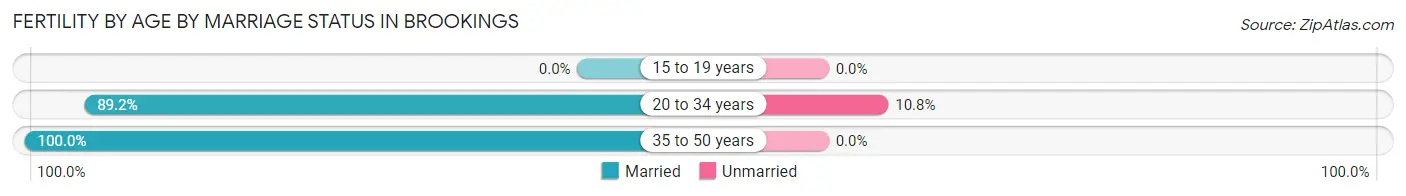
| Age Bracket | Married | Unmarried |
| 15 to 19 years | 0 (0.0%) | 0 (0.0%) |
| 20 to 34 years | 66 (89.2%) | 8 (10.8%) |
| 35 to 50 years | 59 (100.0%) | 0 (0.0%) |
| Total | 125 (94.0%) | 8 (6.0%) |
Fertility by Education in Brookings
Average fertility rate in Brookings is 18.0 births per 1,000 women. Women with the education attainment of less than high school have the highest fertility rate of 39.0 births per 1,000 women, while women with the education attainment of high school diploma have the lowest fertility at 11.0 births per 1,000 women. Women with the education attainment of bachelor's degree represent 38.4% of all women with births.
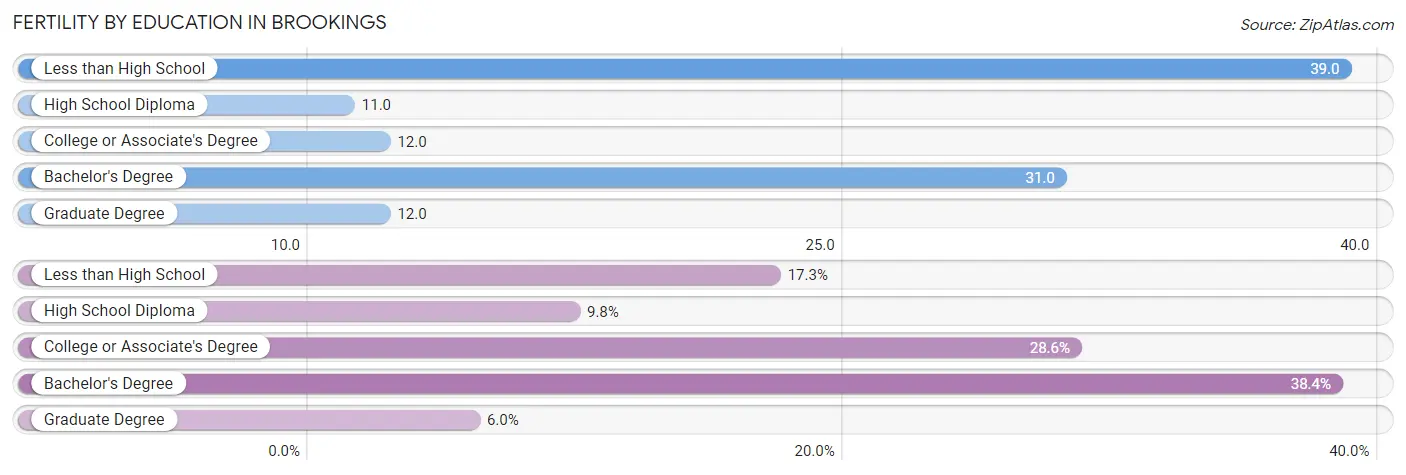
| Educational Attainment | Women with Births | Births / 1,000 Women |
| Less than High School | 23 (17.3%) | 39.0 |
| High School Diploma | 13 (9.8%) | 11.0 |
| College or Associate's Degree | 38 (28.6%) | 12.0 |
| Bachelor's Degree | 51 (38.4%) | 31.0 |
| Graduate Degree | 8 (6.0%) | 12.0 |
| Total | 133 (100.0%) | 18.0 |
Fertility by Education by Marriage Status in Brookings
6.0% of women with births in Brookings are unmarried. Women with the educational attainment of high school diploma are most likely to be married with 100.0% of them married at childbirth, while women with the educational attainment of less than high school are least likely to be married with 34.8% of them unmarried at childbirth.
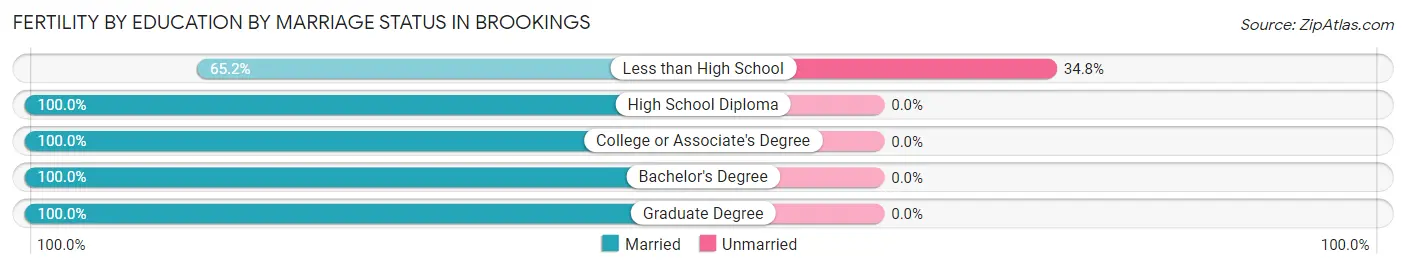
| Educational Attainment | Married | Unmarried |
| Less than High School | 15 (65.2%) | 8 (34.8%) |
| High School Diploma | 13 (100.0%) | 0 (0.0%) |
| College or Associate's Degree | 38 (100.0%) | 0 (0.0%) |
| Bachelor's Degree | 51 (100.0%) | 0 (0.0%) |
| Graduate Degree | 8 (100.0%) | 0 (0.0%) |
| Total | 125 (94.0%) | 8 (6.0%) |
Employment Characteristics in Brookings
Employment by Class of Employer in Brookings
Among the 12,870 employed individuals in Brookings, private company employees (8,074 | 62.7%), state government employees (2,257 | 17.5%), and not-for-profit organizations (844 | 6.6%) make up the most common classes of employment.
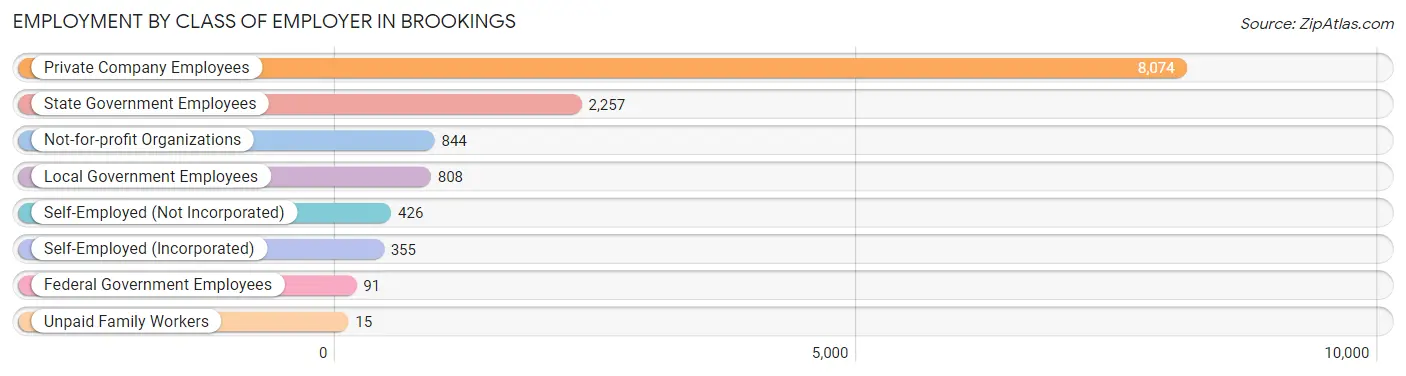
| Employer Class | # Employees | % Employees |
| Private Company Employees | 8,074 | 62.7% |
| Self-Employed (Incorporated) | 355 | 2.8% |
| Self-Employed (Not Incorporated) | 426 | 3.3% |
| Not-for-profit Organizations | 844 | 6.6% |
| Local Government Employees | 808 | 6.3% |
| State Government Employees | 2,257 | 17.5% |
| Federal Government Employees | 91 | 0.7% |
| Unpaid Family Workers | 15 | 0.1% |
| Total | 12,870 | 100.0% |
Employment Status by Age in Brookings
According to the labor force statistics for Brookings, out of the total population over 16 years of age (19,859), 70.1% or 13,921 individuals are in the labor force, with 5.1% or 710 of them unemployed. The age group with the highest labor force participation rate is 45 to 54 years, with 89.8% or 1,448 individuals in the labor force. Within the labor force, the 16 to 19 years age range has the highest percentage of unemployed individuals, with 18.1% or 317 of them being unemployed.
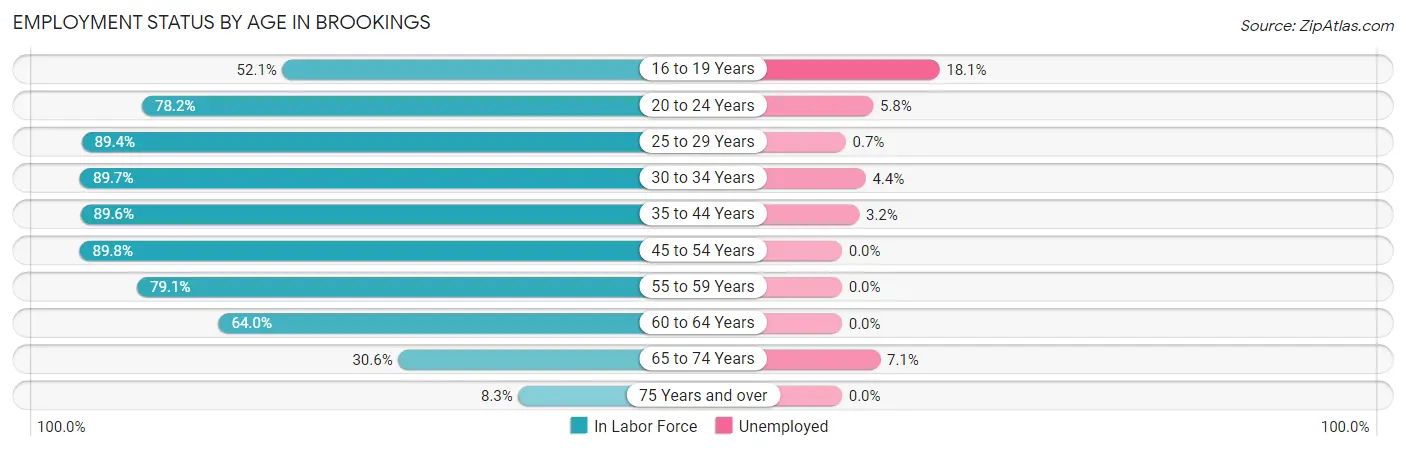
| Age Bracket | In Labor Force | Unemployed |
| 16 to 19 Years | 1,751 (52.1%) | 317 (18.1%) |
| 20 to 24 Years | 4,071 (78.2%) | 236 (5.8%) |
| 25 to 29 Years | 1,524 (89.4%) | 11 (0.7%) |
| 30 to 34 Years | 1,056 (89.7%) | 46 (4.4%) |
| 35 to 44 Years | 2,276 (89.6%) | 73 (3.2%) |
| 45 to 54 Years | 1,448 (89.8%) | 0 (0.0%) |
| 55 to 59 Years | 824 (79.1%) | 0 (0.0%) |
| 60 to 64 Years | 466 (64.0%) | 0 (0.0%) |
| 65 to 74 Years | 410 (30.6%) | 29 (7.1%) |
| 75 Years and over | 95 (8.3%) | 0 (0.0%) |
| Total | 13,921 (70.1%) | 710 (5.1%) |
Employment Status by Educational Attainment in Brookings
According to labor force statistics for Brookings, 86.3% of individuals (7,599) out of the total population between 25 and 64 years of age (8,805) are in the labor force, with 1.7% or 129 of them being unemployed. The group with the highest labor force participation rate are those with the educational attainment of bachelor's degree or higher, with 91.5% or 4,042 individuals in the labor force. Within the labor force, individuals with college / associate degree education have the highest percentage of unemployment, with 2.2% or 46 of them being unemployed.
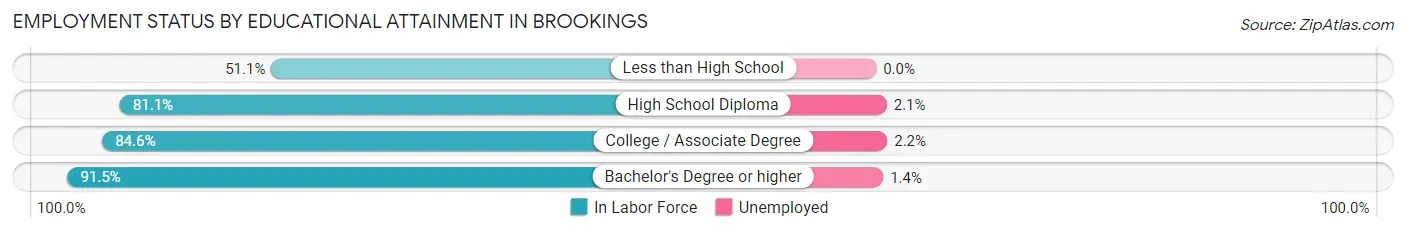
| Educational Attainment | In Labor Force | Unemployed |
| Less than High School | 156 (51.1%) | 0 (0.0%) |
| High School Diploma | 1,299 (81.1%) | 34 (2.1%) |
| College / Associate Degree | 2,099 (84.6%) | 55 (2.2%) |
| Bachelor's Degree or higher | 4,042 (91.5%) | 62 (1.4%) |
| Total | 7,599 (86.3%) | 150 (1.7%) |
Employment Occupations by Sex in Brookings
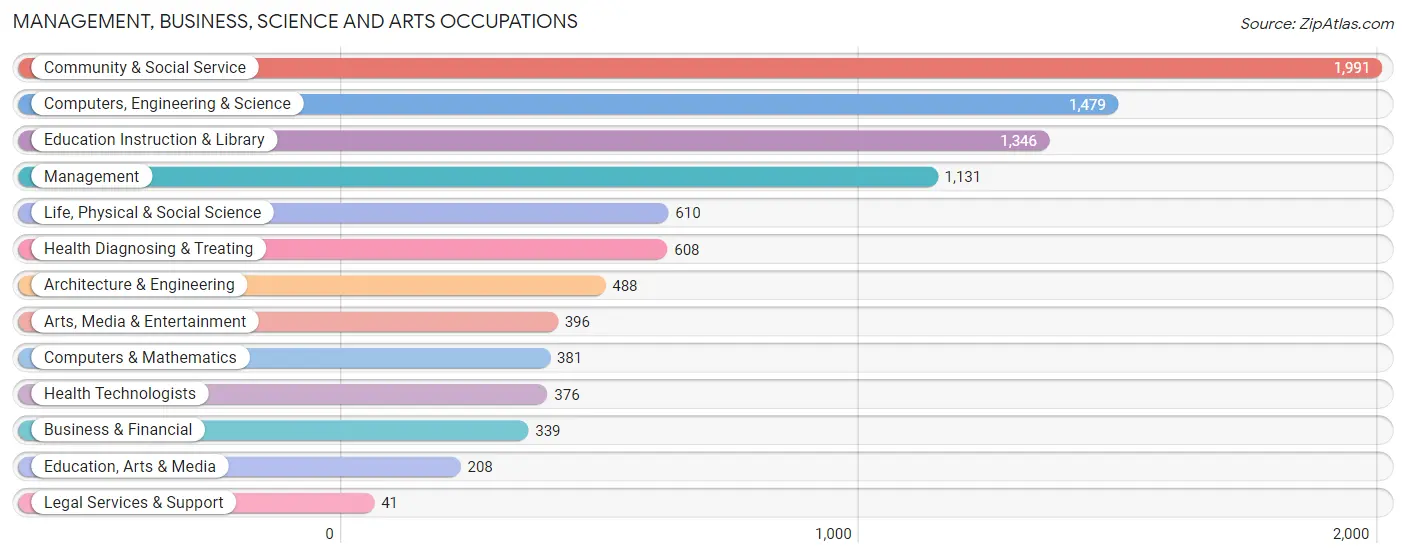
Management, Business, Science and Arts Occupations
The most common Management, Business, Science and Arts occupations in Brookings are Community & Social Service (1,991 | 15.1%), Computers, Engineering & Science (1,479 | 11.3%), Education Instruction & Library (1,346 | 10.2%), Management (1,131 | 8.6%), and Life, Physical & Social Science (610 | 4.6%).
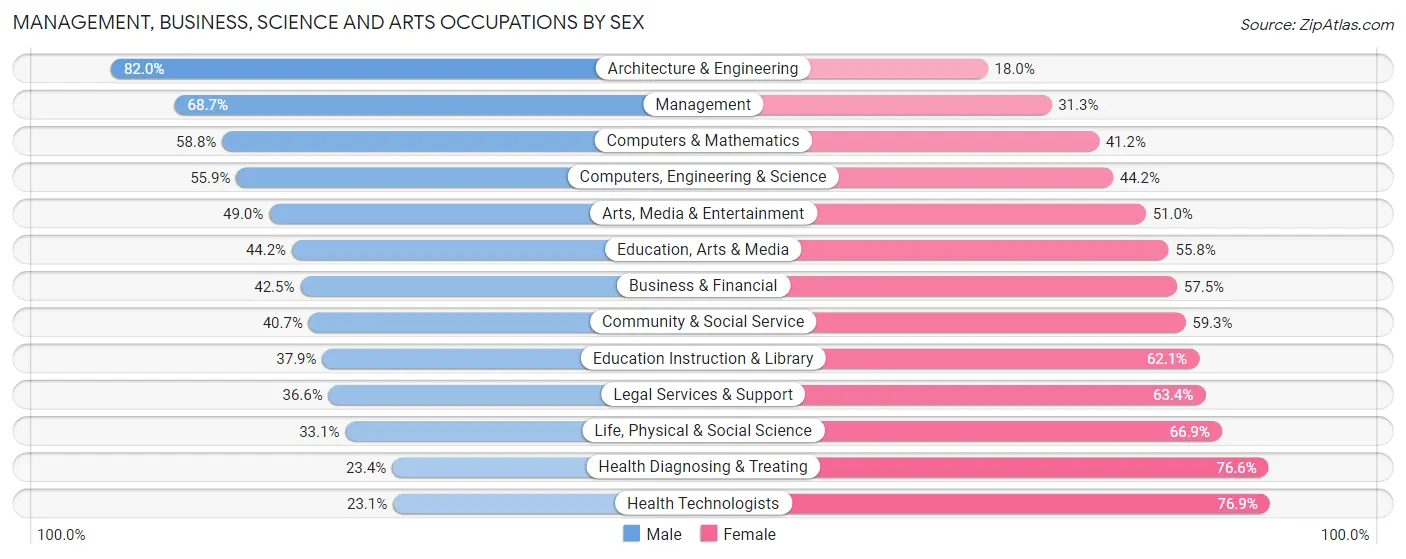
Management, Business, Science and Arts Occupations by Sex
Within the Management, Business, Science and Arts occupations in Brookings, the most male-oriented occupations are Architecture & Engineering (82.0%), Management (68.7%), and Computers & Mathematics (58.8%), while the most female-oriented occupations are Health Technologists (76.9%), Health Diagnosing & Treating (76.6%), and Life, Physical & Social Science (66.9%).
| Occupation | Male | Female |
| Management | 777 (68.7%) | 354 (31.3%) |
| Business & Financial | 144 (42.5%) | 195 (57.5%) |
| Computers, Engineering & Science | 826 (55.8%) | 653 (44.2%) |
| Computers & Mathematics | 224 (58.8%) | 157 (41.2%) |
| Architecture & Engineering | 400 (82.0%) | 88 (18.0%) |
| Life, Physical & Social Science | 202 (33.1%) | 408 (66.9%) |
| Community & Social Service | 811 (40.7%) | 1,180 (59.3%) |
| Education, Arts & Media | 92 (44.2%) | 116 (55.8%) |
| Legal Services & Support | 15 (36.6%) | 26 (63.4%) |
| Education Instruction & Library | 510 (37.9%) | 836 (62.1%) |
| Arts, Media & Entertainment | 194 (49.0%) | 202 (51.0%) |
| Health Diagnosing & Treating | 142 (23.4%) | 466 (76.6%) |
| Health Technologists | 87 (23.1%) | 289 (76.9%) |
| Total (Category) | 2,700 (48.7%) | 2,848 (51.3%) |
| Total (Overall) | 6,920 (52.6%) | 6,228 (47.4%) |
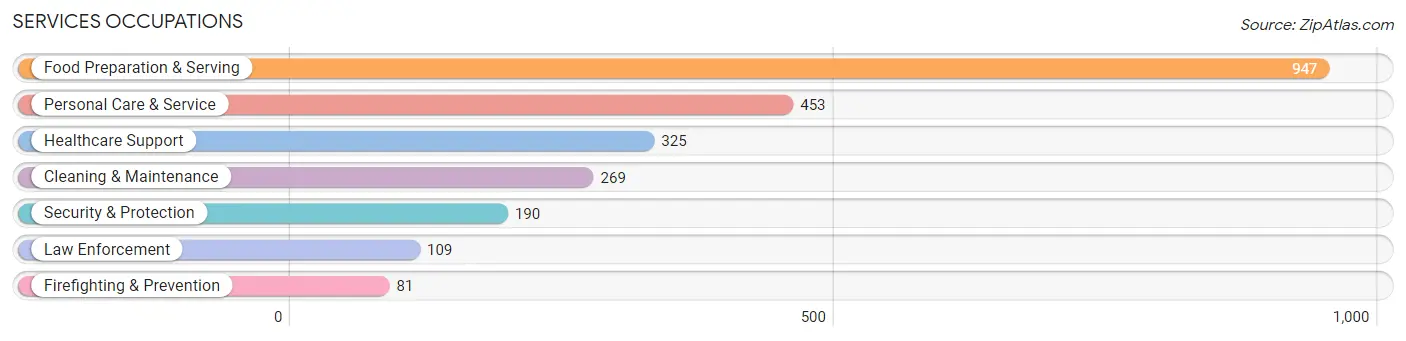
Services Occupations
The most common Services occupations in Brookings are Food Preparation & Serving (947 | 7.2%), Personal Care & Service (453 | 3.5%), Healthcare Support (325 | 2.5%), Cleaning & Maintenance (269 | 2.1%), and Security & Protection (190 | 1.5%).
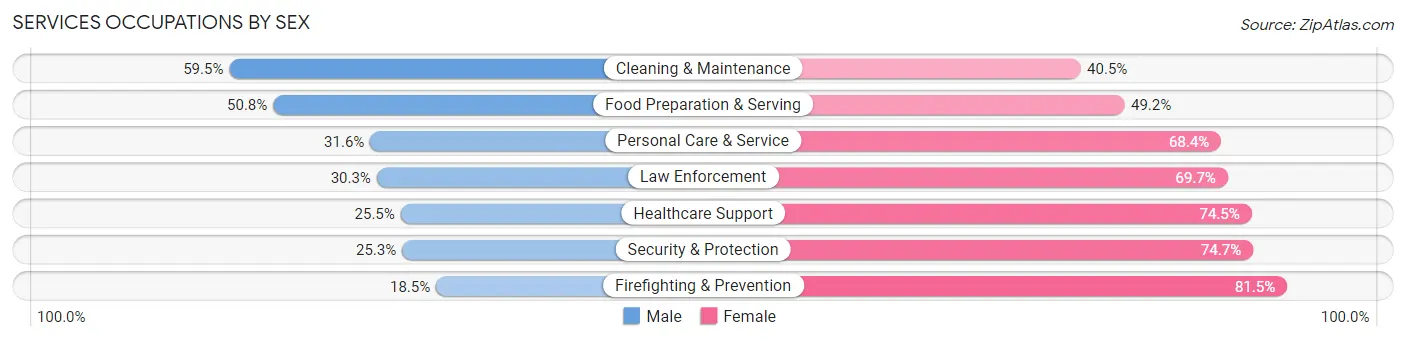
Services Occupations by Sex
Within the Services occupations in Brookings, the most male-oriented occupations are Cleaning & Maintenance (59.5%), Food Preparation & Serving (50.8%), and Personal Care & Service (31.6%), while the most female-oriented occupations are Firefighting & Prevention (81.5%), Security & Protection (74.7%), and Healthcare Support (74.5%).
| Occupation | Male | Female |
| Healthcare Support | 83 (25.5%) | 242 (74.5%) |
| Security & Protection | 48 (25.3%) | 142 (74.7%) |
| Firefighting & Prevention | 15 (18.5%) | 66 (81.5%) |
| Law Enforcement | 33 (30.3%) | 76 (69.7%) |
| Food Preparation & Serving | 481 (50.8%) | 466 (49.2%) |
| Cleaning & Maintenance | 160 (59.5%) | 109 (40.5%) |
| Personal Care & Service | 143 (31.6%) | 310 (68.4%) |
| Total (Category) | 915 (41.9%) | 1,269 (58.1%) |
| Total (Overall) | 6,920 (52.6%) | 6,228 (47.4%) |
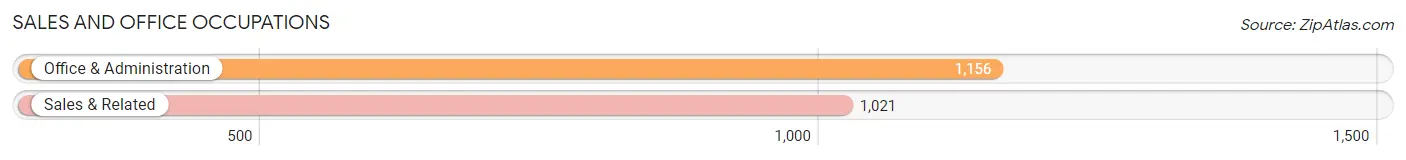
Sales and Office Occupations
The most common Sales and Office occupations in Brookings are Office & Administration (1,156 | 8.8%), and Sales & Related (1,021 | 7.8%).
Sales and Office Occupations by Sex
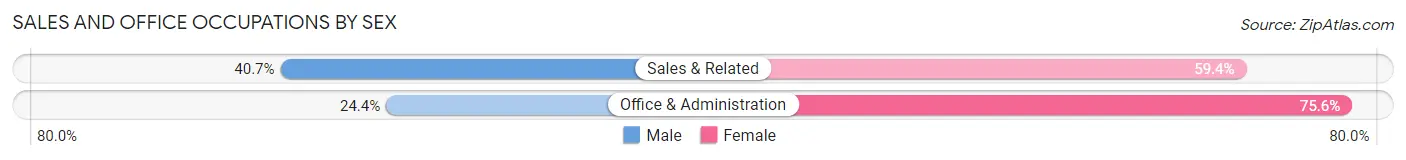
| Occupation | Male | Female |
| Sales & Related | 415 (40.6%) | 606 (59.4%) |
| Office & Administration | 282 (24.4%) | 874 (75.6%) |
| Total (Category) | 697 (32.0%) | 1,480 (68.0%) |
| Total (Overall) | 6,920 (52.6%) | 6,228 (47.4%) |
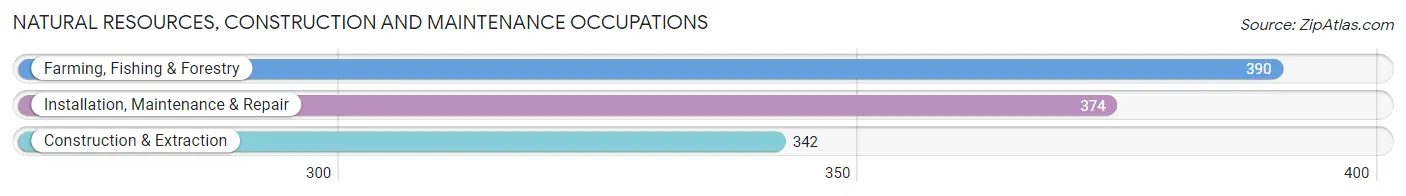
Natural Resources, Construction and Maintenance Occupations
The most common Natural Resources, Construction and Maintenance occupations in Brookings are Farming, Fishing & Forestry (390 | 3.0%), Installation, Maintenance & Repair (374 | 2.8%), and Construction & Extraction (342 | 2.6%).
Natural Resources, Construction and Maintenance Occupations by Sex
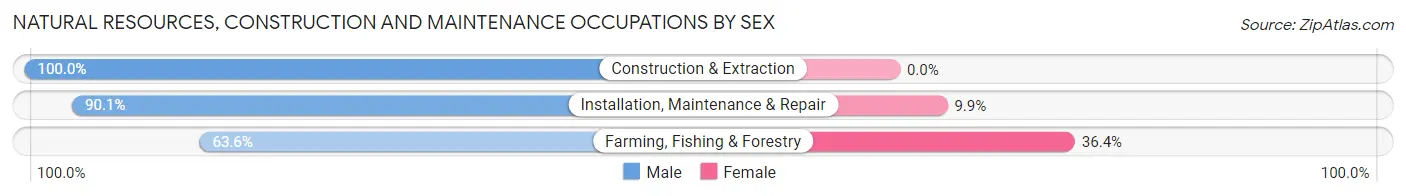
| Occupation | Male | Female |
| Farming, Fishing & Forestry | 248 (63.6%) | 142 (36.4%) |
| Construction & Extraction | 342 (100.0%) | 0 (0.0%) |
| Installation, Maintenance & Repair | 337 (90.1%) | 37 (9.9%) |
| Total (Category) | 927 (83.8%) | 179 (16.2%) |
| Total (Overall) | 6,920 (52.6%) | 6,228 (47.4%) |
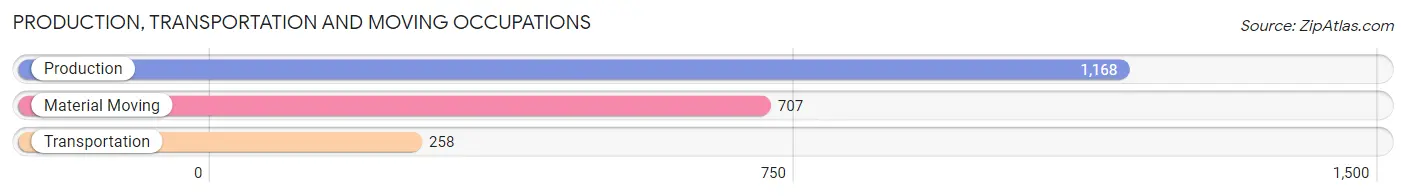
Production, Transportation and Moving Occupations
The most common Production, Transportation and Moving occupations in Brookings are Production (1,168 | 8.9%), Material Moving (707 | 5.4%), and Transportation (258 | 2.0%).
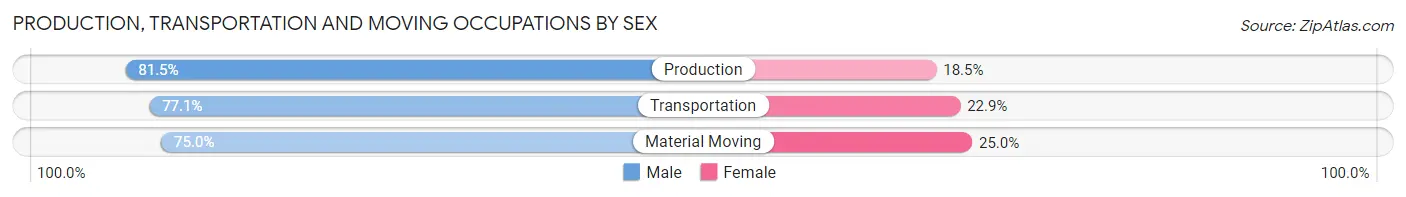
Production, Transportation and Moving Occupations by Sex
| Occupation | Male | Female |
| Production | 952 (81.5%) | 216 (18.5%) |
| Transportation | 199 (77.1%) | 59 (22.9%) |
| Material Moving | 530 (75.0%) | 177 (25.0%) |
| Total (Category) | 1,681 (78.8%) | 452 (21.2%) |
| Total (Overall) | 6,920 (52.6%) | 6,228 (47.4%) |
Employment Industries by Sex in Brookings
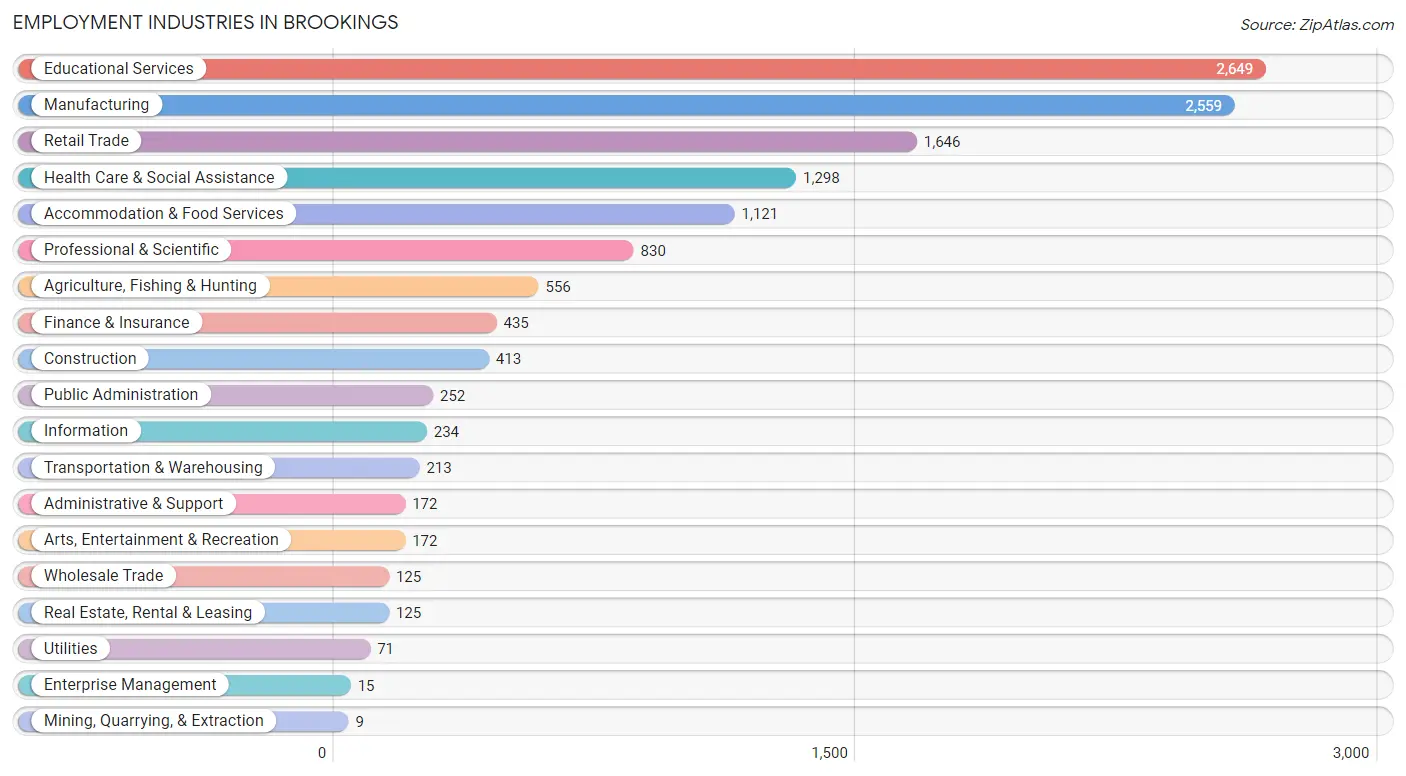
Employment Industries in Brookings
The major employment industries in Brookings include Educational Services (2,649 | 20.2%), Manufacturing (2,559 | 19.5%), Retail Trade (1,646 | 12.5%), Health Care & Social Assistance (1,298 | 9.9%), and Accommodation & Food Services (1,121 | 8.5%).
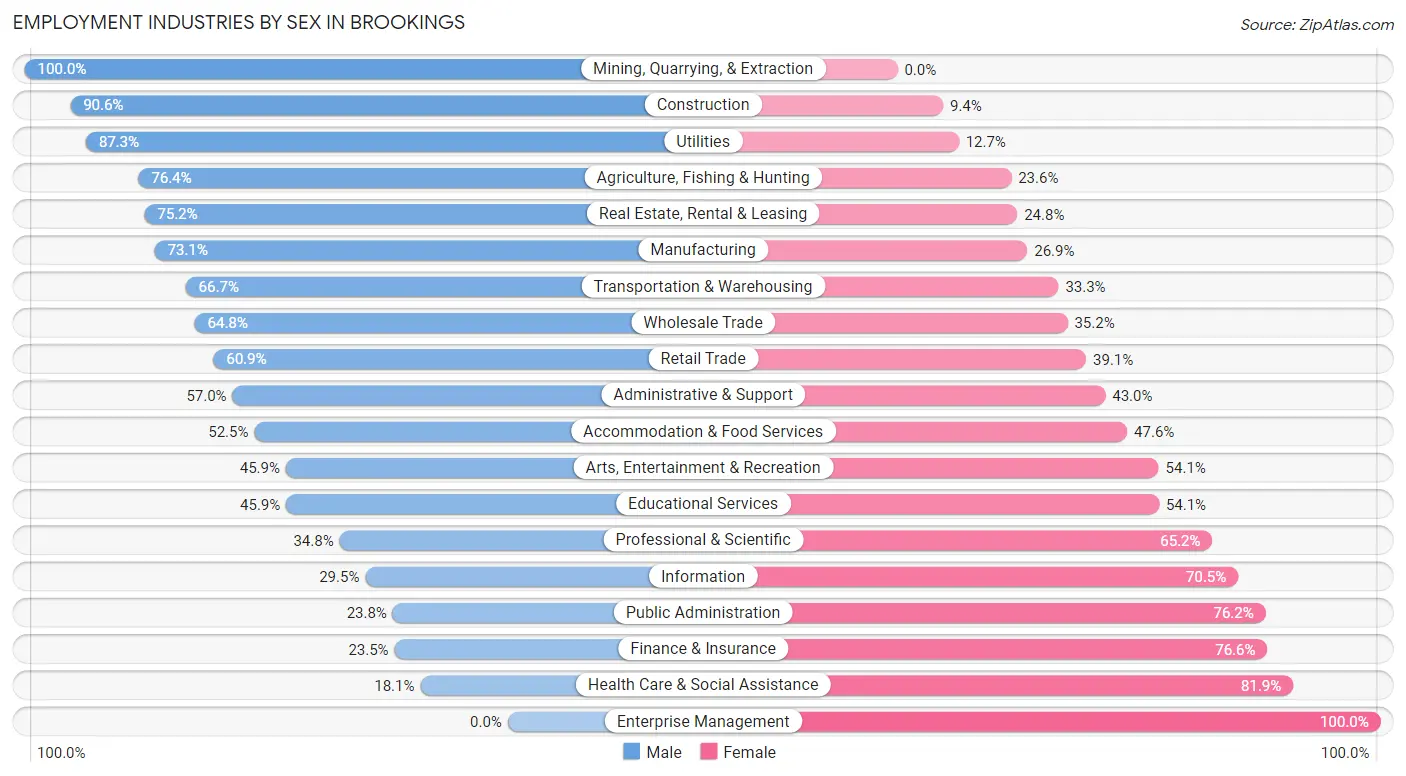
Employment Industries by Sex in Brookings
The Brookings industries that see more men than women are Mining, Quarrying, & Extraction (100.0%), Construction (90.6%), and Utilities (87.3%), whereas the industries that tend to have a higher number of women are Enterprise Management (100.0%), Health Care & Social Assistance (81.9%), and Finance & Insurance (76.5%).
| Industry | Male | Female |
| Agriculture, Fishing & Hunting | 425 (76.4%) | 131 (23.6%) |
| Mining, Quarrying, & Extraction | 9 (100.0%) | 0 (0.0%) |
| Construction | 374 (90.6%) | 39 (9.4%) |
| Manufacturing | 1,871 (73.1%) | 688 (26.9%) |
| Wholesale Trade | 81 (64.8%) | 44 (35.2%) |
| Retail Trade | 1,003 (60.9%) | 643 (39.1%) |
| Transportation & Warehousing | 142 (66.7%) | 71 (33.3%) |
| Utilities | 62 (87.3%) | 9 (12.7%) |
| Information | 69 (29.5%) | 165 (70.5%) |
| Finance & Insurance | 102 (23.4%) | 333 (76.5%) |
| Real Estate, Rental & Leasing | 94 (75.2%) | 31 (24.8%) |
| Professional & Scientific | 289 (34.8%) | 541 (65.2%) |
| Enterprise Management | 0 (0.0%) | 15 (100.0%) |
| Administrative & Support | 98 (57.0%) | 74 (43.0%) |
| Educational Services | 1,215 (45.9%) | 1,434 (54.1%) |
| Health Care & Social Assistance | 235 (18.1%) | 1,063 (81.9%) |
| Arts, Entertainment & Recreation | 79 (45.9%) | 93 (54.1%) |
| Accommodation & Food Services | 588 (52.4%) | 533 (47.5%) |
| Public Administration | 60 (23.8%) | 192 (76.2%) |
| Total | 6,920 (52.6%) | 6,228 (47.4%) |
Education in Brookings
School Enrollment in Brookings
The most common levels of schooling among the 10,233 students in Brookings are college / undergraduate (6,401 | 62.5%), elementary school (1,006 | 9.8%), and middle school (849 | 8.3%).
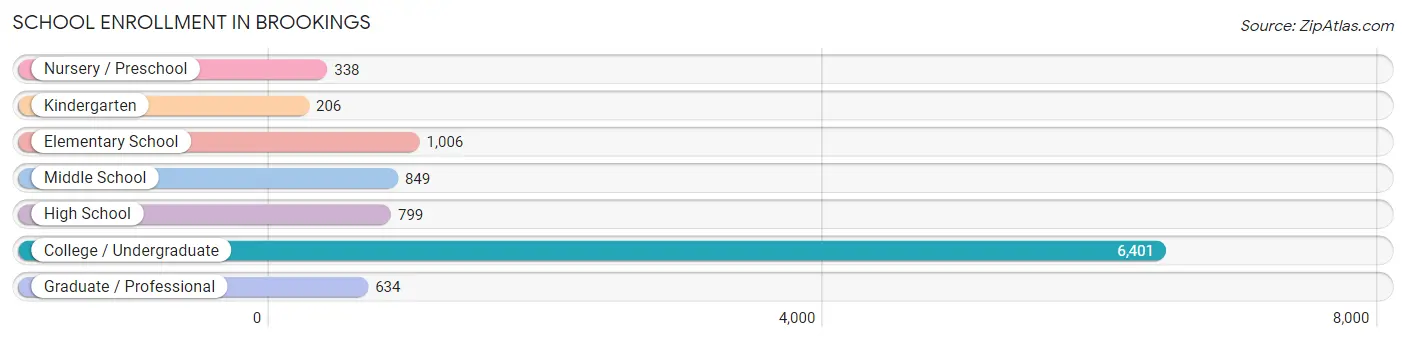
| School Level | # Students | % Students |
| Nursery / Preschool | 338 | 3.3% |
| Kindergarten | 206 | 2.0% |
| Elementary School | 1,006 | 9.8% |
| Middle School | 849 | 8.3% |
| High School | 799 | 7.8% |
| College / Undergraduate | 6,401 | 62.5% |
| Graduate / Professional | 634 | 6.2% |
| Total | 10,233 | 100.0% |
School Enrollment by Age by Funding Source in Brookings
Out of a total of 10,233 students who are enrolled in schools in Brookings, 665 (6.5%) attend a private institution, while the remaining 9,568 (93.5%) are enrolled in public schools. The age group of 3 to 4 year olds has the highest likelihood of being enrolled in private schools, with 56 (44.4% in the age bracket) enrolled. Conversely, the age group of 18 to 19 year olds has the lowest likelihood of being enrolled in a private school, with 2,545 (99.9% in the age bracket) attending a public institution.
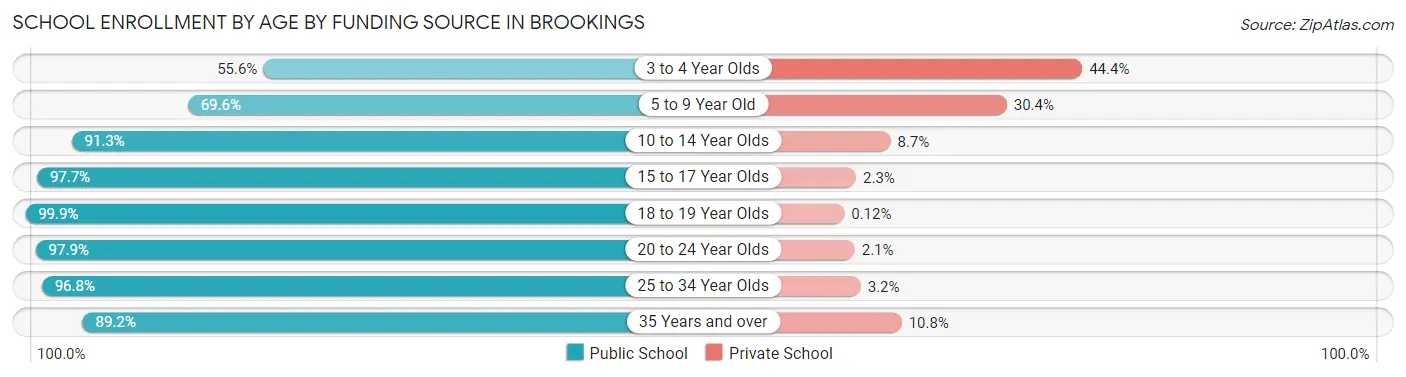
| Age Bracket | Public School | Private School |
| 3 to 4 Year Olds | 70 (55.6%) | 56 (44.4%) |
| 5 to 9 Year Old | 843 (69.6%) | 368 (30.4%) |
| 10 to 14 Year Olds | 983 (91.3%) | 94 (8.7%) |
| 15 to 17 Year Olds | 720 (97.7%) | 17 (2.3%) |
| 18 to 19 Year Olds | 2,545 (99.9%) | 3 (0.1%) |
| 20 to 24 Year Olds | 3,603 (97.9%) | 76 (2.1%) |
| 25 to 34 Year Olds | 577 (96.8%) | 19 (3.2%) |
| 35 Years and over | 231 (89.2%) | 28 (10.8%) |
| Total | 9,568 (93.5%) | 665 (6.5%) |
Educational Attainment by Field of Study in Brookings
Education (959 | 16.1%), business (722 | 12.1%), science & technology (663 | 11.2%), engineering (603 | 10.1%), and bio, nature & agricultural (599 | 10.1%) are the most common fields of study among 5,947 individuals in Brookings who have obtained a bachelor's degree or higher.
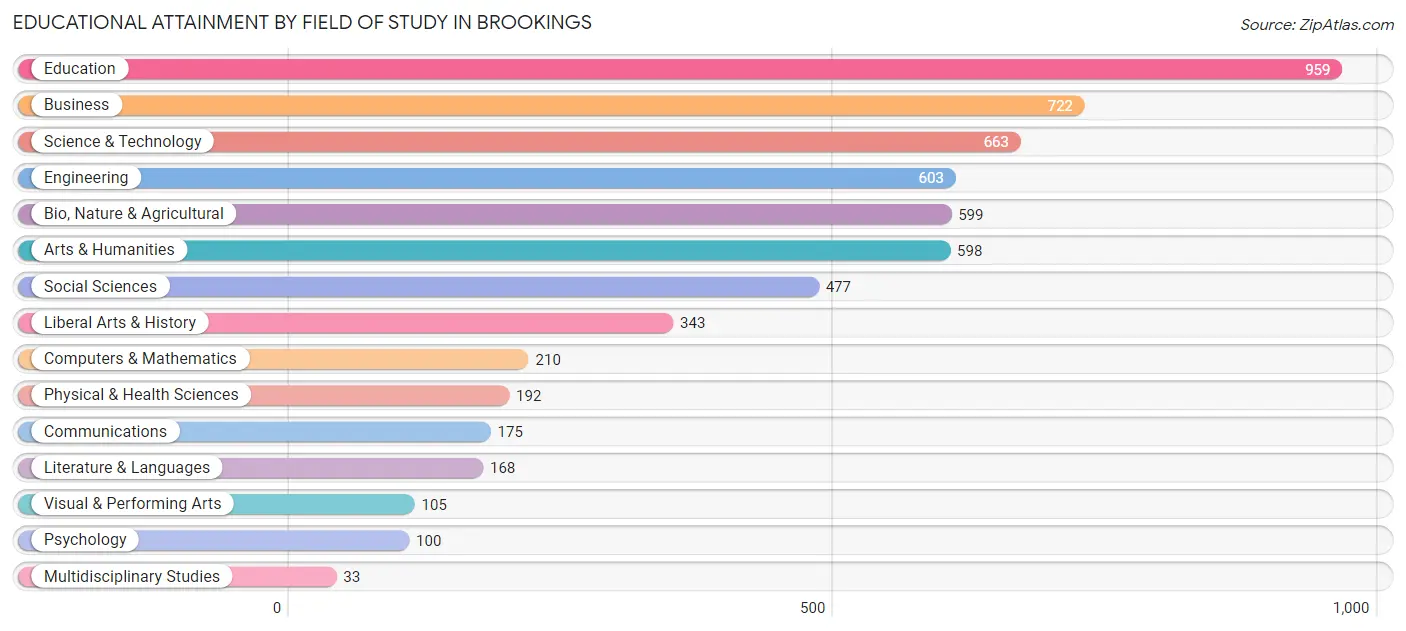
| Field of Study | # Graduates | % Graduates |
| Computers & Mathematics | 210 | 3.5% |
| Bio, Nature & Agricultural | 599 | 10.1% |
| Physical & Health Sciences | 192 | 3.2% |
| Psychology | 100 | 1.7% |
| Social Sciences | 477 | 8.0% |
| Engineering | 603 | 10.1% |
| Multidisciplinary Studies | 33 | 0.5% |
| Science & Technology | 663 | 11.2% |
| Business | 722 | 12.1% |
| Education | 959 | 16.1% |
| Literature & Languages | 168 | 2.8% |
| Liberal Arts & History | 343 | 5.8% |
| Visual & Performing Arts | 105 | 1.8% |
| Communications | 175 | 2.9% |
| Arts & Humanities | 598 | 10.1% |
| Total | 5,947 | 100.0% |
Transportation & Commute in Brookings
Vehicle Availability by Sex in Brookings
The most prevalent vehicle ownership categories in Brookings are males with 2 vehicles (2,106, accounting for 33.3%) and females with 2 vehicles (1,826, making up 39.8%).
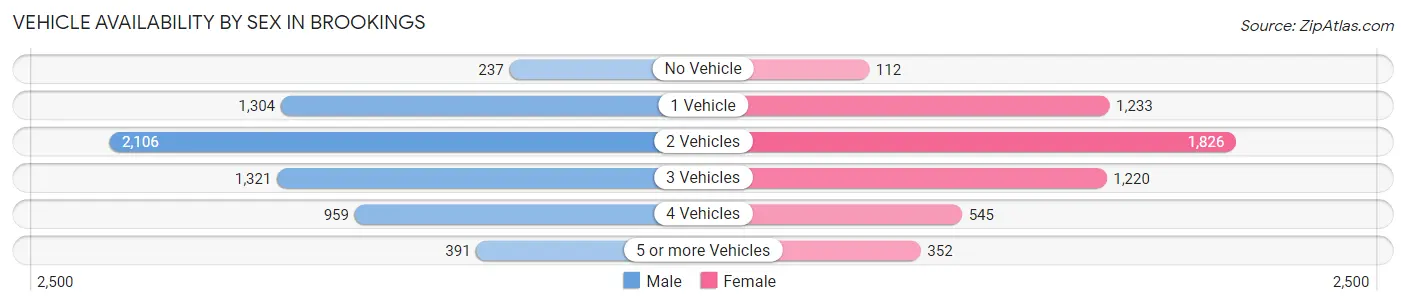
| Vehicles Available | Male | Female |
| No Vehicle | 237 (3.7%) | 112 (2.1%) |
| 1 Vehicle | 1,304 (20.6%) | 1,233 (23.3%) |
| 2 Vehicles | 2,106 (33.3%) | 1,826 (34.5%) |
| 3 Vehicles | 1,321 (20.9%) | 1,220 (23.1%) |
| 4 Vehicles | 959 (15.2%) | 545 (10.3%) |
| 5 or more Vehicles | 391 (6.2%) | 352 (6.7%) |
| Total | 6,318 (100.0%) | 5,288 (100.0%) |
Commute Time in Brookings
The most frequently occuring commute durations in Brookings are 5 to 9 minutes (4,254 commuters, 36.4%), 10 to 14 minutes (3,447 commuters, 29.5%), and 15 to 19 minutes (1,257 commuters, 10.8%).
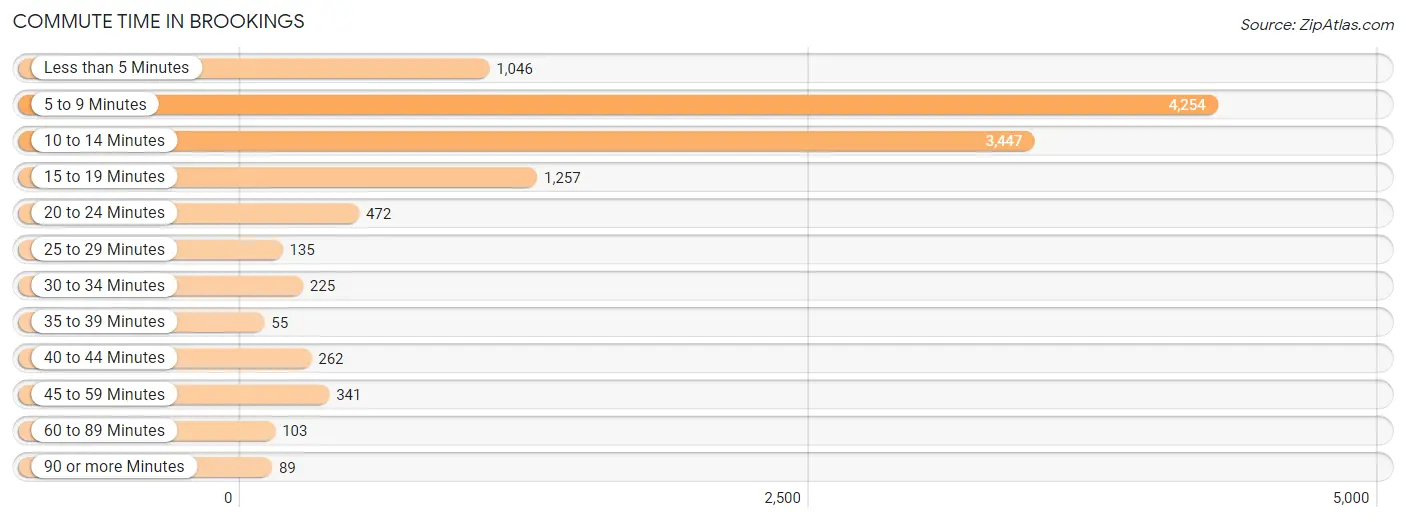
| Commute Time | # Commuters | % Commuters |
| Less than 5 Minutes | 1,046 | 8.9% |
| 5 to 9 Minutes | 4,254 | 36.4% |
| 10 to 14 Minutes | 3,447 | 29.5% |
| 15 to 19 Minutes | 1,257 | 10.8% |
| 20 to 24 Minutes | 472 | 4.0% |
| 25 to 29 Minutes | 135 | 1.2% |
| 30 to 34 Minutes | 225 | 1.9% |
| 35 to 39 Minutes | 55 | 0.5% |
| 40 to 44 Minutes | 262 | 2.2% |
| 45 to 59 Minutes | 341 | 2.9% |
| 60 to 89 Minutes | 103 | 0.9% |
| 90 or more Minutes | 89 | 0.8% |
Commute Time by Sex in Brookings
The most common commute times in Brookings are 5 to 9 minutes (1,941 commuters, 31.4%) for males and 5 to 9 minutes (2,313 commuters, 42.0%) for females.
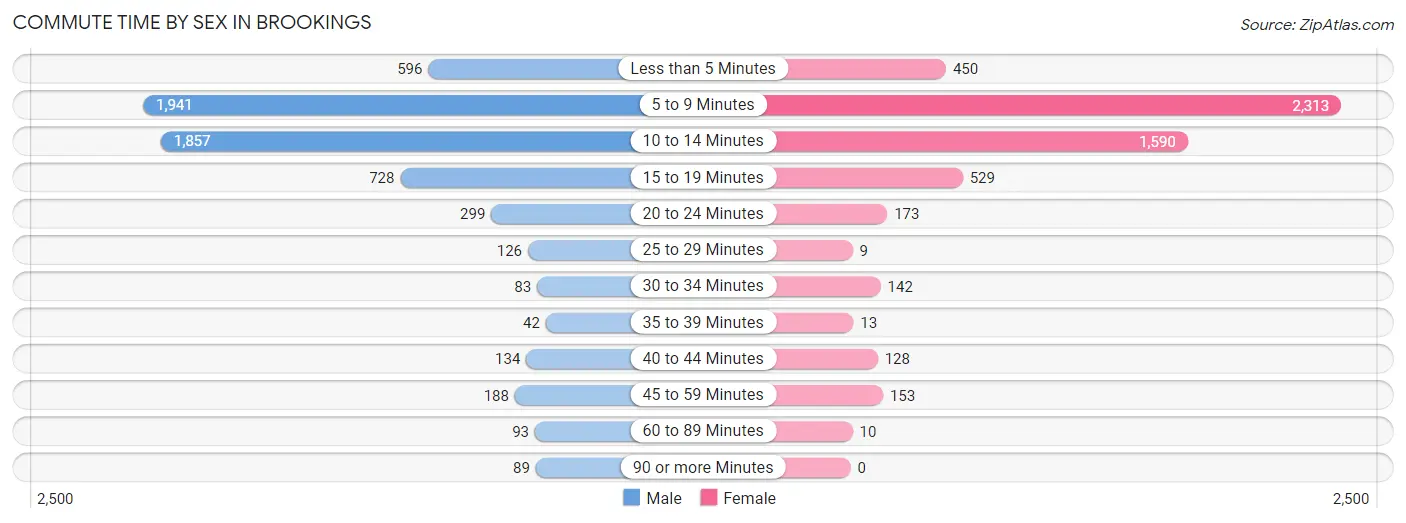
| Commute Time | Male | Female |
| Less than 5 Minutes | 596 (9.7%) | 450 (8.2%) |
| 5 to 9 Minutes | 1,941 (31.4%) | 2,313 (42.0%) |
| 10 to 14 Minutes | 1,857 (30.1%) | 1,590 (28.9%) |
| 15 to 19 Minutes | 728 (11.8%) | 529 (9.6%) |
| 20 to 24 Minutes | 299 (4.8%) | 173 (3.1%) |
| 25 to 29 Minutes | 126 (2.0%) | 9 (0.2%) |
| 30 to 34 Minutes | 83 (1.3%) | 142 (2.6%) |
| 35 to 39 Minutes | 42 (0.7%) | 13 (0.2%) |
| 40 to 44 Minutes | 134 (2.2%) | 128 (2.3%) |
| 45 to 59 Minutes | 188 (3.0%) | 153 (2.8%) |
| 60 to 89 Minutes | 93 (1.5%) | 10 (0.2%) |
| 90 or more Minutes | 89 (1.4%) | 0 (0.0%) |
Time of Departure to Work by Sex in Brookings
The most frequent times of departure to work in Brookings are 7:30 AM to 7:59 AM (1,098, 17.8%) for males and 7:30 AM to 7:59 AM (1,555, 28.2%) for females.
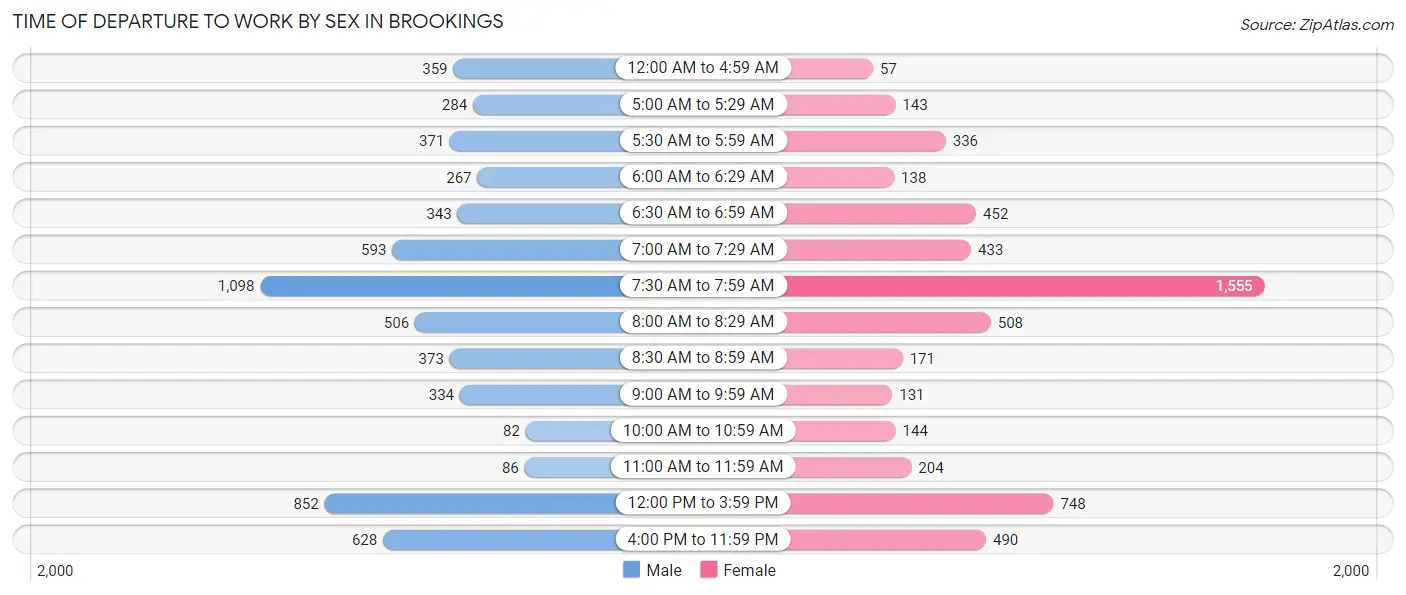
| Time of Departure | Male | Female |
| 12:00 AM to 4:59 AM | 359 (5.8%) | 57 (1.0%) |
| 5:00 AM to 5:29 AM | 284 (4.6%) | 143 (2.6%) |
| 5:30 AM to 5:59 AM | 371 (6.0%) | 336 (6.1%) |
| 6:00 AM to 6:29 AM | 267 (4.3%) | 138 (2.5%) |
| 6:30 AM to 6:59 AM | 343 (5.6%) | 452 (8.2%) |
| 7:00 AM to 7:29 AM | 593 (9.6%) | 433 (7.9%) |
| 7:30 AM to 7:59 AM | 1,098 (17.8%) | 1,555 (28.2%) |
| 8:00 AM to 8:29 AM | 506 (8.2%) | 508 (9.2%) |
| 8:30 AM to 8:59 AM | 373 (6.0%) | 171 (3.1%) |
| 9:00 AM to 9:59 AM | 334 (5.4%) | 131 (2.4%) |
| 10:00 AM to 10:59 AM | 82 (1.3%) | 144 (2.6%) |
| 11:00 AM to 11:59 AM | 86 (1.4%) | 204 (3.7%) |
| 12:00 PM to 3:59 PM | 852 (13.8%) | 748 (13.6%) |
| 4:00 PM to 11:59 PM | 628 (10.2%) | 490 (8.9%) |
| Total | 6,176 (100.0%) | 5,510 (100.0%) |
Housing Occupancy in Brookings
Occupancy by Ownership in Brookings
Of the total 8,766 dwellings in Brookings, owner-occupied units account for 4,214 (48.1%), while renter-occupied units make up 4,552 (51.9%).
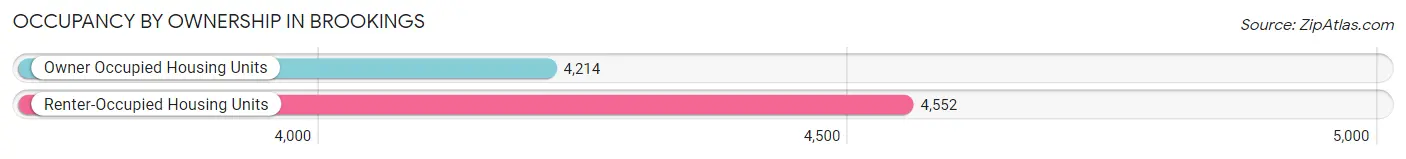
| Occupancy | # Housing Units | % Housing Units |
| Owner Occupied Housing Units | 4,214 | 48.1% |
| Renter-Occupied Housing Units | 4,552 | 51.9% |
| Total Occupied Housing Units | 8,766 | 100.0% |
Occupancy by Household Size in Brookings
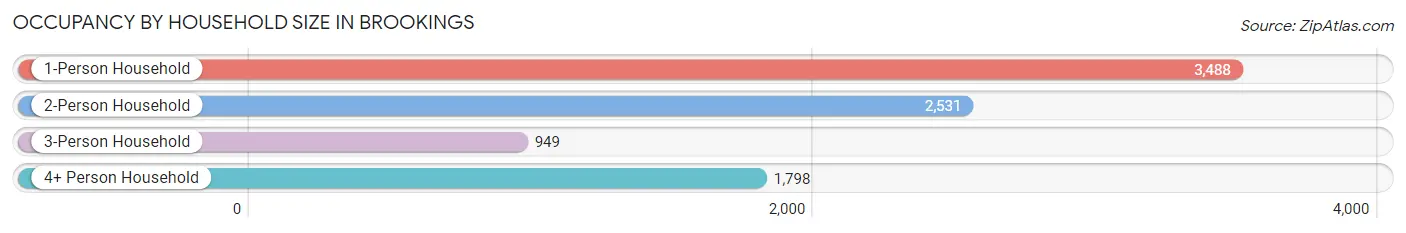
| Household Size | # Housing Units | % Housing Units |
| 1-Person Household | 3,488 | 39.8% |
| 2-Person Household | 2,531 | 28.9% |
| 3-Person Household | 949 | 10.8% |
| 4+ Person Household | 1,798 | 20.5% |
| Total Housing Units | 8,766 | 100.0% |
Occupancy by Ownership by Household Size in Brookings
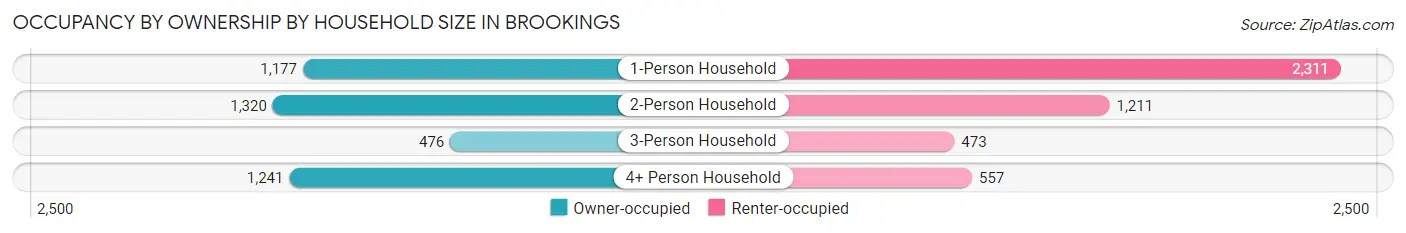
| Household Size | Owner-occupied | Renter-occupied |
| 1-Person Household | 1,177 (33.7%) | 2,311 (66.3%) |
| 2-Person Household | 1,320 (52.1%) | 1,211 (47.8%) |
| 3-Person Household | 476 (50.2%) | 473 (49.8%) |
| 4+ Person Household | 1,241 (69.0%) | 557 (31.0%) |
| Total Housing Units | 4,214 (48.1%) | 4,552 (51.9%) |
Occupancy by Educational Attainment in Brookings
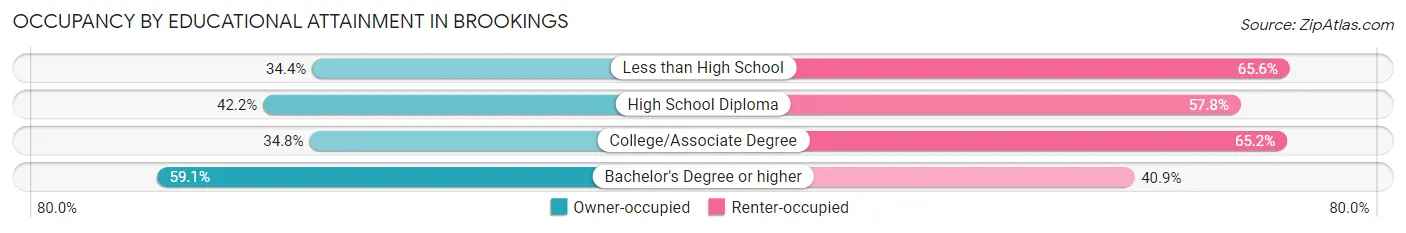
| Household Size | Owner-occupied | Renter-occupied |
| Less than High School | 87 (34.4%) | 166 (65.6%) |
| High School Diploma | 580 (42.2%) | 795 (57.8%) |
| College/Associate Degree | 962 (34.8%) | 1,800 (65.2%) |
| Bachelor's Degree or higher | 2,585 (59.1%) | 1,791 (40.9%) |
Occupancy by Age of Householder in Brookings
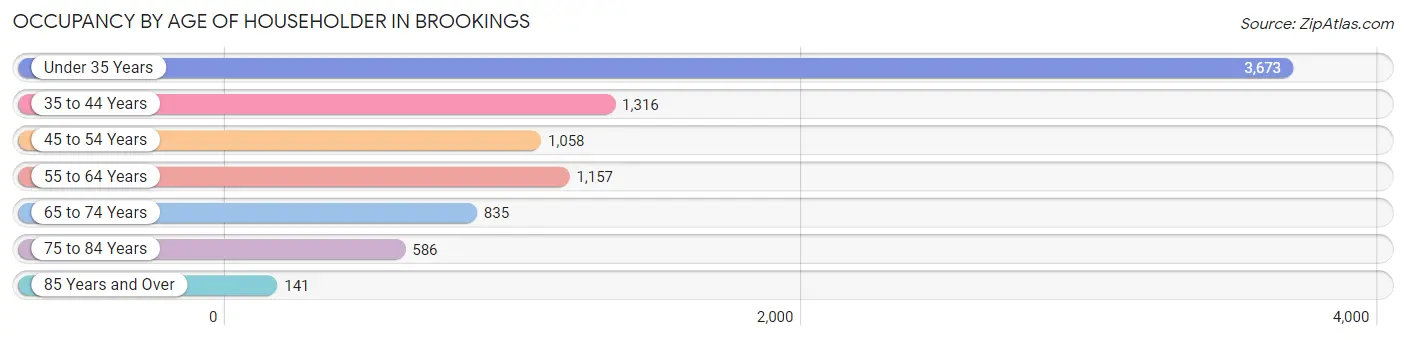
| Age Bracket | # Households | % Households |
| Under 35 Years | 3,673 | 41.9% |
| 35 to 44 Years | 1,316 | 15.0% |
| 45 to 54 Years | 1,058 | 12.1% |
| 55 to 64 Years | 1,157 | 13.2% |
| 65 to 74 Years | 835 | 9.5% |
| 75 to 84 Years | 586 | 6.7% |
| 85 Years and Over | 141 | 1.6% |
| Total | 8,766 | 100.0% |
Housing Finances in Brookings
Median Income by Occupancy in Brookings
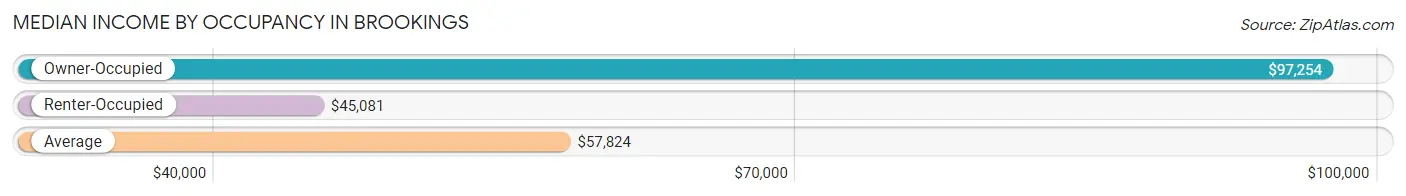
| Occupancy Type | # Households | Median Income |
| Owner-Occupied | 4,214 (48.1%) | $97,254 |
| Renter-Occupied | 4,552 (51.9%) | $45,081 |
| Average | 8,766 (100.0%) | $57,824 |
Occupancy by Householder Income Bracket in Brookings
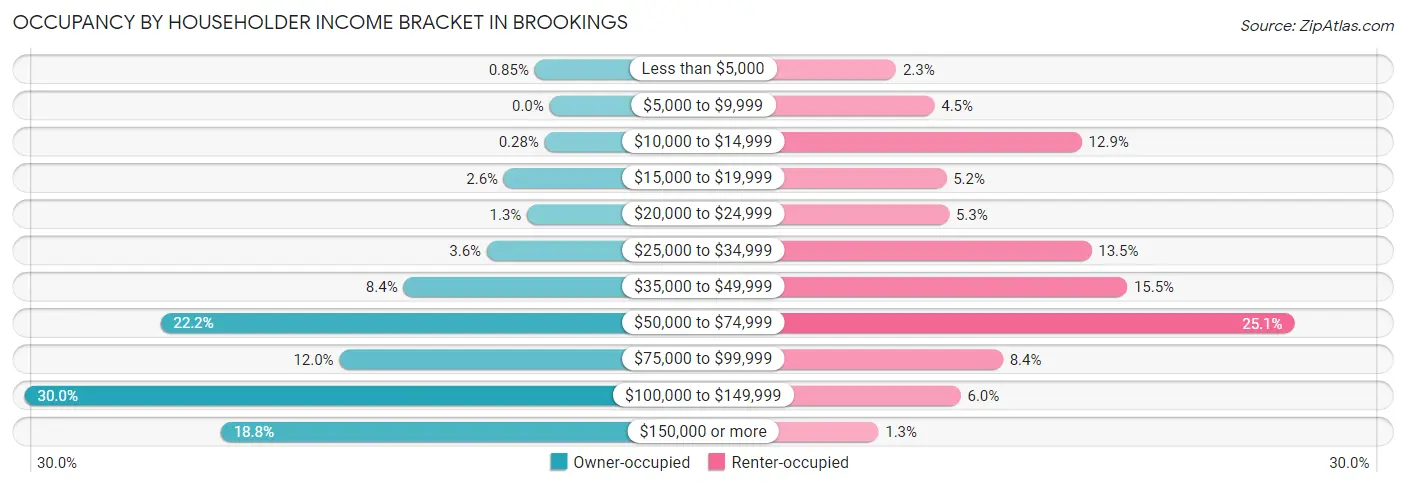
| Income Bracket | Owner-occupied | Renter-occupied |
| Less than $5,000 | 36 (0.9%) | 105 (2.3%) |
| $5,000 to $9,999 | 0 (0.0%) | 205 (4.5%) |
| $10,000 to $14,999 | 12 (0.3%) | 588 (12.9%) |
| $15,000 to $19,999 | 110 (2.6%) | 236 (5.2%) |
| $20,000 to $24,999 | 54 (1.3%) | 243 (5.3%) |
| $25,000 to $34,999 | 151 (3.6%) | 613 (13.5%) |
| $35,000 to $49,999 | 352 (8.4%) | 706 (15.5%) |
| $50,000 to $74,999 | 937 (22.2%) | 1,141 (25.1%) |
| $75,000 to $99,999 | 506 (12.0%) | 383 (8.4%) |
| $100,000 to $149,999 | 1,264 (30.0%) | 273 (6.0%) |
| $150,000 or more | 792 (18.8%) | 59 (1.3%) |
| Total | 4,214 (100.0%) | 4,552 (100.0%) |
Monthly Housing Cost Tiers in Brookings
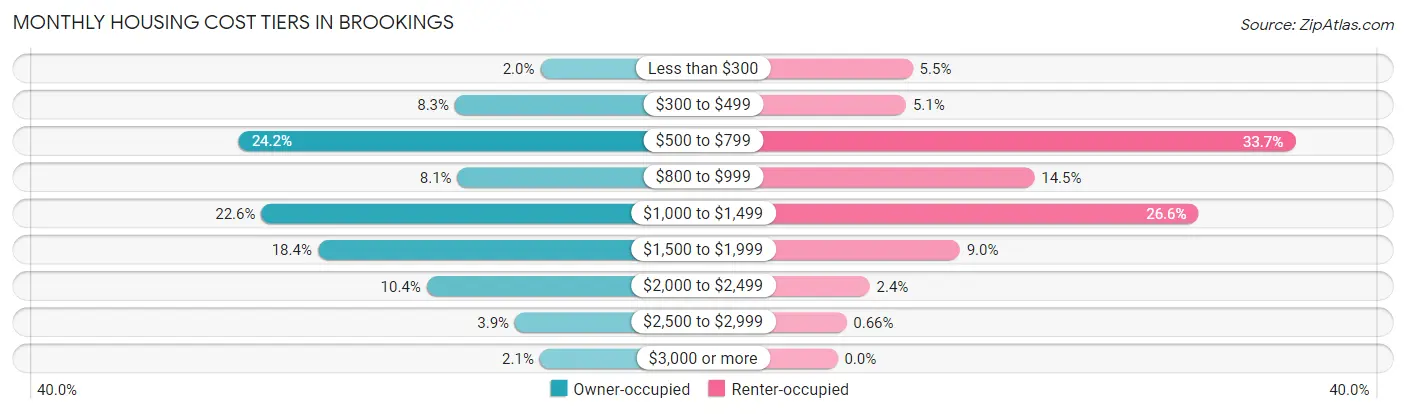
| Monthly Cost | Owner-occupied | Renter-occupied |
| Less than $300 | 85 (2.0%) | 252 (5.5%) |
| $300 to $499 | 350 (8.3%) | 230 (5.1%) |
| $500 to $799 | 1,021 (24.2%) | 1,534 (33.7%) |
| $800 to $999 | 342 (8.1%) | 660 (14.5%) |
| $1,000 to $1,499 | 951 (22.6%) | 1,210 (26.6%) |
| $1,500 to $1,999 | 776 (18.4%) | 410 (9.0%) |
| $2,000 to $2,499 | 438 (10.4%) | 108 (2.4%) |
| $2,500 to $2,999 | 164 (3.9%) | 30 (0.7%) |
| $3,000 or more | 87 (2.1%) | 0 (0.0%) |
| Total | 4,214 (100.0%) | 4,552 (100.0%) |
Physical Housing Characteristics in Brookings
Housing Structures in Brookings
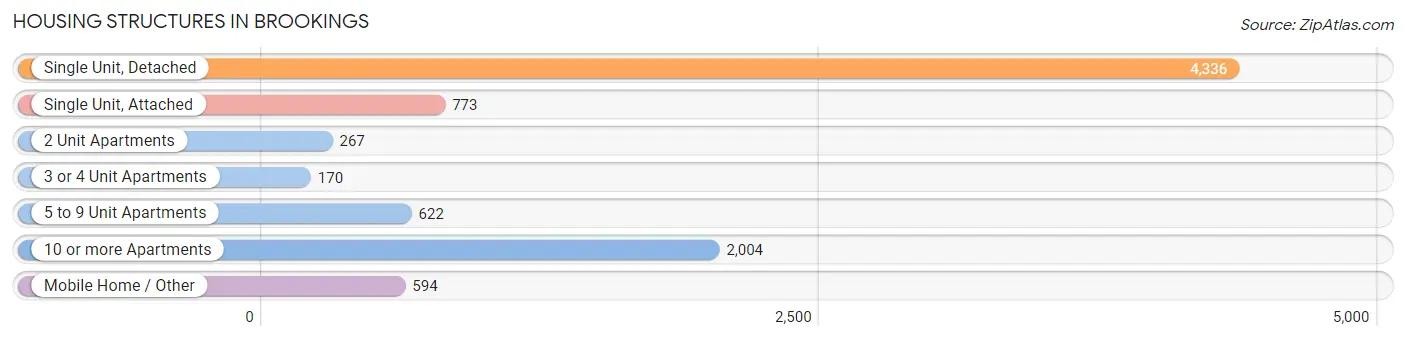
| Structure Type | # Housing Units | % Housing Units |
| Single Unit, Detached | 4,336 | 49.5% |
| Single Unit, Attached | 773 | 8.8% |
| 2 Unit Apartments | 267 | 3.0% |
| 3 or 4 Unit Apartments | 170 | 1.9% |
| 5 to 9 Unit Apartments | 622 | 7.1% |
| 10 or more Apartments | 2,004 | 22.9% |
| Mobile Home / Other | 594 | 6.8% |
| Total | 8,766 | 100.0% |
Housing Structures by Occupancy in Brookings
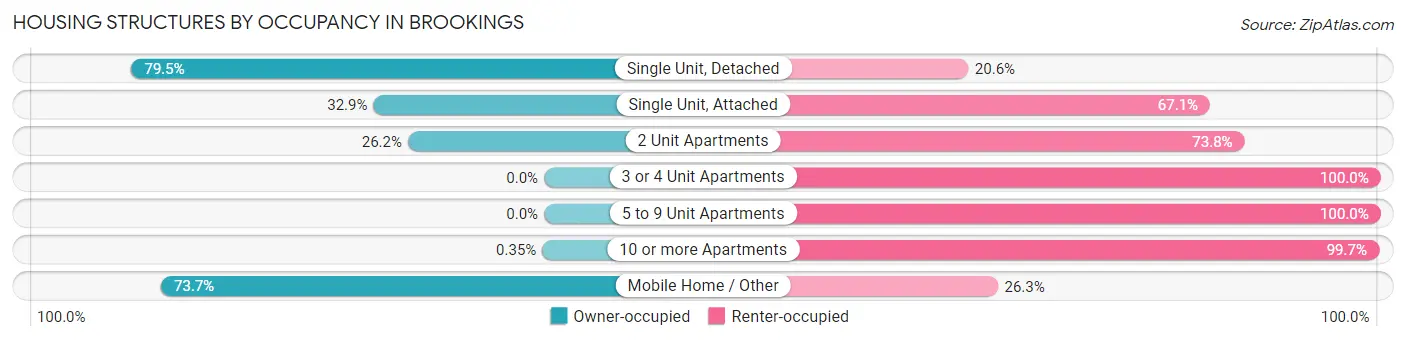
| Structure Type | Owner-occupied | Renter-occupied |
| Single Unit, Detached | 3,445 (79.4%) | 891 (20.5%) |
| Single Unit, Attached | 254 (32.9%) | 519 (67.1%) |
| 2 Unit Apartments | 70 (26.2%) | 197 (73.8%) |
| 3 or 4 Unit Apartments | 0 (0.0%) | 170 (100.0%) |
| 5 to 9 Unit Apartments | 0 (0.0%) | 622 (100.0%) |
| 10 or more Apartments | 7 (0.4%) | 1,997 (99.7%) |
| Mobile Home / Other | 438 (73.7%) | 156 (26.3%) |
| Total | 4,214 (48.1%) | 4,552 (51.9%) |
Housing Structures by Number of Rooms in Brookings
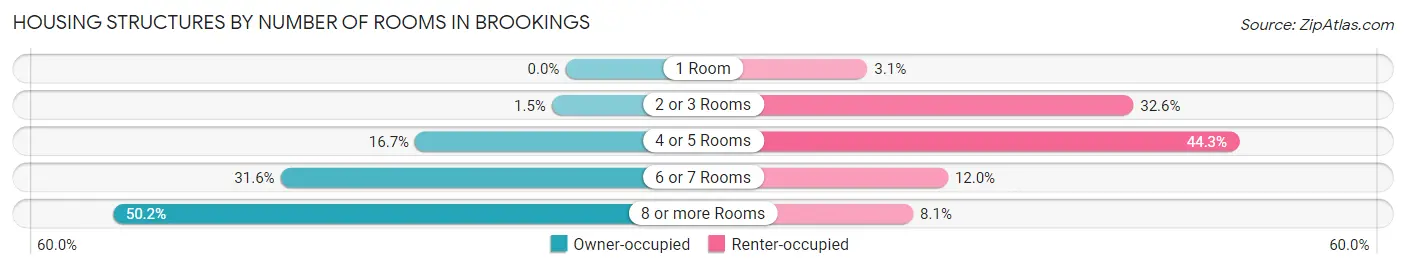
| Number of Rooms | Owner-occupied | Renter-occupied |
| 1 Room | 0 (0.0%) | 139 (3.0%) |
| 2 or 3 Rooms | 63 (1.5%) | 1,482 (32.6%) |
| 4 or 5 Rooms | 703 (16.7%) | 2,015 (44.3%) |
| 6 or 7 Rooms | 1,332 (31.6%) | 546 (12.0%) |
| 8 or more Rooms | 2,116 (50.2%) | 370 (8.1%) |
| Total | 4,214 (100.0%) | 4,552 (100.0%) |
Housing Structure by Heating Type in Brookings
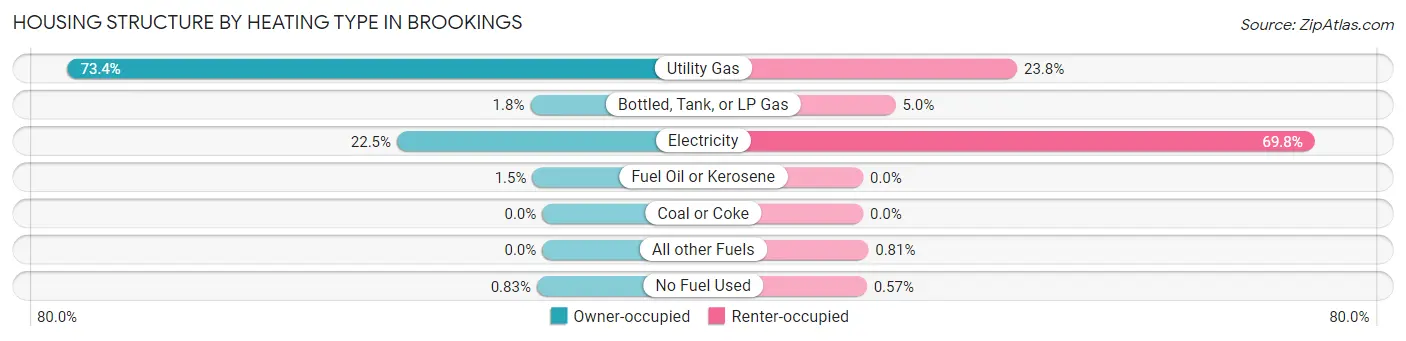
| Heating Type | Owner-occupied | Renter-occupied |
| Utility Gas | 3,092 (73.4%) | 1,084 (23.8%) |
| Bottled, Tank, or LP Gas | 77 (1.8%) | 228 (5.0%) |
| Electricity | 946 (22.5%) | 3,177 (69.8%) |
| Fuel Oil or Kerosene | 64 (1.5%) | 0 (0.0%) |
| Coal or Coke | 0 (0.0%) | 0 (0.0%) |
| All other Fuels | 0 (0.0%) | 37 (0.8%) |
| No Fuel Used | 35 (0.8%) | 26 (0.6%) |
| Total | 4,214 (100.0%) | 4,552 (100.0%) |
Household Vehicle Usage in Brookings
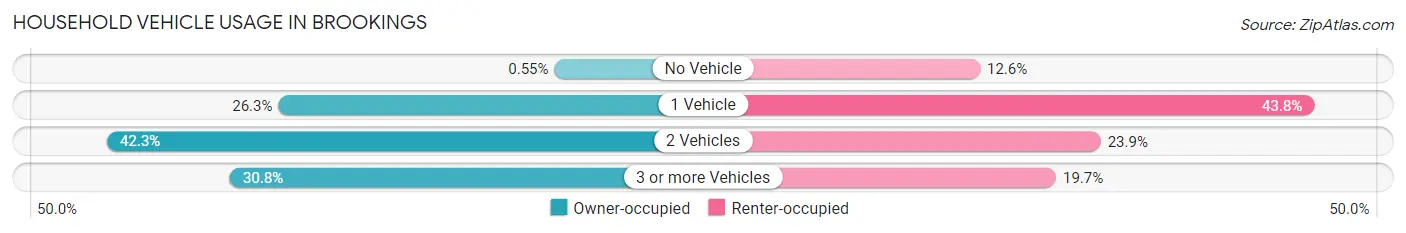
| Vehicles per Household | Owner-occupied | Renter-occupied |
| No Vehicle | 23 (0.5%) | 574 (12.6%) |
| 1 Vehicle | 1,109 (26.3%) | 1,994 (43.8%) |
| 2 Vehicles | 1,783 (42.3%) | 1,087 (23.9%) |
| 3 or more Vehicles | 1,299 (30.8%) | 897 (19.7%) |
| Total | 4,214 (100.0%) | 4,552 (100.0%) |
Real Estate & Mortgages in Brookings
Real Estate and Mortgage Overview in Brookings
| Characteristic | Without Mortgage | With Mortgage |
| Housing Units | 1,570 | 2,644 |
| Median Property Value | $215,100 | $226,700 |
| Median Household Income | $81,774 | $503 |
| Monthly Housing Costs | $627 | $87 |
| Real Estate Taxes | $2,637 | $51 |
Property Value by Mortgage Status in Brookings
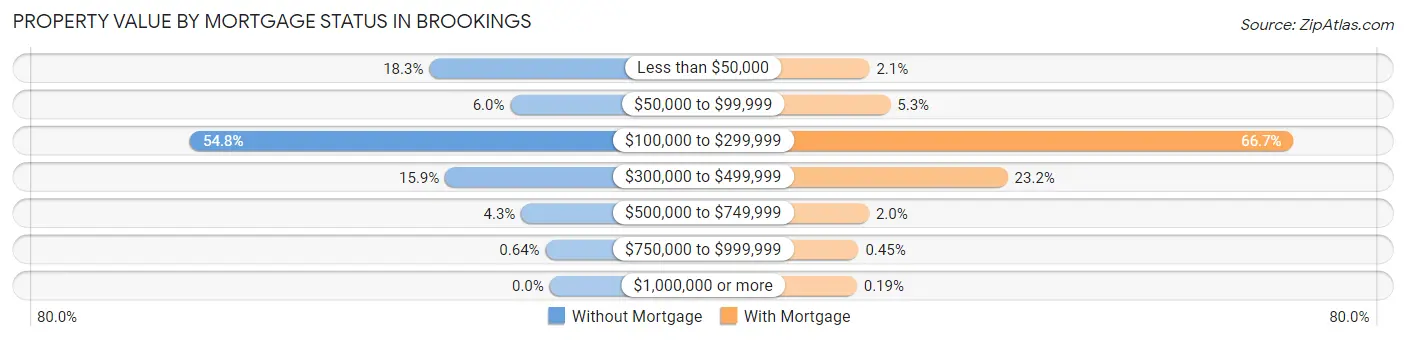
| Property Value | Without Mortgage | With Mortgage |
| Less than $50,000 | 288 (18.3%) | 56 (2.1%) |
| $50,000 to $99,999 | 94 (6.0%) | 140 (5.3%) |
| $100,000 to $299,999 | 860 (54.8%) | 1,764 (66.7%) |
| $300,000 to $499,999 | 250 (15.9%) | 613 (23.2%) |
| $500,000 to $749,999 | 68 (4.3%) | 54 (2.0%) |
| $750,000 to $999,999 | 10 (0.6%) | 12 (0.4%) |
| $1,000,000 or more | 0 (0.0%) | 5 (0.2%) |
| Total | 1,570 (100.0%) | 2,644 (100.0%) |
Household Income by Mortgage Status in Brookings
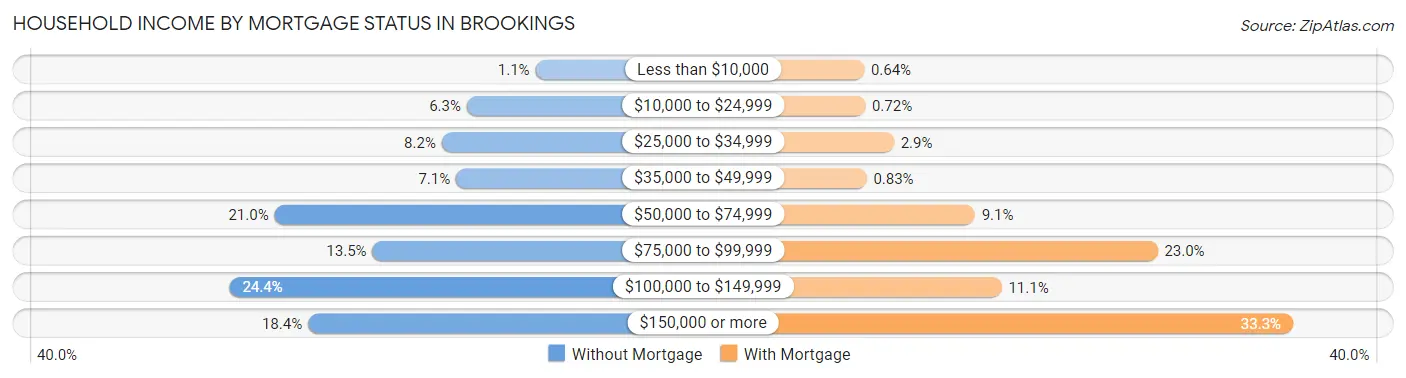
| Household Income | Without Mortgage | With Mortgage |
| Less than $10,000 | 17 (1.1%) | 17 (0.6%) |
| $10,000 to $24,999 | 99 (6.3%) | 19 (0.7%) |
| $25,000 to $34,999 | 129 (8.2%) | 77 (2.9%) |
| $35,000 to $49,999 | 112 (7.1%) | 22 (0.8%) |
| $50,000 to $74,999 | 329 (21.0%) | 240 (9.1%) |
| $75,000 to $99,999 | 212 (13.5%) | 608 (23.0%) |
| $100,000 to $149,999 | 383 (24.4%) | 294 (11.1%) |
| $150,000 or more | 289 (18.4%) | 881 (33.3%) |
| Total | 1,570 (100.0%) | 2,644 (100.0%) |
Property Value to Household Income Ratio in Brookings
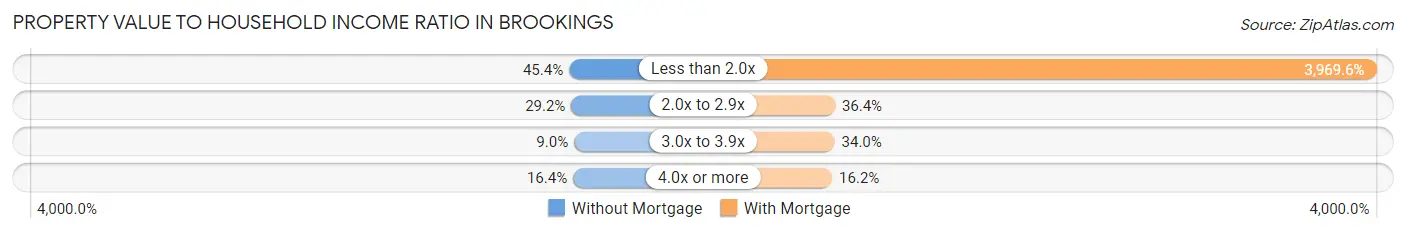
| Value-to-Income Ratio | Without Mortgage | With Mortgage |
| Less than 2.0x | 712 (45.4%) | 104,956 (3,969.6%) |
| 2.0x to 2.9x | 459 (29.2%) | 961 (36.3%) |
| 3.0x to 3.9x | 142 (9.0%) | 898 (34.0%) |
| 4.0x or more | 257 (16.4%) | 427 (16.2%) |
| Total | 1,570 (100.0%) | 2,644 (100.0%) |
Real Estate Taxes by Mortgage Status in Brookings
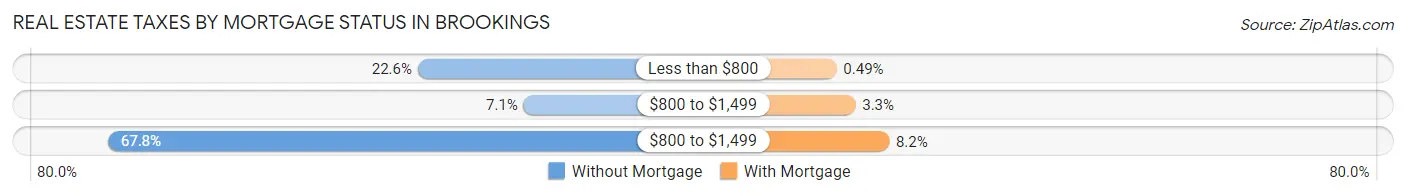
| Property Taxes | Without Mortgage | With Mortgage |
| Less than $800 | 354 (22.6%) | 13 (0.5%) |
| $800 to $1,499 | 111 (7.1%) | 86 (3.3%) |
| $800 to $1,499 | 1,065 (67.8%) | 216 (8.2%) |
| Total | 1,570 (100.0%) | 2,644 (100.0%) |
Health & Disability in Brookings
Health Insurance Coverage by Age in Brookings
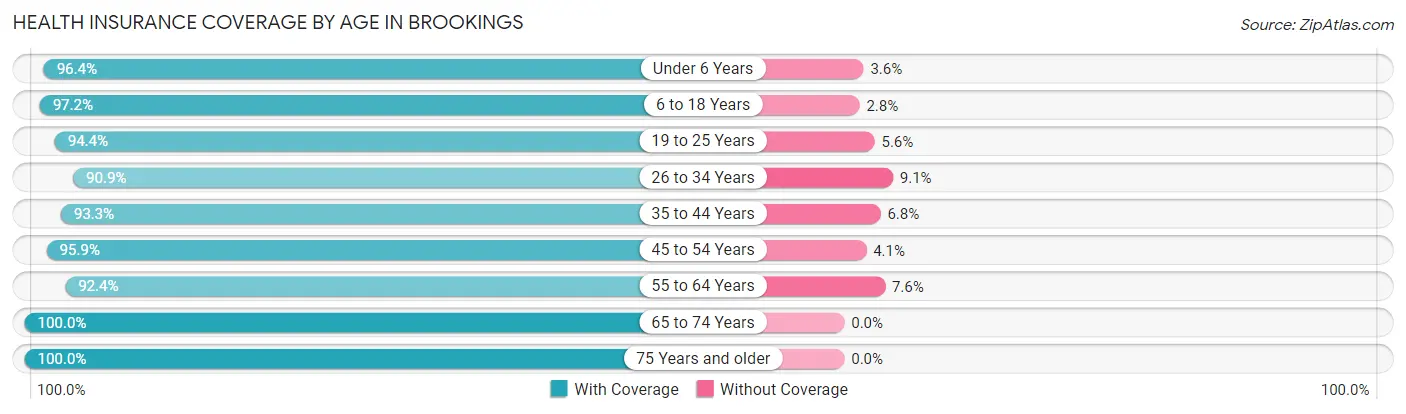
| Age Bracket | With Coverage | Without Coverage |
| Under 6 Years | 1,374 (96.4%) | 51 (3.6%) |
| 6 to 18 Years | 3,942 (97.2%) | 115 (2.8%) |
| 19 to 25 Years | 6,858 (94.4%) | 410 (5.6%) |
| 26 to 34 Years | 2,108 (90.9%) | 210 (9.1%) |
| 35 to 44 Years | 2,322 (93.2%) | 168 (6.8%) |
| 45 to 54 Years | 1,547 (95.9%) | 66 (4.1%) |
| 55 to 64 Years | 1,622 (92.4%) | 133 (7.6%) |
| 65 to 74 Years | 1,333 (100.0%) | 0 (0.0%) |
| 75 Years and older | 1,059 (100.0%) | 0 (0.0%) |
| Total | 22,165 (95.1%) | 1,153 (4.9%) |
Health Insurance Coverage by Citizenship Status in Brookings
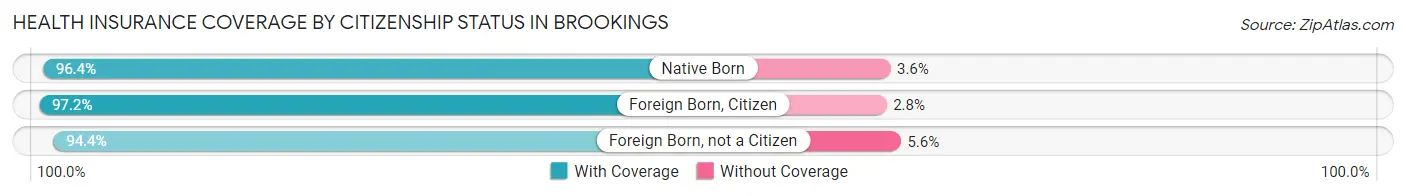
| Citizenship Status | With Coverage | Without Coverage |
| Native Born | 1,374 (96.4%) | 51 (3.6%) |
| Foreign Born, Citizen | 3,942 (97.2%) | 115 (2.8%) |
| Foreign Born, not a Citizen | 6,858 (94.4%) | 410 (5.6%) |
Health Insurance Coverage by Household Income in Brookings
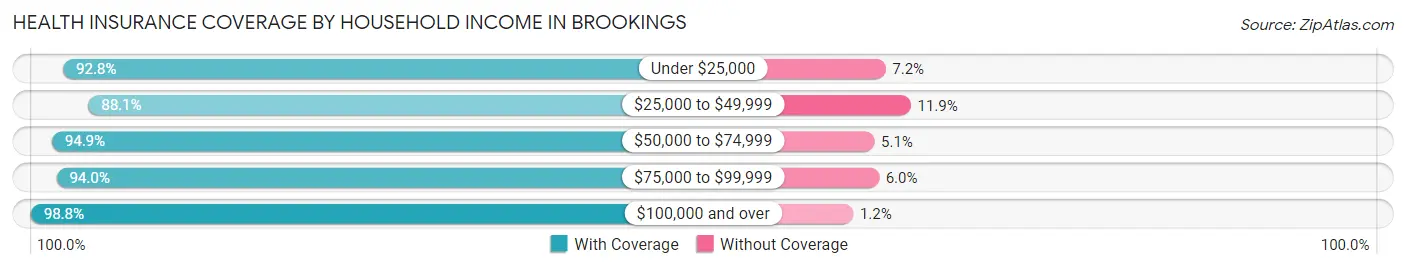
| Household Income | With Coverage | Without Coverage |
| Under $25,000 | 2,132 (92.8%) | 166 (7.2%) |
| $25,000 to $49,999 | 3,112 (88.1%) | 422 (11.9%) |
| $50,000 to $74,999 | 4,104 (94.9%) | 221 (5.1%) |
| $75,000 to $99,999 | 2,358 (94.0%) | 150 (6.0%) |
| $100,000 and over | 7,410 (98.8%) | 87 (1.2%) |
Public vs Private Health Insurance Coverage by Age in Brookings
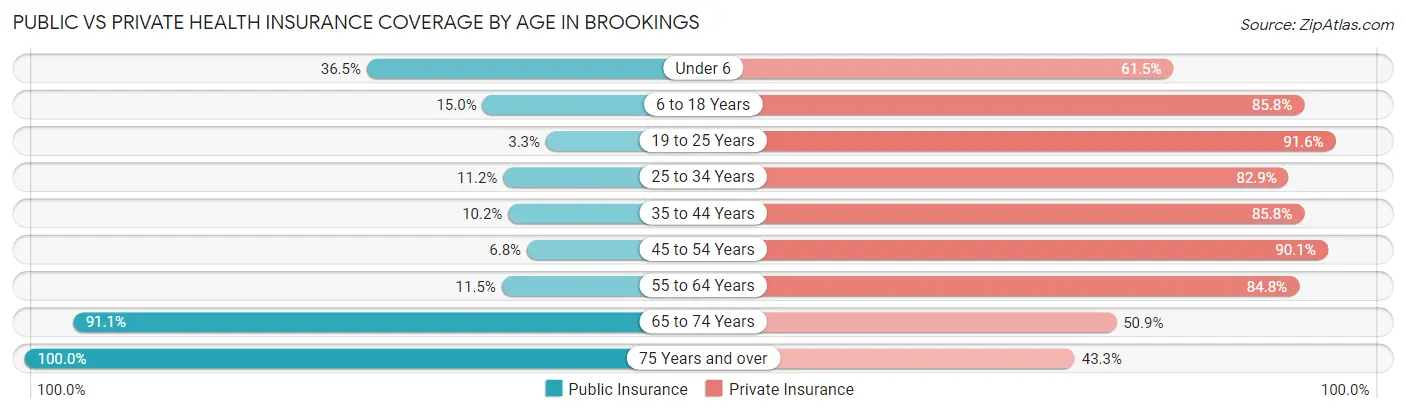
| Age Bracket | Public Insurance | Private Insurance |
| Under 6 | 520 (36.5%) | 877 (61.5%) |
| 6 to 18 Years | 609 (15.0%) | 3,481 (85.8%) |
| 19 to 25 Years | 236 (3.3%) | 6,659 (91.6%) |
| 25 to 34 Years | 259 (11.2%) | 1,922 (82.9%) |
| 35 to 44 Years | 255 (10.2%) | 2,136 (85.8%) |
| 45 to 54 Years | 109 (6.8%) | 1,454 (90.1%) |
| 55 to 64 Years | 201 (11.5%) | 1,489 (84.8%) |
| 65 to 74 Years | 1,214 (91.1%) | 679 (50.9%) |
| 75 Years and over | 1,059 (100.0%) | 458 (43.2%) |
| Total | 4,462 (19.1%) | 19,155 (82.2%) |
Disability Status by Sex by Age in Brookings
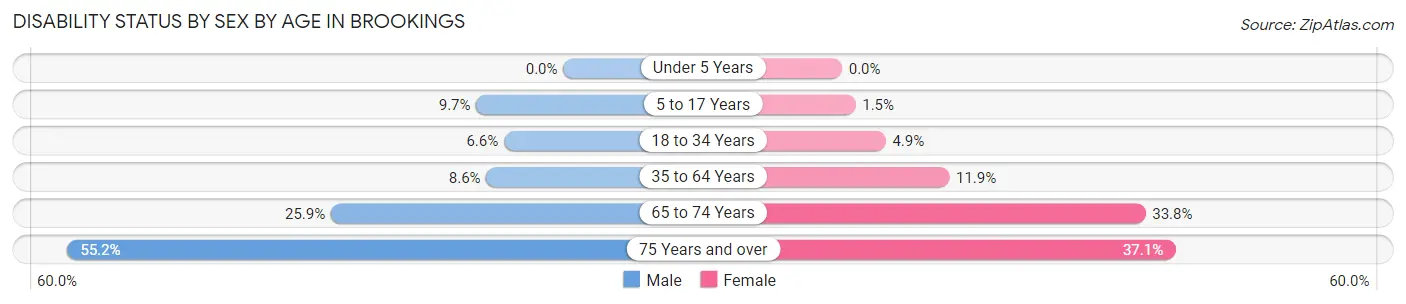
| Age Bracket | Male | Female |
| Under 5 Years | 0 (0.0%) | 0 (0.0%) |
| 5 to 17 Years | 139 (9.7%) | 26 (1.5%) |
| 18 to 34 Years | 378 (6.6%) | 245 (4.9%) |
| 35 to 64 Years | 250 (8.6%) | 351 (11.9%) |
| 65 to 74 Years | 178 (25.9%) | 218 (33.8%) |
| 75 Years and over | 253 (55.2%) | 223 (37.1%) |
Disability Class by Sex by Age in Brookings
Disability Class: Hearing Difficulty
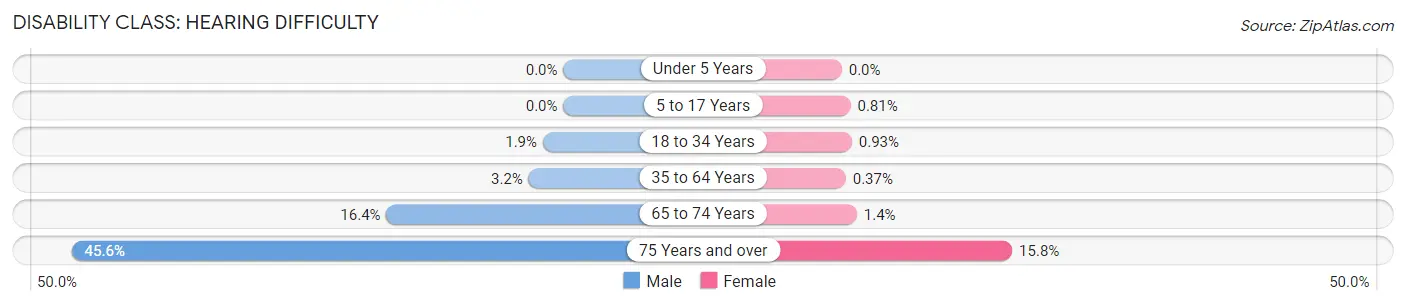
| Age Bracket | Male | Female |
| Under 5 Years | 0 (0.0%) | 0 (0.0%) |
| 5 to 17 Years | 0 (0.0%) | 14 (0.8%) |
| 18 to 34 Years | 109 (1.9%) | 47 (0.9%) |
| 35 to 64 Years | 94 (3.2%) | 11 (0.4%) |
| 65 to 74 Years | 113 (16.4%) | 9 (1.4%) |
| 75 Years and over | 209 (45.6%) | 95 (15.8%) |
Disability Class: Vision Difficulty
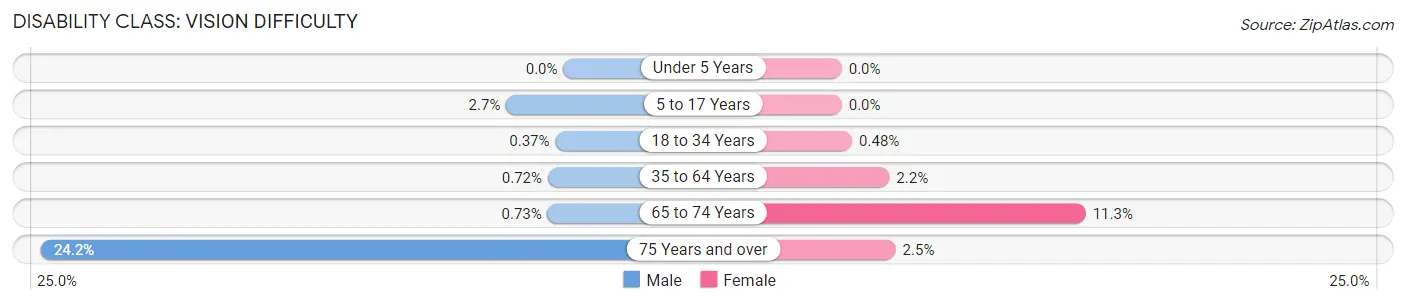
| Age Bracket | Male | Female |
| Under 5 Years | 0 (0.0%) | 0 (0.0%) |
| 5 to 17 Years | 38 (2.6%) | 0 (0.0%) |
| 18 to 34 Years | 21 (0.4%) | 24 (0.5%) |
| 35 to 64 Years | 21 (0.7%) | 65 (2.2%) |
| 65 to 74 Years | 5 (0.7%) | 73 (11.3%) |
| 75 Years and over | 111 (24.2%) | 15 (2.5%) |
Disability Class: Cognitive Difficulty
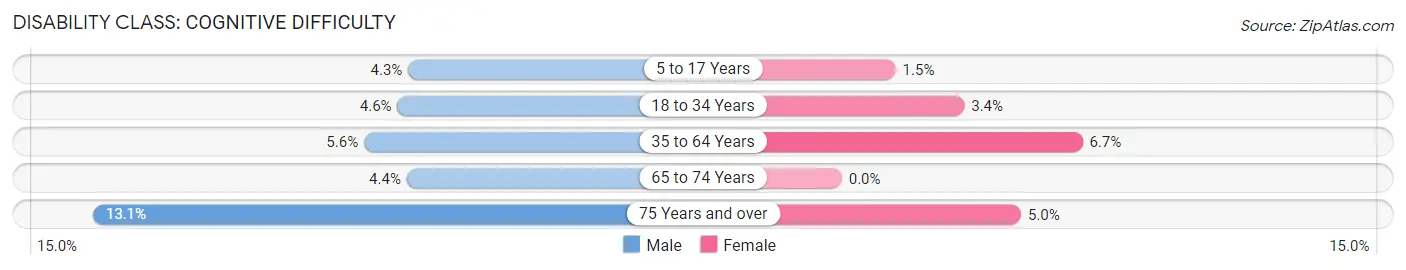
| Age Bracket | Male | Female |
| 5 to 17 Years | 62 (4.3%) | 26 (1.5%) |
| 18 to 34 Years | 265 (4.6%) | 172 (3.4%) |
| 35 to 64 Years | 162 (5.6%) | 197 (6.7%) |
| 65 to 74 Years | 30 (4.4%) | 0 (0.0%) |
| 75 Years and over | 60 (13.1%) | 30 (5.0%) |
Disability Class: Ambulatory Difficulty
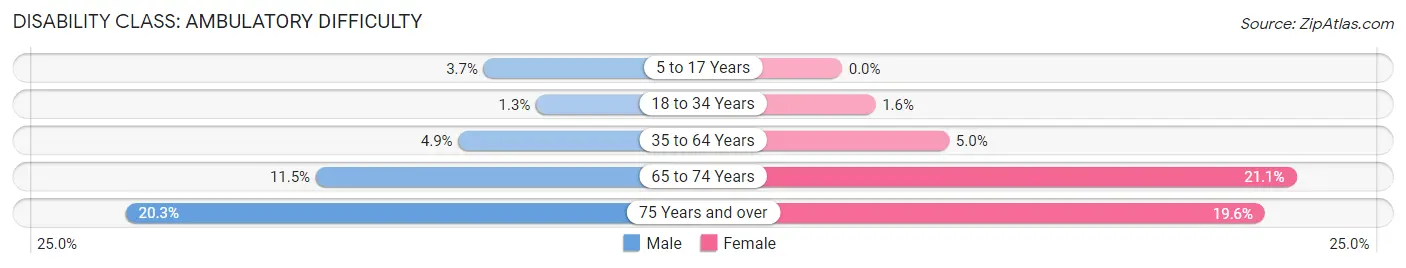
| Age Bracket | Male | Female |
| 5 to 17 Years | 53 (3.7%) | 0 (0.0%) |
| 18 to 34 Years | 72 (1.3%) | 78 (1.5%) |
| 35 to 64 Years | 142 (4.9%) | 146 (5.0%) |
| 65 to 74 Years | 79 (11.5%) | 136 (21.1%) |
| 75 Years and over | 93 (20.3%) | 118 (19.6%) |
Disability Class: Self-Care Difficulty
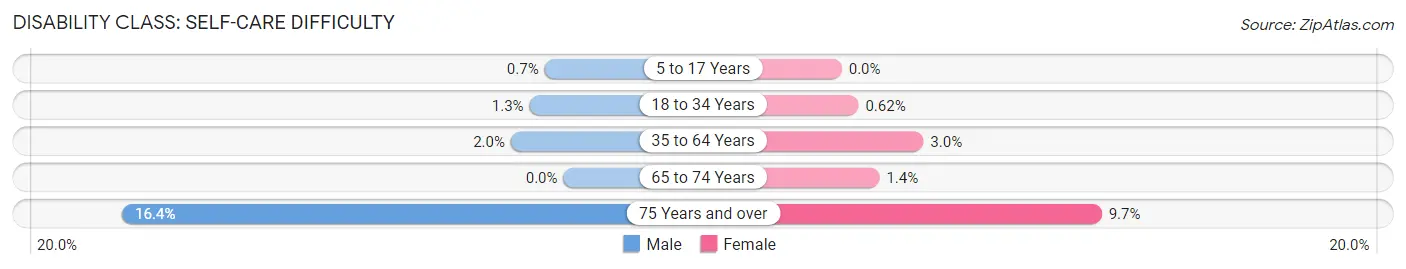
| Age Bracket | Male | Female |
| 5 to 17 Years | 10 (0.7%) | 0 (0.0%) |
| 18 to 34 Years | 72 (1.3%) | 31 (0.6%) |
| 35 to 64 Years | 57 (1.9%) | 89 (3.0%) |
| 65 to 74 Years | 0 (0.0%) | 9 (1.4%) |
| 75 Years and over | 75 (16.4%) | 58 (9.7%) |
Technology Access in Brookings
Computing Device Access in Brookings
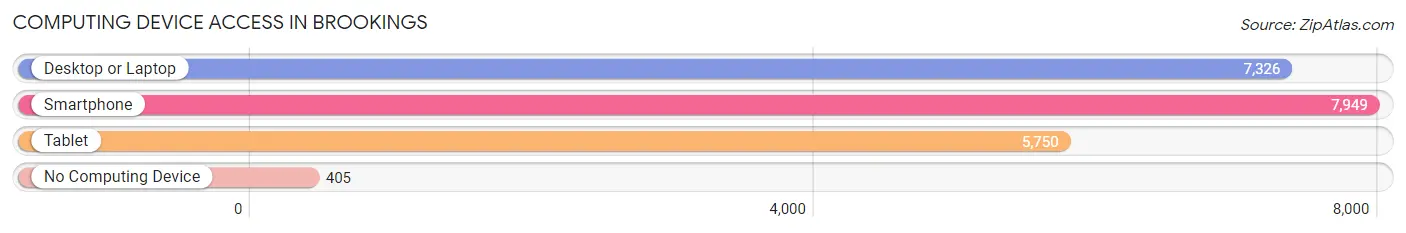
| Device Type | # Households | % Households |
| Desktop or Laptop | 7,326 | 83.6% |
| Smartphone | 7,949 | 90.7% |
| Tablet | 5,750 | 65.6% |
| No Computing Device | 405 | 4.6% |
| Total | 8,766 | 100.0% |
Internet Access in Brookings
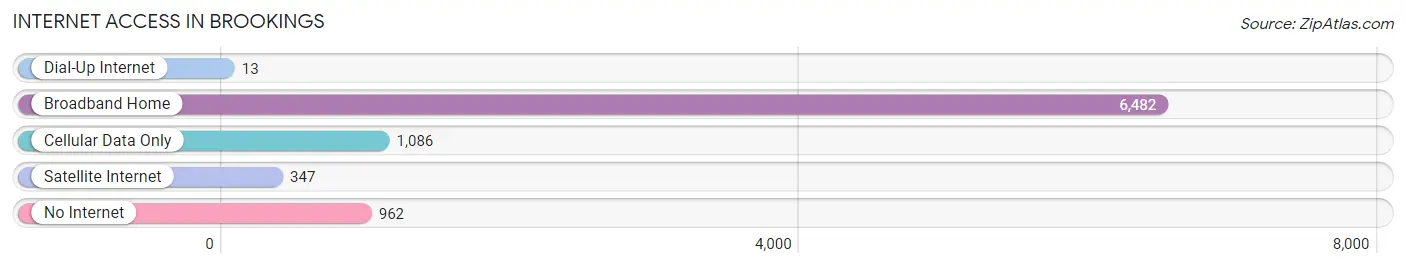
| Internet Type | # Households | % Households |
| Dial-Up Internet | 13 | 0.2% |
| Broadband Home | 6,482 | 73.9% |
| Cellular Data Only | 1,086 | 12.4% |
| Satellite Internet | 347 | 4.0% |
| No Internet | 962 | 11.0% |
| Total | 8,766 | 100.0% |
Brookings Summary
Brookings, South Dakota is a city located in the eastern part of the state, in Brookings County. It is the fourth largest city in South Dakota, with a population of 22,056 as of the 2010 census. The city is home to South Dakota State University, the largest university in the state.
History
The area that is now Brookings was first settled in 1857 by a group of Norwegian immigrants. The city was named after Wilmot Brookings, a railroad official who helped bring the railroad to the area. The city was officially incorporated in 1883.
In the early 1900s, the city experienced a period of growth and development. The South Dakota State College of Agriculture and Mechanic Arts (now South Dakota State University) was established in Brookings in 1881. The college was the first public university in the state and has since grown to become the largest university in South Dakota.
In the 1950s, the city experienced a period of rapid growth. The population of Brookings more than doubled between 1950 and 1960, from 5,000 to 11,000. This growth was largely due to the expansion of South Dakota State University and the growth of the local economy.
Geography
Brookings is located in the eastern part of South Dakota, in Brookings County. It is situated on the Big Sioux River, about 50 miles north of Sioux Falls. The city is located in the Prairie Coteau region of the state, which is characterized by rolling hills and prairies.
The city has a total area of 8.7 square miles, of which 8.6 square miles is land and 0.1 square miles is water. The city is located at an elevation of 1,541 feet above sea level.
Economy
The economy of Brookings is largely driven by the presence of South Dakota State University. The university is the largest employer in the city, with over 4,000 employees. Other major employers in the city include the Brookings Health System, Daktronics, and 3M.
The city also has a strong agricultural sector, with a variety of crops grown in the area. The city is home to several food processing plants, including a Tyson Foods plant and a Cargill plant.
Demographics
As of the 2010 census, the population of Brookings was 22,056. The racial makeup of the city was 90.2% White, 4.2% African American, 0.7% Native American, 2.2% Asian, 0.3% Pacific Islander, and 1.4% from other races. Hispanic or Latino of any race were 2.7% of the population.
The median household income in Brookings was $45,945, and the median family income was $60,945. The per capita income for the city was $22,845. About 8.2% of the population was below the poverty line.
The city is home to a variety of religious denominations, including Lutheran, Catholic, Methodist, and Baptist. The largest religious group in the city is Lutheran, with over 20% of the population identifying as Lutheran.
Common Questions
What is Per Capita Income in Brookings?
Per Capita income in Brookings is $29,284.
What is the Median Family Income in Brookings?
Median Family Income in Brookings is $95,804.
What is the Median Household income in Brookings?
Median Household Income in Brookings is $57,824.
What is Income or Wage Gap in Brookings?
Income or Wage Gap in Brookings is 24.6%.
Women in Brookings earn 75.4 cents for every dollar earned by a man.
What is Inequality or Gini Index in Brookings?
Inequality or Gini Index in Brookings is 0.41.
What is the Total Population of Brookings?
Total Population of Brookings is 23,530.
What is the Total Male Population of Brookings?
Total Male Population of Brookings is 12,005.
What is the Total Female Population of Brookings?
Total Female Population of Brookings is 11,525.
What is the Ratio of Males per 100 Females in Brookings?
There are 104.16 Males per 100 Females in Brookings.
What is the Ratio of Females per 100 Males in Brookings?
There are 96.00 Females per 100 Males in Brookings.
What is the Median Population Age in Brookings?
Median Population Age in Brookings is 24.5 Years.
What is the Average Family Size in Brookings
Average Family Size in Brookings is 3.2 People.
What is the Average Household Size in Brookings
Average Household Size in Brookings is 2.3 People.
How Large is the Labor Force in Brookings?
There are 13,921 People in the Labor Forcein in Brookings.
What is the Percentage of People in the Labor Force in Brookings?
70.1% of People are in the Labor Force in Brookings.
What is the Unemployment Rate in Brookings?
Unemployment Rate in Brookings is 5.1%.