Dell Rapids, SD Map & Demographics
Dell Rapids Map
Dell Rapids Overview
$39,941
PER CAPITA INCOME
$112,845
AVG FAMILY INCOME
$88,958
AVG HOUSEHOLD INCOME
28.1%
WAGE / INCOME GAP [ % ]
71.9¢/ $1
WAGE / INCOME GAP [ $ ]
0.35
INEQUALITY / GINI INDEX
3,953
TOTAL POPULATION
1,882
MALE POPULATION
2,071
FEMALE POPULATION
90.87
MALES / 100 FEMALES
110.04
FEMALES / 100 MALES
38.7
MEDIAN AGE
3.0
AVG FAMILY SIZE
2.5
AVG HOUSEHOLD SIZE
2,054
LABOR FORCE [ PEOPLE ]
67.8%
PERCENT IN LABOR FORCE
1.3%
UNEMPLOYMENT RATE
Dell Rapids Zip Codes
Dell Rapids Area Codes
Income in Dell Rapids
Income Overview in Dell Rapids
Per Capita Income in Dell Rapids is $39,941, while median incomes of families and households are $112,845 and $88,958 respectively.
| Characteristic | Number | Measure |
| Per Capita Income | 3,953 | $39,941 |
| Median Family Income | 1,148 | $112,845 |
| Mean Family Income | 1,148 | $116,567 |
| Median Household Income | 1,529 | $88,958 |
| Mean Household Income | 1,529 | $101,858 |
| Income Deficit | 1,148 | $0 |
| Wage / Income Gap (%) | 3,953 | 28.07% |
| Wage / Income Gap ($) | 3,953 | 71.93¢ per $1 |
| Gini / Inequality Index | 3,953 | 0.35 |
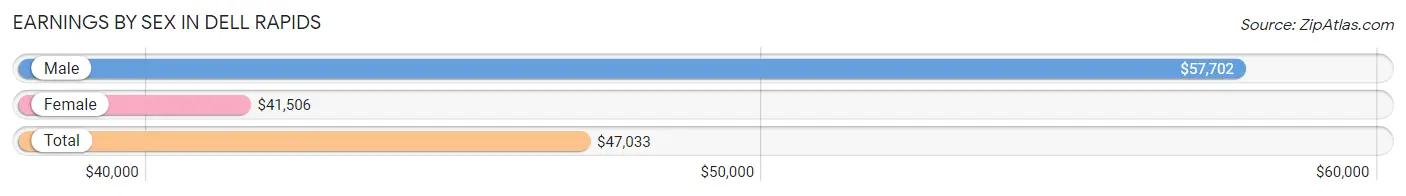
Earnings by Sex in Dell Rapids
Average Earnings in Dell Rapids are $47,033, $57,702 for men and $41,506 for women, a difference of 28.1%.
| Sex | Number | Average Earnings |
| Male | 1,129 (51.3%) | $57,702 |
| Female | 1,071 (48.7%) | $41,506 |
| Total | 2,200 (100.0%) | $47,033 |
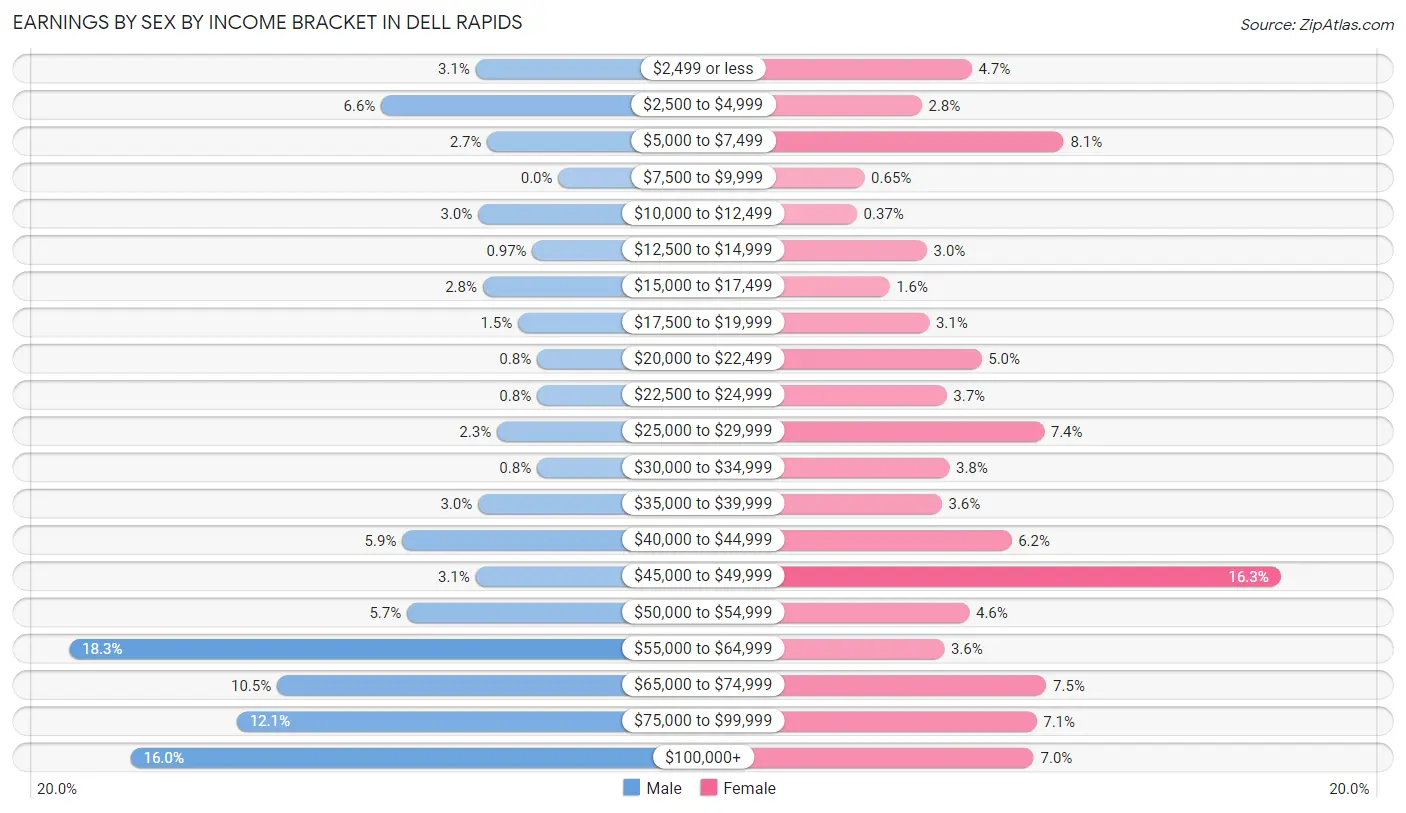
Earnings by Sex by Income Bracket in Dell Rapids
The most common earnings brackets in Dell Rapids are $55,000 to $64,999 for men (207 | 18.3%) and $45,000 to $49,999 for women (174 | 16.3%).
| Income | Male | Female |
| $2,499 or less | 35 (3.1%) | 50 (4.7%) |
| $2,500 to $4,999 | 75 (6.6%) | 30 (2.8%) |
| $5,000 to $7,499 | 30 (2.7%) | 87 (8.1%) |
| $7,500 to $9,999 | 0 (0.0%) | 7 (0.6%) |
| $10,000 to $12,499 | 34 (3.0%) | 4 (0.4%) |
| $12,500 to $14,999 | 11 (1.0%) | 32 (3.0%) |
| $15,000 to $17,499 | 32 (2.8%) | 17 (1.6%) |
| $17,500 to $19,999 | 17 (1.5%) | 33 (3.1%) |
| $20,000 to $22,499 | 9 (0.8%) | 54 (5.0%) |
| $22,500 to $24,999 | 9 (0.8%) | 40 (3.7%) |
| $25,000 to $29,999 | 26 (2.3%) | 79 (7.4%) |
| $30,000 to $34,999 | 9 (0.8%) | 41 (3.8%) |
| $35,000 to $39,999 | 34 (3.0%) | 38 (3.5%) |
| $40,000 to $44,999 | 66 (5.9%) | 66 (6.2%) |
| $45,000 to $49,999 | 35 (3.1%) | 174 (16.3%) |
| $50,000 to $54,999 | 64 (5.7%) | 49 (4.6%) |
| $55,000 to $64,999 | 207 (18.3%) | 39 (3.6%) |
| $65,000 to $74,999 | 119 (10.5%) | 80 (7.5%) |
| $75,000 to $99,999 | 136 (12.0%) | 76 (7.1%) |
| $100,000+ | 181 (16.0%) | 75 (7.0%) |
| Total | 1,129 (100.0%) | 1,071 (100.0%) |
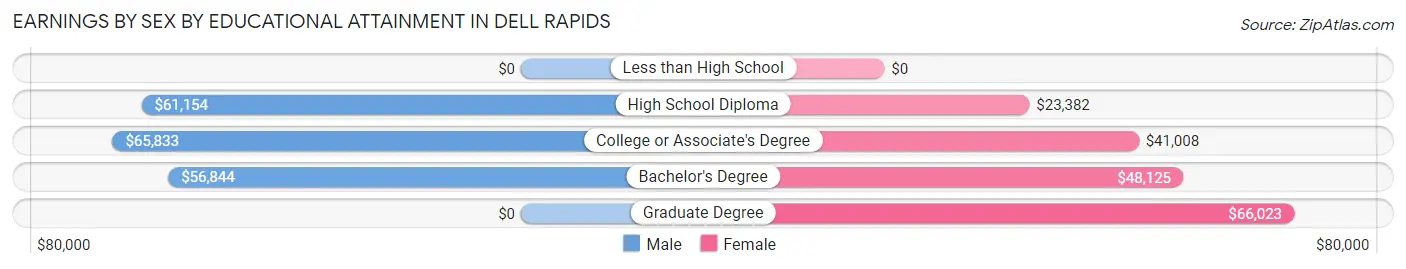
Earnings by Sex by Educational Attainment in Dell Rapids
Average earnings in Dell Rapids are $61,012 for men and $45,375 for women, a difference of 25.6%. Men with an educational attainment of college or associate's degree enjoy the highest average annual earnings of $65,833, while those with bachelor's degree education earn the least with $56,844. Women with an educational attainment of graduate degree earn the most with the average annual earnings of $66,023, while those with high school diploma education have the smallest earnings of $23,382.
| Educational Attainment | Male Income | Female Income |
| Less than High School | - | - |
| High School Diploma | $61,154 | $23,382 |
| College or Associate's Degree | $65,833 | $41,008 |
| Bachelor's Degree | $56,844 | $48,125 |
| Graduate Degree | - | - |
| Total | $61,012 | $45,375 |
Family Income in Dell Rapids
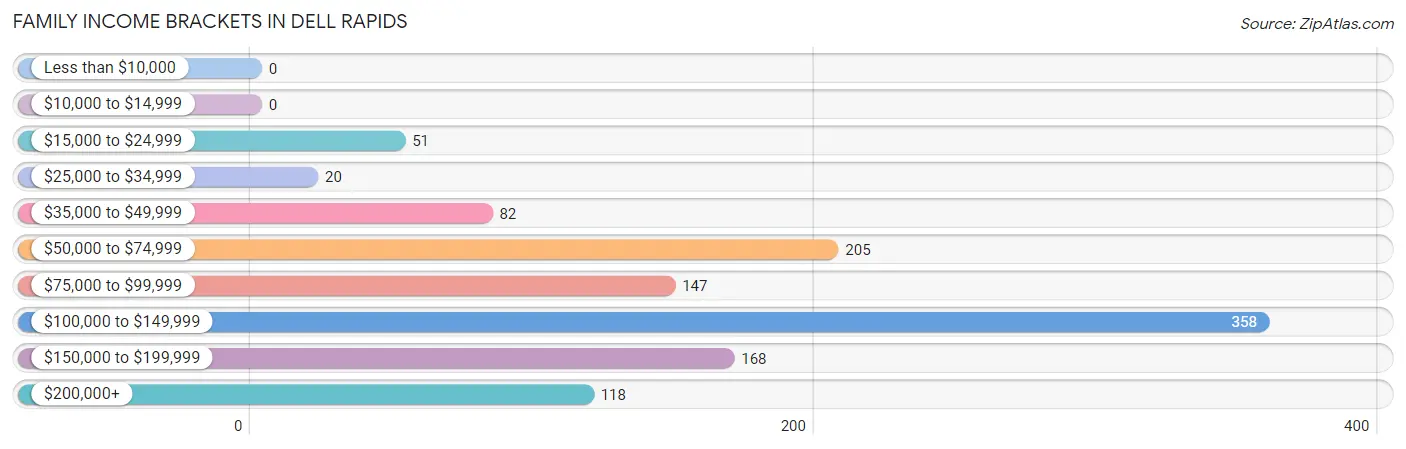
Family Income Brackets in Dell Rapids
According to the Dell Rapids family income data, there are 358 families falling into the $100,000 to $149,999 income range, which is the most common income bracket and makes up 31.2% of all families.
| Income Bracket | # Families | % Families |
| Less than $10,000 | 0 | 0.0% |
| $10,000 to $14,999 | 0 | 0.0% |
| $15,000 to $24,999 | 51 | 4.4% |
| $25,000 to $34,999 | 20 | 1.7% |
| $35,000 to $49,999 | 82 | 7.1% |
| $50,000 to $74,999 | 205 | 17.9% |
| $75,000 to $99,999 | 147 | 12.8% |
| $100,000 to $149,999 | 358 | 31.2% |
| $150,000 to $199,999 | 168 | 14.6% |
| $200,000+ | 118 | 10.3% |
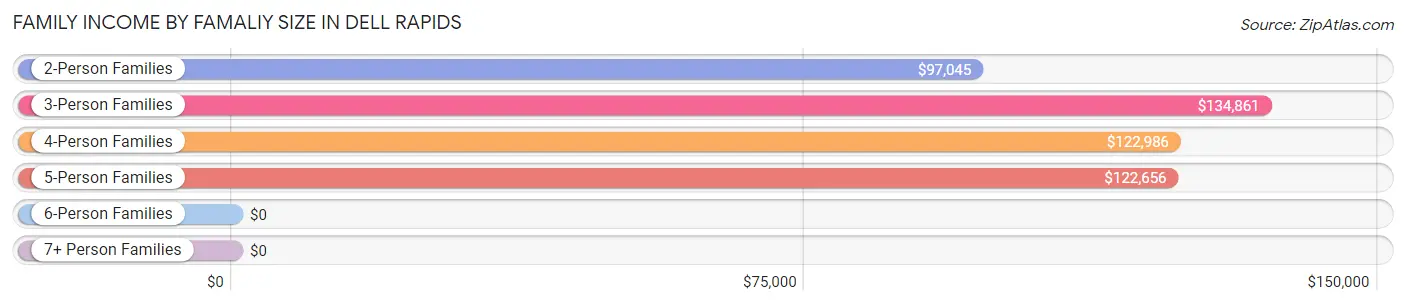
Family Income by Famaliy Size in Dell Rapids
3-person families (209 | 18.2%) account for the highest median family income in Dell Rapids with $134,861 per family, while 2-person families (612 | 53.3%) have the highest median income of $48,522 per family member.
| Income Bracket | # Families | Median Income |
| 2-Person Families | 612 (53.3%) | $97,045 |
| 3-Person Families | 209 (18.2%) | $134,861 |
| 4-Person Families | 137 (11.9%) | $122,986 |
| 5-Person Families | 153 (13.3%) | $122,656 |
| 6-Person Families | 23 (2.0%) | $0 |
| 7+ Person Families | 14 (1.2%) | $0 |
| Total | 1,148 (100.0%) | $112,845 |
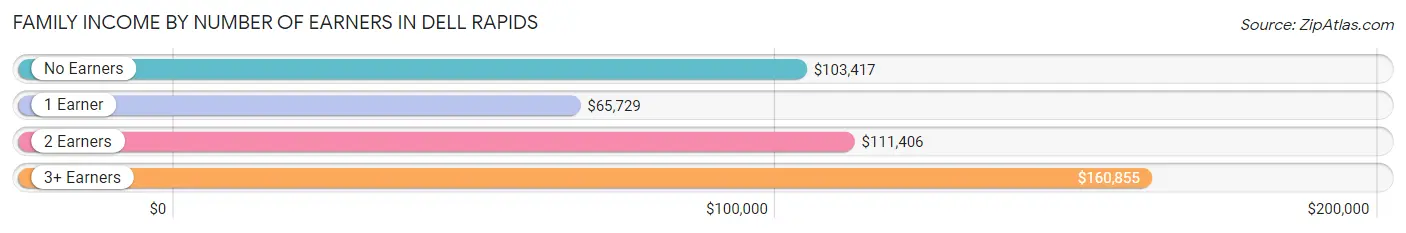
Family Income by Number of Earners in Dell Rapids
The median family income in Dell Rapids is $112,845, with families comprising 3+ earners (209) having the highest median family income of $160,855, while families with 1 earner (306) have the lowest median family income of $65,729, accounting for 18.2% and 26.7% of families, respectively.
| Number of Earners | # Families | Median Income |
| No Earners | 173 (15.1%) | $103,417 |
| 1 Earner | 306 (26.7%) | $65,729 |
| 2 Earners | 460 (40.1%) | $111,406 |
| 3+ Earners | 209 (18.2%) | $160,855 |
| Total | 1,148 (100.0%) | $112,845 |
Household Income in Dell Rapids
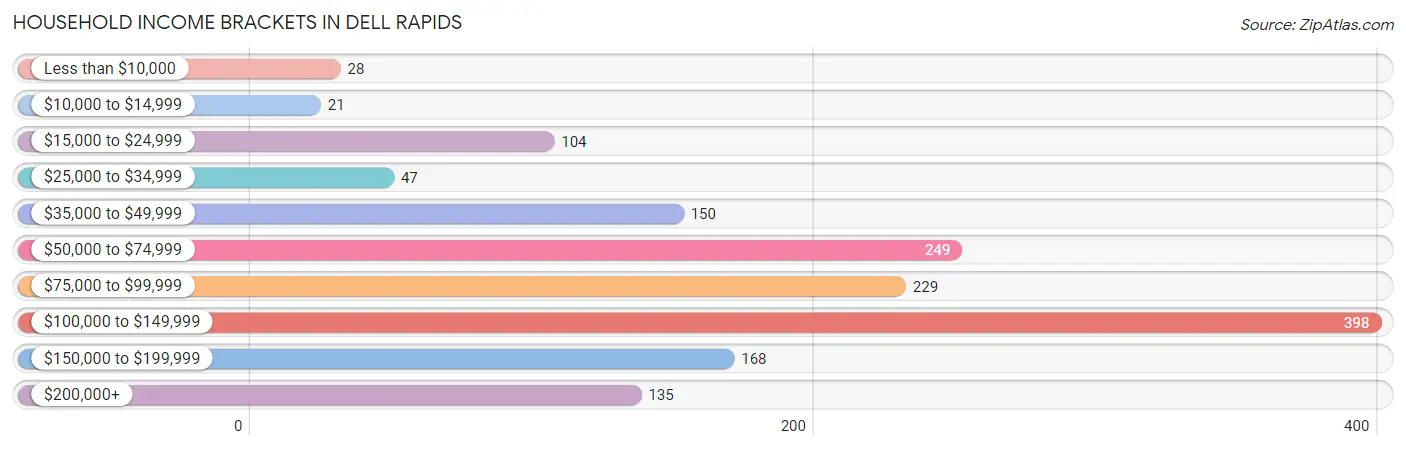
Household Income Brackets in Dell Rapids
With 398 households falling in the category, the $100,000 to $149,999 income range is the most frequent in Dell Rapids, accounting for 26.0% of all households. In contrast, only 21 households (1.4%) fall into the $10,000 to $14,999 income bracket, making it the least populous group.
| Income Bracket | # Households | % Households |
| Less than $10,000 | 28 | 1.8% |
| $10,000 to $14,999 | 21 | 1.4% |
| $15,000 to $24,999 | 104 | 6.8% |
| $25,000 to $34,999 | 47 | 3.1% |
| $35,000 to $49,999 | 150 | 9.8% |
| $50,000 to $74,999 | 249 | 16.3% |
| $75,000 to $99,999 | 229 | 15.0% |
| $100,000 to $149,999 | 398 | 26.0% |
| $150,000 to $199,999 | 168 | 11.0% |
| $200,000+ | 135 | 8.8% |
Household Income by Householder Age in Dell Rapids
The median household income in Dell Rapids is $88,958, with the highest median household income of $143,485 found in the 45 to 64 years age bracket for the primary householder. A total of 496 households (32.4%) fall into this category. Meanwhile, the 15 to 24 years age bracket for the primary householder has the lowest median household income of $0, with 7 households (0.5%) in this group.
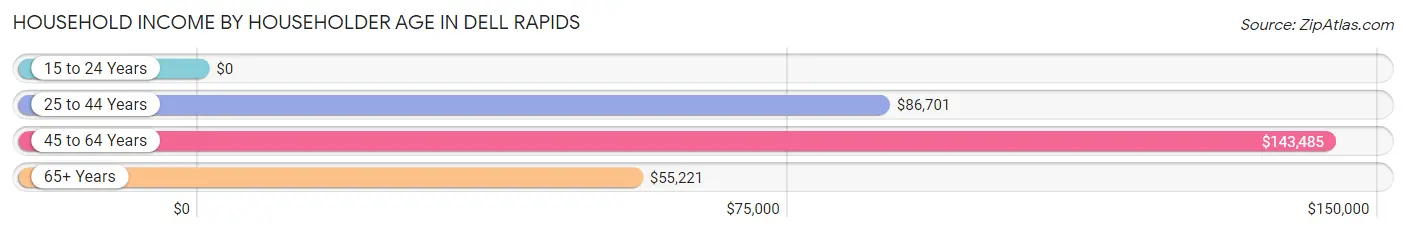
| Income Bracket | # Households | Median Income |
| 15 to 24 Years | 7 (0.5%) | $0 |
| 25 to 44 Years | 615 (40.2%) | $86,701 |
| 45 to 64 Years | 496 (32.4%) | $143,485 |
| 65+ Years | 411 (26.9%) | $55,221 |
| Total | 1,529 (100.0%) | $88,958 |
Poverty in Dell Rapids
Income Below Poverty by Sex and Age in Dell Rapids
With 5.7% poverty level for males and 8.5% for females among the residents of Dell Rapids, 6 to 11 year old males and under 5 year old females are the most vulnerable to poverty, with 43 males (22.3%) and 34 females (29.3%) in their respective age groups living below the poverty level.
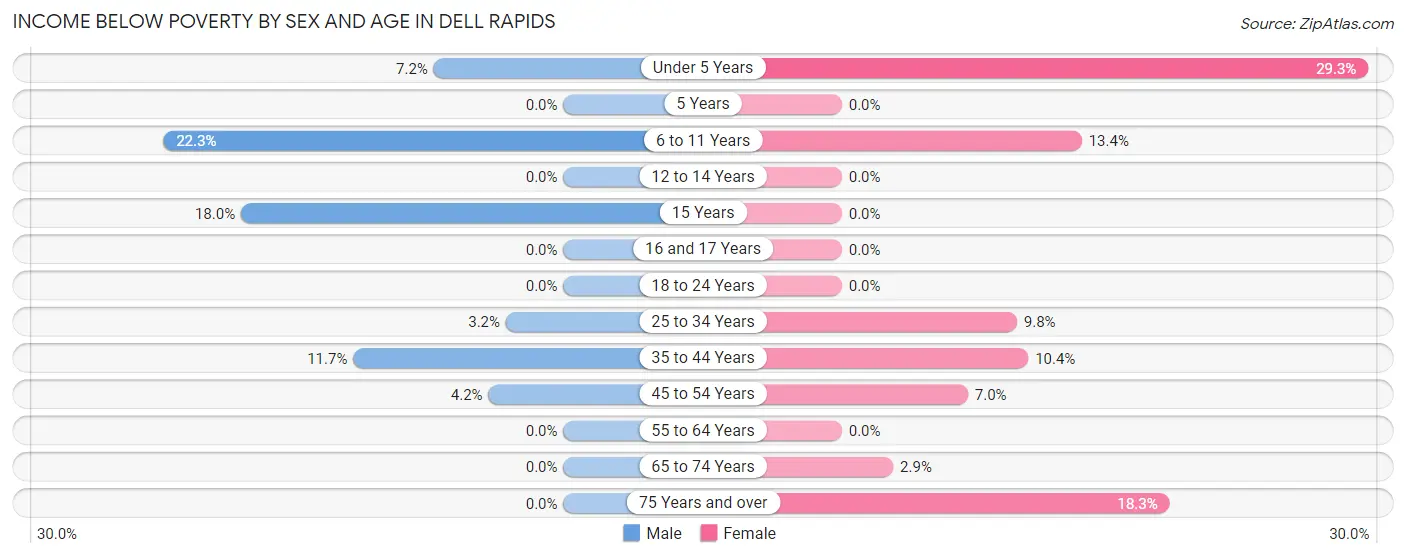
| Age Bracket | Male | Female |
| Under 5 Years | 7 (7.2%) | 34 (29.3%) |
| 5 Years | 0 (0.0%) | 0 (0.0%) |
| 6 to 11 Years | 43 (22.3%) | 29 (13.4%) |
| 12 to 14 Years | 0 (0.0%) | 0 (0.0%) |
| 15 Years | 7 (17.9%) | 0 (0.0%) |
| 16 and 17 Years | 0 (0.0%) | 0 (0.0%) |
| 18 to 24 Years | 0 (0.0%) | 0 (0.0%) |
| 25 to 34 Years | 9 (3.2%) | 31 (9.8%) |
| 35 to 44 Years | 31 (11.7%) | 30 (10.4%) |
| 45 to 54 Years | 8 (4.2%) | 17 (7.0%) |
| 55 to 64 Years | 0 (0.0%) | 0 (0.0%) |
| 65 to 74 Years | 0 (0.0%) | 7 (2.9%) |
| 75 Years and over | 0 (0.0%) | 23 (18.2%) |
| Total | 105 (5.7%) | 171 (8.5%) |
Income Above Poverty by Sex and Age in Dell Rapids
According to the poverty statistics in Dell Rapids, males aged 5 years and females aged 5 years are the age groups that are most secure financially, with 100.0% of males and 100.0% of females in these age groups living above the poverty line.
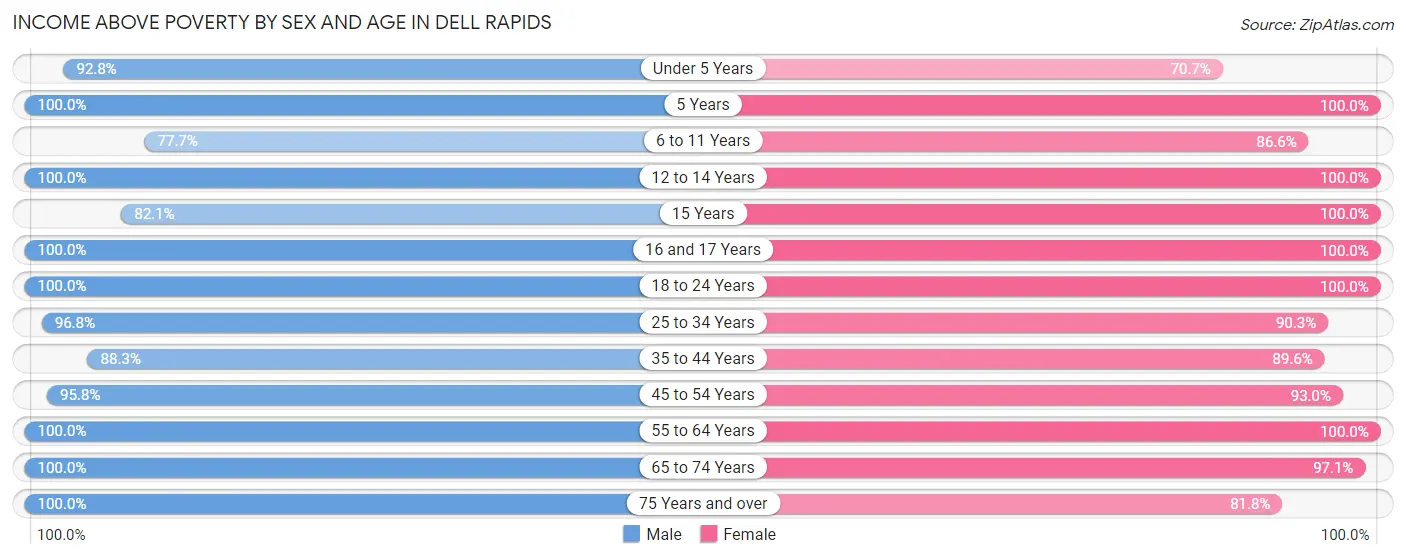
| Age Bracket | Male | Female |
| Under 5 Years | 90 (92.8%) | 82 (70.7%) |
| 5 Years | 22 (100.0%) | 33 (100.0%) |
| 6 to 11 Years | 150 (77.7%) | 188 (86.6%) |
| 12 to 14 Years | 59 (100.0%) | 117 (100.0%) |
| 15 Years | 32 (82.1%) | 10 (100.0%) |
| 16 and 17 Years | 50 (100.0%) | 48 (100.0%) |
| 18 to 24 Years | 58 (100.0%) | 79 (100.0%) |
| 25 to 34 Years | 272 (96.8%) | 287 (90.2%) |
| 35 to 44 Years | 234 (88.3%) | 259 (89.6%) |
| 45 to 54 Years | 184 (95.8%) | 225 (93.0%) |
| 55 to 64 Years | 304 (100.0%) | 182 (100.0%) |
| 65 to 74 Years | 193 (100.0%) | 238 (97.1%) |
| 75 Years and over | 96 (100.0%) | 103 (81.8%) |
| Total | 1,744 (94.3%) | 1,851 (91.5%) |
Income Below Poverty Among Married-Couple Families in Dell Rapids
The poverty statistics for married-couple families in Dell Rapids show that 2.6% or 26 of the total 993 families live below the poverty line. Families with 5 or more children have the highest poverty rate of 100.0%, comprising of 14 families. On the other hand, families with no children have the lowest poverty rate of 0.0%, which includes 0 families.
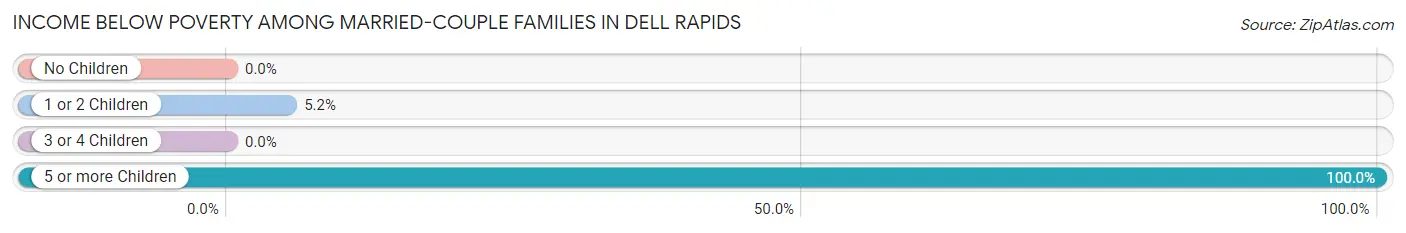
| Children | Above Poverty | Below Poverty |
| No Children | 601 (100.0%) | 0 (0.0%) |
| 1 or 2 Children | 221 (94.9%) | 12 (5.1%) |
| 3 or 4 Children | 145 (100.0%) | 0 (0.0%) |
| 5 or more Children | 0 (0.0%) | 14 (100.0%) |
| Total | 967 (97.4%) | 26 (2.6%) |
Income Below Poverty Among Single-Parent Households in Dell Rapids
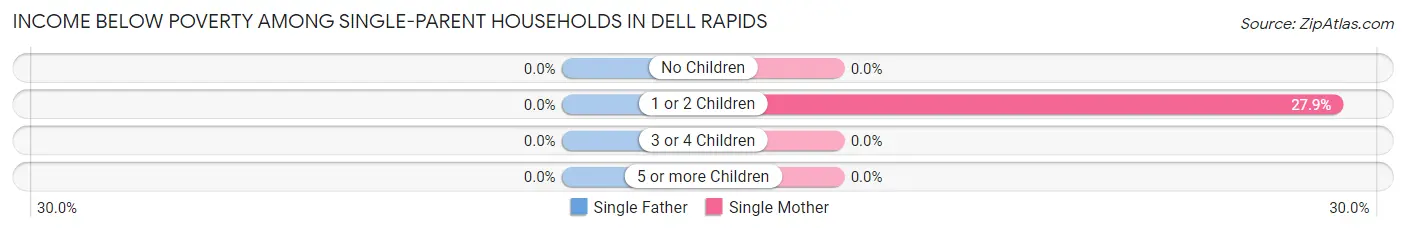
| Children | Single Father | Single Mother |
| No Children | 0 (0.0%) | 0 (0.0%) |
| 1 or 2 Children | 0 (0.0%) | 24 (27.9%) |
| 3 or 4 Children | 0 (0.0%) | 0 (0.0%) |
| 5 or more Children | 0 (0.0%) | 0 (0.0%) |
| Total | 0 (0.0%) | 24 (19.2%) |
Income Below Poverty Among Married-Couple vs Single-Parent Households in Dell Rapids
The poverty data for Dell Rapids shows that 26 of the married-couple family households (2.6%) and 24 of the single-parent households (15.5%) are living below the poverty level. Within the married-couple family households, those with 5 or more children have the highest poverty rate, with 14 households (100.0%) falling below the poverty line. Among the single-parent households, those with 1 or 2 children have the highest poverty rate, with 24 household (22.6%) living below poverty.
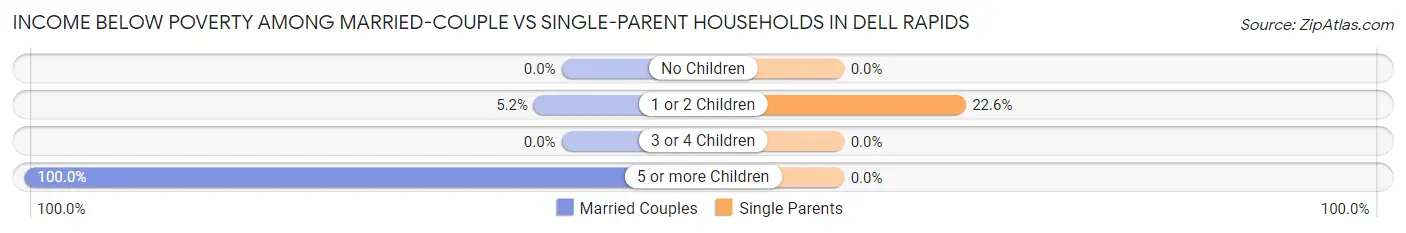
| Children | Married-Couple Families | Single-Parent Households |
| No Children | 0 (0.0%) | 0 (0.0%) |
| 1 or 2 Children | 12 (5.1%) | 24 (22.6%) |
| 3 or 4 Children | 0 (0.0%) | 0 (0.0%) |
| 5 or more Children | 14 (100.0%) | 0 (0.0%) |
| Total | 26 (2.6%) | 24 (15.5%) |
Race in Dell Rapids
The most populous races in Dell Rapids are White / Caucasian (3,784 | 95.7%), Hispanic or Latino (151 | 3.8%), and Two or more Races (112 | 2.8%).
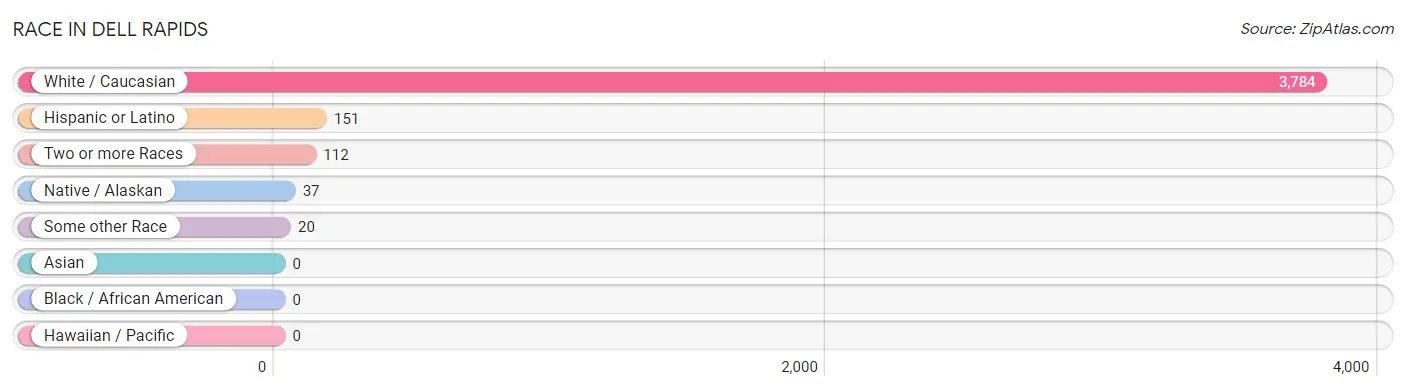
| Race | # Population | % Population |
| Asian | 0 | 0.0% |
| Black / African American | 0 | 0.0% |
| Hawaiian / Pacific | 0 | 0.0% |
| Hispanic or Latino | 151 | 3.8% |
| Native / Alaskan | 37 | 0.9% |
| White / Caucasian | 3,784 | 95.7% |
| Two or more Races | 112 | 2.8% |
| Some other Race | 20 | 0.5% |
| Total | 3,953 | 100.0% |
Ancestry in Dell Rapids
The most populous ancestries reported in Dell Rapids are German (1,378 | 34.9%), Norwegian (817 | 20.7%), Irish (426 | 10.8%), English (399 | 10.1%), and Dutch (295 | 7.5%), together accounting for 83.9% of all Dell Rapids residents.
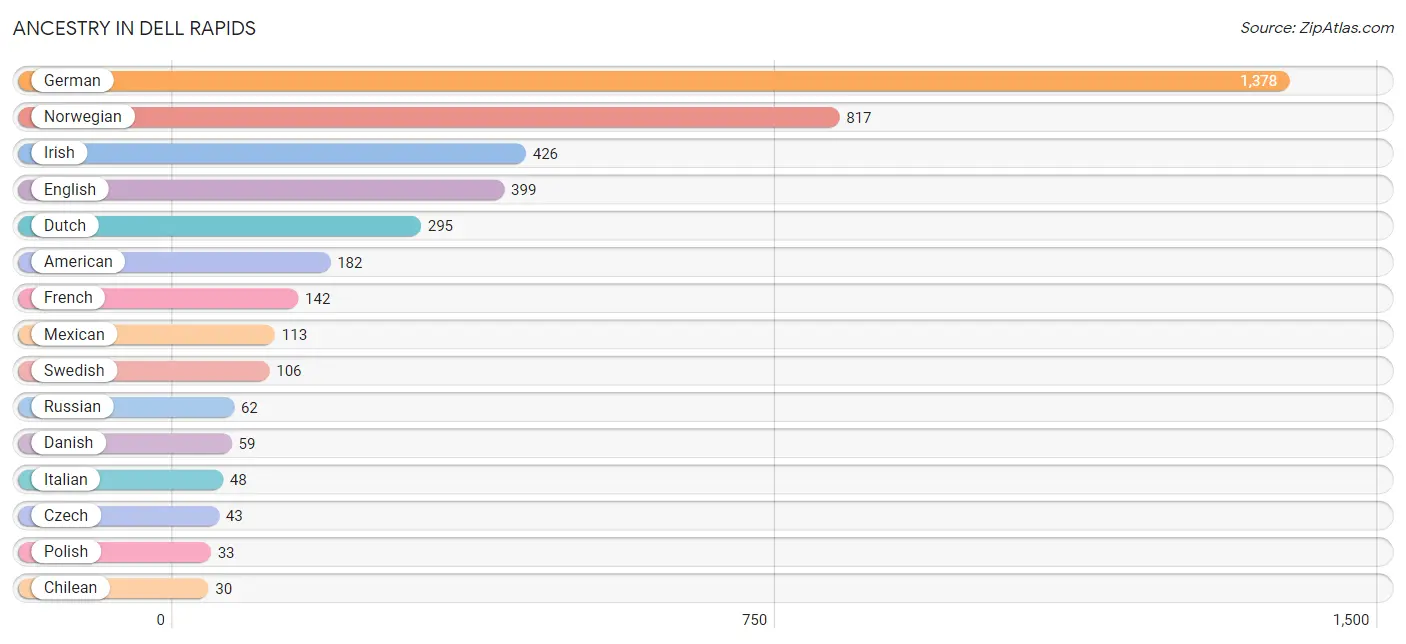
| Ancestry | # Population | % Population |
| African | 9 | 0.2% |
| American | 182 | 4.6% |
| British | 19 | 0.5% |
| Chilean | 30 | 0.8% |
| Choctaw | 26 | 0.7% |
| Czech | 43 | 1.1% |
| Danish | 59 | 1.5% |
| Dutch | 295 | 7.5% |
| English | 399 | 10.1% |
| European | 7 | 0.2% |
| French | 142 | 3.6% |
| German | 1,378 | 34.9% |
| Greek | 9 | 0.2% |
| Irish | 426 | 10.8% |
| Italian | 48 | 1.2% |
| Luxembourger | 15 | 0.4% |
| Mexican | 113 | 2.9% |
| Norwegian | 817 | 20.7% |
| Polish | 33 | 0.8% |
| Russian | 62 | 1.6% |
| Scandinavian | 16 | 0.4% |
| Scotch-Irish | 20 | 0.5% |
| Sioux | 11 | 0.3% |
| South American | 30 | 0.8% |
| Subsaharan African | 9 | 0.2% |
| Swedish | 106 | 2.7% |
| Swiss | 9 | 0.2% |
| Welsh | 16 | 0.4% | View All 28 Rows |
Immigrants in Dell Rapids
The most numerous immigrant groups reported in Dell Rapids came from Chile (20 | 0.5%), Latin America (20 | 0.5%), South America (20 | 0.5%), and Oceania (9 | 0.2%), together accounting for 1.8% of all Dell Rapids residents.
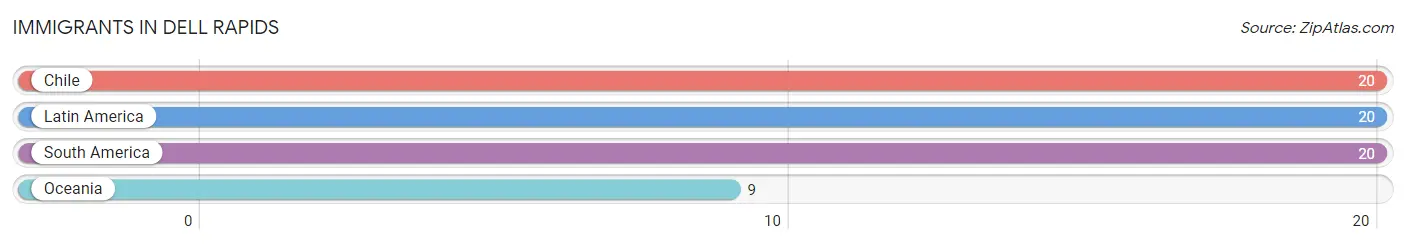
| Immigration Origin | # Population | % Population |
| Chile | 20 | 0.5% |
| Latin America | 20 | 0.5% |
| Oceania | 9 | 0.2% |
| South America | 20 | 0.5% | View All 4 Rows |
Sex and Age in Dell Rapids
Sex and Age in Dell Rapids
The most populous age groups in Dell Rapids are 55 to 59 Years (232 | 12.3%) for men and 10 to 14 Years (219 | 10.6%) for women.
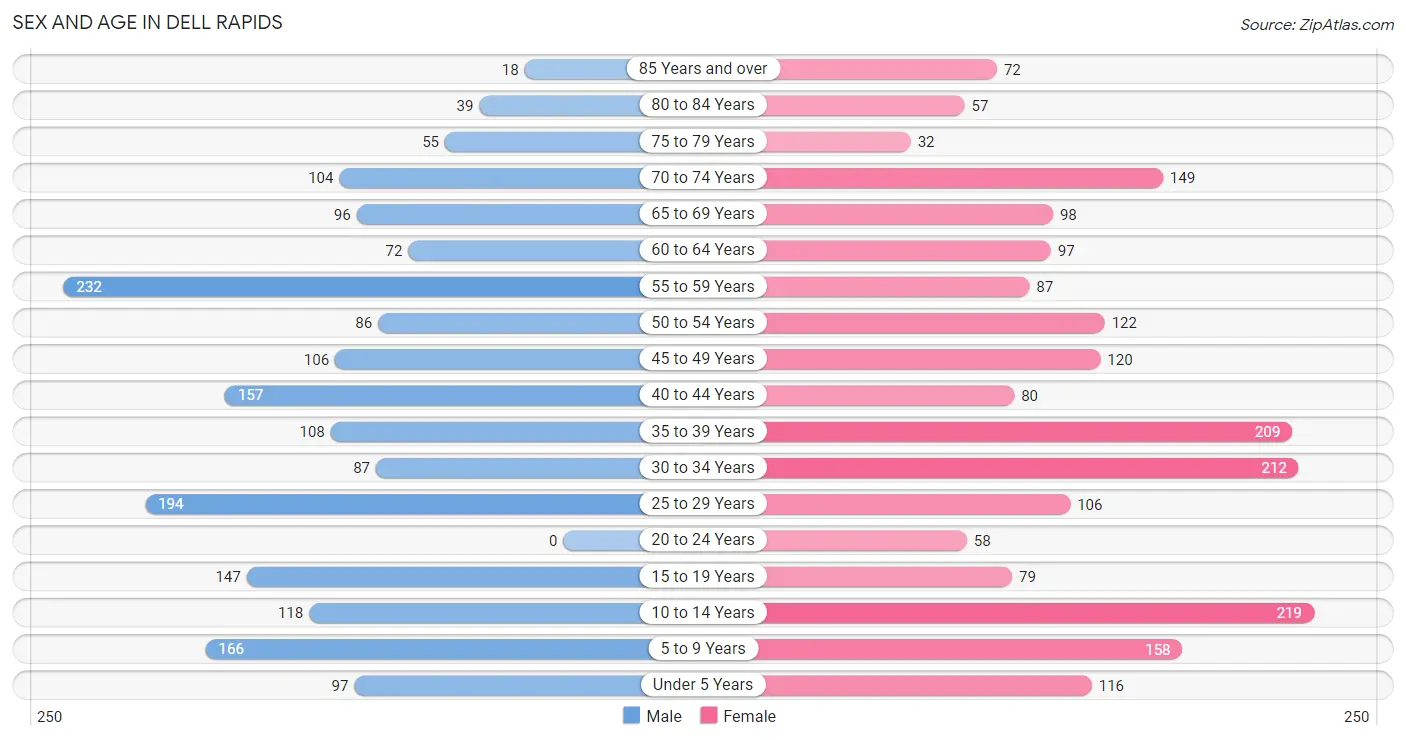
| Age Bracket | Male | Female |
| Under 5 Years | 97 (5.1%) | 116 (5.6%) |
| 5 to 9 Years | 166 (8.8%) | 158 (7.6%) |
| 10 to 14 Years | 118 (6.3%) | 219 (10.6%) |
| 15 to 19 Years | 147 (7.8%) | 79 (3.8%) |
| 20 to 24 Years | 0 (0.0%) | 58 (2.8%) |
| 25 to 29 Years | 194 (10.3%) | 106 (5.1%) |
| 30 to 34 Years | 87 (4.6%) | 212 (10.2%) |
| 35 to 39 Years | 108 (5.7%) | 209 (10.1%) |
| 40 to 44 Years | 157 (8.3%) | 80 (3.9%) |
| 45 to 49 Years | 106 (5.6%) | 120 (5.8%) |
| 50 to 54 Years | 86 (4.6%) | 122 (5.9%) |
| 55 to 59 Years | 232 (12.3%) | 87 (4.2%) |
| 60 to 64 Years | 72 (3.8%) | 97 (4.7%) |
| 65 to 69 Years | 96 (5.1%) | 98 (4.7%) |
| 70 to 74 Years | 104 (5.5%) | 149 (7.2%) |
| 75 to 79 Years | 55 (2.9%) | 32 (1.5%) |
| 80 to 84 Years | 39 (2.1%) | 57 (2.8%) |
| 85 Years and over | 18 (1.0%) | 72 (3.5%) |
| Total | 1,882 (100.0%) | 2,071 (100.0%) |
Families and Households in Dell Rapids
Median Family Size in Dell Rapids
The median family size in Dell Rapids is 2.95 persons per family, with married-couple families (993 | 86.5%) accounting for the largest median family size of 3.07 persons per family. On the other hand, single female/mother families (125 | 10.9%) represent the smallest median family size with 2.14 persons per family.
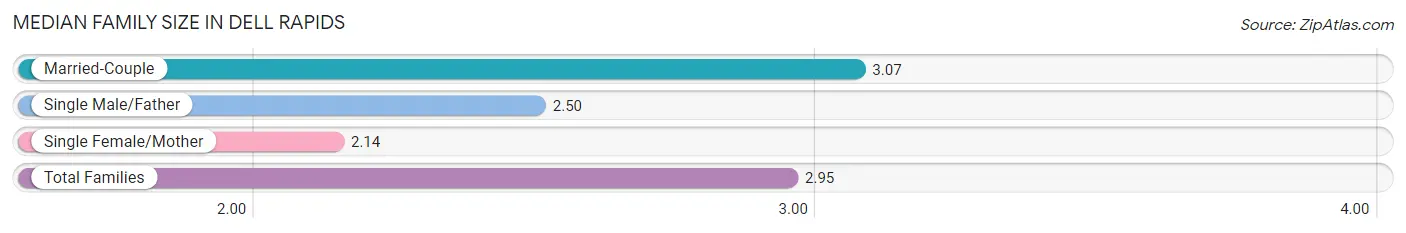
| Family Type | # Families | Family Size |
| Married-Couple | 993 (86.5%) | 3.07 |
| Single Male/Father | 30 (2.6%) | 2.50 |
| Single Female/Mother | 125 (10.9%) | 2.14 |
| Total Families | 1,148 (100.0%) | 2.95 |
Median Household Size in Dell Rapids
The median household size in Dell Rapids is 2.54 persons per household, with single male/father households (30 | 2.0%) accounting for the largest median household size of 3.9 persons per household. non-family households (381 | 24.9%) represent the smallest median household size with 1.20 persons per household.
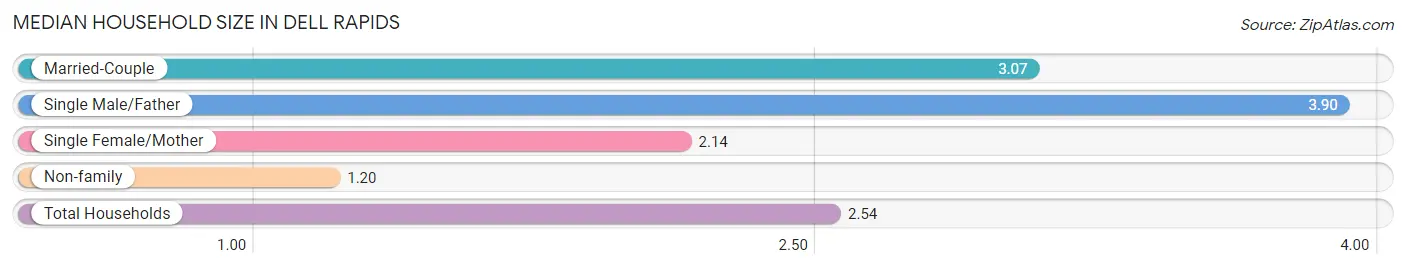
| Household Type | # Households | Household Size |
| Married-Couple | 993 (64.9%) | 3.07 |
| Single Male/Father | 30 (2.0%) | 3.90 |
| Single Female/Mother | 125 (8.2%) | 2.14 |
| Non-family | 381 (24.9%) | 1.20 |
| Total Households | 1,529 (100.0%) | 2.54 |
Household Size by Marriage Status in Dell Rapids
Out of a total of 1,529 households in Dell Rapids, 1,148 (75.1%) are family households, while 381 (24.9%) are nonfamily households. The most numerous type of family households are 2-person households, comprising 592, and the most common type of nonfamily households are 1-person households, comprising 323.
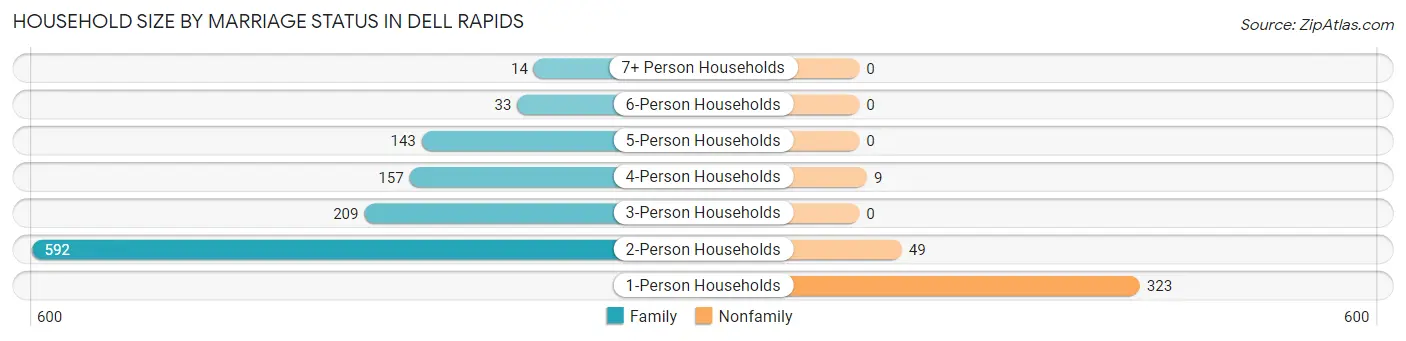
| Household Size | Family Households | Nonfamily Households |
| 1-Person Households | - | 323 (21.1%) |
| 2-Person Households | 592 (38.7%) | 49 (3.2%) |
| 3-Person Households | 209 (13.7%) | 0 (0.0%) |
| 4-Person Households | 157 (10.3%) | 9 (0.6%) |
| 5-Person Households | 143 (9.3%) | 0 (0.0%) |
| 6-Person Households | 33 (2.2%) | 0 (0.0%) |
| 7+ Person Households | 14 (0.9%) | 0 (0.0%) |
| Total | 1,148 (75.1%) | 381 (24.9%) |
Female Fertility in Dell Rapids
Fertility by Age in Dell Rapids
Average fertility rate in Dell Rapids is 47.0 births per 1,000 women. Women in the age bracket of 20 to 34 years have the highest fertility rate with 93.0 births per 1,000 women. Women in the age bracket of 20 to 34 years acount for 85.4% of all women with births.
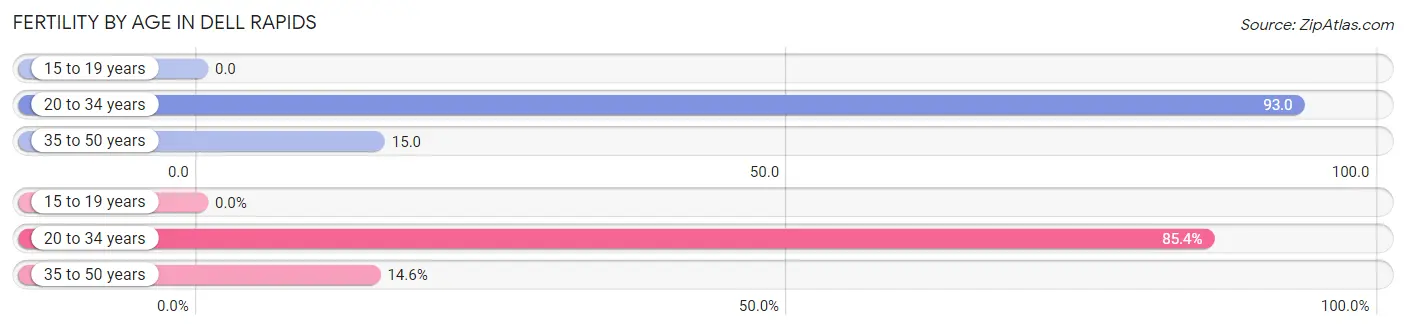
| Age Bracket | Women with Births | Births / 1,000 Women |
| 15 to 19 years | 0 (0.0%) | 0.0 |
| 20 to 34 years | 35 (85.4%) | 93.0 |
| 35 to 50 years | 6 (14.6%) | 15.0 |
| Total | 41 (100.0%) | 47.0 |
Fertility by Age by Marriage Status in Dell Rapids
78.0% of women with births (41) in Dell Rapids are married. The highest percentage of unmarried women with births falls into 20 to 34 years age bracket with 25.7% of them unmarried at the time of birth, while the lowest percentage of unmarried women with births belong to 35 to 50 years age bracket with 0.0% of them unmarried.
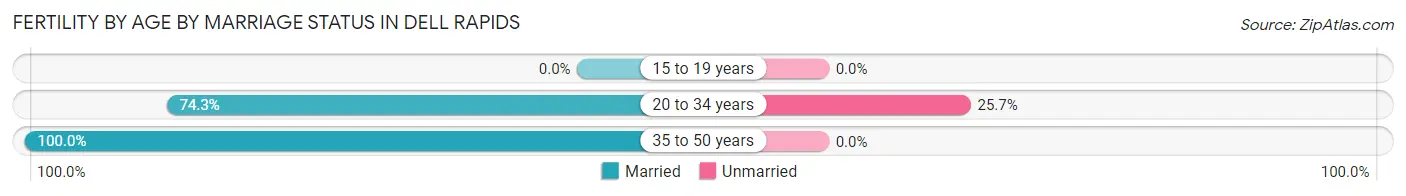
| Age Bracket | Married | Unmarried |
| 15 to 19 years | 0 (0.0%) | 0 (0.0%) |
| 20 to 34 years | 26 (74.3%) | 9 (25.7%) |
| 35 to 50 years | 6 (100.0%) | 0 (0.0%) |
| Total | 32 (78.0%) | 9 (22.0%) |
Fertility by Education in Dell Rapids
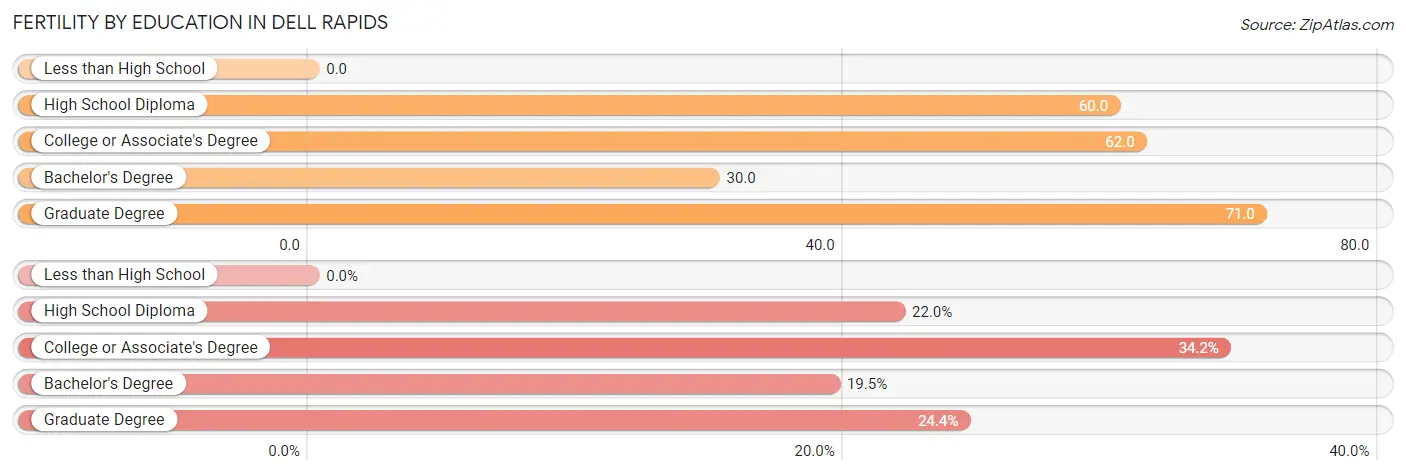
| Educational Attainment | Women with Births | Births / 1,000 Women |
| Less than High School | 0 (0.0%) | 0.0 |
| High School Diploma | 9 (22.0%) | 60.0 |
| College or Associate's Degree | 14 (34.2%) | 62.0 |
| Bachelor's Degree | 8 (19.5%) | 30.0 |
| Graduate Degree | 10 (24.4%) | 71.0 |
| Total | 41 (100.0%) | 47.0 |
Fertility by Education by Marriage Status in Dell Rapids
22.0% of women with births in Dell Rapids are unmarried. Women with the educational attainment of college or associate's degree are most likely to be married with 100.0% of them married at childbirth, while women with the educational attainment of high school diploma are least likely to be married with 100.0% of them unmarried at childbirth.
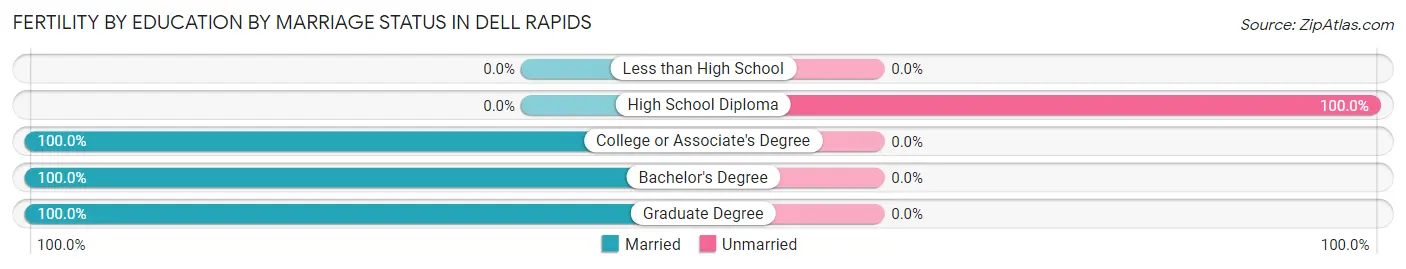
| Educational Attainment | Married | Unmarried |
| Less than High School | 0 (0.0%) | 0 (0.0%) |
| High School Diploma | 0 (0.0%) | 9 (100.0%) |
| College or Associate's Degree | 14 (100.0%) | 0 (0.0%) |
| Bachelor's Degree | 8 (100.0%) | 0 (0.0%) |
| Graduate Degree | 10 (100.0%) | 0 (0.0%) |
| Total | 32 (78.0%) | 9 (22.0%) |
Employment Characteristics in Dell Rapids
Employment by Class of Employer in Dell Rapids
Among the 2,028 employed individuals in Dell Rapids, private company employees (1,107 | 54.6%), not-for-profit organizations (328 | 16.2%), and self-employed (not incorporated) (187 | 9.2%) make up the most common classes of employment.
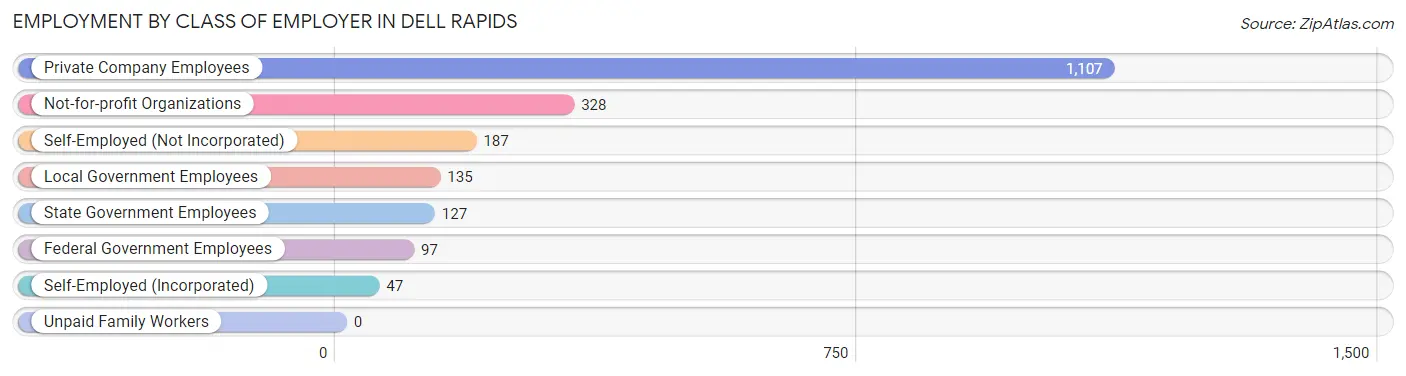
| Employer Class | # Employees | % Employees |
| Private Company Employees | 1,107 | 54.6% |
| Self-Employed (Incorporated) | 47 | 2.3% |
| Self-Employed (Not Incorporated) | 187 | 9.2% |
| Not-for-profit Organizations | 328 | 16.2% |
| Local Government Employees | 135 | 6.7% |
| State Government Employees | 127 | 6.3% |
| Federal Government Employees | 97 | 4.8% |
| Unpaid Family Workers | 0 | 0.0% |
| Total | 2,028 | 100.0% |
Employment Status by Age in Dell Rapids
According to the labor force statistics for Dell Rapids, out of the total population over 16 years of age (3,030), 67.8% or 2,054 individuals are in the labor force, with 1.3% or 27 of them unemployed. The age group with the highest labor force participation rate is 25 to 29 years, with 100.0% or 300 individuals in the labor force. Within the labor force, the 45 to 54 years age range has the highest percentage of unemployed individuals, with 4.1% or 17 of them being unemployed.
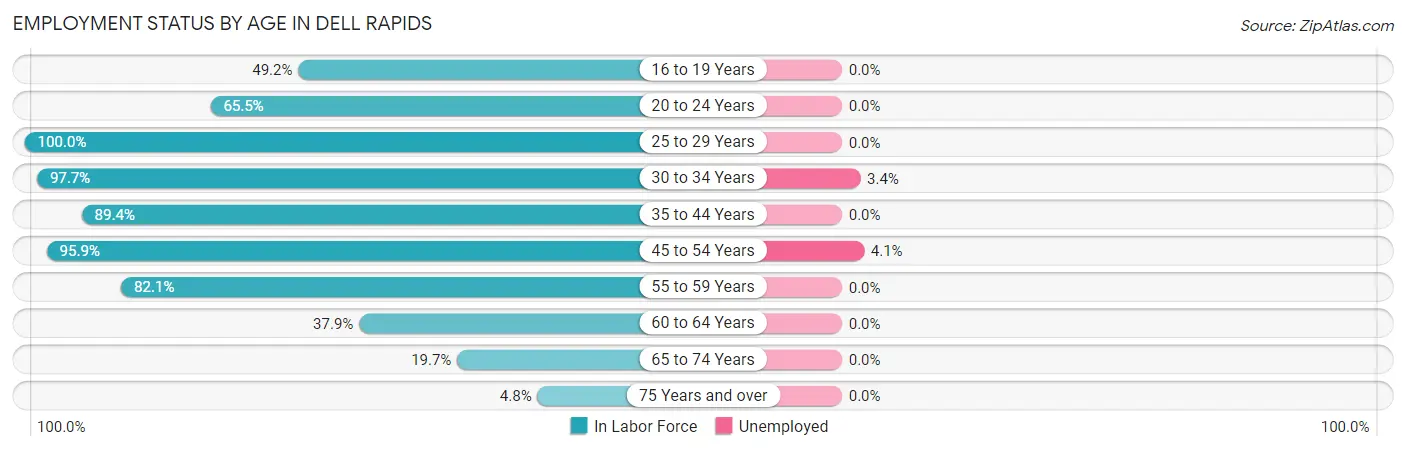
| Age Bracket | In Labor Force | Unemployed |
| 16 to 19 Years | 87 (49.2%) | 0 (0.0%) |
| 20 to 24 Years | 38 (65.5%) | 0 (0.0%) |
| 25 to 29 Years | 300 (100.0%) | 0 (0.0%) |
| 30 to 34 Years | 292 (97.7%) | 10 (3.4%) |
| 35 to 44 Years | 495 (89.4%) | 0 (0.0%) |
| 45 to 54 Years | 416 (95.9%) | 17 (4.1%) |
| 55 to 59 Years | 262 (82.1%) | 0 (0.0%) |
| 60 to 64 Years | 64 (37.9%) | 0 (0.0%) |
| 65 to 74 Years | 88 (19.7%) | 0 (0.0%) |
| 75 Years and over | 13 (4.8%) | 0 (0.0%) |
| Total | 2,054 (67.8%) | 27 (1.3%) |
Employment Status by Educational Attainment in Dell Rapids
According to labor force statistics for Dell Rapids, 88.1% of individuals (1,828) out of the total population between 25 and 64 years of age (2,075) are in the labor force, with 1.5% or 27 of them being unemployed. The group with the highest labor force participation rate are those with the educational attainment of less than high school, with 100.0% or 57 individuals in the labor force. Within the labor force, individuals with high school diploma education have the highest percentage of unemployment, with 4.5% or 17 of them being unemployed.
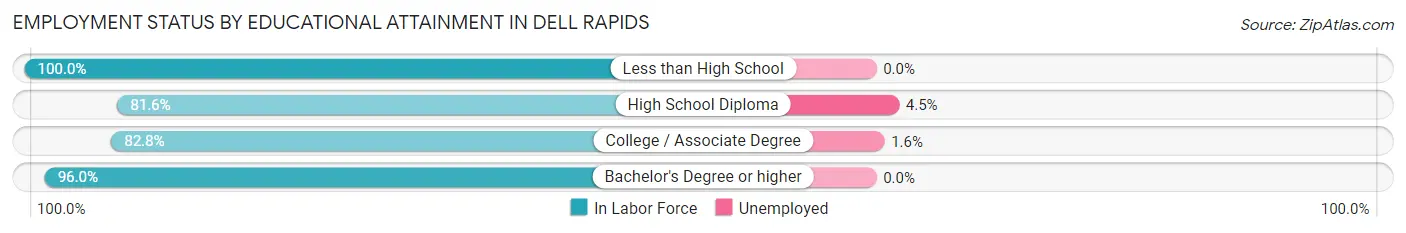
| Educational Attainment | In Labor Force | Unemployed |
| Less than High School | 57 (100.0%) | 0 (0.0%) |
| High School Diploma | 376 (81.6%) | 21 (4.5%) |
| College / Associate Degree | 622 (82.8%) | 12 (1.6%) |
| Bachelor's Degree or higher | 774 (96.0%) | 0 (0.0%) |
| Total | 1,828 (88.1%) | 31 (1.5%) |
Employment Occupations by Sex in Dell Rapids
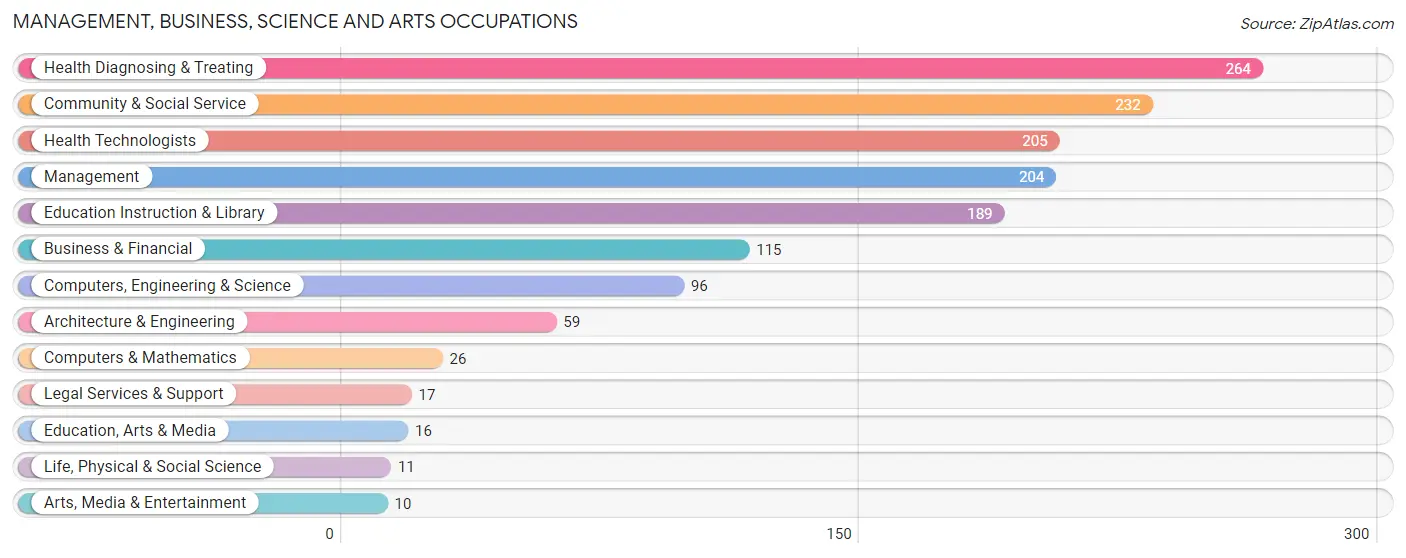
Management, Business, Science and Arts Occupations
The most common Management, Business, Science and Arts occupations in Dell Rapids are Health Diagnosing & Treating (264 | 13.0%), Community & Social Service (232 | 11.4%), Health Technologists (205 | 10.1%), Management (204 | 10.1%), and Education Instruction & Library (189 | 9.3%).
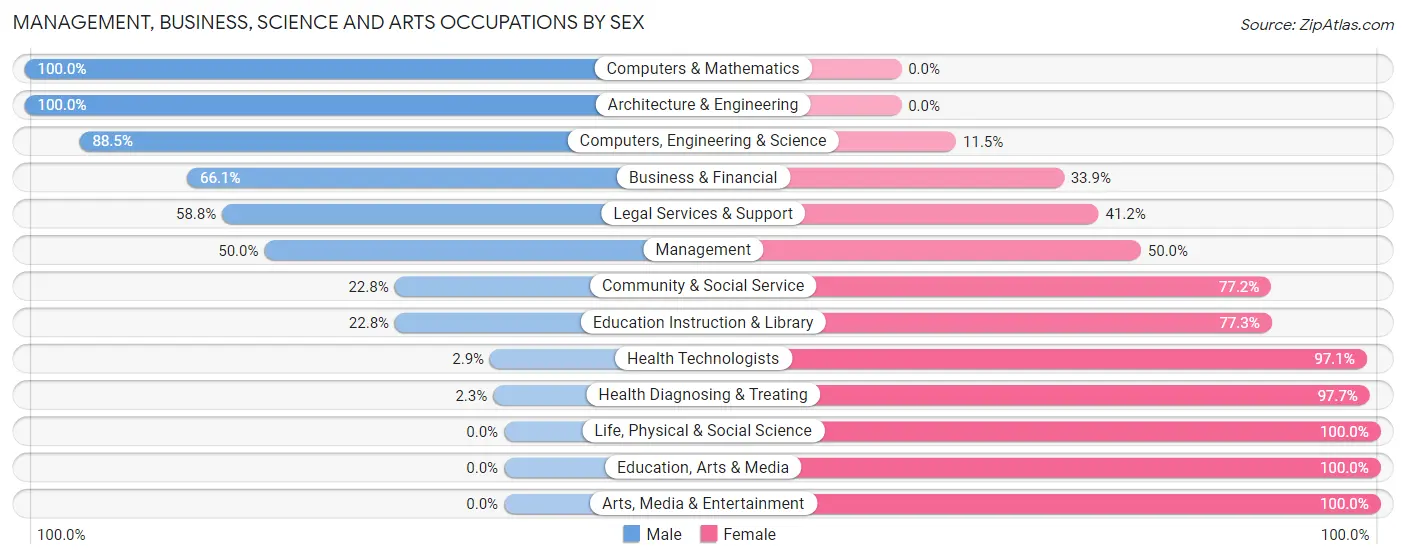
Management, Business, Science and Arts Occupations by Sex
Within the Management, Business, Science and Arts occupations in Dell Rapids, the most male-oriented occupations are Computers & Mathematics (100.0%), Architecture & Engineering (100.0%), and Computers, Engineering & Science (88.5%), while the most female-oriented occupations are Life, Physical & Social Science (100.0%), Education, Arts & Media (100.0%), and Arts, Media & Entertainment (100.0%).
| Occupation | Male | Female |
| Management | 102 (50.0%) | 102 (50.0%) |
| Business & Financial | 76 (66.1%) | 39 (33.9%) |
| Computers, Engineering & Science | 85 (88.5%) | 11 (11.5%) |
| Computers & Mathematics | 26 (100.0%) | 0 (0.0%) |
| Architecture & Engineering | 59 (100.0%) | 0 (0.0%) |
| Life, Physical & Social Science | 0 (0.0%) | 11 (100.0%) |
| Community & Social Service | 53 (22.8%) | 179 (77.2%) |
| Education, Arts & Media | 0 (0.0%) | 16 (100.0%) |
| Legal Services & Support | 10 (58.8%) | 7 (41.2%) |
| Education Instruction & Library | 43 (22.8%) | 146 (77.2%) |
| Arts, Media & Entertainment | 0 (0.0%) | 10 (100.0%) |
| Health Diagnosing & Treating | 6 (2.3%) | 258 (97.7%) |
| Health Technologists | 6 (2.9%) | 199 (97.1%) |
| Total (Category) | 322 (35.3%) | 589 (64.6%) |
| Total (Overall) | 999 (49.3%) | 1,029 (50.7%) |
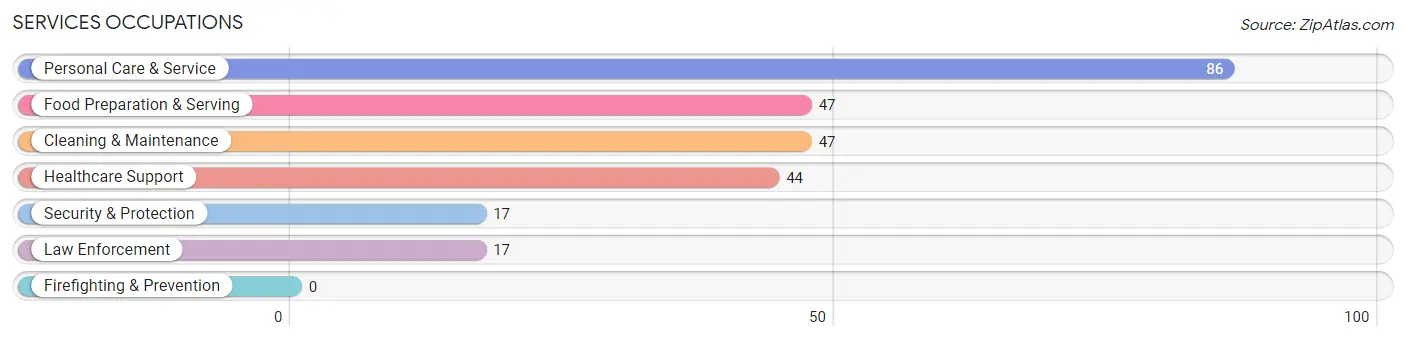
Services Occupations
The most common Services occupations in Dell Rapids are Personal Care & Service (86 | 4.2%), Food Preparation & Serving (47 | 2.3%), Cleaning & Maintenance (47 | 2.3%), Healthcare Support (44 | 2.2%), and Security & Protection (17 | 0.8%).
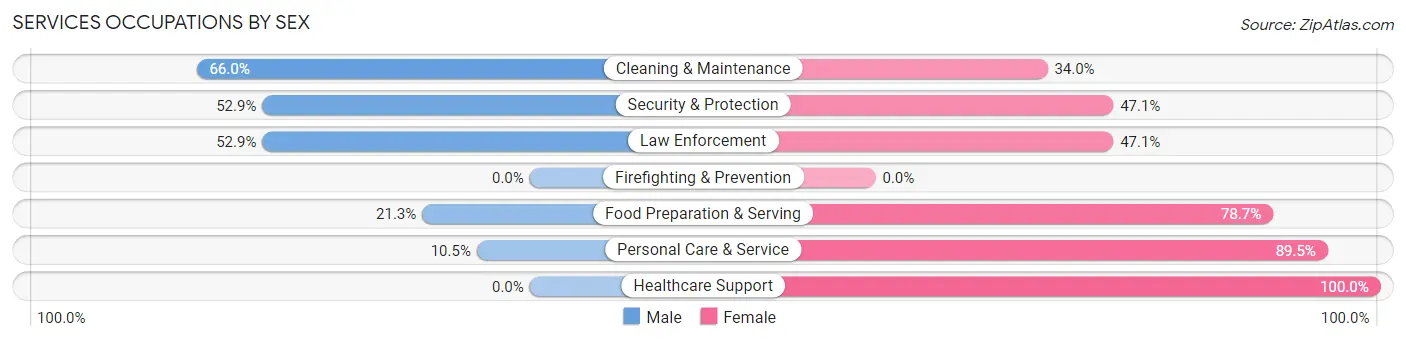
Services Occupations by Sex
Within the Services occupations in Dell Rapids, the most male-oriented occupations are Cleaning & Maintenance (66.0%), Security & Protection (52.9%), and Law Enforcement (52.9%), while the most female-oriented occupations are Healthcare Support (100.0%), Personal Care & Service (89.5%), and Food Preparation & Serving (78.7%).
| Occupation | Male | Female |
| Healthcare Support | 0 (0.0%) | 44 (100.0%) |
| Security & Protection | 9 (52.9%) | 8 (47.1%) |
| Firefighting & Prevention | 0 (0.0%) | 0 (0.0%) |
| Law Enforcement | 9 (52.9%) | 8 (47.1%) |
| Food Preparation & Serving | 10 (21.3%) | 37 (78.7%) |
| Cleaning & Maintenance | 31 (66.0%) | 16 (34.0%) |
| Personal Care & Service | 9 (10.5%) | 77 (89.5%) |
| Total (Category) | 59 (24.5%) | 182 (75.5%) |
| Total (Overall) | 999 (49.3%) | 1,029 (50.7%) |
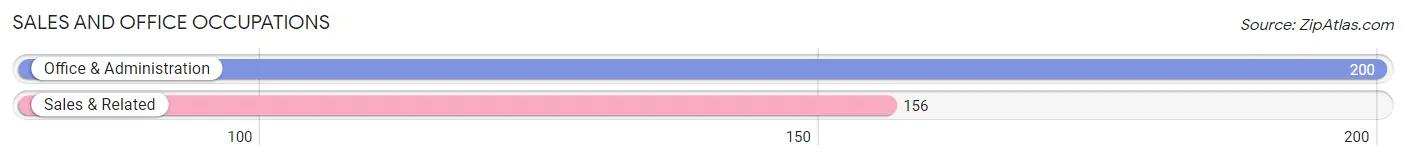
Sales and Office Occupations
The most common Sales and Office occupations in Dell Rapids are Office & Administration (200 | 9.9%), and Sales & Related (156 | 7.7%).
Sales and Office Occupations by Sex
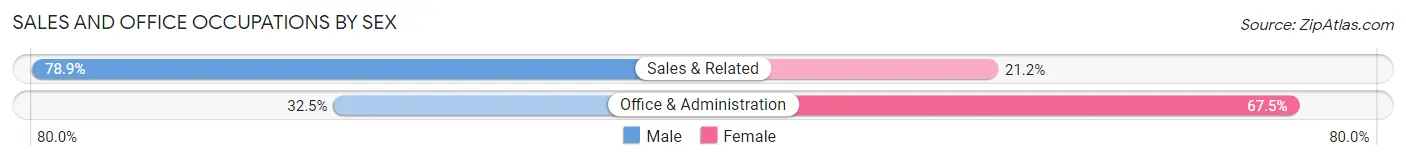
| Occupation | Male | Female |
| Sales & Related | 123 (78.8%) | 33 (21.1%) |
| Office & Administration | 65 (32.5%) | 135 (67.5%) |
| Total (Category) | 188 (52.8%) | 168 (47.2%) |
| Total (Overall) | 999 (49.3%) | 1,029 (50.7%) |
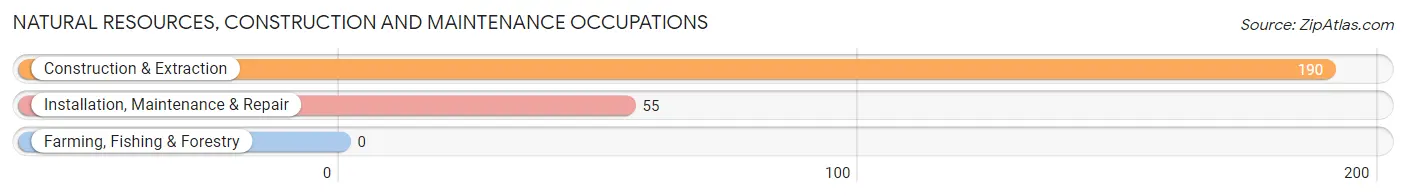
Natural Resources, Construction and Maintenance Occupations
The most common Natural Resources, Construction and Maintenance occupations in Dell Rapids are Construction & Extraction (190 | 9.4%), and Installation, Maintenance & Repair (55 | 2.7%).
Natural Resources, Construction and Maintenance Occupations by Sex
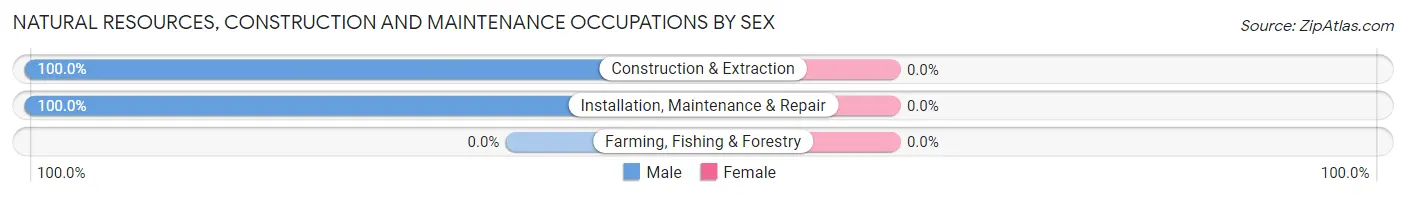
| Occupation | Male | Female |
| Farming, Fishing & Forestry | 0 (0.0%) | 0 (0.0%) |
| Construction & Extraction | 190 (100.0%) | 0 (0.0%) |
| Installation, Maintenance & Repair | 55 (100.0%) | 0 (0.0%) |
| Total (Category) | 245 (100.0%) | 0 (0.0%) |
| Total (Overall) | 999 (49.3%) | 1,029 (50.7%) |
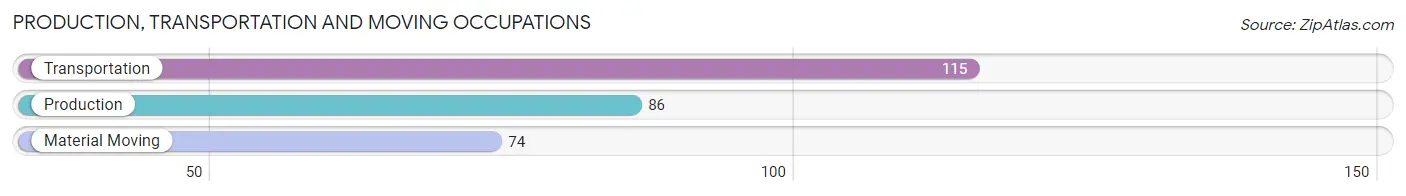
Production, Transportation and Moving Occupations
The most common Production, Transportation and Moving occupations in Dell Rapids are Transportation (115 | 5.7%), Production (86 | 4.2%), and Material Moving (74 | 3.6%).
Production, Transportation and Moving Occupations by Sex
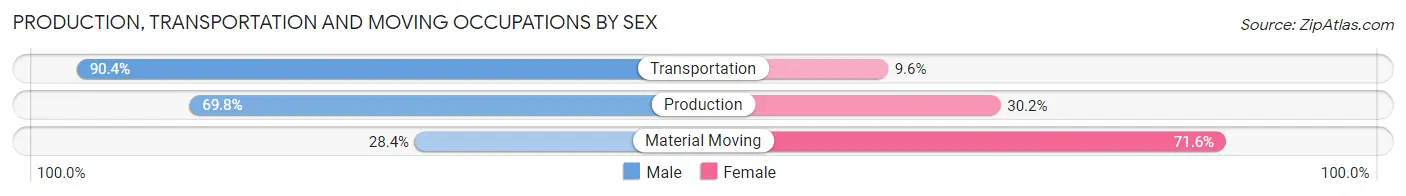
| Occupation | Male | Female |
| Production | 60 (69.8%) | 26 (30.2%) |
| Transportation | 104 (90.4%) | 11 (9.6%) |
| Material Moving | 21 (28.4%) | 53 (71.6%) |
| Total (Category) | 185 (67.3%) | 90 (32.7%) |
| Total (Overall) | 999 (49.3%) | 1,029 (50.7%) |
Employment Industries by Sex in Dell Rapids
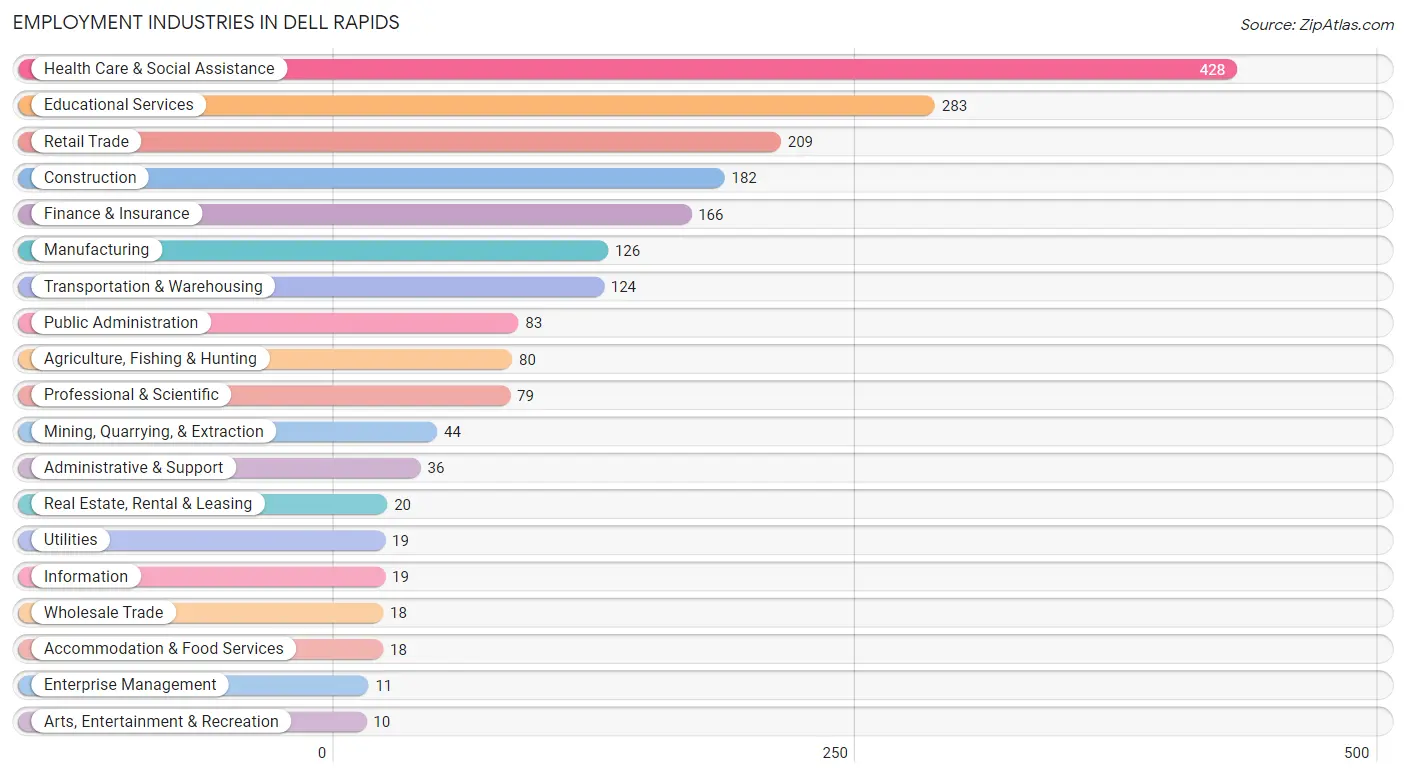
Employment Industries in Dell Rapids
The major employment industries in Dell Rapids include Health Care & Social Assistance (428 | 21.1%), Educational Services (283 | 14.0%), Retail Trade (209 | 10.3%), Construction (182 | 9.0%), and Finance & Insurance (166 | 8.2%).
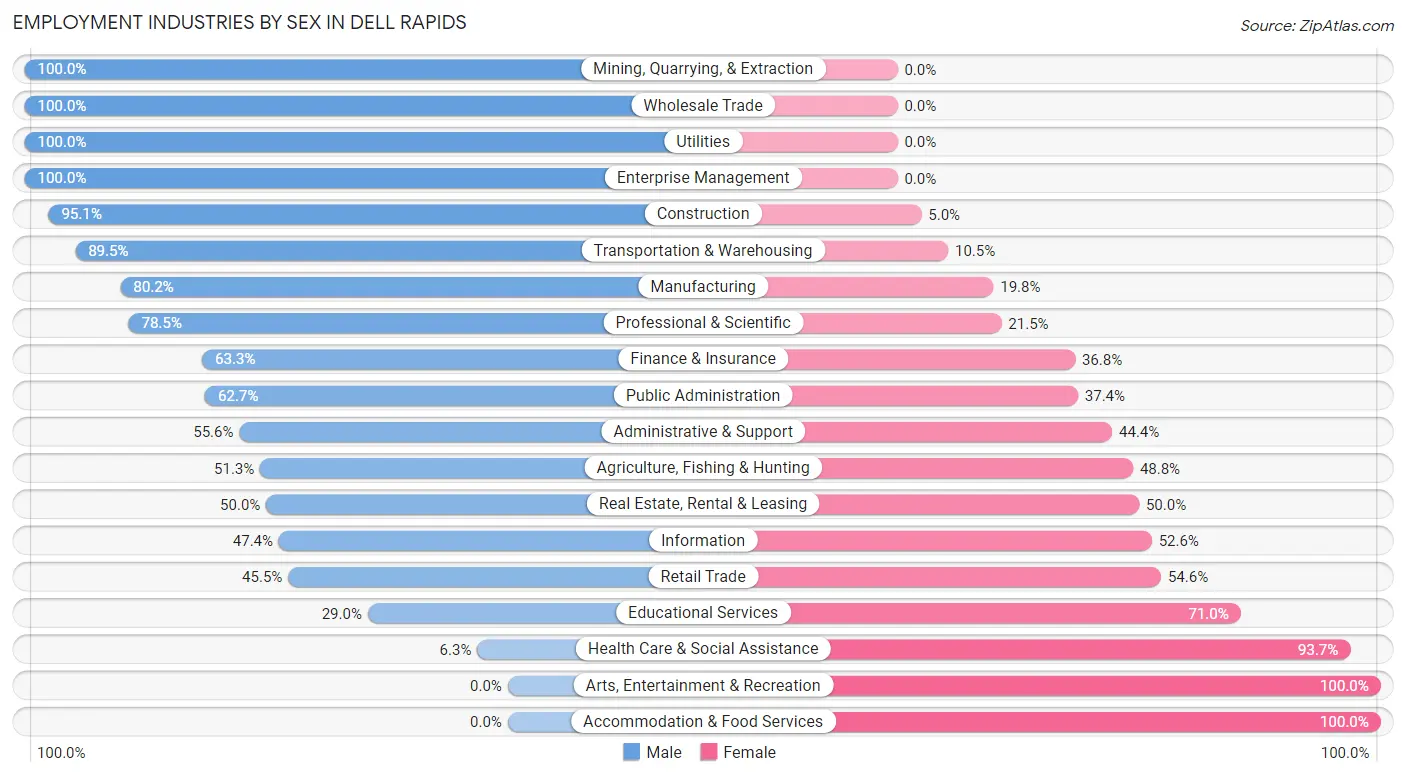
Employment Industries by Sex in Dell Rapids
The Dell Rapids industries that see more men than women are Mining, Quarrying, & Extraction (100.0%), Wholesale Trade (100.0%), and Utilities (100.0%), whereas the industries that tend to have a higher number of women are Arts, Entertainment & Recreation (100.0%), Accommodation & Food Services (100.0%), and Health Care & Social Assistance (93.7%).
| Industry | Male | Female |
| Agriculture, Fishing & Hunting | 41 (51.2%) | 39 (48.7%) |
| Mining, Quarrying, & Extraction | 44 (100.0%) | 0 (0.0%) |
| Construction | 173 (95.1%) | 9 (5.0%) |
| Manufacturing | 101 (80.2%) | 25 (19.8%) |
| Wholesale Trade | 18 (100.0%) | 0 (0.0%) |
| Retail Trade | 95 (45.5%) | 114 (54.5%) |
| Transportation & Warehousing | 111 (89.5%) | 13 (10.5%) |
| Utilities | 19 (100.0%) | 0 (0.0%) |
| Information | 9 (47.4%) | 10 (52.6%) |
| Finance & Insurance | 105 (63.2%) | 61 (36.7%) |
| Real Estate, Rental & Leasing | 10 (50.0%) | 10 (50.0%) |
| Professional & Scientific | 62 (78.5%) | 17 (21.5%) |
| Enterprise Management | 11 (100.0%) | 0 (0.0%) |
| Administrative & Support | 20 (55.6%) | 16 (44.4%) |
| Educational Services | 82 (29.0%) | 201 (71.0%) |
| Health Care & Social Assistance | 27 (6.3%) | 401 (93.7%) |
| Arts, Entertainment & Recreation | 0 (0.0%) | 10 (100.0%) |
| Accommodation & Food Services | 0 (0.0%) | 18 (100.0%) |
| Public Administration | 52 (62.6%) | 31 (37.3%) |
| Total | 999 (49.3%) | 1,029 (50.7%) |
Education in Dell Rapids
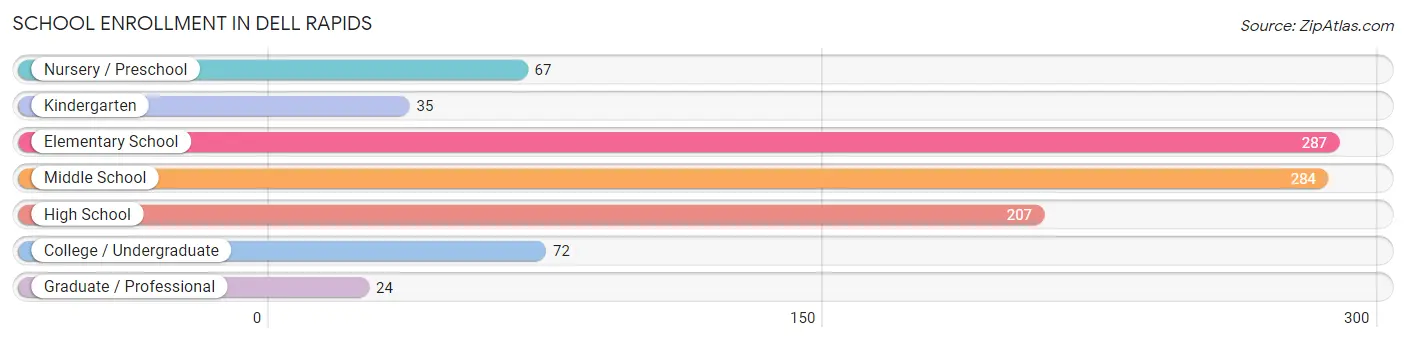
School Enrollment in Dell Rapids
The most common levels of schooling among the 976 students in Dell Rapids are elementary school (287 | 29.4%), middle school (284 | 29.1%), and high school (207 | 21.2%).
| School Level | # Students | % Students |
| Nursery / Preschool | 67 | 6.9% |
| Kindergarten | 35 | 3.6% |
| Elementary School | 287 | 29.4% |
| Middle School | 284 | 29.1% |
| High School | 207 | 21.2% |
| College / Undergraduate | 72 | 7.4% |
| Graduate / Professional | 24 | 2.5% |
| Total | 976 | 100.0% |
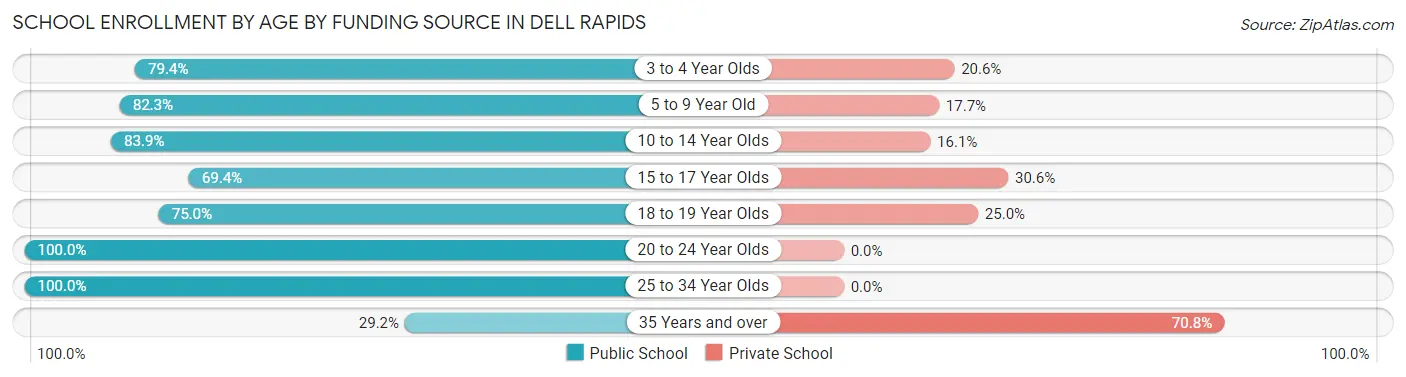
School Enrollment by Age by Funding Source in Dell Rapids
Out of a total of 976 students who are enrolled in schools in Dell Rapids, 192 (19.7%) attend a private institution, while the remaining 784 (80.3%) are enrolled in public schools. The age group of 35 years and over has the highest likelihood of being enrolled in private schools, with 17 (70.8% in the age bracket) enrolled. Conversely, the age group of 20 to 24 year olds has the lowest likelihood of being enrolled in a private school, with 40 (100.0% in the age bracket) attending a public institution.
| Age Bracket | Public School | Private School |
| 3 to 4 Year Olds | 27 (79.4%) | 7 (20.6%) |
| 5 to 9 Year Old | 255 (82.3%) | 55 (17.7%) |
| 10 to 14 Year Olds | 276 (83.9%) | 53 (16.1%) |
| 15 to 17 Year Olds | 102 (69.4%) | 45 (30.6%) |
| 18 to 19 Year Olds | 45 (75.0%) | 15 (25.0%) |
| 20 to 24 Year Olds | 40 (100.0%) | 0 (0.0%) |
| 25 to 34 Year Olds | 32 (100.0%) | 0 (0.0%) |
| 35 Years and over | 7 (29.2%) | 17 (70.8%) |
| Total | 784 (80.3%) | 192 (19.7%) |
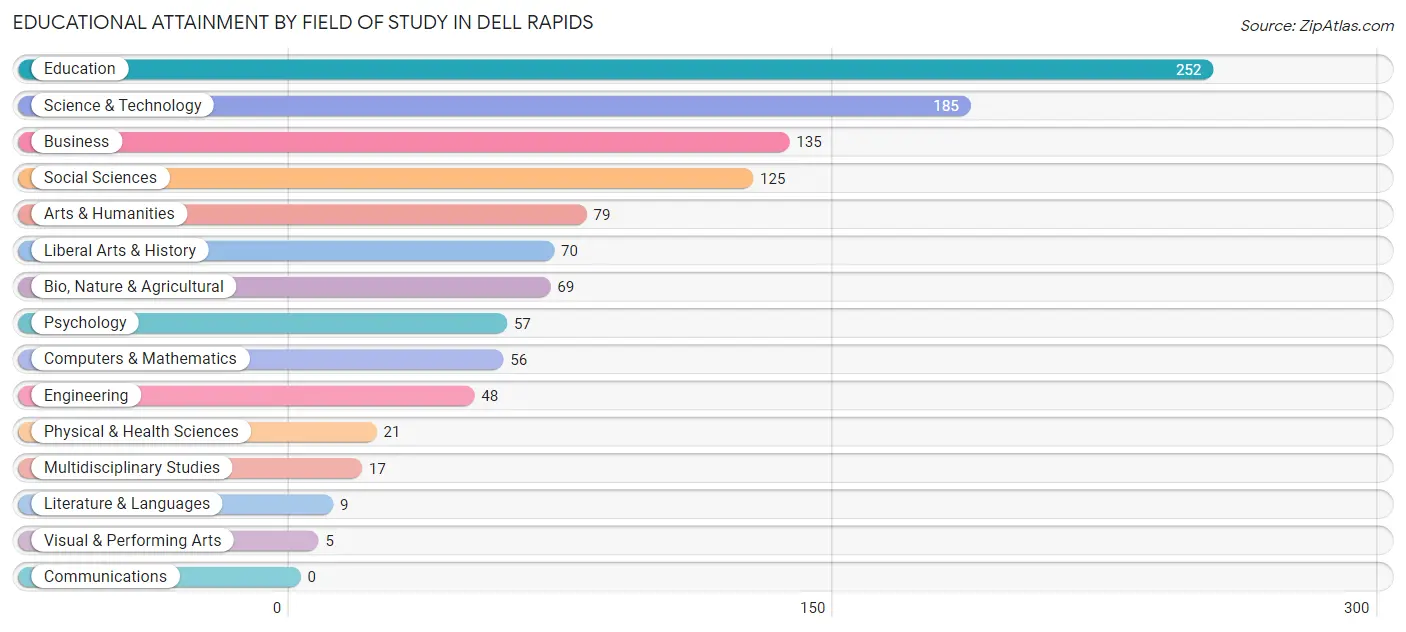
Educational Attainment by Field of Study in Dell Rapids
Education (252 | 22.3%), science & technology (185 | 16.4%), business (135 | 12.0%), social sciences (125 | 11.1%), and arts & humanities (79 | 7.0%) are the most common fields of study among 1,128 individuals in Dell Rapids who have obtained a bachelor's degree or higher.
| Field of Study | # Graduates | % Graduates |
| Computers & Mathematics | 56 | 5.0% |
| Bio, Nature & Agricultural | 69 | 6.1% |
| Physical & Health Sciences | 21 | 1.9% |
| Psychology | 57 | 5.1% |
| Social Sciences | 125 | 11.1% |
| Engineering | 48 | 4.3% |
| Multidisciplinary Studies | 17 | 1.5% |
| Science & Technology | 185 | 16.4% |
| Business | 135 | 12.0% |
| Education | 252 | 22.3% |
| Literature & Languages | 9 | 0.8% |
| Liberal Arts & History | 70 | 6.2% |
| Visual & Performing Arts | 5 | 0.4% |
| Communications | 0 | 0.0% |
| Arts & Humanities | 79 | 7.0% |
| Total | 1,128 | 100.0% |
Transportation & Commute in Dell Rapids
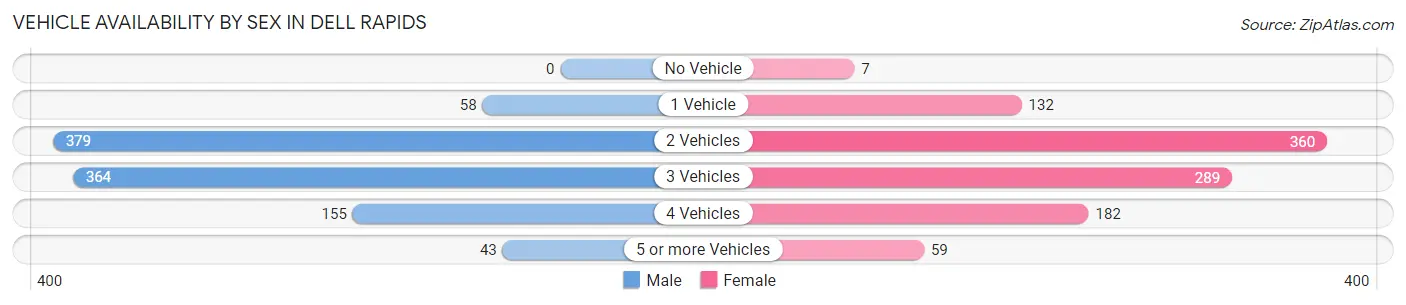
Vehicle Availability by Sex in Dell Rapids
The most prevalent vehicle ownership categories in Dell Rapids are males with 2 vehicles (379, accounting for 37.9%) and females with 2 vehicles (360, making up 36.8%).
| Vehicles Available | Male | Female |
| No Vehicle | 0 (0.0%) | 7 (0.7%) |
| 1 Vehicle | 58 (5.8%) | 132 (12.8%) |
| 2 Vehicles | 379 (37.9%) | 360 (35.0%) |
| 3 Vehicles | 364 (36.4%) | 289 (28.1%) |
| 4 Vehicles | 155 (15.5%) | 182 (17.7%) |
| 5 or more Vehicles | 43 (4.3%) | 59 (5.7%) |
| Total | 999 (100.0%) | 1,029 (100.0%) |
Commute Time in Dell Rapids
The most frequently occuring commute durations in Dell Rapids are 30 to 34 minutes (609 commuters, 31.3%), 5 to 9 minutes (398 commuters, 20.5%), and less than 5 minutes (196 commuters, 10.1%).
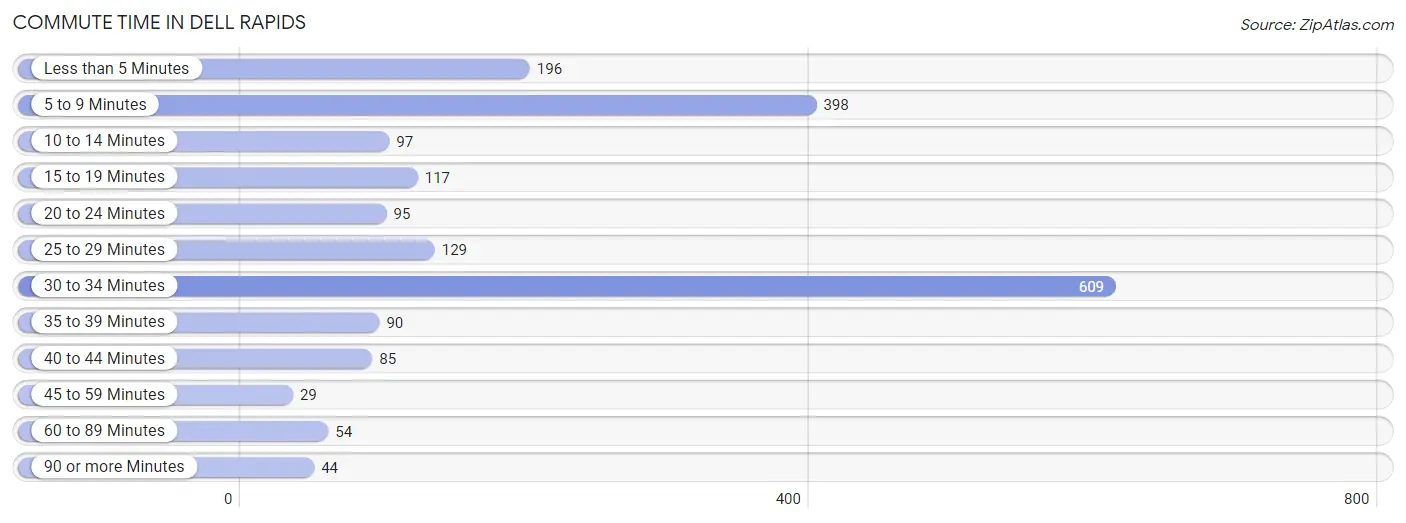
| Commute Time | # Commuters | % Commuters |
| Less than 5 Minutes | 196 | 10.1% |
| 5 to 9 Minutes | 398 | 20.5% |
| 10 to 14 Minutes | 97 | 5.0% |
| 15 to 19 Minutes | 117 | 6.0% |
| 20 to 24 Minutes | 95 | 4.9% |
| 25 to 29 Minutes | 129 | 6.6% |
| 30 to 34 Minutes | 609 | 31.3% |
| 35 to 39 Minutes | 90 | 4.6% |
| 40 to 44 Minutes | 85 | 4.4% |
| 45 to 59 Minutes | 29 | 1.5% |
| 60 to 89 Minutes | 54 | 2.8% |
| 90 or more Minutes | 44 | 2.3% |
Commute Time by Sex in Dell Rapids
The most common commute times in Dell Rapids are 30 to 34 minutes (266 commuters, 27.4%) for males and 30 to 34 minutes (343 commuters, 35.3%) for females.
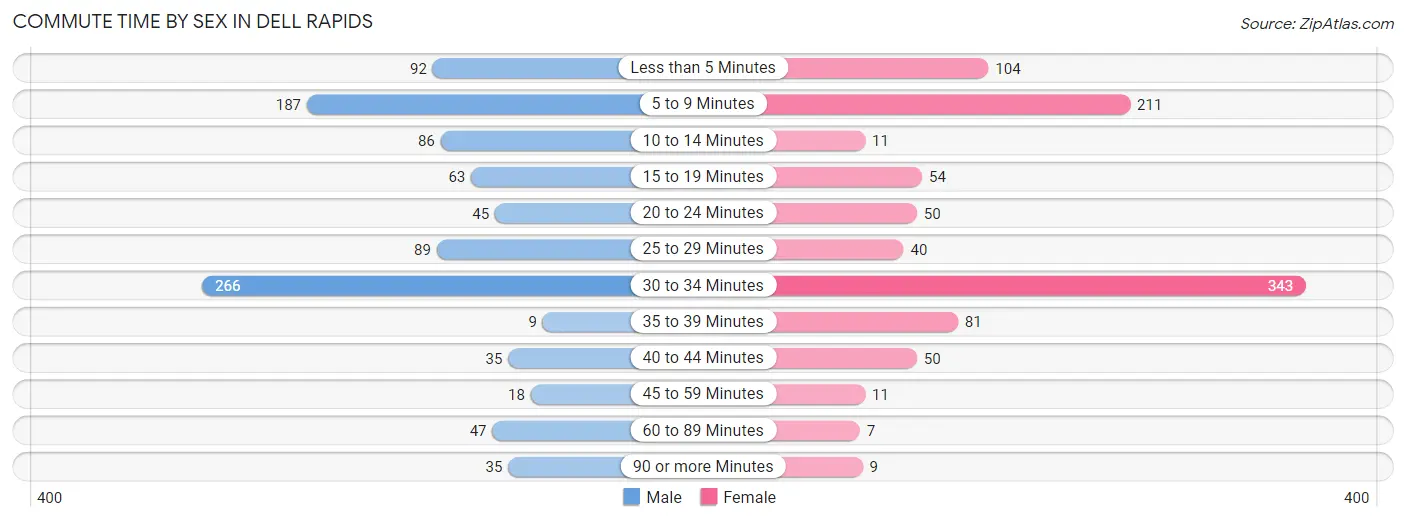
| Commute Time | Male | Female |
| Less than 5 Minutes | 92 (9.5%) | 104 (10.7%) |
| 5 to 9 Minutes | 187 (19.2%) | 211 (21.7%) |
| 10 to 14 Minutes | 86 (8.8%) | 11 (1.1%) |
| 15 to 19 Minutes | 63 (6.5%) | 54 (5.6%) |
| 20 to 24 Minutes | 45 (4.6%) | 50 (5.1%) |
| 25 to 29 Minutes | 89 (9.2%) | 40 (4.1%) |
| 30 to 34 Minutes | 266 (27.4%) | 343 (35.3%) |
| 35 to 39 Minutes | 9 (0.9%) | 81 (8.3%) |
| 40 to 44 Minutes | 35 (3.6%) | 50 (5.1%) |
| 45 to 59 Minutes | 18 (1.8%) | 11 (1.1%) |
| 60 to 89 Minutes | 47 (4.8%) | 7 (0.7%) |
| 90 or more Minutes | 35 (3.6%) | 9 (0.9%) |
Time of Departure to Work by Sex in Dell Rapids
The most frequent times of departure to work in Dell Rapids are 7:30 AM to 7:59 AM (185, 19.0%) for males and 7:00 AM to 7:29 AM (230, 23.7%) for females.
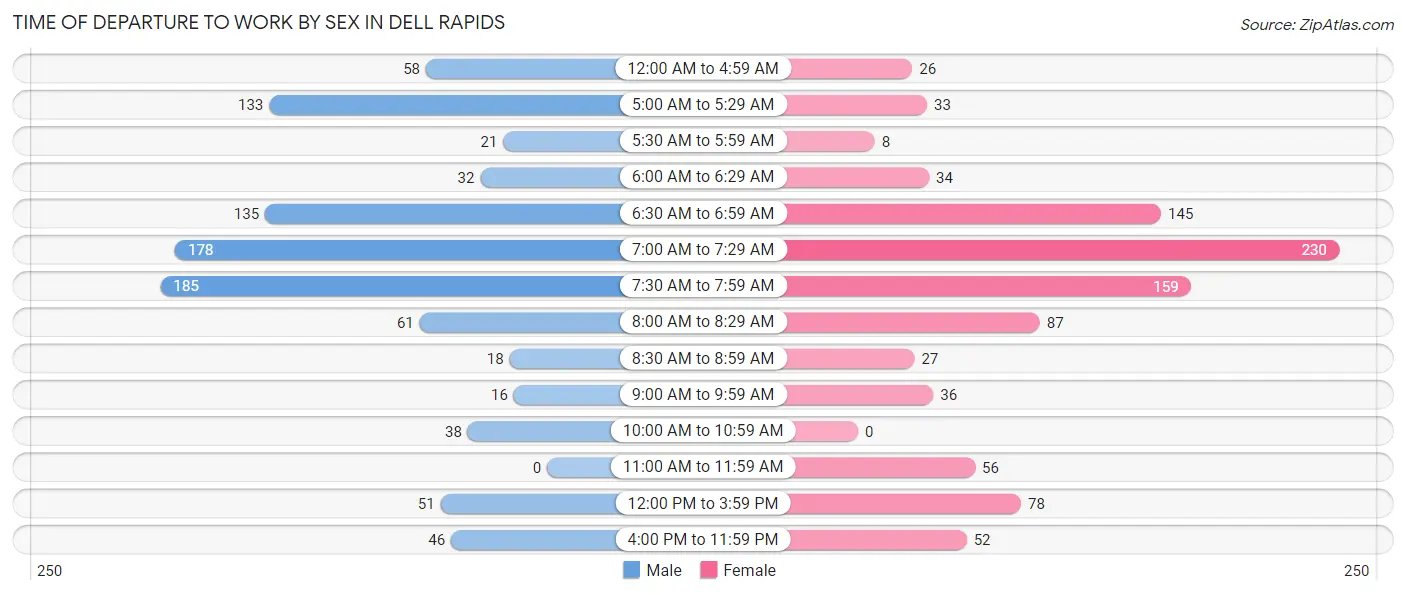
| Time of Departure | Male | Female |
| 12:00 AM to 4:59 AM | 58 (6.0%) | 26 (2.7%) |
| 5:00 AM to 5:29 AM | 133 (13.7%) | 33 (3.4%) |
| 5:30 AM to 5:59 AM | 21 (2.2%) | 8 (0.8%) |
| 6:00 AM to 6:29 AM | 32 (3.3%) | 34 (3.5%) |
| 6:30 AM to 6:59 AM | 135 (13.9%) | 145 (14.9%) |
| 7:00 AM to 7:29 AM | 178 (18.3%) | 230 (23.7%) |
| 7:30 AM to 7:59 AM | 185 (19.0%) | 159 (16.4%) |
| 8:00 AM to 8:29 AM | 61 (6.3%) | 87 (9.0%) |
| 8:30 AM to 8:59 AM | 18 (1.8%) | 27 (2.8%) |
| 9:00 AM to 9:59 AM | 16 (1.7%) | 36 (3.7%) |
| 10:00 AM to 10:59 AM | 38 (3.9%) | 0 (0.0%) |
| 11:00 AM to 11:59 AM | 0 (0.0%) | 56 (5.8%) |
| 12:00 PM to 3:59 PM | 51 (5.2%) | 78 (8.0%) |
| 4:00 PM to 11:59 PM | 46 (4.7%) | 52 (5.4%) |
| Total | 972 (100.0%) | 971 (100.0%) |
Housing Occupancy in Dell Rapids
Occupancy by Ownership in Dell Rapids
Of the total 1,529 dwellings in Dell Rapids, owner-occupied units account for 1,209 (79.1%), while renter-occupied units make up 320 (20.9%).
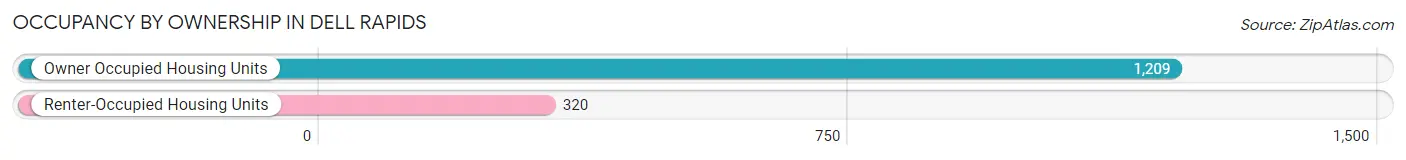
| Occupancy | # Housing Units | % Housing Units |
| Owner Occupied Housing Units | 1,209 | 79.1% |
| Renter-Occupied Housing Units | 320 | 20.9% |
| Total Occupied Housing Units | 1,529 | 100.0% |
Occupancy by Household Size in Dell Rapids
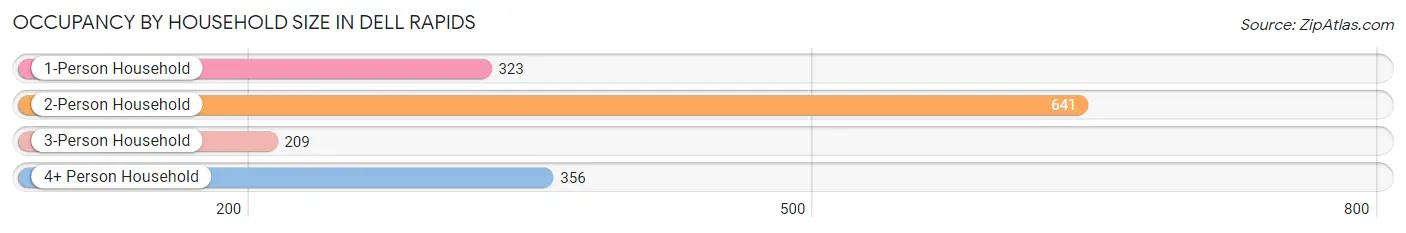
| Household Size | # Housing Units | % Housing Units |
| 1-Person Household | 323 | 21.1% |
| 2-Person Household | 641 | 41.9% |
| 3-Person Household | 209 | 13.7% |
| 4+ Person Household | 356 | 23.3% |
| Total Housing Units | 1,529 | 100.0% |
Occupancy by Ownership by Household Size in Dell Rapids
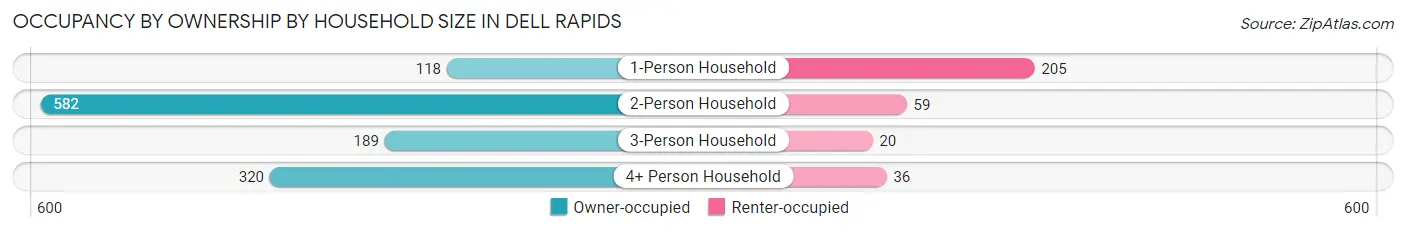
| Household Size | Owner-occupied | Renter-occupied |
| 1-Person Household | 118 (36.5%) | 205 (63.5%) |
| 2-Person Household | 582 (90.8%) | 59 (9.2%) |
| 3-Person Household | 189 (90.4%) | 20 (9.6%) |
| 4+ Person Household | 320 (89.9%) | 36 (10.1%) |
| Total Housing Units | 1,209 (79.1%) | 320 (20.9%) |
Occupancy by Educational Attainment in Dell Rapids
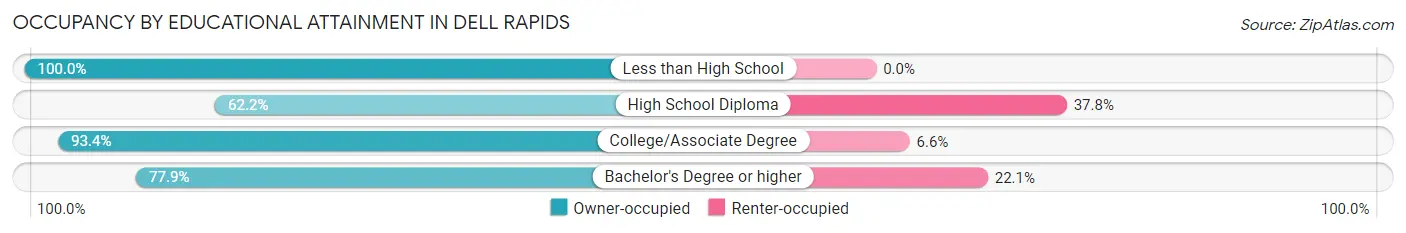
| Household Size | Owner-occupied | Renter-occupied |
| Less than High School | 15 (100.0%) | 0 (0.0%) |
| High School Diploma | 247 (62.2%) | 150 (37.8%) |
| College/Associate Degree | 465 (93.4%) | 33 (6.6%) |
| Bachelor's Degree or higher | 482 (77.9%) | 137 (22.1%) |
Occupancy by Age of Householder in Dell Rapids
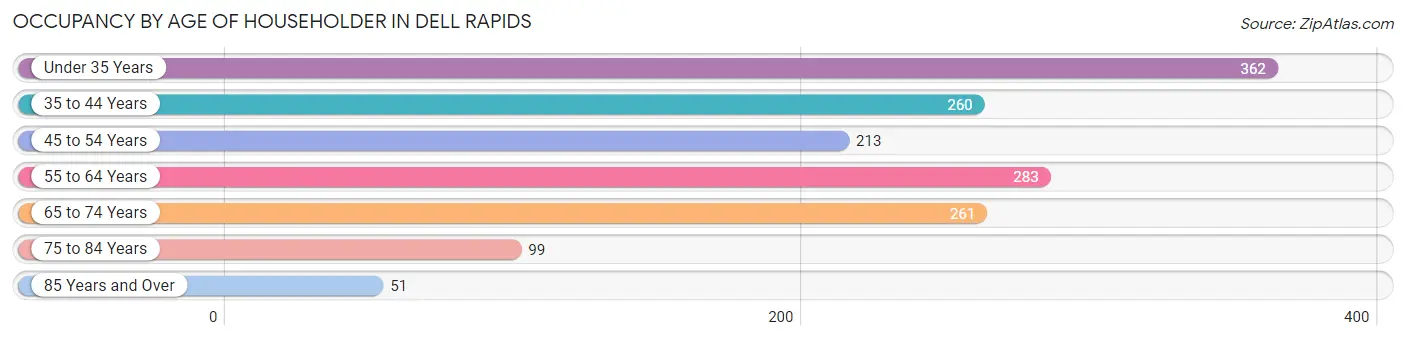
| Age Bracket | # Households | % Households |
| Under 35 Years | 362 | 23.7% |
| 35 to 44 Years | 260 | 17.0% |
| 45 to 54 Years | 213 | 13.9% |
| 55 to 64 Years | 283 | 18.5% |
| 65 to 74 Years | 261 | 17.1% |
| 75 to 84 Years | 99 | 6.5% |
| 85 Years and Over | 51 | 3.3% |
| Total | 1,529 | 100.0% |
Housing Finances in Dell Rapids
Median Income by Occupancy in Dell Rapids
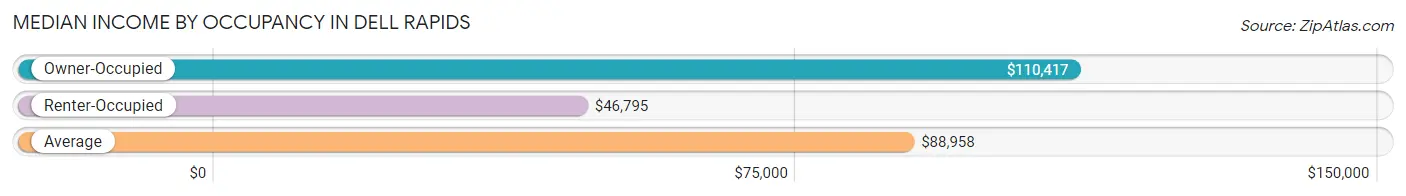
| Occupancy Type | # Households | Median Income |
| Owner-Occupied | 1,209 (79.1%) | $110,417 |
| Renter-Occupied | 320 (20.9%) | $46,795 |
| Average | 1,529 (100.0%) | $88,958 |
Occupancy by Householder Income Bracket in Dell Rapids
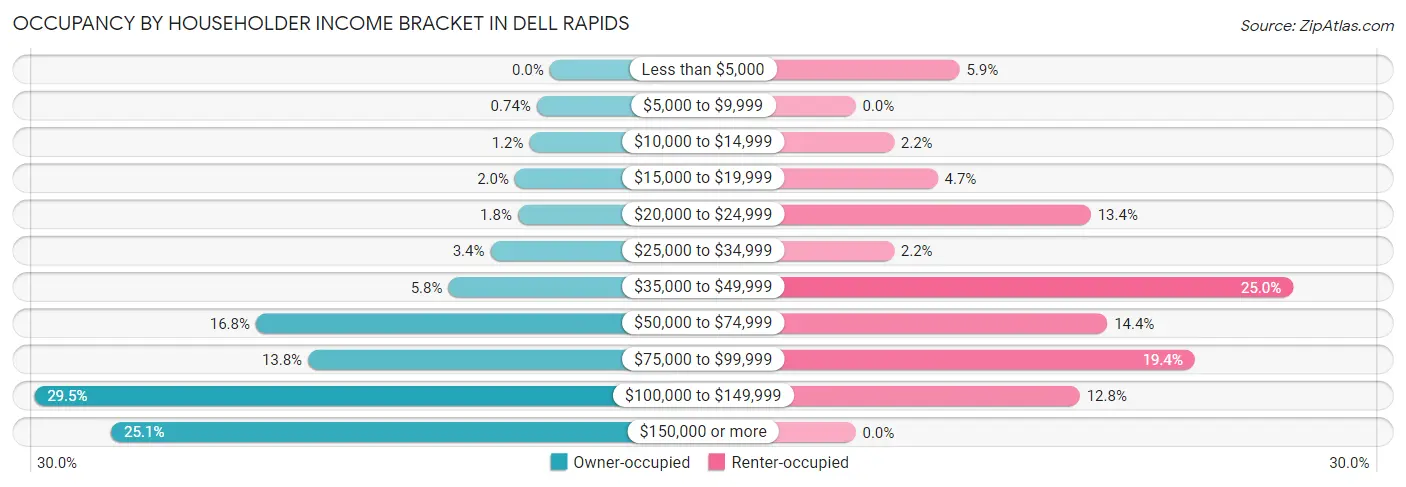
| Income Bracket | Owner-occupied | Renter-occupied |
| Less than $5,000 | 0 (0.0%) | 19 (5.9%) |
| $5,000 to $9,999 | 9 (0.7%) | 0 (0.0%) |
| $10,000 to $14,999 | 14 (1.2%) | 7 (2.2%) |
| $15,000 to $19,999 | 24 (2.0%) | 15 (4.7%) |
| $20,000 to $24,999 | 22 (1.8%) | 43 (13.4%) |
| $25,000 to $34,999 | 41 (3.4%) | 7 (2.2%) |
| $35,000 to $49,999 | 70 (5.8%) | 80 (25.0%) |
| $50,000 to $74,999 | 203 (16.8%) | 46 (14.4%) |
| $75,000 to $99,999 | 167 (13.8%) | 62 (19.4%) |
| $100,000 to $149,999 | 356 (29.4%) | 41 (12.8%) |
| $150,000 or more | 303 (25.1%) | 0 (0.0%) |
| Total | 1,209 (100.0%) | 320 (100.0%) |
Monthly Housing Cost Tiers in Dell Rapids
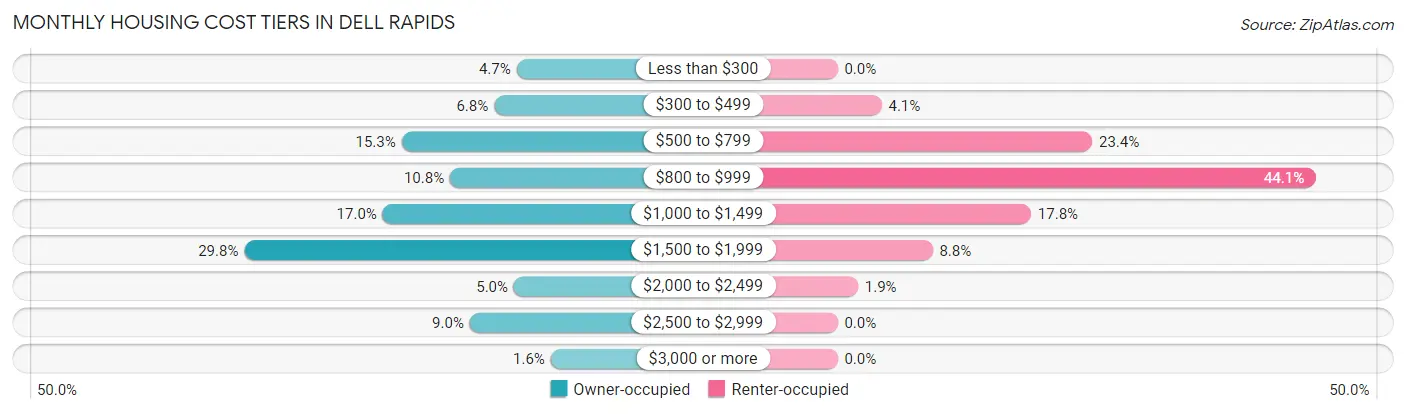
| Monthly Cost | Owner-occupied | Renter-occupied |
| Less than $300 | 57 (4.7%) | 0 (0.0%) |
| $300 to $499 | 82 (6.8%) | 13 (4.1%) |
| $500 to $799 | 185 (15.3%) | 75 (23.4%) |
| $800 to $999 | 131 (10.8%) | 141 (44.1%) |
| $1,000 to $1,499 | 206 (17.0%) | 57 (17.8%) |
| $1,500 to $1,999 | 360 (29.8%) | 28 (8.7%) |
| $2,000 to $2,499 | 60 (5.0%) | 6 (1.9%) |
| $2,500 to $2,999 | 109 (9.0%) | 0 (0.0%) |
| $3,000 or more | 19 (1.6%) | 0 (0.0%) |
| Total | 1,209 (100.0%) | 320 (100.0%) |
Physical Housing Characteristics in Dell Rapids
Housing Structures in Dell Rapids
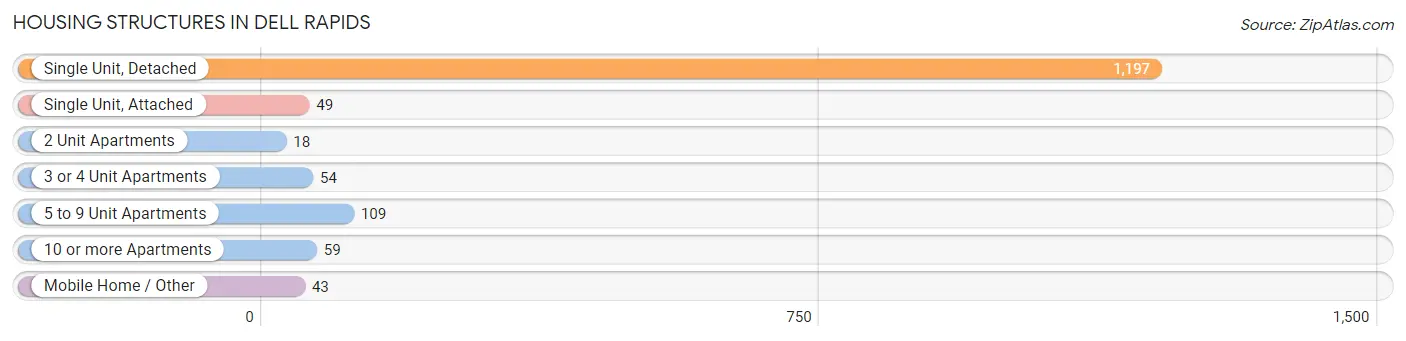
| Structure Type | # Housing Units | % Housing Units |
| Single Unit, Detached | 1,197 | 78.3% |
| Single Unit, Attached | 49 | 3.2% |
| 2 Unit Apartments | 18 | 1.2% |
| 3 or 4 Unit Apartments | 54 | 3.5% |
| 5 to 9 Unit Apartments | 109 | 7.1% |
| 10 or more Apartments | 59 | 3.9% |
| Mobile Home / Other | 43 | 2.8% |
| Total | 1,529 | 100.0% |
Housing Structures by Occupancy in Dell Rapids
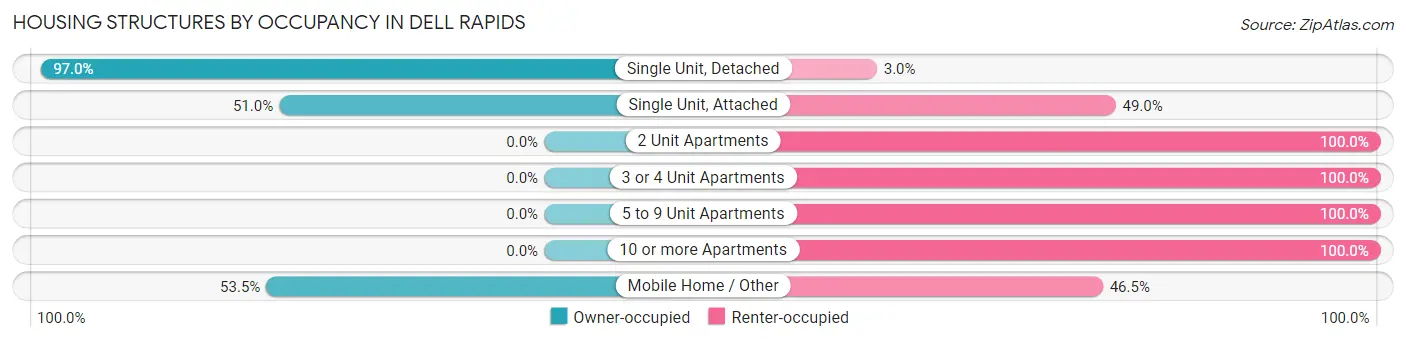
| Structure Type | Owner-occupied | Renter-occupied |
| Single Unit, Detached | 1,161 (97.0%) | 36 (3.0%) |
| Single Unit, Attached | 25 (51.0%) | 24 (49.0%) |
| 2 Unit Apartments | 0 (0.0%) | 18 (100.0%) |
| 3 or 4 Unit Apartments | 0 (0.0%) | 54 (100.0%) |
| 5 to 9 Unit Apartments | 0 (0.0%) | 109 (100.0%) |
| 10 or more Apartments | 0 (0.0%) | 59 (100.0%) |
| Mobile Home / Other | 23 (53.5%) | 20 (46.5%) |
| Total | 1,209 (79.1%) | 320 (20.9%) |
Housing Structures by Number of Rooms in Dell Rapids
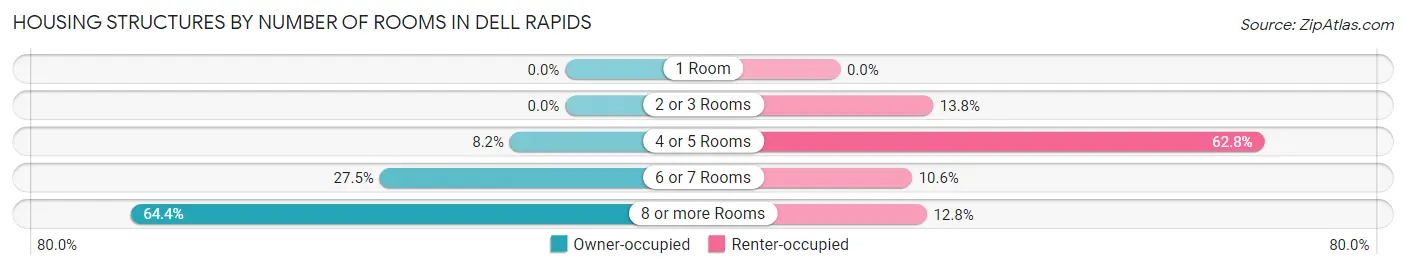
| Number of Rooms | Owner-occupied | Renter-occupied |
| 1 Room | 0 (0.0%) | 0 (0.0%) |
| 2 or 3 Rooms | 0 (0.0%) | 44 (13.8%) |
| 4 or 5 Rooms | 99 (8.2%) | 201 (62.8%) |
| 6 or 7 Rooms | 332 (27.5%) | 34 (10.6%) |
| 8 or more Rooms | 778 (64.3%) | 41 (12.8%) |
| Total | 1,209 (100.0%) | 320 (100.0%) |
Housing Structure by Heating Type in Dell Rapids
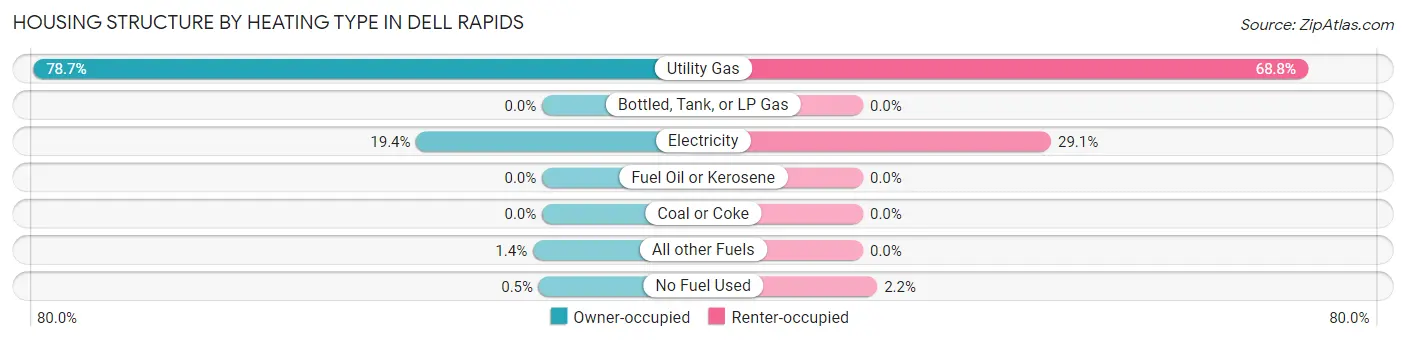
| Heating Type | Owner-occupied | Renter-occupied |
| Utility Gas | 951 (78.7%) | 220 (68.8%) |
| Bottled, Tank, or LP Gas | 0 (0.0%) | 0 (0.0%) |
| Electricity | 235 (19.4%) | 93 (29.1%) |
| Fuel Oil or Kerosene | 0 (0.0%) | 0 (0.0%) |
| Coal or Coke | 0 (0.0%) | 0 (0.0%) |
| All other Fuels | 17 (1.4%) | 0 (0.0%) |
| No Fuel Used | 6 (0.5%) | 7 (2.2%) |
| Total | 1,209 (100.0%) | 320 (100.0%) |
Household Vehicle Usage in Dell Rapids
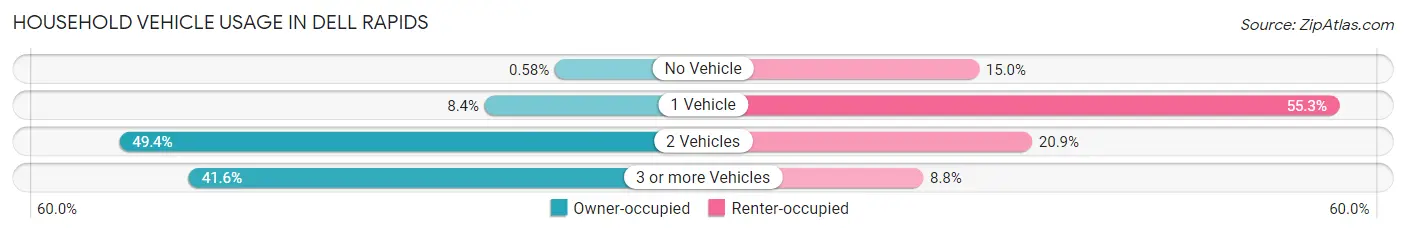
| Vehicles per Household | Owner-occupied | Renter-occupied |
| No Vehicle | 7 (0.6%) | 48 (15.0%) |
| 1 Vehicle | 102 (8.4%) | 177 (55.3%) |
| 2 Vehicles | 597 (49.4%) | 67 (20.9%) |
| 3 or more Vehicles | 503 (41.6%) | 28 (8.7%) |
| Total | 1,209 (100.0%) | 320 (100.0%) |
Real Estate & Mortgages in Dell Rapids
Real Estate and Mortgage Overview in Dell Rapids
| Characteristic | Without Mortgage | With Mortgage |
| Housing Units | 465 | 744 |
| Median Property Value | $269,300 | $251,800 |
| Median Household Income | $78,750 | $151 |
| Monthly Housing Costs | $646 | $19 |
| Real Estate Taxes | $3,400 | $14 |
Property Value by Mortgage Status in Dell Rapids
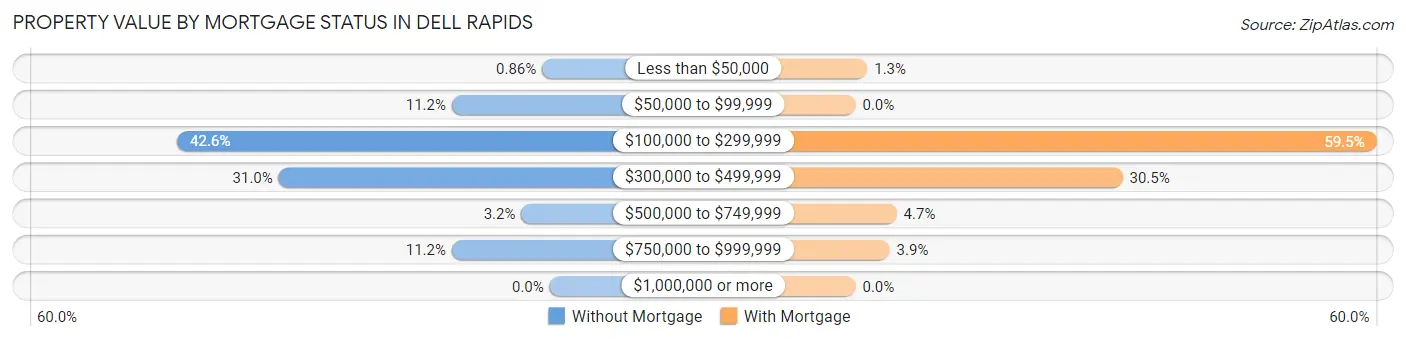
| Property Value | Without Mortgage | With Mortgage |
| Less than $50,000 | 4 (0.9%) | 10 (1.3%) |
| $50,000 to $99,999 | 52 (11.2%) | 0 (0.0%) |
| $100,000 to $299,999 | 198 (42.6%) | 443 (59.5%) |
| $300,000 to $499,999 | 144 (31.0%) | 227 (30.5%) |
| $500,000 to $749,999 | 15 (3.2%) | 35 (4.7%) |
| $750,000 to $999,999 | 52 (11.2%) | 29 (3.9%) |
| $1,000,000 or more | 0 (0.0%) | 0 (0.0%) |
| Total | 465 (100.0%) | 744 (100.0%) |
Household Income by Mortgage Status in Dell Rapids
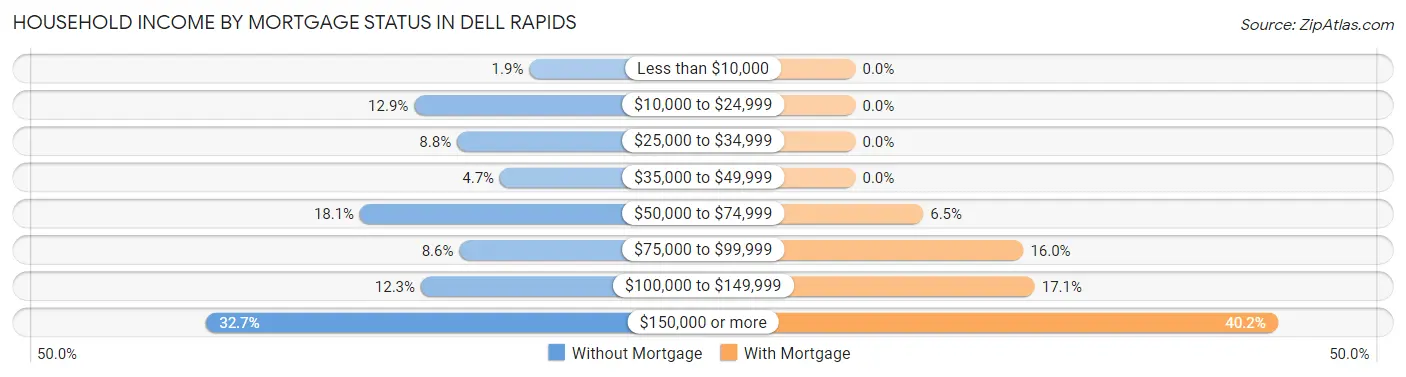
| Household Income | Without Mortgage | With Mortgage |
| Less than $10,000 | 9 (1.9%) | 0 (0.0%) |
| $10,000 to $24,999 | 60 (12.9%) | 0 (0.0%) |
| $25,000 to $34,999 | 41 (8.8%) | 0 (0.0%) |
| $35,000 to $49,999 | 22 (4.7%) | 0 (0.0%) |
| $50,000 to $74,999 | 84 (18.1%) | 48 (6.5%) |
| $75,000 to $99,999 | 40 (8.6%) | 119 (16.0%) |
| $100,000 to $149,999 | 57 (12.3%) | 127 (17.1%) |
| $150,000 or more | 152 (32.7%) | 299 (40.2%) |
| Total | 465 (100.0%) | 744 (100.0%) |
Property Value to Household Income Ratio in Dell Rapids
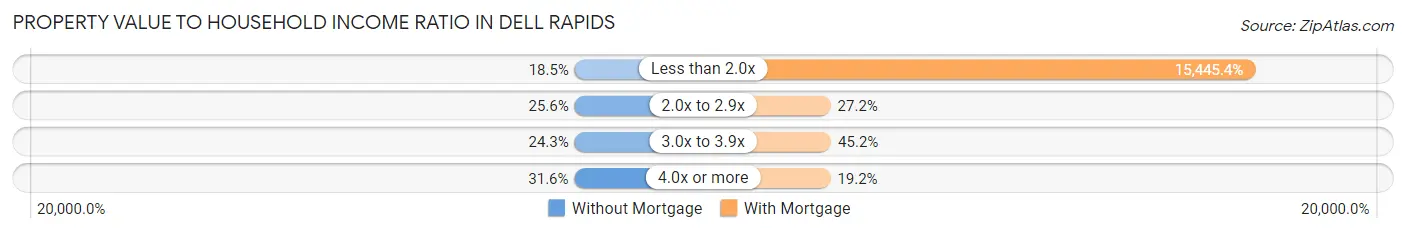
| Value-to-Income Ratio | Without Mortgage | With Mortgage |
| Less than 2.0x | 86 (18.5%) | 114,914 (15,445.4%) |
| 2.0x to 2.9x | 119 (25.6%) | 202 (27.2%) |
| 3.0x to 3.9x | 113 (24.3%) | 336 (45.2%) |
| 4.0x or more | 147 (31.6%) | 143 (19.2%) |
| Total | 465 (100.0%) | 744 (100.0%) |
Real Estate Taxes by Mortgage Status in Dell Rapids
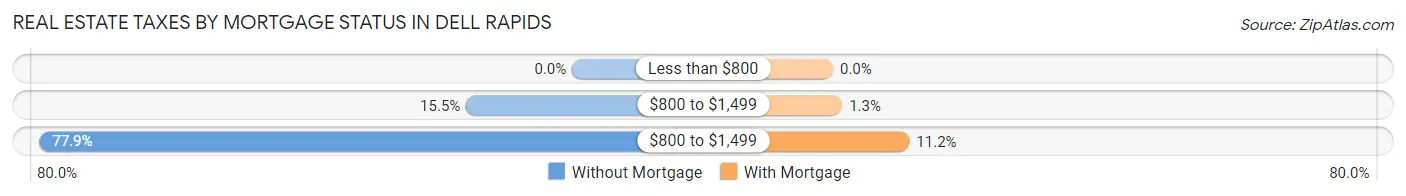
| Property Taxes | Without Mortgage | With Mortgage |
| Less than $800 | 0 (0.0%) | 0 (0.0%) |
| $800 to $1,499 | 72 (15.5%) | 10 (1.3%) |
| $800 to $1,499 | 362 (77.8%) | 83 (11.2%) |
| Total | 465 (100.0%) | 744 (100.0%) |
Health & Disability in Dell Rapids
Health Insurance Coverage by Age in Dell Rapids
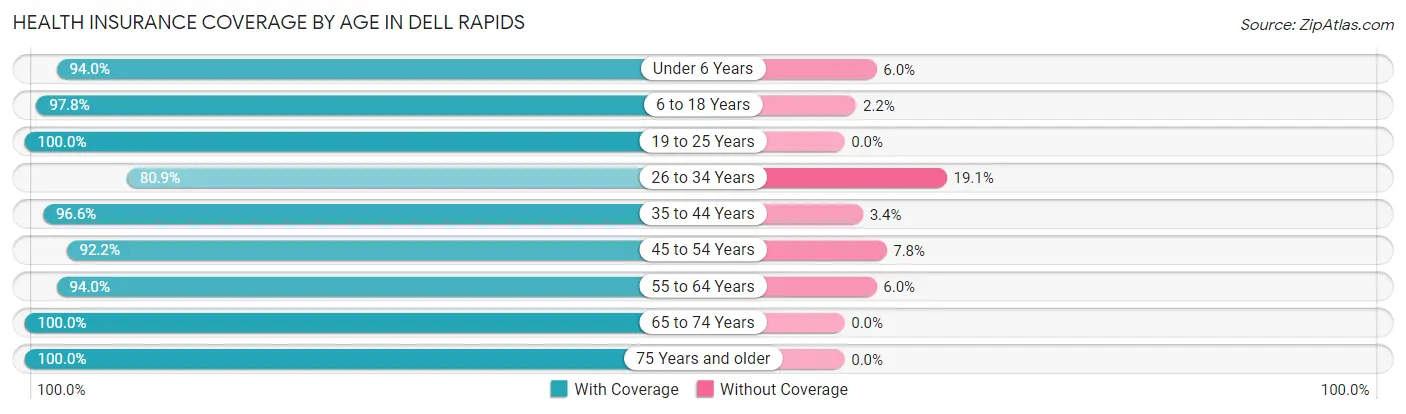
| Age Bracket | With Coverage | Without Coverage |
| Under 6 Years | 252 (94.0%) | 16 (6.0%) |
| 6 to 18 Years | 805 (97.8%) | 18 (2.2%) |
| 19 to 25 Years | 94 (100.0%) | 0 (0.0%) |
| 26 to 34 Years | 463 (80.9%) | 109 (19.1%) |
| 35 to 44 Years | 535 (96.6%) | 19 (3.4%) |
| 45 to 54 Years | 400 (92.2%) | 34 (7.8%) |
| 55 to 64 Years | 457 (94.0%) | 29 (6.0%) |
| 65 to 74 Years | 438 (100.0%) | 0 (0.0%) |
| 75 Years and older | 222 (100.0%) | 0 (0.0%) |
| Total | 3,666 (94.2%) | 225 (5.8%) |
Health Insurance Coverage by Citizenship Status in Dell Rapids
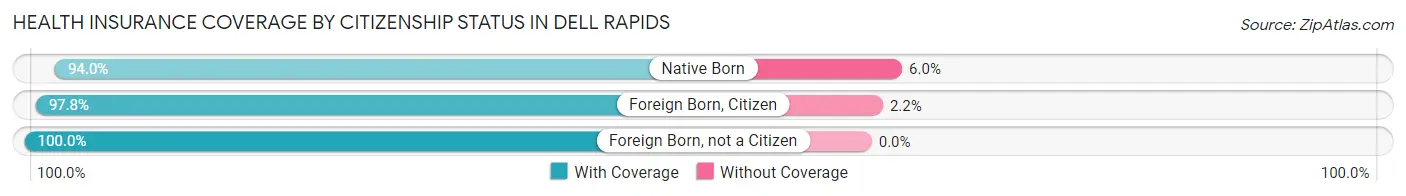
| Citizenship Status | With Coverage | Without Coverage |
| Native Born | 252 (94.0%) | 16 (6.0%) |
| Foreign Born, Citizen | 805 (97.8%) | 18 (2.2%) |
| Foreign Born, not a Citizen | 94 (100.0%) | 0 (0.0%) |
Health Insurance Coverage by Household Income in Dell Rapids
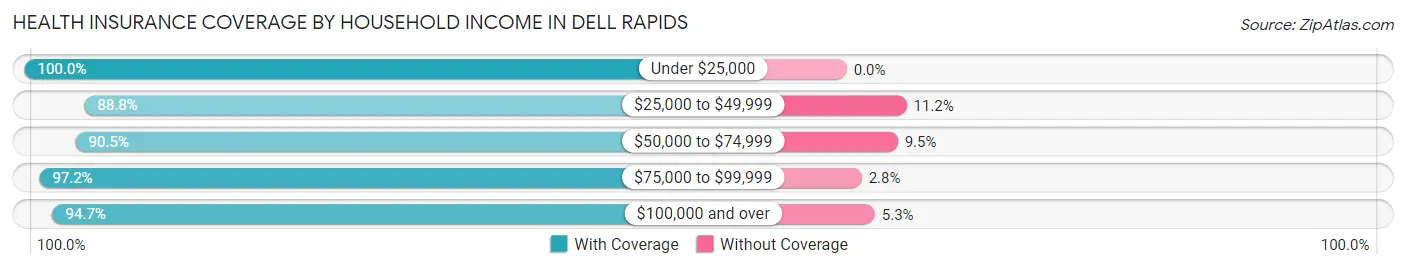
| Household Income | With Coverage | Without Coverage |
| Under $25,000 | 223 (100.0%) | 0 (0.0%) |
| $25,000 to $49,999 | 396 (88.8%) | 50 (11.2%) |
| $50,000 to $74,999 | 455 (90.5%) | 48 (9.5%) |
| $75,000 to $99,999 | 628 (97.2%) | 18 (2.8%) |
| $100,000 and over | 1,964 (94.7%) | 109 (5.3%) |
Public vs Private Health Insurance Coverage by Age in Dell Rapids
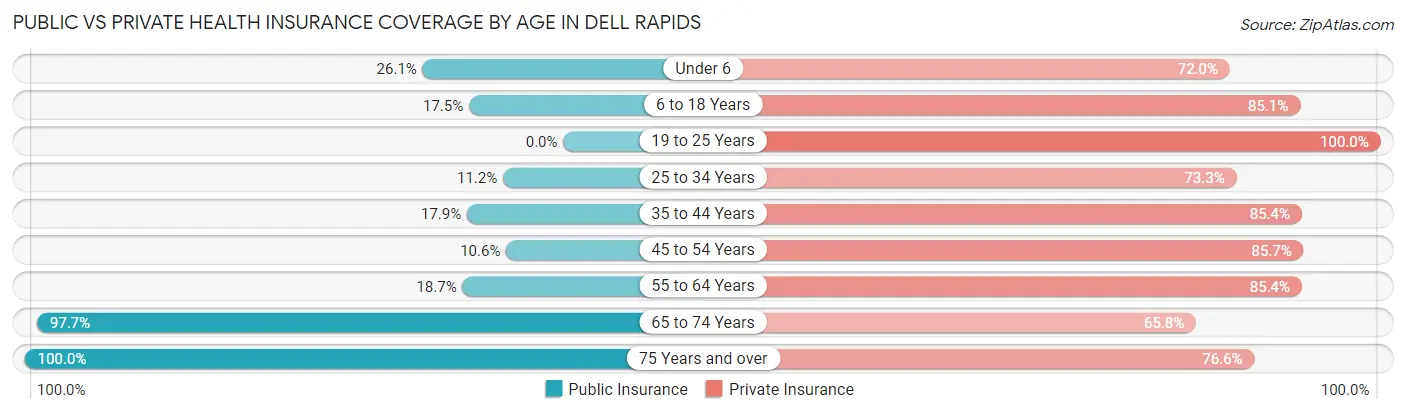
| Age Bracket | Public Insurance | Private Insurance |
| Under 6 | 70 (26.1%) | 193 (72.0%) |
| 6 to 18 Years | 144 (17.5%) | 700 (85.1%) |
| 19 to 25 Years | 0 (0.0%) | 94 (100.0%) |
| 25 to 34 Years | 64 (11.2%) | 419 (73.3%) |
| 35 to 44 Years | 99 (17.9%) | 473 (85.4%) |
| 45 to 54 Years | 46 (10.6%) | 372 (85.7%) |
| 55 to 64 Years | 91 (18.7%) | 415 (85.4%) |
| 65 to 74 Years | 428 (97.7%) | 288 (65.7%) |
| 75 Years and over | 222 (100.0%) | 170 (76.6%) |
| Total | 1,164 (29.9%) | 3,124 (80.3%) |
Disability Status by Sex by Age in Dell Rapids
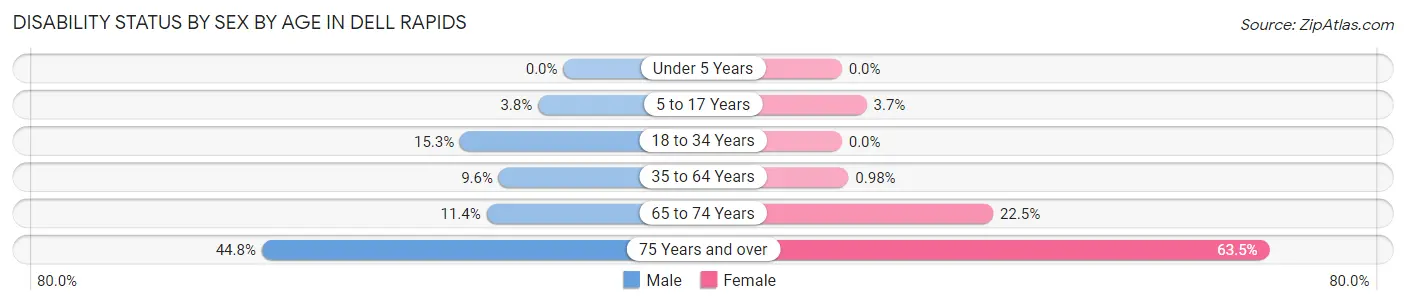
| Age Bracket | Male | Female |
| Under 5 Years | 0 (0.0%) | 0 (0.0%) |
| 5 to 17 Years | 14 (3.7%) | 16 (3.7%) |
| 18 to 34 Years | 52 (15.3%) | 0 (0.0%) |
| 35 to 64 Years | 73 (9.6%) | 7 (1.0%) |
| 65 to 74 Years | 22 (11.4%) | 55 (22.5%) |
| 75 Years and over | 43 (44.8%) | 80 (63.5%) |
Disability Class by Sex by Age in Dell Rapids
Disability Class: Hearing Difficulty
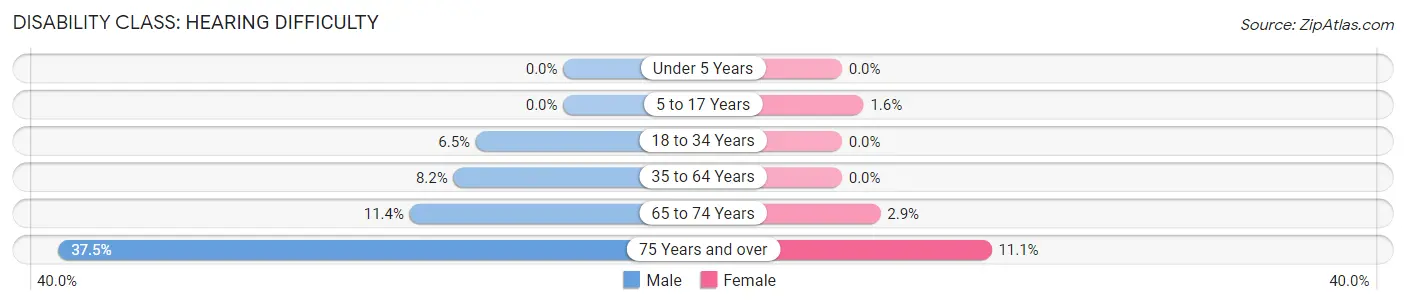
| Age Bracket | Male | Female |
| Under 5 Years | 0 (0.0%) | 0 (0.0%) |
| 5 to 17 Years | 0 (0.0%) | 7 (1.6%) |
| 18 to 34 Years | 22 (6.5%) | 0 (0.0%) |
| 35 to 64 Years | 62 (8.2%) | 0 (0.0%) |
| 65 to 74 Years | 22 (11.4%) | 7 (2.9%) |
| 75 Years and over | 36 (37.5%) | 14 (11.1%) |
Disability Class: Vision Difficulty
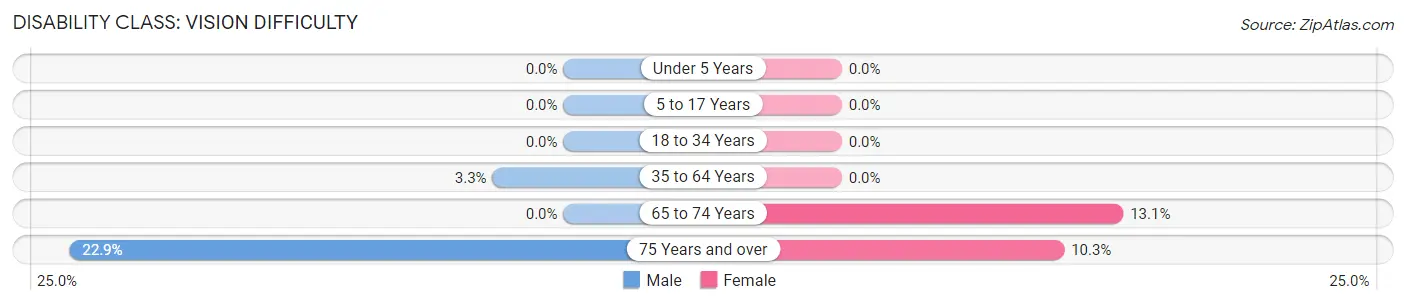
| Age Bracket | Male | Female |
| Under 5 Years | 0 (0.0%) | 0 (0.0%) |
| 5 to 17 Years | 0 (0.0%) | 0 (0.0%) |
| 18 to 34 Years | 0 (0.0%) | 0 (0.0%) |
| 35 to 64 Years | 25 (3.3%) | 0 (0.0%) |
| 65 to 74 Years | 0 (0.0%) | 32 (13.1%) |
| 75 Years and over | 22 (22.9%) | 13 (10.3%) |
Disability Class: Cognitive Difficulty
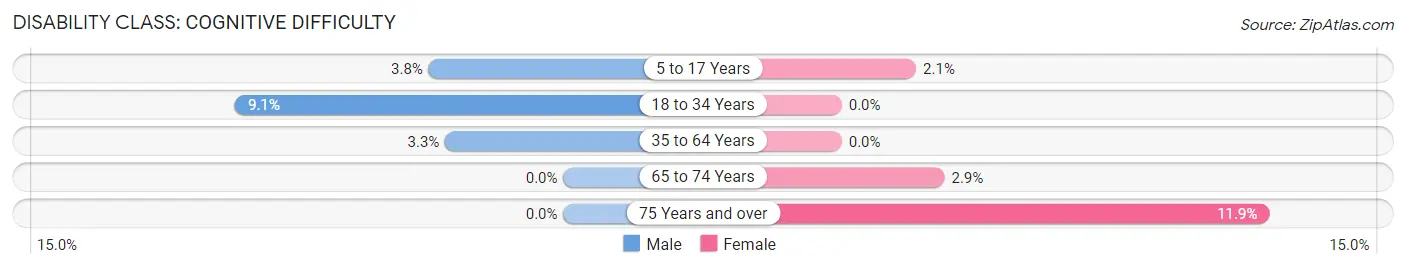
| Age Bracket | Male | Female |
| 5 to 17 Years | 14 (3.7%) | 9 (2.1%) |
| 18 to 34 Years | 31 (9.1%) | 0 (0.0%) |
| 35 to 64 Years | 25 (3.3%) | 0 (0.0%) |
| 65 to 74 Years | 0 (0.0%) | 7 (2.9%) |
| 75 Years and over | 0 (0.0%) | 15 (11.9%) |
Disability Class: Ambulatory Difficulty
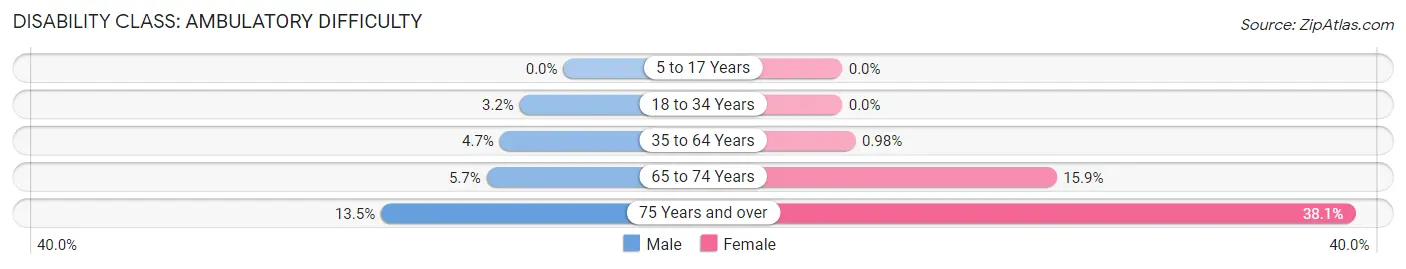
| Age Bracket | Male | Female |
| 5 to 17 Years | 0 (0.0%) | 0 (0.0%) |
| 18 to 34 Years | 11 (3.2%) | 0 (0.0%) |
| 35 to 64 Years | 36 (4.7%) | 7 (1.0%) |
| 65 to 74 Years | 11 (5.7%) | 39 (15.9%) |
| 75 Years and over | 13 (13.5%) | 48 (38.1%) |
Disability Class: Self-Care Difficulty
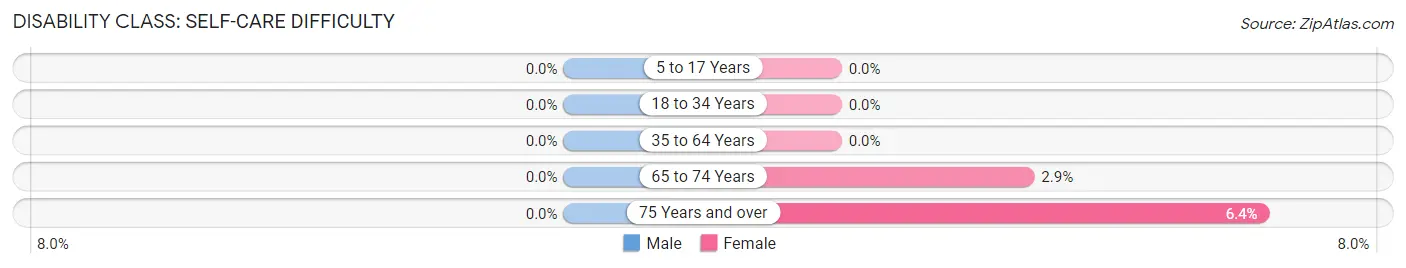
| Age Bracket | Male | Female |
| 5 to 17 Years | 0 (0.0%) | 0 (0.0%) |
| 18 to 34 Years | 0 (0.0%) | 0 (0.0%) |
| 35 to 64 Years | 0 (0.0%) | 0 (0.0%) |
| 65 to 74 Years | 0 (0.0%) | 7 (2.9%) |
| 75 Years and over | 0 (0.0%) | 8 (6.4%) |
Technology Access in Dell Rapids
Computing Device Access in Dell Rapids
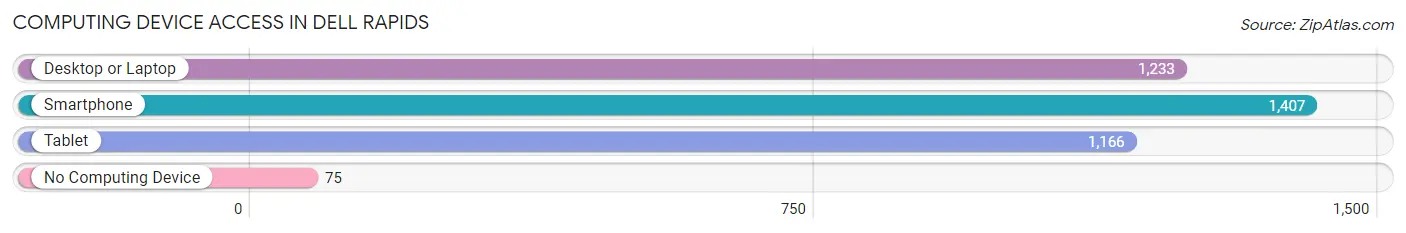
| Device Type | # Households | % Households |
| Desktop or Laptop | 1,233 | 80.6% |
| Smartphone | 1,407 | 92.0% |
| Tablet | 1,166 | 76.3% |
| No Computing Device | 75 | 4.9% |
| Total | 1,529 | 100.0% |
Internet Access in Dell Rapids
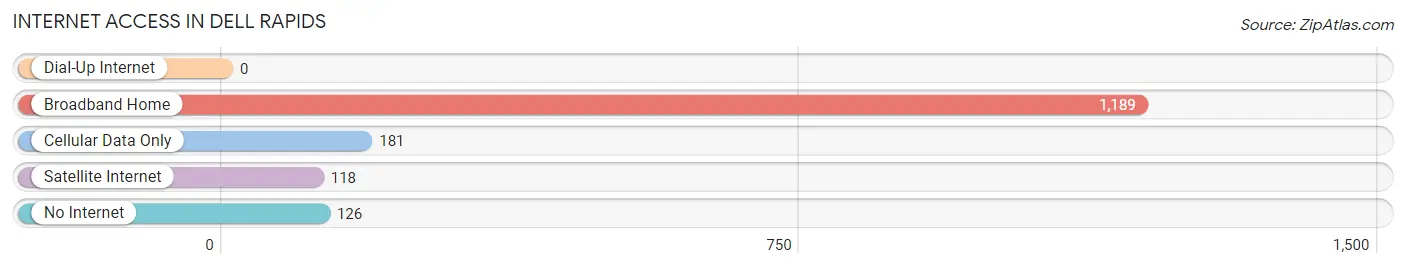
| Internet Type | # Households | % Households |
| Dial-Up Internet | 0 | 0.0% |
| Broadband Home | 1,189 | 77.8% |
| Cellular Data Only | 181 | 11.8% |
| Satellite Internet | 118 | 7.7% |
| No Internet | 126 | 8.2% |
| Total | 1,529 | 100.0% |
Dell Rapids Summary
Dell Rapids is a small city located in Minnehaha County, South Dakota. It is situated on the Big Sioux River, about 20 miles northwest of Sioux Falls. The city has a population of approximately 4,000 people and is part of the Sioux Falls Metropolitan Statistical Area.
History
Dell Rapids was founded in 1871 by a group of settlers from Wisconsin. The city was named after the rapids of the Big Sioux River, which were used to power a sawmill. The city was incorporated in 1883 and has since grown to become a thriving community.
The city has a rich history of industry and agriculture. In the late 19th century, Dell Rapids was home to a number of flour mills, sawmills, and other businesses. The city was also a major producer of brick and tile. In the early 20th century, the city was home to a number of dairy farms and other agricultural operations.
Geography
Dell Rapids is located in southeastern South Dakota, about 20 miles northwest of Sioux Falls. The city is situated on the Big Sioux River, which flows through the city. The city is surrounded by rolling hills and farmland.
The climate in Dell Rapids is typical of the Midwest, with hot summers and cold winters. The average temperature in the summer is around 80 degrees Fahrenheit, while the average temperature in the winter is around 20 degrees Fahrenheit.
Economy
Dell Rapids is a small city with a diverse economy. The city is home to a number of manufacturing and agricultural businesses, as well as a number of retail stores and restaurants. The city is also home to a number of medical and educational facilities.
The city is home to a number of large employers, including the Dell Rapids Manufacturing Company, which produces a variety of products, including furniture, cabinets, and other wood products. The city is also home to a number of smaller businesses, including a number of restaurants, retail stores, and other service-oriented businesses.
Demographics
As of the 2010 census, the population of Dell Rapids was 4,099. The racial makeup of the city was 95.3% White, 0.7% African American, 0.3% Native American, 0.7% Asian, 0.1% Pacific Islander, 1.2% from other races, and 1.9% from two or more races. Hispanic or Latino of any race were 3.2% of the population.
The median income for a household in Dell Rapids was $45,938, and the median income for a family was $54,844. The per capita income for the city was $21,945. About 8.2% of families and 10.3% of the population were below the poverty line, including 14.2% of those under age 18 and 6.2% of those age 65 or over.
Dell Rapids is a small city with a rich history and a diverse economy. The city is home to a number of businesses, including manufacturing, agriculture, retail, and medical and educational facilities. The city has a population of approximately 4,000 people and is part of the Sioux Falls Metropolitan Statistical Area.
Common Questions
What is Per Capita Income in Dell Rapids?
Per Capita income in Dell Rapids is $39,941.
What is the Median Family Income in Dell Rapids?
Median Family Income in Dell Rapids is $112,845.
What is the Median Household income in Dell Rapids?
Median Household Income in Dell Rapids is $88,958.
What is Income or Wage Gap in Dell Rapids?
Income or Wage Gap in Dell Rapids is 28.1%.
Women in Dell Rapids earn 71.9 cents for every dollar earned by a man.
What is Inequality or Gini Index in Dell Rapids?
Inequality or Gini Index in Dell Rapids is 0.35.
What is the Total Population of Dell Rapids?
Total Population of Dell Rapids is 3,953.
What is the Total Male Population of Dell Rapids?
Total Male Population of Dell Rapids is 1,882.
What is the Total Female Population of Dell Rapids?
Total Female Population of Dell Rapids is 2,071.
What is the Ratio of Males per 100 Females in Dell Rapids?
There are 90.87 Males per 100 Females in Dell Rapids.
What is the Ratio of Females per 100 Males in Dell Rapids?
There are 110.04 Females per 100 Males in Dell Rapids.
What is the Median Population Age in Dell Rapids?
Median Population Age in Dell Rapids is 38.7 Years.
What is the Average Family Size in Dell Rapids
Average Family Size in Dell Rapids is 3.0 People.
What is the Average Household Size in Dell Rapids
Average Household Size in Dell Rapids is 2.5 People.
How Large is the Labor Force in Dell Rapids?
There are 2,054 People in the Labor Forcein in Dell Rapids.
What is the Percentage of People in the Labor Force in Dell Rapids?
67.8% of People are in the Labor Force in Dell Rapids.
What is the Unemployment Rate in Dell Rapids?
Unemployment Rate in Dell Rapids is 1.3%.