Lead, SD Map & Demographics
Lead Map
Lead Overview
$33,471
PER CAPITA INCOME
$80,169
AVG FAMILY INCOME
$54,555
AVG HOUSEHOLD INCOME
21.3%
WAGE / INCOME GAP [ % ]
78.7¢/ $1
WAGE / INCOME GAP [ $ ]
0.41
INEQUALITY / GINI INDEX
2,993
TOTAL POPULATION
1,350
MALE POPULATION
1,643
FEMALE POPULATION
82.17
MALES / 100 FEMALES
121.70
FEMALES / 100 MALES
45.5
MEDIAN AGE
2.9
AVG FAMILY SIZE
2.1
AVG HOUSEHOLD SIZE
1,666
LABOR FORCE [ PEOPLE ]
65.4%
PERCENT IN LABOR FORCE
Lead Zip Codes
Lead Area Codes
Income in Lead
Income Overview in Lead
Per Capita Income in Lead is $33,471, while median incomes of families and households are $80,169 and $54,555 respectively.
| Characteristic | Number | Measure |
| Per Capita Income | 2,993 | $33,471 |
| Median Family Income | 747 | $80,169 |
| Mean Family Income | 747 | $88,150 |
| Median Household Income | 1,451 | $54,555 |
| Mean Household Income | 1,451 | $67,830 |
| Income Deficit | 747 | $0 |
| Wage / Income Gap (%) | 2,993 | 21.28% |
| Wage / Income Gap ($) | 2,993 | 78.72¢ per $1 |
| Gini / Inequality Index | 2,993 | 0.41 |
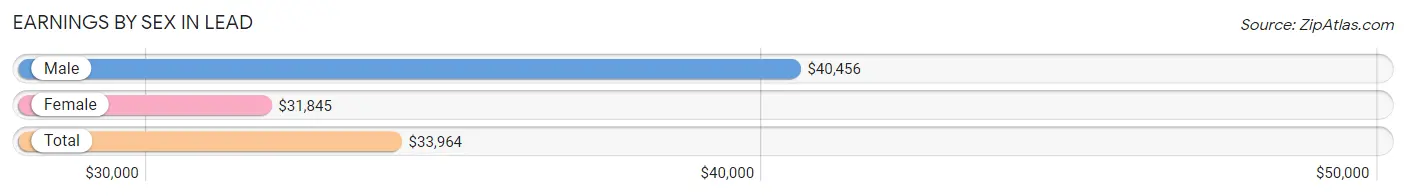
Earnings by Sex in Lead
Average Earnings in Lead are $33,964, $40,456 for men and $31,845 for women, a difference of 21.3%.
| Sex | Number | Average Earnings |
| Male | 887 (48.7%) | $40,456 |
| Female | 933 (51.3%) | $31,845 |
| Total | 1,820 (100.0%) | $33,964 |
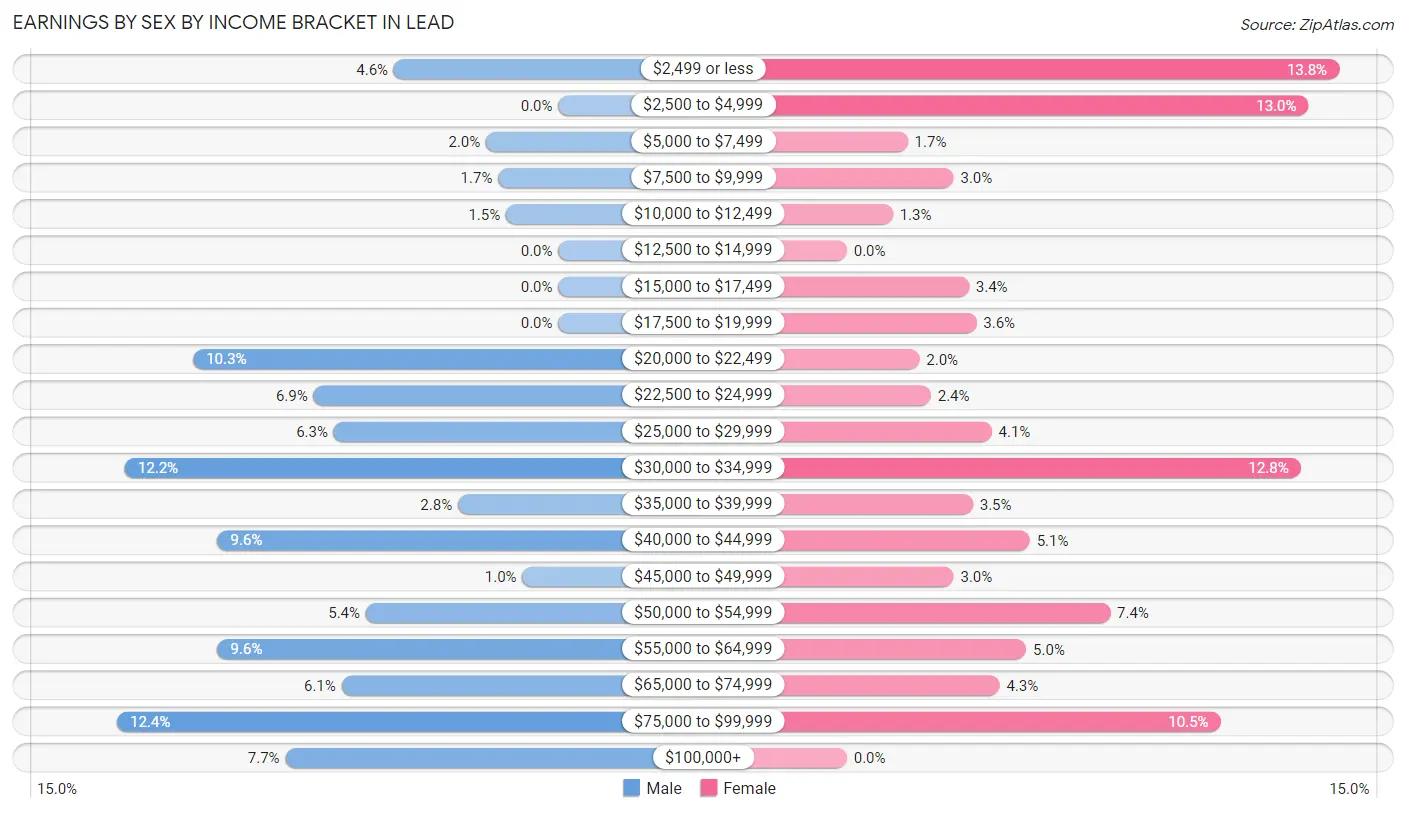
Earnings by Sex by Income Bracket in Lead
The most common earnings brackets in Lead are $75,000 to $99,999 for men (110 | 12.4%) and $2,499 or less for women (129 | 13.8%).
| Income | Male | Female |
| $2,499 or less | 41 (4.6%) | 129 (13.8%) |
| $2,500 to $4,999 | 0 (0.0%) | 121 (13.0%) |
| $5,000 to $7,499 | 18 (2.0%) | 16 (1.7%) |
| $7,500 to $9,999 | 15 (1.7%) | 28 (3.0%) |
| $10,000 to $12,499 | 13 (1.5%) | 12 (1.3%) |
| $12,500 to $14,999 | 0 (0.0%) | 0 (0.0%) |
| $15,000 to $17,499 | 0 (0.0%) | 32 (3.4%) |
| $17,500 to $19,999 | 0 (0.0%) | 34 (3.6%) |
| $20,000 to $22,499 | 91 (10.3%) | 19 (2.0%) |
| $22,500 to $24,999 | 61 (6.9%) | 22 (2.4%) |
| $25,000 to $29,999 | 56 (6.3%) | 38 (4.1%) |
| $30,000 to $34,999 | 108 (12.2%) | 119 (12.8%) |
| $35,000 to $39,999 | 25 (2.8%) | 33 (3.5%) |
| $40,000 to $44,999 | 85 (9.6%) | 48 (5.1%) |
| $45,000 to $49,999 | 9 (1.0%) | 28 (3.0%) |
| $50,000 to $54,999 | 48 (5.4%) | 69 (7.4%) |
| $55,000 to $64,999 | 85 (9.6%) | 47 (5.0%) |
| $65,000 to $74,999 | 54 (6.1%) | 40 (4.3%) |
| $75,000 to $99,999 | 110 (12.4%) | 98 (10.5%) |
| $100,000+ | 68 (7.7%) | 0 (0.0%) |
| Total | 887 (100.0%) | 933 (100.0%) |
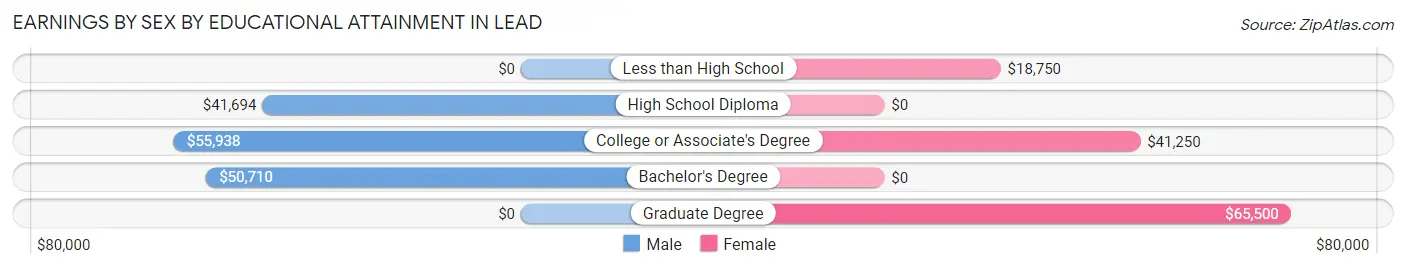
Earnings by Sex by Educational Attainment in Lead
Average earnings in Lead are $50,104 for men and $33,023 for women, a difference of 34.1%. Men with an educational attainment of college or associate's degree enjoy the highest average annual earnings of $55,938, while those with high school diploma education earn the least with $41,694. Women with an educational attainment of graduate degree earn the most with the average annual earnings of $65,500, while those with less than high school education have the smallest earnings of $18,750.
| Educational Attainment | Male Income | Female Income |
| Less than High School | - | - |
| High School Diploma | $41,694 | $0 |
| College or Associate's Degree | $55,938 | $41,250 |
| Bachelor's Degree | $50,710 | $0 |
| Graduate Degree | - | - |
| Total | $50,104 | $33,023 |
Family Income in Lead
Family Income Brackets in Lead
According to the Lead family income data, there are 157 families falling into the $150,000 to $199,999 income range, which is the most common income bracket and makes up 21.0% of all families.
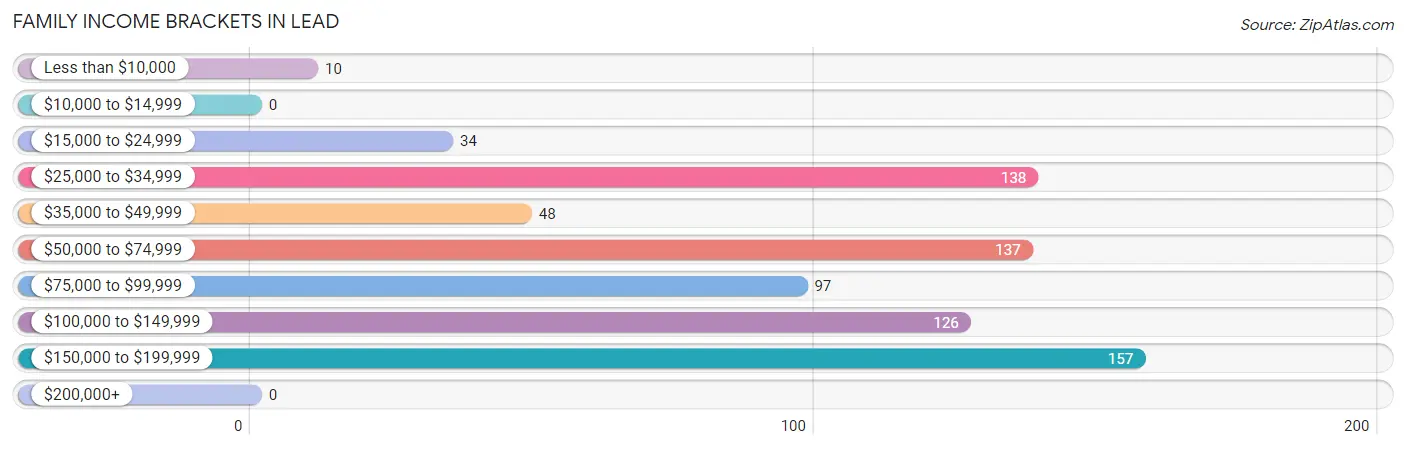
| Income Bracket | # Families | % Families |
| Less than $10,000 | 10 | 1.3% |
| $10,000 to $14,999 | 0 | 0.0% |
| $15,000 to $24,999 | 34 | 4.6% |
| $25,000 to $34,999 | 138 | 18.5% |
| $35,000 to $49,999 | 48 | 6.4% |
| $50,000 to $74,999 | 137 | 18.3% |
| $75,000 to $99,999 | 97 | 13.0% |
| $100,000 to $149,999 | 126 | 16.9% |
| $150,000 to $199,999 | 157 | 21.0% |
| $200,000+ | 0 | 0.0% |
Family Income by Famaliy Size in Lead
4-person families (148 | 19.8%) account for the highest median family income in Lead with $145,938 per family, while 4-person families (148 | 19.8%) have the highest median income of $36,484 per family member.
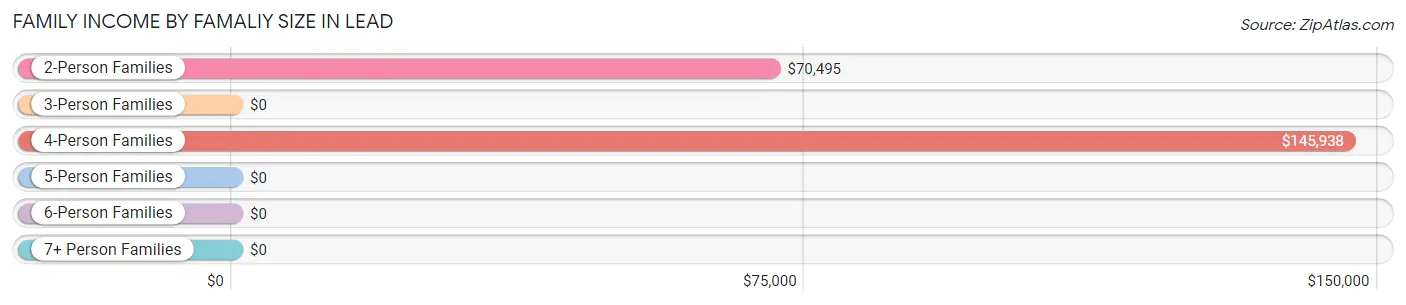
| Income Bracket | # Families | Median Income |
| 2-Person Families | 455 (60.9%) | $70,495 |
| 3-Person Families | 94 (12.6%) | $0 |
| 4-Person Families | 148 (19.8%) | $145,938 |
| 5-Person Families | 38 (5.1%) | $0 |
| 6-Person Families | 12 (1.6%) | $0 |
| 7+ Person Families | 0 (0.0%) | $0 |
| Total | 747 (100.0%) | $80,169 |
Family Income by Number of Earners in Lead
The median family income in Lead is $80,169, with families comprising 3+ earners (98) having the highest median family income of $165,913, while families with no earners (79) have the lowest median family income of $29,744, accounting for 13.1% and 10.6% of families, respectively.
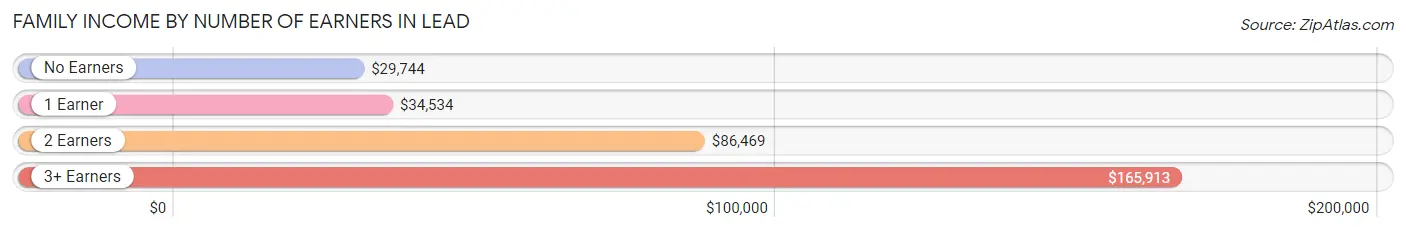
| Number of Earners | # Families | Median Income |
| No Earners | 79 (10.6%) | $29,744 |
| 1 Earner | 209 (28.0%) | $34,534 |
| 2 Earners | 361 (48.3%) | $86,469 |
| 3+ Earners | 98 (13.1%) | $165,913 |
| Total | 747 (100.0%) | $80,169 |
Household Income in Lead
Household Income Brackets in Lead
With 255 households falling in the category, the $25,000 to $34,999 income range is the most frequent in Lead, accounting for 17.6% of all households. In contrast, only 1 households (0.1%) fall into the $200,000+ income bracket, making it the least populous group.
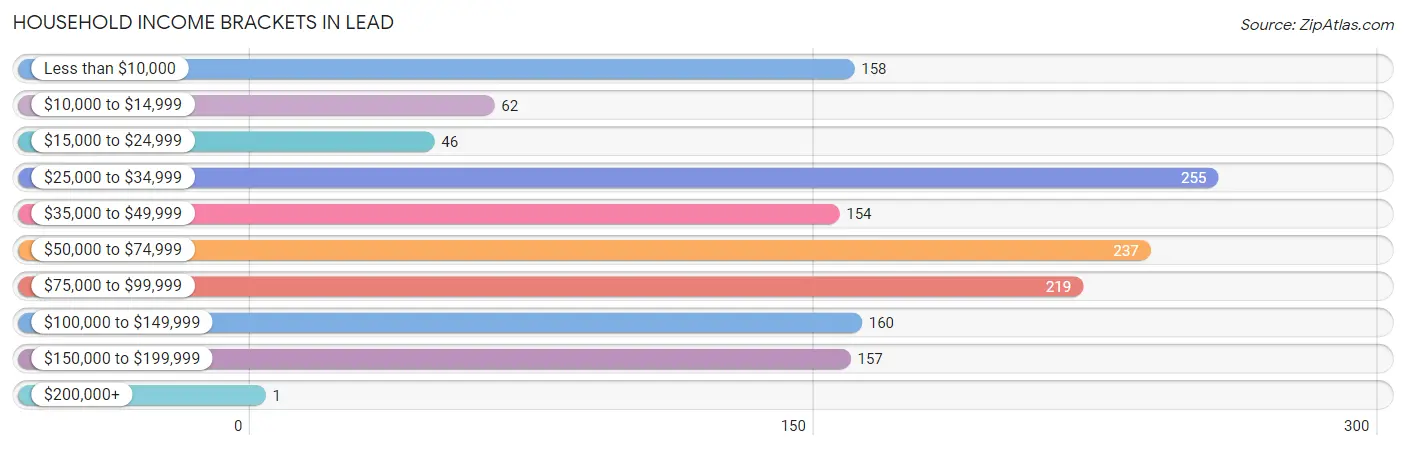
| Income Bracket | # Households | % Households |
| Less than $10,000 | 158 | 10.9% |
| $10,000 to $14,999 | 62 | 4.3% |
| $15,000 to $24,999 | 46 | 3.2% |
| $25,000 to $34,999 | 255 | 17.6% |
| $35,000 to $49,999 | 154 | 10.6% |
| $50,000 to $74,999 | 237 | 16.3% |
| $75,000 to $99,999 | 219 | 15.1% |
| $100,000 to $149,999 | 160 | 11.0% |
| $150,000 to $199,999 | 157 | 10.8% |
| $200,000+ | 1 | 0.1% |
Household Income by Householder Age in Lead
The median household income in Lead is $54,555, with the highest median household income of $72,061 found in the 45 to 64 years age bracket for the primary householder. A total of 401 households (27.6%) fall into this category. Meanwhile, the 15 to 24 years age bracket for the primary householder has the lowest median household income of $0, with 47 households (3.2%) in this group.
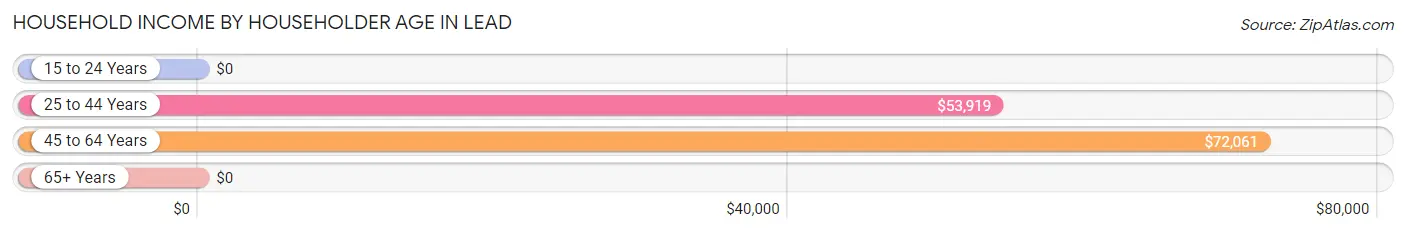
| Income Bracket | # Households | Median Income |
| 15 to 24 Years | 47 (3.2%) | $0 |
| 25 to 44 Years | 461 (31.8%) | $53,919 |
| 45 to 64 Years | 401 (27.6%) | $72,061 |
| 65+ Years | 542 (37.3%) | $0 |
| Total | 1,451 (100.0%) | $54,555 |
Poverty in Lead
Income Below Poverty by Sex and Age in Lead
With 7.6% poverty level for males and 17.1% for females among the residents of Lead, under 5 year old males and 18 to 24 year old females are the most vulnerable to poverty, with 46 males (43.0%) and 52 females (70.3%) in their respective age groups living below the poverty level.
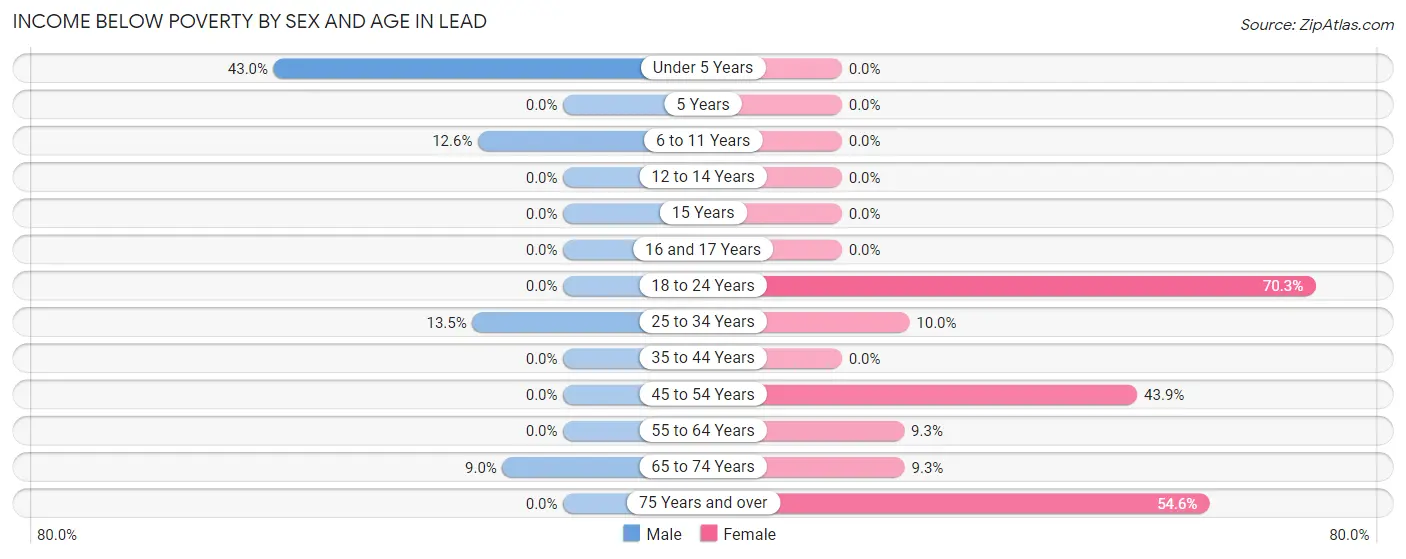
| Age Bracket | Male | Female |
| Under 5 Years | 46 (43.0%) | 0 (0.0%) |
| 5 Years | 0 (0.0%) | 0 (0.0%) |
| 6 to 11 Years | 11 (12.6%) | 0 (0.0%) |
| 12 to 14 Years | 0 (0.0%) | 0 (0.0%) |
| 15 Years | 0 (0.0%) | 0 (0.0%) |
| 16 and 17 Years | 0 (0.0%) | 0 (0.0%) |
| 18 to 24 Years | 0 (0.0%) | 52 (70.3%) |
| 25 to 34 Years | 24 (13.5%) | 31 (10.0%) |
| 35 to 44 Years | 0 (0.0%) | 0 (0.0%) |
| 45 to 54 Years | 0 (0.0%) | 25 (43.9%) |
| 55 to 64 Years | 0 (0.0%) | 34 (9.3%) |
| 65 to 74 Years | 21 (9.0%) | 25 (9.3%) |
| 75 Years and over | 0 (0.0%) | 114 (54.5%) |
| Total | 102 (7.6%) | 281 (17.1%) |
Income Above Poverty by Sex and Age in Lead
According to the poverty statistics in Lead, males aged 5 years and females aged under 5 years are the age groups that are most secure financially, with 100.0% of males and 100.0% of females in these age groups living above the poverty line.
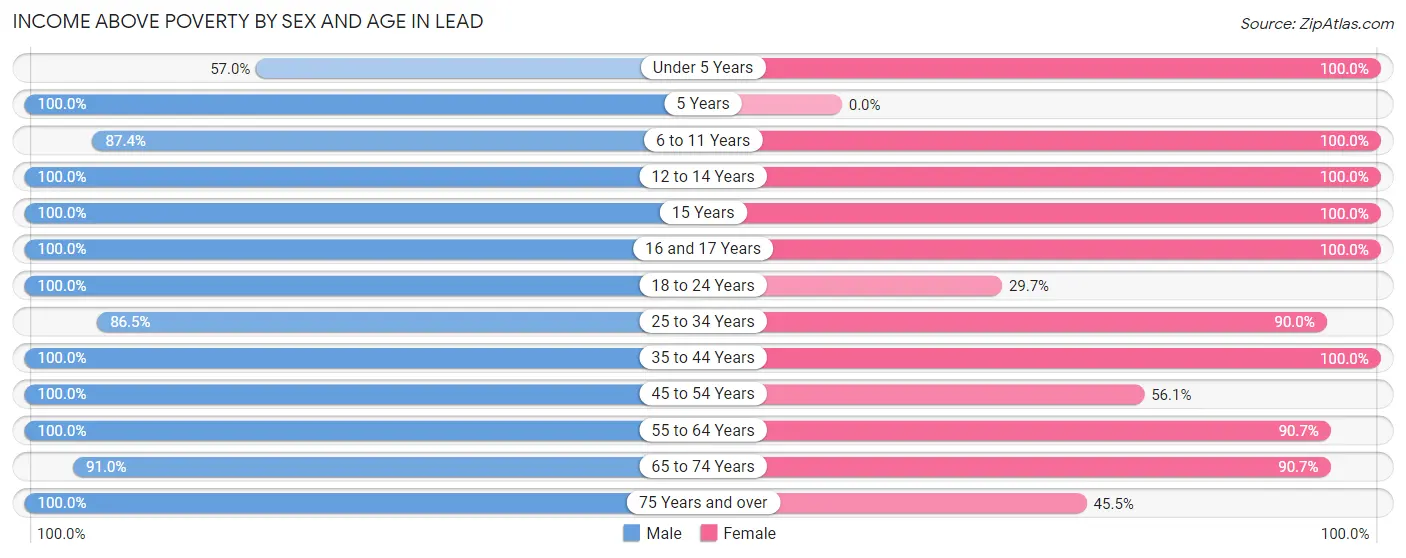
| Age Bracket | Male | Female |
| Under 5 Years | 61 (57.0%) | 14 (100.0%) |
| 5 Years | 12 (100.0%) | 0 (0.0%) |
| 6 to 11 Years | 76 (87.4%) | 62 (100.0%) |
| 12 to 14 Years | 12 (100.0%) | 98 (100.0%) |
| 15 Years | 10 (100.0%) | 40 (100.0%) |
| 16 and 17 Years | 26 (100.0%) | 9 (100.0%) |
| 18 to 24 Years | 132 (100.0%) | 22 (29.7%) |
| 25 to 34 Years | 154 (86.5%) | 278 (90.0%) |
| 35 to 44 Years | 157 (100.0%) | 136 (100.0%) |
| 45 to 54 Years | 102 (100.0%) | 32 (56.1%) |
| 55 to 64 Years | 195 (100.0%) | 333 (90.7%) |
| 65 to 74 Years | 212 (91.0%) | 243 (90.7%) |
| 75 Years and over | 93 (100.0%) | 95 (45.5%) |
| Total | 1,242 (92.4%) | 1,362 (82.9%) |
Income Below Poverty Among Married-Couple Families in Lead
The poverty statistics for married-couple families in Lead show that 4.0% or 24 of the total 594 families live below the poverty line. Families with 1 or 2 children have the highest poverty rate of 21.8%, comprising of 24 families. On the other hand, families with no children have the lowest poverty rate of 0.0%, which includes 0 families.
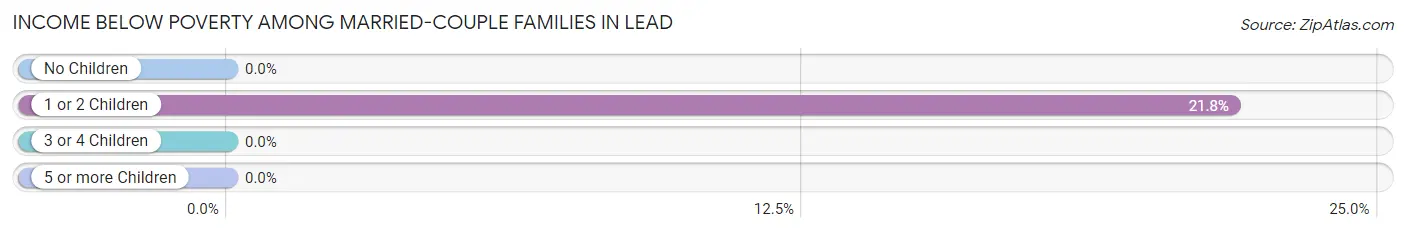
| Children | Above Poverty | Below Poverty |
| No Children | 434 (100.0%) | 0 (0.0%) |
| 1 or 2 Children | 86 (78.2%) | 24 (21.8%) |
| 3 or 4 Children | 50 (100.0%) | 0 (0.0%) |
| 5 or more Children | 0 (0.0%) | 0 (0.0%) |
| Total | 570 (96.0%) | 24 (4.0%) |
Income Below Poverty Among Single-Parent Households in Lead
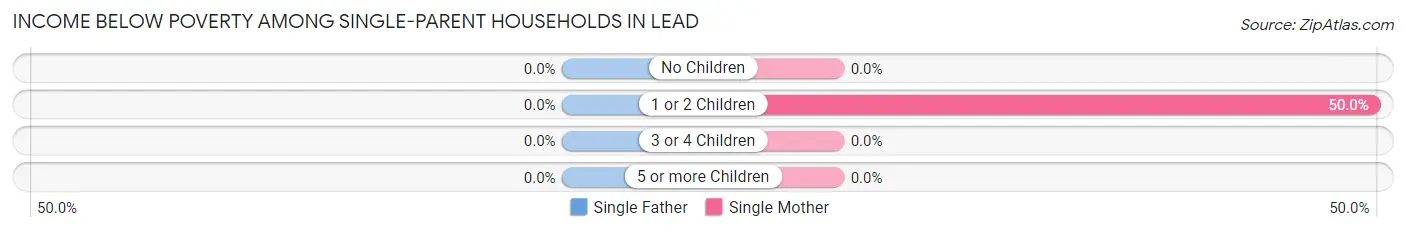
| Children | Single Father | Single Mother |
| No Children | 0 (0.0%) | 0 (0.0%) |
| 1 or 2 Children | 0 (0.0%) | 10 (50.0%) |
| 3 or 4 Children | 0 (0.0%) | 0 (0.0%) |
| 5 or more Children | 0 (0.0%) | 0 (0.0%) |
| Total | 0 (0.0%) | 10 (14.7%) |
Income Below Poverty Among Married-Couple vs Single-Parent Households in Lead
The poverty data for Lead shows that 24 of the married-couple family households (4.0%) and 10 of the single-parent households (6.5%) are living below the poverty level. Within the married-couple family households, those with 1 or 2 children have the highest poverty rate, with 24 households (21.8%) falling below the poverty line. Among the single-parent households, those with 1 or 2 children have the highest poverty rate, with 10 household (27.0%) living below poverty.
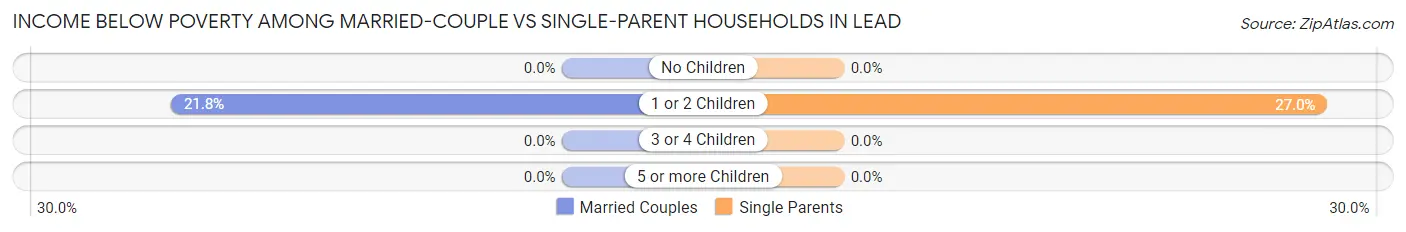
| Children | Married-Couple Families | Single-Parent Households |
| No Children | 0 (0.0%) | 0 (0.0%) |
| 1 or 2 Children | 24 (21.8%) | 10 (27.0%) |
| 3 or 4 Children | 0 (0.0%) | 0 (0.0%) |
| 5 or more Children | 0 (0.0%) | 0 (0.0%) |
| Total | 24 (4.0%) | 10 (6.5%) |
Race in Lead
The most populous races in Lead are White / Caucasian (2,892 | 96.6%), Two or more Races (61 | 2.0%), and Native / Alaskan (40 | 1.3%).
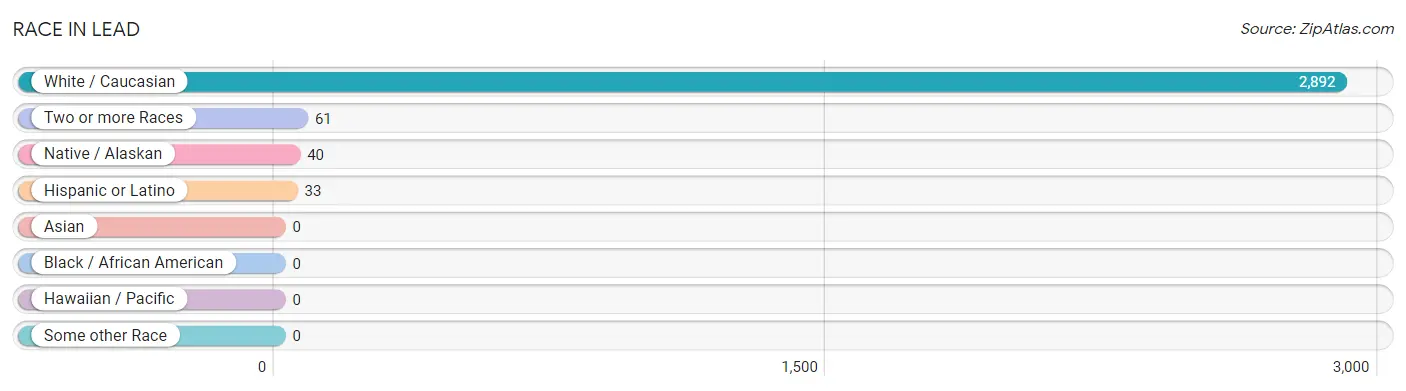
| Race | # Population | % Population |
| Asian | 0 | 0.0% |
| Black / African American | 0 | 0.0% |
| Hawaiian / Pacific | 0 | 0.0% |
| Hispanic or Latino | 33 | 1.1% |
| Native / Alaskan | 40 | 1.3% |
| White / Caucasian | 2,892 | 96.6% |
| Two or more Races | 61 | 2.0% |
| Some other Race | 0 | 0.0% |
| Total | 2,993 | 100.0% |
Ancestry in Lead
The most populous ancestries reported in Lead are German (855 | 28.6%), Irish (514 | 17.2%), English (388 | 13.0%), Norwegian (251 | 8.4%), and American (190 | 6.4%), together accounting for 73.4% of all Lead residents.
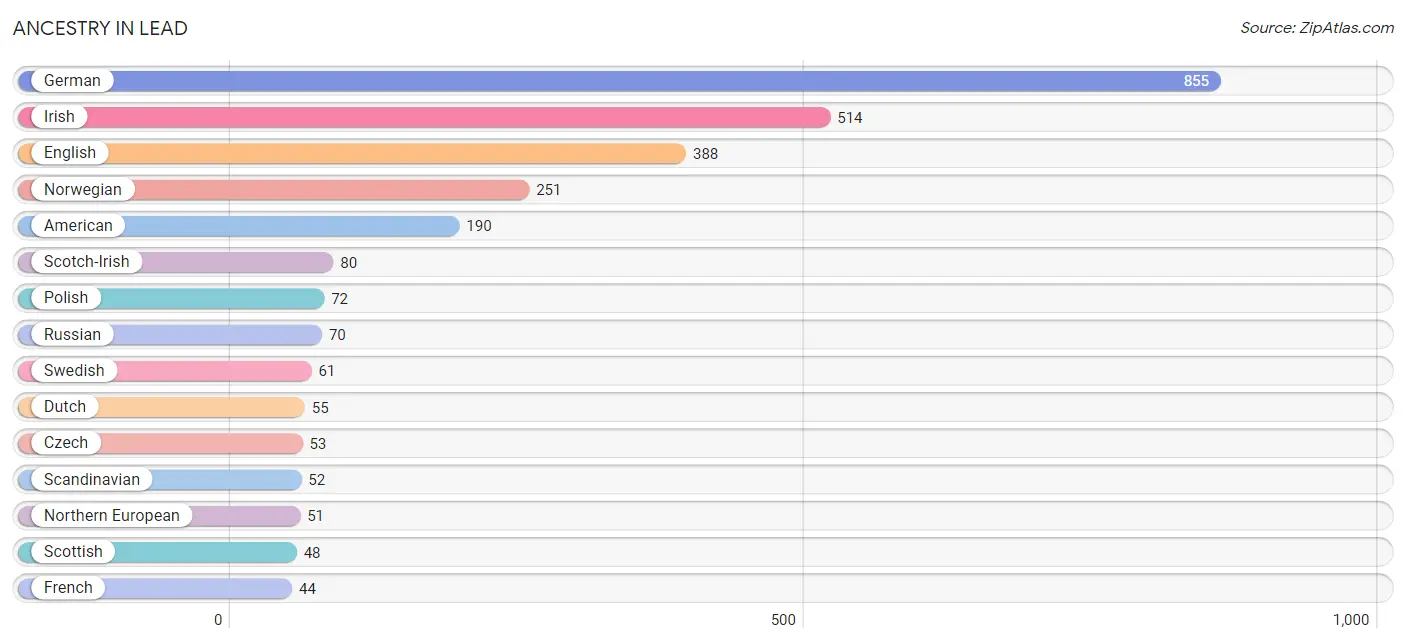
| Ancestry | # Population | % Population |
| American | 190 | 6.4% |
| Austrian | 1 | 0.0% |
| Belgian | 4 | 0.1% |
| Czech | 53 | 1.8% |
| Danish | 9 | 0.3% |
| Dutch | 55 | 1.8% |
| English | 388 | 13.0% |
| Finnish | 7 | 0.2% |
| French | 44 | 1.5% |
| German | 855 | 28.6% |
| Icelander | 4 | 0.1% |
| Irish | 514 | 17.2% |
| Italian | 16 | 0.5% |
| Luxembourger | 17 | 0.6% |
| Mexican | 1 | 0.0% |
| Northern European | 51 | 1.7% |
| Norwegian | 251 | 8.4% |
| Polish | 72 | 2.4% |
| Russian | 70 | 2.3% |
| Scandinavian | 52 | 1.7% |
| Scotch-Irish | 80 | 2.7% |
| Scottish | 48 | 1.6% |
| Sioux | 40 | 1.3% |
| Spaniard | 14 | 0.5% |
| Spanish | 18 | 0.6% |
| Swedish | 61 | 2.0% |
| Welsh | 16 | 0.5% | View All 27 Rows |
Immigrants in Lead

| Immigration Origin | # Population | % Population | View All 0 Rows |
Sex and Age in Lead
Sex and Age in Lead
The most populous age groups in Lead are 65 to 69 Years (164 | 12.1%) for men and 60 to 64 Years (235 | 14.3%) for women.
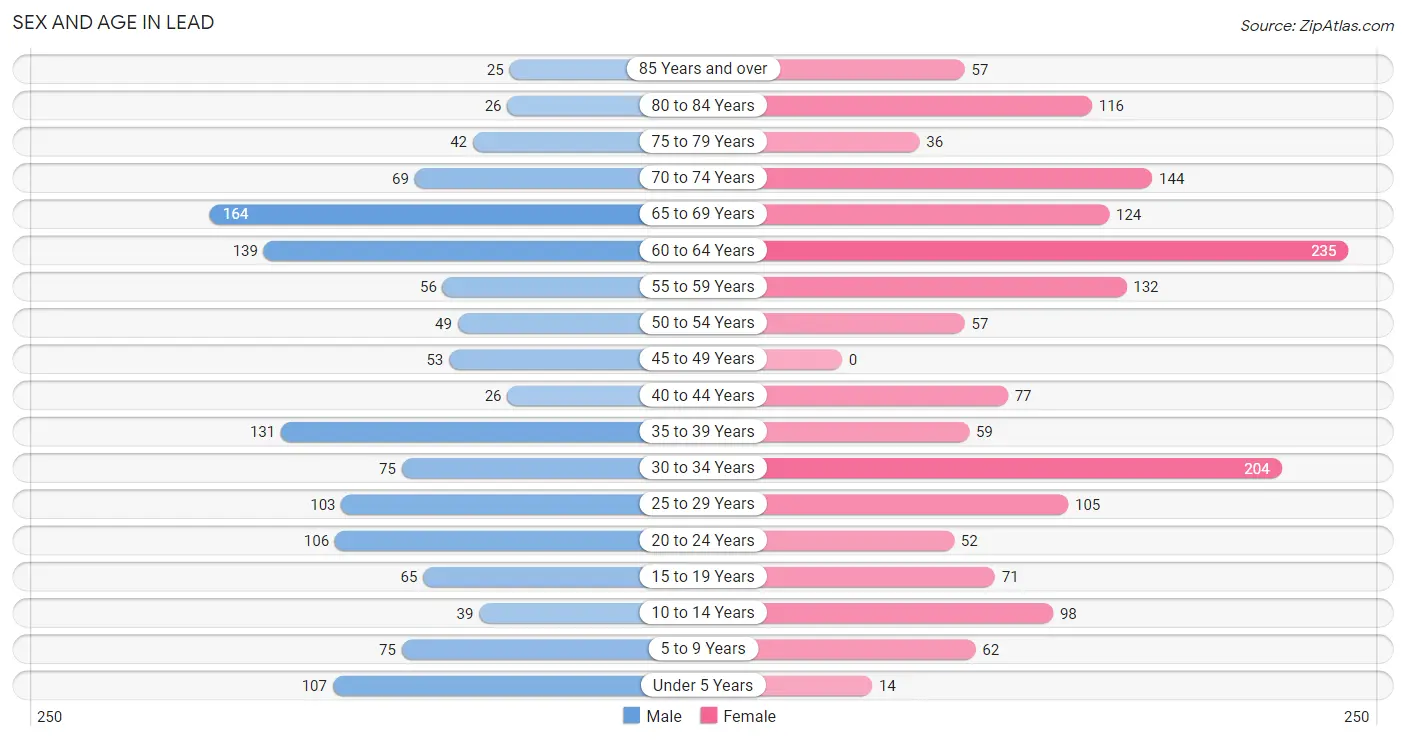
| Age Bracket | Male | Female |
| Under 5 Years | 107 (7.9%) | 14 (0.9%) |
| 5 to 9 Years | 75 (5.6%) | 62 (3.8%) |
| 10 to 14 Years | 39 (2.9%) | 98 (6.0%) |
| 15 to 19 Years | 65 (4.8%) | 71 (4.3%) |
| 20 to 24 Years | 106 (7.9%) | 52 (3.2%) |
| 25 to 29 Years | 103 (7.6%) | 105 (6.4%) |
| 30 to 34 Years | 75 (5.6%) | 204 (12.4%) |
| 35 to 39 Years | 131 (9.7%) | 59 (3.6%) |
| 40 to 44 Years | 26 (1.9%) | 77 (4.7%) |
| 45 to 49 Years | 53 (3.9%) | 0 (0.0%) |
| 50 to 54 Years | 49 (3.6%) | 57 (3.5%) |
| 55 to 59 Years | 56 (4.2%) | 132 (8.0%) |
| 60 to 64 Years | 139 (10.3%) | 235 (14.3%) |
| 65 to 69 Years | 164 (12.1%) | 124 (7.5%) |
| 70 to 74 Years | 69 (5.1%) | 144 (8.8%) |
| 75 to 79 Years | 42 (3.1%) | 36 (2.2%) |
| 80 to 84 Years | 26 (1.9%) | 116 (7.1%) |
| 85 Years and over | 25 (1.8%) | 57 (3.5%) |
| Total | 1,350 (100.0%) | 1,643 (100.0%) |
Families and Households in Lead
Median Family Size in Lead
The median family size in Lead is 2.91 persons per family, with single female/mother families (68 | 9.1%) accounting for the largest median family size of 3.04 persons per family. On the other hand, single male/father families (85 | 11.4%) represent the smallest median family size with 2.45 persons per family.
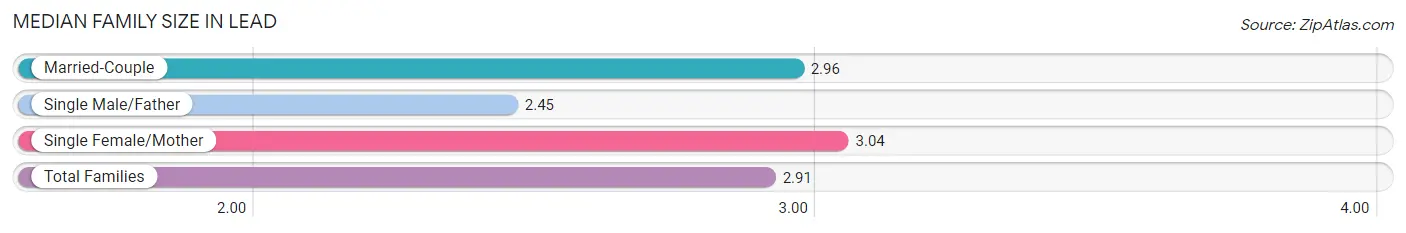
| Family Type | # Families | Family Size |
| Married-Couple | 594 (79.5%) | 2.96 |
| Single Male/Father | 85 (11.4%) | 2.45 |
| Single Female/Mother | 68 (9.1%) | 3.04 |
| Total Families | 747 (100.0%) | 2.91 |
Median Household Size in Lead
The median household size in Lead is 2.06 persons per household, with single female/mother households (68 | 4.7%) accounting for the largest median household size of 3.04 persons per household. non-family households (704 | 48.5%) represent the smallest median household size with 1.12 persons per household.
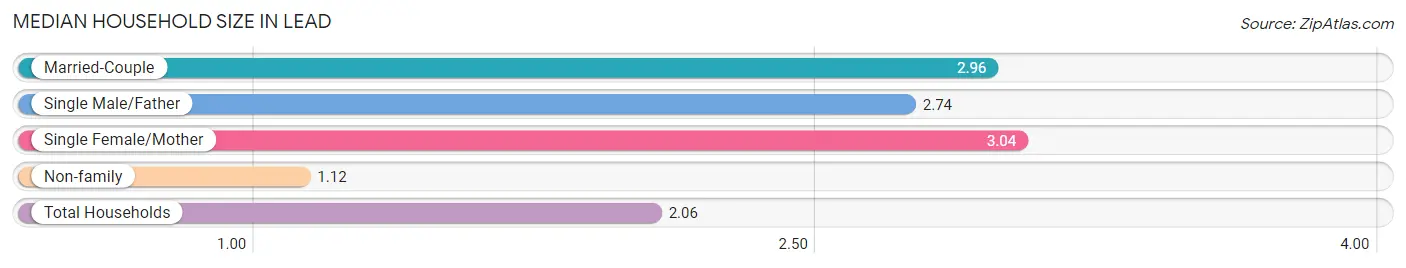
| Household Type | # Households | Household Size |
| Married-Couple | 594 (40.9%) | 2.96 |
| Single Male/Father | 85 (5.9%) | 2.74 |
| Single Female/Mother | 68 (4.7%) | 3.04 |
| Non-family | 704 (48.5%) | 1.12 |
| Total Households | 1,451 (100.0%) | 2.06 |
Household Size by Marriage Status in Lead
Out of a total of 1,451 households in Lead, 747 (51.5%) are family households, while 704 (48.5%) are nonfamily households. The most numerous type of family households are 2-person households, comprising 441, and the most common type of nonfamily households are 1-person households, comprising 628.
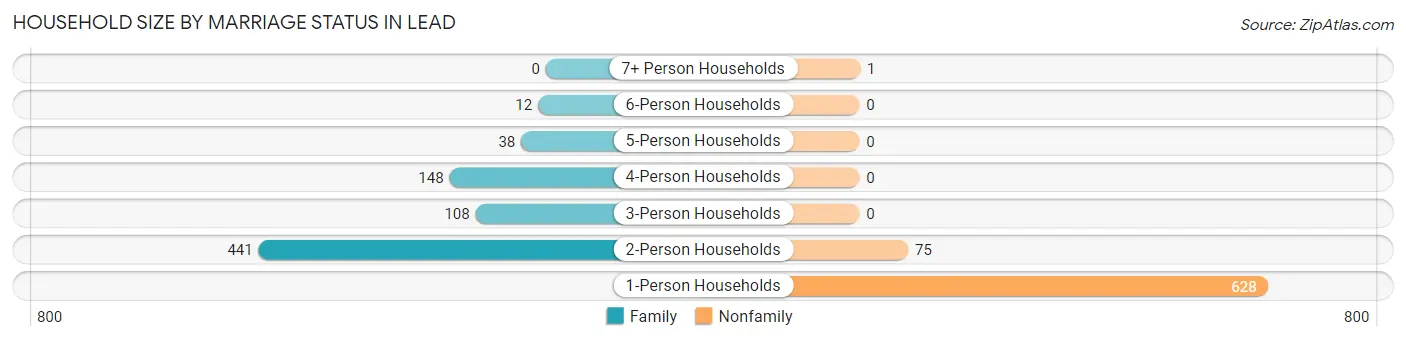
| Household Size | Family Households | Nonfamily Households |
| 1-Person Households | - | 628 (43.3%) |
| 2-Person Households | 441 (30.4%) | 75 (5.2%) |
| 3-Person Households | 108 (7.4%) | 0 (0.0%) |
| 4-Person Households | 148 (10.2%) | 0 (0.0%) |
| 5-Person Households | 38 (2.6%) | 0 (0.0%) |
| 6-Person Households | 12 (0.8%) | 0 (0.0%) |
| 7+ Person Households | 0 (0.0%) | 1 (0.1%) |
| Total | 747 (51.5%) | 704 (48.5%) |
Female Fertility in Lead
Fertility by Age in Lead
Average fertility rate in Lead is 79.0 births per 1,000 women. Women in the age bracket of 20 to 34 years have the highest fertility rate with 125.0 births per 1,000 women. Women in the age bracket of 20 to 34 years acount for 100.0% of all women with births.
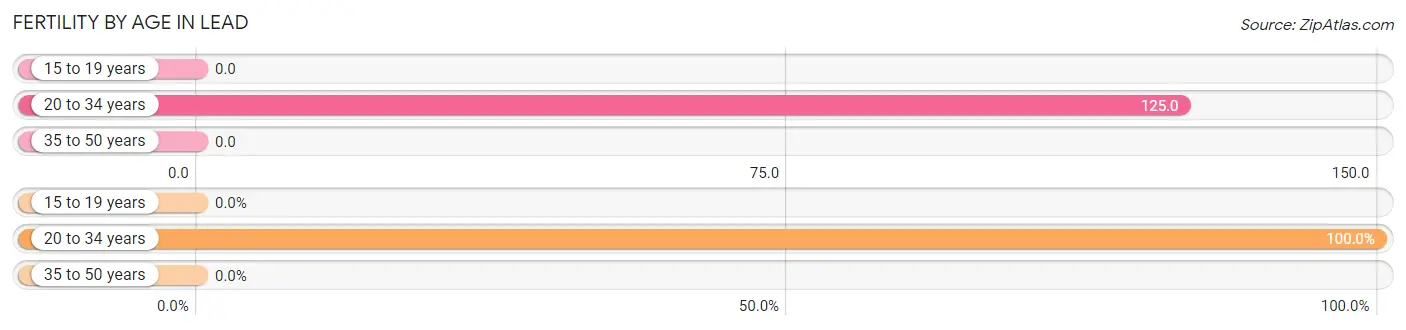
| Age Bracket | Women with Births | Births / 1,000 Women |
| 15 to 19 years | 0 (0.0%) | 0.0 |
| 20 to 34 years | 45 (100.0%) | 125.0 |
| 35 to 50 years | 0 (0.0%) | 0.0 |
| Total | 45 (100.0%) | 79.0 |
Fertility by Age by Marriage Status in Lead
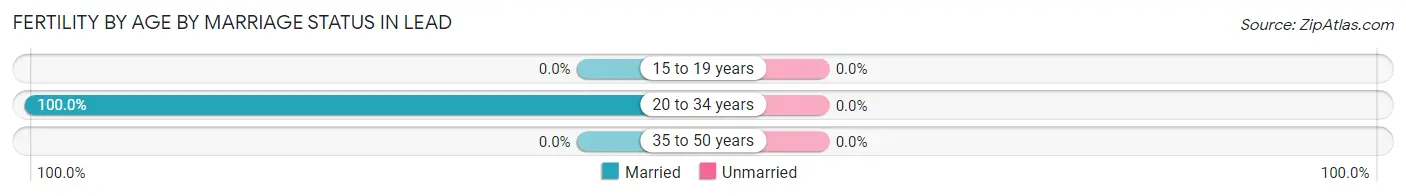
| Age Bracket | Married | Unmarried |
| 15 to 19 years | 0 (0.0%) | 0 (0.0%) |
| 20 to 34 years | 45 (100.0%) | 0 (0.0%) |
| 35 to 50 years | 0 (0.0%) | 0 (0.0%) |
| Total | 45 (100.0%) | 0 (0.0%) |
Fertility by Education in Lead
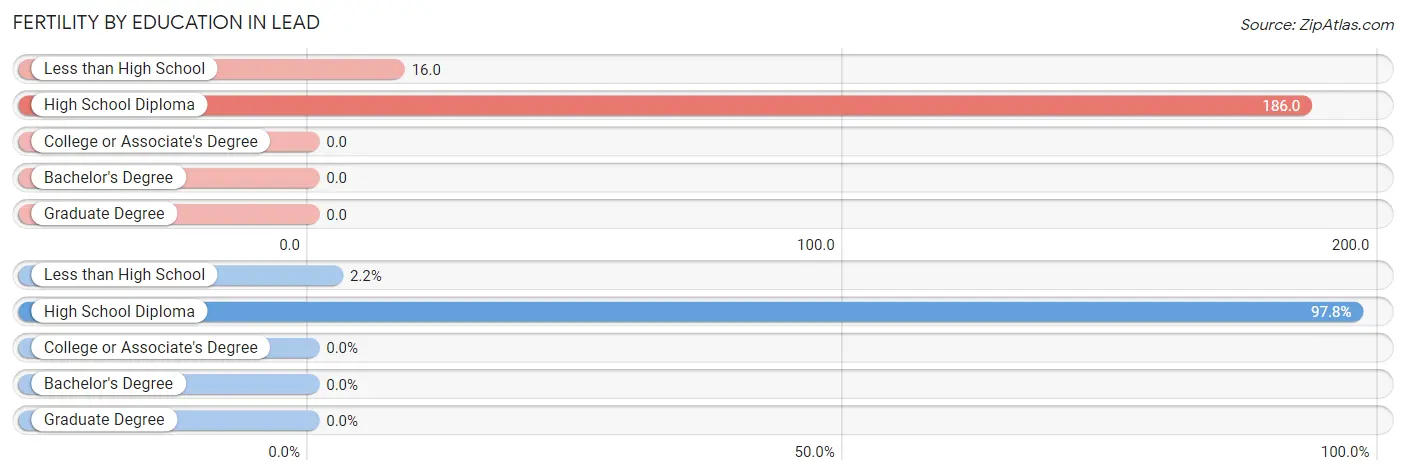
| Educational Attainment | Women with Births | Births / 1,000 Women |
| Less than High School | 1 (2.2%) | 16.0 |
| High School Diploma | 44 (97.8%) | 186.0 |
| College or Associate's Degree | 0 (0.0%) | 0.0 |
| Bachelor's Degree | 0 (0.0%) | 0.0 |
| Graduate Degree | 0 (0.0%) | 0.0 |
| Total | 45 (100.0%) | 79.0 |
Fertility by Education by Marriage Status in Lead
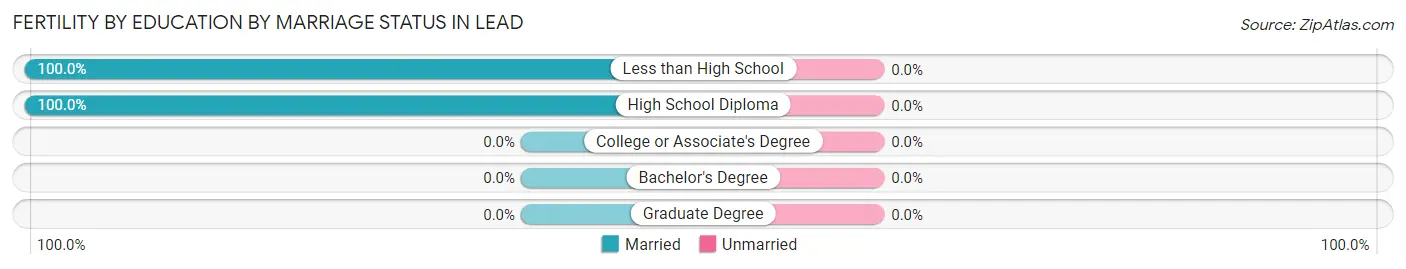
| Educational Attainment | Married | Unmarried |
| Less than High School | 1 (100.0%) | 0 (0.0%) |
| High School Diploma | 44 (100.0%) | 0 (0.0%) |
| College or Associate's Degree | 0 (0.0%) | 0 (0.0%) |
| Bachelor's Degree | 0 (0.0%) | 0 (0.0%) |
| Graduate Degree | 0 (0.0%) | 0 (0.0%) |
| Total | 45 (100.0%) | 0 (0.0%) |
Employment Characteristics in Lead
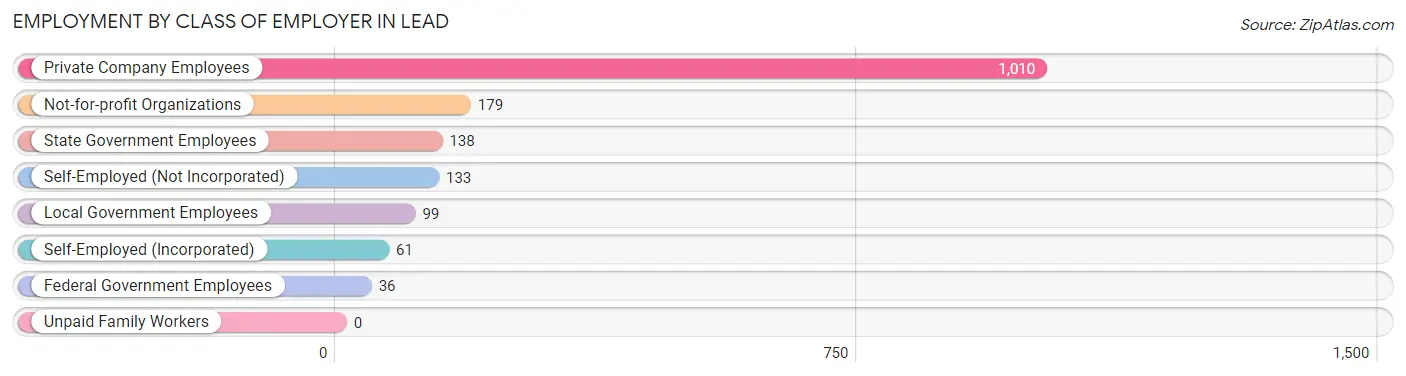
Employment by Class of Employer in Lead
Among the 1,656 employed individuals in Lead, private company employees (1,010 | 61.0%), not-for-profit organizations (179 | 10.8%), and state government employees (138 | 8.3%) make up the most common classes of employment.
| Employer Class | # Employees | % Employees |
| Private Company Employees | 1,010 | 61.0% |
| Self-Employed (Incorporated) | 61 | 3.7% |
| Self-Employed (Not Incorporated) | 133 | 8.0% |
| Not-for-profit Organizations | 179 | 10.8% |
| Local Government Employees | 99 | 6.0% |
| State Government Employees | 138 | 8.3% |
| Federal Government Employees | 36 | 2.2% |
| Unpaid Family Workers | 0 | 0.0% |
| Total | 1,656 | 100.0% |
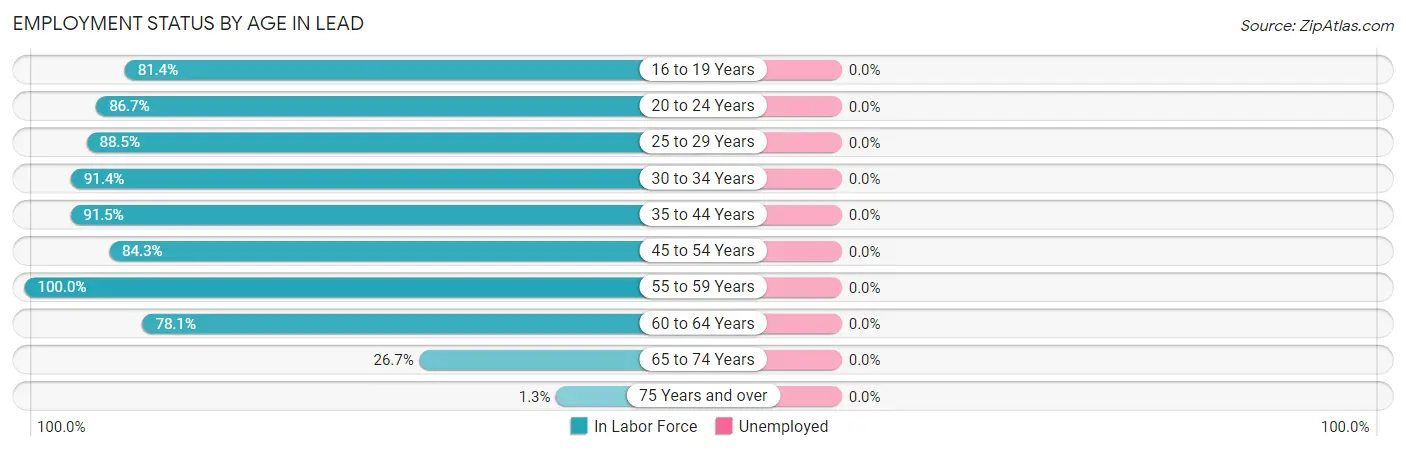
Employment Status by Age in Lead
| Age Bracket | In Labor Force | Unemployed |
| 16 to 19 Years | 70 (81.4%) | 0 (0.0%) |
| 20 to 24 Years | 137 (86.7%) | 0 (0.0%) |
| 25 to 29 Years | 184 (88.5%) | 0 (0.0%) |
| 30 to 34 Years | 255 (91.4%) | 0 (0.0%) |
| 35 to 44 Years | 268 (91.5%) | 0 (0.0%) |
| 45 to 54 Years | 134 (84.3%) | 0 (0.0%) |
| 55 to 59 Years | 188 (100.0%) | 0 (0.0%) |
| 60 to 64 Years | 292 (78.1%) | 0 (0.0%) |
| 65 to 74 Years | 134 (26.7%) | 0 (0.0%) |
| 75 Years and over | 4 (1.3%) | 0 (0.0%) |
| Total | 1,666 (65.4%) | 0 (0.0%) |
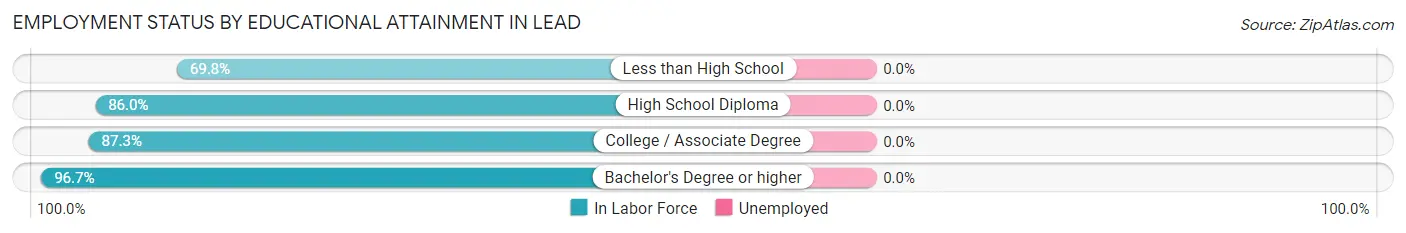
Employment Status by Educational Attainment in Lead
| Educational Attainment | In Labor Force | Unemployed |
| Less than High School | 37 (69.8%) | 0 (0.0%) |
| High School Diploma | 561 (86.0%) | 0 (0.0%) |
| College / Associate Degree | 433 (87.3%) | 0 (0.0%) |
| Bachelor's Degree or higher | 290 (96.7%) | 0 (0.0%) |
| Total | 1,321 (88.0%) | 0 (0.0%) |
Employment Occupations by Sex in Lead
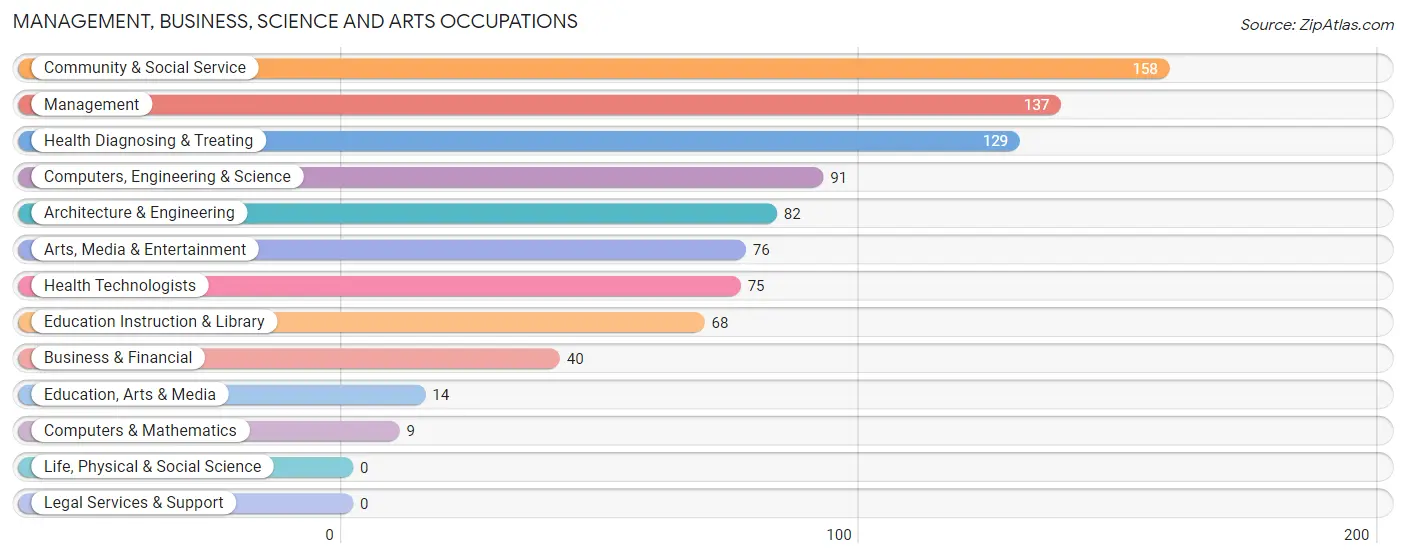
Management, Business, Science and Arts Occupations
The most common Management, Business, Science and Arts occupations in Lead are Community & Social Service (158 | 9.5%), Management (137 | 8.2%), Health Diagnosing & Treating (129 | 7.7%), Computers, Engineering & Science (91 | 5.5%), and Architecture & Engineering (82 | 4.9%).
Management, Business, Science and Arts Occupations by Sex
Within the Management, Business, Science and Arts occupations in Lead, the most male-oriented occupations are Architecture & Engineering (100.0%), Computers, Engineering & Science (90.1%), and Management (53.3%), while the most female-oriented occupations are Business & Financial (100.0%), Computers & Mathematics (100.0%), and Health Diagnosing & Treating (100.0%).
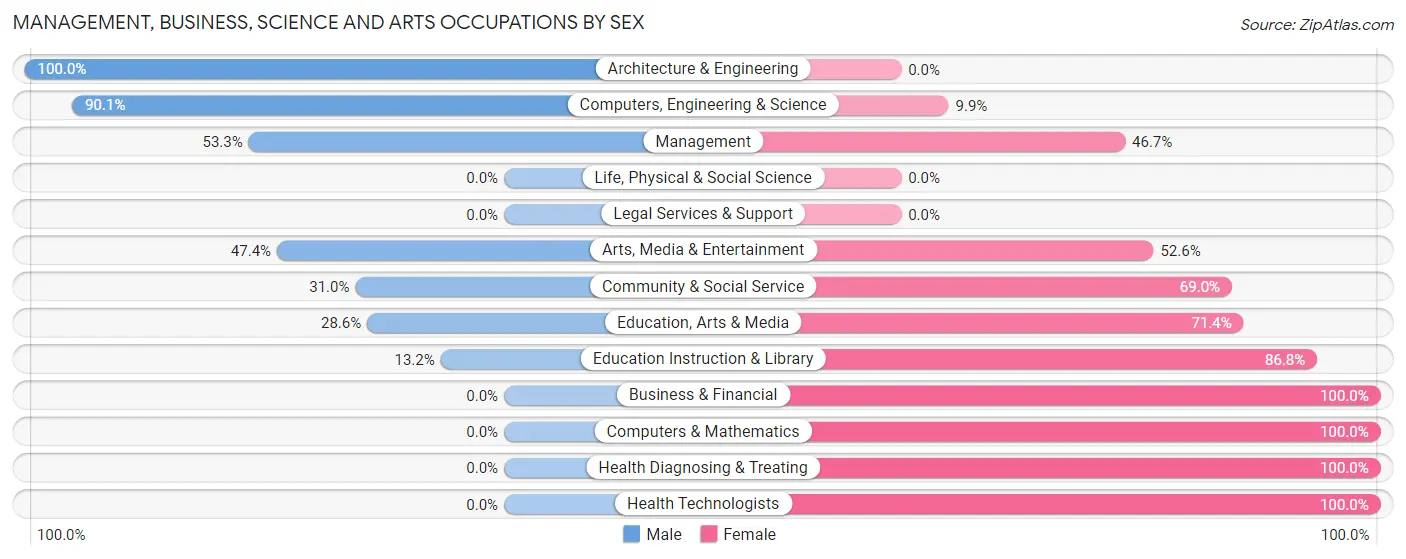
| Occupation | Male | Female |
| Management | 73 (53.3%) | 64 (46.7%) |
| Business & Financial | 0 (0.0%) | 40 (100.0%) |
| Computers, Engineering & Science | 82 (90.1%) | 9 (9.9%) |
| Computers & Mathematics | 0 (0.0%) | 9 (100.0%) |
| Architecture & Engineering | 82 (100.0%) | 0 (0.0%) |
| Life, Physical & Social Science | 0 (0.0%) | 0 (0.0%) |
| Community & Social Service | 49 (31.0%) | 109 (69.0%) |
| Education, Arts & Media | 4 (28.6%) | 10 (71.4%) |
| Legal Services & Support | 0 (0.0%) | 0 (0.0%) |
| Education Instruction & Library | 9 (13.2%) | 59 (86.8%) |
| Arts, Media & Entertainment | 36 (47.4%) | 40 (52.6%) |
| Health Diagnosing & Treating | 0 (0.0%) | 129 (100.0%) |
| Health Technologists | 0 (0.0%) | 75 (100.0%) |
| Total (Category) | 204 (36.8%) | 351 (63.2%) |
| Total (Overall) | 835 (50.1%) | 831 (49.9%) |
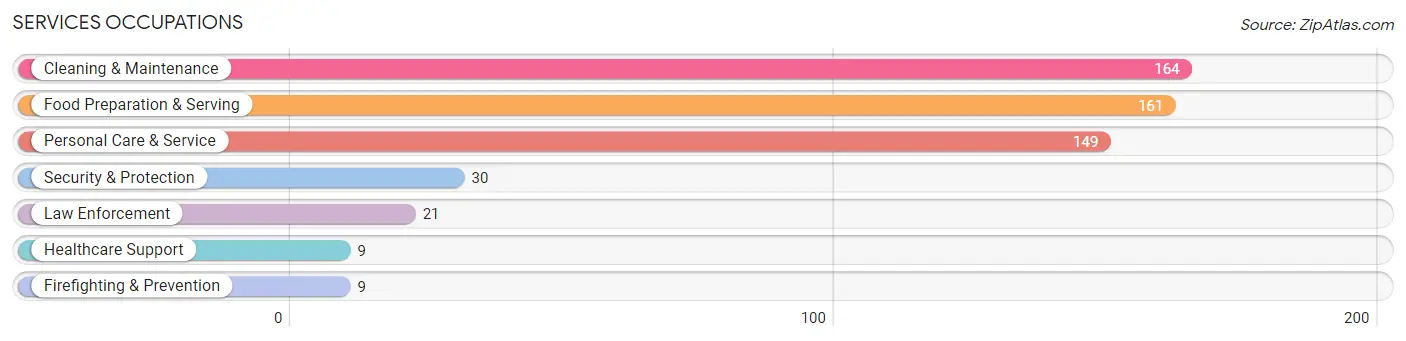
Services Occupations
The most common Services occupations in Lead are Cleaning & Maintenance (164 | 9.8%), Food Preparation & Serving (161 | 9.7%), Personal Care & Service (149 | 8.9%), Security & Protection (30 | 1.8%), and Law Enforcement (21 | 1.3%).
Services Occupations by Sex
Within the Services occupations in Lead, the most male-oriented occupations are Law Enforcement (100.0%), Food Preparation & Serving (83.2%), and Security & Protection (70.0%), while the most female-oriented occupations are Healthcare Support (100.0%), Firefighting & Prevention (100.0%), and Cleaning & Maintenance (59.2%).
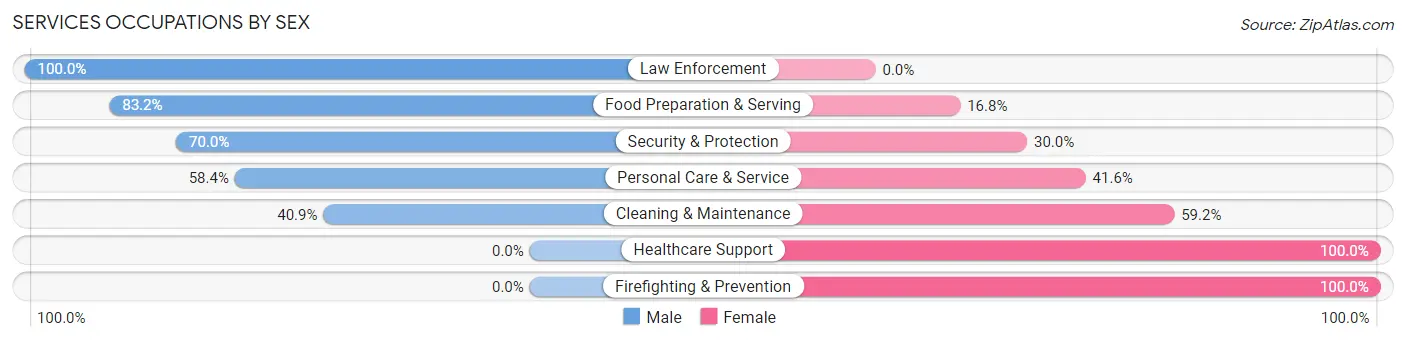
| Occupation | Male | Female |
| Healthcare Support | 0 (0.0%) | 9 (100.0%) |
| Security & Protection | 21 (70.0%) | 9 (30.0%) |
| Firefighting & Prevention | 0 (0.0%) | 9 (100.0%) |
| Law Enforcement | 21 (100.0%) | 0 (0.0%) |
| Food Preparation & Serving | 134 (83.2%) | 27 (16.8%) |
| Cleaning & Maintenance | 67 (40.8%) | 97 (59.2%) |
| Personal Care & Service | 87 (58.4%) | 62 (41.6%) |
| Total (Category) | 309 (60.2%) | 204 (39.8%) |
| Total (Overall) | 835 (50.1%) | 831 (49.9%) |
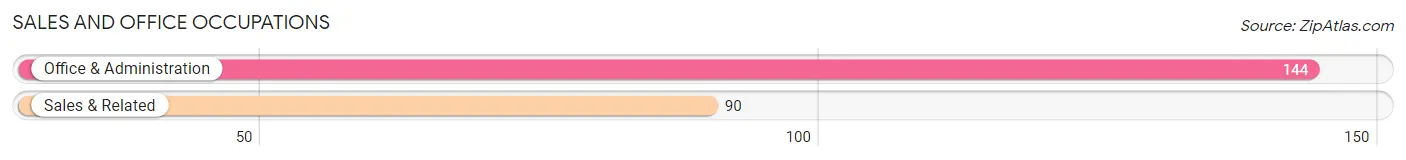
Sales and Office Occupations
The most common Sales and Office occupations in Lead are Office & Administration (144 | 8.6%), and Sales & Related (90 | 5.4%).
Sales and Office Occupations by Sex
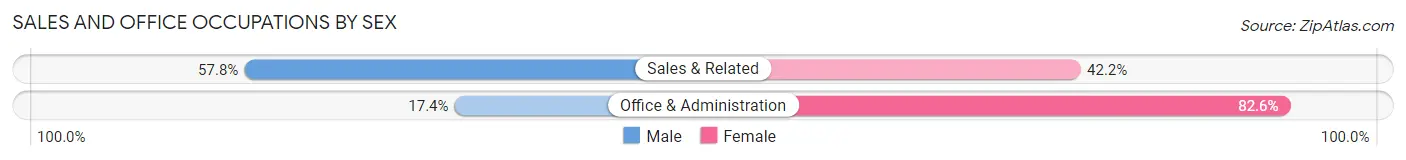
| Occupation | Male | Female |
| Sales & Related | 52 (57.8%) | 38 (42.2%) |
| Office & Administration | 25 (17.4%) | 119 (82.6%) |
| Total (Category) | 77 (32.9%) | 157 (67.1%) |
| Total (Overall) | 835 (50.1%) | 831 (49.9%) |
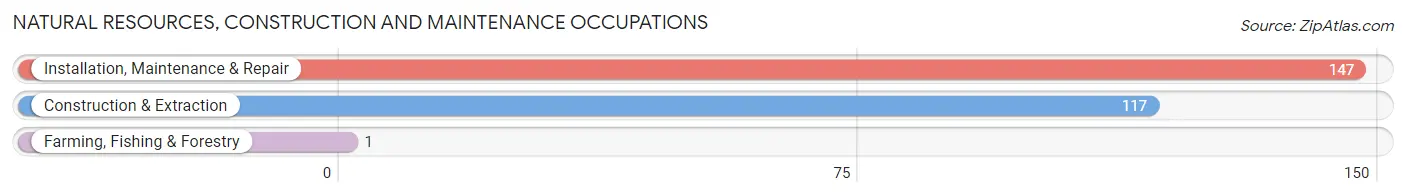
Natural Resources, Construction and Maintenance Occupations
The most common Natural Resources, Construction and Maintenance occupations in Lead are Installation, Maintenance & Repair (147 | 8.8%), Construction & Extraction (117 | 7.0%), and Farming, Fishing & Forestry (1 | 0.1%).
Natural Resources, Construction and Maintenance Occupations by Sex
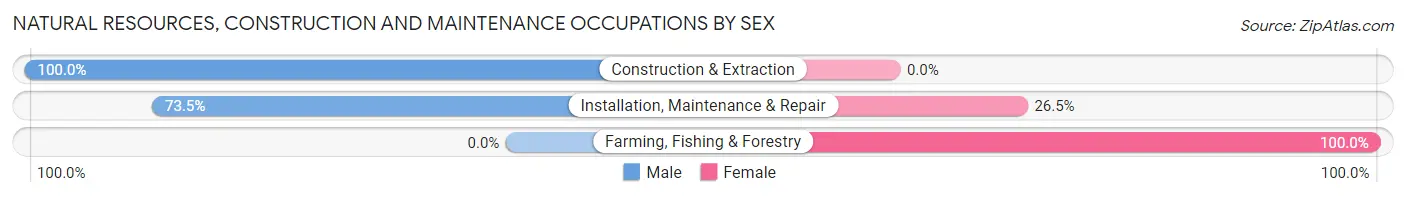
| Occupation | Male | Female |
| Farming, Fishing & Forestry | 0 (0.0%) | 1 (100.0%) |
| Construction & Extraction | 117 (100.0%) | 0 (0.0%) |
| Installation, Maintenance & Repair | 108 (73.5%) | 39 (26.5%) |
| Total (Category) | 225 (84.9%) | 40 (15.1%) |
| Total (Overall) | 835 (50.1%) | 831 (49.9%) |
Production, Transportation and Moving Occupations
The most common Production, Transportation and Moving occupations in Lead are Material Moving (60 | 3.6%), Production (29 | 1.7%), and Transportation (10 | 0.6%).
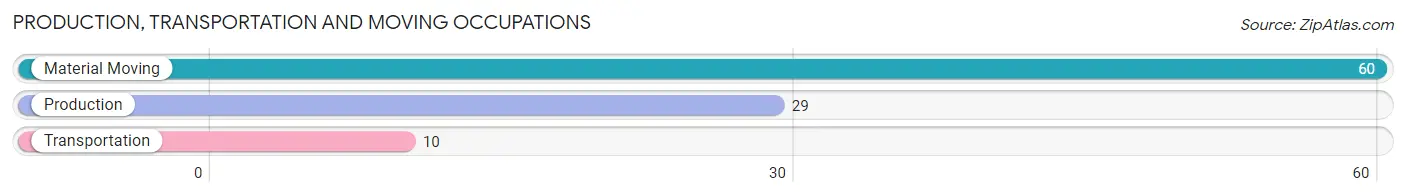
Production, Transportation and Moving Occupations by Sex
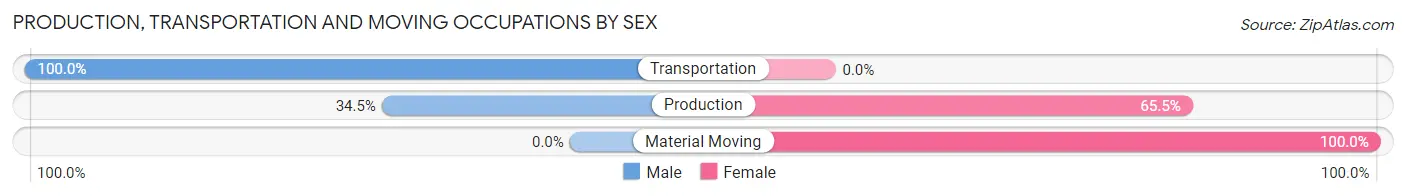
| Occupation | Male | Female |
| Production | 10 (34.5%) | 19 (65.5%) |
| Transportation | 10 (100.0%) | 0 (0.0%) |
| Material Moving | 0 (0.0%) | 60 (100.0%) |
| Total (Category) | 20 (20.2%) | 79 (79.8%) |
| Total (Overall) | 835 (50.1%) | 831 (49.9%) |
Employment Industries by Sex in Lead
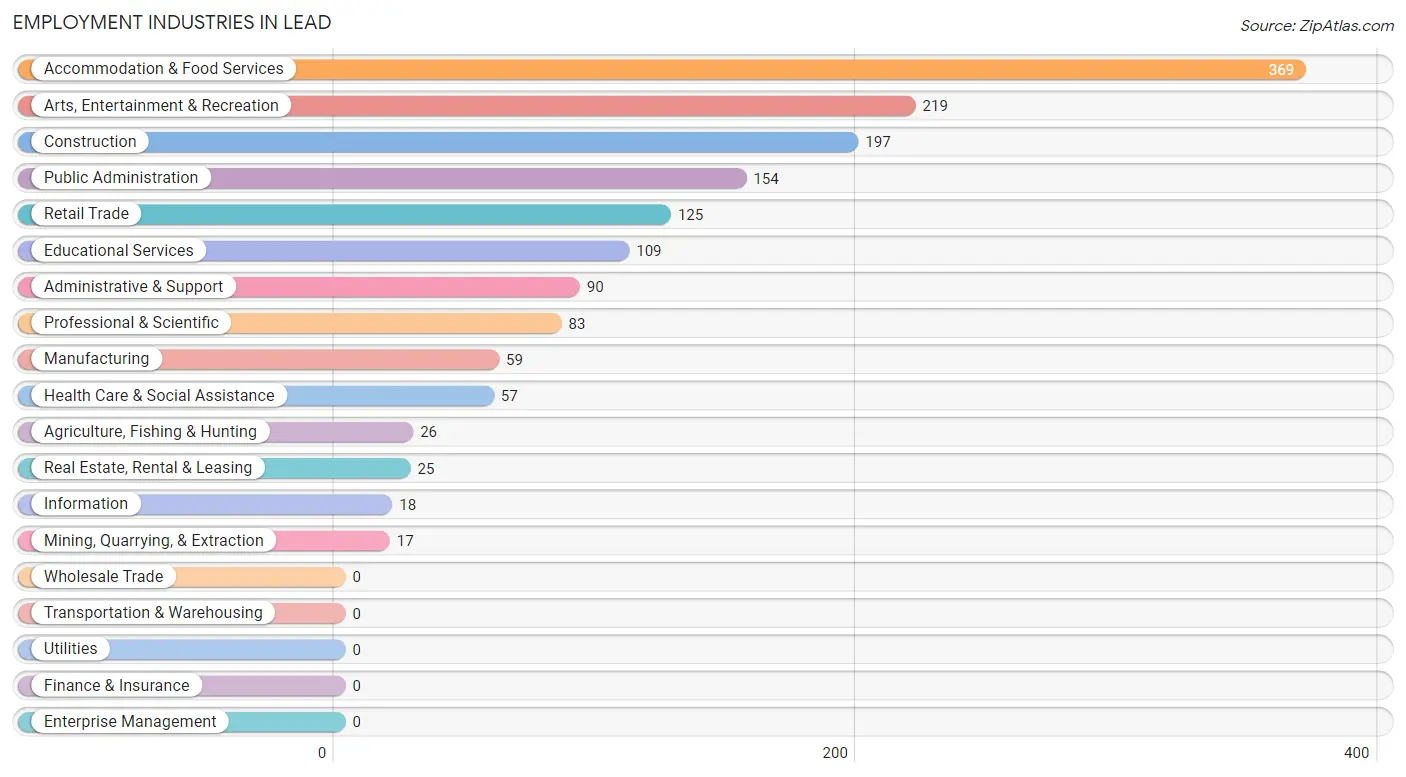
Employment Industries in Lead
The major employment industries in Lead include Accommodation & Food Services (369 | 22.2%), Arts, Entertainment & Recreation (219 | 13.2%), Construction (197 | 11.8%), Public Administration (154 | 9.2%), and Retail Trade (125 | 7.5%).
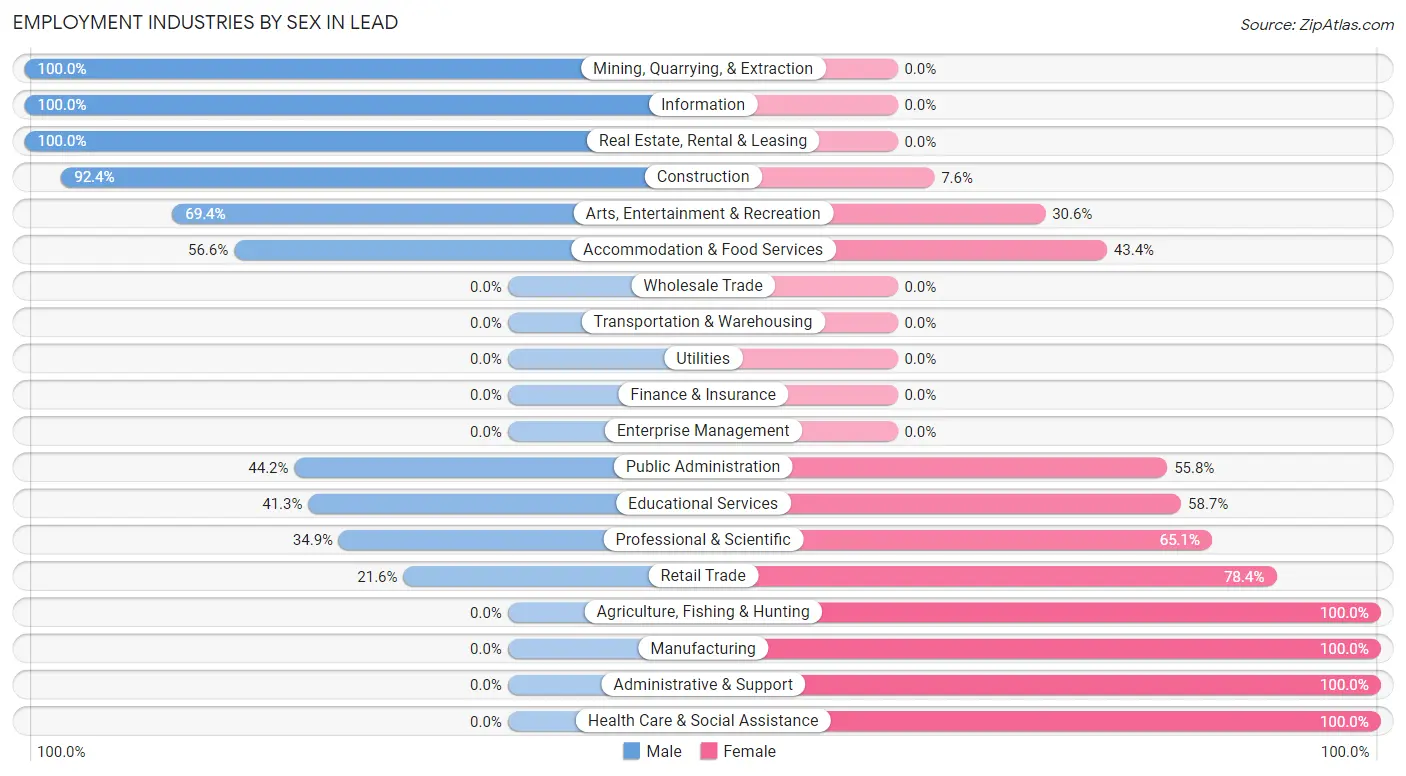
Employment Industries by Sex in Lead
The Lead industries that see more men than women are Mining, Quarrying, & Extraction (100.0%), Information (100.0%), and Real Estate, Rental & Leasing (100.0%), whereas the industries that tend to have a higher number of women are Agriculture, Fishing & Hunting (100.0%), Manufacturing (100.0%), and Administrative & Support (100.0%).
| Industry | Male | Female |
| Agriculture, Fishing & Hunting | 0 (0.0%) | 26 (100.0%) |
| Mining, Quarrying, & Extraction | 17 (100.0%) | 0 (0.0%) |
| Construction | 182 (92.4%) | 15 (7.6%) |
| Manufacturing | 0 (0.0%) | 59 (100.0%) |
| Wholesale Trade | 0 (0.0%) | 0 (0.0%) |
| Retail Trade | 27 (21.6%) | 98 (78.4%) |
| Transportation & Warehousing | 0 (0.0%) | 0 (0.0%) |
| Utilities | 0 (0.0%) | 0 (0.0%) |
| Information | 18 (100.0%) | 0 (0.0%) |
| Finance & Insurance | 0 (0.0%) | 0 (0.0%) |
| Real Estate, Rental & Leasing | 25 (100.0%) | 0 (0.0%) |
| Professional & Scientific | 29 (34.9%) | 54 (65.1%) |
| Enterprise Management | 0 (0.0%) | 0 (0.0%) |
| Administrative & Support | 0 (0.0%) | 90 (100.0%) |
| Educational Services | 45 (41.3%) | 64 (58.7%) |
| Health Care & Social Assistance | 0 (0.0%) | 57 (100.0%) |
| Arts, Entertainment & Recreation | 152 (69.4%) | 67 (30.6%) |
| Accommodation & Food Services | 209 (56.6%) | 160 (43.4%) |
| Public Administration | 68 (44.2%) | 86 (55.8%) |
| Total | 835 (50.1%) | 831 (49.9%) |
Education in Lead
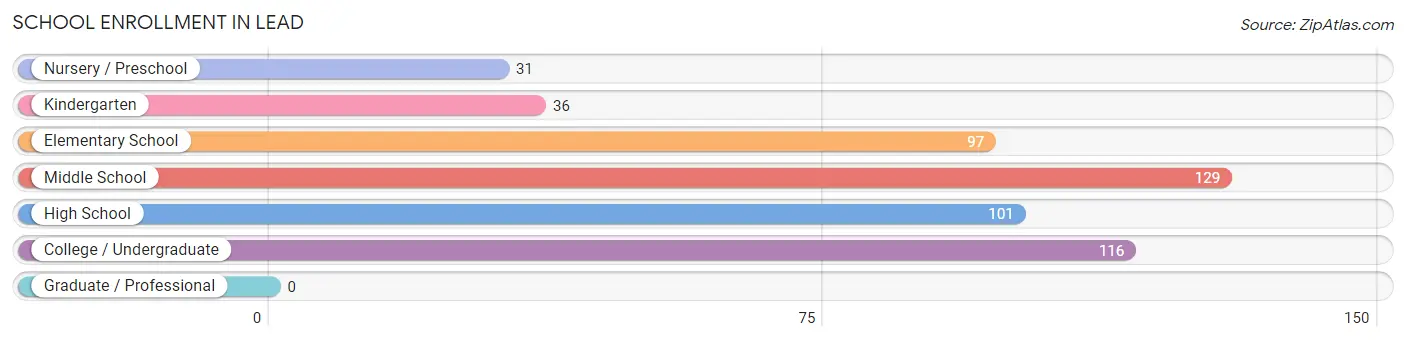
School Enrollment in Lead
The most common levels of schooling among the 510 students in Lead are middle school (129 | 25.3%), college / undergraduate (116 | 22.8%), and high school (101 | 19.8%).
| School Level | # Students | % Students |
| Nursery / Preschool | 31 | 6.1% |
| Kindergarten | 36 | 7.1% |
| Elementary School | 97 | 19.0% |
| Middle School | 129 | 25.3% |
| High School | 101 | 19.8% |
| College / Undergraduate | 116 | 22.8% |
| Graduate / Professional | 0 | 0.0% |
| Total | 510 | 100.0% |
School Enrollment by Age by Funding Source in Lead
Out of a total of 510 students who are enrolled in schools in Lead, 57 (11.2%) attend a private institution, while the remaining 453 (88.8%) are enrolled in public schools. The age group of 25 to 34 year olds has the highest likelihood of being enrolled in private schools, with 54 (100.0% in the age bracket) enrolled. Conversely, the age group of 3 to 4 year olds has the lowest likelihood of being enrolled in a private school, with 19 (100.0% in the age bracket) attending a public institution.
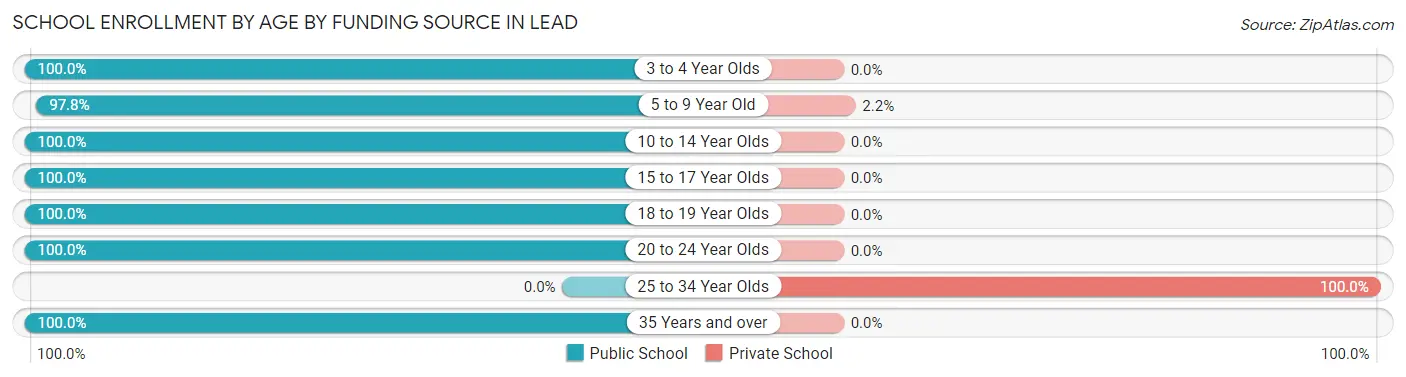
| Age Bracket | Public School | Private School |
| 3 to 4 Year Olds | 19 (100.0%) | 0 (0.0%) |
| 5 to 9 Year Old | 134 (97.8%) | 3 (2.2%) |
| 10 to 14 Year Olds | 137 (100.0%) | 0 (0.0%) |
| 15 to 17 Year Olds | 85 (100.0%) | 0 (0.0%) |
| 18 to 19 Year Olds | 16 (100.0%) | 0 (0.0%) |
| 20 to 24 Year Olds | 52 (100.0%) | 0 (0.0%) |
| 25 to 34 Year Olds | 0 (0.0%) | 54 (100.0%) |
| 35 Years and over | 10 (100.0%) | 0 (0.0%) |
| Total | 453 (88.8%) | 57 (11.2%) |
Educational Attainment by Field of Study in Lead
Education (215 | 37.1%), visual & performing arts (103 | 17.8%), business (88 | 15.2%), engineering (43 | 7.4%), and computers & mathematics (35 | 6.0%) are the most common fields of study among 579 individuals in Lead who have obtained a bachelor's degree or higher.
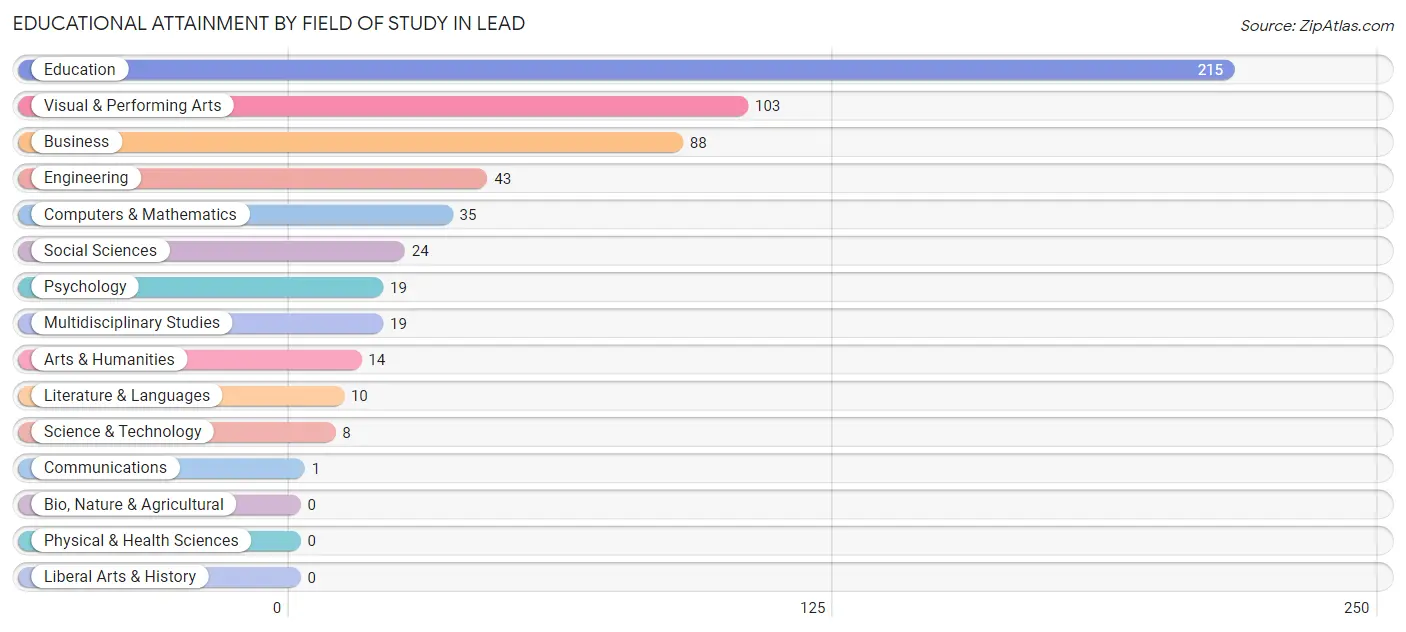
| Field of Study | # Graduates | % Graduates |
| Computers & Mathematics | 35 | 6.0% |
| Bio, Nature & Agricultural | 0 | 0.0% |
| Physical & Health Sciences | 0 | 0.0% |
| Psychology | 19 | 3.3% |
| Social Sciences | 24 | 4.2% |
| Engineering | 43 | 7.4% |
| Multidisciplinary Studies | 19 | 3.3% |
| Science & Technology | 8 | 1.4% |
| Business | 88 | 15.2% |
| Education | 215 | 37.1% |
| Literature & Languages | 10 | 1.7% |
| Liberal Arts & History | 0 | 0.0% |
| Visual & Performing Arts | 103 | 17.8% |
| Communications | 1 | 0.2% |
| Arts & Humanities | 14 | 2.4% |
| Total | 579 | 100.0% |
Transportation & Commute in Lead
Vehicle Availability by Sex in Lead
The most prevalent vehicle ownership categories in Lead are males with 2 vehicles (345, accounting for 41.8%) and females with 2 vehicles (190, making up 41.6%).
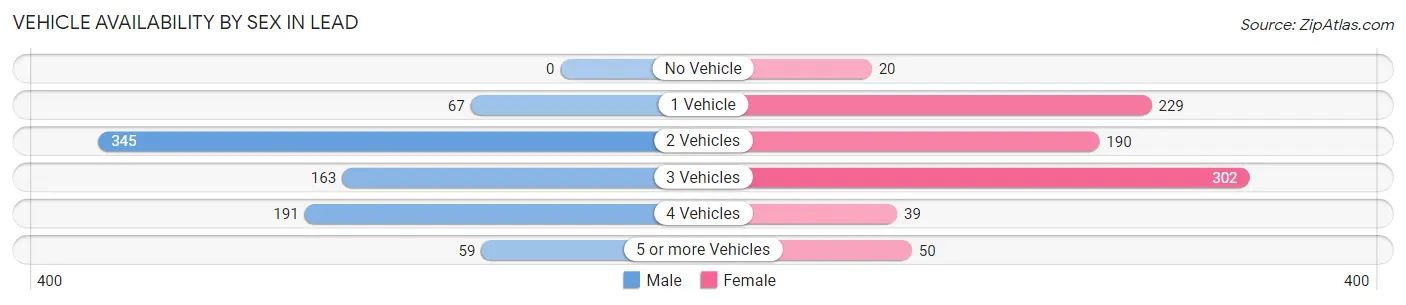
| Vehicles Available | Male | Female |
| No Vehicle | 0 (0.0%) | 20 (2.4%) |
| 1 Vehicle | 67 (8.1%) | 229 (27.6%) |
| 2 Vehicles | 345 (41.8%) | 190 (22.9%) |
| 3 Vehicles | 163 (19.8%) | 302 (36.4%) |
| 4 Vehicles | 191 (23.2%) | 39 (4.7%) |
| 5 or more Vehicles | 59 (7.1%) | 50 (6.0%) |
| Total | 825 (100.0%) | 830 (100.0%) |
Commute Time in Lead
The most frequently occuring commute durations in Lead are 10 to 14 minutes (439 commuters, 26.9%), 5 to 9 minutes (262 commuters, 16.0%), and 20 to 24 minutes (196 commuters, 12.0%).
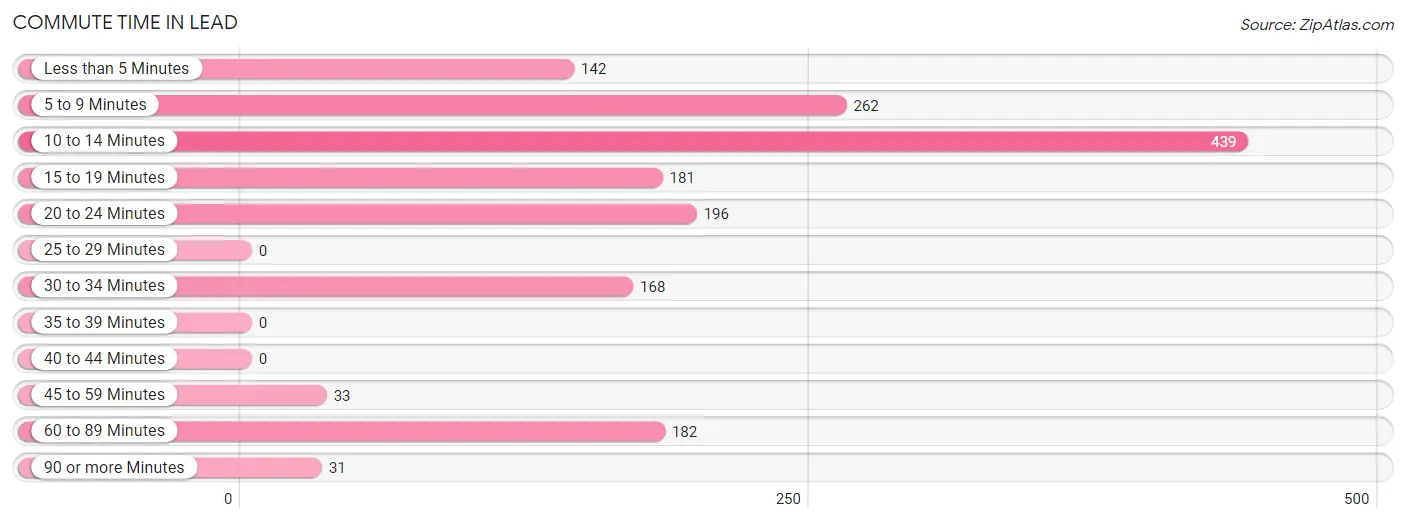
| Commute Time | # Commuters | % Commuters |
| Less than 5 Minutes | 142 | 8.7% |
| 5 to 9 Minutes | 262 | 16.0% |
| 10 to 14 Minutes | 439 | 26.9% |
| 15 to 19 Minutes | 181 | 11.1% |
| 20 to 24 Minutes | 196 | 12.0% |
| 25 to 29 Minutes | 0 | 0.0% |
| 30 to 34 Minutes | 168 | 10.3% |
| 35 to 39 Minutes | 0 | 0.0% |
| 40 to 44 Minutes | 0 | 0.0% |
| 45 to 59 Minutes | 33 | 2.0% |
| 60 to 89 Minutes | 182 | 11.1% |
| 90 or more Minutes | 31 | 1.9% |
Commute Time by Sex in Lead
The most common commute times in Lead are 5 to 9 minutes (199 commuters, 24.4%) for males and 10 to 14 minutes (258 commuters, 31.6%) for females.
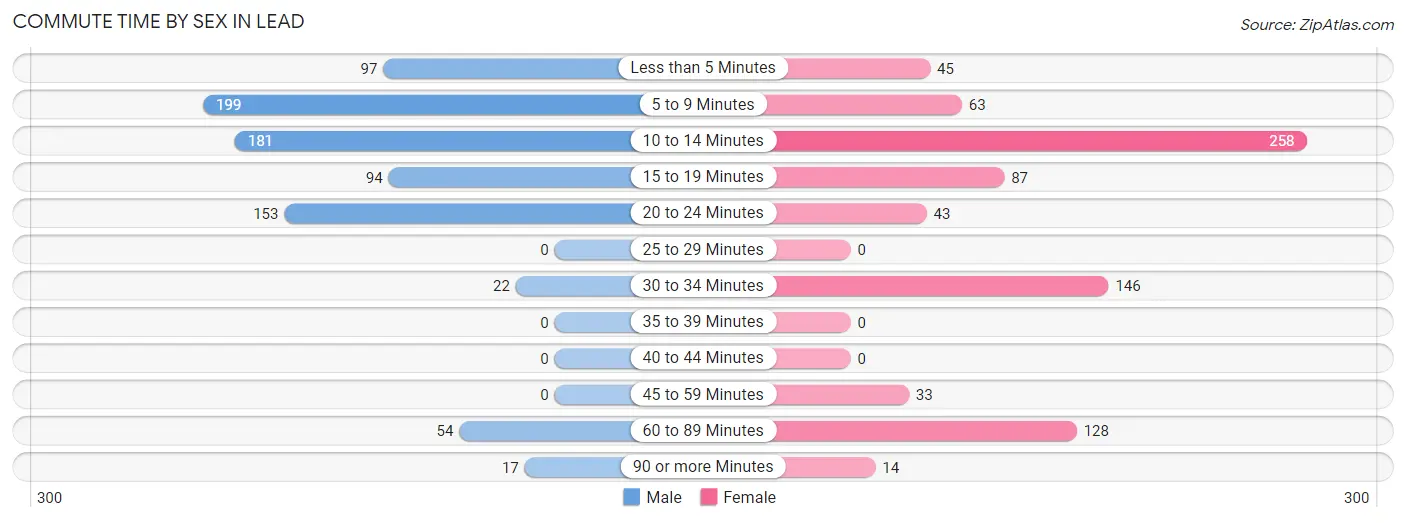
| Commute Time | Male | Female |
| Less than 5 Minutes | 97 (11.9%) | 45 (5.5%) |
| 5 to 9 Minutes | 199 (24.4%) | 63 (7.7%) |
| 10 to 14 Minutes | 181 (22.2%) | 258 (31.6%) |
| 15 to 19 Minutes | 94 (11.5%) | 87 (10.6%) |
| 20 to 24 Minutes | 153 (18.7%) | 43 (5.3%) |
| 25 to 29 Minutes | 0 (0.0%) | 0 (0.0%) |
| 30 to 34 Minutes | 22 (2.7%) | 146 (17.9%) |
| 35 to 39 Minutes | 0 (0.0%) | 0 (0.0%) |
| 40 to 44 Minutes | 0 (0.0%) | 0 (0.0%) |
| 45 to 59 Minutes | 0 (0.0%) | 33 (4.0%) |
| 60 to 89 Minutes | 54 (6.6%) | 128 (15.7%) |
| 90 or more Minutes | 17 (2.1%) | 14 (1.7%) |
Time of Departure to Work by Sex in Lead
The most frequent times of departure to work in Lead are 7:30 AM to 7:59 AM (165, 20.2%) for males and 7:30 AM to 7:59 AM (232, 28.4%) for females.
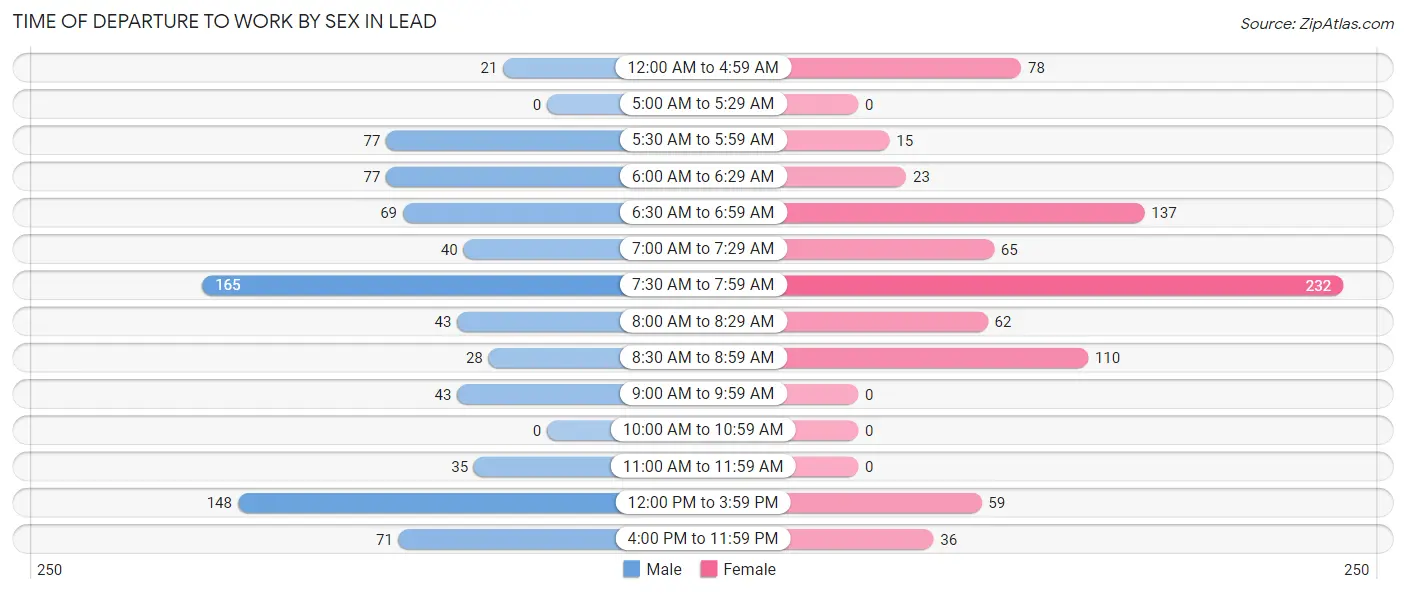
| Time of Departure | Male | Female |
| 12:00 AM to 4:59 AM | 21 (2.6%) | 78 (9.6%) |
| 5:00 AM to 5:29 AM | 0 (0.0%) | 0 (0.0%) |
| 5:30 AM to 5:59 AM | 77 (9.4%) | 15 (1.8%) |
| 6:00 AM to 6:29 AM | 77 (9.4%) | 23 (2.8%) |
| 6:30 AM to 6:59 AM | 69 (8.5%) | 137 (16.8%) |
| 7:00 AM to 7:29 AM | 40 (4.9%) | 65 (8.0%) |
| 7:30 AM to 7:59 AM | 165 (20.2%) | 232 (28.4%) |
| 8:00 AM to 8:29 AM | 43 (5.3%) | 62 (7.6%) |
| 8:30 AM to 8:59 AM | 28 (3.4%) | 110 (13.5%) |
| 9:00 AM to 9:59 AM | 43 (5.3%) | 0 (0.0%) |
| 10:00 AM to 10:59 AM | 0 (0.0%) | 0 (0.0%) |
| 11:00 AM to 11:59 AM | 35 (4.3%) | 0 (0.0%) |
| 12:00 PM to 3:59 PM | 148 (18.1%) | 59 (7.2%) |
| 4:00 PM to 11:59 PM | 71 (8.7%) | 36 (4.4%) |
| Total | 817 (100.0%) | 817 (100.0%) |
Housing Occupancy in Lead
Occupancy by Ownership in Lead
Of the total 1,451 dwellings in Lead, owner-occupied units account for 1,049 (72.3%), while renter-occupied units make up 402 (27.7%).
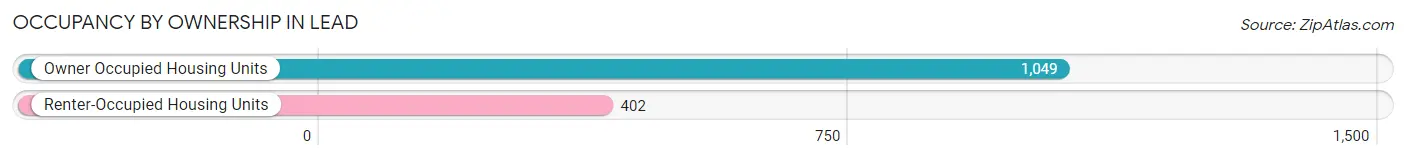
| Occupancy | # Housing Units | % Housing Units |
| Owner Occupied Housing Units | 1,049 | 72.3% |
| Renter-Occupied Housing Units | 402 | 27.7% |
| Total Occupied Housing Units | 1,451 | 100.0% |
Occupancy by Household Size in Lead
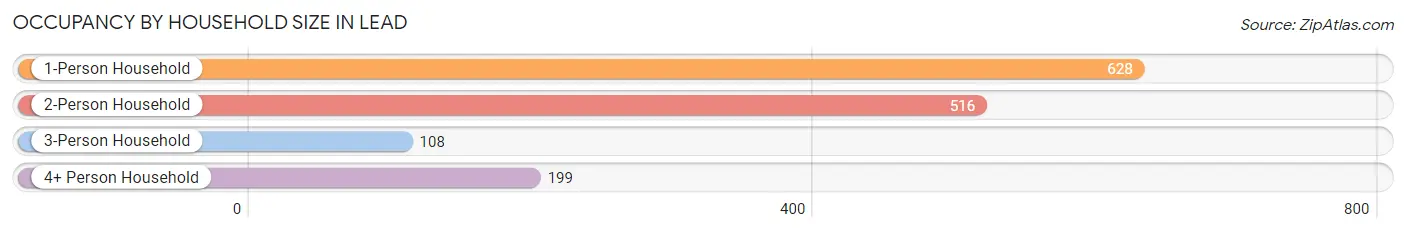
| Household Size | # Housing Units | % Housing Units |
| 1-Person Household | 628 | 43.3% |
| 2-Person Household | 516 | 35.6% |
| 3-Person Household | 108 | 7.4% |
| 4+ Person Household | 199 | 13.7% |
| Total Housing Units | 1,451 | 100.0% |
Occupancy by Ownership by Household Size in Lead
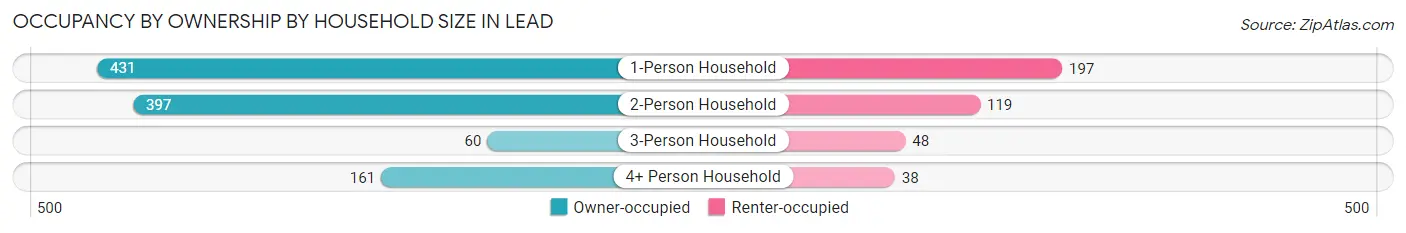
| Household Size | Owner-occupied | Renter-occupied |
| 1-Person Household | 431 (68.6%) | 197 (31.4%) |
| 2-Person Household | 397 (76.9%) | 119 (23.1%) |
| 3-Person Household | 60 (55.6%) | 48 (44.4%) |
| 4+ Person Household | 161 (80.9%) | 38 (19.1%) |
| Total Housing Units | 1,049 (72.3%) | 402 (27.7%) |
Occupancy by Educational Attainment in Lead
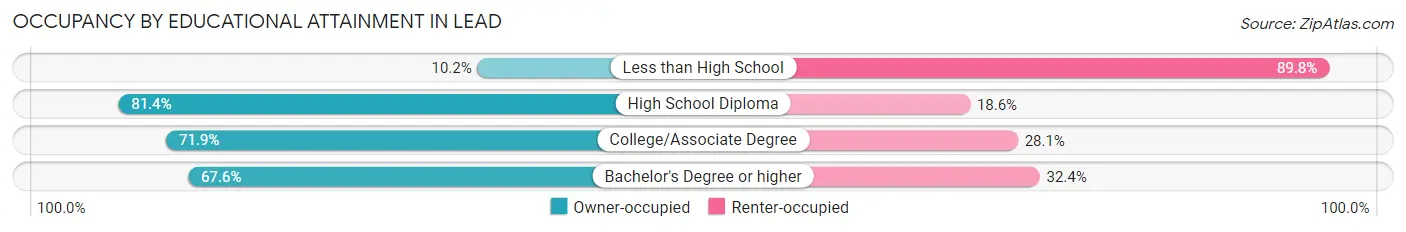
| Household Size | Owner-occupied | Renter-occupied |
| Less than High School | 5 (10.2%) | 44 (89.8%) |
| High School Diploma | 438 (81.4%) | 100 (18.6%) |
| College/Associate Degree | 364 (71.9%) | 142 (28.1%) |
| Bachelor's Degree or higher | 242 (67.6%) | 116 (32.4%) |
Occupancy by Age of Householder in Lead
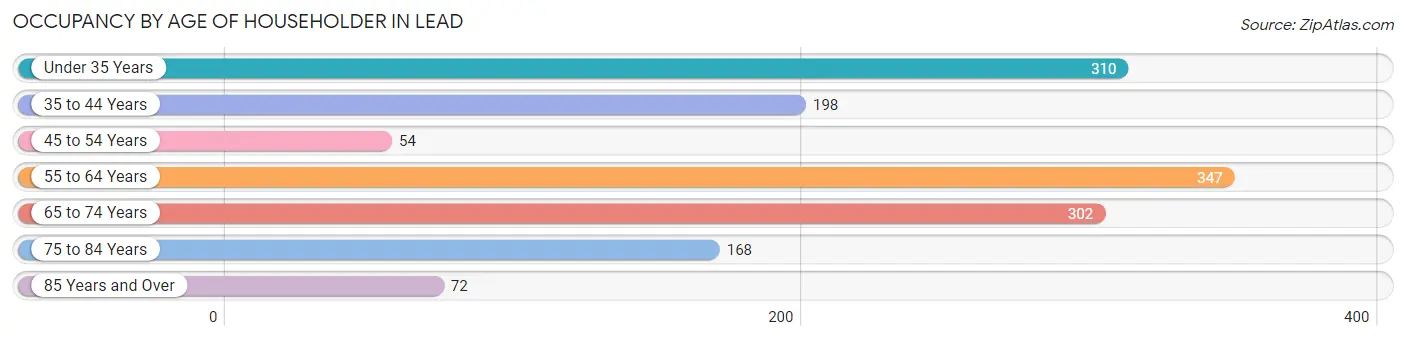
| Age Bracket | # Households | % Households |
| Under 35 Years | 310 | 21.4% |
| 35 to 44 Years | 198 | 13.7% |
| 45 to 54 Years | 54 | 3.7% |
| 55 to 64 Years | 347 | 23.9% |
| 65 to 74 Years | 302 | 20.8% |
| 75 to 84 Years | 168 | 11.6% |
| 85 Years and Over | 72 | 5.0% |
| Total | 1,451 | 100.0% |
Housing Finances in Lead
Median Income by Occupancy in Lead
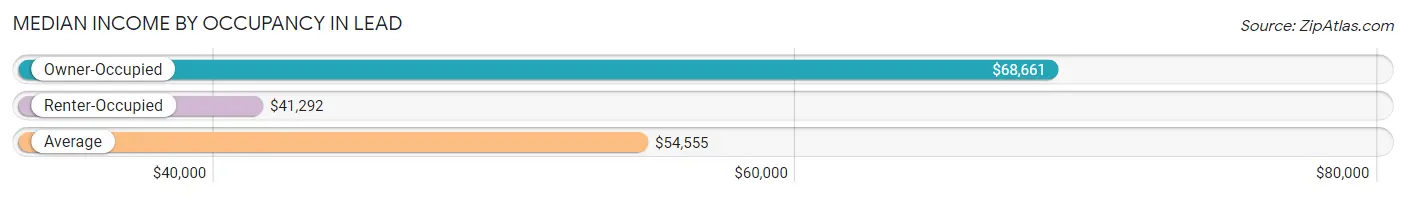
| Occupancy Type | # Households | Median Income |
| Owner-Occupied | 1,049 (72.3%) | $68,661 |
| Renter-Occupied | 402 (27.7%) | $41,292 |
| Average | 1,451 (100.0%) | $54,555 |
Occupancy by Householder Income Bracket in Lead
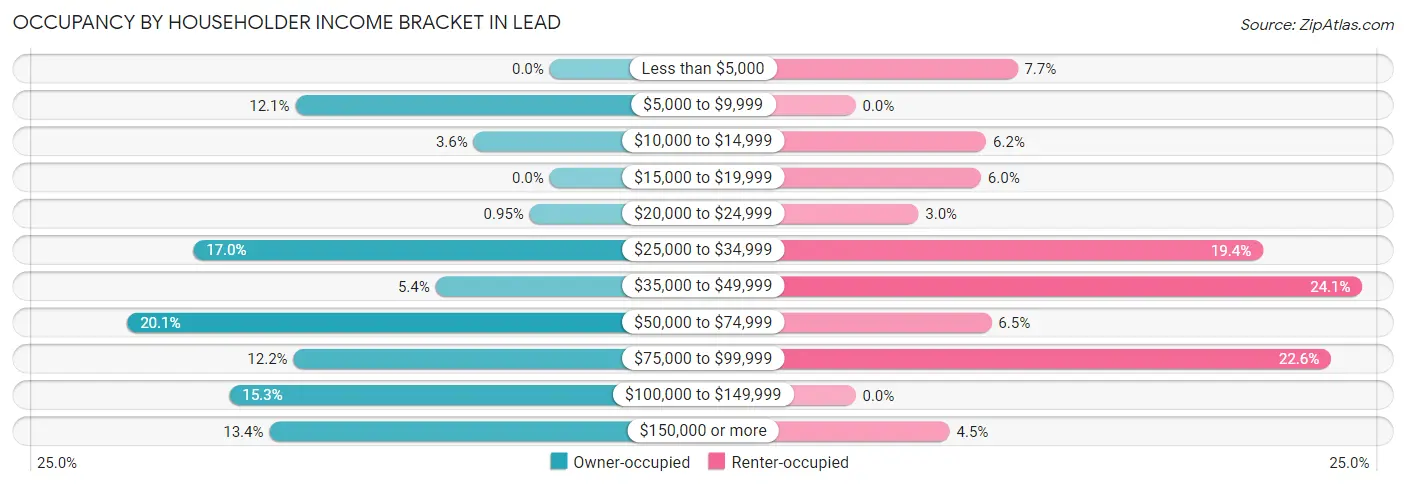
| Income Bracket | Owner-occupied | Renter-occupied |
| Less than $5,000 | 0 (0.0%) | 31 (7.7%) |
| $5,000 to $9,999 | 127 (12.1%) | 0 (0.0%) |
| $10,000 to $14,999 | 38 (3.6%) | 25 (6.2%) |
| $15,000 to $19,999 | 0 (0.0%) | 24 (6.0%) |
| $20,000 to $24,999 | 10 (0.9%) | 12 (3.0%) |
| $25,000 to $34,999 | 178 (17.0%) | 78 (19.4%) |
| $35,000 to $49,999 | 57 (5.4%) | 97 (24.1%) |
| $50,000 to $74,999 | 211 (20.1%) | 26 (6.5%) |
| $75,000 to $99,999 | 128 (12.2%) | 91 (22.6%) |
| $100,000 to $149,999 | 160 (15.2%) | 0 (0.0%) |
| $150,000 or more | 140 (13.4%) | 18 (4.5%) |
| Total | 1,049 (100.0%) | 402 (100.0%) |
Monthly Housing Cost Tiers in Lead
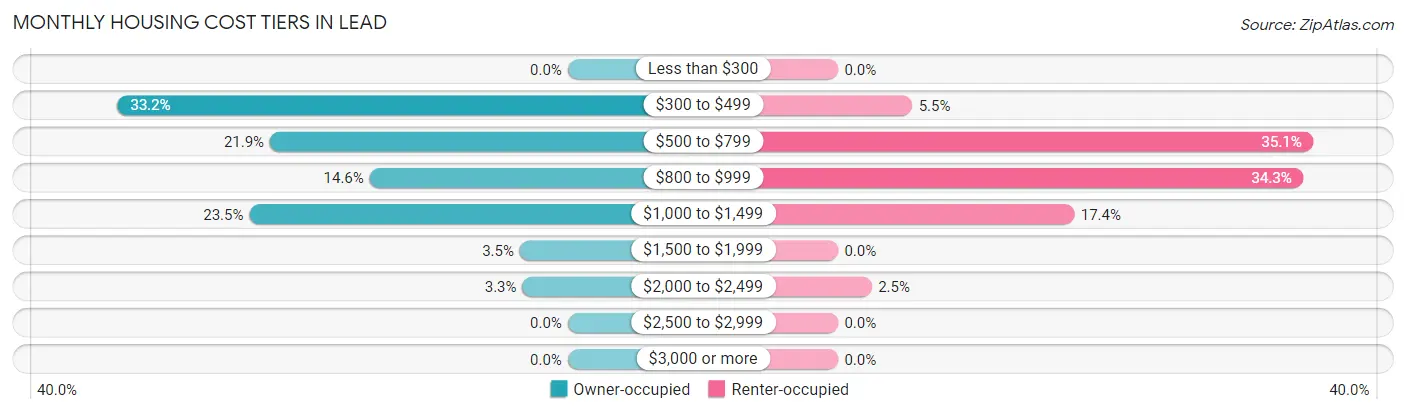
| Monthly Cost | Owner-occupied | Renter-occupied |
| Less than $300 | 0 (0.0%) | 0 (0.0%) |
| $300 to $499 | 348 (33.2%) | 22 (5.5%) |
| $500 to $799 | 230 (21.9%) | 141 (35.1%) |
| $800 to $999 | 153 (14.6%) | 138 (34.3%) |
| $1,000 to $1,499 | 246 (23.4%) | 70 (17.4%) |
| $1,500 to $1,999 | 37 (3.5%) | 0 (0.0%) |
| $2,000 to $2,499 | 35 (3.3%) | 10 (2.5%) |
| $2,500 to $2,999 | 0 (0.0%) | 0 (0.0%) |
| $3,000 or more | 0 (0.0%) | 0 (0.0%) |
| Total | 1,049 (100.0%) | 402 (100.0%) |
Physical Housing Characteristics in Lead
Housing Structures in Lead
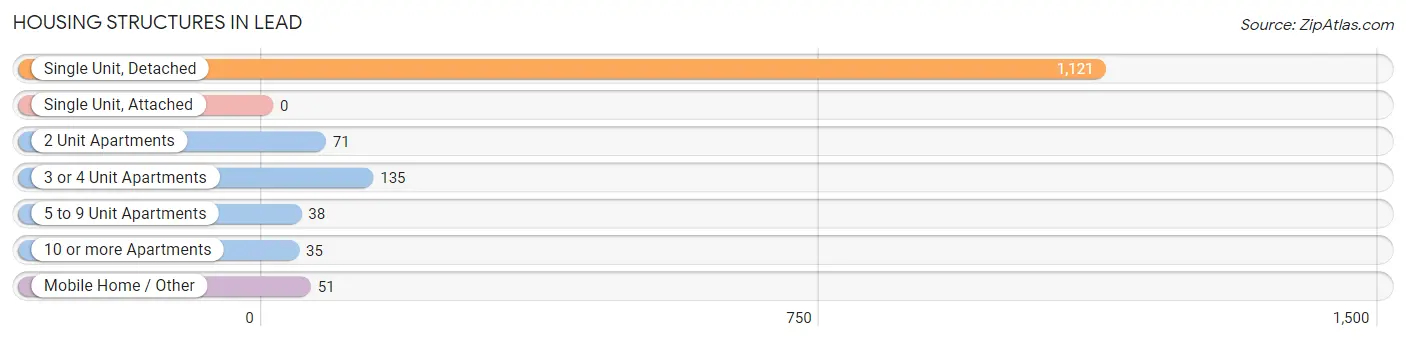
| Structure Type | # Housing Units | % Housing Units |
| Single Unit, Detached | 1,121 | 77.3% |
| Single Unit, Attached | 0 | 0.0% |
| 2 Unit Apartments | 71 | 4.9% |
| 3 or 4 Unit Apartments | 135 | 9.3% |
| 5 to 9 Unit Apartments | 38 | 2.6% |
| 10 or more Apartments | 35 | 2.4% |
| Mobile Home / Other | 51 | 3.5% |
| Total | 1,451 | 100.0% |
Housing Structures by Occupancy in Lead
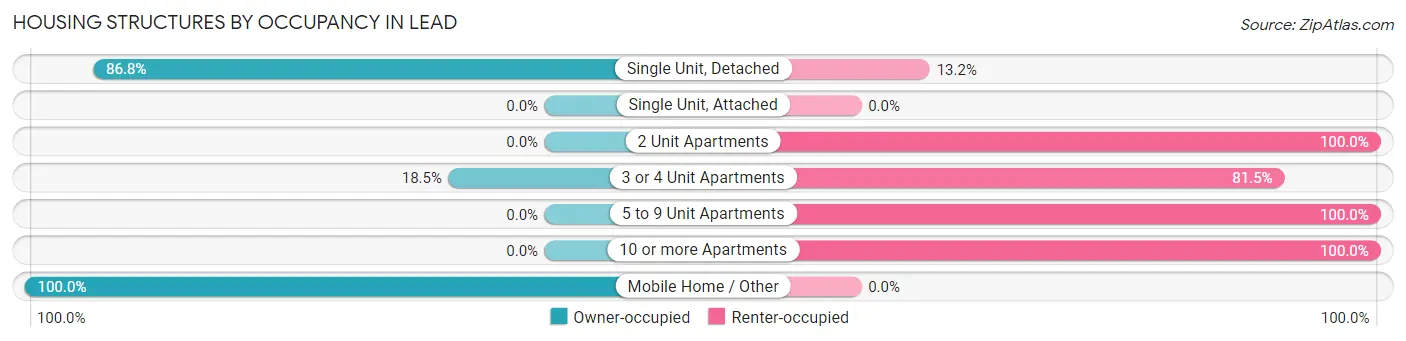
| Structure Type | Owner-occupied | Renter-occupied |
| Single Unit, Detached | 973 (86.8%) | 148 (13.2%) |
| Single Unit, Attached | 0 (0.0%) | 0 (0.0%) |
| 2 Unit Apartments | 0 (0.0%) | 71 (100.0%) |
| 3 or 4 Unit Apartments | 25 (18.5%) | 110 (81.5%) |
| 5 to 9 Unit Apartments | 0 (0.0%) | 38 (100.0%) |
| 10 or more Apartments | 0 (0.0%) | 35 (100.0%) |
| Mobile Home / Other | 51 (100.0%) | 0 (0.0%) |
| Total | 1,049 (72.3%) | 402 (27.7%) |
Housing Structures by Number of Rooms in Lead
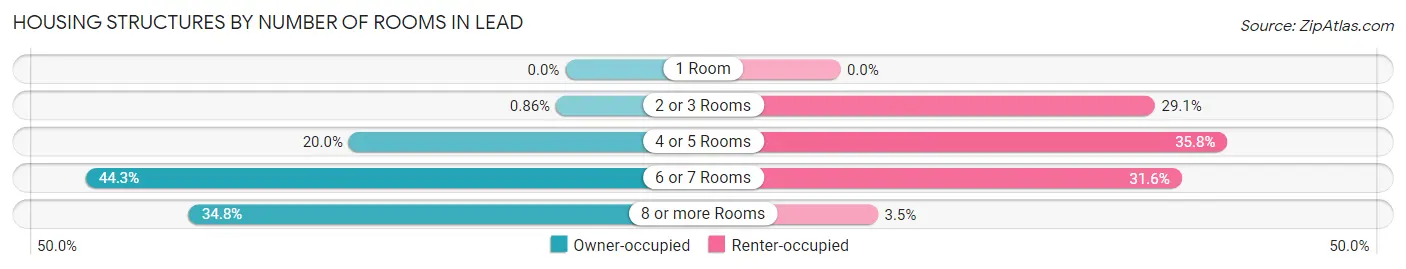
| Number of Rooms | Owner-occupied | Renter-occupied |
| 1 Room | 0 (0.0%) | 0 (0.0%) |
| 2 or 3 Rooms | 9 (0.9%) | 117 (29.1%) |
| 4 or 5 Rooms | 210 (20.0%) | 144 (35.8%) |
| 6 or 7 Rooms | 465 (44.3%) | 127 (31.6%) |
| 8 or more Rooms | 365 (34.8%) | 14 (3.5%) |
| Total | 1,049 (100.0%) | 402 (100.0%) |
Housing Structure by Heating Type in Lead
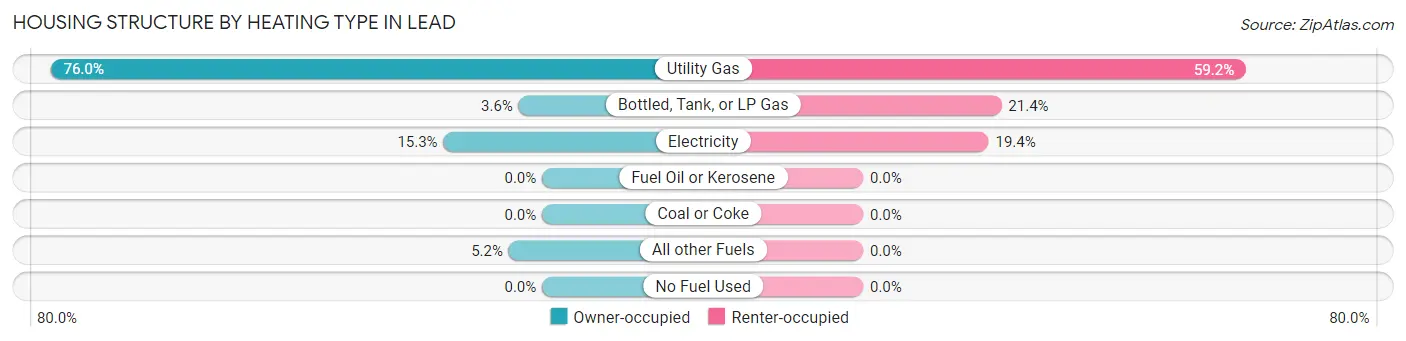
| Heating Type | Owner-occupied | Renter-occupied |
| Utility Gas | 797 (76.0%) | 238 (59.2%) |
| Bottled, Tank, or LP Gas | 38 (3.6%) | 86 (21.4%) |
| Electricity | 160 (15.2%) | 78 (19.4%) |
| Fuel Oil or Kerosene | 0 (0.0%) | 0 (0.0%) |
| Coal or Coke | 0 (0.0%) | 0 (0.0%) |
| All other Fuels | 54 (5.1%) | 0 (0.0%) |
| No Fuel Used | 0 (0.0%) | 0 (0.0%) |
| Total | 1,049 (100.0%) | 402 (100.0%) |
Household Vehicle Usage in Lead
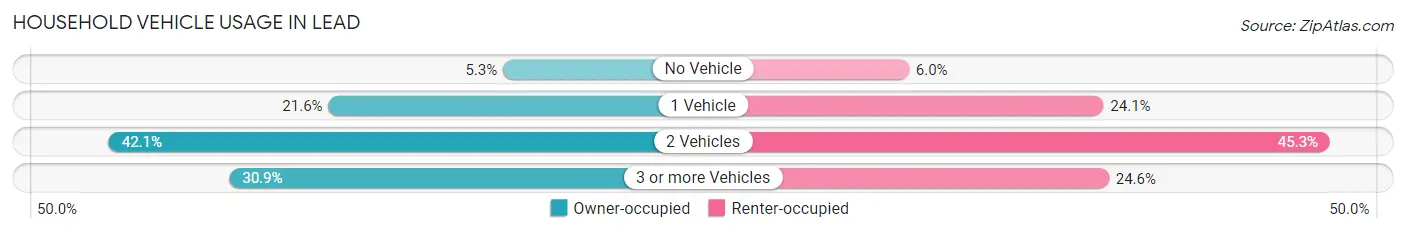
| Vehicles per Household | Owner-occupied | Renter-occupied |
| No Vehicle | 56 (5.3%) | 24 (6.0%) |
| 1 Vehicle | 227 (21.6%) | 97 (24.1%) |
| 2 Vehicles | 442 (42.1%) | 182 (45.3%) |
| 3 or more Vehicles | 324 (30.9%) | 99 (24.6%) |
| Total | 1,049 (100.0%) | 402 (100.0%) |
Real Estate & Mortgages in Lead
Real Estate and Mortgage Overview in Lead
| Characteristic | Without Mortgage | With Mortgage |
| Housing Units | 596 | 453 |
| Median Property Value | $207,100 | $157,800 |
| Median Household Income | $56,250 | $88 |
| Monthly Housing Costs | $485 | $0 |
| Real Estate Taxes | $1,829 | $0 |
Property Value by Mortgage Status in Lead
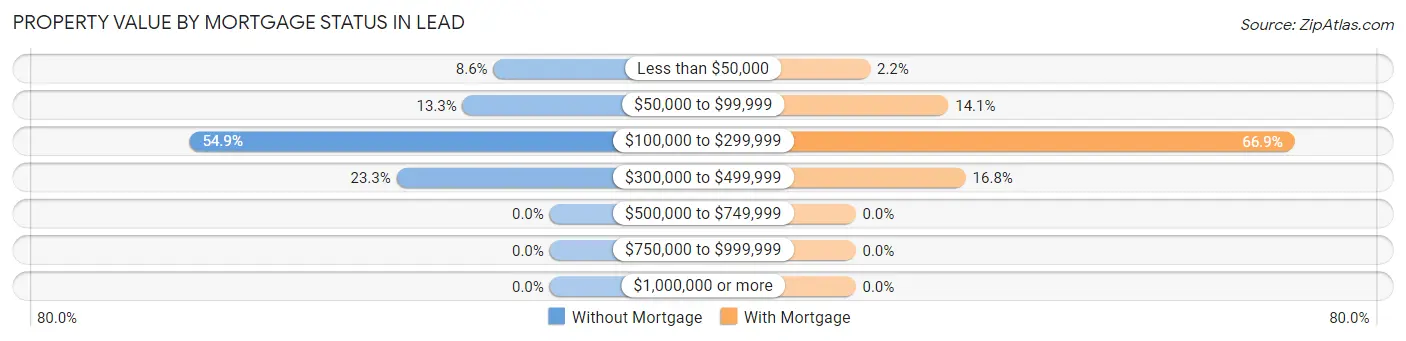
| Property Value | Without Mortgage | With Mortgage |
| Less than $50,000 | 51 (8.6%) | 10 (2.2%) |
| $50,000 to $99,999 | 79 (13.3%) | 64 (14.1%) |
| $100,000 to $299,999 | 327 (54.9%) | 303 (66.9%) |
| $300,000 to $499,999 | 139 (23.3%) | 76 (16.8%) |
| $500,000 to $749,999 | 0 (0.0%) | 0 (0.0%) |
| $750,000 to $999,999 | 0 (0.0%) | 0 (0.0%) |
| $1,000,000 or more | 0 (0.0%) | 0 (0.0%) |
| Total | 596 (100.0%) | 453 (100.0%) |
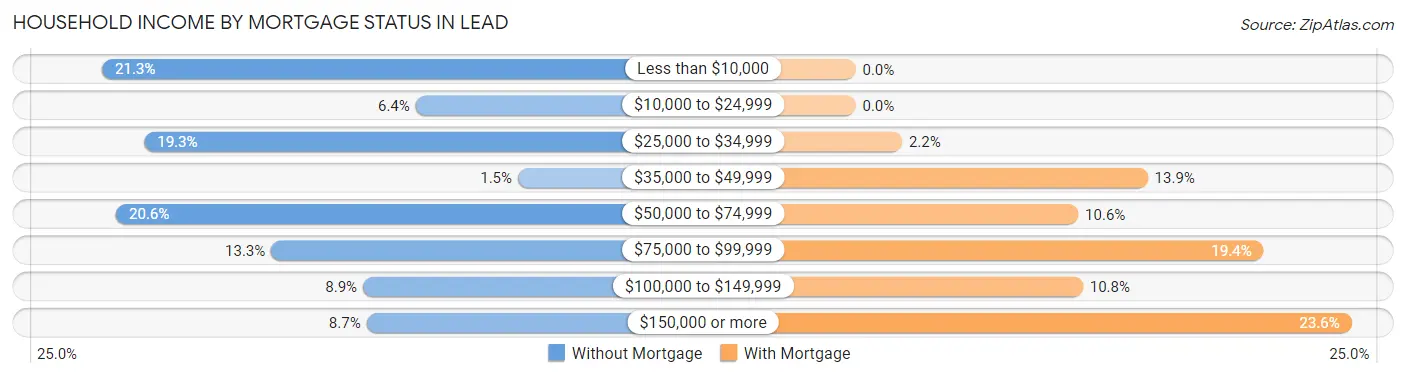
Household Income by Mortgage Status in Lead
| Household Income | Without Mortgage | With Mortgage |
| Less than $10,000 | 127 (21.3%) | 0 (0.0%) |
| $10,000 to $24,999 | 38 (6.4%) | 0 (0.0%) |
| $25,000 to $34,999 | 115 (19.3%) | 10 (2.2%) |
| $35,000 to $49,999 | 9 (1.5%) | 63 (13.9%) |
| $50,000 to $74,999 | 123 (20.6%) | 48 (10.6%) |
| $75,000 to $99,999 | 79 (13.3%) | 88 (19.4%) |
| $100,000 to $149,999 | 53 (8.9%) | 49 (10.8%) |
| $150,000 or more | 52 (8.7%) | 107 (23.6%) |
| Total | 596 (100.0%) | 453 (100.0%) |
Property Value to Household Income Ratio in Lead
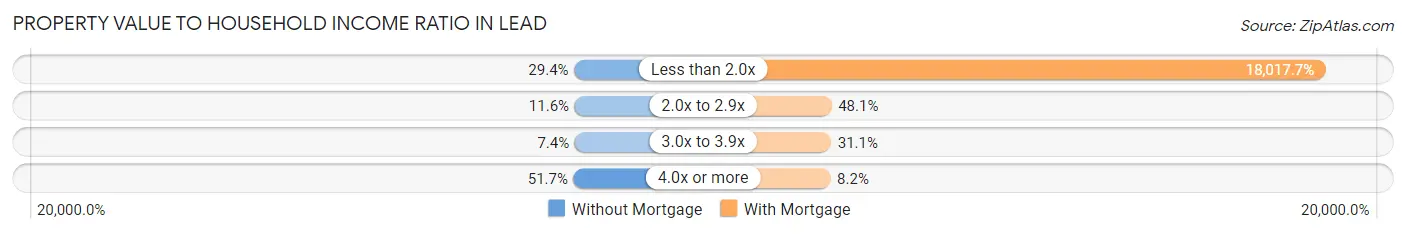
| Value-to-Income Ratio | Without Mortgage | With Mortgage |
| Less than 2.0x | 175 (29.4%) | 81,620 (18,017.7%) |
| 2.0x to 2.9x | 69 (11.6%) | 218 (48.1%) |
| 3.0x to 3.9x | 44 (7.4%) | 141 (31.1%) |
| 4.0x or more | 308 (51.7%) | 37 (8.2%) |
| Total | 596 (100.0%) | 453 (100.0%) |
Real Estate Taxes by Mortgage Status in Lead
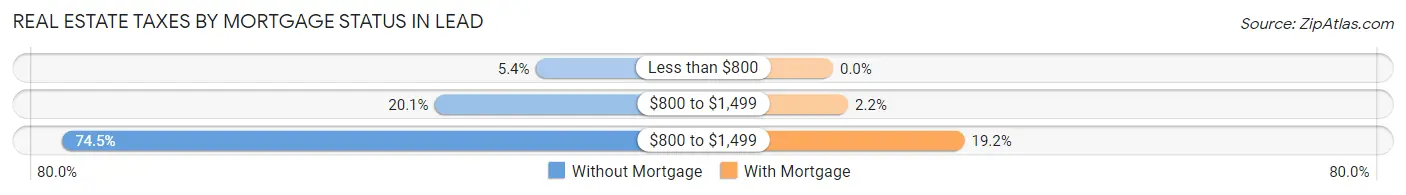
| Property Taxes | Without Mortgage | With Mortgage |
| Less than $800 | 32 (5.4%) | 0 (0.0%) |
| $800 to $1,499 | 120 (20.1%) | 10 (2.2%) |
| $800 to $1,499 | 444 (74.5%) | 87 (19.2%) |
| Total | 596 (100.0%) | 453 (100.0%) |
Health & Disability in Lead
Health Insurance Coverage by Age in Lead

| Age Bracket | With Coverage | Without Coverage |
| Under 6 Years | 133 (100.0%) | 0 (0.0%) |
| 6 to 18 Years | 315 (86.1%) | 51 (13.9%) |
| 19 to 25 Years | 159 (86.4%) | 25 (13.6%) |
| 26 to 34 Years | 333 (68.4%) | 154 (31.6%) |
| 35 to 44 Years | 259 (88.4%) | 34 (11.6%) |
| 45 to 54 Years | 113 (71.1%) | 46 (28.9%) |
| 55 to 64 Years | 562 (100.0%) | 0 (0.0%) |
| 65 to 74 Years | 501 (100.0%) | 0 (0.0%) |
| 75 Years and older | 302 (100.0%) | 0 (0.0%) |
| Total | 2,677 (89.6%) | 310 (10.4%) |
Health Insurance Coverage by Citizenship Status in Lead
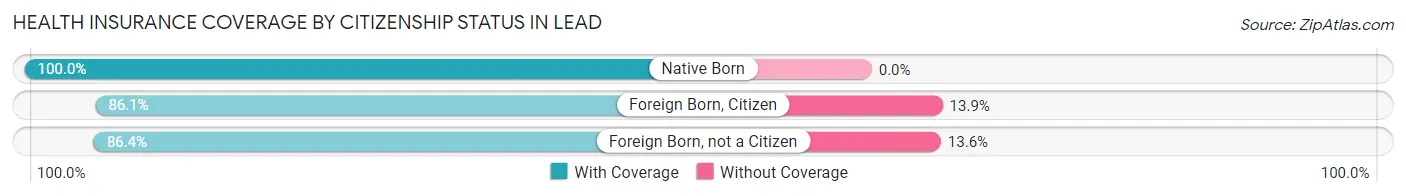
| Citizenship Status | With Coverage | Without Coverage |
| Native Born | 133 (100.0%) | 0 (0.0%) |
| Foreign Born, Citizen | 315 (86.1%) | 51 (13.9%) |
| Foreign Born, not a Citizen | 159 (86.4%) | 25 (13.6%) |
Health Insurance Coverage by Household Income in Lead
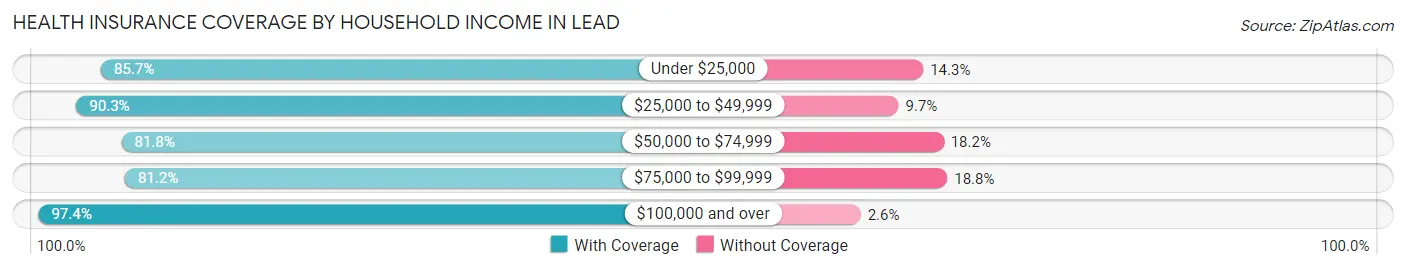
| Household Income | With Coverage | Without Coverage |
| Under $25,000 | 347 (85.7%) | 58 (14.3%) |
| $25,000 to $49,999 | 753 (90.3%) | 81 (9.7%) |
| $50,000 to $74,999 | 338 (81.8%) | 75 (18.2%) |
| $75,000 to $99,999 | 306 (81.2%) | 71 (18.8%) |
| $100,000 and over | 932 (97.4%) | 25 (2.6%) |
Public vs Private Health Insurance Coverage by Age in Lead
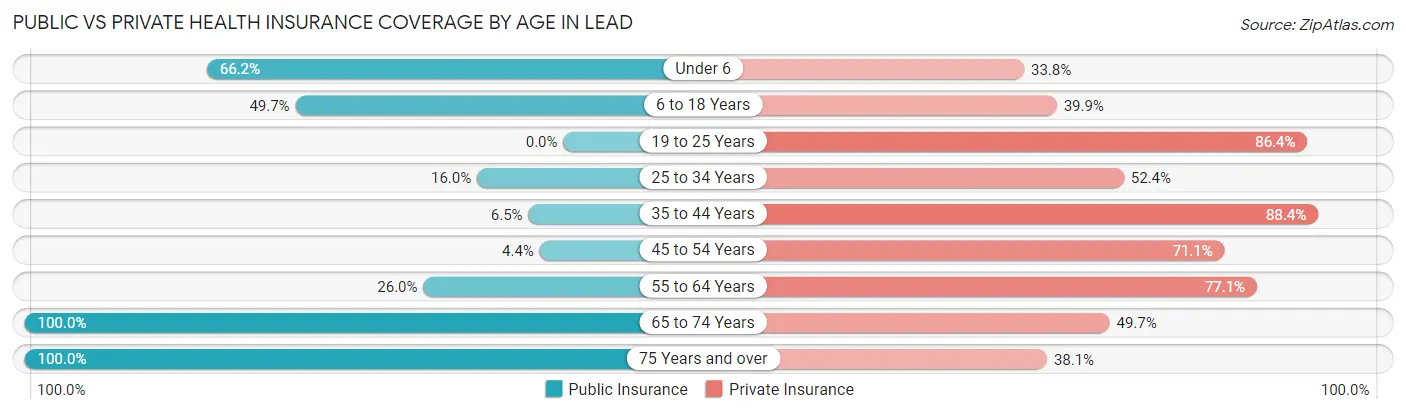
| Age Bracket | Public Insurance | Private Insurance |
| Under 6 | 88 (66.2%) | 45 (33.8%) |
| 6 to 18 Years | 182 (49.7%) | 146 (39.9%) |
| 19 to 25 Years | 0 (0.0%) | 159 (86.4%) |
| 25 to 34 Years | 78 (16.0%) | 255 (52.4%) |
| 35 to 44 Years | 19 (6.5%) | 259 (88.4%) |
| 45 to 54 Years | 7 (4.4%) | 113 (71.1%) |
| 55 to 64 Years | 146 (26.0%) | 433 (77.0%) |
| 65 to 74 Years | 501 (100.0%) | 249 (49.7%) |
| 75 Years and over | 302 (100.0%) | 115 (38.1%) |
| Total | 1,323 (44.3%) | 1,774 (59.4%) |
Disability Status by Sex by Age in Lead
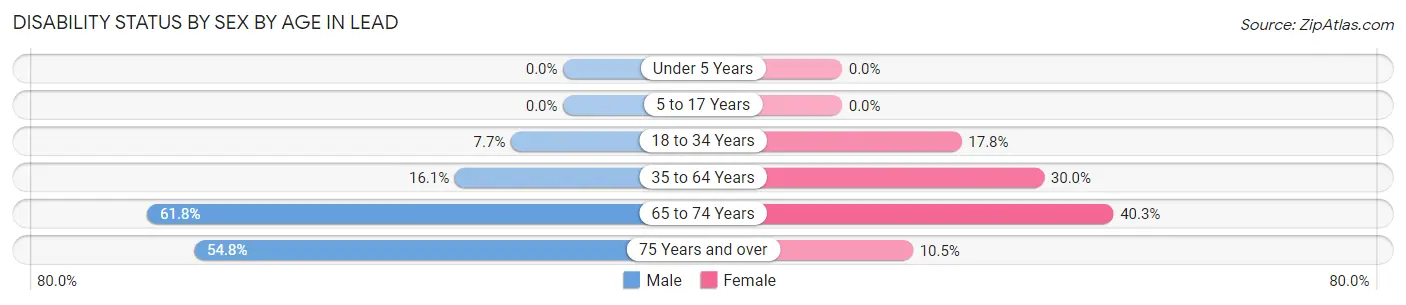
| Age Bracket | Male | Female |
| Under 5 Years | 0 (0.0%) | 0 (0.0%) |
| 5 to 17 Years | 0 (0.0%) | 0 (0.0%) |
| 18 to 34 Years | 24 (7.7%) | 68 (17.7%) |
| 35 to 64 Years | 73 (16.1%) | 168 (30.0%) |
| 65 to 74 Years | 144 (61.8%) | 108 (40.3%) |
| 75 Years and over | 51 (54.8%) | 22 (10.5%) |
Disability Class by Sex by Age in Lead
Disability Class: Hearing Difficulty
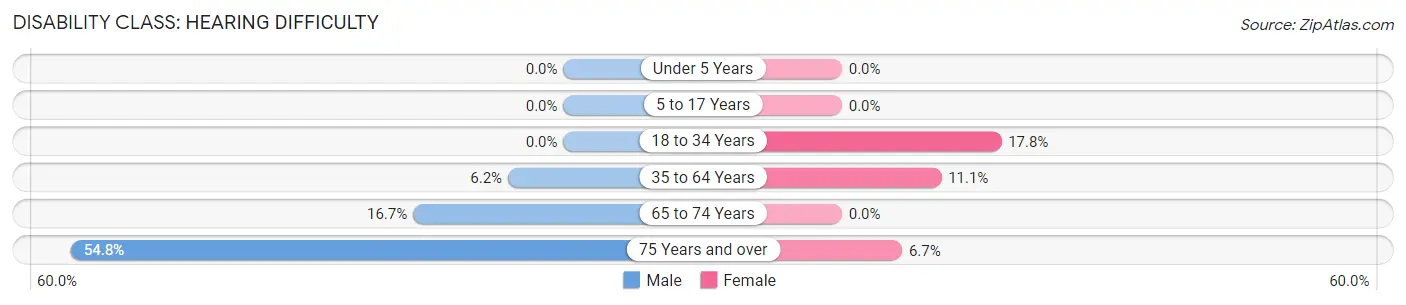
| Age Bracket | Male | Female |
| Under 5 Years | 0 (0.0%) | 0 (0.0%) |
| 5 to 17 Years | 0 (0.0%) | 0 (0.0%) |
| 18 to 34 Years | 0 (0.0%) | 68 (17.7%) |
| 35 to 64 Years | 28 (6.2%) | 62 (11.1%) |
| 65 to 74 Years | 39 (16.7%) | 0 (0.0%) |
| 75 Years and over | 51 (54.8%) | 14 (6.7%) |
Disability Class: Vision Difficulty
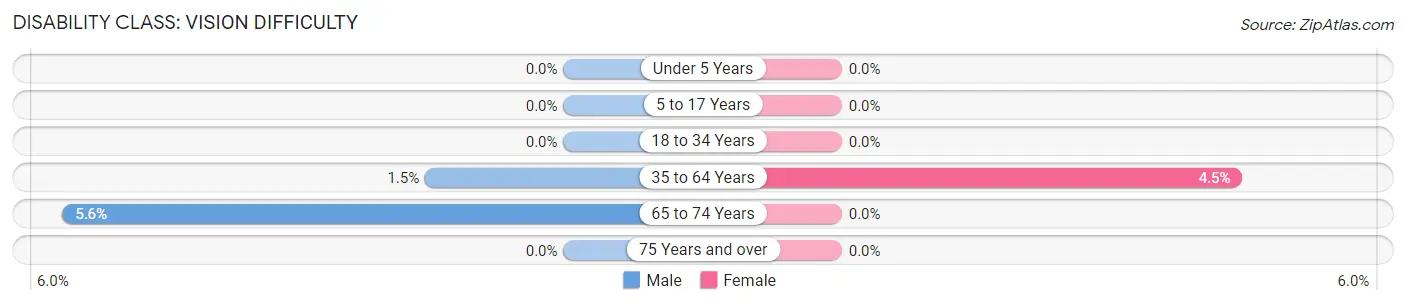
| Age Bracket | Male | Female |
| Under 5 Years | 0 (0.0%) | 0 (0.0%) |
| 5 to 17 Years | 0 (0.0%) | 0 (0.0%) |
| 18 to 34 Years | 0 (0.0%) | 0 (0.0%) |
| 35 to 64 Years | 7 (1.5%) | 25 (4.5%) |
| 65 to 74 Years | 13 (5.6%) | 0 (0.0%) |
| 75 Years and over | 0 (0.0%) | 0 (0.0%) |
Disability Class: Cognitive Difficulty
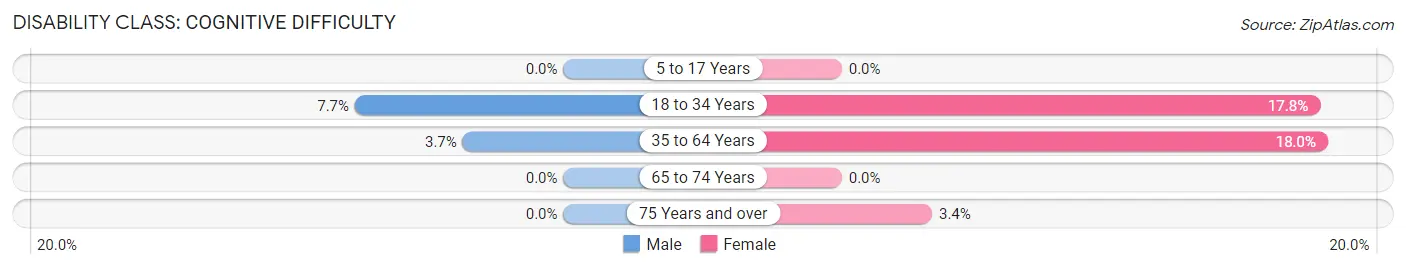
| Age Bracket | Male | Female |
| 5 to 17 Years | 0 (0.0%) | 0 (0.0%) |
| 18 to 34 Years | 24 (7.7%) | 68 (17.7%) |
| 35 to 64 Years | 17 (3.7%) | 101 (18.0%) |
| 65 to 74 Years | 0 (0.0%) | 0 (0.0%) |
| 75 Years and over | 0 (0.0%) | 7 (3.4%) |
Disability Class: Ambulatory Difficulty
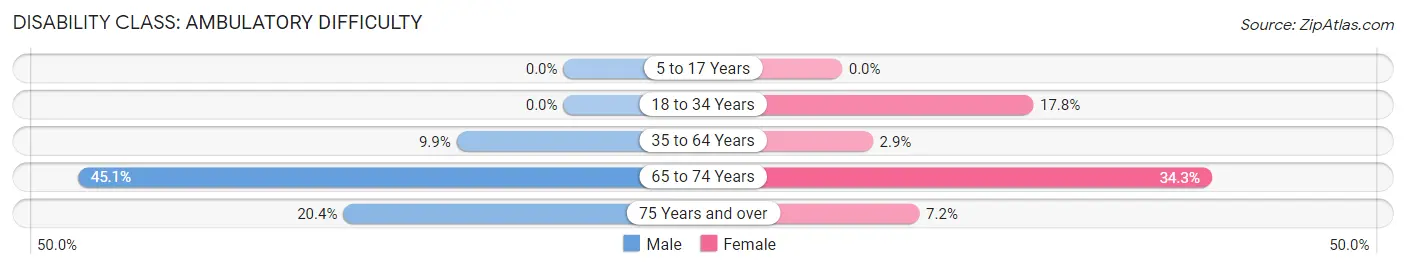
| Age Bracket | Male | Female |
| 5 to 17 Years | 0 (0.0%) | 0 (0.0%) |
| 18 to 34 Years | 0 (0.0%) | 68 (17.7%) |
| 35 to 64 Years | 45 (9.9%) | 16 (2.9%) |
| 65 to 74 Years | 105 (45.1%) | 92 (34.3%) |
| 75 Years and over | 19 (20.4%) | 15 (7.2%) |
Disability Class: Self-Care Difficulty
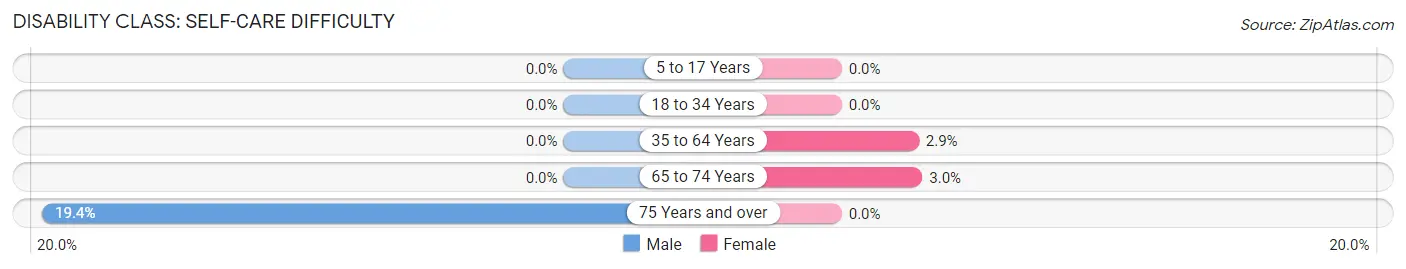
| Age Bracket | Male | Female |
| 5 to 17 Years | 0 (0.0%) | 0 (0.0%) |
| 18 to 34 Years | 0 (0.0%) | 0 (0.0%) |
| 35 to 64 Years | 0 (0.0%) | 16 (2.9%) |
| 65 to 74 Years | 0 (0.0%) | 8 (3.0%) |
| 75 Years and over | 18 (19.4%) | 0 (0.0%) |
Technology Access in Lead
Computing Device Access in Lead
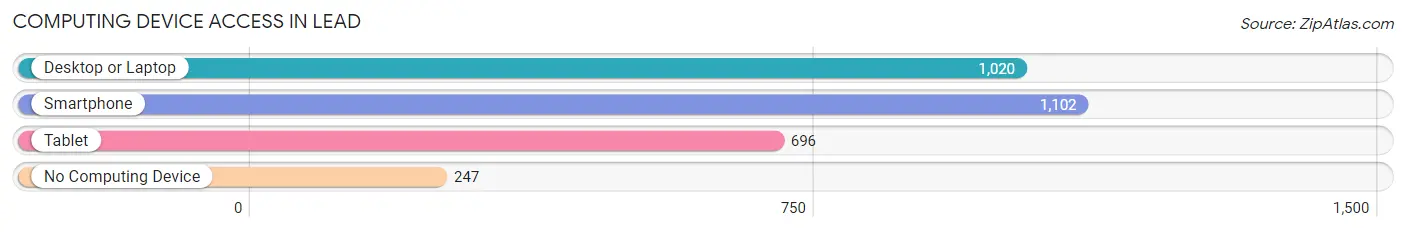
| Device Type | # Households | % Households |
| Desktop or Laptop | 1,020 | 70.3% |
| Smartphone | 1,102 | 75.9% |
| Tablet | 696 | 48.0% |
| No Computing Device | 247 | 17.0% |
| Total | 1,451 | 100.0% |
Internet Access in Lead
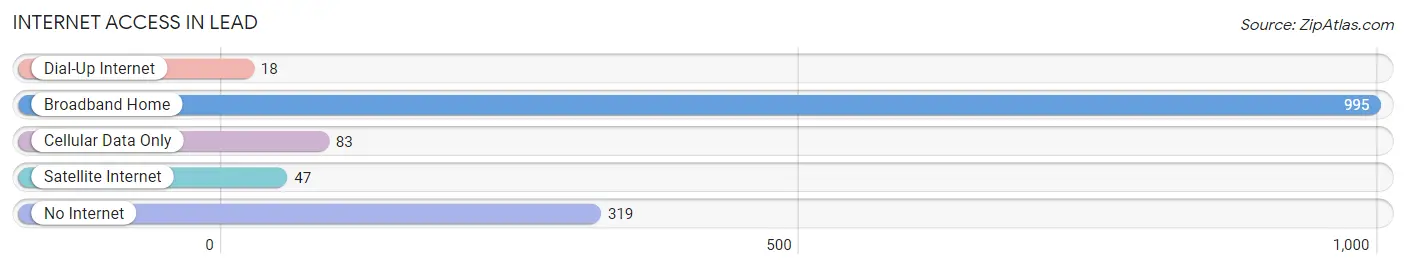
| Internet Type | # Households | % Households |
| Dial-Up Internet | 18 | 1.2% |
| Broadband Home | 995 | 68.6% |
| Cellular Data Only | 83 | 5.7% |
| Satellite Internet | 47 | 3.2% |
| No Internet | 319 | 22.0% |
| Total | 1,451 | 100.0% |
Lead Summary
South Dakota is a state located in the Midwestern region of the United States. It is bordered by North Dakota to the north, Minnesota to the east, Iowa to the southeast, Nebraska to the south, Wyoming to the west, and Montana to the northwest. South Dakota is the seventeenth largest state by area, and the fifth least populous state in the country. As of 2020, the population of South Dakota was estimated to be 884,659.
Geography
South Dakota is located in the Great Plains region of the United States. It is bordered by North Dakota to the north, Minnesota to the east, Iowa to the southeast, Nebraska to the south, Wyoming to the west, and Montana to the northwest. The Missouri River forms the eastern border of the state. South Dakota is divided into two distinct geographic regions: the eastern part of the state is characterized by rolling hills and prairies, while the western part of the state is dominated by the Black Hills, a mountain range that is home to Mount Rushmore National Memorial.
The highest point in South Dakota is Harney Peak, which is located in the Black Hills and has an elevation of 7,242 feet (2,207 m). The lowest point in the state is Big Stone Lake, which has an elevation of 966 feet (294 m).
Climate
South Dakota has a continental climate, with cold winters and hot summers. The average temperature in January is 19°F (-7°C), and the average temperature in July is 79°F (26°C). The state receives an average of 17 inches (43 cm) of precipitation per year.
Economy
South Dakota has a diversified economy, with agriculture, tourism, and manufacturing being the main industries. Agriculture is the largest sector of the state’s economy, accounting for about one-third of the state’s total economic output. The state’s main agricultural products include corn, soybeans, wheat, and hogs.
Tourism is also an important part of the state’s economy, with the Black Hills and Badlands National Park being the most popular tourist destinations. Manufacturing is also an important part of the state’s economy, with the largest employers being the food processing, machinery, and chemical industries.
Demographics
As of 2020, the population of South Dakota was estimated to be 884,659. The state has a population density of 10.7 people per square mile (4.2/km2). The largest city in the state is Sioux Falls, with a population of 183,200.
The racial makeup of South Dakota is 87.3% White, 8.2% Native American, 1.2% Asian, 0.7% Black, 0.2% Pacific Islander, and 2.4% from two or more races. The state has a median household income of $54,945, and a poverty rate of 11.2%.
The largest ancestry groups in South Dakota are German (37.2%), Norwegian (17.2%), Irish (13.2%), and English (10.2%). The state is also home to a large population of Native Americans, with the largest tribes being the Sioux, Cheyenne, and Oglala.
Conclusion
South Dakota is a state located in the Midwestern region of the United States. It is bordered by North Dakota to the north, Minnesota to the east, Iowa to the southeast, Nebraska to the south, Wyoming to the west, and Montana to the northwest. South Dakota has a continental climate, with cold winters and hot summers. The state has a diversified economy, with agriculture, tourism, and manufacturing being the main industries. As of 2020, the population of South Dakota was estimated to be 884,659. The largest ancestry groups in South Dakota are German, Norwegian, Irish, and English.
Common Questions
What is Per Capita Income in Lead?
Per Capita income in Lead is $33,471.
What is the Median Family Income in Lead?
Median Family Income in Lead is $80,169.
What is the Median Household income in Lead?
Median Household Income in Lead is $54,555.
What is Income or Wage Gap in Lead?
Income or Wage Gap in Lead is 21.3%.
Women in Lead earn 78.7 cents for every dollar earned by a man.
What is Inequality or Gini Index in Lead?
Inequality or Gini Index in Lead is 0.41.
What is the Total Population of Lead?
Total Population of Lead is 2,993.
What is the Total Male Population of Lead?
Total Male Population of Lead is 1,350.
What is the Total Female Population of Lead?
Total Female Population of Lead is 1,643.
What is the Ratio of Males per 100 Females in Lead?
There are 82.17 Males per 100 Females in Lead.
What is the Ratio of Females per 100 Males in Lead?
There are 121.70 Females per 100 Males in Lead.
What is the Median Population Age in Lead?
Median Population Age in Lead is 45.5 Years.
What is the Average Family Size in Lead
Average Family Size in Lead is 2.9 People.
What is the Average Household Size in Lead
Average Household Size in Lead is 2.1 People.
How Large is the Labor Force in Lead?
There are 1,666 People in the Labor Forcein in Lead.
What is the Percentage of People in the Labor Force in Lead?
65.4% of People are in the Labor Force in Lead.