Belle Fourche, SD Map & Demographics
Belle Fourche Map
Belle Fourche Overview
$34,987
PER CAPITA INCOME
$74,461
AVG FAMILY INCOME
$55,448
AVG HOUSEHOLD INCOME
48.1%
WAGE / INCOME GAP [ % ]
51.9¢/ $1
WAGE / INCOME GAP [ $ ]
0.51
INEQUALITY / GINI INDEX
5,670
TOTAL POPULATION
2,754
MALE POPULATION
2,916
FEMALE POPULATION
94.44
MALES / 100 FEMALES
105.88
FEMALES / 100 MALES
36.0
MEDIAN AGE
3.0
AVG FAMILY SIZE
2.4
AVG HOUSEHOLD SIZE
2,973
LABOR FORCE [ PEOPLE ]
66.1%
PERCENT IN LABOR FORCE
9.2%
UNEMPLOYMENT RATE
Belle Fourche Zip Codes
Belle Fourche Area Codes
Income in Belle Fourche
Income Overview in Belle Fourche
Per Capita Income in Belle Fourche is $34,987, while median incomes of families and households are $74,461 and $55,448 respectively.
| Characteristic | Number | Measure |
| Per Capita Income | 5,670 | $34,987 |
| Median Family Income | 1,426 | $74,461 |
| Mean Family Income | 1,426 | $111,820 |
| Median Household Income | 2,340 | $55,448 |
| Mean Household Income | 2,340 | $84,543 |
| Income Deficit | 1,426 | $0 |
| Wage / Income Gap (%) | 5,670 | 48.06% |
| Wage / Income Gap ($) | 5,670 | 51.94¢ per $1 |
| Gini / Inequality Index | 5,670 | 0.51 |
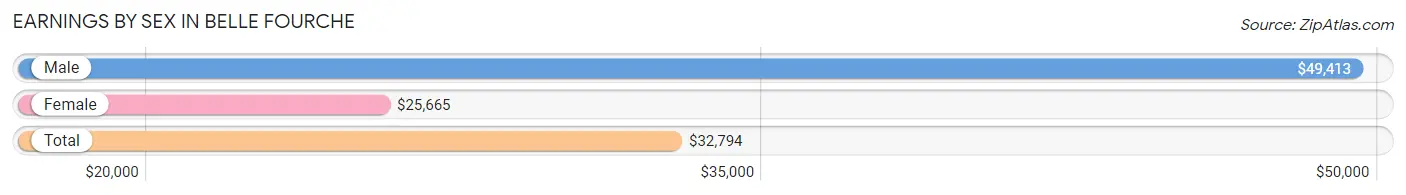
Earnings by Sex in Belle Fourche
Average Earnings in Belle Fourche are $32,794, $49,413 for men and $25,665 for women, a difference of 48.1%.
| Sex | Number | Average Earnings |
| Male | 1,495 (46.7%) | $49,413 |
| Female | 1,705 (53.3%) | $25,665 |
| Total | 3,200 (100.0%) | $32,794 |
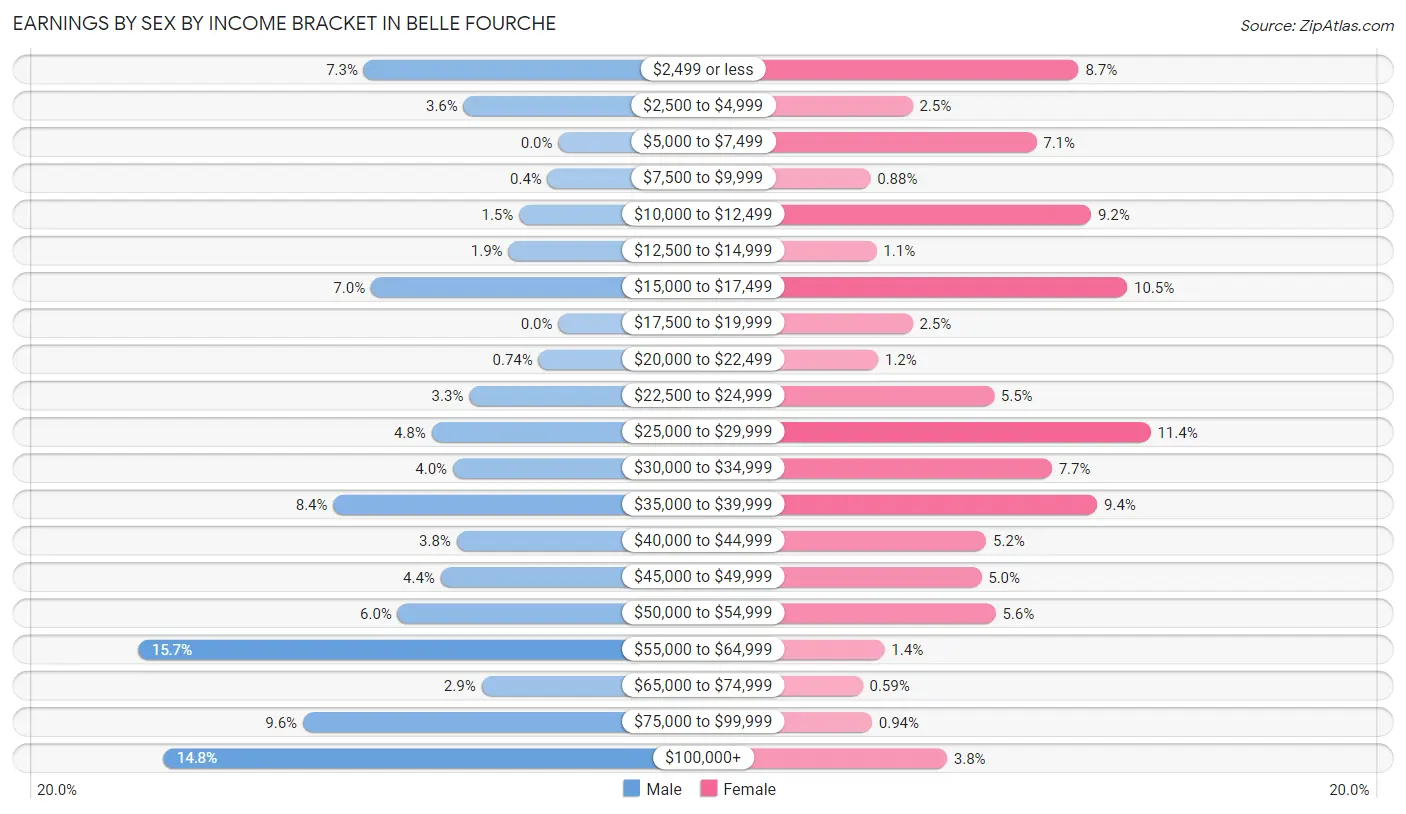
Earnings by Sex by Income Bracket in Belle Fourche
The most common earnings brackets in Belle Fourche are $55,000 to $64,999 for men (235 | 15.7%) and $25,000 to $29,999 for women (194 | 11.4%).
| Income | Male | Female |
| $2,499 or less | 109 (7.3%) | 148 (8.7%) |
| $2,500 to $4,999 | 53 (3.5%) | 42 (2.5%) |
| $5,000 to $7,499 | 0 (0.0%) | 121 (7.1%) |
| $7,500 to $9,999 | 6 (0.4%) | 15 (0.9%) |
| $10,000 to $12,499 | 22 (1.5%) | 156 (9.1%) |
| $12,500 to $14,999 | 28 (1.9%) | 19 (1.1%) |
| $15,000 to $17,499 | 105 (7.0%) | 179 (10.5%) |
| $17,500 to $19,999 | 0 (0.0%) | 42 (2.5%) |
| $20,000 to $22,499 | 11 (0.7%) | 20 (1.2%) |
| $22,500 to $24,999 | 50 (3.3%) | 94 (5.5%) |
| $25,000 to $29,999 | 71 (4.8%) | 194 (11.4%) |
| $30,000 to $34,999 | 59 (4.0%) | 131 (7.7%) |
| $35,000 to $39,999 | 126 (8.4%) | 160 (9.4%) |
| $40,000 to $44,999 | 57 (3.8%) | 89 (5.2%) |
| $45,000 to $49,999 | 66 (4.4%) | 86 (5.0%) |
| $50,000 to $54,999 | 90 (6.0%) | 95 (5.6%) |
| $55,000 to $64,999 | 235 (15.7%) | 24 (1.4%) |
| $65,000 to $74,999 | 43 (2.9%) | 10 (0.6%) |
| $75,000 to $99,999 | 143 (9.6%) | 16 (0.9%) |
| $100,000+ | 221 (14.8%) | 64 (3.7%) |
| Total | 1,495 (100.0%) | 1,705 (100.0%) |
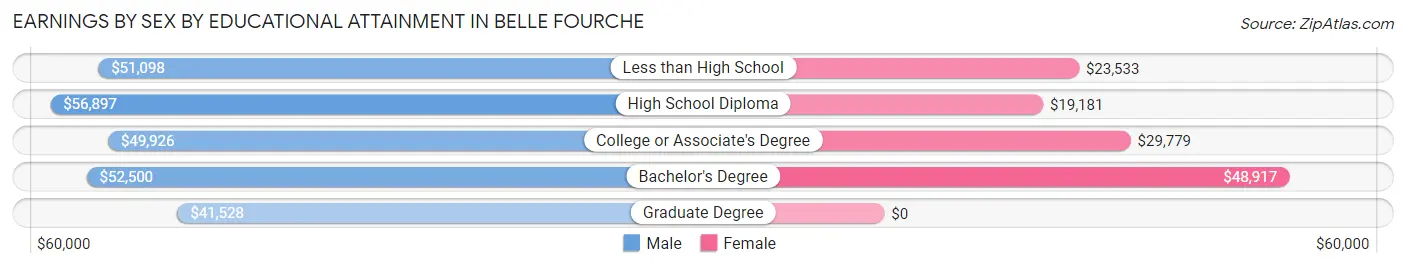
Earnings by Sex by Educational Attainment in Belle Fourche
Average earnings in Belle Fourche are $52,297 for men and $29,038 for women, a difference of 44.5%. Men with an educational attainment of high school diploma enjoy the highest average annual earnings of $56,897, while those with graduate degree education earn the least with $41,528. Women with an educational attainment of bachelor's degree earn the most with the average annual earnings of $48,917, while those with high school diploma education have the smallest earnings of $19,181.
| Educational Attainment | Male Income | Female Income |
| Less than High School | $51,098 | $23,533 |
| High School Diploma | $56,897 | $19,181 |
| College or Associate's Degree | $49,926 | $29,779 |
| Bachelor's Degree | $52,500 | $48,917 |
| Graduate Degree | $41,528 | $0 |
| Total | $52,297 | $29,038 |
Family Income in Belle Fourche
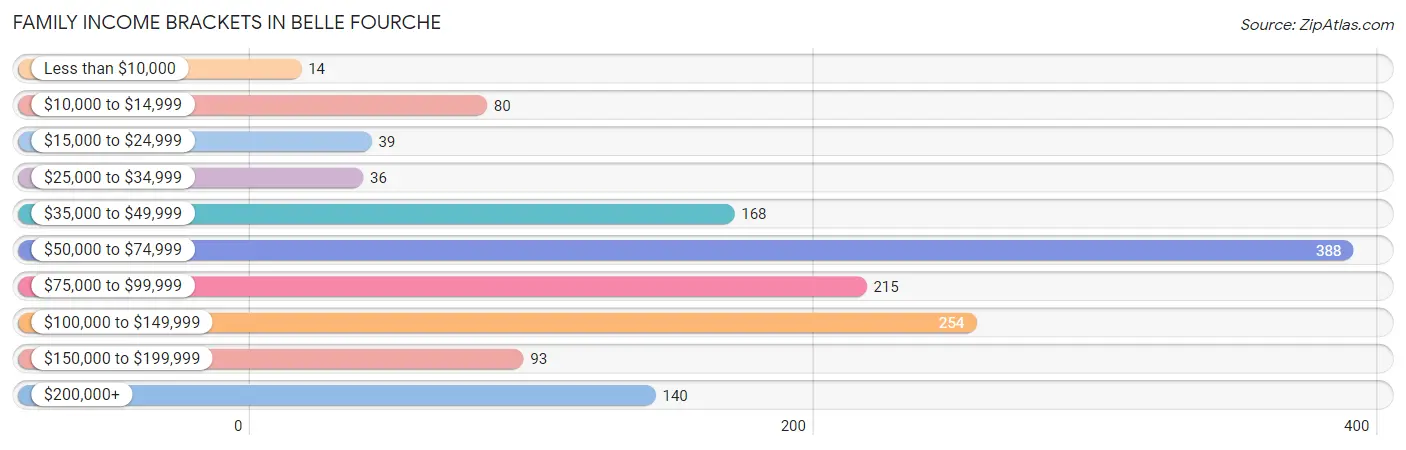
Family Income Brackets in Belle Fourche
According to the Belle Fourche family income data, there are 388 families falling into the $50,000 to $74,999 income range, which is the most common income bracket and makes up 27.2% of all families. Conversely, the less than $10,000 income bracket is the least frequent group with only 14 families (1.0%) belonging to this category.
| Income Bracket | # Families | % Families |
| Less than $10,000 | 14 | 1.0% |
| $10,000 to $14,999 | 80 | 5.6% |
| $15,000 to $24,999 | 39 | 2.7% |
| $25,000 to $34,999 | 36 | 2.5% |
| $35,000 to $49,999 | 168 | 11.8% |
| $50,000 to $74,999 | 388 | 27.2% |
| $75,000 to $99,999 | 215 | 15.1% |
| $100,000 to $149,999 | 254 | 17.8% |
| $150,000 to $199,999 | 93 | 6.5% |
| $200,000+ | 140 | 9.8% |
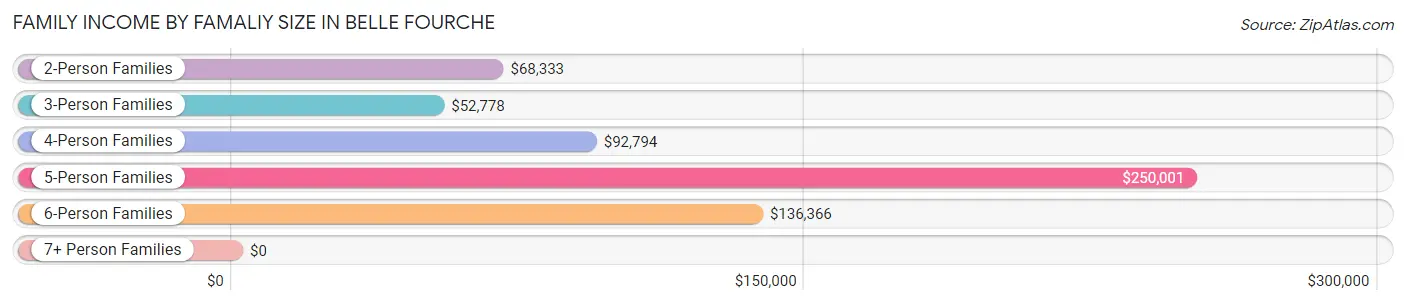
Family Income by Famaliy Size in Belle Fourche
5-person families (105 | 7.4%) account for the highest median family income in Belle Fourche with $250,001 per family, while 5-person families (105 | 7.4%) have the highest median income of $50,000 per family member.
| Income Bracket | # Families | Median Income |
| 2-Person Families | 694 (48.7%) | $68,333 |
| 3-Person Families | 238 (16.7%) | $52,778 |
| 4-Person Families | 302 (21.2%) | $92,794 |
| 5-Person Families | 105 (7.4%) | $250,001 |
| 6-Person Families | 75 (5.3%) | $136,366 |
| 7+ Person Families | 12 (0.8%) | $0 |
| Total | 1,426 (100.0%) | $74,461 |
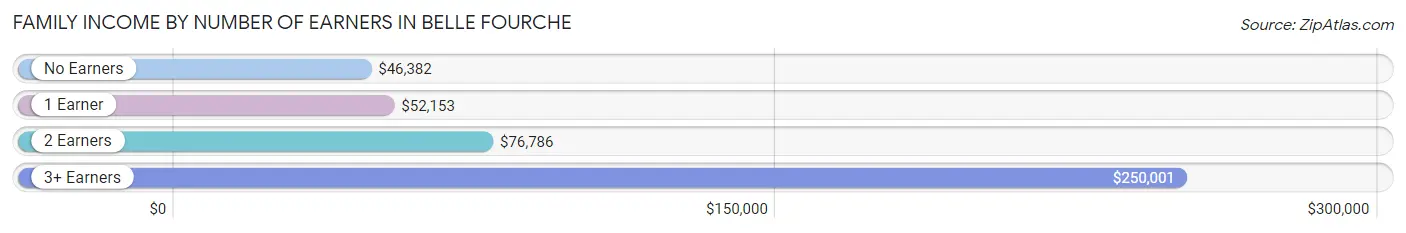
Family Income by Number of Earners in Belle Fourche
The median family income in Belle Fourche is $74,461, with families comprising 3+ earners (135) having the highest median family income of $250,001, while families with no earners (187) have the lowest median family income of $46,382, accounting for 9.5% and 13.1% of families, respectively.
| Number of Earners | # Families | Median Income |
| No Earners | 187 (13.1%) | $46,382 |
| 1 Earner | 392 (27.5%) | $52,153 |
| 2 Earners | 712 (49.9%) | $76,786 |
| 3+ Earners | 135 (9.5%) | $250,001 |
| Total | 1,426 (100.0%) | $74,461 |
Household Income in Belle Fourche
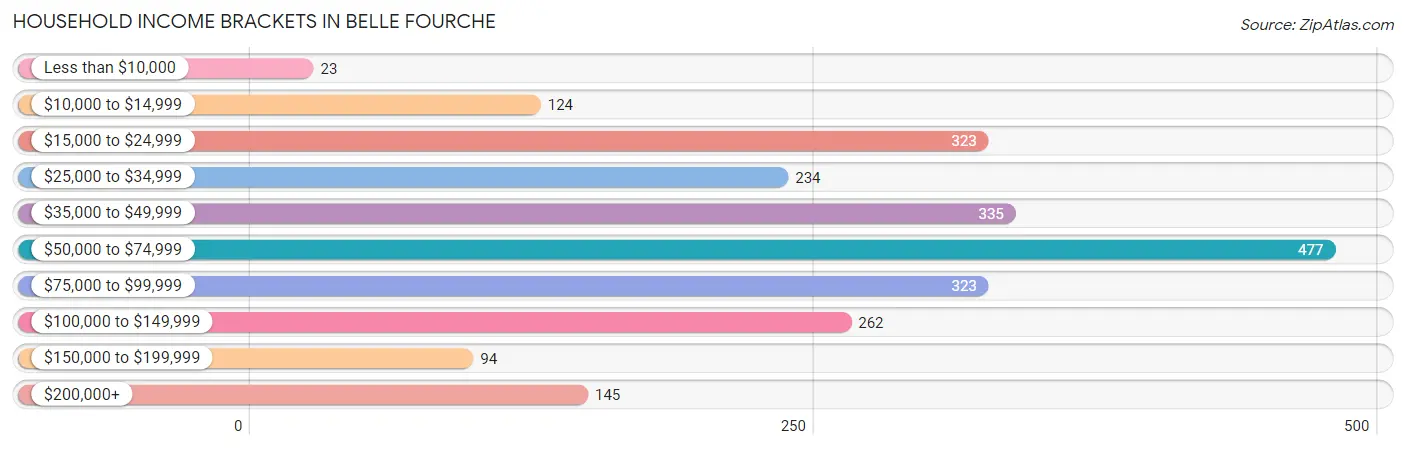
Household Income Brackets in Belle Fourche
With 477 households falling in the category, the $50,000 to $74,999 income range is the most frequent in Belle Fourche, accounting for 20.4% of all households. In contrast, only 23 households (1.0%) fall into the less than $10,000 income bracket, making it the least populous group.
| Income Bracket | # Households | % Households |
| Less than $10,000 | 23 | 1.0% |
| $10,000 to $14,999 | 124 | 5.3% |
| $15,000 to $24,999 | 323 | 13.8% |
| $25,000 to $34,999 | 234 | 10.0% |
| $35,000 to $49,999 | 335 | 14.3% |
| $50,000 to $74,999 | 477 | 20.4% |
| $75,000 to $99,999 | 323 | 13.8% |
| $100,000 to $149,999 | 262 | 11.2% |
| $150,000 to $199,999 | 94 | 4.0% |
| $200,000+ | 145 | 6.2% |
Household Income by Householder Age in Belle Fourche
The median household income in Belle Fourche is $55,448, with the highest median household income of $73,563 found in the 25 to 44 years age bracket for the primary householder. A total of 820 households (35.0%) fall into this category. Meanwhile, the 15 to 24 years age bracket for the primary householder has the lowest median household income of $30,428, with 133 households (5.7%) in this group.
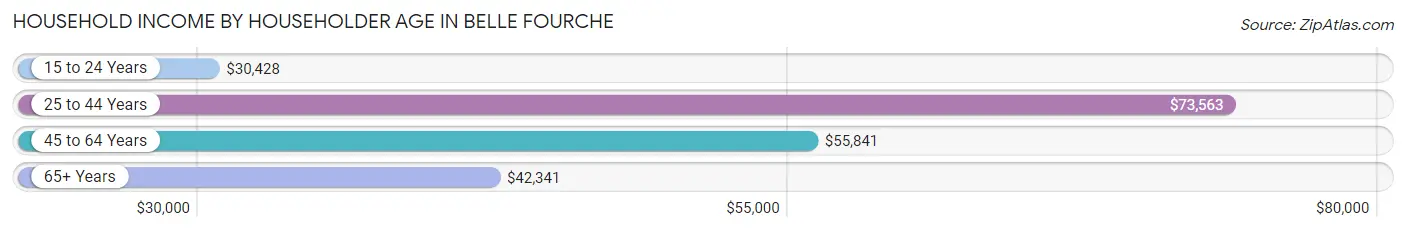
| Income Bracket | # Households | Median Income |
| 15 to 24 Years | 133 (5.7%) | $30,428 |
| 25 to 44 Years | 820 (35.0%) | $73,563 |
| 45 to 64 Years | 763 (32.6%) | $55,841 |
| 65+ Years | 624 (26.7%) | $42,341 |
| Total | 2,340 (100.0%) | $55,448 |
Poverty in Belle Fourche
Income Below Poverty by Sex and Age in Belle Fourche
With 6.2% poverty level for males and 11.0% for females among the residents of Belle Fourche, 75 year old and over males and 18 to 24 year old females are the most vulnerable to poverty, with 55 males (38.5%) and 164 females (65.3%) in their respective age groups living below the poverty level.
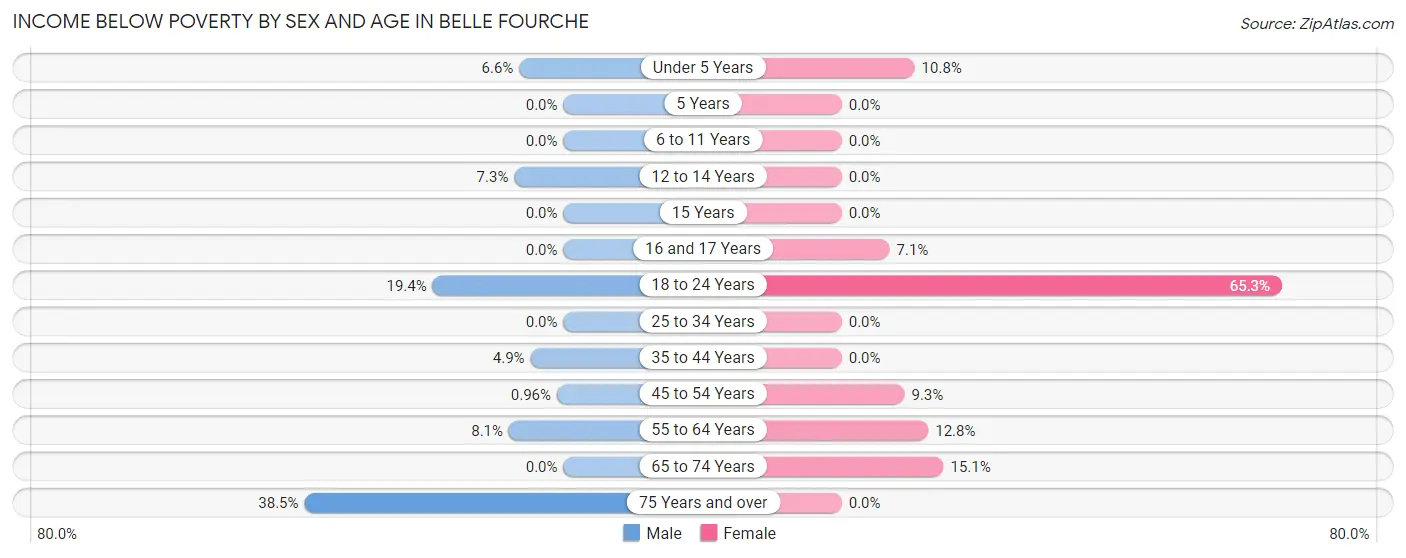
| Age Bracket | Male | Female |
| Under 5 Years | 8 (6.6%) | 21 (10.8%) |
| 5 Years | 0 (0.0%) | 0 (0.0%) |
| 6 to 11 Years | 0 (0.0%) | 0 (0.0%) |
| 12 to 14 Years | 14 (7.3%) | 0 (0.0%) |
| 15 Years | 0 (0.0%) | 0 (0.0%) |
| 16 and 17 Years | 0 (0.0%) | 13 (7.1%) |
| 18 to 24 Years | 40 (19.4%) | 164 (65.3%) |
| 25 to 34 Years | 0 (0.0%) | 0 (0.0%) |
| 35 to 44 Years | 17 (4.9%) | 0 (0.0%) |
| 45 to 54 Years | 3 (1.0%) | 34 (9.3%) |
| 55 to 64 Years | 28 (8.1%) | 38 (12.8%) |
| 65 to 74 Years | 0 (0.0%) | 42 (15.1%) |
| 75 Years and over | 55 (38.5%) | 0 (0.0%) |
| Total | 165 (6.2%) | 312 (11.0%) |
Income Above Poverty by Sex and Age in Belle Fourche
According to the poverty statistics in Belle Fourche, males aged 5 years and females aged 5 years are the age groups that are most secure financially, with 100.0% of males and 100.0% of females in these age groups living above the poverty line.
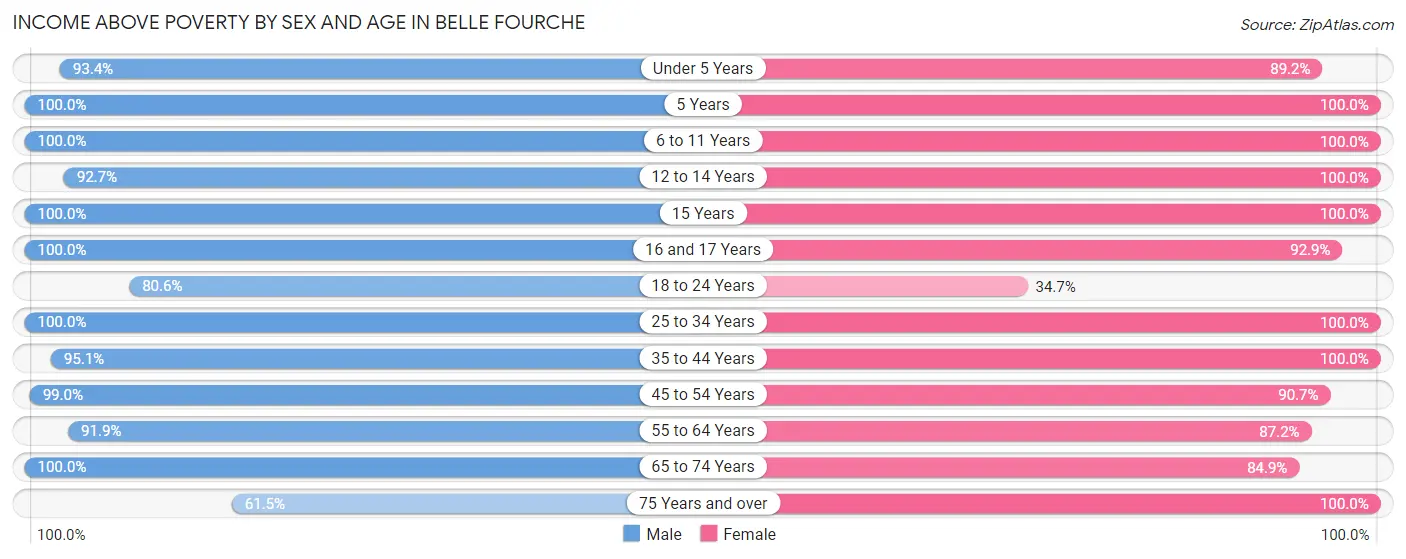
| Age Bracket | Male | Female |
| Under 5 Years | 114 (93.4%) | 173 (89.2%) |
| 5 Years | 34 (100.0%) | 18 (100.0%) |
| 6 to 11 Years | 200 (100.0%) | 207 (100.0%) |
| 12 to 14 Years | 178 (92.7%) | 38 (100.0%) |
| 15 Years | 104 (100.0%) | 12 (100.0%) |
| 16 and 17 Years | 12 (100.0%) | 170 (92.9%) |
| 18 to 24 Years | 166 (80.6%) | 87 (34.7%) |
| 25 to 34 Years | 467 (100.0%) | 368 (100.0%) |
| 35 to 44 Years | 331 (95.1%) | 376 (100.0%) |
| 45 to 54 Years | 310 (99.0%) | 331 (90.7%) |
| 55 to 64 Years | 318 (91.9%) | 258 (87.2%) |
| 65 to 74 Years | 182 (100.0%) | 236 (84.9%) |
| 75 Years and over | 88 (61.5%) | 259 (100.0%) |
| Total | 2,504 (93.8%) | 2,533 (89.0%) |
Income Below Poverty Among Married-Couple Families in Belle Fourche
The poverty statistics for married-couple families in Belle Fourche show that 5.6% or 60 of the total 1,068 families live below the poverty line. Families with no children have the highest poverty rate of 10.4%, comprising of 60 families. On the other hand, families with 1 or 2 children have the lowest poverty rate of 0.0%, which includes 0 families.
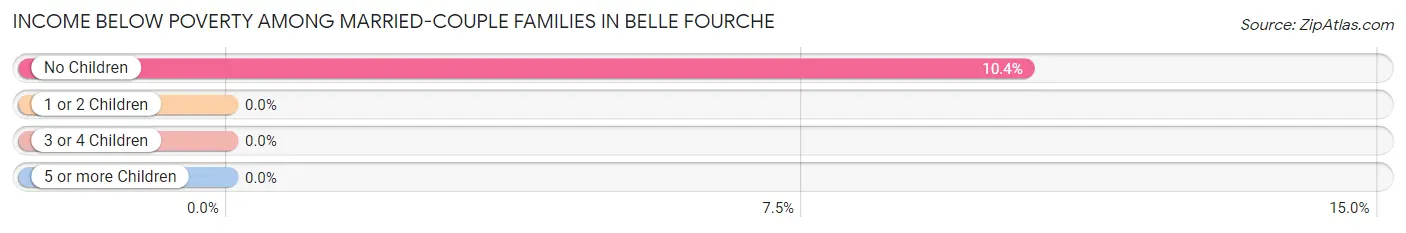
| Children | Above Poverty | Below Poverty |
| No Children | 517 (89.6%) | 60 (10.4%) |
| 1 or 2 Children | 392 (100.0%) | 0 (0.0%) |
| 3 or 4 Children | 87 (100.0%) | 0 (0.0%) |
| 5 or more Children | 12 (100.0%) | 0 (0.0%) |
| Total | 1,008 (94.4%) | 60 (5.6%) |
Income Below Poverty Among Single-Parent Households in Belle Fourche
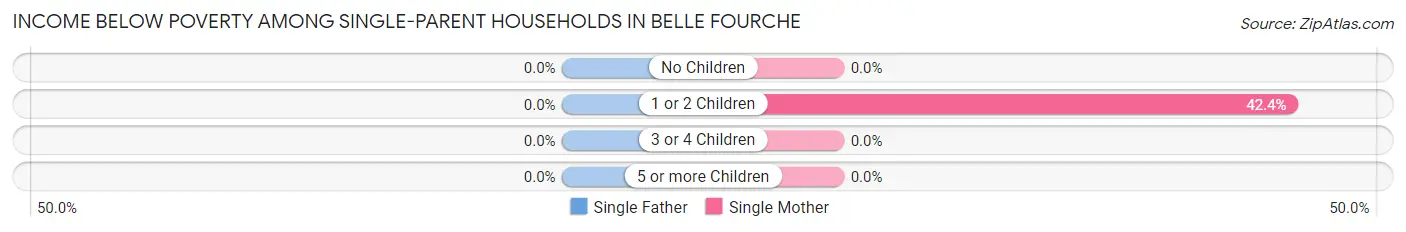
| Children | Single Father | Single Mother |
| No Children | 0 (0.0%) | 0 (0.0%) |
| 1 or 2 Children | 0 (0.0%) | 72 (42.3%) |
| 3 or 4 Children | 0 (0.0%) | 0 (0.0%) |
| 5 or more Children | 0 (0.0%) | 0 (0.0%) |
| Total | 0 (0.0%) | 72 (28.1%) |
Income Below Poverty Among Married-Couple vs Single-Parent Households in Belle Fourche
The poverty data for Belle Fourche shows that 60 of the married-couple family households (5.6%) and 72 of the single-parent households (20.1%) are living below the poverty level. Within the married-couple family households, those with no children have the highest poverty rate, with 60 households (10.4%) falling below the poverty line. Among the single-parent households, those with 1 or 2 children have the highest poverty rate, with 72 household (28.2%) living below poverty.
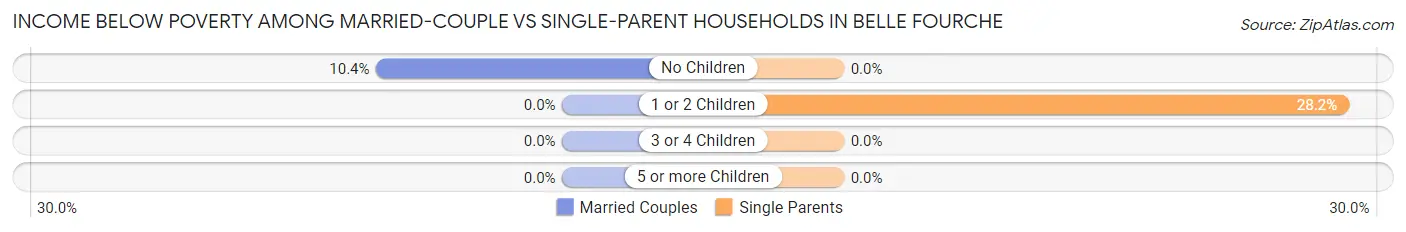
| Children | Married-Couple Families | Single-Parent Households |
| No Children | 60 (10.4%) | 0 (0.0%) |
| 1 or 2 Children | 0 (0.0%) | 72 (28.2%) |
| 3 or 4 Children | 0 (0.0%) | 0 (0.0%) |
| 5 or more Children | 0 (0.0%) | 0 (0.0%) |
| Total | 60 (5.6%) | 72 (20.1%) |
Race in Belle Fourche
The most populous races in Belle Fourche are White / Caucasian (5,046 | 89.0%), Two or more Races (409 | 7.2%), and Hispanic or Latino (335 | 5.9%).
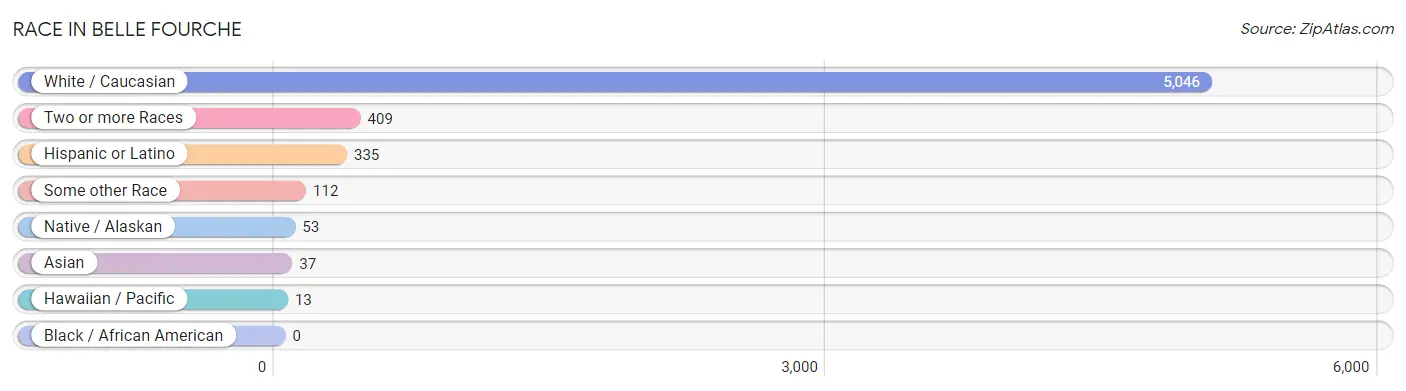
| Race | # Population | % Population |
| Asian | 37 | 0.6% |
| Black / African American | 0 | 0.0% |
| Hawaiian / Pacific | 13 | 0.2% |
| Hispanic or Latino | 335 | 5.9% |
| Native / Alaskan | 53 | 0.9% |
| White / Caucasian | 5,046 | 89.0% |
| Two or more Races | 409 | 7.2% |
| Some other Race | 112 | 2.0% |
| Total | 5,670 | 100.0% |
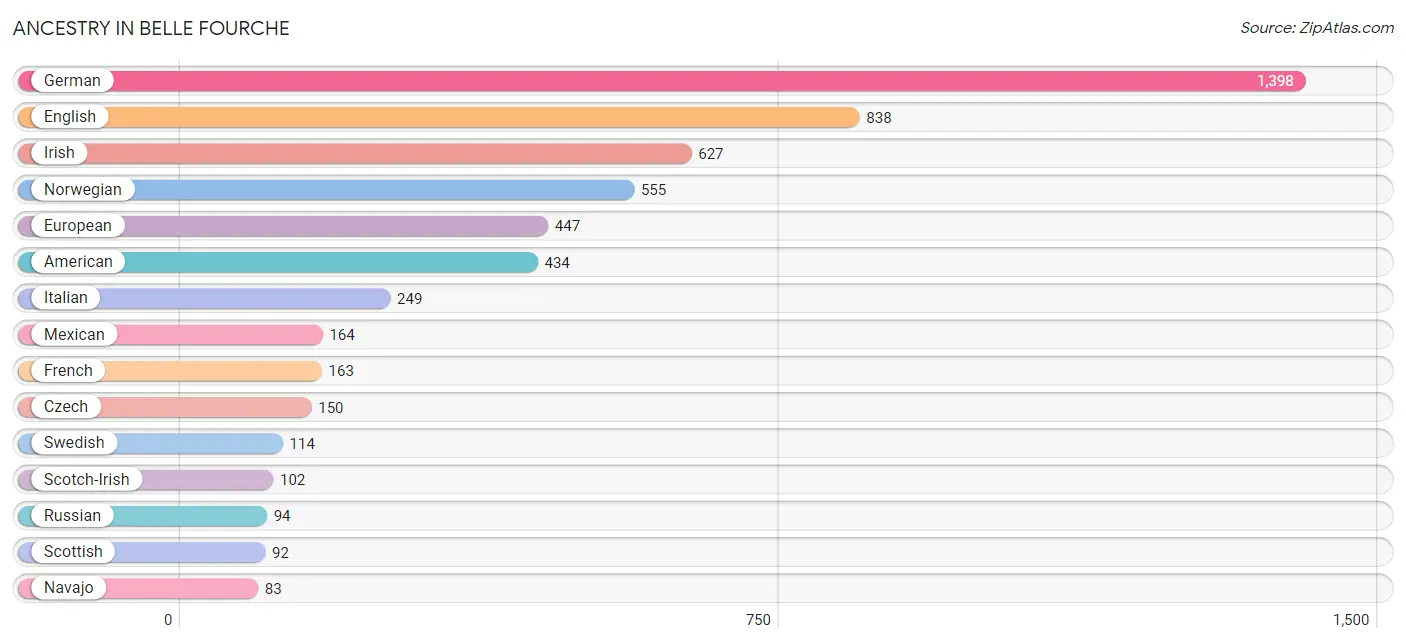
Ancestry in Belle Fourche
The most populous ancestries reported in Belle Fourche are German (1,398 | 24.7%), English (838 | 14.8%), Irish (627 | 11.1%), Norwegian (555 | 9.8%), and European (447 | 7.9%), together accounting for 68.2% of all Belle Fourche residents.
| Ancestry | # Population | % Population |
| American | 434 | 7.6% |
| Austrian | 4 | 0.1% |
| Belgian | 32 | 0.6% |
| Canadian | 9 | 0.2% |
| Choctaw | 49 | 0.9% |
| Creek | 40 | 0.7% |
| Czech | 150 | 2.6% |
| Danish | 57 | 1.0% |
| Dutch | 77 | 1.4% |
| Eastern European | 79 | 1.4% |
| English | 838 | 14.8% |
| European | 447 | 7.9% |
| Finnish | 75 | 1.3% |
| French | 163 | 2.9% |
| French Canadian | 61 | 1.1% |
| German | 1,398 | 24.7% |
| German Russian | 3 | 0.1% |
| Irish | 627 | 11.1% |
| Italian | 249 | 4.4% |
| Latvian | 14 | 0.3% |
| Mexican | 164 | 2.9% |
| Native Hawaiian | 13 | 0.2% |
| Navajo | 83 | 1.5% |
| Norwegian | 555 | 9.8% |
| Polish | 49 | 0.9% |
| Puerto Rican | 34 | 0.6% |
| Romanian | 20 | 0.4% |
| Russian | 94 | 1.7% |
| Scandinavian | 1 | 0.0% |
| Scotch-Irish | 102 | 1.8% |
| Scottish | 92 | 1.6% |
| Sioux | 54 | 0.9% |
| Spanish | 64 | 1.1% |
| Spanish American | 8 | 0.1% |
| Swedish | 114 | 2.0% |
| Swiss | 25 | 0.4% |
| Thai | 37 | 0.6% |
| Ukrainian | 12 | 0.2% |
| Ute | 12 | 0.2% | View All 39 Rows |
Immigrants in Belle Fourche
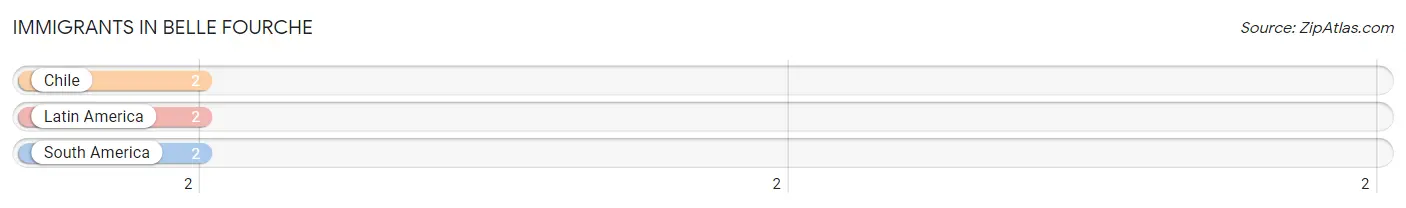
The most numerous immigrant groups reported in Belle Fourche came from Chile (2 | 0.0%), Latin America (2 | 0.0%), and South America (2 | 0.0%), together accounting for 0.1% of all Belle Fourche residents.
| Immigration Origin | # Population | % Population |
| Chile | 2 | 0.0% |
| Latin America | 2 | 0.0% |
| South America | 2 | 0.0% | View All 3 Rows |
Sex and Age in Belle Fourche
Sex and Age in Belle Fourche
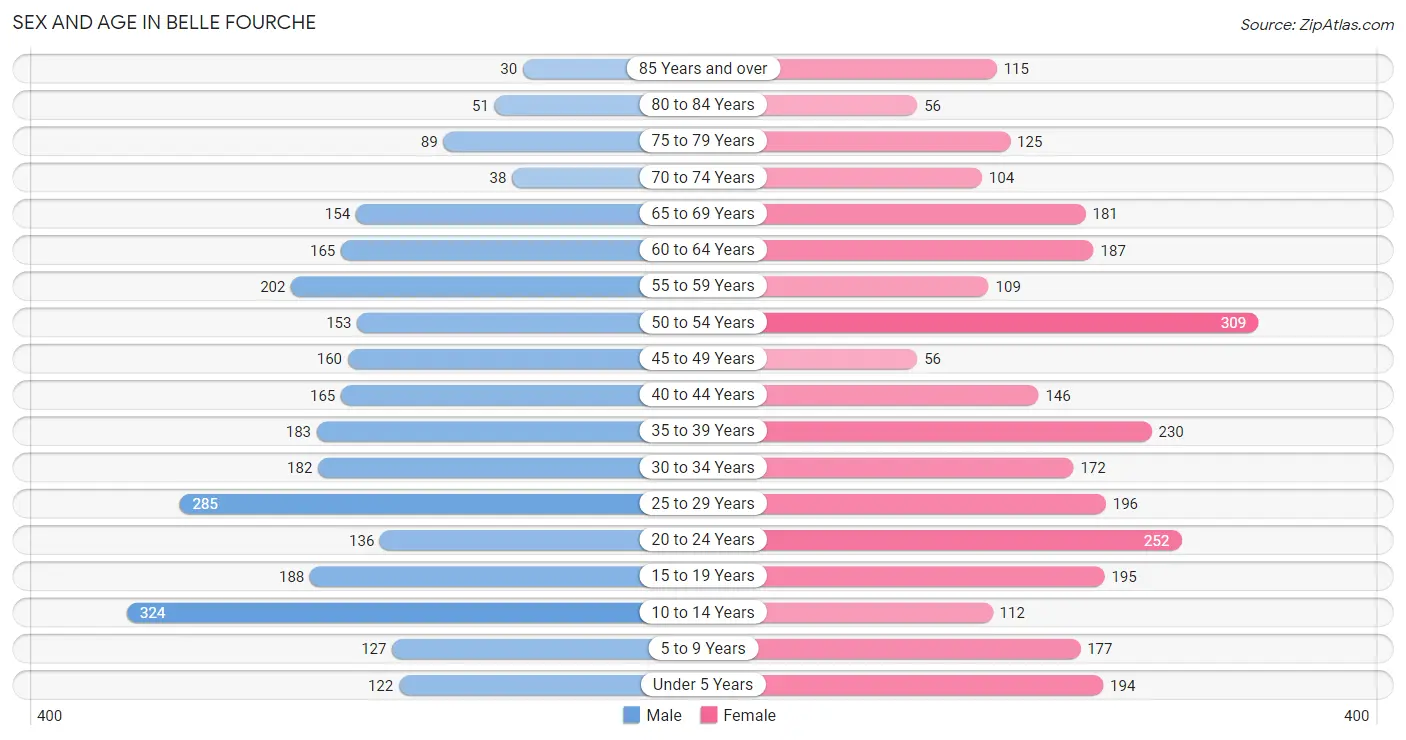
The most populous age groups in Belle Fourche are 10 to 14 Years (324 | 11.8%) for men and 50 to 54 Years (309 | 10.6%) for women.
| Age Bracket | Male | Female |
| Under 5 Years | 122 (4.4%) | 194 (6.7%) |
| 5 to 9 Years | 127 (4.6%) | 177 (6.1%) |
| 10 to 14 Years | 324 (11.8%) | 112 (3.8%) |
| 15 to 19 Years | 188 (6.8%) | 195 (6.7%) |
| 20 to 24 Years | 136 (4.9%) | 252 (8.6%) |
| 25 to 29 Years | 285 (10.3%) | 196 (6.7%) |
| 30 to 34 Years | 182 (6.6%) | 172 (5.9%) |
| 35 to 39 Years | 183 (6.6%) | 230 (7.9%) |
| 40 to 44 Years | 165 (6.0%) | 146 (5.0%) |
| 45 to 49 Years | 160 (5.8%) | 56 (1.9%) |
| 50 to 54 Years | 153 (5.6%) | 309 (10.6%) |
| 55 to 59 Years | 202 (7.3%) | 109 (3.7%) |
| 60 to 64 Years | 165 (6.0%) | 187 (6.4%) |
| 65 to 69 Years | 154 (5.6%) | 181 (6.2%) |
| 70 to 74 Years | 38 (1.4%) | 104 (3.6%) |
| 75 to 79 Years | 89 (3.2%) | 125 (4.3%) |
| 80 to 84 Years | 51 (1.8%) | 56 (1.9%) |
| 85 Years and over | 30 (1.1%) | 115 (3.9%) |
| Total | 2,754 (100.0%) | 2,916 (100.0%) |
Families and Households in Belle Fourche
Median Family Size in Belle Fourche
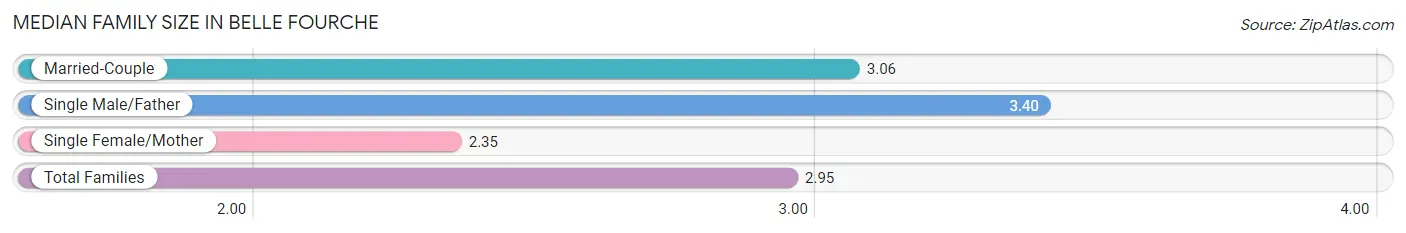
The median family size in Belle Fourche is 2.95 persons per family, with single male/father families (102 | 7.1%) accounting for the largest median family size of 3.4 persons per family. On the other hand, single female/mother families (256 | 17.9%) represent the smallest median family size with 2.35 persons per family.
| Family Type | # Families | Family Size |
| Married-Couple | 1,068 (74.9%) | 3.06 |
| Single Male/Father | 102 (7.1%) | 3.40 |
| Single Female/Mother | 256 (17.9%) | 2.35 |
| Total Families | 1,426 (100.0%) | 2.95 |
Median Household Size in Belle Fourche
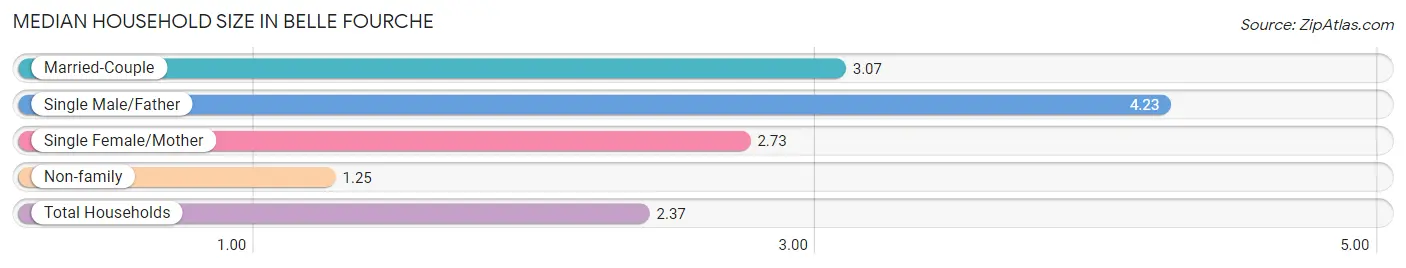
The median household size in Belle Fourche is 2.37 persons per household, with single male/father households (102 | 4.4%) accounting for the largest median household size of 4.23 persons per household. non-family households (914 | 39.1%) represent the smallest median household size with 1.25 persons per household.
| Household Type | # Households | Household Size |
| Married-Couple | 1,068 (45.6%) | 3.07 |
| Single Male/Father | 102 (4.4%) | 4.23 |
| Single Female/Mother | 256 (10.9%) | 2.73 |
| Non-family | 914 (39.1%) | 1.25 |
| Total Households | 2,340 (100.0%) | 2.37 |
Household Size by Marriage Status in Belle Fourche
Out of a total of 2,340 households in Belle Fourche, 1,426 (60.9%) are family households, while 914 (39.1%) are nonfamily households. The most numerous type of family households are 2-person households, comprising 635, and the most common type of nonfamily households are 1-person households, comprising 744.
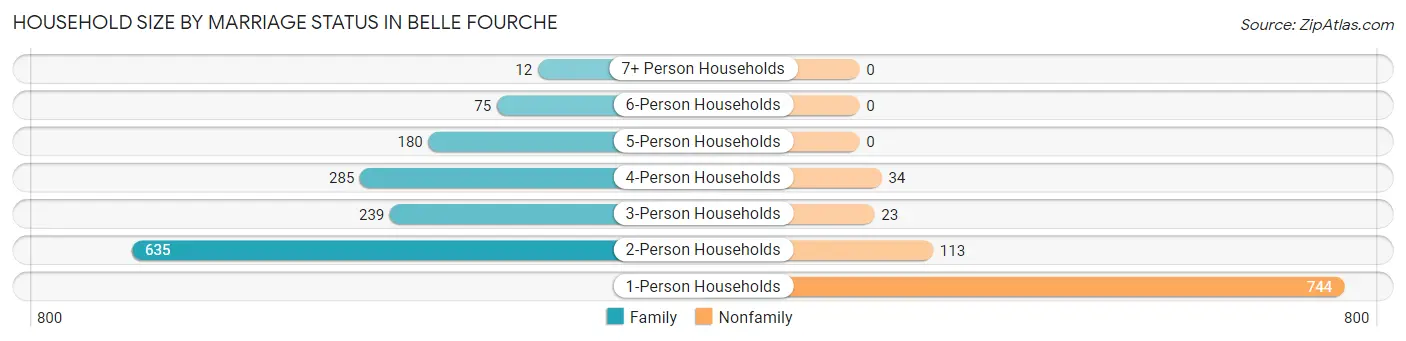
| Household Size | Family Households | Nonfamily Households |
| 1-Person Households | - | 744 (31.8%) |
| 2-Person Households | 635 (27.1%) | 113 (4.8%) |
| 3-Person Households | 239 (10.2%) | 23 (1.0%) |
| 4-Person Households | 285 (12.2%) | 34 (1.5%) |
| 5-Person Households | 180 (7.7%) | 0 (0.0%) |
| 6-Person Households | 75 (3.2%) | 0 (0.0%) |
| 7+ Person Households | 12 (0.5%) | 0 (0.0%) |
| Total | 1,426 (60.9%) | 914 (39.1%) |
Female Fertility in Belle Fourche
Fertility by Age in Belle Fourche
Average fertility rate in Belle Fourche is 25.0 births per 1,000 women. Women in the age bracket of 20 to 34 years have the highest fertility rate with 32.0 births per 1,000 women. Women in the age bracket of 20 to 34 years acount for 55.6% of all women with births.
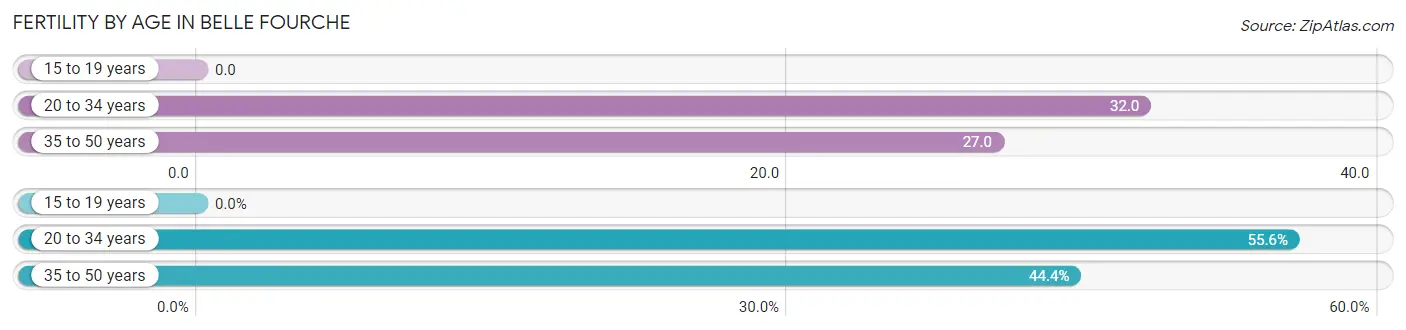
| Age Bracket | Women with Births | Births / 1,000 Women |
| 15 to 19 years | 0 (0.0%) | 0.0 |
| 20 to 34 years | 20 (55.6%) | 32.0 |
| 35 to 50 years | 16 (44.4%) | 27.0 |
| Total | 36 (100.0%) | 25.0 |
Fertility by Age by Marriage Status in Belle Fourche
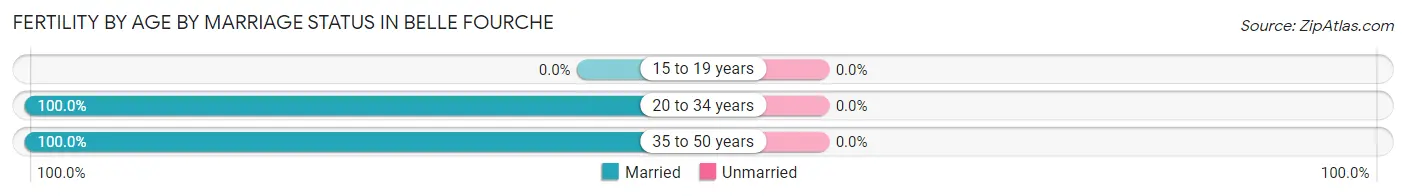
| Age Bracket | Married | Unmarried |
| 15 to 19 years | 0 (0.0%) | 0 (0.0%) |
| 20 to 34 years | 20 (100.0%) | 0 (0.0%) |
| 35 to 50 years | 16 (100.0%) | 0 (0.0%) |
| Total | 36 (100.0%) | 0 (0.0%) |
Fertility by Education in Belle Fourche
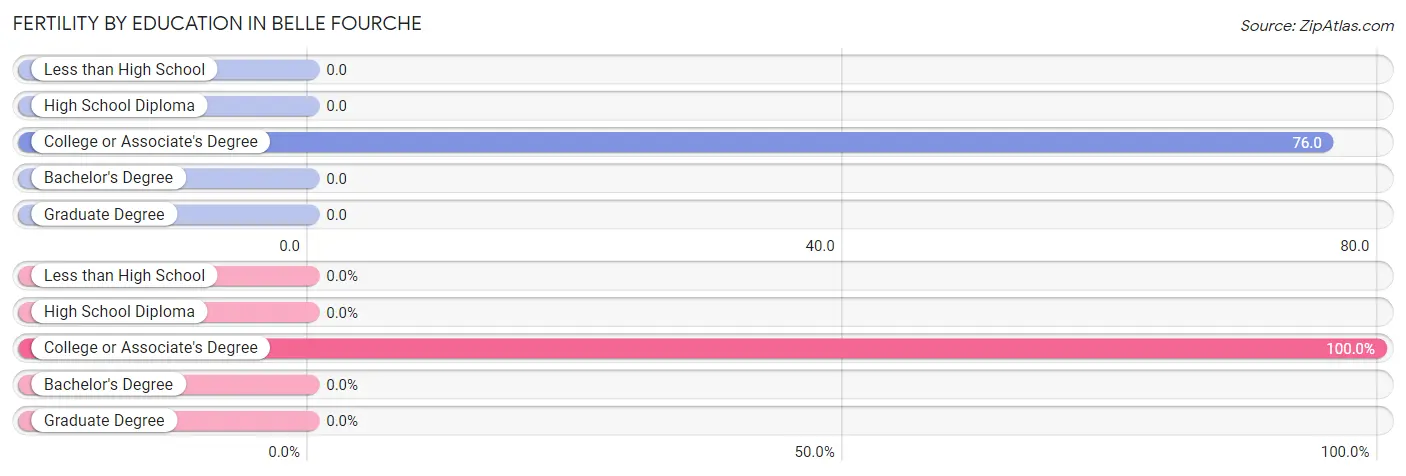
| Educational Attainment | Women with Births | Births / 1,000 Women |
| Less than High School | 0 (0.0%) | 0.0 |
| High School Diploma | 0 (0.0%) | 0.0 |
| College or Associate's Degree | 36 (100.0%) | 76.0 |
| Bachelor's Degree | 0 (0.0%) | 0.0 |
| Graduate Degree | 0 (0.0%) | 0.0 |
| Total | 36 (100.0%) | 25.0 |
Fertility by Education by Marriage Status in Belle Fourche
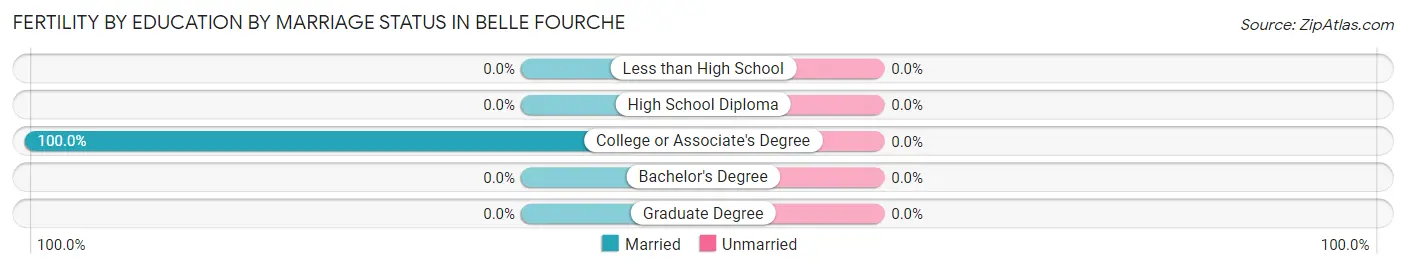
| Educational Attainment | Married | Unmarried |
| Less than High School | 0 (0.0%) | 0 (0.0%) |
| High School Diploma | 0 (0.0%) | 0 (0.0%) |
| College or Associate's Degree | 36 (100.0%) | 0 (0.0%) |
| Bachelor's Degree | 0 (0.0%) | 0 (0.0%) |
| Graduate Degree | 0 (0.0%) | 0 (0.0%) |
| Total | 36 (100.0%) | 0 (0.0%) |
Employment Characteristics in Belle Fourche
Employment by Class of Employer in Belle Fourche
Among the 2,590 employed individuals in Belle Fourche, private company employees (1,618 | 62.5%), local government employees (367 | 14.2%), and not-for-profit organizations (243 | 9.4%) make up the most common classes of employment.
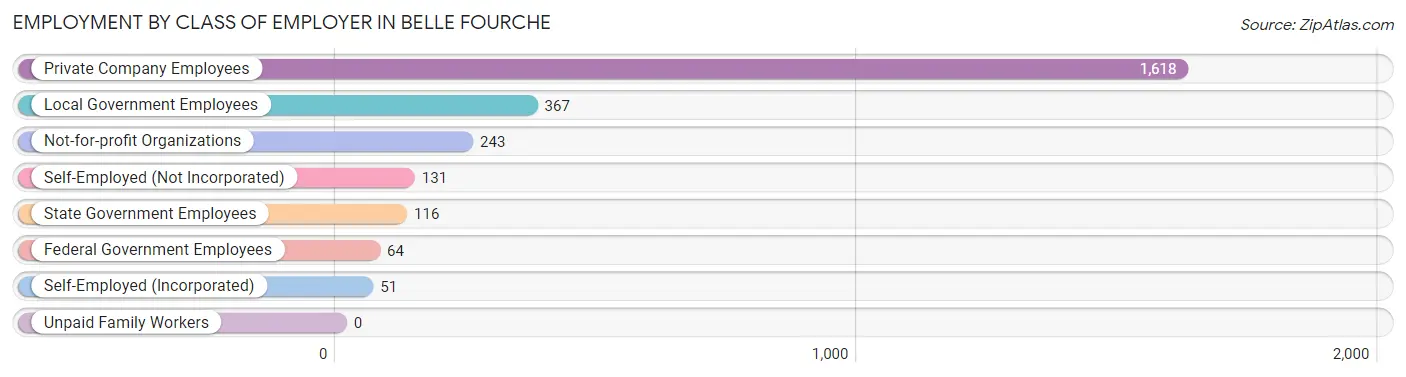
| Employer Class | # Employees | % Employees |
| Private Company Employees | 1,618 | 62.5% |
| Self-Employed (Incorporated) | 51 | 2.0% |
| Self-Employed (Not Incorporated) | 131 | 5.1% |
| Not-for-profit Organizations | 243 | 9.4% |
| Local Government Employees | 367 | 14.2% |
| State Government Employees | 116 | 4.5% |
| Federal Government Employees | 64 | 2.5% |
| Unpaid Family Workers | 0 | 0.0% |
| Total | 2,590 | 100.0% |
Employment Status by Age in Belle Fourche
According to the labor force statistics for Belle Fourche, out of the total population over 16 years of age (4,498), 66.1% or 2,973 individuals are in the labor force, with 9.2% or 274 of them unemployed. The age group with the highest labor force participation rate is 55 to 59 years, with 92.0% or 286 individuals in the labor force. Within the labor force, the 16 to 19 years age range has the highest percentage of unemployed individuals, with 21.6% or 38 of them being unemployed.
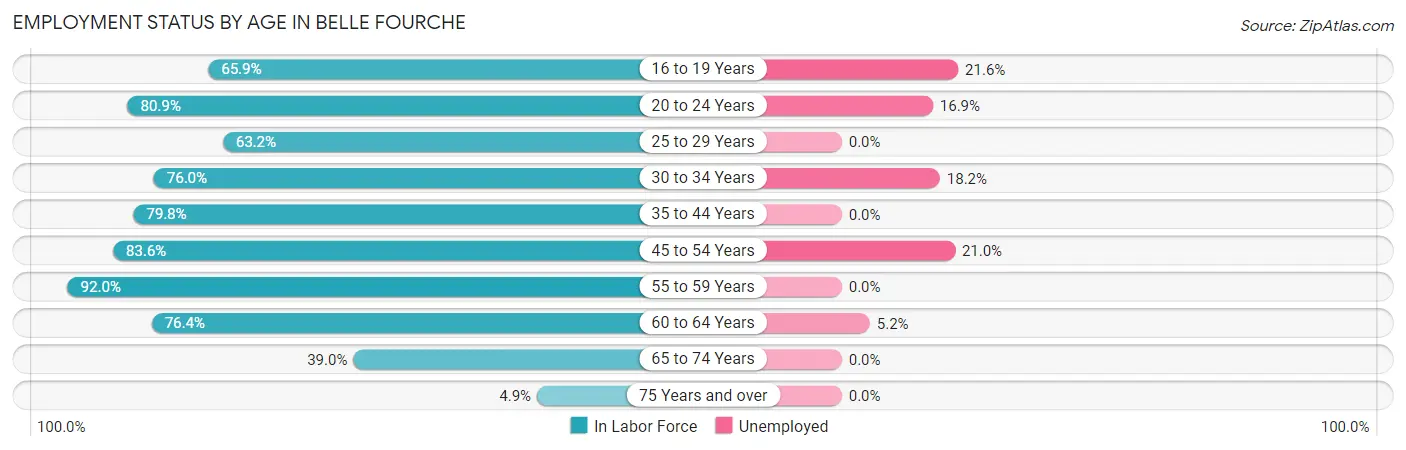
| Age Bracket | In Labor Force | Unemployed |
| 16 to 19 Years | 176 (65.9%) | 38 (21.6%) |
| 20 to 24 Years | 314 (80.9%) | 53 (16.9%) |
| 25 to 29 Years | 304 (63.2%) | 0 (0.0%) |
| 30 to 34 Years | 269 (76.0%) | 49 (18.2%) |
| 35 to 44 Years | 578 (79.8%) | 0 (0.0%) |
| 45 to 54 Years | 567 (83.6%) | 119 (21.0%) |
| 55 to 59 Years | 286 (92.0%) | 0 (0.0%) |
| 60 to 64 Years | 269 (76.4%) | 14 (5.2%) |
| 65 to 74 Years | 186 (39.0%) | 0 (0.0%) |
| 75 Years and over | 23 (4.9%) | 0 (0.0%) |
| Total | 2,973 (66.1%) | 274 (9.2%) |
Employment Status by Educational Attainment in Belle Fourche
According to labor force statistics for Belle Fourche, 78.4% of individuals (2,274) out of the total population between 25 and 64 years of age (2,900) are in the labor force, with 8.0% or 182 of them being unemployed. The group with the highest labor force participation rate are those with the educational attainment of bachelor's degree or higher, with 87.8% or 367 individuals in the labor force. Within the labor force, individuals with high school diploma education have the highest percentage of unemployment, with 16.8% or 128 of them being unemployed.
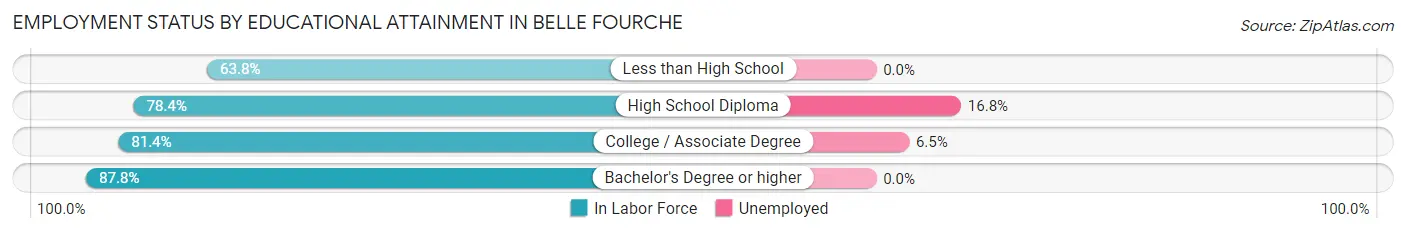
| Educational Attainment | In Labor Force | Unemployed |
| Less than High School | 308 (63.8%) | 0 (0.0%) |
| High School Diploma | 764 (78.4%) | 164 (16.8%) |
| College / Associate Degree | 834 (81.4%) | 67 (6.5%) |
| Bachelor's Degree or higher | 367 (87.8%) | 0 (0.0%) |
| Total | 2,274 (78.4%) | 232 (8.0%) |
Employment Occupations by Sex in Belle Fourche
Management, Business, Science and Arts Occupations
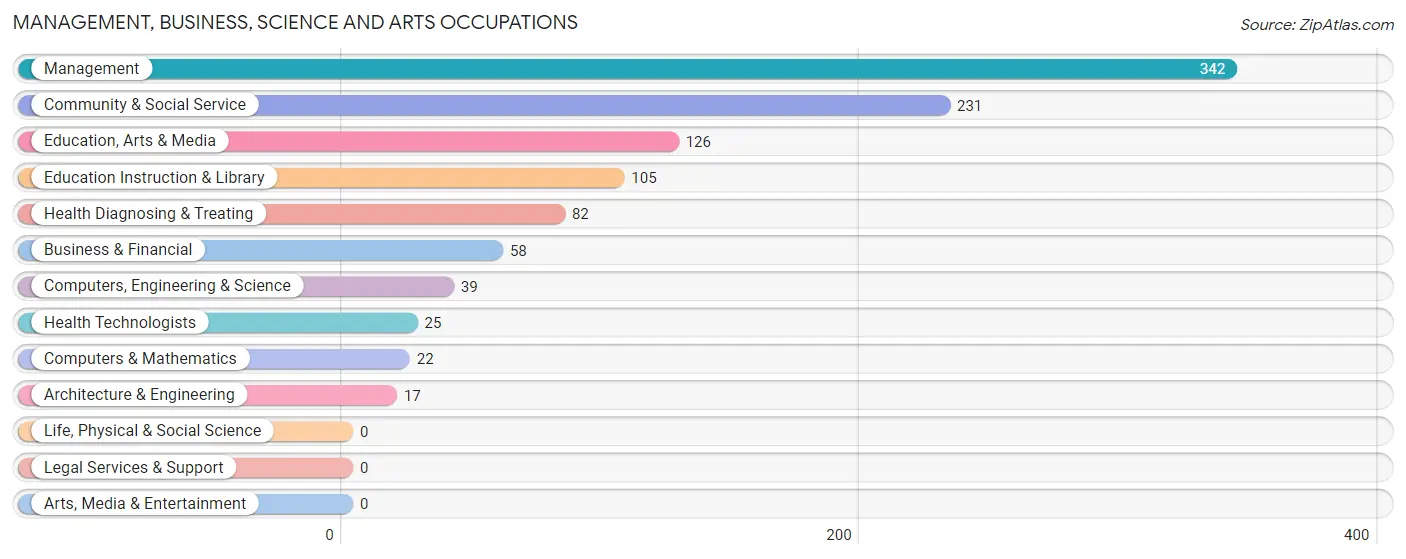
The most common Management, Business, Science and Arts occupations in Belle Fourche are Management (342 | 12.7%), Community & Social Service (231 | 8.6%), Education, Arts & Media (126 | 4.7%), Education Instruction & Library (105 | 3.9%), and Health Diagnosing & Treating (82 | 3.0%).
Management, Business, Science and Arts Occupations by Sex
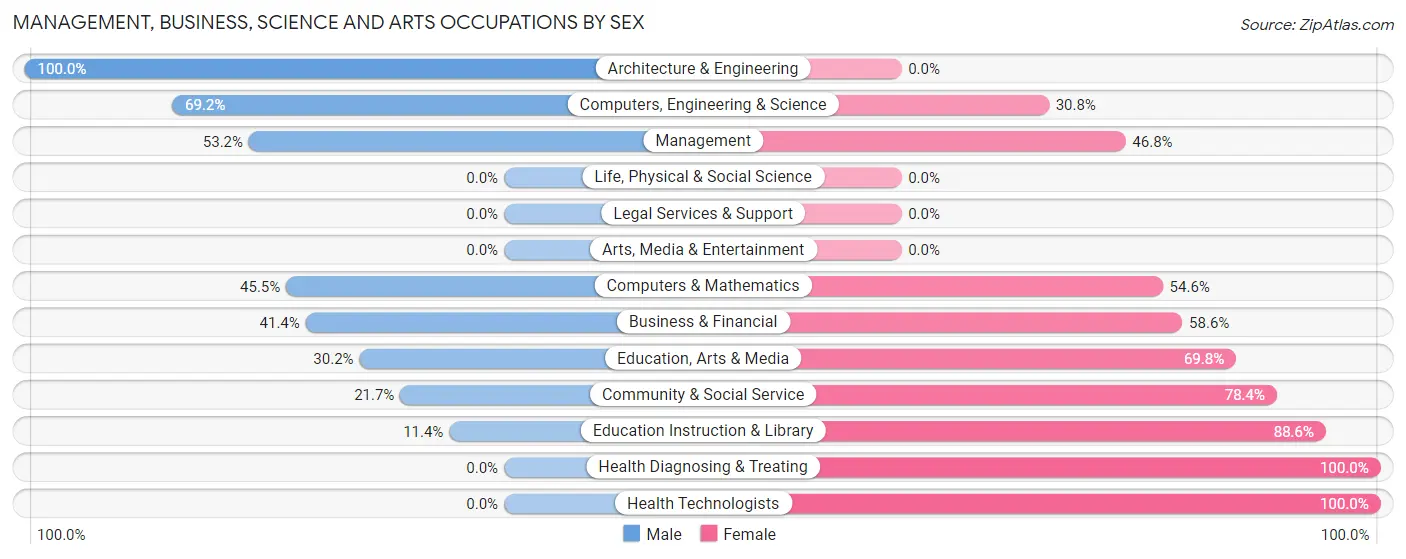
Within the Management, Business, Science and Arts occupations in Belle Fourche, the most male-oriented occupations are Architecture & Engineering (100.0%), Computers, Engineering & Science (69.2%), and Management (53.2%), while the most female-oriented occupations are Health Diagnosing & Treating (100.0%), Health Technologists (100.0%), and Education Instruction & Library (88.6%).
| Occupation | Male | Female |
| Management | 182 (53.2%) | 160 (46.8%) |
| Business & Financial | 24 (41.4%) | 34 (58.6%) |
| Computers, Engineering & Science | 27 (69.2%) | 12 (30.8%) |
| Computers & Mathematics | 10 (45.5%) | 12 (54.5%) |
| Architecture & Engineering | 17 (100.0%) | 0 (0.0%) |
| Life, Physical & Social Science | 0 (0.0%) | 0 (0.0%) |
| Community & Social Service | 50 (21.6%) | 181 (78.3%) |
| Education, Arts & Media | 38 (30.2%) | 88 (69.8%) |
| Legal Services & Support | 0 (0.0%) | 0 (0.0%) |
| Education Instruction & Library | 12 (11.4%) | 93 (88.6%) |
| Arts, Media & Entertainment | 0 (0.0%) | 0 (0.0%) |
| Health Diagnosing & Treating | 0 (0.0%) | 82 (100.0%) |
| Health Technologists | 0 (0.0%) | 25 (100.0%) |
| Total (Category) | 283 (37.6%) | 469 (62.4%) |
| Total (Overall) | 1,231 (45.6%) | 1,468 (54.4%) |
Services Occupations
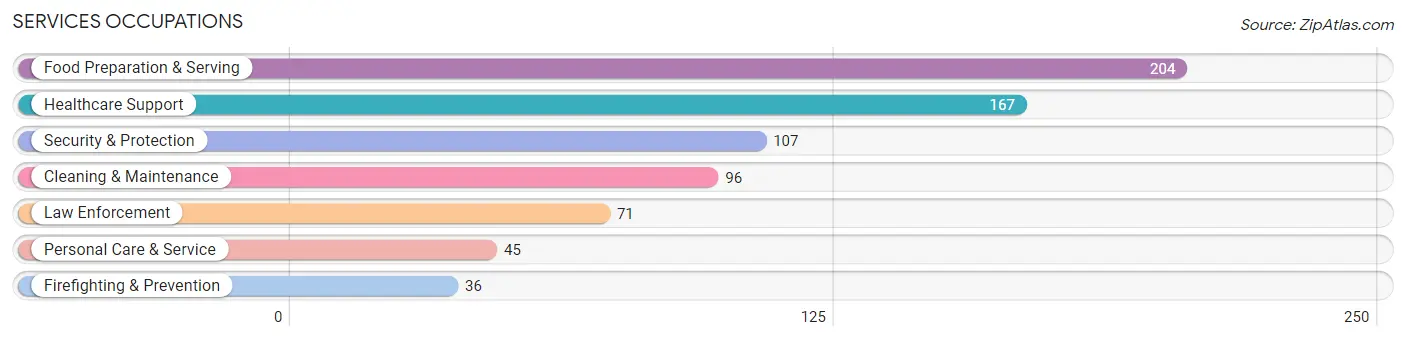
The most common Services occupations in Belle Fourche are Food Preparation & Serving (204 | 7.6%), Healthcare Support (167 | 6.2%), Security & Protection (107 | 4.0%), Cleaning & Maintenance (96 | 3.6%), and Law Enforcement (71 | 2.6%).
Services Occupations by Sex
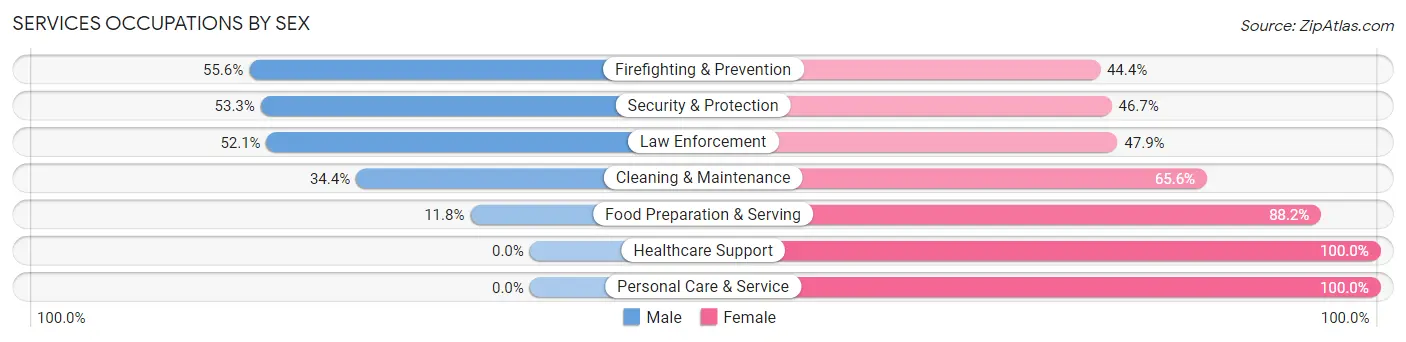
Within the Services occupations in Belle Fourche, the most male-oriented occupations are Firefighting & Prevention (55.6%), Security & Protection (53.3%), and Law Enforcement (52.1%), while the most female-oriented occupations are Healthcare Support (100.0%), Personal Care & Service (100.0%), and Food Preparation & Serving (88.2%).
| Occupation | Male | Female |
| Healthcare Support | 0 (0.0%) | 167 (100.0%) |
| Security & Protection | 57 (53.3%) | 50 (46.7%) |
| Firefighting & Prevention | 20 (55.6%) | 16 (44.4%) |
| Law Enforcement | 37 (52.1%) | 34 (47.9%) |
| Food Preparation & Serving | 24 (11.8%) | 180 (88.2%) |
| Cleaning & Maintenance | 33 (34.4%) | 63 (65.6%) |
| Personal Care & Service | 0 (0.0%) | 45 (100.0%) |
| Total (Category) | 114 (18.4%) | 505 (81.6%) |
| Total (Overall) | 1,231 (45.6%) | 1,468 (54.4%) |
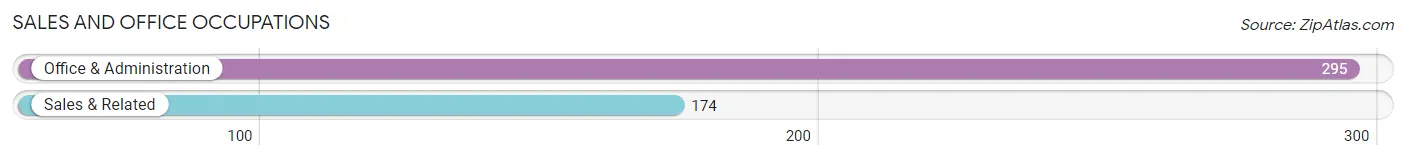
Sales and Office Occupations
The most common Sales and Office occupations in Belle Fourche are Office & Administration (295 | 10.9%), and Sales & Related (174 | 6.5%).
Sales and Office Occupations by Sex
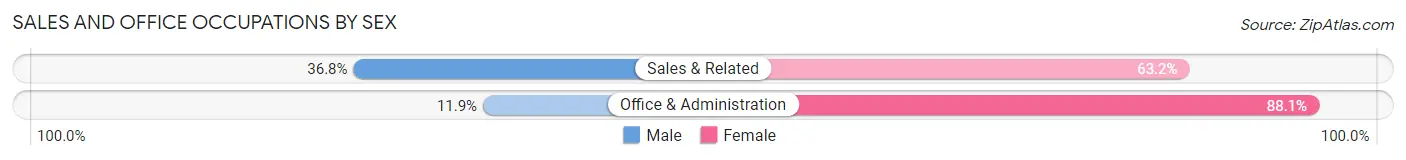
| Occupation | Male | Female |
| Sales & Related | 64 (36.8%) | 110 (63.2%) |
| Office & Administration | 35 (11.9%) | 260 (88.1%) |
| Total (Category) | 99 (21.1%) | 370 (78.9%) |
| Total (Overall) | 1,231 (45.6%) | 1,468 (54.4%) |
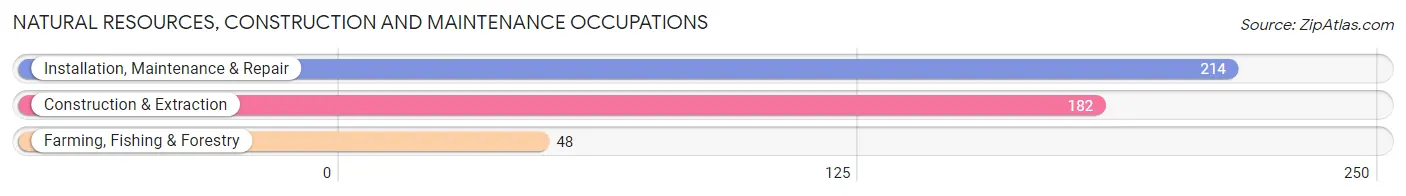
Natural Resources, Construction and Maintenance Occupations
The most common Natural Resources, Construction and Maintenance occupations in Belle Fourche are Installation, Maintenance & Repair (214 | 7.9%), Construction & Extraction (182 | 6.7%), and Farming, Fishing & Forestry (48 | 1.8%).
Natural Resources, Construction and Maintenance Occupations by Sex
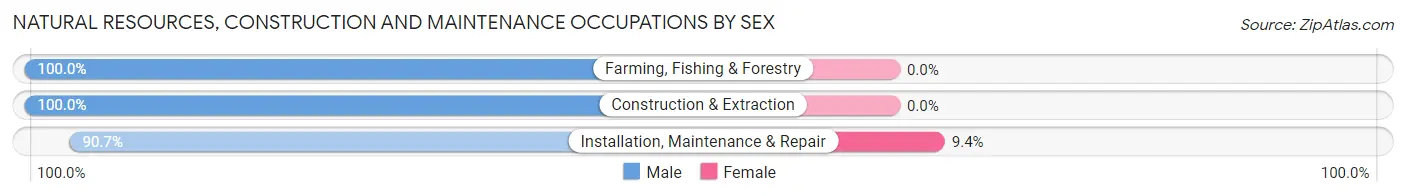
| Occupation | Male | Female |
| Farming, Fishing & Forestry | 48 (100.0%) | 0 (0.0%) |
| Construction & Extraction | 182 (100.0%) | 0 (0.0%) |
| Installation, Maintenance & Repair | 194 (90.6%) | 20 (9.3%) |
| Total (Category) | 424 (95.5%) | 20 (4.5%) |
| Total (Overall) | 1,231 (45.6%) | 1,468 (54.4%) |
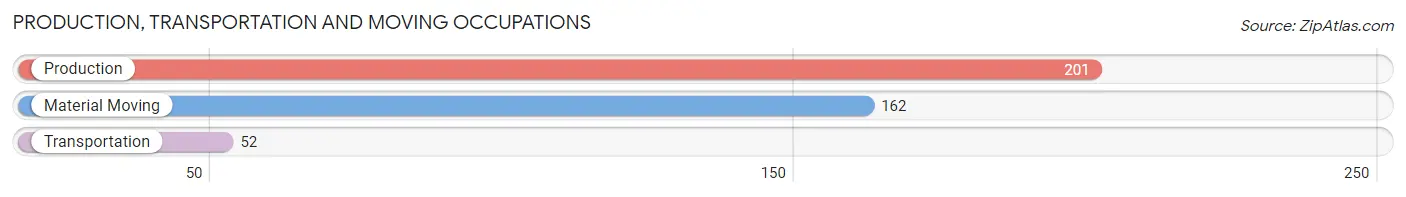
Production, Transportation and Moving Occupations
The most common Production, Transportation and Moving occupations in Belle Fourche are Production (201 | 7.4%), Material Moving (162 | 6.0%), and Transportation (52 | 1.9%).
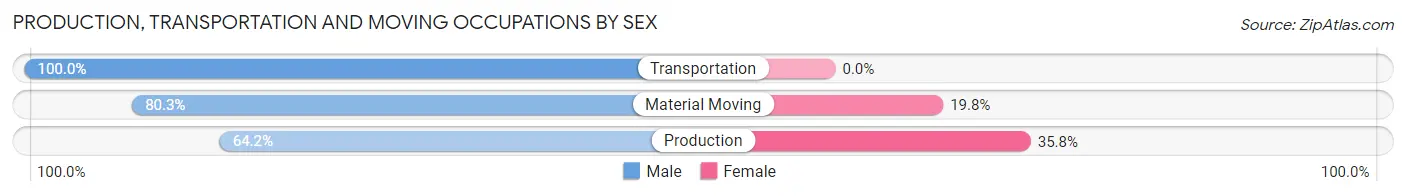
Production, Transportation and Moving Occupations by Sex
| Occupation | Male | Female |
| Production | 129 (64.2%) | 72 (35.8%) |
| Transportation | 52 (100.0%) | 0 (0.0%) |
| Material Moving | 130 (80.2%) | 32 (19.8%) |
| Total (Category) | 311 (74.9%) | 104 (25.1%) |
| Total (Overall) | 1,231 (45.6%) | 1,468 (54.4%) |
Employment Industries by Sex in Belle Fourche
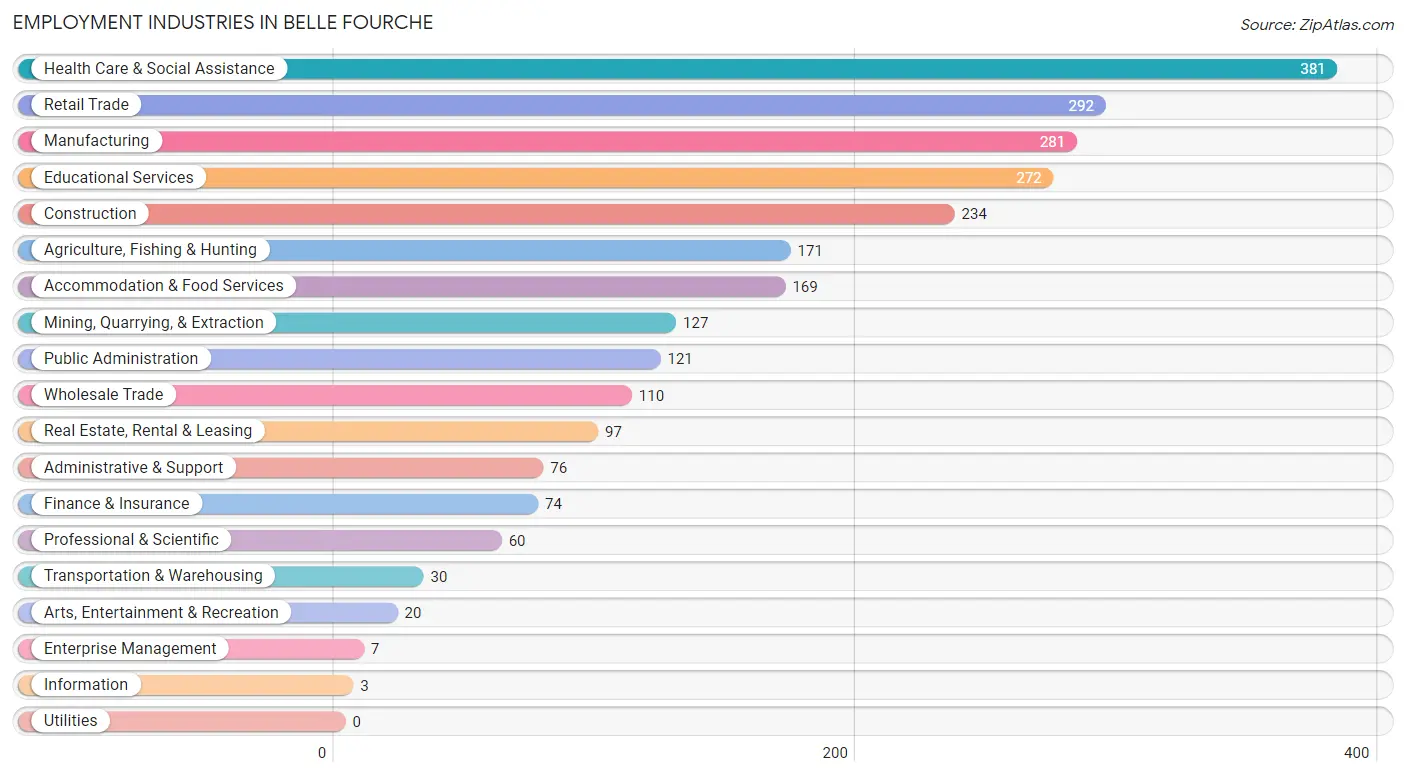
Employment Industries in Belle Fourche
The major employment industries in Belle Fourche include Health Care & Social Assistance (381 | 14.1%), Retail Trade (292 | 10.8%), Manufacturing (281 | 10.4%), Educational Services (272 | 10.1%), and Construction (234 | 8.7%).
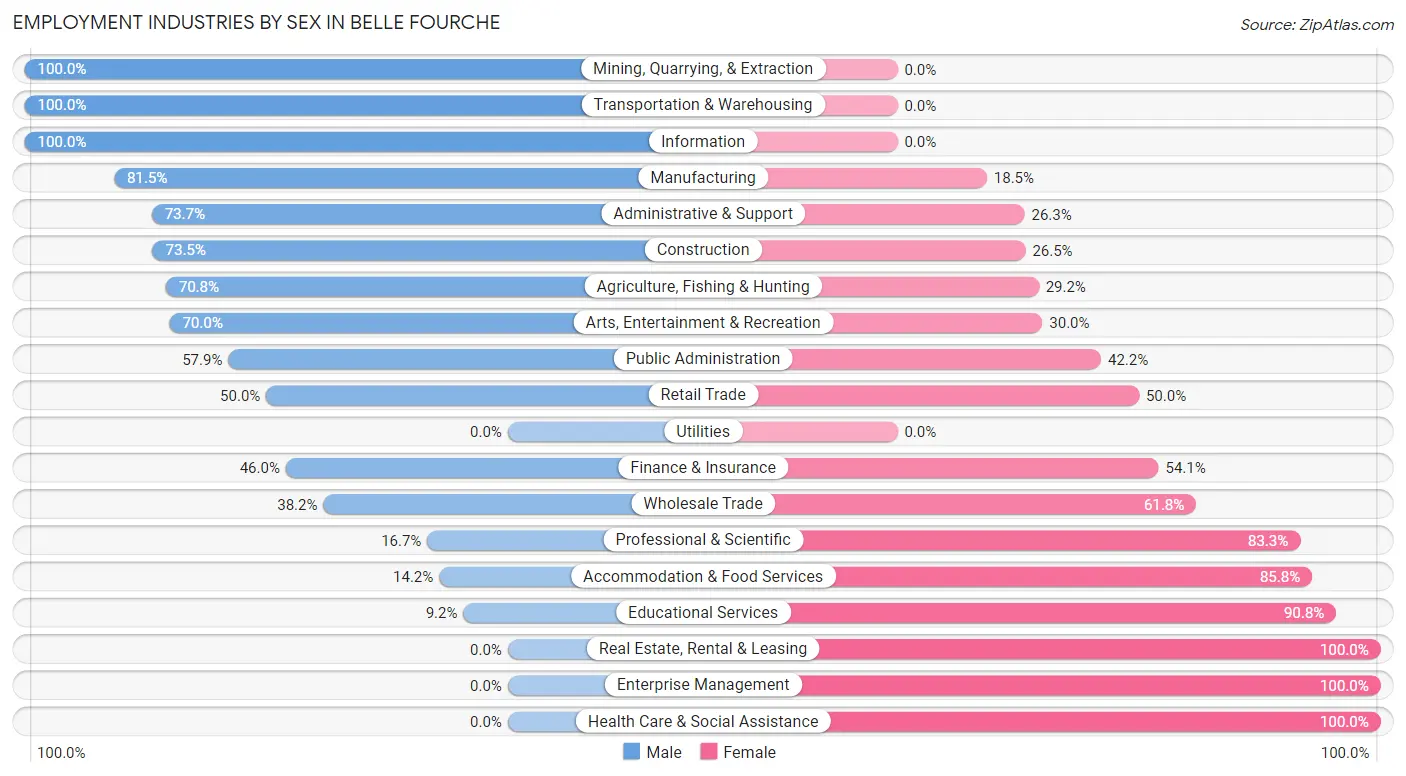
Employment Industries by Sex in Belle Fourche
The Belle Fourche industries that see more men than women are Mining, Quarrying, & Extraction (100.0%), Transportation & Warehousing (100.0%), and Information (100.0%), whereas the industries that tend to have a higher number of women are Real Estate, Rental & Leasing (100.0%), Enterprise Management (100.0%), and Health Care & Social Assistance (100.0%).
| Industry | Male | Female |
| Agriculture, Fishing & Hunting | 121 (70.8%) | 50 (29.2%) |
| Mining, Quarrying, & Extraction | 127 (100.0%) | 0 (0.0%) |
| Construction | 172 (73.5%) | 62 (26.5%) |
| Manufacturing | 229 (81.5%) | 52 (18.5%) |
| Wholesale Trade | 42 (38.2%) | 68 (61.8%) |
| Retail Trade | 146 (50.0%) | 146 (50.0%) |
| Transportation & Warehousing | 30 (100.0%) | 0 (0.0%) |
| Utilities | 0 (0.0%) | 0 (0.0%) |
| Information | 3 (100.0%) | 0 (0.0%) |
| Finance & Insurance | 34 (46.0%) | 40 (54.0%) |
| Real Estate, Rental & Leasing | 0 (0.0%) | 97 (100.0%) |
| Professional & Scientific | 10 (16.7%) | 50 (83.3%) |
| Enterprise Management | 0 (0.0%) | 7 (100.0%) |
| Administrative & Support | 56 (73.7%) | 20 (26.3%) |
| Educational Services | 25 (9.2%) | 247 (90.8%) |
| Health Care & Social Assistance | 0 (0.0%) | 381 (100.0%) |
| Arts, Entertainment & Recreation | 14 (70.0%) | 6 (30.0%) |
| Accommodation & Food Services | 24 (14.2%) | 145 (85.8%) |
| Public Administration | 70 (57.9%) | 51 (42.1%) |
| Total | 1,231 (45.6%) | 1,468 (54.4%) |
Education in Belle Fourche
School Enrollment in Belle Fourche
The most common levels of schooling among the 1,255 students in Belle Fourche are high school (425 | 33.9%), elementary school (335 | 26.7%), and middle school (301 | 24.0%).
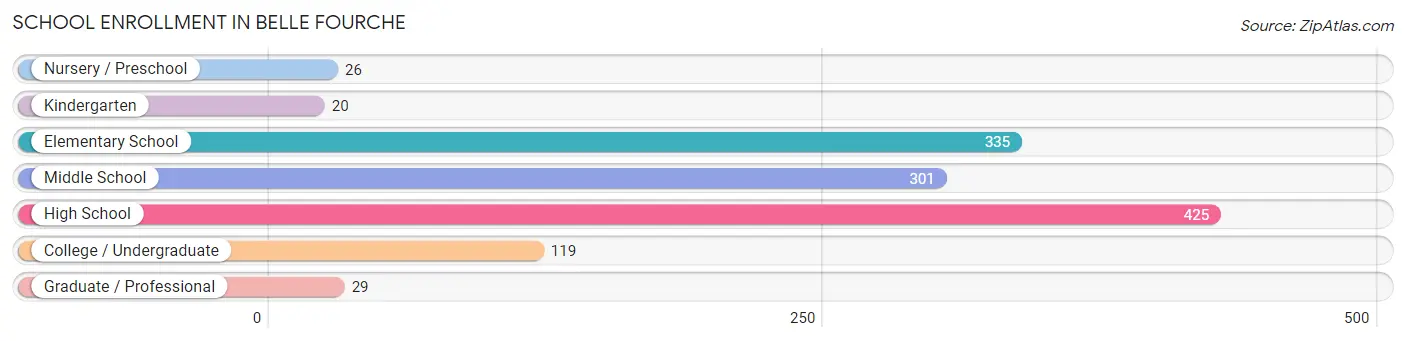
| School Level | # Students | % Students |
| Nursery / Preschool | 26 | 2.1% |
| Kindergarten | 20 | 1.6% |
| Elementary School | 335 | 26.7% |
| Middle School | 301 | 24.0% |
| High School | 425 | 33.9% |
| College / Undergraduate | 119 | 9.5% |
| Graduate / Professional | 29 | 2.3% |
| Total | 1,255 | 100.0% |
School Enrollment by Age by Funding Source in Belle Fourche
Out of a total of 1,255 students who are enrolled in schools in Belle Fourche, 324 (25.8%) attend a private institution, while the remaining 931 (74.2%) are enrolled in public schools. The age group of 3 to 4 year olds has the highest likelihood of being enrolled in private schools, with 26 (100.0% in the age bracket) enrolled. Conversely, the age group of 25 to 34 year olds has the lowest likelihood of being enrolled in a private school, with 14 (100.0% in the age bracket) attending a public institution.
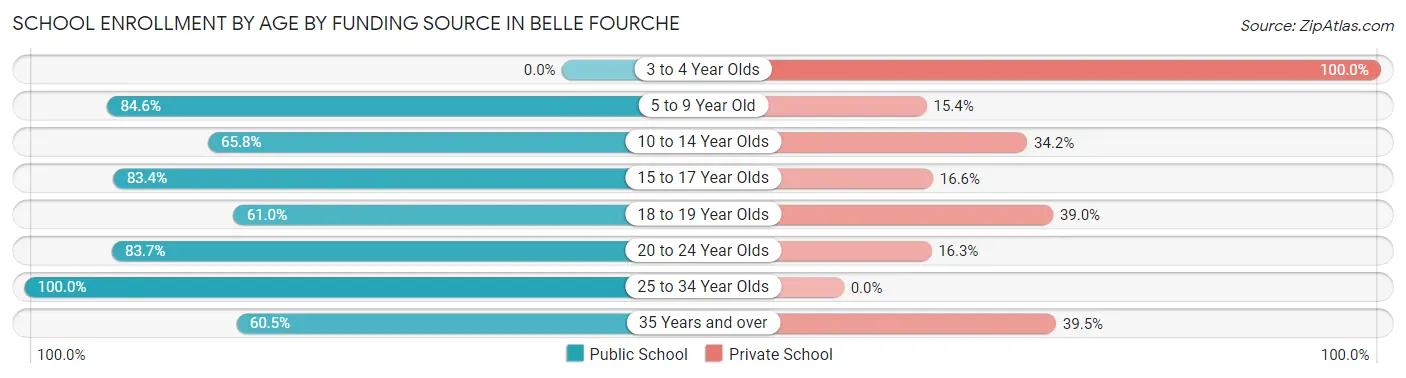
| Age Bracket | Public School | Private School |
| 3 to 4 Year Olds | 0 (0.0%) | 26 (100.0%) |
| 5 to 9 Year Old | 230 (84.6%) | 42 (15.4%) |
| 10 to 14 Year Olds | 287 (65.8%) | 149 (34.2%) |
| 15 to 17 Year Olds | 261 (83.4%) | 52 (16.6%) |
| 18 to 19 Year Olds | 36 (61.0%) | 23 (39.0%) |
| 20 to 24 Year Olds | 77 (83.7%) | 15 (16.3%) |
| 25 to 34 Year Olds | 14 (100.0%) | 0 (0.0%) |
| 35 Years and over | 26 (60.5%) | 17 (39.5%) |
| Total | 931 (74.2%) | 324 (25.8%) |
Educational Attainment by Field of Study in Belle Fourche
Education (179 | 31.2%), business (81 | 14.1%), science & technology (70 | 12.2%), bio, nature & agricultural (48 | 8.4%), and visual & performing arts (47 | 8.2%) are the most common fields of study among 574 individuals in Belle Fourche who have obtained a bachelor's degree or higher.
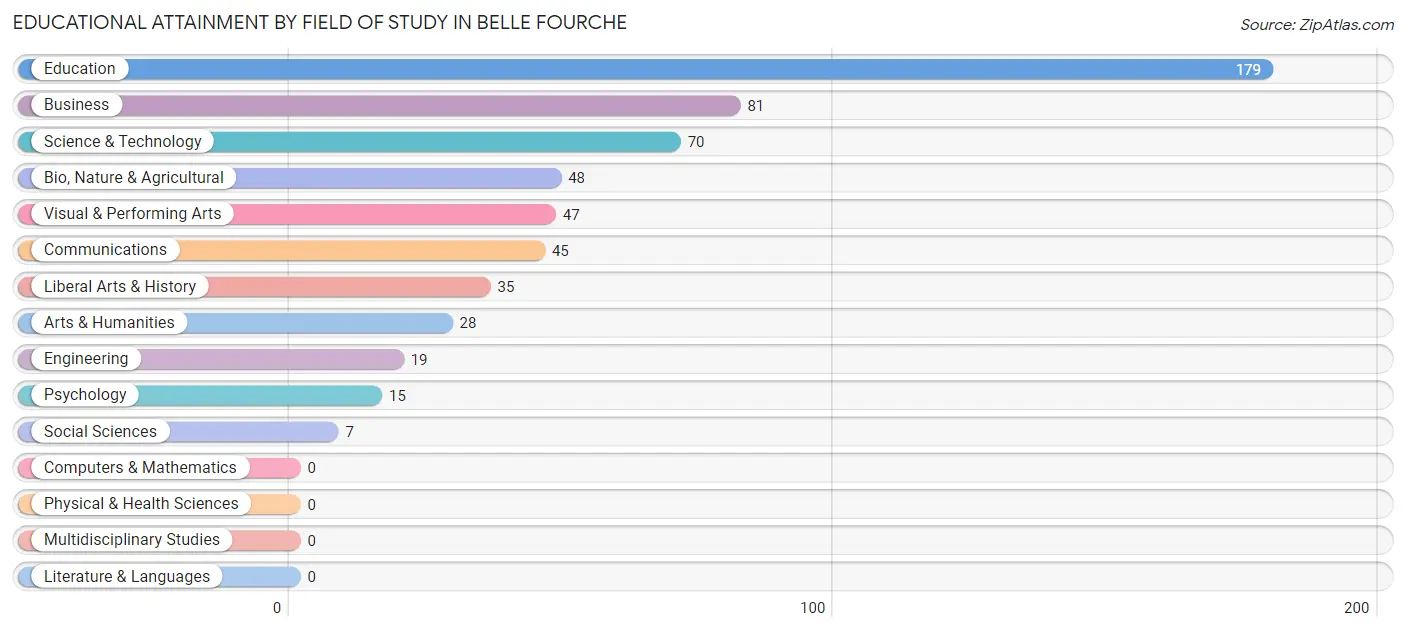
| Field of Study | # Graduates | % Graduates |
| Computers & Mathematics | 0 | 0.0% |
| Bio, Nature & Agricultural | 48 | 8.4% |
| Physical & Health Sciences | 0 | 0.0% |
| Psychology | 15 | 2.6% |
| Social Sciences | 7 | 1.2% |
| Engineering | 19 | 3.3% |
| Multidisciplinary Studies | 0 | 0.0% |
| Science & Technology | 70 | 12.2% |
| Business | 81 | 14.1% |
| Education | 179 | 31.2% |
| Literature & Languages | 0 | 0.0% |
| Liberal Arts & History | 35 | 6.1% |
| Visual & Performing Arts | 47 | 8.2% |
| Communications | 45 | 7.8% |
| Arts & Humanities | 28 | 4.9% |
| Total | 574 | 100.0% |
Transportation & Commute in Belle Fourche
Vehicle Availability by Sex in Belle Fourche
The most prevalent vehicle ownership categories in Belle Fourche are males with 2 vehicles (440, accounting for 39.1%) and females with 2 vehicles (423, making up 30.2%).
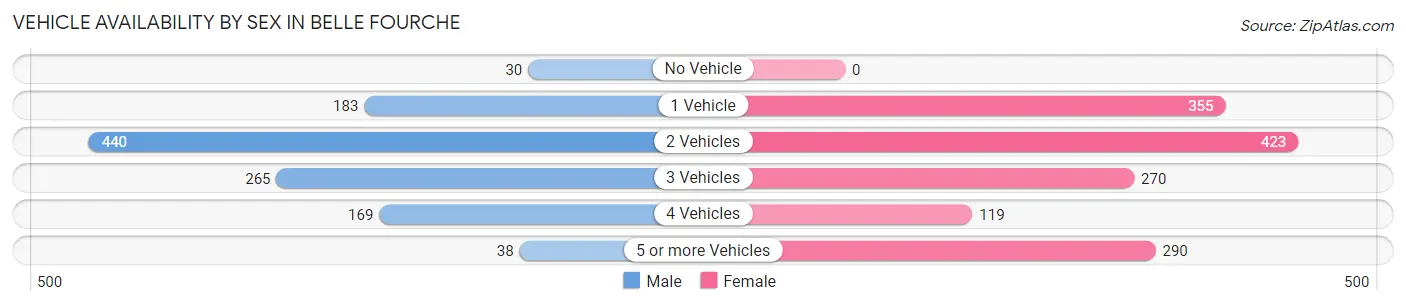
| Vehicles Available | Male | Female |
| No Vehicle | 30 (2.7%) | 0 (0.0%) |
| 1 Vehicle | 183 (16.3%) | 355 (24.4%) |
| 2 Vehicles | 440 (39.1%) | 423 (29.0%) |
| 3 Vehicles | 265 (23.6%) | 270 (18.5%) |
| 4 Vehicles | 169 (15.0%) | 119 (8.2%) |
| 5 or more Vehicles | 38 (3.4%) | 290 (19.9%) |
| Total | 1,125 (100.0%) | 1,457 (100.0%) |
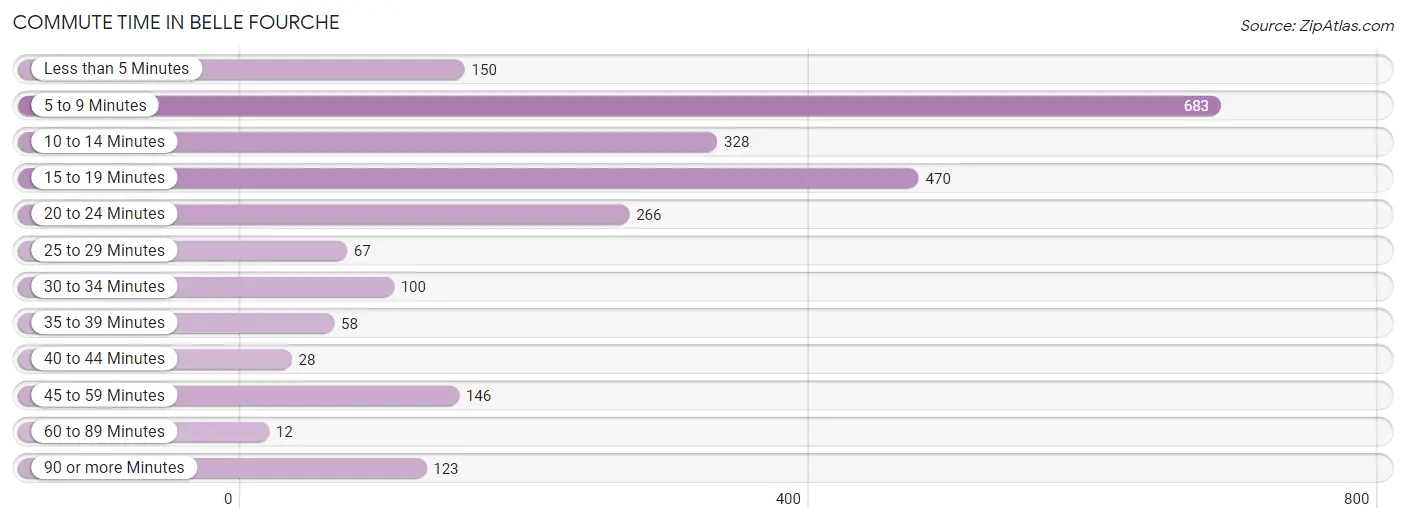
Commute Time in Belle Fourche
The most frequently occuring commute durations in Belle Fourche are 5 to 9 minutes (683 commuters, 28.1%), 15 to 19 minutes (470 commuters, 19.3%), and 10 to 14 minutes (328 commuters, 13.5%).
| Commute Time | # Commuters | % Commuters |
| Less than 5 Minutes | 150 | 6.2% |
| 5 to 9 Minutes | 683 | 28.1% |
| 10 to 14 Minutes | 328 | 13.5% |
| 15 to 19 Minutes | 470 | 19.3% |
| 20 to 24 Minutes | 266 | 10.9% |
| 25 to 29 Minutes | 67 | 2.8% |
| 30 to 34 Minutes | 100 | 4.1% |
| 35 to 39 Minutes | 58 | 2.4% |
| 40 to 44 Minutes | 28 | 1.1% |
| 45 to 59 Minutes | 146 | 6.0% |
| 60 to 89 Minutes | 12 | 0.5% |
| 90 or more Minutes | 123 | 5.1% |
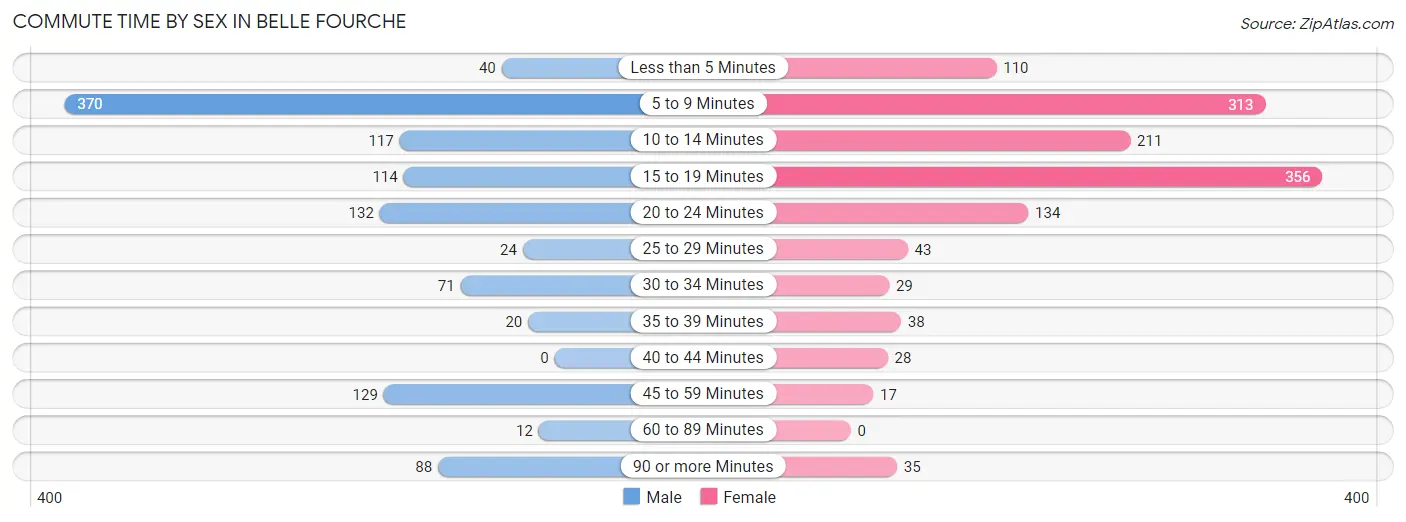
Commute Time by Sex in Belle Fourche
The most common commute times in Belle Fourche are 5 to 9 minutes (370 commuters, 33.1%) for males and 15 to 19 minutes (356 commuters, 27.1%) for females.
| Commute Time | Male | Female |
| Less than 5 Minutes | 40 (3.6%) | 110 (8.4%) |
| 5 to 9 Minutes | 370 (33.1%) | 313 (23.8%) |
| 10 to 14 Minutes | 117 (10.5%) | 211 (16.1%) |
| 15 to 19 Minutes | 114 (10.2%) | 356 (27.1%) |
| 20 to 24 Minutes | 132 (11.8%) | 134 (10.2%) |
| 25 to 29 Minutes | 24 (2.1%) | 43 (3.3%) |
| 30 to 34 Minutes | 71 (6.4%) | 29 (2.2%) |
| 35 to 39 Minutes | 20 (1.8%) | 38 (2.9%) |
| 40 to 44 Minutes | 0 (0.0%) | 28 (2.1%) |
| 45 to 59 Minutes | 129 (11.6%) | 17 (1.3%) |
| 60 to 89 Minutes | 12 (1.1%) | 0 (0.0%) |
| 90 or more Minutes | 88 (7.9%) | 35 (2.7%) |
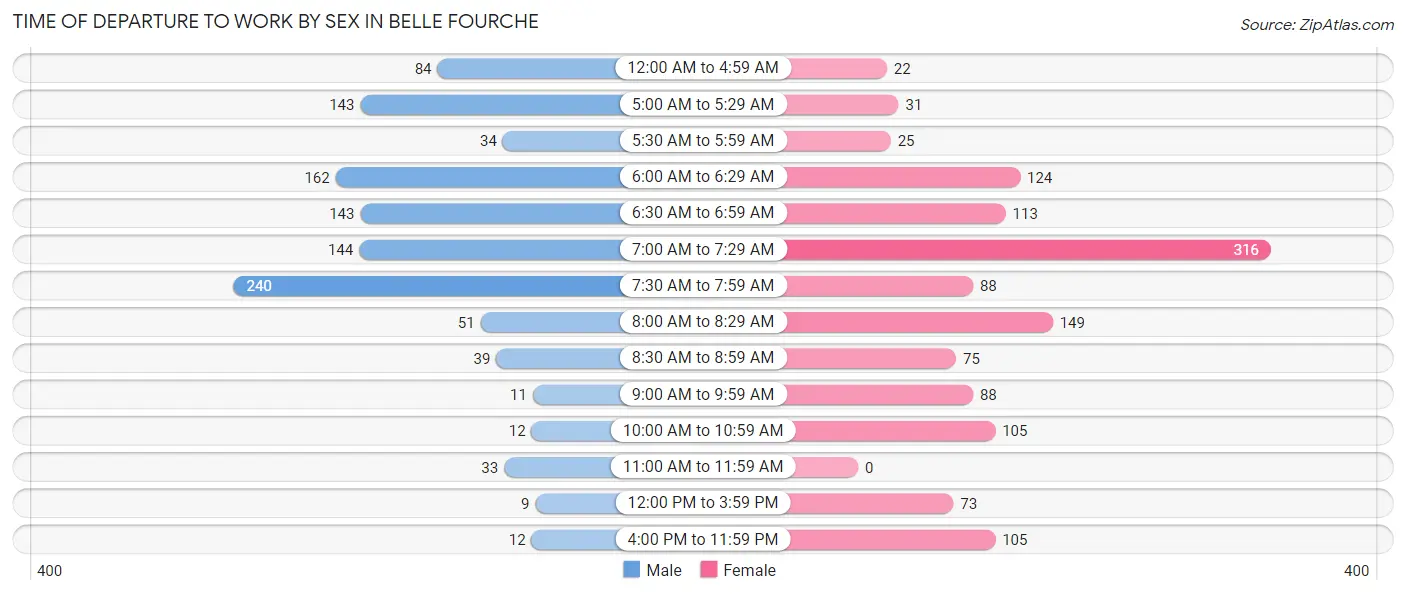
Time of Departure to Work by Sex in Belle Fourche
The most frequent times of departure to work in Belle Fourche are 7:30 AM to 7:59 AM (240, 21.5%) for males and 7:00 AM to 7:29 AM (316, 24.0%) for females.
| Time of Departure | Male | Female |
| 12:00 AM to 4:59 AM | 84 (7.5%) | 22 (1.7%) |
| 5:00 AM to 5:29 AM | 143 (12.8%) | 31 (2.4%) |
| 5:30 AM to 5:59 AM | 34 (3.0%) | 25 (1.9%) |
| 6:00 AM to 6:29 AM | 162 (14.5%) | 124 (9.4%) |
| 6:30 AM to 6:59 AM | 143 (12.8%) | 113 (8.6%) |
| 7:00 AM to 7:29 AM | 144 (12.9%) | 316 (24.0%) |
| 7:30 AM to 7:59 AM | 240 (21.5%) | 88 (6.7%) |
| 8:00 AM to 8:29 AM | 51 (4.6%) | 149 (11.3%) |
| 8:30 AM to 8:59 AM | 39 (3.5%) | 75 (5.7%) |
| 9:00 AM to 9:59 AM | 11 (1.0%) | 88 (6.7%) |
| 10:00 AM to 10:59 AM | 12 (1.1%) | 105 (8.0%) |
| 11:00 AM to 11:59 AM | 33 (2.9%) | 0 (0.0%) |
| 12:00 PM to 3:59 PM | 9 (0.8%) | 73 (5.6%) |
| 4:00 PM to 11:59 PM | 12 (1.1%) | 105 (8.0%) |
| Total | 1,117 (100.0%) | 1,314 (100.0%) |
Housing Occupancy in Belle Fourche
Occupancy by Ownership in Belle Fourche
Of the total 2,340 dwellings in Belle Fourche, owner-occupied units account for 1,636 (69.9%), while renter-occupied units make up 704 (30.1%).

| Occupancy | # Housing Units | % Housing Units |
| Owner Occupied Housing Units | 1,636 | 69.9% |
| Renter-Occupied Housing Units | 704 | 30.1% |
| Total Occupied Housing Units | 2,340 | 100.0% |
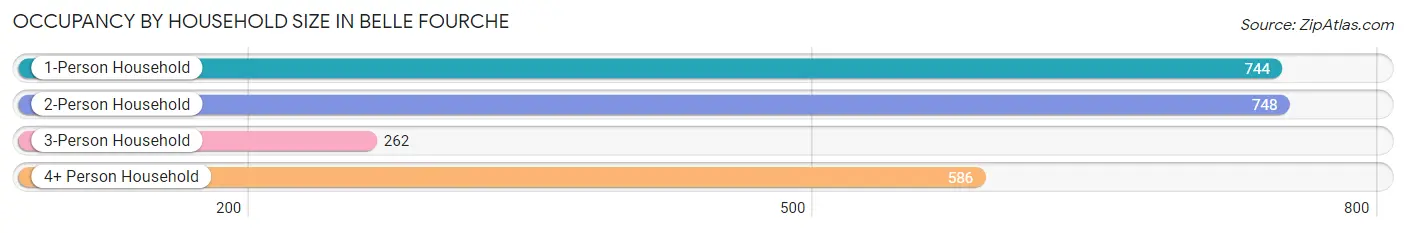
Occupancy by Household Size in Belle Fourche
| Household Size | # Housing Units | % Housing Units |
| 1-Person Household | 744 | 31.8% |
| 2-Person Household | 748 | 32.0% |
| 3-Person Household | 262 | 11.2% |
| 4+ Person Household | 586 | 25.0% |
| Total Housing Units | 2,340 | 100.0% |
Occupancy by Ownership by Household Size in Belle Fourche
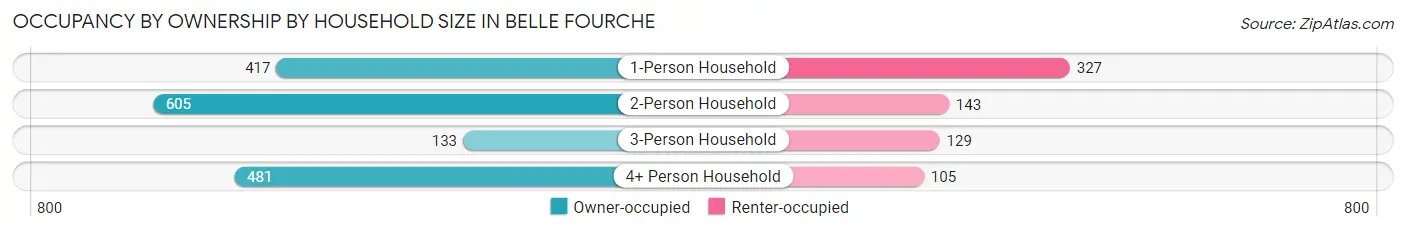
| Household Size | Owner-occupied | Renter-occupied |
| 1-Person Household | 417 (56.0%) | 327 (44.0%) |
| 2-Person Household | 605 (80.9%) | 143 (19.1%) |
| 3-Person Household | 133 (50.8%) | 129 (49.2%) |
| 4+ Person Household | 481 (82.1%) | 105 (17.9%) |
| Total Housing Units | 1,636 (69.9%) | 704 (30.1%) |
Occupancy by Educational Attainment in Belle Fourche
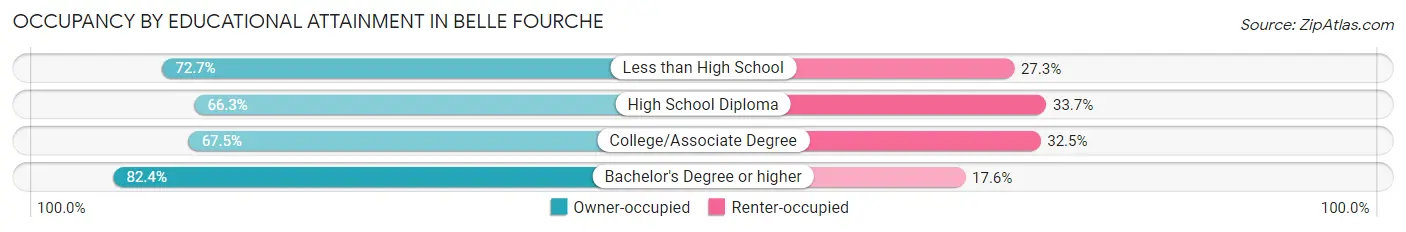
| Household Size | Owner-occupied | Renter-occupied |
| Less than High School | 133 (72.7%) | 50 (27.3%) |
| High School Diploma | 510 (66.3%) | 259 (33.7%) |
| College/Associate Degree | 680 (67.5%) | 328 (32.5%) |
| Bachelor's Degree or higher | 313 (82.4%) | 67 (17.6%) |
Occupancy by Age of Householder in Belle Fourche
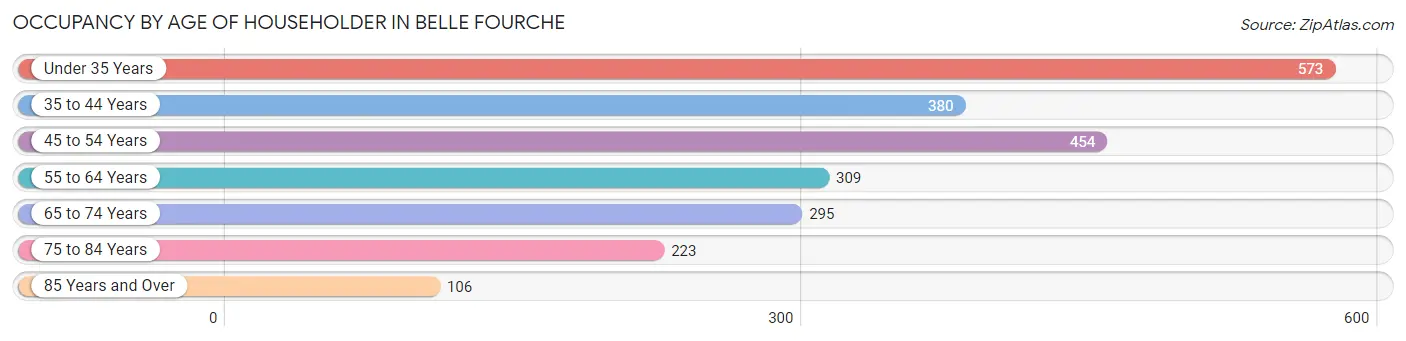
| Age Bracket | # Households | % Households |
| Under 35 Years | 573 | 24.5% |
| 35 to 44 Years | 380 | 16.2% |
| 45 to 54 Years | 454 | 19.4% |
| 55 to 64 Years | 309 | 13.2% |
| 65 to 74 Years | 295 | 12.6% |
| 75 to 84 Years | 223 | 9.5% |
| 85 Years and Over | 106 | 4.5% |
| Total | 2,340 | 100.0% |
Housing Finances in Belle Fourche
Median Income by Occupancy in Belle Fourche
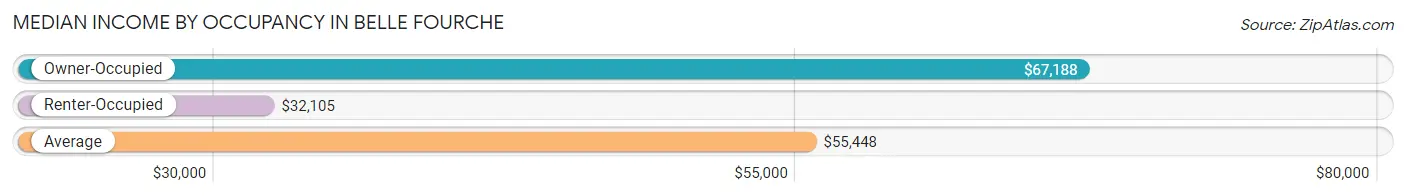
| Occupancy Type | # Households | Median Income |
| Owner-Occupied | 1,636 (69.9%) | $67,188 |
| Renter-Occupied | 704 (30.1%) | $32,105 |
| Average | 2,340 (100.0%) | $55,448 |
Occupancy by Householder Income Bracket in Belle Fourche
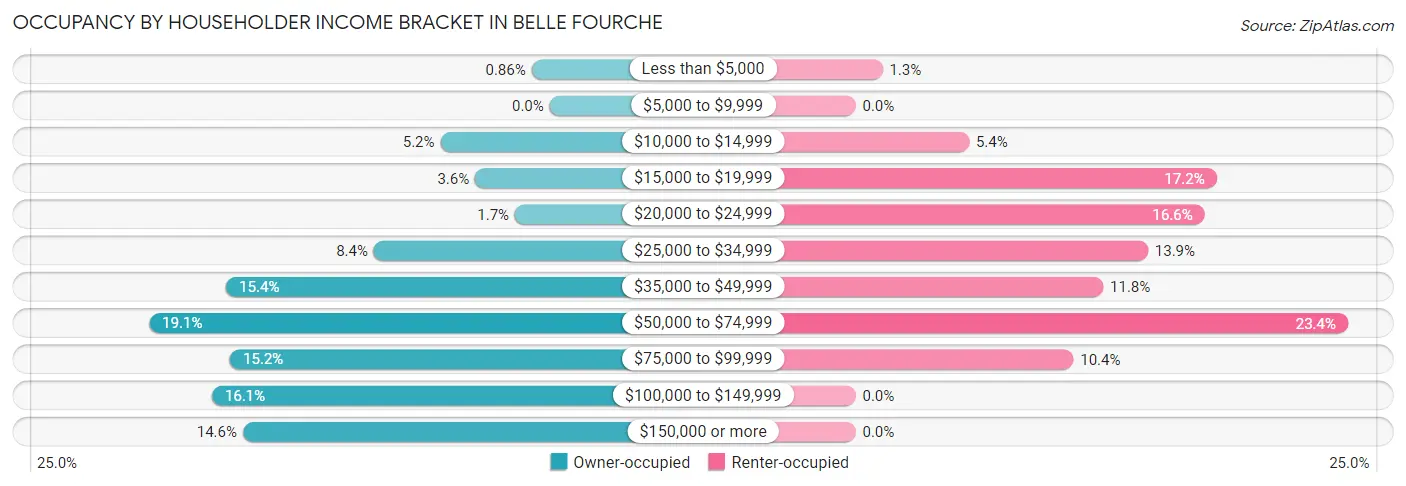
| Income Bracket | Owner-occupied | Renter-occupied |
| Less than $5,000 | 14 (0.9%) | 9 (1.3%) |
| $5,000 to $9,999 | 0 (0.0%) | 0 (0.0%) |
| $10,000 to $14,999 | 85 (5.2%) | 38 (5.4%) |
| $15,000 to $19,999 | 58 (3.5%) | 121 (17.2%) |
| $20,000 to $24,999 | 27 (1.7%) | 117 (16.6%) |
| $25,000 to $34,999 | 137 (8.4%) | 98 (13.9%) |
| $35,000 to $49,999 | 252 (15.4%) | 83 (11.8%) |
| $50,000 to $74,999 | 312 (19.1%) | 165 (23.4%) |
| $75,000 to $99,999 | 249 (15.2%) | 73 (10.4%) |
| $100,000 to $149,999 | 263 (16.1%) | 0 (0.0%) |
| $150,000 or more | 239 (14.6%) | 0 (0.0%) |
| Total | 1,636 (100.0%) | 704 (100.0%) |
Monthly Housing Cost Tiers in Belle Fourche
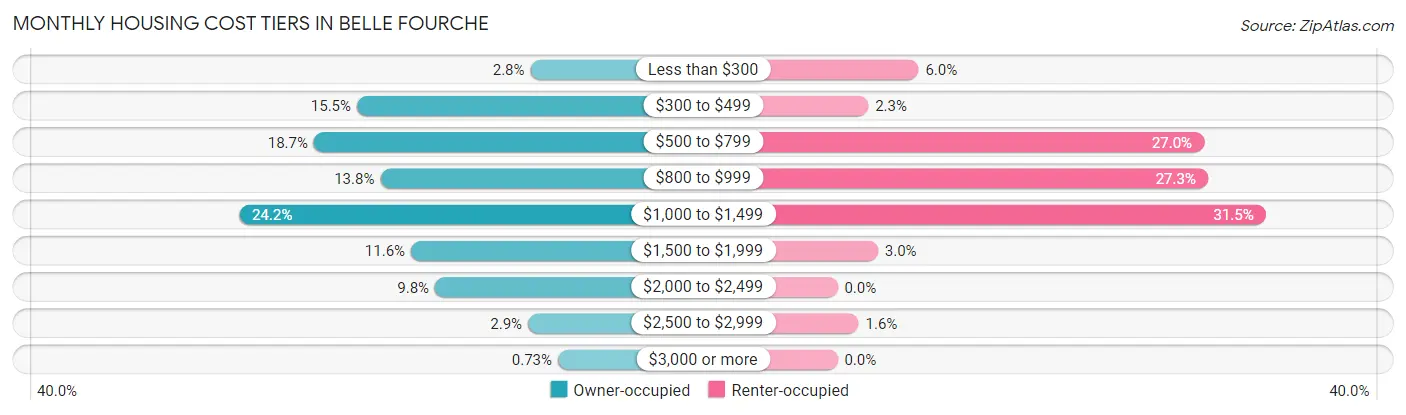
| Monthly Cost | Owner-occupied | Renter-occupied |
| Less than $300 | 45 (2.8%) | 42 (6.0%) |
| $300 to $499 | 254 (15.5%) | 16 (2.3%) |
| $500 to $799 | 306 (18.7%) | 190 (27.0%) |
| $800 to $999 | 226 (13.8%) | 192 (27.3%) |
| $1,000 to $1,499 | 396 (24.2%) | 222 (31.5%) |
| $1,500 to $1,999 | 189 (11.6%) | 21 (3.0%) |
| $2,000 to $2,499 | 160 (9.8%) | 0 (0.0%) |
| $2,500 to $2,999 | 48 (2.9%) | 11 (1.6%) |
| $3,000 or more | 12 (0.7%) | 0 (0.0%) |
| Total | 1,636 (100.0%) | 704 (100.0%) |
Physical Housing Characteristics in Belle Fourche
Housing Structures in Belle Fourche
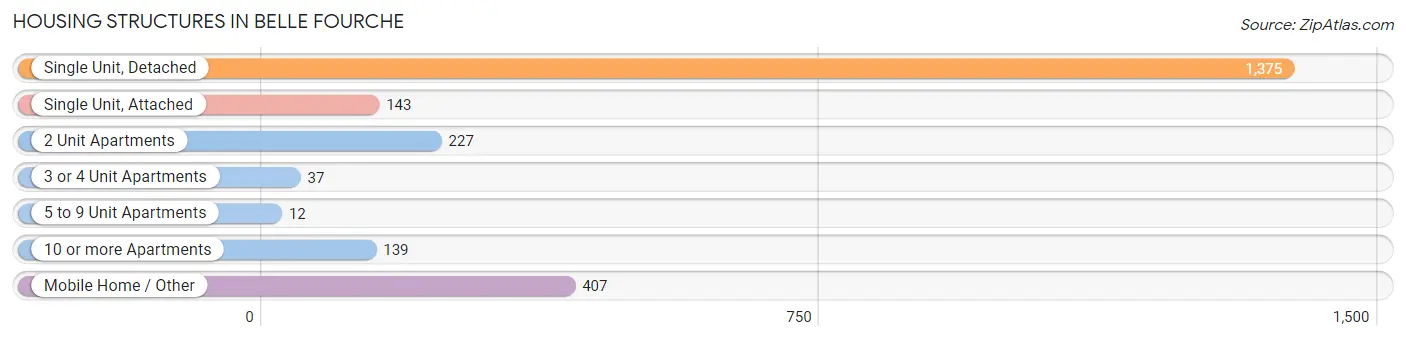
| Structure Type | # Housing Units | % Housing Units |
| Single Unit, Detached | 1,375 | 58.8% |
| Single Unit, Attached | 143 | 6.1% |
| 2 Unit Apartments | 227 | 9.7% |
| 3 or 4 Unit Apartments | 37 | 1.6% |
| 5 to 9 Unit Apartments | 12 | 0.5% |
| 10 or more Apartments | 139 | 5.9% |
| Mobile Home / Other | 407 | 17.4% |
| Total | 2,340 | 100.0% |
Housing Structures by Occupancy in Belle Fourche
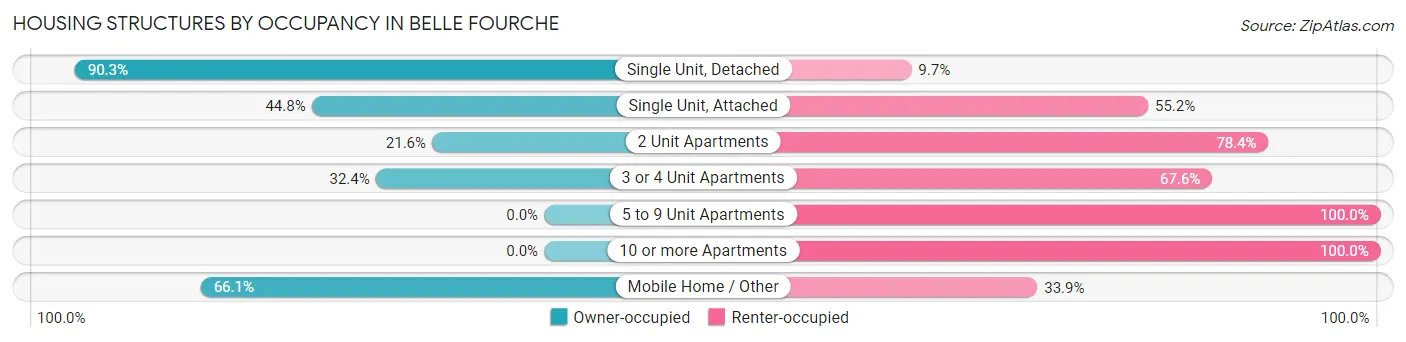
| Structure Type | Owner-occupied | Renter-occupied |
| Single Unit, Detached | 1,242 (90.3%) | 133 (9.7%) |
| Single Unit, Attached | 64 (44.8%) | 79 (55.2%) |
| 2 Unit Apartments | 49 (21.6%) | 178 (78.4%) |
| 3 or 4 Unit Apartments | 12 (32.4%) | 25 (67.6%) |
| 5 to 9 Unit Apartments | 0 (0.0%) | 12 (100.0%) |
| 10 or more Apartments | 0 (0.0%) | 139 (100.0%) |
| Mobile Home / Other | 269 (66.1%) | 138 (33.9%) |
| Total | 1,636 (69.9%) | 704 (30.1%) |
Housing Structures by Number of Rooms in Belle Fourche
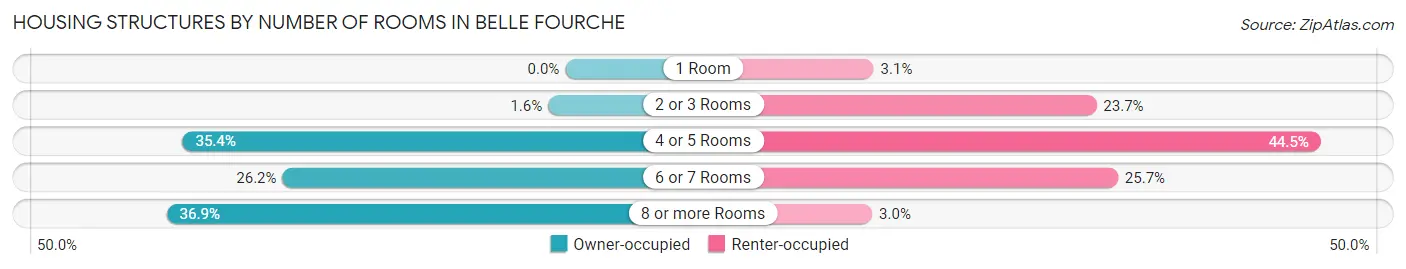
| Number of Rooms | Owner-occupied | Renter-occupied |
| 1 Room | 0 (0.0%) | 22 (3.1%) |
| 2 or 3 Rooms | 26 (1.6%) | 167 (23.7%) |
| 4 or 5 Rooms | 579 (35.4%) | 313 (44.5%) |
| 6 or 7 Rooms | 428 (26.2%) | 181 (25.7%) |
| 8 or more Rooms | 603 (36.9%) | 21 (3.0%) |
| Total | 1,636 (100.0%) | 704 (100.0%) |
Housing Structure by Heating Type in Belle Fourche
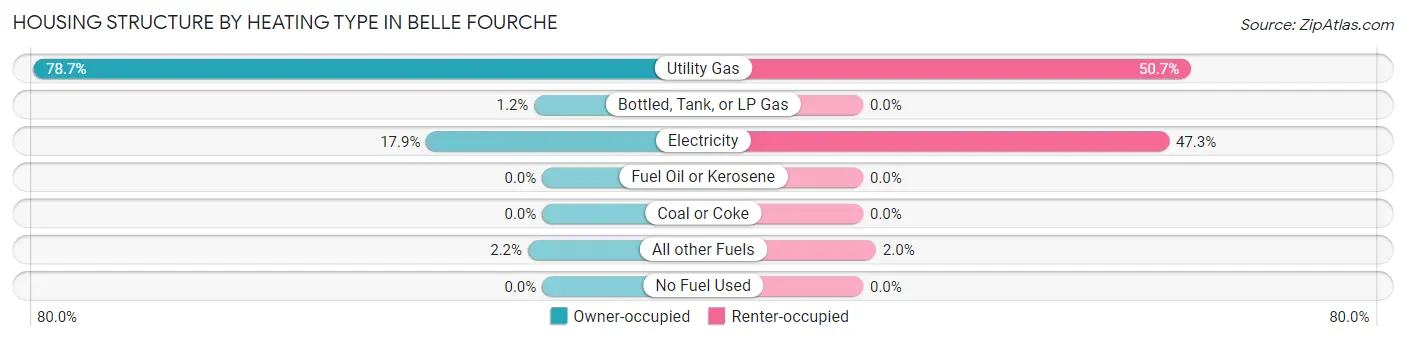
| Heating Type | Owner-occupied | Renter-occupied |
| Utility Gas | 1,287 (78.7%) | 357 (50.7%) |
| Bottled, Tank, or LP Gas | 20 (1.2%) | 0 (0.0%) |
| Electricity | 293 (17.9%) | 333 (47.3%) |
| Fuel Oil or Kerosene | 0 (0.0%) | 0 (0.0%) |
| Coal or Coke | 0 (0.0%) | 0 (0.0%) |
| All other Fuels | 36 (2.2%) | 14 (2.0%) |
| No Fuel Used | 0 (0.0%) | 0 (0.0%) |
| Total | 1,636 (100.0%) | 704 (100.0%) |
Household Vehicle Usage in Belle Fourche
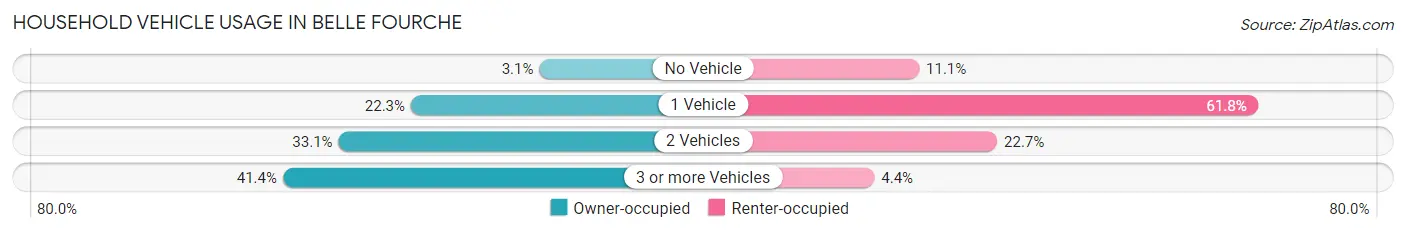
| Vehicles per Household | Owner-occupied | Renter-occupied |
| No Vehicle | 51 (3.1%) | 78 (11.1%) |
| 1 Vehicle | 365 (22.3%) | 435 (61.8%) |
| 2 Vehicles | 542 (33.1%) | 160 (22.7%) |
| 3 or more Vehicles | 678 (41.4%) | 31 (4.4%) |
| Total | 1,636 (100.0%) | 704 (100.0%) |
Real Estate & Mortgages in Belle Fourche
Real Estate and Mortgage Overview in Belle Fourche
| Characteristic | Without Mortgage | With Mortgage |
| Housing Units | 657 | 979 |
| Median Property Value | $93,700 | $196,200 |
| Median Household Income | $52,250 | $209 |
| Monthly Housing Costs | $519 | $12 |
| Real Estate Taxes | $1,515 | $0 |
Property Value by Mortgage Status in Belle Fourche
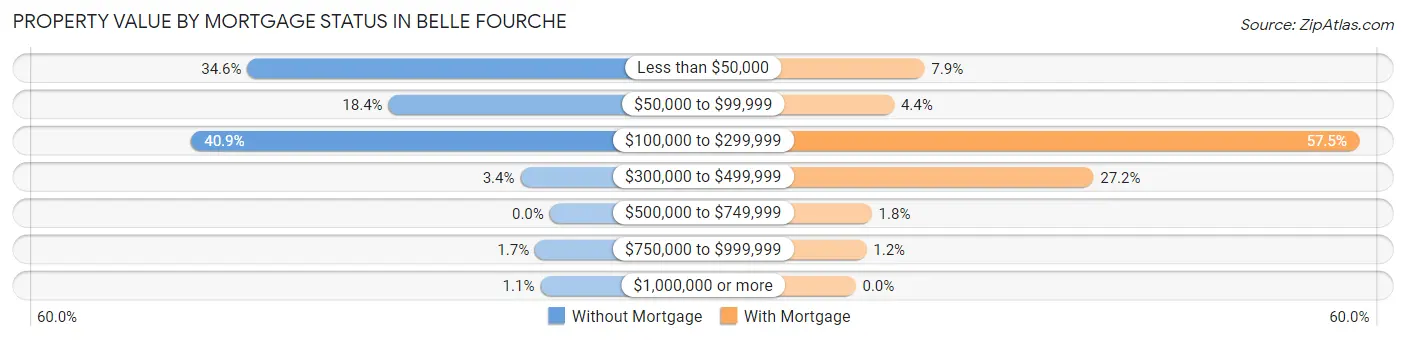
| Property Value | Without Mortgage | With Mortgage |
| Less than $50,000 | 227 (34.5%) | 77 (7.9%) |
| $50,000 to $99,999 | 121 (18.4%) | 43 (4.4%) |
| $100,000 to $299,999 | 269 (40.9%) | 563 (57.5%) |
| $300,000 to $499,999 | 22 (3.4%) | 266 (27.2%) |
| $500,000 to $749,999 | 0 (0.0%) | 18 (1.8%) |
| $750,000 to $999,999 | 11 (1.7%) | 12 (1.2%) |
| $1,000,000 or more | 7 (1.1%) | 0 (0.0%) |
| Total | 657 (100.0%) | 979 (100.0%) |
Household Income by Mortgage Status in Belle Fourche
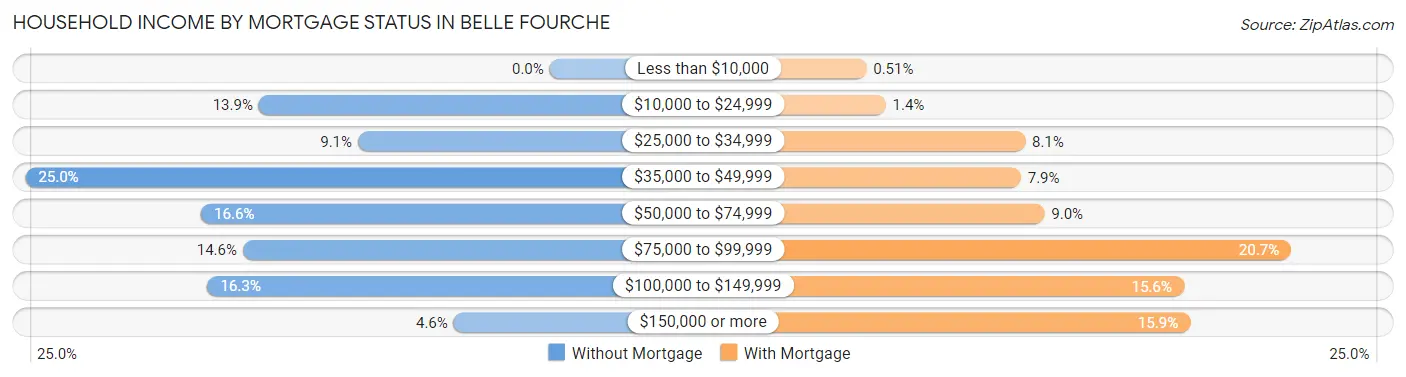
| Household Income | Without Mortgage | With Mortgage |
| Less than $10,000 | 0 (0.0%) | 5 (0.5%) |
| $10,000 to $24,999 | 91 (13.9%) | 14 (1.4%) |
| $25,000 to $34,999 | 60 (9.1%) | 79 (8.1%) |
| $35,000 to $49,999 | 164 (25.0%) | 77 (7.9%) |
| $50,000 to $74,999 | 109 (16.6%) | 88 (9.0%) |
| $75,000 to $99,999 | 96 (14.6%) | 203 (20.7%) |
| $100,000 to $149,999 | 107 (16.3%) | 153 (15.6%) |
| $150,000 or more | 30 (4.6%) | 156 (15.9%) |
| Total | 657 (100.0%) | 979 (100.0%) |
Property Value to Household Income Ratio in Belle Fourche
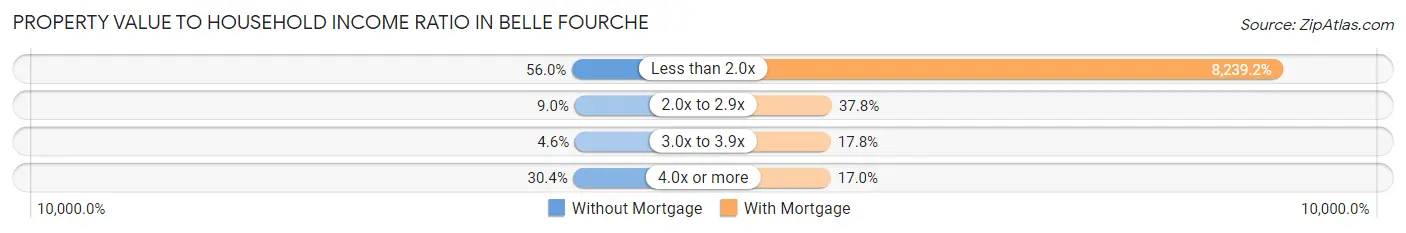
| Value-to-Income Ratio | Without Mortgage | With Mortgage |
| Less than 2.0x | 368 (56.0%) | 80,662 (8,239.2%) |
| 2.0x to 2.9x | 59 (9.0%) | 370 (37.8%) |
| 3.0x to 3.9x | 30 (4.6%) | 174 (17.8%) |
| 4.0x or more | 200 (30.4%) | 166 (17.0%) |
| Total | 657 (100.0%) | 979 (100.0%) |
Real Estate Taxes by Mortgage Status in Belle Fourche
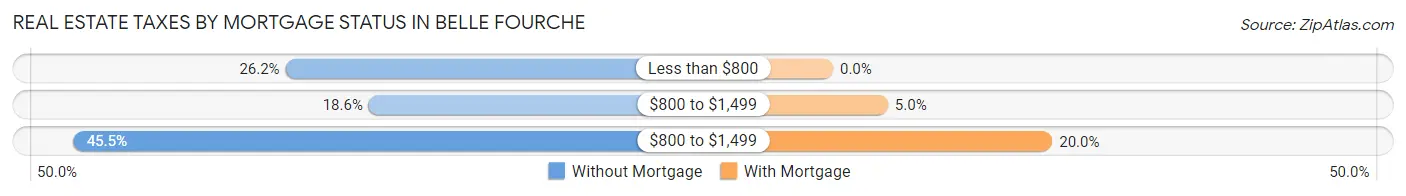
| Property Taxes | Without Mortgage | With Mortgage |
| Less than $800 | 172 (26.2%) | 0 (0.0%) |
| $800 to $1,499 | 122 (18.6%) | 49 (5.0%) |
| $800 to $1,499 | 299 (45.5%) | 196 (20.0%) |
| Total | 657 (100.0%) | 979 (100.0%) |
Health & Disability in Belle Fourche
Health Insurance Coverage by Age in Belle Fourche
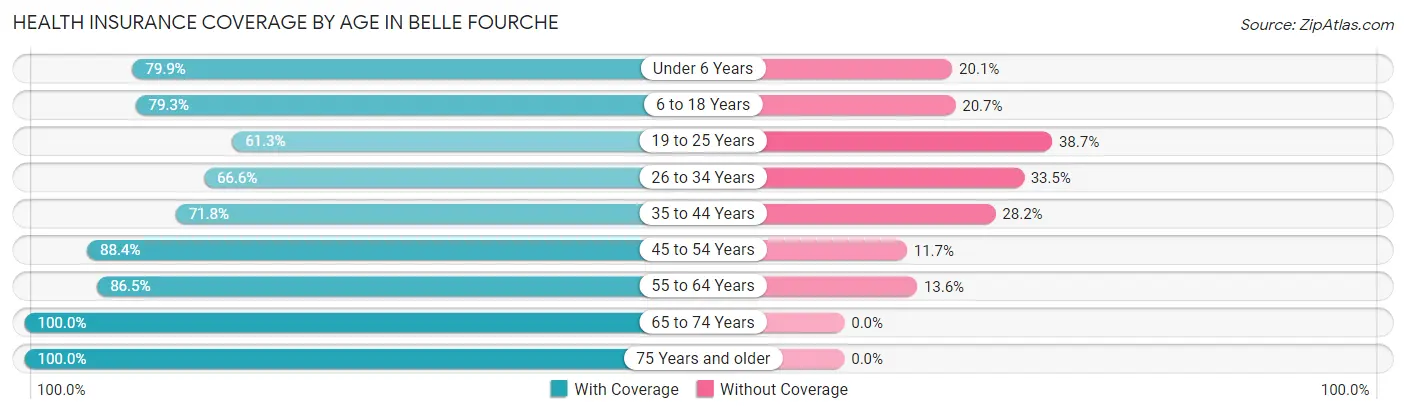
| Age Bracket | With Coverage | Without Coverage |
| Under 6 Years | 294 (79.9%) | 74 (20.1%) |
| 6 to 18 Years | 839 (79.3%) | 219 (20.7%) |
| 19 to 25 Years | 250 (61.3%) | 158 (38.7%) |
| 26 to 34 Years | 549 (66.5%) | 276 (33.5%) |
| 35 to 44 Years | 520 (71.8%) | 204 (28.2%) |
| 45 to 54 Years | 599 (88.3%) | 79 (11.7%) |
| 55 to 64 Years | 555 (86.5%) | 87 (13.6%) |
| 65 to 74 Years | 460 (100.0%) | 0 (0.0%) |
| 75 Years and older | 402 (100.0%) | 0 (0.0%) |
| Total | 4,468 (80.3%) | 1,097 (19.7%) |
Health Insurance Coverage by Citizenship Status in Belle Fourche
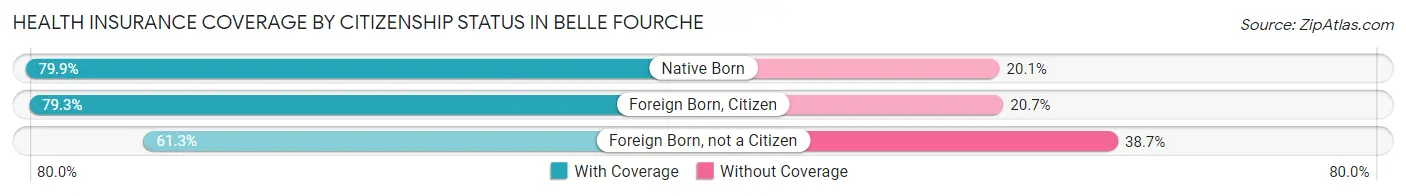
| Citizenship Status | With Coverage | Without Coverage |
| Native Born | 294 (79.9%) | 74 (20.1%) |
| Foreign Born, Citizen | 839 (79.3%) | 219 (20.7%) |
| Foreign Born, not a Citizen | 250 (61.3%) | 158 (38.7%) |
Health Insurance Coverage by Household Income in Belle Fourche
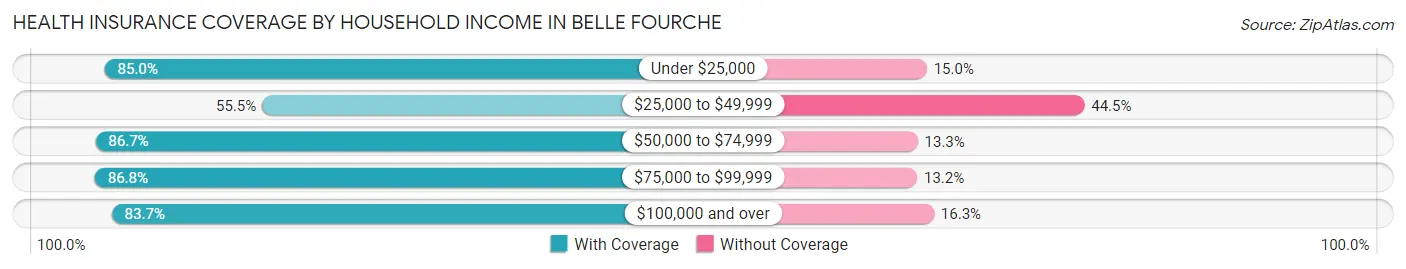
| Household Income | With Coverage | Without Coverage |
| Under $25,000 | 511 (85.0%) | 90 (15.0%) |
| $25,000 to $49,999 | 525 (55.5%) | 421 (44.5%) |
| $50,000 to $74,999 | 1,209 (86.7%) | 185 (13.3%) |
| $75,000 to $99,999 | 726 (86.8%) | 110 (13.2%) |
| $100,000 and over | 1,482 (83.7%) | 289 (16.3%) |
Public vs Private Health Insurance Coverage by Age in Belle Fourche
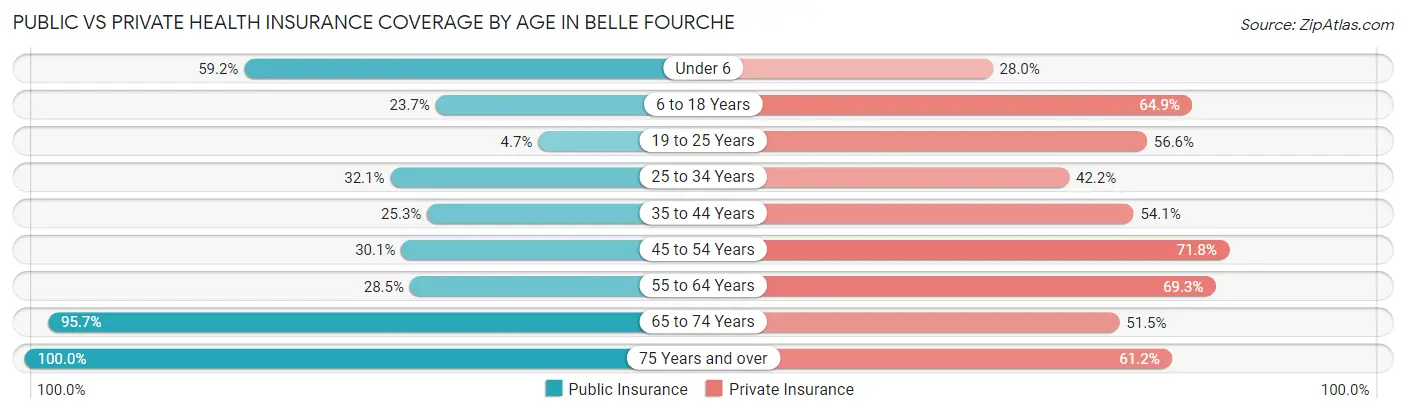
| Age Bracket | Public Insurance | Private Insurance |
| Under 6 | 218 (59.2%) | 103 (28.0%) |
| 6 to 18 Years | 251 (23.7%) | 687 (64.9%) |
| 19 to 25 Years | 19 (4.7%) | 231 (56.6%) |
| 25 to 34 Years | 265 (32.1%) | 348 (42.2%) |
| 35 to 44 Years | 183 (25.3%) | 392 (54.1%) |
| 45 to 54 Years | 204 (30.1%) | 487 (71.8%) |
| 55 to 64 Years | 183 (28.5%) | 445 (69.3%) |
| 65 to 74 Years | 440 (95.7%) | 237 (51.5%) |
| 75 Years and over | 402 (100.0%) | 246 (61.2%) |
| Total | 2,165 (38.9%) | 3,176 (57.1%) |
Disability Status by Sex by Age in Belle Fourche
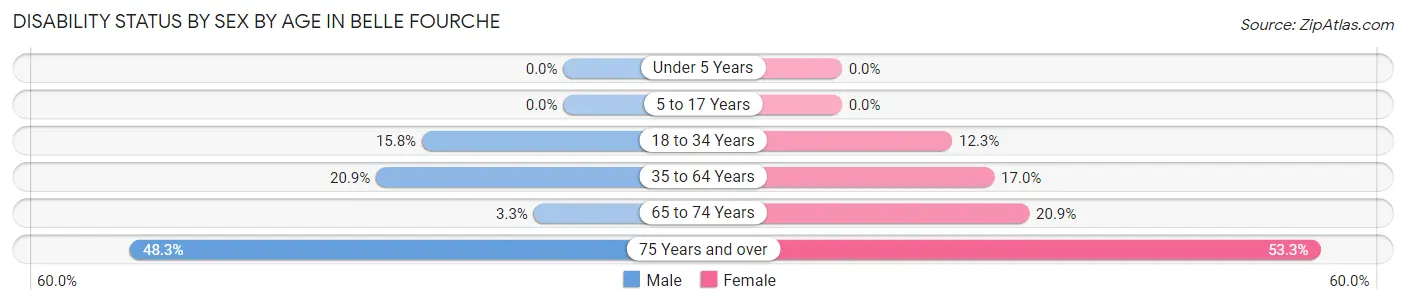
| Age Bracket | Male | Female |
| Under 5 Years | 0 (0.0%) | 0 (0.0%) |
| 5 to 17 Years | 0 (0.0%) | 0 (0.0%) |
| 18 to 34 Years | 106 (15.8%) | 76 (12.3%) |
| 35 to 64 Years | 210 (20.8%) | 176 (17.0%) |
| 65 to 74 Years | 6 (3.3%) | 58 (20.9%) |
| 75 Years and over | 69 (48.2%) | 138 (53.3%) |
Disability Class by Sex by Age in Belle Fourche
Disability Class: Hearing Difficulty
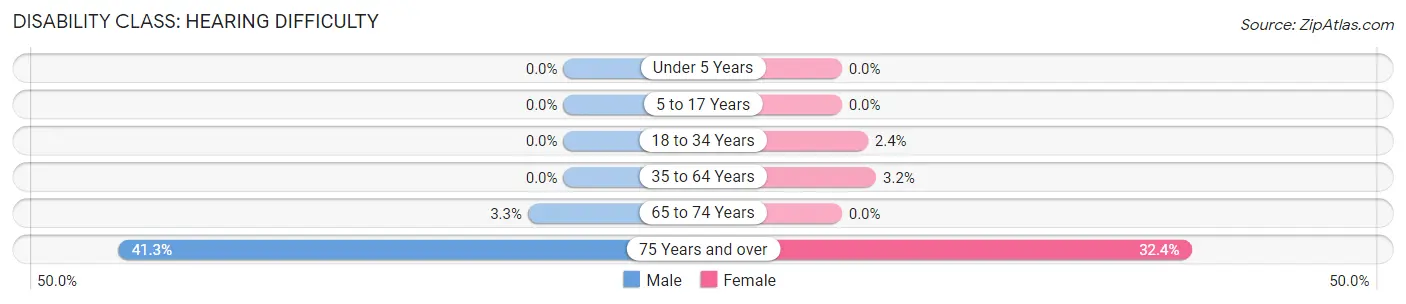
| Age Bracket | Male | Female |
| Under 5 Years | 0 (0.0%) | 0 (0.0%) |
| 5 to 17 Years | 0 (0.0%) | 0 (0.0%) |
| 18 to 34 Years | 0 (0.0%) | 15 (2.4%) |
| 35 to 64 Years | 0 (0.0%) | 33 (3.2%) |
| 65 to 74 Years | 6 (3.3%) | 0 (0.0%) |
| 75 Years and over | 59 (41.3%) | 84 (32.4%) |
Disability Class: Vision Difficulty
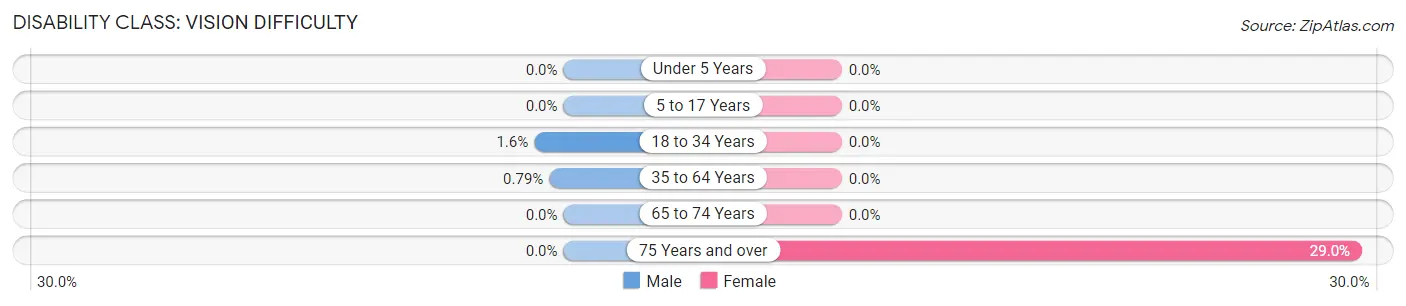
| Age Bracket | Male | Female |
| Under 5 Years | 0 (0.0%) | 0 (0.0%) |
| 5 to 17 Years | 0 (0.0%) | 0 (0.0%) |
| 18 to 34 Years | 11 (1.6%) | 0 (0.0%) |
| 35 to 64 Years | 8 (0.8%) | 0 (0.0%) |
| 65 to 74 Years | 0 (0.0%) | 0 (0.0%) |
| 75 Years and over | 0 (0.0%) | 75 (29.0%) |
Disability Class: Cognitive Difficulty
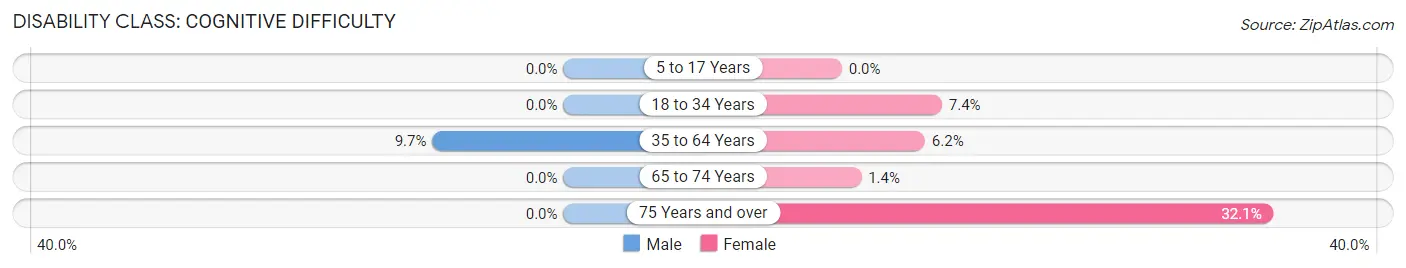
| Age Bracket | Male | Female |
| 5 to 17 Years | 0 (0.0%) | 0 (0.0%) |
| 18 to 34 Years | 0 (0.0%) | 46 (7.4%) |
| 35 to 64 Years | 98 (9.7%) | 64 (6.2%) |
| 65 to 74 Years | 0 (0.0%) | 4 (1.4%) |
| 75 Years and over | 0 (0.0%) | 83 (32.1%) |
Disability Class: Ambulatory Difficulty
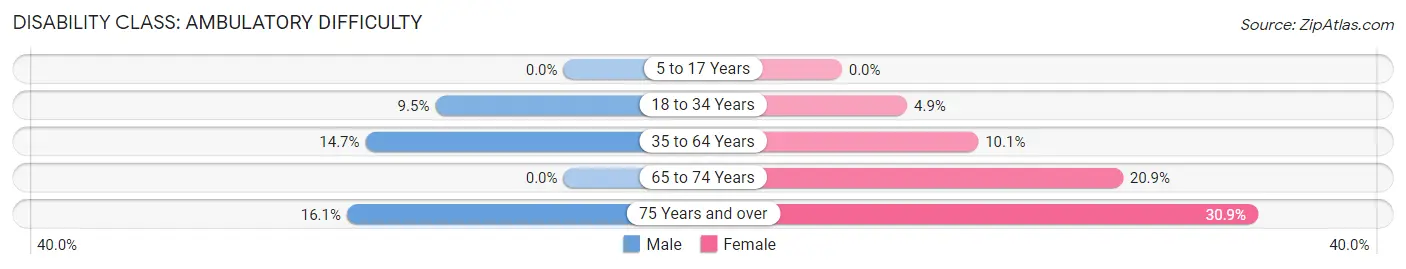
| Age Bracket | Male | Female |
| 5 to 17 Years | 0 (0.0%) | 0 (0.0%) |
| 18 to 34 Years | 64 (9.5%) | 30 (4.9%) |
| 35 to 64 Years | 148 (14.7%) | 105 (10.1%) |
| 65 to 74 Years | 0 (0.0%) | 58 (20.9%) |
| 75 Years and over | 23 (16.1%) | 80 (30.9%) |
Disability Class: Self-Care Difficulty
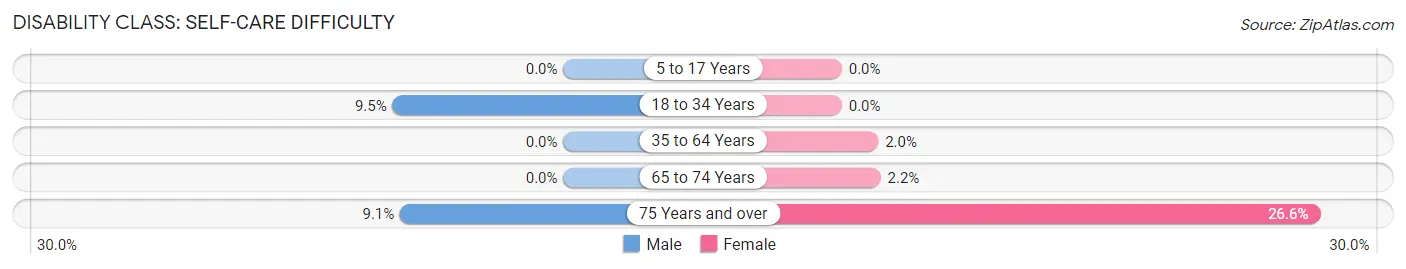
| Age Bracket | Male | Female |
| 5 to 17 Years | 0 (0.0%) | 0 (0.0%) |
| 18 to 34 Years | 64 (9.5%) | 0 (0.0%) |
| 35 to 64 Years | 0 (0.0%) | 21 (2.0%) |
| 65 to 74 Years | 0 (0.0%) | 6 (2.2%) |
| 75 Years and over | 13 (9.1%) | 69 (26.6%) |
Technology Access in Belle Fourche
Computing Device Access in Belle Fourche
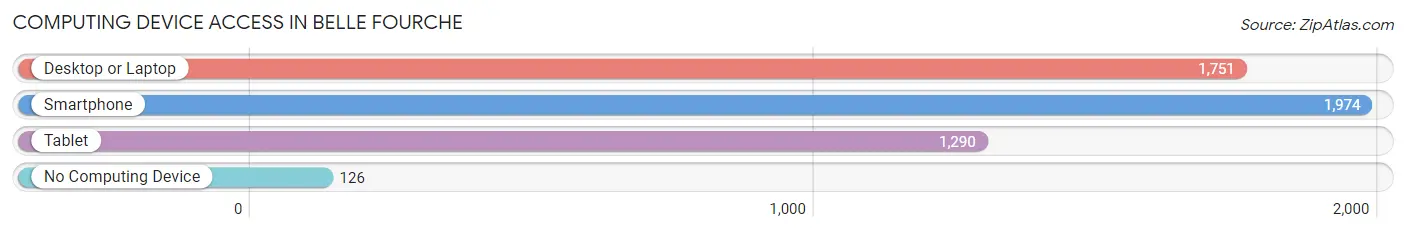
| Device Type | # Households | % Households |
| Desktop or Laptop | 1,751 | 74.8% |
| Smartphone | 1,974 | 84.4% |
| Tablet | 1,290 | 55.1% |
| No Computing Device | 126 | 5.4% |
| Total | 2,340 | 100.0% |
Internet Access in Belle Fourche
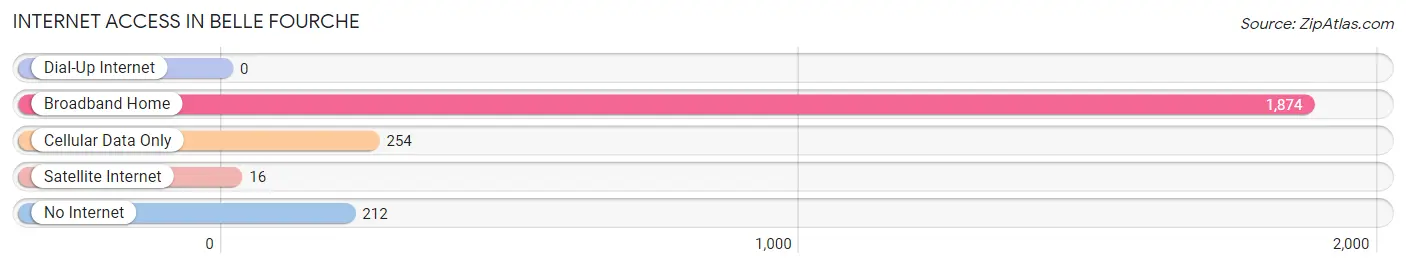
| Internet Type | # Households | % Households |
| Dial-Up Internet | 0 | 0.0% |
| Broadband Home | 1,874 | 80.1% |
| Cellular Data Only | 254 | 10.8% |
| Satellite Internet | 16 | 0.7% |
| No Internet | 212 | 9.1% |
| Total | 2,340 | 100.0% |
Belle Fourche Summary
Belle Fourche, South Dakota is a small city located in Butte County in the western part of the state. It is the county seat and the largest city in the county. The city is situated on the Belle Fourche River, which is a tributary of the Cheyenne River. The city is located at the intersection of Interstate 90 and U.S. Route 85.
History
Belle Fourche was founded in 1892 by the Belle Fourche Land and Townsite Company. The company was formed by a group of investors from the East Coast who wanted to develop the area for agricultural and commercial purposes. The city was named after the nearby Belle Fourche River, which was named by French fur traders in the early 1800s.
The city quickly grew and by 1900, it had a population of 1,000. The city was incorporated in 1906 and by 1910, the population had grown to 1,845. The city continued to grow and by 1950, the population had reached 3,845.
Geography
Belle Fourche is located in the western part of South Dakota, in Butte County. It is situated on the Belle Fourche River, which is a tributary of the Cheyenne River. The city is located at the intersection of Interstate 90 and U.S. Route 85.
The city has a total area of 4.2 square miles, all of which is land. The city is located at an elevation of 3,845 feet above sea level. The climate is semi-arid, with hot summers and cold winters.
Economy
Belle Fourche is a small city with a population of 5,594 as of 2019. The city’s economy is largely based on agriculture, with the main crops being wheat, corn, and hay. The city is also home to several manufacturing companies, including a plastics plant, a metal fabrication plant, and a food processing plant.
The city is also home to several retail stores, restaurants, and other businesses. The city is also home to the Belle Fourche Country Club, which is a popular destination for golfers.
Demographics
As of the 2010 census, the population of Belle Fourche was 5,594. The racial makeup of the city was 95.3% White, 0.3% African American, 0.7% Native American, 0.3% Asian, 0.1% Pacific Islander, 1.2% from other races, and 2.3% from two or more races. Hispanic or Latino of any race were 3.2% of the population.
The median income for a household in the city was $41,944, and the median income for a family was $50,917. The per capita income for the city was $20,945. About 8.3% of families and 11.2% of the population were below the poverty line, including 15.2% of those under age 18 and 8.2% of those age 65 or over.
Common Questions
What is Per Capita Income in Belle Fourche?
Per Capita income in Belle Fourche is $34,987.
What is the Median Family Income in Belle Fourche?
Median Family Income in Belle Fourche is $74,461.
What is the Median Household income in Belle Fourche?
Median Household Income in Belle Fourche is $55,448.
What is Income or Wage Gap in Belle Fourche?
Income or Wage Gap in Belle Fourche is 48.1%.
Women in Belle Fourche earn 51.9 cents for every dollar earned by a man.
What is Inequality or Gini Index in Belle Fourche?
Inequality or Gini Index in Belle Fourche is 0.51.
What is the Total Population of Belle Fourche?
Total Population of Belle Fourche is 5,670.
What is the Total Male Population of Belle Fourche?
Total Male Population of Belle Fourche is 2,754.
What is the Total Female Population of Belle Fourche?
Total Female Population of Belle Fourche is 2,916.
What is the Ratio of Males per 100 Females in Belle Fourche?
There are 94.44 Males per 100 Females in Belle Fourche.
What is the Ratio of Females per 100 Males in Belle Fourche?
There are 105.88 Females per 100 Males in Belle Fourche.
What is the Median Population Age in Belle Fourche?
Median Population Age in Belle Fourche is 36.0 Years.
What is the Average Family Size in Belle Fourche
Average Family Size in Belle Fourche is 3.0 People.
What is the Average Household Size in Belle Fourche
Average Household Size in Belle Fourche is 2.4 People.
How Large is the Labor Force in Belle Fourche?
There are 2,973 People in the Labor Forcein in Belle Fourche.
What is the Percentage of People in the Labor Force in Belle Fourche?
66.1% of People are in the Labor Force in Belle Fourche.
What is the Unemployment Rate in Belle Fourche?
Unemployment Rate in Belle Fourche is 9.2%.