Area Code 618 Map & Demographics
Area Code 618 Map
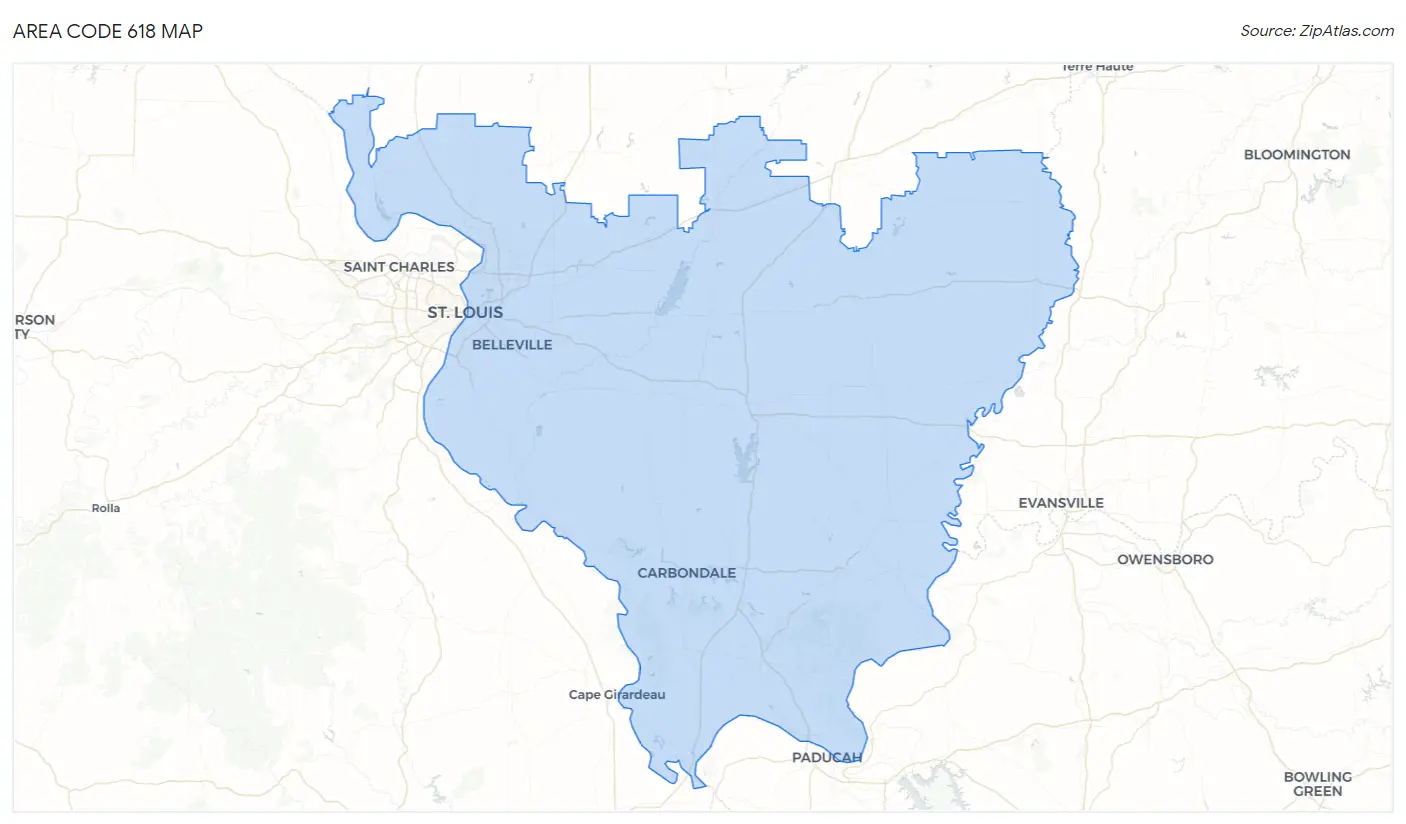
Area Code 618 Overview
$31,955
PER CAPITA INCOME
$79,447
AVG FAMILY INCOME
$64,170
AVG HOUSEHOLD INCOME
32.5%
WAGE / INCOME GAP [ % ]
67.5¢/ $1
WAGE / INCOME GAP [ $ ]
$10,806
FAMILY INCOME DEFICIT
123.02
INEQUALITY / GINI INDEX
1,177,395
TOTAL POPULATION
589,915
MALE POPULATION
587,480
FEMALE POPULATION
100.41
MALES / 100 FEMALES
99.59
FEMALES / 100 MALES
43.1
MEDIAN AGE
3.1
AVG FAMILY SIZE
2.5
AVG HOUSEHOLD SIZE
547,790
LABOR FORCE [ PEOPLE ]
57.4%
PERCENT IN LABOR FORCE
6.4%
UNEMPLOYMENT RATE
Income in Area Code 618
Income Overview in Area Code 618
Per Capita Income in Area Code 618 is $31,955, while median incomes of families and households are $79,447 and $64,170 respectively.
| Characteristic | Number | Measure |
| Per Capita Income | 1,177,395 | $31,955 |
| Median Family Income | 299,500 | $79,447 |
| Mean Family Income | 299,500 | $27,803,690 |
| Median Household Income | 471,641 | $64,170 |
| Mean Household Income | 471,641 | $23,682,820 |
| Income Deficit | 299,500 | $10,806 |
| Wage / Income Gap (%) | 1,177,395 | 32.47% |
| Wage / Income Gap ($) | 1,177,395 | 67.53¢ per $1 |
| Gini / Inequality Index | 1,177,395 | 123.02 |
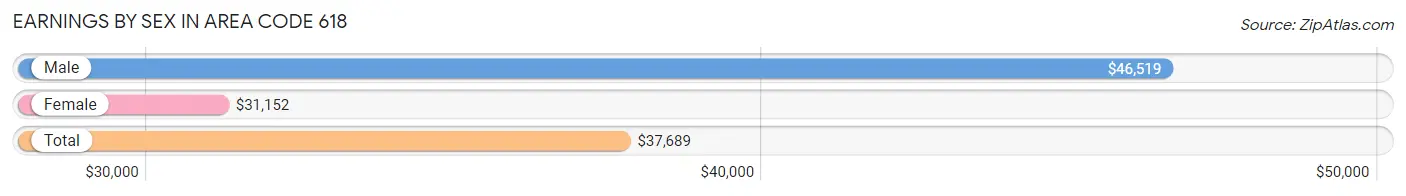
Earnings by Sex in Area Code 618
Average Earnings in Area Code 618 are $37,689, $46,519 for men and $31,152 for women, a difference of 33.0%.
| Sex | Number | Average Earnings |
| Male | 312,154 (52.2%) | $46,519 |
| Female | 285,431 (47.8%) | $31,152 |
| Total | 597,585 (100.0%) | $37,689 |
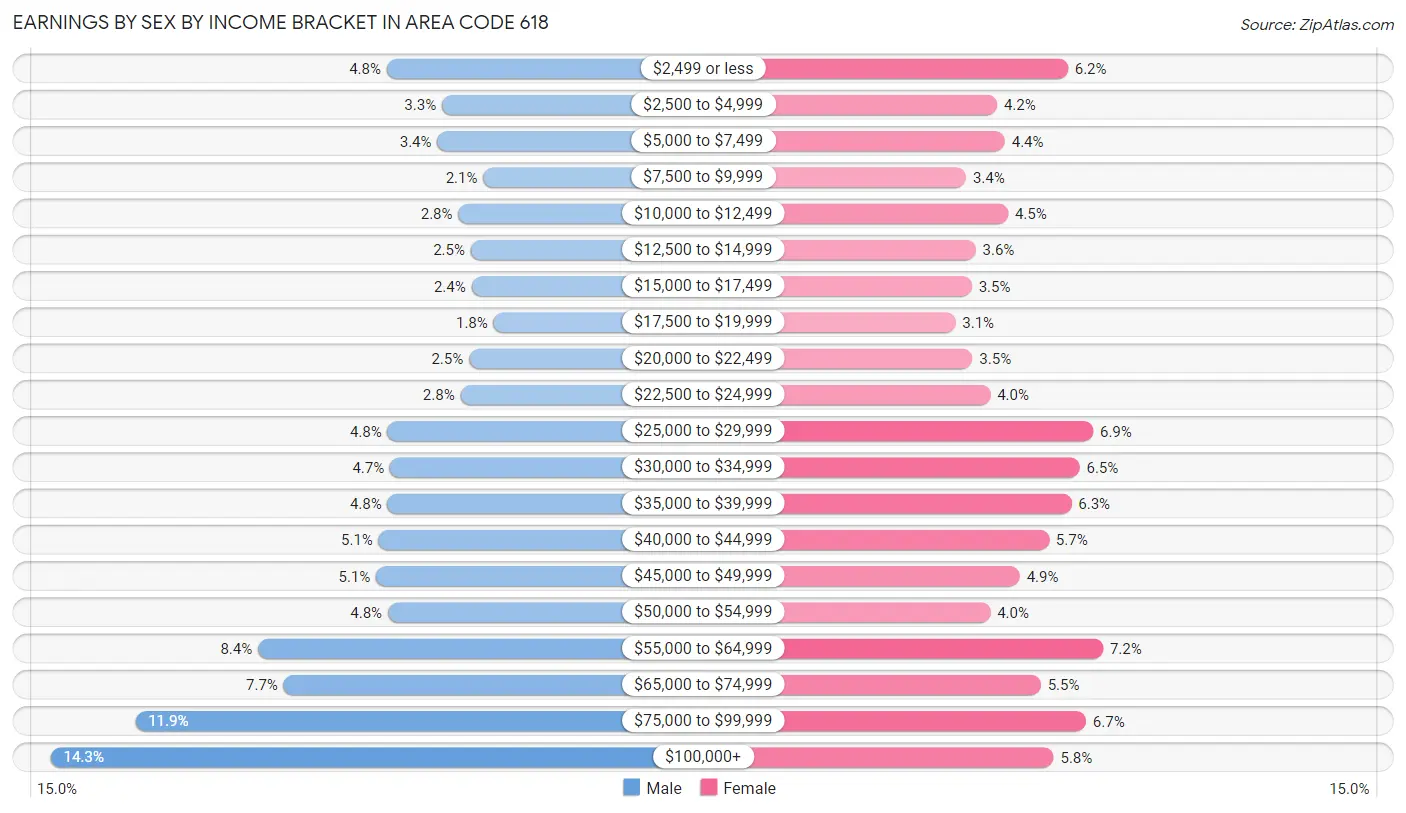
Earnings by Sex by Income Bracket in Area Code 618
The most common earnings brackets in Area Code 618 are $100,000+ for men (44,559 | 14.3%) and $55,000 to $64,999 for women (20,561 | 7.2%).
| Income | Male | Female |
| $2,499 or less | 15,031 (4.8%) | 17,726 (6.2%) |
| $2,500 to $4,999 | 10,223 (3.3%) | 12,033 (4.2%) |
| $5,000 to $7,499 | 10,598 (3.4%) | 12,675 (4.4%) |
| $7,500 to $9,999 | 6,596 (2.1%) | 9,555 (3.4%) |
| $10,000 to $12,499 | 8,757 (2.8%) | 12,938 (4.5%) |
| $12,500 to $14,999 | 7,666 (2.5%) | 10,323 (3.6%) |
| $15,000 to $17,499 | 7,614 (2.4%) | 10,023 (3.5%) |
| $17,500 to $19,999 | 5,667 (1.8%) | 8,714 (3.0%) |
| $20,000 to $22,499 | 7,835 (2.5%) | 10,062 (3.5%) |
| $22,500 to $24,999 | 8,592 (2.8%) | 11,491 (4.0%) |
| $25,000 to $29,999 | 14,974 (4.8%) | 19,742 (6.9%) |
| $30,000 to $34,999 | 14,753 (4.7%) | 18,665 (6.5%) |
| $35,000 to $39,999 | 14,986 (4.8%) | 18,001 (6.3%) |
| $40,000 to $44,999 | 15,765 (5.1%) | 16,210 (5.7%) |
| $45,000 to $49,999 | 15,989 (5.1%) | 13,877 (4.9%) |
| $50,000 to $54,999 | 14,964 (4.8%) | 11,515 (4.0%) |
| $55,000 to $64,999 | 26,345 (8.4%) | 20,561 (7.2%) |
| $65,000 to $74,999 | 24,111 (7.7%) | 15,547 (5.4%) |
| $75,000 to $99,999 | 37,129 (11.9%) | 19,176 (6.7%) |
| $100,000+ | 44,559 (14.3%) | 16,597 (5.8%) |
| Total | 312,154 (100.0%) | 285,431 (100.0%) |
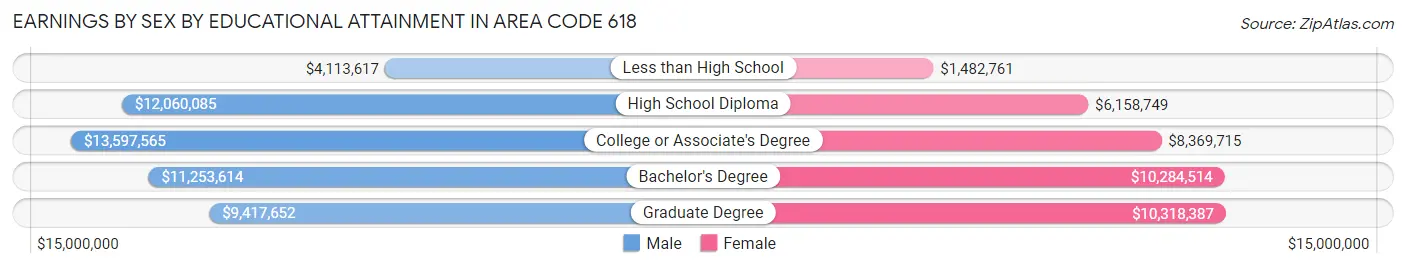
Earnings by Sex by Educational Attainment in Area Code 618
Average earnings in Area Code 618 are $14,938,852 for men and $10,086,794 for women, a difference of 32.5%. Men with an educational attainment of college or associate's degree enjoy the highest average annual earnings of $13,597,565, while those with less than high school education earn the least with $4,113,617. Women with an educational attainment of graduate degree earn the most with the average annual earnings of $10,318,387, while those with less than high school education have the smallest earnings of $1,482,761.
| Educational Attainment | Male Income | Female Income |
| Less than High School | $4,113,617 | $1,482,761 |
| High School Diploma | $12,060,085 | $6,158,749 |
| College or Associate's Degree | $13,597,565 | $8,369,715 |
| Bachelor's Degree | $11,253,614 | $10,284,514 |
| Graduate Degree | $9,417,652 | $10,318,387 |
| Total | $14,938,852 | $10,086,794 |
Family Income in Area Code 618
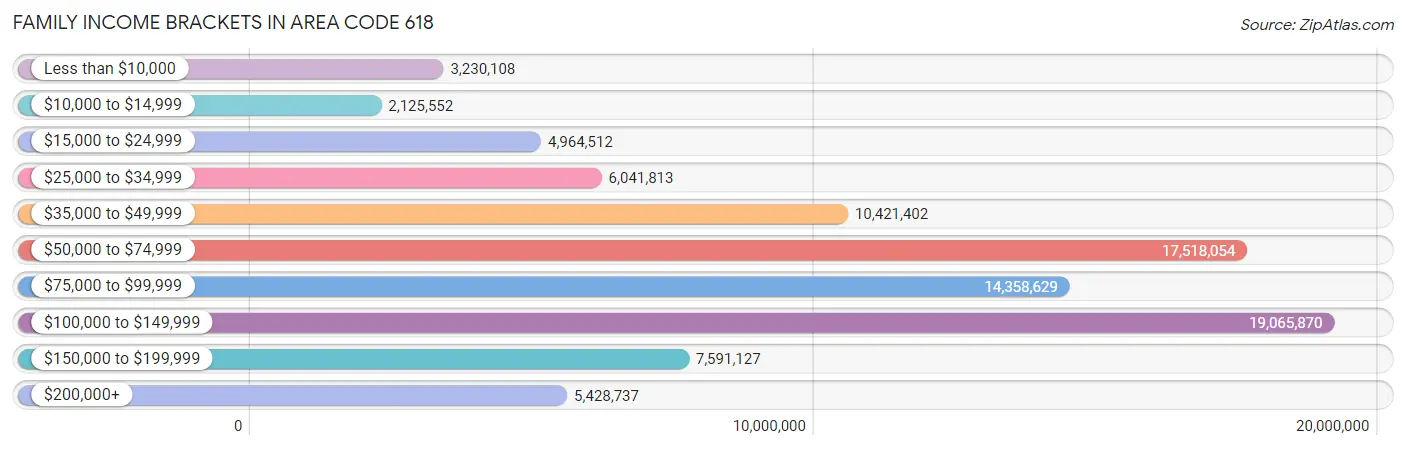
Family Income Brackets in Area Code 618
According to the Area Code 618 family income data, there are 19,065,870 families falling into the $100,000 to $149,999 income range, which is the most common income bracket and makes up 6,365.9% of all families. Conversely, the $10,000 to $14,999 income bracket is the least frequent group with only 2,125,552 families (709.7%) belonging to this category.
| Income Bracket | # Families | % Families |
| Less than $10,000 | 3,230,108 | 1,078.5% |
| $10,000 to $14,999 | 2,125,552 | 709.7% |
| $15,000 to $24,999 | 4,964,512 | 1,657.6% |
| $25,000 to $34,999 | 6,041,813 | 2,017.3% |
| $35,000 to $49,999 | 10,421,402 | 3,479.6% |
| $50,000 to $74,999 | 17,518,054 | 5,849.1% |
| $75,000 to $99,999 | 14,358,629 | 4,794.2% |
| $100,000 to $149,999 | 19,065,870 | 6,365.9% |
| $150,000 to $199,999 | 7,591,127 | 2,534.6% |
| $200,000+ | 5,428,737 | 1,812.6% |
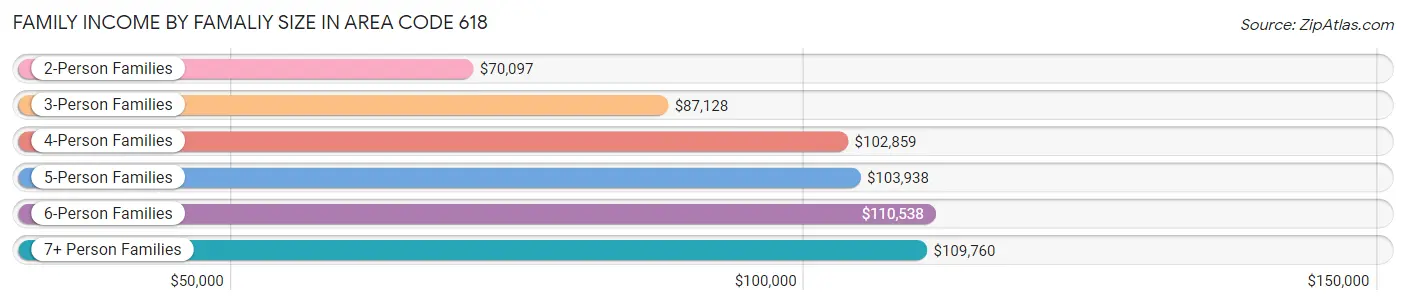
Family Income by Famaliy Size in Area Code 618
6-person families (7,033 | 2.4%) account for the highest median family income in Area Code 618 with $110,538 per family, while 2-person families (152,808 | 51.0%) have the highest median income of $35,049 per family member.
| Income Bracket | # Families | Median Income |
| 2-Person Families | 152,808 (51.0%) | $70,097 |
| 3-Person Families | 63,524 (21.2%) | $87,128 |
| 4-Person Families | 51,097 (17.1%) | $102,859 |
| 5-Person Families | 21,353 (7.1%) | $103,938 |
| 6-Person Families | 7,033 (2.4%) | $110,538 |
| 7+ Person Families | 3,685 (1.2%) | $109,760 |
| Total | 299,500 (100.0%) | $79,447 |
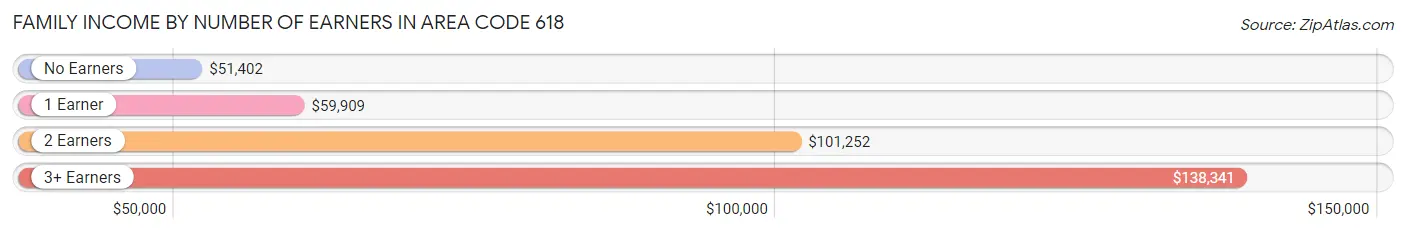
Family Income by Number of Earners in Area Code 618
The median family income in Area Code 618 is $79,447, with families comprising 3+ earners (32,057) having the highest median family income of $138,341, while families with no earners (51,063) have the lowest median family income of $51,402, accounting for 10.7% and 17.1% of families, respectively.
| Number of Earners | # Families | Median Income |
| No Earners | 51,063 (17.1%) | $51,402 |
| 1 Earner | 97,198 (32.5%) | $59,909 |
| 2 Earners | 119,182 (39.8%) | $101,252 |
| 3+ Earners | 32,057 (10.7%) | $138,341 |
| Total | 299,500 (100.0%) | $79,447 |
Household Income in Area Code 618
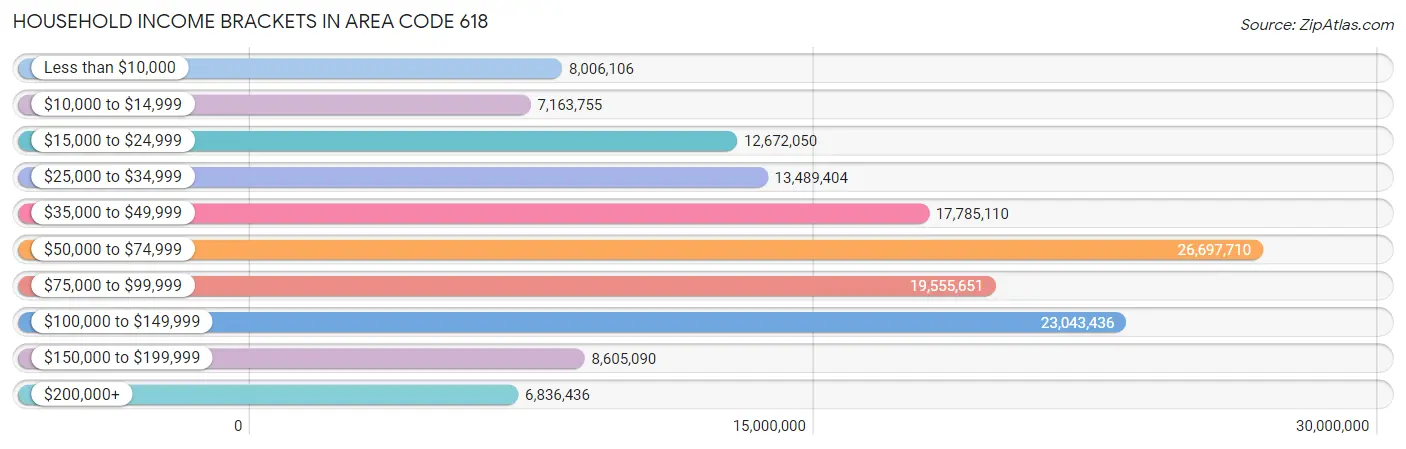
Household Income Brackets in Area Code 618
With 26,697,710 households falling in the category, the $50,000 to $74,999 income range is the most frequent in Area Code 618, accounting for 5,660.6% of all households. In contrast, only 6,836,436 households (1,449.5%) fall into the $200,000+ income bracket, making it the least populous group.
| Income Bracket | # Households | % Households |
| Less than $10,000 | 8,006,106 | 1,697.5% |
| $10,000 to $14,999 | 7,163,755 | 1,518.9% |
| $15,000 to $24,999 | 12,672,050 | 2,686.8% |
| $25,000 to $34,999 | 13,489,404 | 2,860.1% |
| $35,000 to $49,999 | 17,785,110 | 3,770.9% |
| $50,000 to $74,999 | 26,697,710 | 5,660.6% |
| $75,000 to $99,999 | 19,555,651 | 4,146.3% |
| $100,000 to $149,999 | 23,043,436 | 4,885.8% |
| $150,000 to $199,999 | 8,605,090 | 1,824.5% |
| $200,000+ | 6,836,436 | 1,449.5% |
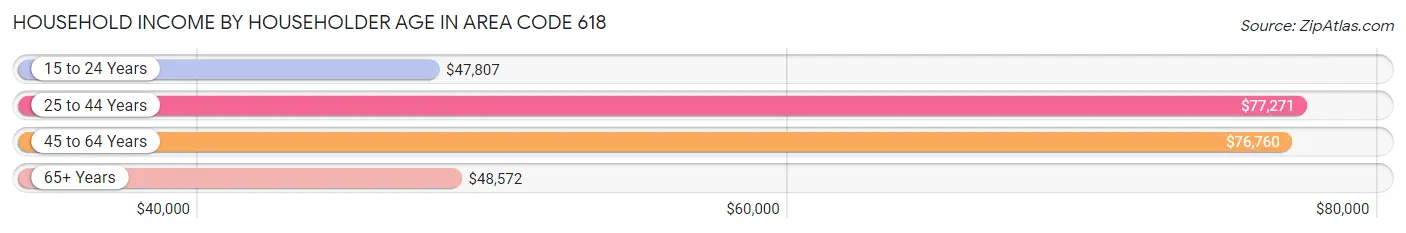
Household Income by Householder Age in Area Code 618
The median household income in Area Code 618 is $64,170, with the highest median household income of $77,271 found in the 25 to 44 years age bracket for the primary householder. A total of 140,296 households (29.7%) fall into this category. Meanwhile, the 15 to 24 years age bracket for the primary householder has the lowest median household income of $47,807, with 18,378 households (3.9%) in this group.
| Income Bracket | # Households | Median Income |
| 15 to 24 Years | 18,378 (3.9%) | $47,807 |
| 25 to 44 Years | 140,296 (29.7%) | $77,271 |
| 45 to 64 Years | 172,293 (36.5%) | $76,760 |
| 65+ Years | 140,674 (29.8%) | $48,572 |
| Total | 471,641 (100.0%) | $64,170 |
Poverty in Area Code 618
Income Below Poverty by Sex and Age in Area Code 618
With 12.2% poverty level for males and 15.0% for females among the residents of Area Code 618, under 5 year old males and 18 to 24 year old females are the most vulnerable to poverty, with 7,078 males (21.6%) and 11,374 females (24.9%) in their respective age groups living below the poverty level.
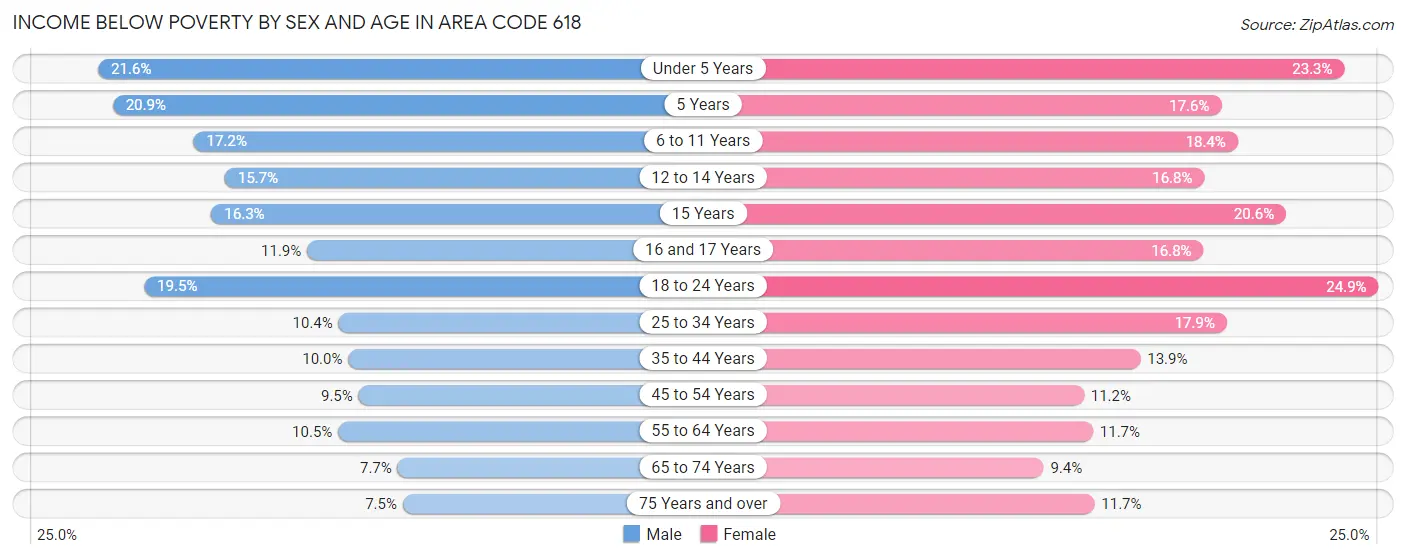
| Age Bracket | Male | Female |
| Under 5 Years | 7,078 (21.6%) | 7,076 (23.3%) |
| 5 Years | 1,391 (20.9%) | 1,118 (17.6%) |
| 6 to 11 Years | 7,329 (17.2%) | 7,317 (18.4%) |
| 12 to 14 Years | 3,524 (15.7%) | 3,679 (16.8%) |
| 15 Years | 1,206 (16.3%) | 1,500 (20.6%) |
| 16 and 17 Years | 1,875 (11.9%) | 2,408 (16.8%) |
| 18 to 24 Years | 9,431 (19.5%) | 11,374 (24.9%) |
| 25 to 34 Years | 7,279 (10.4%) | 12,367 (17.9%) |
| 35 to 44 Years | 7,016 (10.0%) | 9,806 (13.9%) |
| 45 to 54 Years | 6,629 (9.5%) | 7,924 (11.2%) |
| 55 to 64 Years | 8,413 (10.4%) | 9,589 (11.7%) |
| 65 to 74 Years | 4,548 (7.7%) | 6,057 (9.4%) |
| 75 Years and over | 2,653 (7.4%) | 6,001 (11.7%) |
| Total | 68,372 (12.2%) | 86,216 (15.0%) |
Income Above Poverty by Sex and Age in Area Code 618
According to the poverty statistics in Area Code 618, males aged 75 years and over and females aged 65 to 74 years are the age groups that are most secure financially, with 92.5% of males and 90.6% of females in these age groups living above the poverty line.
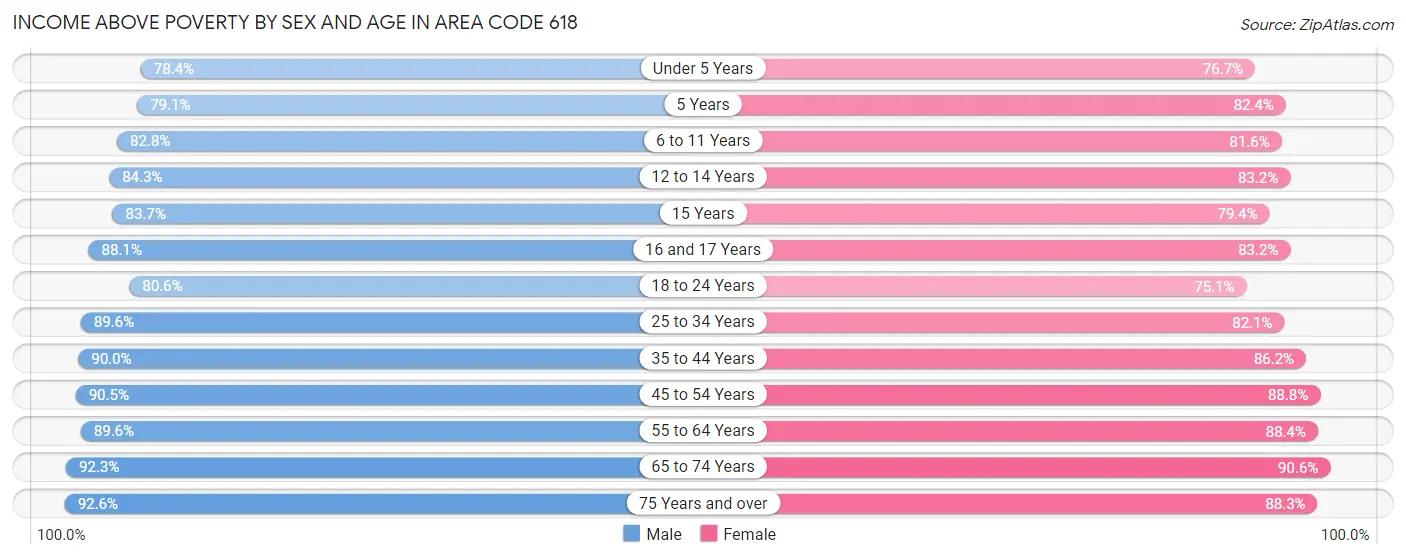
| Age Bracket | Male | Female |
| Under 5 Years | 25,710 (78.4%) | 23,273 (76.7%) |
| 5 Years | 5,262 (79.1%) | 5,230 (82.4%) |
| 6 to 11 Years | 35,379 (82.8%) | 32,520 (81.6%) |
| 12 to 14 Years | 18,912 (84.3%) | 18,189 (83.2%) |
| 15 Years | 6,181 (83.7%) | 5,779 (79.4%) |
| 16 and 17 Years | 13,900 (88.1%) | 11,940 (83.2%) |
| 18 to 24 Years | 39,051 (80.5%) | 34,298 (75.1%) |
| 25 to 34 Years | 62,522 (89.6%) | 56,893 (82.1%) |
| 35 to 44 Years | 63,301 (90.0%) | 61,001 (86.2%) |
| 45 to 54 Years | 63,129 (90.5%) | 62,630 (88.8%) |
| 55 to 64 Years | 72,100 (89.5%) | 72,745 (88.3%) |
| 65 to 74 Years | 54,623 (92.3%) | 58,659 (90.6%) |
| 75 Years and over | 32,951 (92.5%) | 45,188 (88.3%) |
| Total | 493,021 (87.8%) | 488,345 (85.0%) |
Income Below Poverty Among Married-Couple Families in Area Code 618
The poverty statistics for married-couple families in Area Code 618 show that 3.9% or 8,652 of the total 222,579 families live below the poverty line. Families with 5 or more children have the highest poverty rate of 23.3%, comprising of 391 families. On the other hand, families with no children have the lowest poverty rate of 2.9%, which includes 4,036 families.
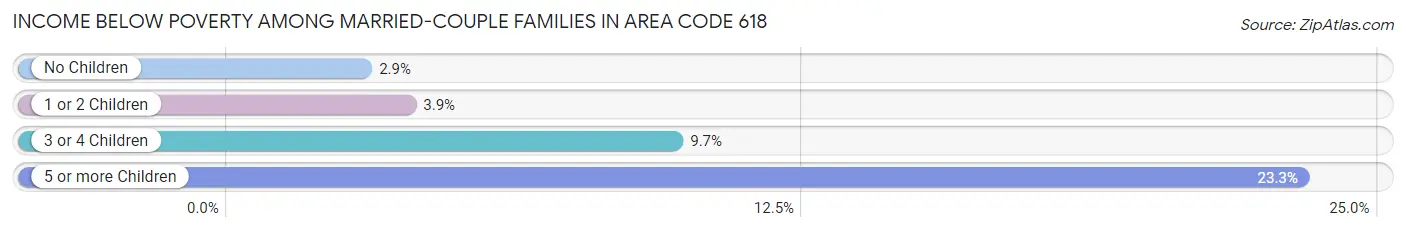
| Children | Above Poverty | Below Poverty |
| No Children | 134,288 (97.1%) | 4,036 (2.9%) |
| 1 or 2 Children | 62,460 (96.1%) | 2,519 (3.9%) |
| 3 or 4 Children | 15,893 (90.3%) | 1,706 (9.7%) |
| 5 or more Children | 1,286 (76.7%) | 391 (23.3%) |
| Total | 213,927 (96.1%) | 8,652 (3.9%) |
Income Below Poverty Among Single-Parent Households in Area Code 618
According to the poverty data in Area Code 618, 15.6% or 3,509 single-father households and 28.4% or 15,448 single-mother households are living below the poverty line. Among single-father households, those with 5 or more children have the highest poverty rate, with 41 households (25.5%) experiencing poverty. Likewise, among single-mother households, those with 5 or more children have the highest poverty rate, with 561 households (84.5%) falling below the poverty line.
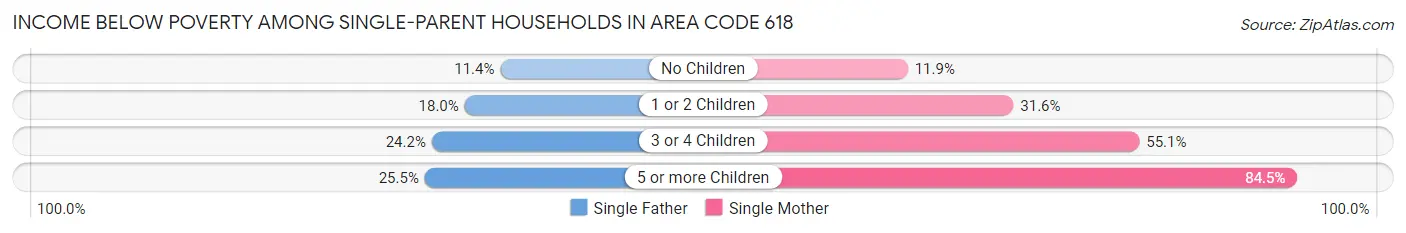
| Children | Single Father | Single Mother |
| No Children | 1,106 (11.4%) | 2,187 (11.9%) |
| 1 or 2 Children | 2,013 (18.0%) | 9,197 (31.6%) |
| 3 or 4 Children | 349 (24.2%) | 3,503 (55.1%) |
| 5 or more Children | 41 (25.5%) | 561 (84.5%) |
| Total | 3,509 (15.6%) | 15,448 (28.4%) |
Income Below Poverty Among Married-Couple vs Single-Parent Households in Area Code 618
The poverty data for Area Code 618 shows that 8,652 of the married-couple family households (3.9%) and 18,957 of the single-parent households (24.6%) are living below the poverty level. Within the married-couple family households, those with 5 or more children have the highest poverty rate, with 391 households (23.3%) falling below the poverty line. Among the single-parent households, those with 5 or more children have the highest poverty rate, with 602 household (73.0%) living below poverty.
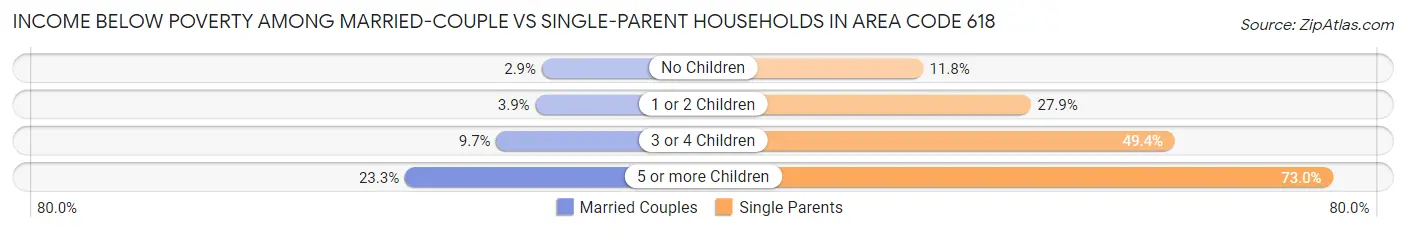
| Children | Married-Couple Families | Single-Parent Households |
| No Children | 4,036 (2.9%) | 3,293 (11.7%) |
| 1 or 2 Children | 2,519 (3.9%) | 11,210 (27.9%) |
| 3 or 4 Children | 1,706 (9.7%) | 3,852 (49.3%) |
| 5 or more Children | 391 (23.3%) | 602 (73.0%) |
| Total | 8,652 (3.9%) | 18,957 (24.6%) |
Race in Area Code 618
The most populous races in Area Code 618 are White / Caucasian (972,358 | 82.6%), Black / African American (126,936 | 10.8%), and Two or more Races (51,058 | 4.3%).
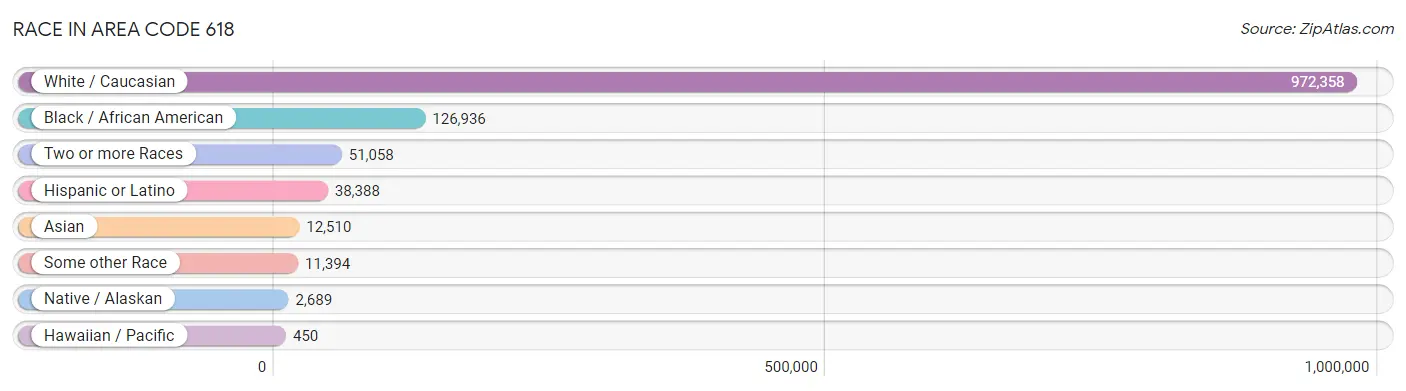
| Race | # Population | % Population |
| Asian | 12,510 | 1.1% |
| Black / African American | 126,936 | 10.8% |
| Hawaiian / Pacific | 450 | 0.0% |
| Hispanic or Latino | 38,388 | 3.3% |
| Native / Alaskan | 2,689 | 0.2% |
| White / Caucasian | 972,358 | 82.6% |
| Two or more Races | 51,058 | 4.3% |
| Some other Race | 11,394 | 1.0% |
| Total | 1,177,395 | 100.0% |
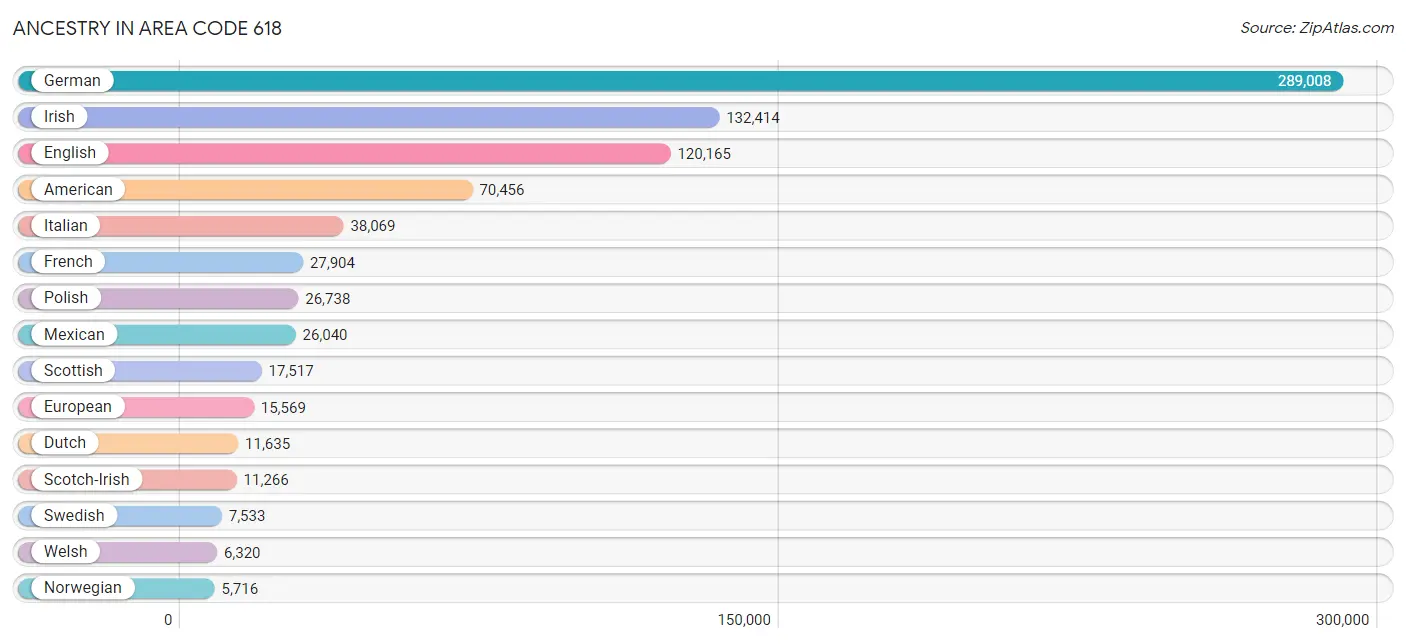
Ancestry in Area Code 618
The most populous ancestries reported in Area Code 618 are German (289,008 | 24.5%), Irish (132,414 | 11.3%), English (120,165 | 10.2%), American (70,456 | 6.0%), and Italian (38,069 | 3.2%), together accounting for 55.2% of all Area Code 618 residents.
| Ancestry | # Population | % Population |
| African | 2,395 | 0.2% |
| Alaska Native | 13 | 0.0% |
| Alaskan Athabascan | 5 | 0.0% |
| Albanian | 393 | 0.0% |
| Alsatian | 44 | 0.0% |
| American | 70,456 | 6.0% |
| Apache | 302 | 0.0% |
| Arab | 2,103 | 0.2% |
| Argentinean | 131 | 0.0% |
| Armenian | 475 | 0.0% |
| Assyrian / Chaldean / Syriac | 20 | 0.0% |
| Australian | 41 | 0.0% |
| Austrian | 1,510 | 0.1% |
| Bahamian | 29 | 0.0% |
| Bangladeshi | 40 | 0.0% |
| Barbadian | 16 | 0.0% |
| Basque | 20 | 0.0% |
| Belgian | 933 | 0.1% |
| Belizean | 26 | 0.0% |
| Bermudan | 21 | 0.0% |
| Bhutanese | 1,616 | 0.1% |
| Blackfeet | 983 | 0.1% |
| Bolivian | 76 | 0.0% |
| Brazilian | 114 | 0.0% |
| British | 4,694 | 0.4% |
| British West Indian | 1 | 0.0% |
| Bulgarian | 470 | 0.0% |
| Burmese | 2,332 | 0.2% |
| Cajun | 20 | 0.0% |
| Cambodian | 2 | 0.0% |
| Canadian | 815 | 0.1% |
| Cape Verdean | 12 | 0.0% |
| Celtic | 50 | 0.0% |
| Central American | 2,915 | 0.3% |
| Central American Indian | 192 | 0.0% |
| Cherokee | 5,344 | 0.4% |
| Cheyenne | 91 | 0.0% |
| Chickasaw | 18 | 0.0% |
| Chilean | 58 | 0.0% |
| Chinese | 42 | 0.0% |
| Chippewa | 171 | 0.0% |
| Choctaw | 643 | 0.1% |
| Colombian | 307 | 0.0% |
| Comanche | 250 | 0.0% |
| Costa Rican | 180 | 0.0% |
| Creek | 306 | 0.0% |
| Croatian | 2,653 | 0.2% |
| Crow | 6 | 0.0% |
| Cuban | 765 | 0.1% |
| Czech | 3,465 | 0.3% |
| Czechoslovakian | 980 | 0.1% |
| Danish | 1,523 | 0.1% |
| Delaware | 6 | 0.0% |
| Dominican | 275 | 0.0% |
| Dutch | 11,635 | 1.0% |
| Dutch West Indian | 83 | 0.0% |
| Eastern European | 1,913 | 0.2% |
| Ecuadorian | 179 | 0.0% |
| Egyptian | 132 | 0.0% |
| English | 120,165 | 10.2% |
| Estonian | 10 | 0.0% |
| Ethiopian | 702 | 0.1% |
| European | 15,569 | 1.3% |
| Filipino | 25 | 0.0% |
| Finnish | 247 | 0.0% |
| French | 27,904 | 2.4% |
| French American Indian | 59 | 0.0% |
| French Canadian | 2,312 | 0.2% |
| German | 289,008 | 24.5% |
| German Russian | 16 | 0.0% |
| Ghanaian | 395 | 0.0% |
| Greek | 2,086 | 0.2% |
| Guamanian / Chamorro | 92 | 0.0% |
| Guatemalan | 1,190 | 0.1% |
| Guyanese | 71 | 0.0% |
| Haitian | 160 | 0.0% |
| Honduran | 801 | 0.1% |
| Hungarian | 2,748 | 0.2% |
| Icelander | 65 | 0.0% |
| Indian (Asian) | 3,572 | 0.3% |
| Indonesian | 94 | 0.0% |
| Inupiat | 13 | 0.0% |
| Iranian | 256 | 0.0% |
| Iraqi | 70 | 0.0% |
| Irish | 132,414 | 11.3% |
| Iroquois | 158 | 0.0% |
| Israeli | 111 | 0.0% |
| Italian | 38,069 | 3.2% |
| Jamaican | 825 | 0.1% |
| Japanese | 112 | 0.0% |
| Jordanian | 352 | 0.0% |
| Kenyan | 66 | 0.0% |
| Korean | 4,900 | 0.4% |
| Laotian | 275 | 0.0% |
| Latvian | 97 | 0.0% |
| Lebanese | 258 | 0.0% |
| Lithuanian | 2,684 | 0.2% |
| Lumbee | 10 | 0.0% |
| Luxembourger | 41 | 0.0% |
| Macedonian | 258 | 0.0% |
| Malaysian | 112 | 0.0% |
| Maltese | 25 | 0.0% |
| Menominee | 1 | 0.0% |
| Mexican | 26,040 | 2.2% |
| Mexican American Indian | 734 | 0.1% |
| Mongolian | 4 | 0.0% |
| Moroccan | 27 | 0.0% |
| Native Hawaiian | 557 | 0.1% |
| Navajo | 589 | 0.1% |
| New Zealander | 17 | 0.0% |
| Nicaraguan | 93 | 0.0% |
| Nigerian | 586 | 0.1% |
| Northern European | 1,538 | 0.1% |
| Norwegian | 5,716 | 0.5% |
| Ottawa | 65 | 0.0% |
| Pakistani | 465 | 0.0% |
| Palestinian | 125 | 0.0% |
| Panamanian | 158 | 0.0% |
| Paraguayan | 12 | 0.0% |
| Pennsylvania German | 482 | 0.0% |
| Peruvian | 291 | 0.0% |
| Pima | 13 | 0.0% |
| Polish | 26,738 | 2.3% |
| Portuguese | 979 | 0.1% |
| Potawatomi | 21 | 0.0% |
| Pueblo | 10 | 0.0% |
| Puerto Rican | 3,759 | 0.3% |
| Puget Sound Salish | 17 | 0.0% |
| Romanian | 421 | 0.0% |
| Russian | 2,533 | 0.2% |
| Salvadoran | 493 | 0.0% |
| Samoan | 190 | 0.0% |
| Scandinavian | 2,752 | 0.2% |
| Scotch-Irish | 11,266 | 1.0% |
| Scottish | 17,517 | 1.5% |
| Seminole | 29 | 0.0% |
| Serbian | 281 | 0.0% |
| Shoshone | 16 | 0.0% |
| Sioux | 634 | 0.1% |
| Slavic | 343 | 0.0% |
| Slovak | 1,358 | 0.1% |
| Slovene | 128 | 0.0% |
| South African | 84 | 0.0% |
| South American | 1,284 | 0.1% |
| South American Indian | 101 | 0.0% |
| Spaniard | 1,036 | 0.1% |
| Spanish | 753 | 0.1% |
| Spanish American Indian | 6 | 0.0% |
| Sri Lankan | 1,455 | 0.1% |
| Subsaharan African | 4,492 | 0.4% |
| Swedish | 7,533 | 0.6% |
| Swiss | 3,727 | 0.3% |
| Syrian | 192 | 0.0% |
| Taiwanese | 24 | 0.0% |
| Thai | 2,456 | 0.2% |
| Tlingit-Haida | 8 | 0.0% |
| Tongan | 1 | 0.0% |
| Trinidadian and Tobagonian | 83 | 0.0% |
| Turkish | 131 | 0.0% |
| U.S. Virgin Islander | 8 | 0.0% |
| Ugandan | 10 | 0.0% |
| Ukrainian | 821 | 0.1% |
| Uruguayan | 27 | 0.0% |
| Venezuelan | 203 | 0.0% |
| Vietnamese | 188 | 0.0% |
| Welsh | 6,320 | 0.5% |
| West Indian | 121 | 0.0% |
| Yaqui | 58 | 0.0% |
| Yugoslavian | 642 | 0.1% |
| Yup'ik | 12 | 0.0% | View All 170 Rows |
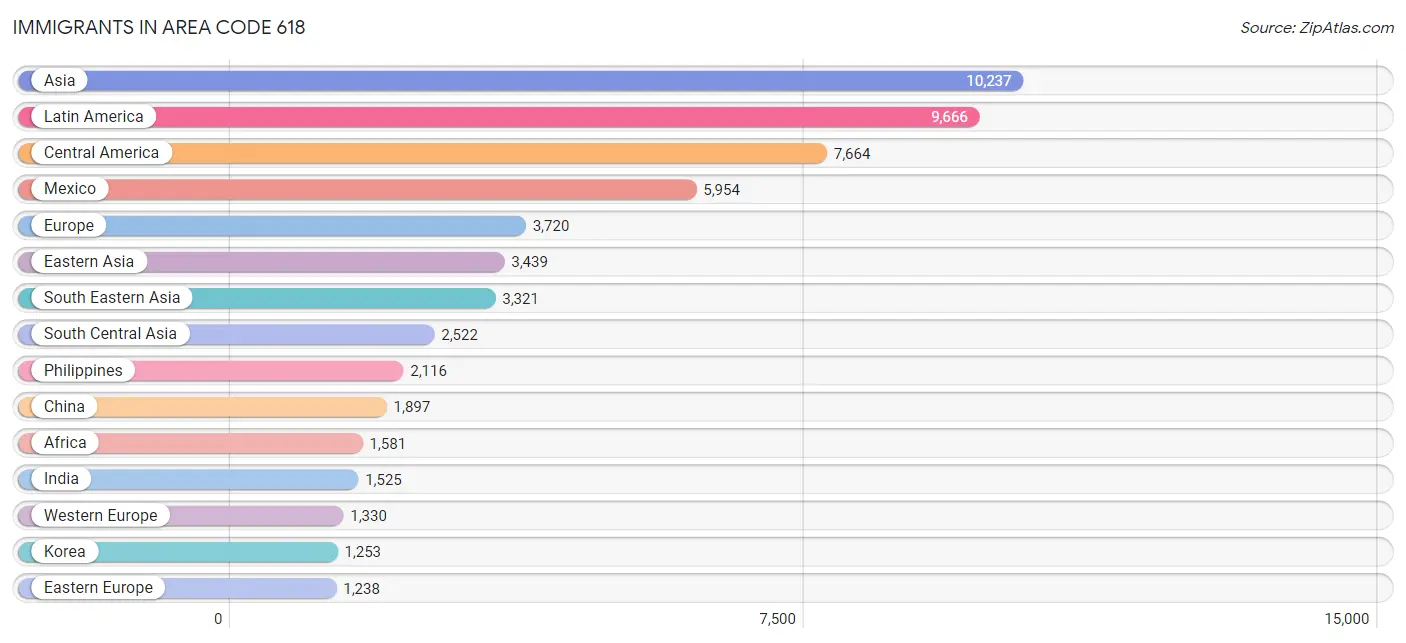
Immigrants in Area Code 618
The most numerous immigrant groups reported in Area Code 618 came from Asia (10,237 | 0.9%), Latin America (9,666 | 0.8%), Central America (7,664 | 0.6%), Mexico (5,954 | 0.5%), and Europe (3,720 | 0.3%), together accounting for 3.2% of all Area Code 618 residents.
| Immigration Origin | # Population | % Population |
| Africa | 1,581 | 0.1% |
| Albania | 31 | 0.0% |
| Argentina | 138 | 0.0% |
| Asia | 10,237 | 0.9% |
| Australia | 28 | 0.0% |
| Austria | 51 | 0.0% |
| Azores | 22 | 0.0% |
| Bahamas | 21 | 0.0% |
| Bangladesh | 122 | 0.0% |
| Barbados | 12 | 0.0% |
| Belgium | 37 | 0.0% |
| Belize | 19 | 0.0% |
| Bolivia | 7 | 0.0% |
| Bosnia and Herzegovina | 33 | 0.0% |
| Brazil | 133 | 0.0% |
| Bulgaria | 133 | 0.0% |
| Cambodia | 28 | 0.0% |
| Cameroon | 35 | 0.0% |
| Canada | 862 | 0.1% |
| Caribbean | 826 | 0.1% |
| Central America | 7,664 | 0.6% |
| Chile | 13 | 0.0% |
| China | 1,897 | 0.2% |
| Colombia | 297 | 0.0% |
| Congo | 5 | 0.0% |
| Costa Rica | 47 | 0.0% |
| Croatia | 5 | 0.0% |
| Cuba | 107 | 0.0% |
| Czechoslovakia | 27 | 0.0% |
| Dominican Republic | 132 | 0.0% |
| Eastern Africa | 526 | 0.0% |
| Eastern Asia | 3,439 | 0.3% |
| Eastern Europe | 1,238 | 0.1% |
| Ecuador | 130 | 0.0% |
| Egypt | 98 | 0.0% |
| El Salvador | 212 | 0.0% |
| England | 373 | 0.0% |
| Ethiopia | 286 | 0.0% |
| Europe | 3,720 | 0.3% |
| France | 116 | 0.0% |
| Germany | 964 | 0.1% |
| Ghana | 266 | 0.0% |
| Greece | 78 | 0.0% |
| Grenada | 7 | 0.0% |
| Guatemala | 695 | 0.1% |
| Guyana | 58 | 0.0% |
| Haiti | 46 | 0.0% |
| Honduras | 603 | 0.1% |
| Hong Kong | 33 | 0.0% |
| Hungary | 48 | 0.0% |
| India | 1,525 | 0.1% |
| Indonesia | 124 | 0.0% |
| Iran | 104 | 0.0% |
| Iraq | 130 | 0.0% |
| Ireland | 88 | 0.0% |
| Israel | 11 | 0.0% |
| Italy | 80 | 0.0% |
| Jamaica | 387 | 0.0% |
| Japan | 287 | 0.0% |
| Jordan | 221 | 0.0% |
| Kazakhstan | 8 | 0.0% |
| Kenya | 102 | 0.0% |
| Korea | 1,253 | 0.1% |
| Kuwait | 75 | 0.0% |
| Laos | 75 | 0.0% |
| Latin America | 9,666 | 0.8% |
| Latvia | 48 | 0.0% |
| Lebanon | 19 | 0.0% |
| Liberia | 2 | 0.0% |
| Lithuania | 35 | 0.0% |
| Malaysia | 8 | 0.0% |
| Mexico | 5,954 | 0.5% |
| Middle Africa | 49 | 0.0% |
| Morocco | 15 | 0.0% |
| Nepal | 389 | 0.0% |
| Netherlands | 152 | 0.0% |
| Nicaragua | 15 | 0.0% |
| Nigeria | 219 | 0.0% |
| North Macedonia | 75 | 0.0% |
| Northern Africa | 229 | 0.0% |
| Northern Europe | 869 | 0.1% |
| Oceania | 88 | 0.0% |
| Pakistan | 217 | 0.0% |
| Panama | 119 | 0.0% |
| Peru | 278 | 0.0% |
| Philippines | 2,116 | 0.2% |
| Poland | 252 | 0.0% |
| Portugal | 52 | 0.0% |
| Romania | 173 | 0.0% |
| Russia | 257 | 0.0% |
| Saudi Arabia | 121 | 0.0% |
| Scotland | 6 | 0.0% |
| Serbia | 15 | 0.0% |
| South Africa | 97 | 0.0% |
| South America | 1,176 | 0.1% |
| South Central Asia | 2,522 | 0.2% |
| South Eastern Asia | 3,321 | 0.3% |
| Southern Europe | 268 | 0.0% |
| Spain | 52 | 0.0% |
| Sri Lanka | 119 | 0.0% |
| Sweden | 21 | 0.0% |
| Switzerland | 10 | 0.0% |
| Syria | 64 | 0.0% |
| Taiwan | 145 | 0.0% |
| Thailand | 216 | 0.0% |
| Trinidad and Tobago | 87 | 0.0% |
| Turkey | 114 | 0.0% |
| Uganda | 24 | 0.0% |
| Ukraine | 78 | 0.0% |
| Venezuela | 110 | 0.0% |
| Vietnam | 639 | 0.1% |
| Western Africa | 499 | 0.0% |
| Western Asia | 909 | 0.1% |
| Western Europe | 1,330 | 0.1% |
| Yemen | 103 | 0.0% |
| Zaire | 8 | 0.0% |
| Zimbabwe | 34 | 0.0% | View All 117 Rows |
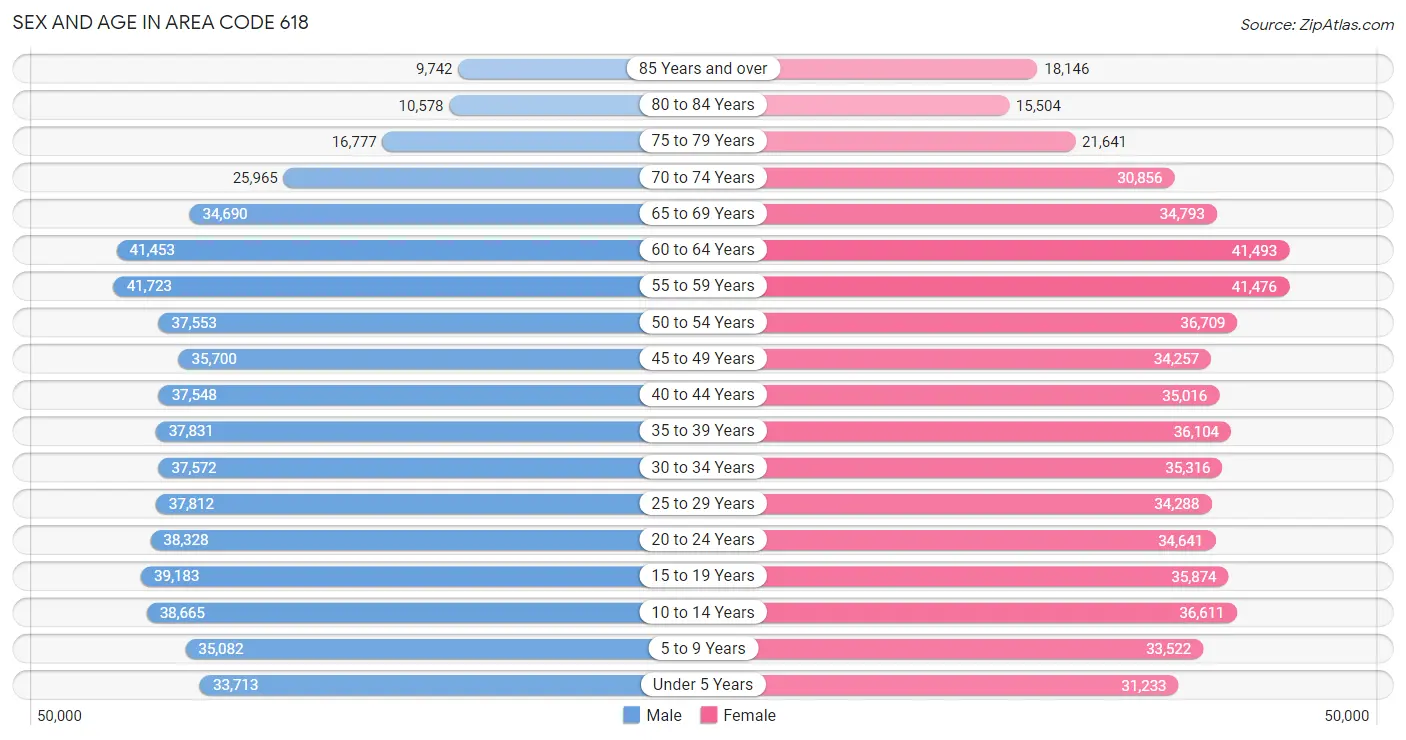
Sex and Age in Area Code 618
Sex and Age in Area Code 618
The most populous age groups in Area Code 618 are 55 to 59 Years (41,723 | 7.1%) for men and 60 to 64 Years (41,493 | 7.1%) for women.
| Age Bracket | Male | Female |
| Under 5 Years | 33,713 (5.7%) | 31,233 (5.3%) |
| 5 to 9 Years | 35,082 (5.9%) | 33,522 (5.7%) |
| 10 to 14 Years | 38,665 (6.6%) | 36,611 (6.2%) |
| 15 to 19 Years | 39,183 (6.6%) | 35,874 (6.1%) |
| 20 to 24 Years | 38,328 (6.5%) | 34,641 (5.9%) |
| 25 to 29 Years | 37,812 (6.4%) | 34,288 (5.8%) |
| 30 to 34 Years | 37,572 (6.4%) | 35,316 (6.0%) |
| 35 to 39 Years | 37,831 (6.4%) | 36,104 (6.1%) |
| 40 to 44 Years | 37,548 (6.4%) | 35,016 (6.0%) |
| 45 to 49 Years | 35,700 (6.0%) | 34,257 (5.8%) |
| 50 to 54 Years | 37,553 (6.4%) | 36,709 (6.2%) |
| 55 to 59 Years | 41,723 (7.1%) | 41,476 (7.1%) |
| 60 to 64 Years | 41,453 (7.0%) | 41,493 (7.1%) |
| 65 to 69 Years | 34,690 (5.9%) | 34,793 (5.9%) |
| 70 to 74 Years | 25,965 (4.4%) | 30,856 (5.2%) |
| 75 to 79 Years | 16,777 (2.8%) | 21,641 (3.7%) |
| 80 to 84 Years | 10,578 (1.8%) | 15,504 (2.6%) |
| 85 Years and over | 9,742 (1.7%) | 18,146 (3.1%) |
| Total | 589,915 (100.0%) | 587,480 (100.0%) |
Families and Households in Area Code 618
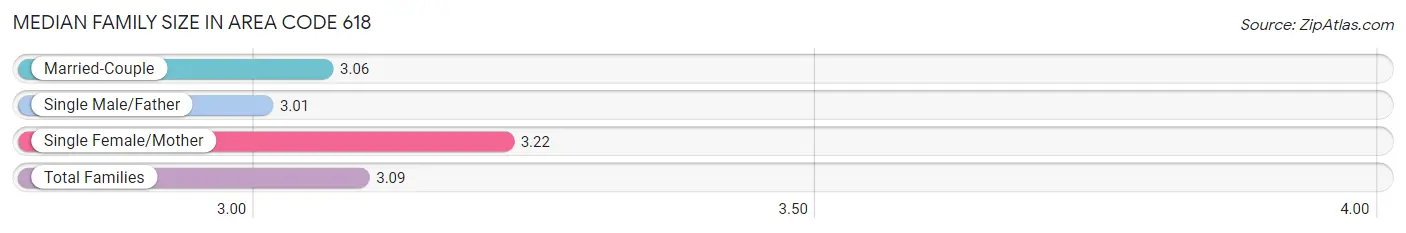
Median Family Size in Area Code 618
The median family size in Area Code 618 is 3.09 persons per family, with single female/mother families (54,449 | 18.2%) accounting for the largest median family size of 3.22132 persons per family. On the other hand, single male/father families (22,472 | 7.5%) represent the smallest median family size with 3.01 persons per family.
| Family Type | # Families | Family Size |
| Married-Couple | 222,579 (74.3%) | 3.06 |
| Single Male/Father | 22,472 (7.5%) | 3.01 |
| Single Female/Mother | 54,449 (18.2%) | 3.22 |
| Total Families | 299,500 (100.0%) | 3.09 |
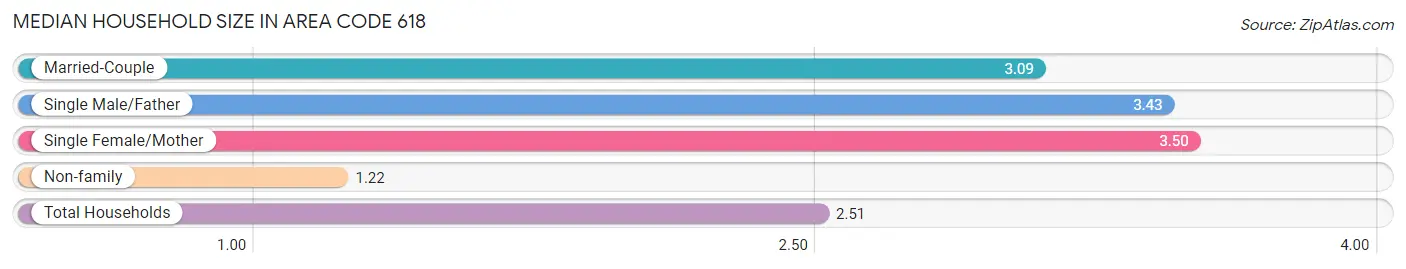
Median Household Size in Area Code 618
The median household size in Area Code 618 is 2.51 persons per household, with single female/mother households (54,449 | 11.5%) accounting for the largest median household size of 3.50132 persons per household. non-family households (172,141 | 36.5%) represent the smallest median household size with 1.22 persons per household.
| Household Type | # Households | Household Size |
| Married-Couple | 222,579 (47.2%) | 3.09 |
| Single Male/Father | 22,472 (4.8%) | 3.43 |
| Single Female/Mother | 54,449 (11.5%) | 3.50 |
| Non-family | 172,141 (36.5%) | 1.22 |
| Total Households | 471,641 (100.0%) | 2.51 |
Household Size by Marriage Status in Area Code 618
Out of a total of 471,641 households in Area Code 618, 299,500 (63.5%) are family households, while 172,141 (36.5%) are nonfamily households. The most numerous type of family households are 2-person households, comprising 142,858, and the most common type of nonfamily households are 1-person households, comprising 146,231.
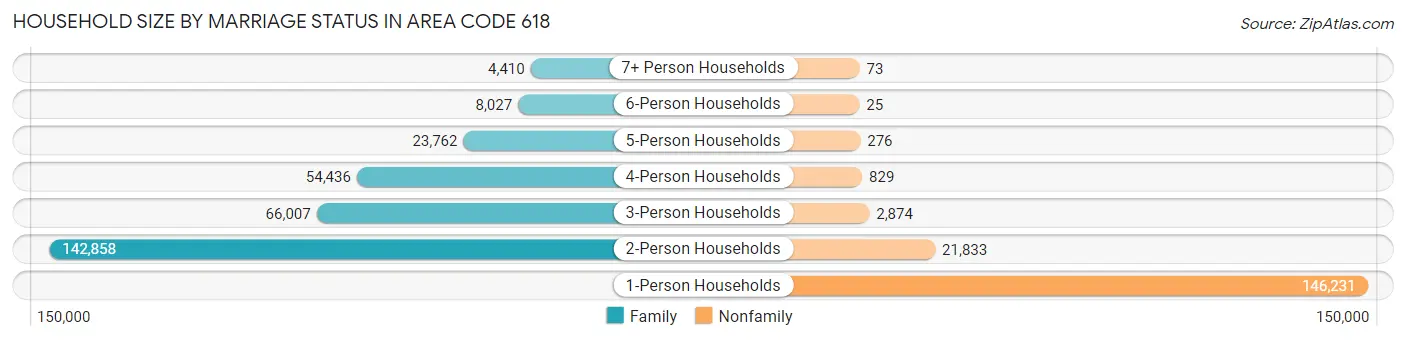
| Household Size | Family Households | Nonfamily Households |
| 1-Person Households | - | 146,231 (31.0%) |
| 2-Person Households | 142,858 (30.3%) | 21,833 (4.6%) |
| 3-Person Households | 66,007 (14.0%) | 2,874 (0.6%) |
| 4-Person Households | 54,436 (11.5%) | 829 (0.2%) |
| 5-Person Households | 23,762 (5.0%) | 276 (0.1%) |
| 6-Person Households | 8,027 (1.7%) | 25 (0.0%) |
| 7+ Person Households | 4,410 (0.9%) | 73 (0.0%) |
| Total | 299,500 (63.5%) | 172,141 (36.5%) |
Female Fertility in Area Code 618
Fertility by Age in Area Code 618
Average fertility rate in Area Code 618 is 71.7 births per 1,000 women. Women in the age bracket of 20 to 34 years have the highest fertility rate with 144.4 births per 1,000 women. Women in the age bracket of 20 to 34 years acount for 75.2% of all women with births.
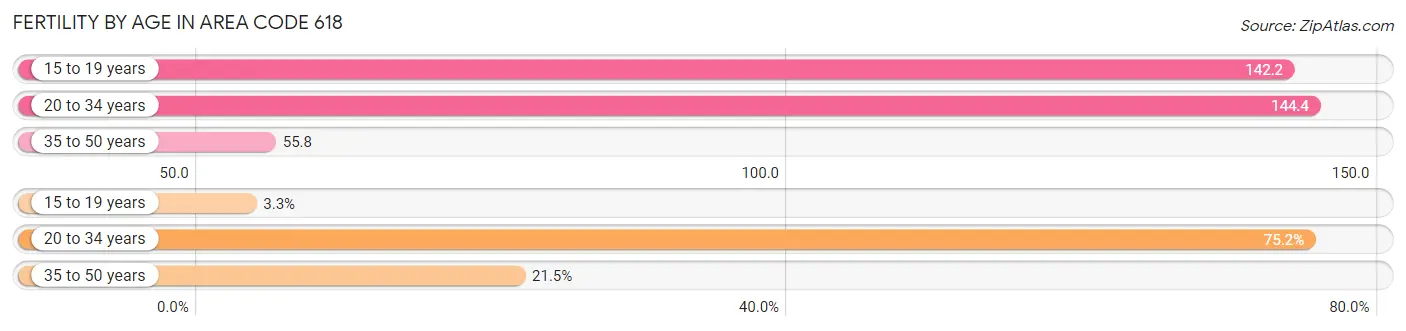
| Age Bracket | Women with Births | Births / 1,000 Women |
| 15 to 19 years | 472 (3.3%) | 142.2 |
| 20 to 34 years | 10,817 (75.2%) | 144.4 |
| 35 to 50 years | 3,096 (21.5%) | 55.8 |
| Total | 14,385 (100.0%) | 71.7 |
Fertility by Age by Marriage Status in Area Code 618
49.4% of women with births (14,385) in Area Code 618 are married. The highest percentage of unmarried women with births falls into 15 to 19 years age bracket with 98.3% of them unmarried at the time of birth, while the lowest percentage of unmarried women with births belong to 20 to 34 years age bracket with 52.6% of them unmarried.
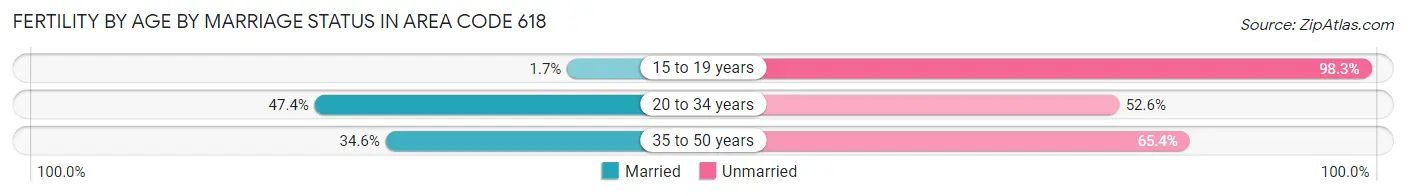
| Age Bracket | Married | Unmarried |
| 15 to 19 years | 8 (1.7%) | 464 (98.3%) |
| 20 to 34 years | 5,132 (47.4%) | 5,685 (52.6%) |
| 35 to 50 years | 1,071 (34.6%) | 2,025 (65.4%) |
| Total | 7,105 (49.4%) | 7,280 (50.6%) |
Fertility by Education in Area Code 618
Average fertility rate in Area Code 618 is 71.7 births per 1,000 women. Women with the education attainment of graduate degree have the highest fertility rate of 206.5 births per 1,000 women, while women with the education attainment of college or associate's degree have the lowest fertility at 92.8 births per 1,000 women. Women with the education attainment of college or associate's degree represent 31.9% of all women with births.
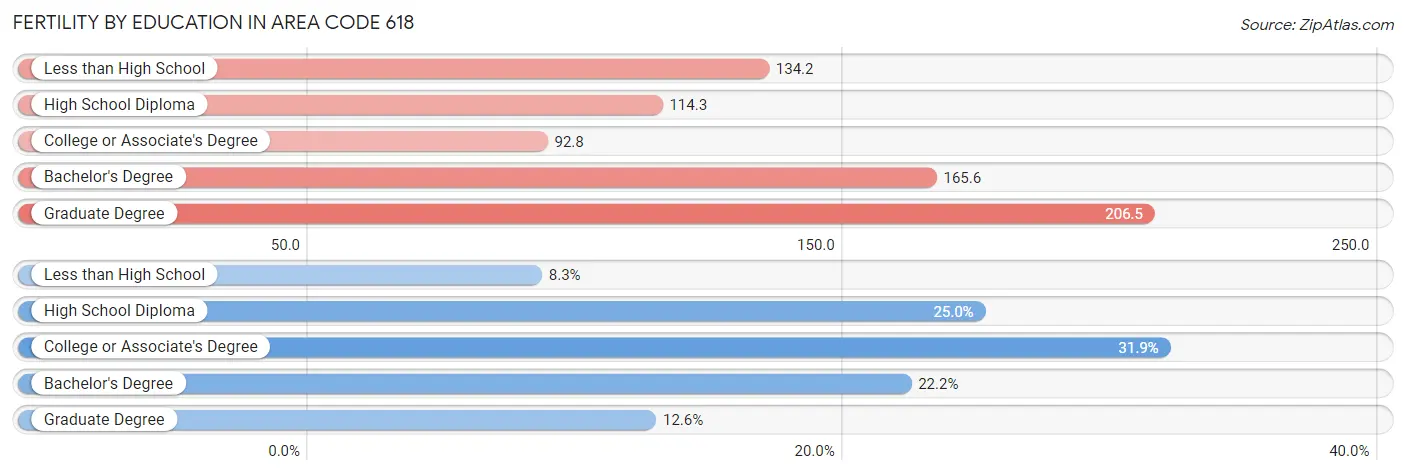
| Educational Attainment | Women with Births | Births / 1,000 Women |
| Less than High School | 1,200 (8.3%) | 134.2 |
| High School Diploma | 3,591 (25.0%) | 114.3 |
| College or Associate's Degree | 4,587 (31.9%) | 92.8 |
| Bachelor's Degree | 3,191 (22.2%) | 165.6 |
| Graduate Degree | 1,816 (12.6%) | 206.5 |
| Total | 14,385 (100.0%) | 71.7 |
Fertility by Education by Marriage Status in Area Code 618
50.6% of women with births in Area Code 618 are unmarried. Women with the educational attainment of graduate degree are most likely to be married with 58.1% of them married at childbirth, while women with the educational attainment of less than high school are least likely to be married with 94.7% of them unmarried at childbirth.
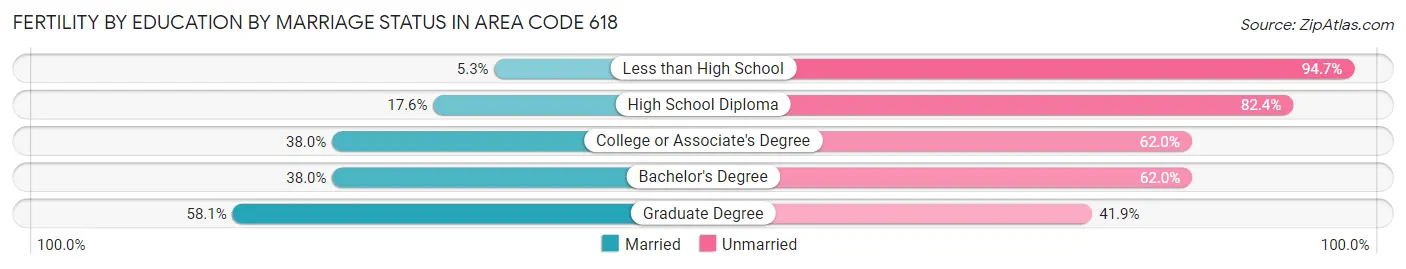
| Educational Attainment | Married | Unmarried |
| Less than High School | 64 (5.3%) | 1,136 (94.7%) |
| High School Diploma | 633 (17.6%) | 2,958 (82.4%) |
| College or Associate's Degree | 1,745 (38.0%) | 2,842 (62.0%) |
| Bachelor's Degree | 1,212 (38.0%) | 1,979 (62.0%) |
| Graduate Degree | 1,055 (58.1%) | 761 (41.9%) |
| Total | 7,105 (49.4%) | 7,280 (50.6%) |
Employment Characteristics in Area Code 618
Employment by Class of Employer in Area Code 618
Among the 530,975 employed individuals in Area Code 618, private company employees (355,452 | 66.9%), not-for-profit organizations (47,124 | 8.9%), and local government employees (37,618 | 7.1%) make up the most common classes of employment.
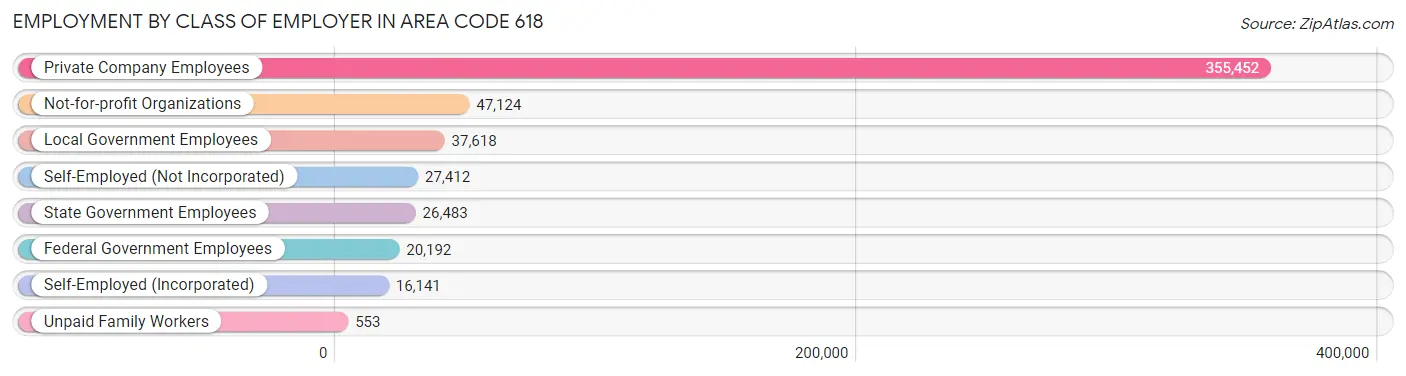
| Employer Class | # Employees | % Employees |
| Private Company Employees | 355,452 | 66.9% |
| Self-Employed (Incorporated) | 16,141 | 3.0% |
| Self-Employed (Not Incorporated) | 27,412 | 5.2% |
| Not-for-profit Organizations | 47,124 | 8.9% |
| Local Government Employees | 37,618 | 7.1% |
| State Government Employees | 26,483 | 5.0% |
| Federal Government Employees | 20,192 | 3.8% |
| Unpaid Family Workers | 553 | 0.1% |
| Total | 530,975 | 100.0% |
Employment Status by Age in Area Code 618
According to the labor force statistics for Area Code 618, out of the total population over 16 years of age (953,854), 57.4% or 547,798 individuals are in the labor force, with 6.4% or 34,895 of them unemployed. The age group with the highest labor force participation rate is 30 to 34 years, with 82.5% or 60,154 individuals in the labor force. Within the labor force, the 16 to 19 years age range has the highest percentage of unemployed individuals, with 3,498.3% or 1,040,080 of them being unemployed.
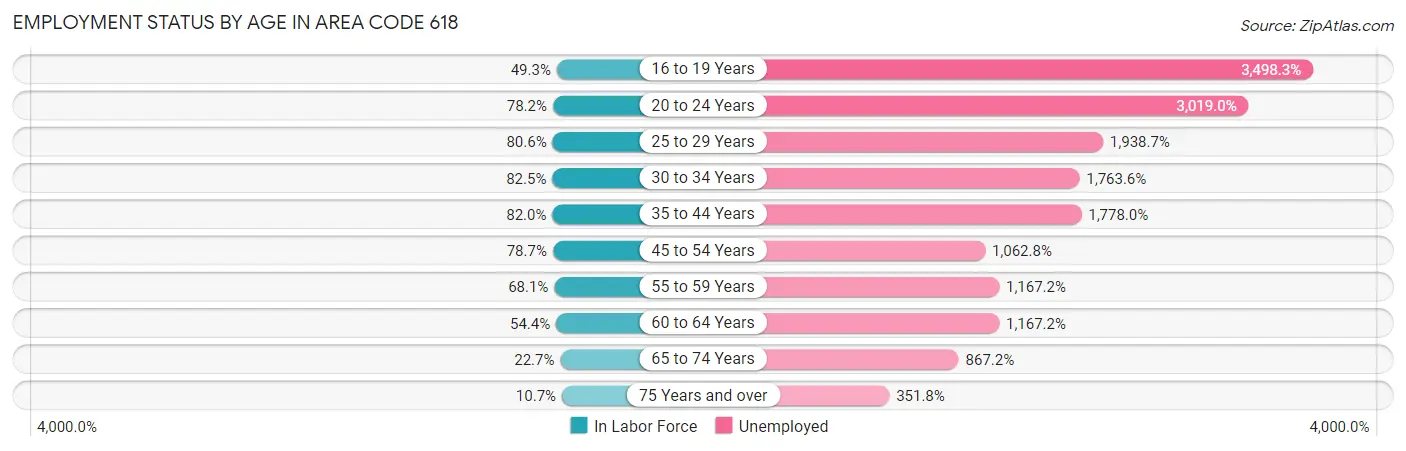
| Age Bracket | In Labor Force | Unemployed |
| 16 to 19 Years | 29,729 (49.3%) | 1,040,080 (3,498.3%) |
| 20 to 24 Years | 57,032 (78.2%) | 1,721,826 (3,019.0%) |
| 25 to 29 Years | 58,120 (80.6%) | 1,126,772 (1,938.7%) |
| 30 to 34 Years | 60,155 (82.5%) | 1,060,876 (1,763.6%) |
| 35 to 44 Years | 120,065 (82.0%) | 2,134,862 (1,778.0%) |
| 45 to 54 Years | 113,531 (78.7%) | 1,206,586 (1,062.8%) |
| 55 to 59 Years | 56,690 (68.1%) | 661,709 (1,167.2%) |
| 60 to 64 Years | 45,131 (54.4%) | 526,769 (1,167.2%) |
| 65 to 74 Years | 28,632 (22.7%) | 248,305 (867.2%) |
| 75 Years and over | 9,882 (10.7%) | 34,779 (351.8%) |
| Total | 547,790 (57.4%) | 34,880 (6.4%) |
Employment Status by Educational Attainment in Area Code 618
According to labor force statistics for Area Code 618, 74.1% of individuals (445,911) out of the total population between 25 and 64 years of age (601,851) are in the labor force, with 1,529.4% or 6,819,763 of them being unemployed. The group with the highest labor force participation rate are those with the educational attainment of bachelor's degree or higher, with 87.2% or 138,629 individuals in the labor force. Within the labor force, individuals with less than high school education have the highest percentage of unemployment, with 3,113.2% or 813,853 of them being unemployed.
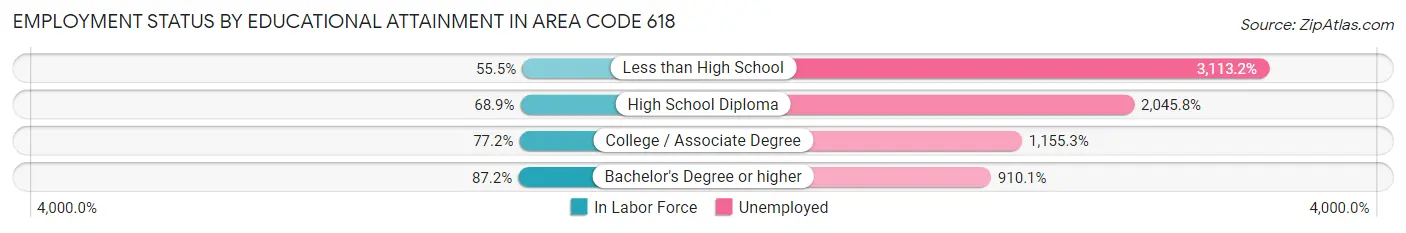
| Educational Attainment | In Labor Force | Unemployed |
| Less than High School | 26,140 (55.5%) | 1,466,130 (3,113.2%) |
| High School Diploma | 116,120 (68.9%) | 3,447,603 (2,045.8%) |
| College / Associate Degree | 175,511 (77.2%) | 2,626,136 (1,155.3%) |
| Bachelor's Degree or higher | 138,630 (87.2%) | 1,446,367 (910.1%) |
| Total | 445,899 (74.1%) | 9,204,709 (1,529.4%) |
Employment Occupations by Sex in Area Code 618
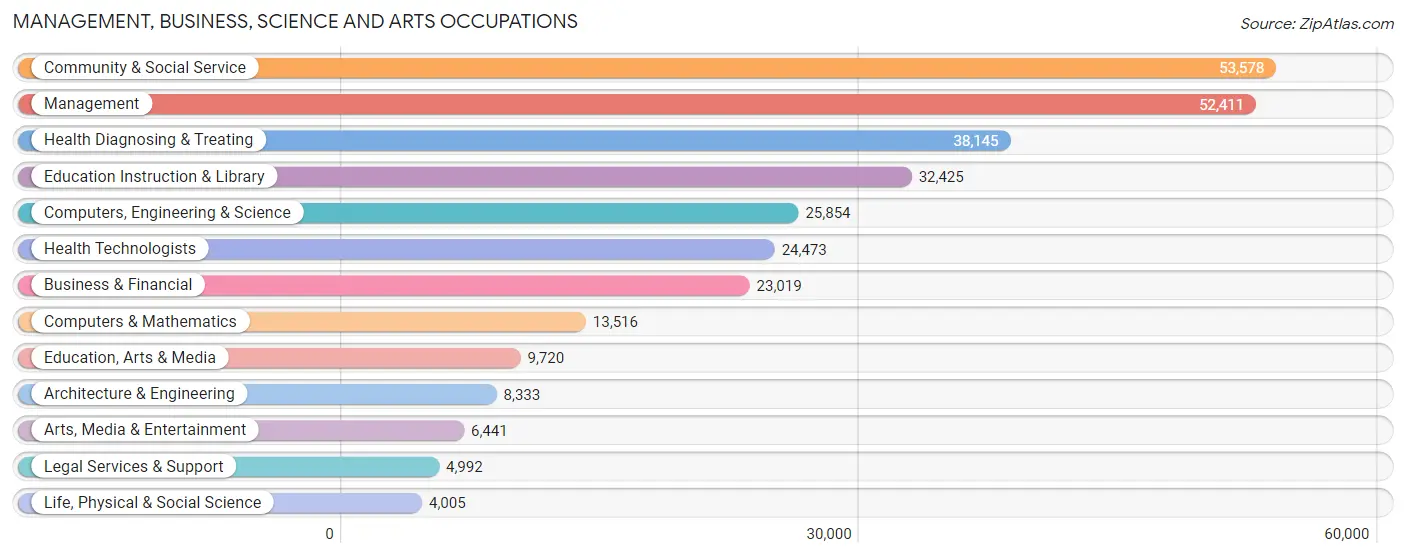
Management, Business, Science and Arts Occupations
The most common Management, Business, Science and Arts occupations in Area Code 618 are Community & Social Service (53,578 | 10.0%), Management (52,411 | 9.7%), Health Diagnosing & Treating (38,145 | 7.1%), Education Instruction & Library (32,425 | 6.0%), and Computers, Engineering & Science (25,854 | 4.8%).
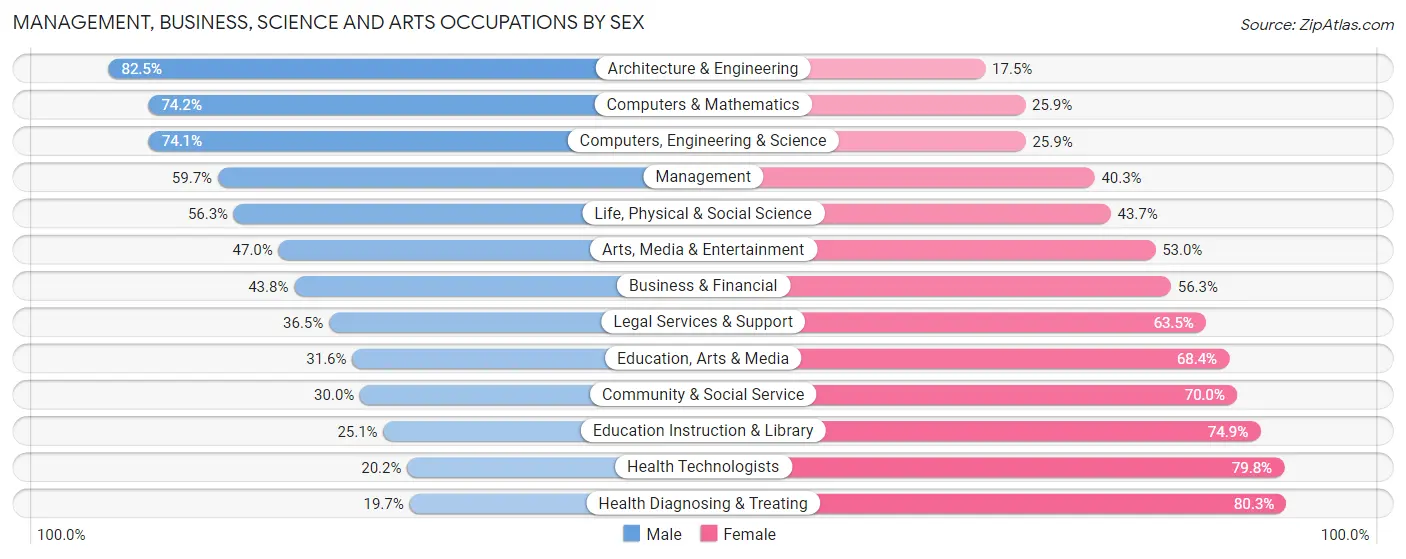
Management, Business, Science and Arts Occupations by Sex
Within the Management, Business, Science and Arts occupations in Area Code 618, the most male-oriented occupations are Architecture & Engineering (82.5%), Computers & Mathematics (74.2%), and Computers, Engineering & Science (74.1%), while the most female-oriented occupations are Health Diagnosing & Treating (80.3%), Health Technologists (79.8%), and Education Instruction & Library (74.9%).
| Occupation | Male | Female |
| Management | 31,280 (59.7%) | 21,131 (40.3%) |
| Business & Financial | 10,070 (43.8%) | 12,949 (56.2%) |
| Computers, Engineering & Science | 19,151 (74.1%) | 6,703 (25.9%) |
| Computers & Mathematics | 10,022 (74.2%) | 3,494 (25.9%) |
| Architecture & Engineering | 6,873 (82.5%) | 1,460 (17.5%) |
| Life, Physical & Social Science | 2,256 (56.3%) | 1,749 (43.7%) |
| Community & Social Service | 16,075 (30.0%) | 37,503 (70.0%) |
| Education, Arts & Media | 3,074 (31.6%) | 6,646 (68.4%) |
| Legal Services & Support | 1,821 (36.5%) | 3,171 (63.5%) |
| Education Instruction & Library | 8,152 (25.1%) | 24,273 (74.9%) |
| Arts, Media & Entertainment | 3,028 (47.0%) | 3,413 (53.0%) |
| Health Diagnosing & Treating | 7,514 (19.7%) | 30,631 (80.3%) |
| Health Technologists | 4,934 (20.2%) | 19,539 (79.8%) |
| Total (Category) | 84,090 (43.6%) | 108,917 (56.4%) |
| Total (Overall) | 279,014 (51.9%) | 258,913 (48.1%) |
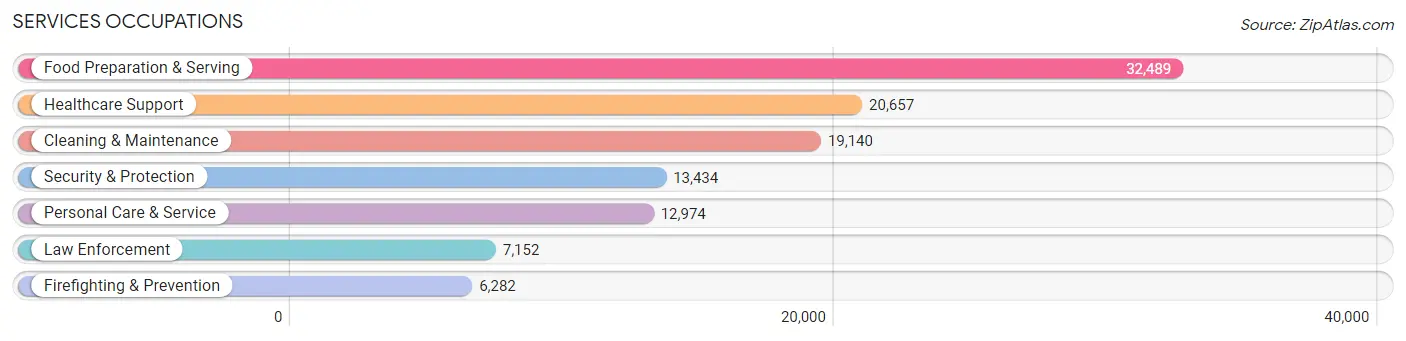
Services Occupations
The most common Services occupations in Area Code 618 are Food Preparation & Serving (32,489 | 6.0%), Healthcare Support (20,657 | 3.8%), Cleaning & Maintenance (19,140 | 3.6%), Security & Protection (13,434 | 2.5%), and Personal Care & Service (12,974 | 2.4%).
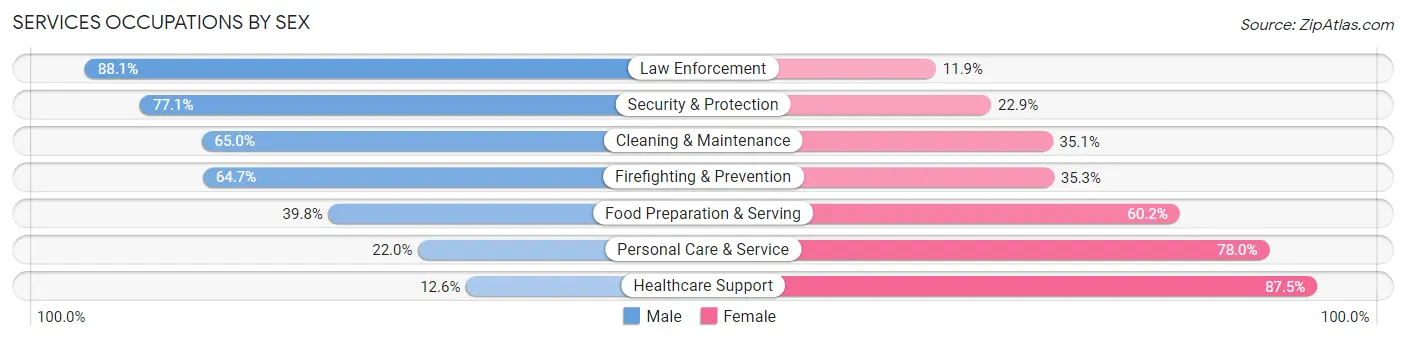
Services Occupations by Sex
Within the Services occupations in Area Code 618, the most male-oriented occupations are Law Enforcement (88.1%), Security & Protection (77.1%), and Cleaning & Maintenance (64.9%), while the most female-oriented occupations are Healthcare Support (87.5%), Personal Care & Service (78.0%), and Food Preparation & Serving (60.2%).
| Occupation | Male | Female |
| Healthcare Support | 2,592 (12.6%) | 18,065 (87.5%) |
| Security & Protection | 10,362 (77.1%) | 3,072 (22.9%) |
| Firefighting & Prevention | 4,064 (64.7%) | 2,218 (35.3%) |
| Law Enforcement | 6,298 (88.1%) | 854 (11.9%) |
| Food Preparation & Serving | 12,926 (39.8%) | 19,563 (60.2%) |
| Cleaning & Maintenance | 12,432 (64.9%) | 6,708 (35.0%) |
| Personal Care & Service | 2,859 (22.0%) | 10,115 (78.0%) |
| Total (Category) | 41,171 (41.7%) | 57,523 (58.3%) |
| Total (Overall) | 279,014 (51.9%) | 258,913 (48.1%) |
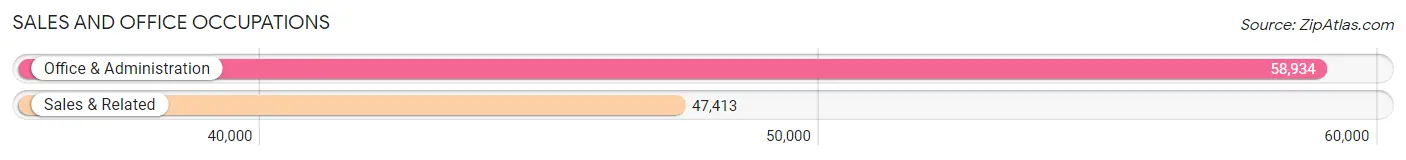
Sales and Office Occupations
The most common Sales and Office occupations in Area Code 618 are Office & Administration (58,934 | 11.0%), and Sales & Related (47,413 | 8.8%).
Sales and Office Occupations by Sex
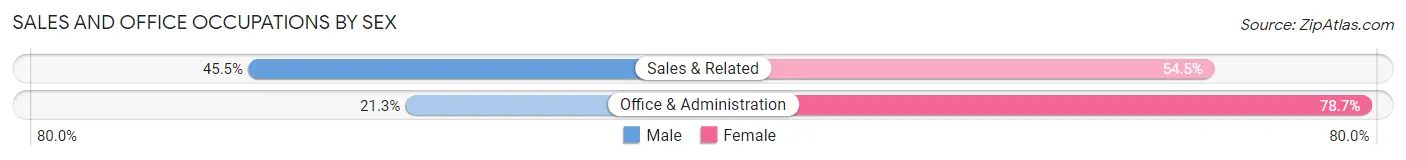
| Occupation | Male | Female |
| Sales & Related | 21,571 (45.5%) | 25,842 (54.5%) |
| Office & Administration | 12,559 (21.3%) | 46,375 (78.7%) |
| Total (Category) | 34,130 (32.1%) | 72,217 (67.9%) |
| Total (Overall) | 279,014 (51.9%) | 258,913 (48.1%) |
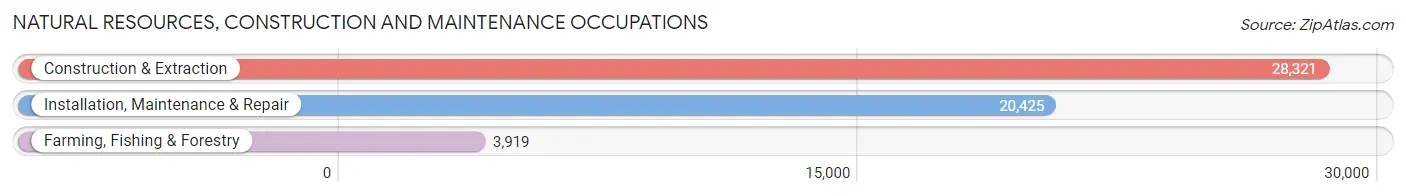
Natural Resources, Construction and Maintenance Occupations
The most common Natural Resources, Construction and Maintenance occupations in Area Code 618 are Construction & Extraction (28,321 | 5.3%), Installation, Maintenance & Repair (20,425 | 3.8%), and Farming, Fishing & Forestry (3,919 | 0.7%).
Natural Resources, Construction and Maintenance Occupations by Sex
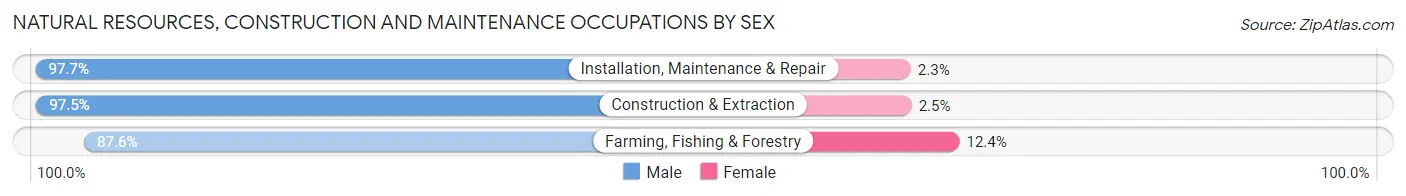
| Occupation | Male | Female |
| Farming, Fishing & Forestry | 3,433 (87.6%) | 486 (12.4%) |
| Construction & Extraction | 27,624 (97.5%) | 697 (2.5%) |
| Installation, Maintenance & Repair | 19,960 (97.7%) | 465 (2.3%) |
| Total (Category) | 51,017 (96.9%) | 1,648 (3.1%) |
| Total (Overall) | 279,014 (51.9%) | 258,913 (48.1%) |
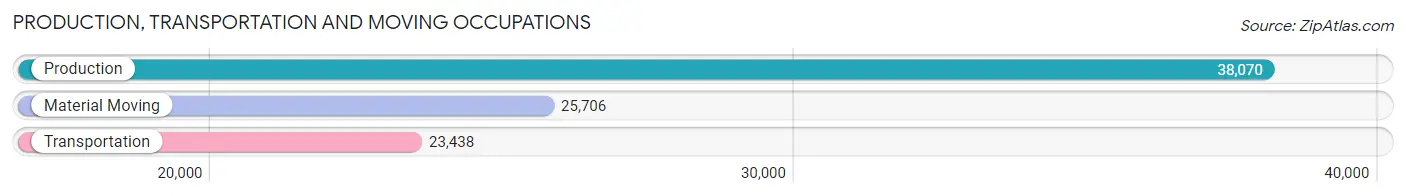
Production, Transportation and Moving Occupations
The most common Production, Transportation and Moving occupations in Area Code 618 are Production (38,070 | 7.1%), Material Moving (25,706 | 4.8%), and Transportation (23,438 | 4.4%).
Production, Transportation and Moving Occupations by Sex
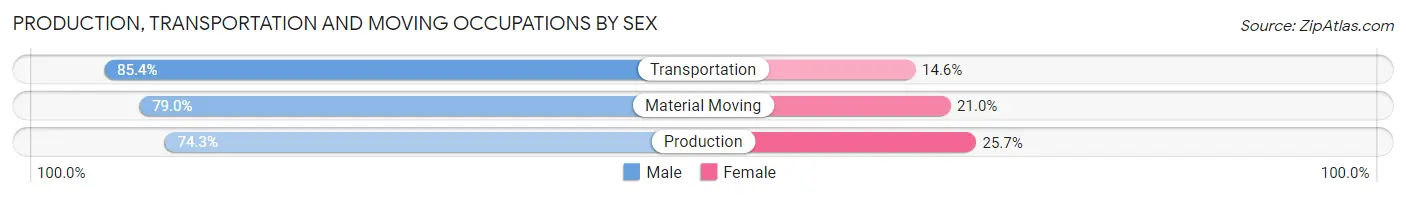
| Occupation | Male | Female |
| Production | 28,288 (74.3%) | 9,782 (25.7%) |
| Transportation | 20,017 (85.4%) | 3,421 (14.6%) |
| Material Moving | 20,301 (79.0%) | 5,405 (21.0%) |
| Total (Category) | 68,606 (78.7%) | 18,608 (21.3%) |
| Total (Overall) | 279,014 (51.9%) | 258,913 (48.1%) |
Employment Industries by Sex in Area Code 618
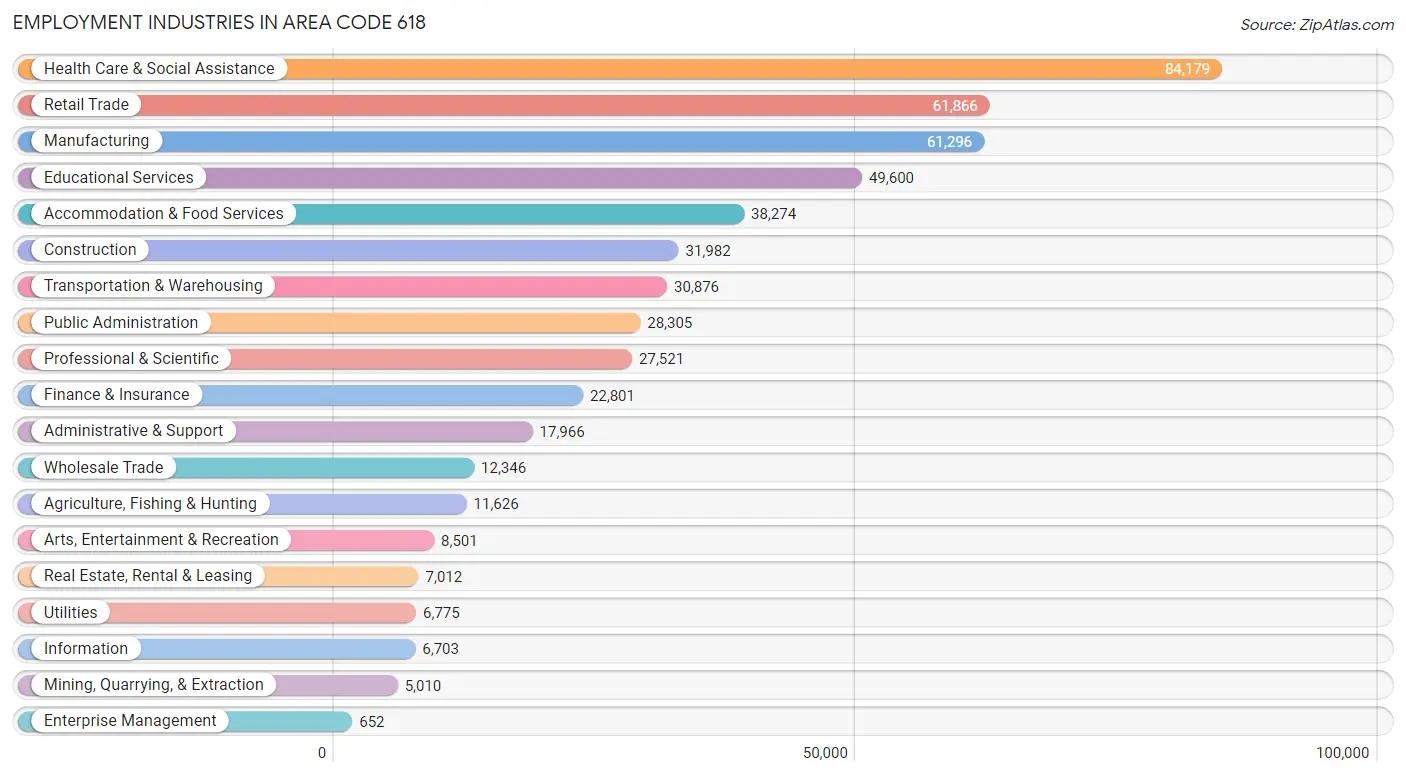
Employment Industries in Area Code 618
The major employment industries in Area Code 618 include Health Care & Social Assistance (84,179 | 15.7%), Retail Trade (61,866 | 11.5%), Manufacturing (61,296 | 11.4%), Educational Services (49,600 | 9.2%), and Accommodation & Food Services (38,274 | 7.1%).
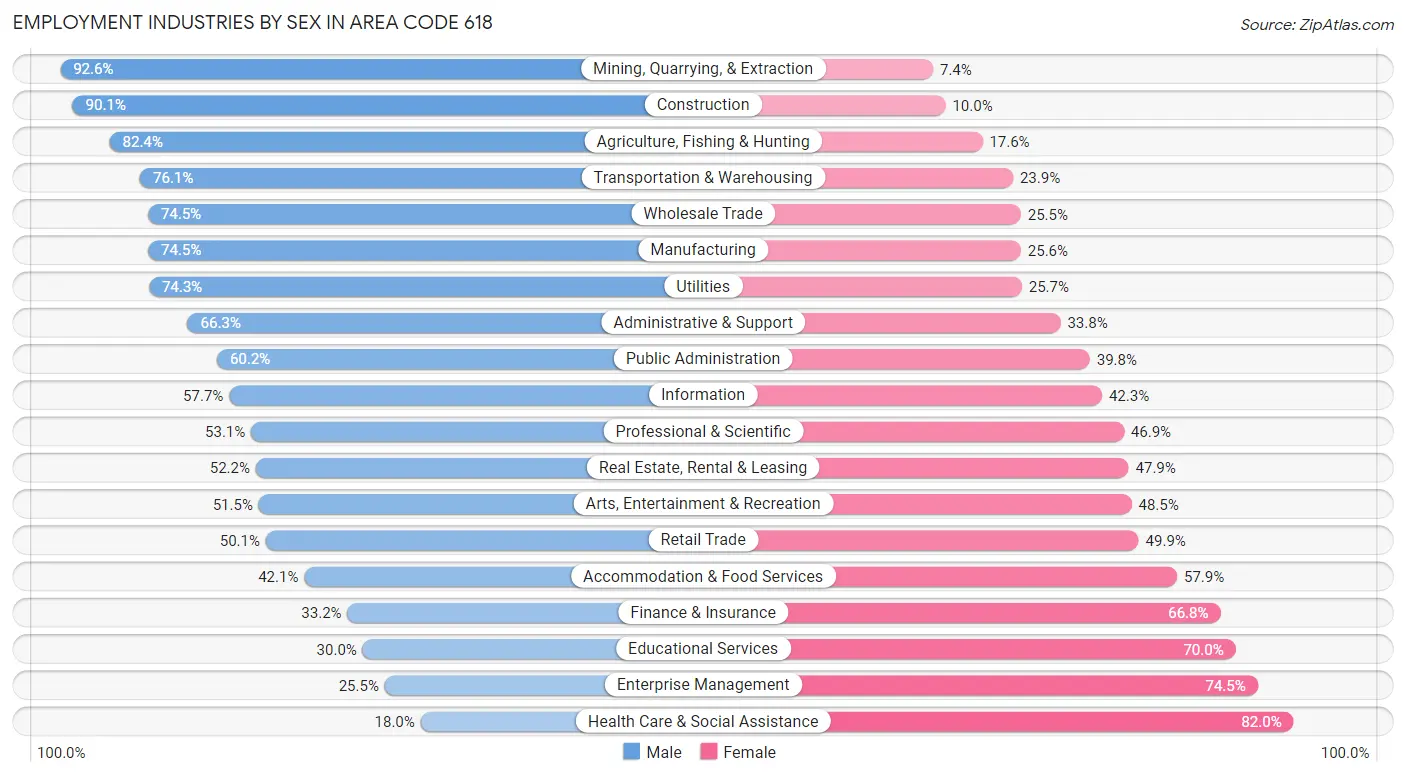
Employment Industries by Sex in Area Code 618
The Area Code 618 industries that see more men than women are Mining, Quarrying, & Extraction (92.6%), Construction (90.0%), and Agriculture, Fishing & Hunting (82.4%), whereas the industries that tend to have a higher number of women are Health Care & Social Assistance (82.0%), Enterprise Management (74.5%), and Educational Services (70.0%).
| Industry | Male | Female |
| Agriculture, Fishing & Hunting | 9,580 (82.4%) | 2,046 (17.6%) |
| Mining, Quarrying, & Extraction | 4,641 (92.6%) | 369 (7.4%) |
| Construction | 28,801 (90.0%) | 3,181 (10.0%) |
| Manufacturing | 45,635 (74.5%) | 15,661 (25.6%) |
| Wholesale Trade | 9,193 (74.5%) | 3,153 (25.5%) |
| Retail Trade | 30,977 (50.1%) | 30,889 (49.9%) |
| Transportation & Warehousing | 23,492 (76.1%) | 7,384 (23.9%) |
| Utilities | 5,031 (74.3%) | 1,744 (25.7%) |
| Information | 3,865 (57.7%) | 2,838 (42.3%) |
| Finance & Insurance | 7,565 (33.2%) | 15,236 (66.8%) |
| Real Estate, Rental & Leasing | 3,657 (52.1%) | 3,355 (47.8%) |
| Professional & Scientific | 14,619 (53.1%) | 12,902 (46.9%) |
| Enterprise Management | 166 (25.5%) | 486 (74.5%) |
| Administrative & Support | 11,902 (66.2%) | 6,064 (33.8%) |
| Educational Services | 14,893 (30.0%) | 34,707 (70.0%) |
| Health Care & Social Assistance | 15,174 (18.0%) | 69,005 (82.0%) |
| Arts, Entertainment & Recreation | 4,381 (51.5%) | 4,120 (48.5%) |
| Accommodation & Food Services | 16,121 (42.1%) | 22,153 (57.9%) |
| Public Administration | 17,034 (60.2%) | 11,271 (39.8%) |
| Total | 279,014 (51.9%) | 258,913 (48.1%) |
Education in Area Code 618
School Enrollment in Area Code 618
The most common levels of schooling among the 273,437 students in Area Code 618 are middle school (59,569 | 21.8%), high school (58,898 | 21.5%), and college / undergraduate (55,072 | 20.1%).
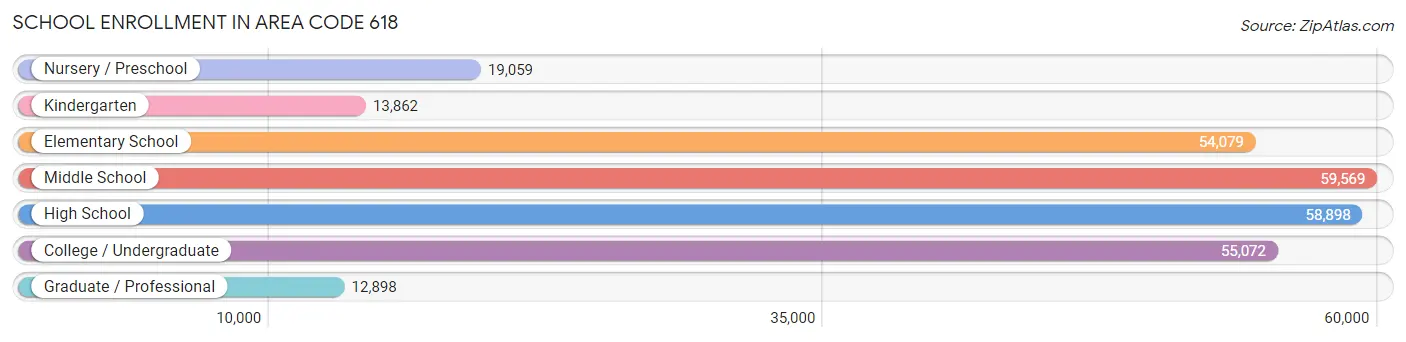
| School Level | # Students | % Students |
| Nursery / Preschool | 19,059 | 7.0% |
| Kindergarten | 13,862 | 5.1% |
| Elementary School | 54,079 | 19.8% |
| Middle School | 59,569 | 21.8% |
| High School | 58,898 | 21.5% |
| College / Undergraduate | 55,072 | 20.1% |
| Graduate / Professional | 12,898 | 4.7% |
| Total | 273,437 | 100.0% |
School Enrollment by Age by Funding Source in Area Code 618
Out of a total of 273,437 students who are enrolled in schools in Area Code 618, 40,482 (14.8%) attend a private institution, while the remaining 232,955 (85.2%) are enrolled in public schools. The age group of 3 to 4 year olds has the highest likelihood of being enrolled in private schools, with 4,342 (29.7% in the age bracket) enrolled. Conversely, the age group of 15 to 17 year olds has the lowest likelihood of being enrolled in a private school, with 39,404 (91.3% in the age bracket) attending a public institution.
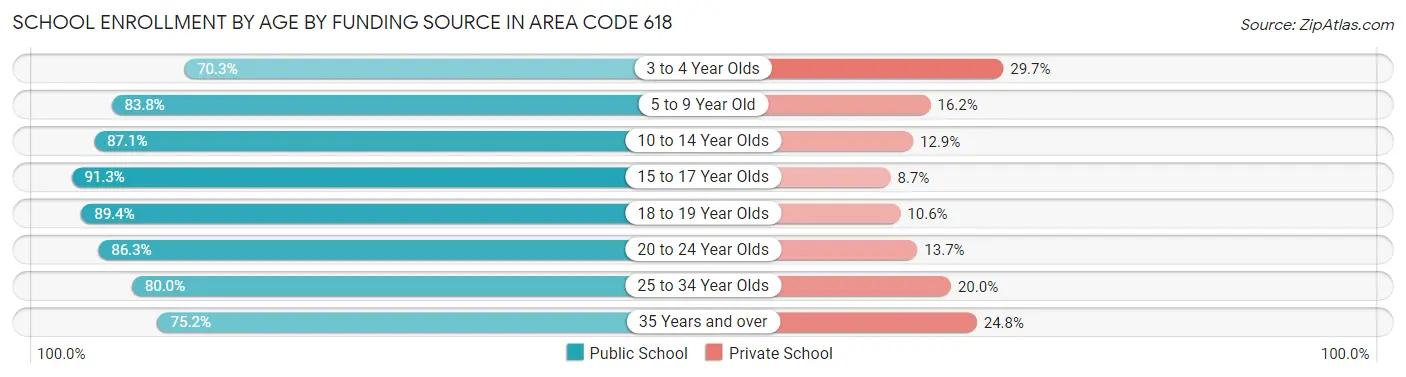
| Age Bracket | Public School | Private School |
| 3 to 4 Year Olds | 10,258 (70.3%) | 4,342 (29.7%) |
| 5 to 9 Year Old | 54,792 (83.8%) | 10,573 (16.2%) |
| 10 to 14 Year Olds | 63,868 (87.1%) | 9,481 (12.9%) |
| 15 to 17 Year Olds | 39,404 (91.3%) | 3,767 (8.7%) |
| 18 to 19 Year Olds | 18,989 (89.4%) | 2,244 (10.6%) |
| 20 to 24 Year Olds | 23,853 (86.3%) | 3,797 (13.7%) |
| 25 to 34 Year Olds | 11,499 (80.0%) | 2,873 (20.0%) |
| 35 Years and over | 10,302 (75.2%) | 3,395 (24.8%) |
| Total | 232,955 (85.2%) | 40,482 (14.8%) |
Educational Attainment by Field of Study in Area Code 618
Business (42,691 | 19.4%), education (40,853 | 18.6%), science & technology (27,100 | 12.3%), arts & humanities (16,606 | 7.6%), and bio, nature & agricultural (14,536 | 6.6%) are the most common fields of study among 219,573 individuals in Area Code 618 who have obtained a bachelor's degree or higher.
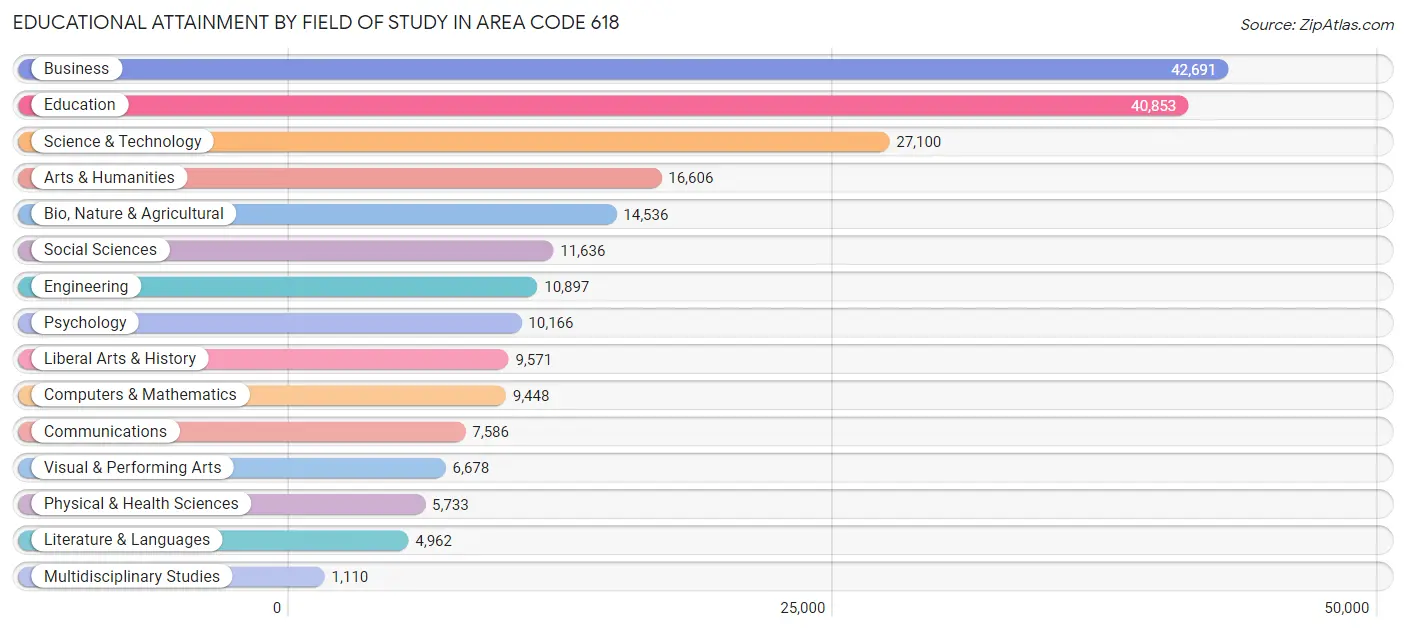
| Field of Study | # Graduates | % Graduates |
| Computers & Mathematics | 9,448 | 4.3% |
| Bio, Nature & Agricultural | 14,536 | 6.6% |
| Physical & Health Sciences | 5,733 | 2.6% |
| Psychology | 10,166 | 4.6% |
| Social Sciences | 11,636 | 5.3% |
| Engineering | 10,897 | 5.0% |
| Multidisciplinary Studies | 1,110 | 0.5% |
| Science & Technology | 27,100 | 12.3% |
| Business | 42,691 | 19.4% |
| Education | 40,853 | 18.6% |
| Literature & Languages | 4,962 | 2.3% |
| Liberal Arts & History | 9,571 | 4.4% |
| Visual & Performing Arts | 6,678 | 3.0% |
| Communications | 7,586 | 3.5% |
| Arts & Humanities | 16,606 | 7.6% |
| Total | 219,573 | 100.0% |
Transportation & Commute in Area Code 618
Vehicle Availability by Sex in Area Code 618
The most prevalent vehicle ownership categories in Area Code 618 are males with 2 vehicles (114,035, accounting for 41.3%) and females with 2 vehicles (98,858, making up 45.2%).
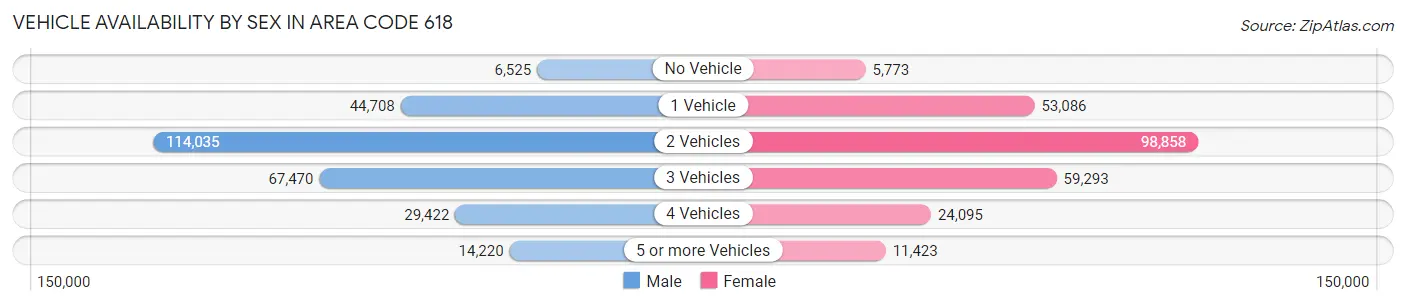
| Vehicles Available | Male | Female |
| No Vehicle | 6,525 (2.4%) | 5,773 (2.3%) |
| 1 Vehicle | 44,708 (16.2%) | 53,086 (21.0%) |
| 2 Vehicles | 114,035 (41.3%) | 98,858 (39.2%) |
| 3 Vehicles | 67,470 (24.4%) | 59,293 (23.5%) |
| 4 Vehicles | 29,422 (10.6%) | 24,095 (9.5%) |
| 5 or more Vehicles | 14,220 (5.1%) | 11,423 (4.5%) |
| Total | 276,380 (100.0%) | 252,528 (100.0%) |
Commute Time in Area Code 618
The most frequently occuring commute durations in Area Code 618 are 5 to 9 minutes (67,659 commuters, 13.8%), 10 to 14 minutes (67,396 commuters, 13.8%), and 15 to 19 minutes (66,578 commuters, 13.6%).
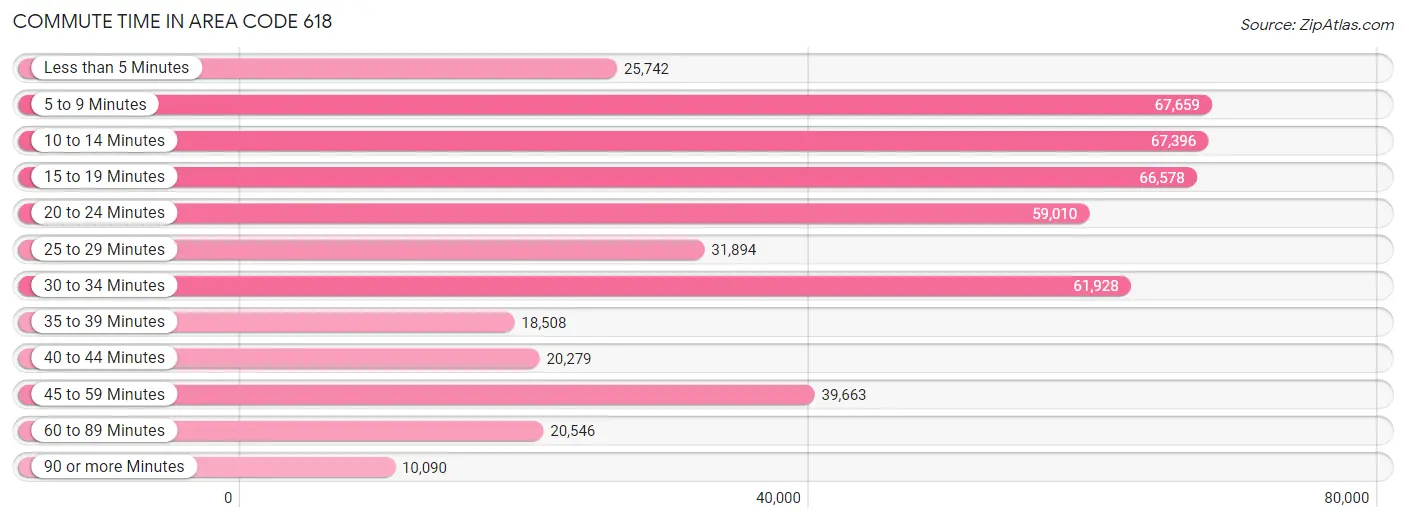
| Commute Time | # Commuters | % Commuters |
| Less than 5 Minutes | 25,742 | 5.3% |
| 5 to 9 Minutes | 67,659 | 13.8% |
| 10 to 14 Minutes | 67,396 | 13.8% |
| 15 to 19 Minutes | 66,578 | 13.6% |
| 20 to 24 Minutes | 59,010 | 12.1% |
| 25 to 29 Minutes | 31,894 | 6.5% |
| 30 to 34 Minutes | 61,928 | 12.7% |
| 35 to 39 Minutes | 18,508 | 3.8% |
| 40 to 44 Minutes | 20,279 | 4.1% |
| 45 to 59 Minutes | 39,663 | 8.1% |
| 60 to 89 Minutes | 20,546 | 4.2% |
| 90 or more Minutes | 10,090 | 2.1% |
Commute Time by Sex in Area Code 618
The most common commute times in Area Code 618 are 10 to 14 minutes (34,362 commuters, 13.4%) for males and 5 to 9 minutes (34,663 commuters, 14.9%) for females.
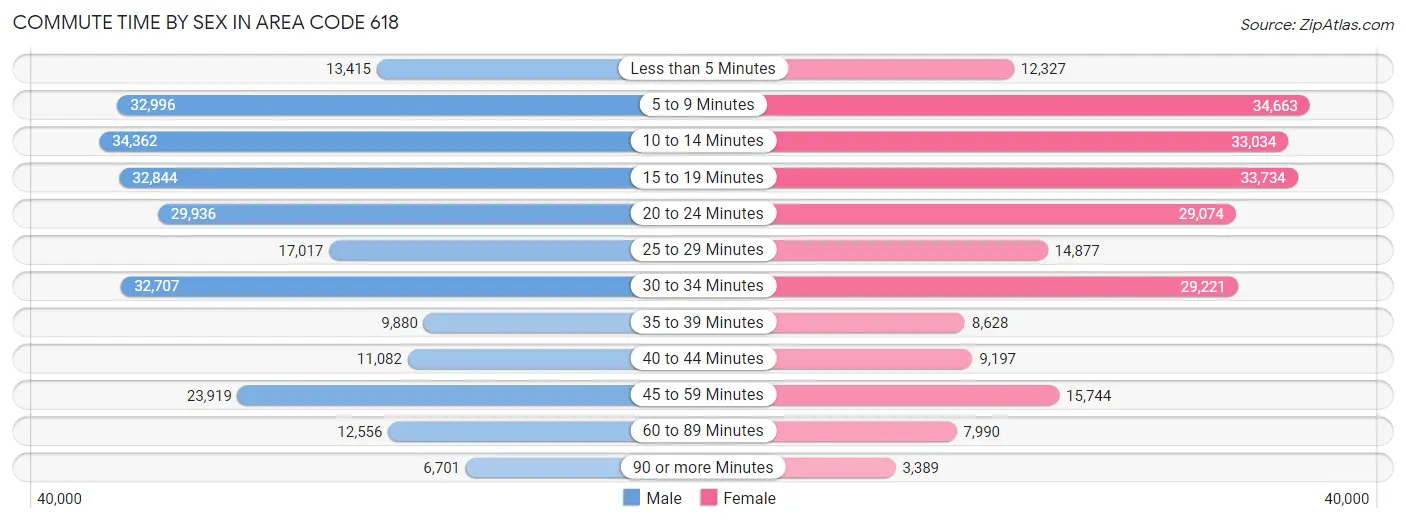
| Commute Time | Male | Female |
| Less than 5 Minutes | 13,415 (5.2%) | 12,327 (5.3%) |
| 5 to 9 Minutes | 32,996 (12.8%) | 34,663 (14.9%) |
| 10 to 14 Minutes | 34,362 (13.4%) | 33,034 (14.2%) |
| 15 to 19 Minutes | 32,844 (12.8%) | 33,734 (14.5%) |
| 20 to 24 Minutes | 29,936 (11.6%) | 29,074 (12.5%) |
| 25 to 29 Minutes | 17,017 (6.6%) | 14,877 (6.4%) |
| 30 to 34 Minutes | 32,707 (12.7%) | 29,221 (12.6%) |
| 35 to 39 Minutes | 9,880 (3.8%) | 8,628 (3.7%) |
| 40 to 44 Minutes | 11,082 (4.3%) | 9,197 (4.0%) |
| 45 to 59 Minutes | 23,919 (9.3%) | 15,744 (6.8%) |
| 60 to 89 Minutes | 12,556 (4.9%) | 7,990 (3.5%) |
| 90 or more Minutes | 6,701 (2.6%) | 3,389 (1.5%) |
Time of Departure to Work by Sex in Area Code 618
The most frequent times of departure to work in Area Code 618 are 7:00 AM to 7:29 AM (31,437, 12.2%) for males and 7:30 AM to 7:59 AM (39,952, 17.2%) for females.
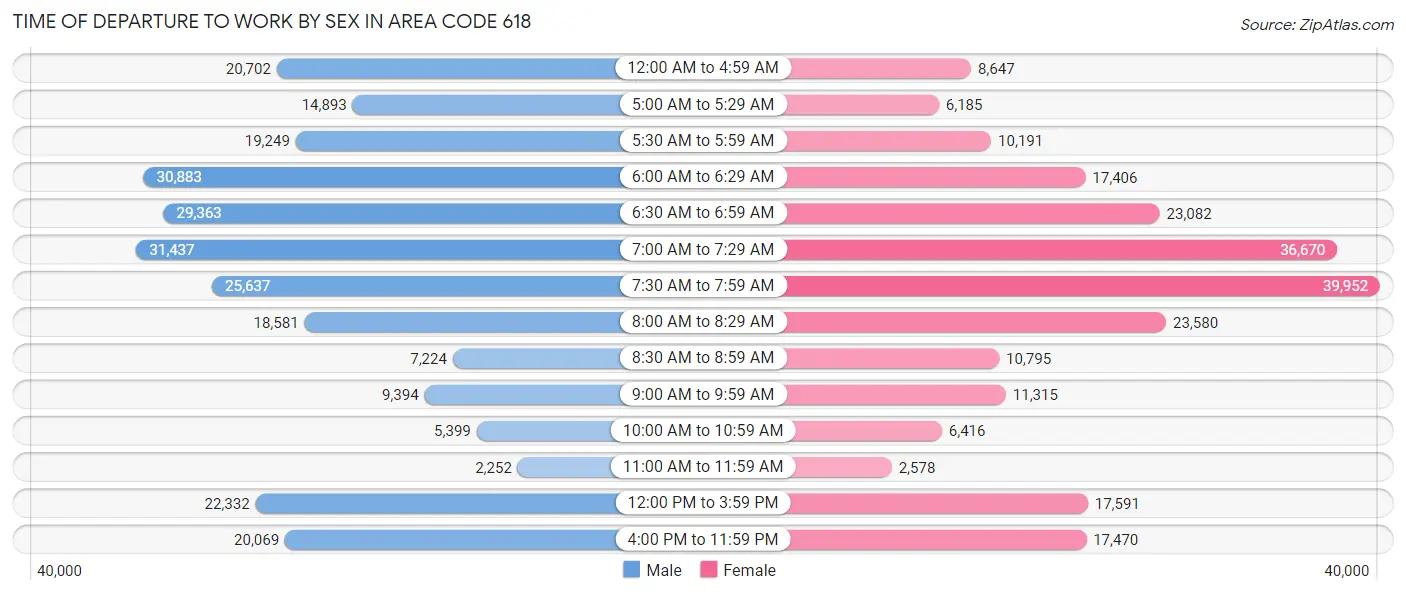
| Time of Departure | Male | Female |
| 12:00 AM to 4:59 AM | 20,702 (8.0%) | 8,647 (3.7%) |
| 5:00 AM to 5:29 AM | 14,893 (5.8%) | 6,185 (2.7%) |
| 5:30 AM to 5:59 AM | 19,249 (7.5%) | 10,191 (4.4%) |
| 6:00 AM to 6:29 AM | 30,883 (12.0%) | 17,406 (7.5%) |
| 6:30 AM to 6:59 AM | 29,363 (11.4%) | 23,082 (10.0%) |
| 7:00 AM to 7:29 AM | 31,437 (12.2%) | 36,670 (15.8%) |
| 7:30 AM to 7:59 AM | 25,637 (10.0%) | 39,952 (17.2%) |
| 8:00 AM to 8:29 AM | 18,581 (7.2%) | 23,580 (10.2%) |
| 8:30 AM to 8:59 AM | 7,224 (2.8%) | 10,795 (4.7%) |
| 9:00 AM to 9:59 AM | 9,394 (3.6%) | 11,315 (4.9%) |
| 10:00 AM to 10:59 AM | 5,399 (2.1%) | 6,416 (2.8%) |
| 11:00 AM to 11:59 AM | 2,252 (0.9%) | 2,578 (1.1%) |
| 12:00 PM to 3:59 PM | 22,332 (8.7%) | 17,591 (7.6%) |
| 4:00 PM to 11:59 PM | 20,069 (7.8%) | 17,470 (7.5%) |
| Total | 257,415 (100.0%) | 231,878 (100.0%) |
Housing Occupancy in Area Code 618
Occupancy by Ownership in Area Code 618
Of the total 471,641 dwellings in Area Code 618, owner-occupied units account for 341,434 (72.4%), while renter-occupied units make up 130,207 (27.6%).
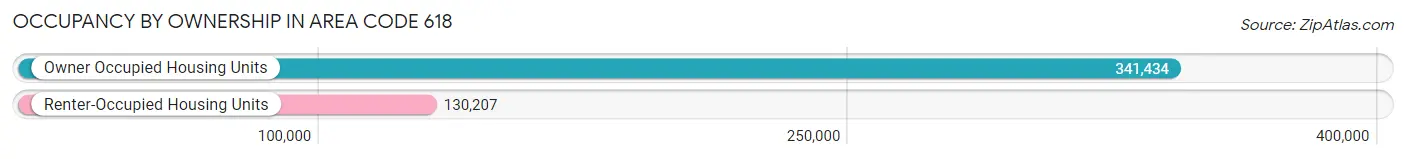
| Occupancy | # Housing Units | % Housing Units |
| Owner Occupied Housing Units | 341,434 | 72.4% |
| Renter-Occupied Housing Units | 130,207 | 27.6% |
| Total Occupied Housing Units | 471,641 | 100.0% |
Occupancy by Household Size in Area Code 618
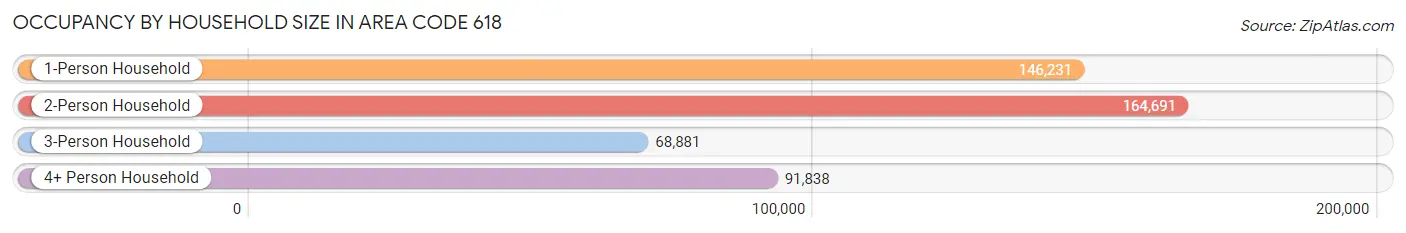
| Household Size | # Housing Units | % Housing Units |
| 1-Person Household | 146,231 | 31.0% |
| 2-Person Household | 164,691 | 34.9% |
| 3-Person Household | 68,881 | 14.6% |
| 4+ Person Household | 91,838 | 19.5% |
| Total Housing Units | 471,641 | 100.0% |
Occupancy by Ownership by Household Size in Area Code 618
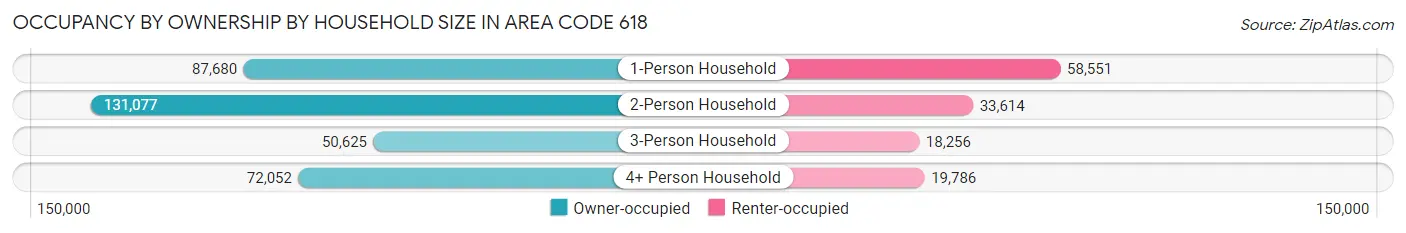
| Household Size | Owner-occupied | Renter-occupied |
| 1-Person Household | 87,680 (60.0%) | 58,551 (40.0%) |
| 2-Person Household | 131,077 (79.6%) | 33,614 (20.4%) |
| 3-Person Household | 50,625 (73.5%) | 18,256 (26.5%) |
| 4+ Person Household | 72,052 (78.5%) | 19,786 (21.5%) |
| Total Housing Units | 341,434 (72.4%) | 130,207 (27.6%) |
Occupancy by Educational Attainment in Area Code 618
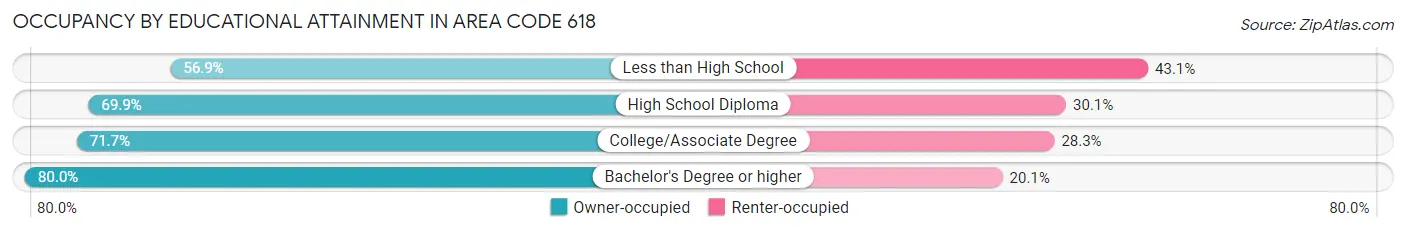
| Household Size | Owner-occupied | Renter-occupied |
| Less than High School | 19,020 (56.9%) | 14,426 (43.1%) |
| High School Diploma | 90,128 (69.9%) | 38,862 (30.1%) |
| College/Associate Degree | 130,123 (71.7%) | 51,305 (28.3%) |
| Bachelor's Degree or higher | 102,163 (79.9%) | 25,614 (20.1%) |
Occupancy by Age of Householder in Area Code 618
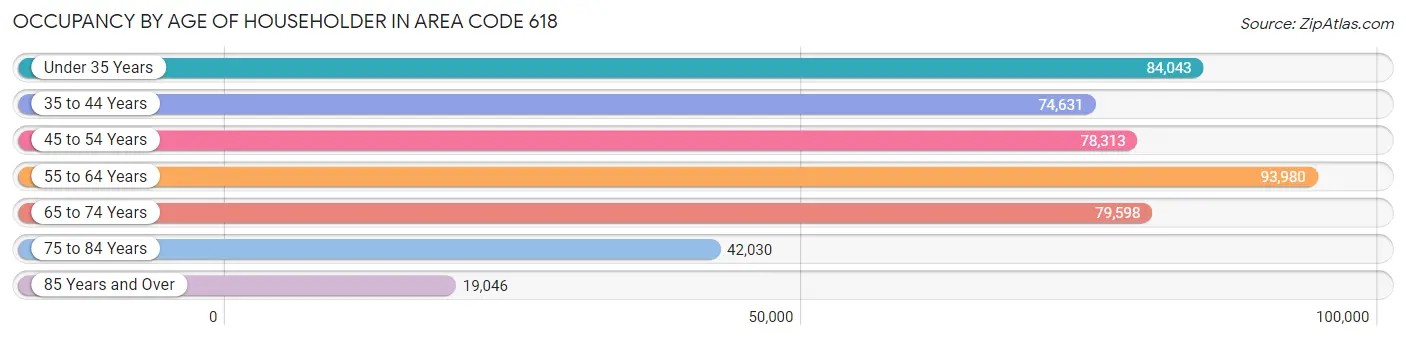
| Age Bracket | # Households | % Households |
| Under 35 Years | 84,043 | 17.8% |
| 35 to 44 Years | 74,631 | 15.8% |
| 45 to 54 Years | 78,313 | 16.6% |
| 55 to 64 Years | 93,980 | 19.9% |
| 65 to 74 Years | 79,598 | 16.9% |
| 75 to 84 Years | 42,030 | 8.9% |
| 85 Years and Over | 19,046 | 4.0% |
| Total | 471,641 | 100.0% |
Housing Finances in Area Code 618
Median Income by Occupancy in Area Code 618
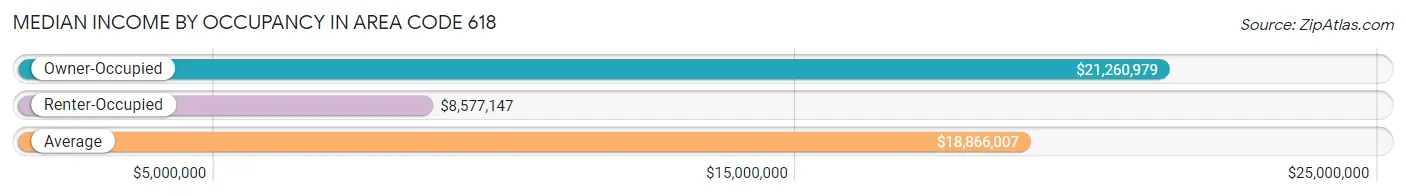
| Occupancy Type | # Households | Median Income |
| Owner-Occupied | 341,434 (72.4%) | $21,260,979 |
| Renter-Occupied | 130,207 (27.6%) | $8,577,147 |
| Average | 471,641 (100.0%) | $18,866,007 |
Occupancy by Householder Income Bracket in Area Code 618
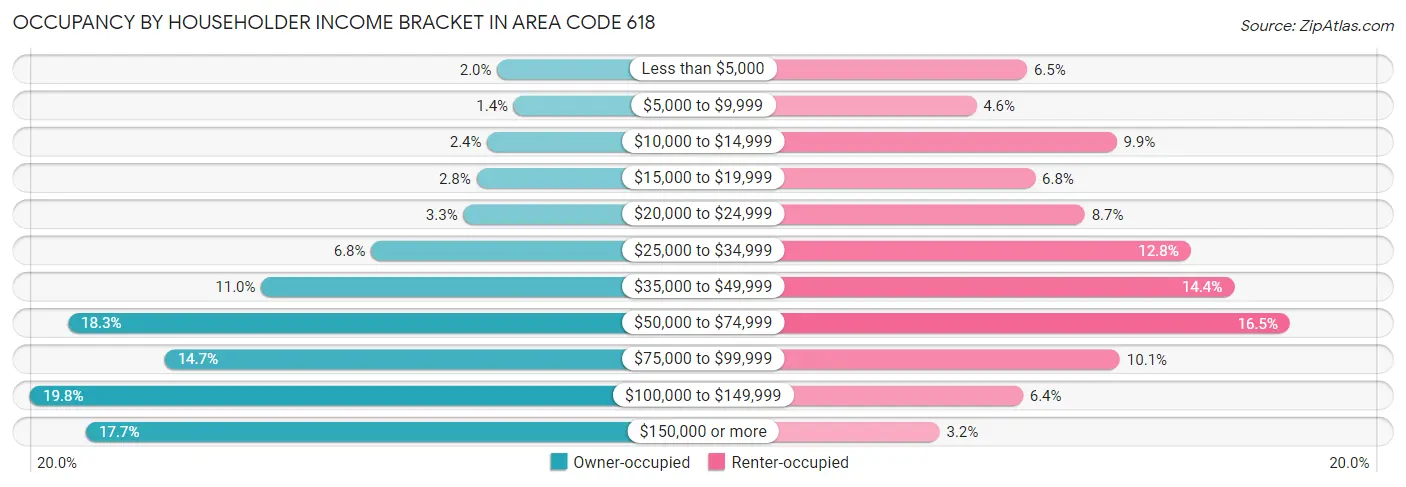
| Income Bracket | Owner-occupied | Renter-occupied |
| Less than $5,000 | 6,810 (2.0%) | 8,504 (6.5%) |
| $5,000 to $9,999 | 4,654 (1.4%) | 5,994 (4.6%) |
| $10,000 to $14,999 | 8,079 (2.4%) | 12,938 (9.9%) |
| $15,000 to $19,999 | 9,489 (2.8%) | 8,911 (6.8%) |
| $20,000 to $24,999 | 11,190 (3.3%) | 11,363 (8.7%) |
| $25,000 to $34,999 | 23,175 (6.8%) | 16,612 (12.8%) |
| $35,000 to $49,999 | 37,499 (11.0%) | 18,770 (14.4%) |
| $50,000 to $74,999 | 62,632 (18.3%) | 21,539 (16.5%) |
| $75,000 to $99,999 | 50,053 (14.7%) | 13,115 (10.1%) |
| $100,000 to $149,999 | 67,567 (19.8%) | 8,297 (6.4%) |
| $150,000 or more | 60,286 (17.7%) | 4,164 (3.2%) |
| Total | 341,434 (100.0%) | 130,207 (100.0%) |
Monthly Housing Cost Tiers in Area Code 618
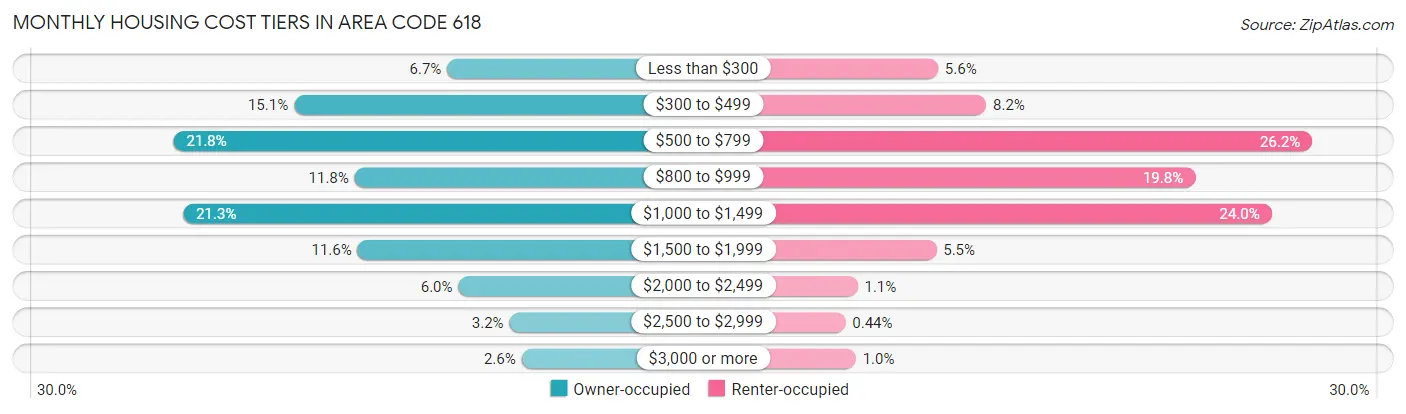
| Monthly Cost | Owner-occupied | Renter-occupied |
| Less than $300 | 22,742 (6.7%) | 7,227 (5.6%) |
| $300 to $499 | 51,608 (15.1%) | 10,694 (8.2%) |
| $500 to $799 | 74,349 (21.8%) | 34,140 (26.2%) |
| $800 to $999 | 40,189 (11.8%) | 25,721 (19.8%) |
| $1,000 to $1,499 | 72,564 (21.2%) | 31,227 (24.0%) |
| $1,500 to $1,999 | 39,648 (11.6%) | 7,111 (5.5%) |
| $2,000 to $2,499 | 20,626 (6.0%) | 1,450 (1.1%) |
| $2,500 to $2,999 | 11,010 (3.2%) | 571 (0.4%) |
| $3,000 or more | 8,698 (2.5%) | 1,317 (1.0%) |
| Total | 341,434 (100.0%) | 130,207 (100.0%) |
Physical Housing Characteristics in Area Code 618
Housing Structures in Area Code 618
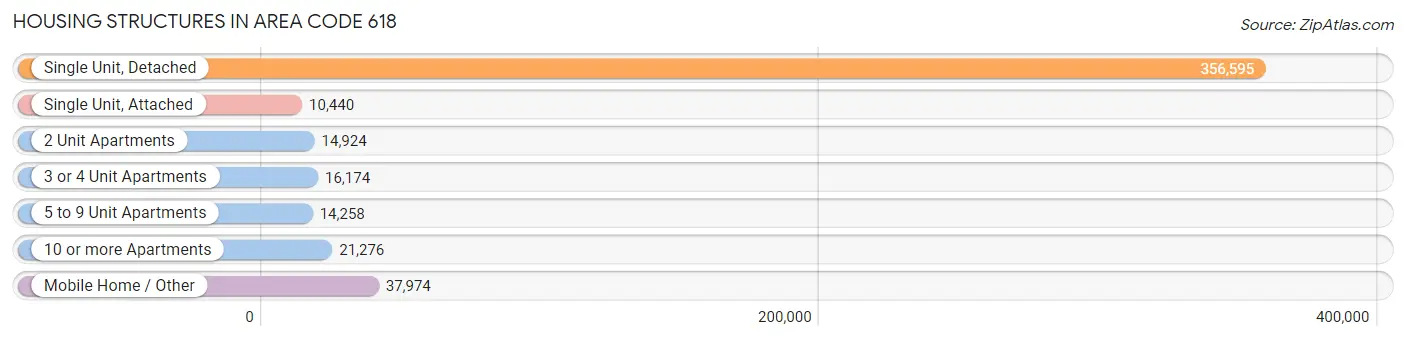
| Structure Type | # Housing Units | % Housing Units |
| Single Unit, Detached | 356,595 | 75.6% |
| Single Unit, Attached | 10,440 | 2.2% |
| 2 Unit Apartments | 14,924 | 3.2% |
| 3 or 4 Unit Apartments | 16,174 | 3.4% |
| 5 to 9 Unit Apartments | 14,258 | 3.0% |
| 10 or more Apartments | 21,276 | 4.5% |
| Mobile Home / Other | 37,974 | 8.1% |
| Total | 471,641 | 100.0% |
Housing Structures by Occupancy in Area Code 618
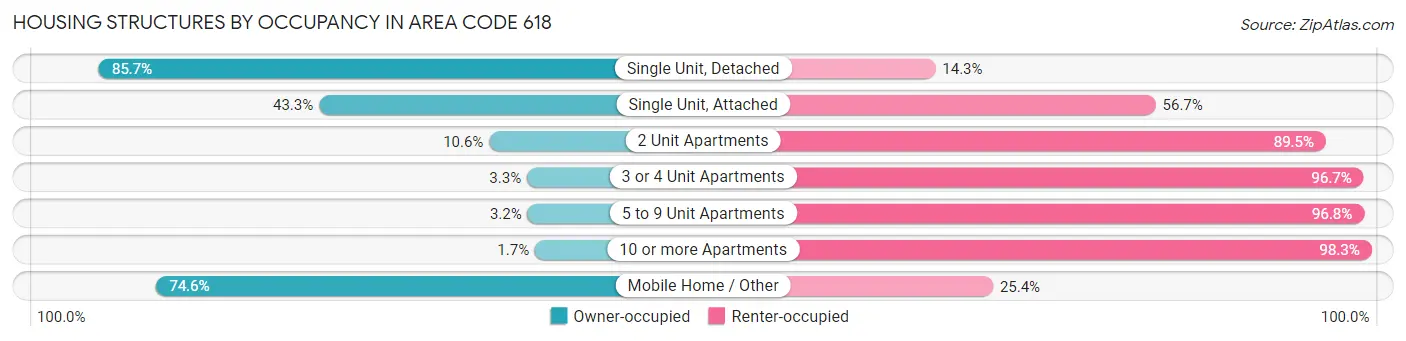
| Structure Type | Owner-occupied | Renter-occupied |
| Single Unit, Detached | 305,648 (85.7%) | 50,947 (14.3%) |
| Single Unit, Attached | 4,522 (43.3%) | 5,918 (56.7%) |
| 2 Unit Apartments | 1,574 (10.5%) | 13,350 (89.4%) |
| 3 or 4 Unit Apartments | 529 (3.3%) | 15,645 (96.7%) |
| 5 to 9 Unit Apartments | 452 (3.2%) | 13,806 (96.8%) |
| 10 or more Apartments | 368 (1.7%) | 20,908 (98.3%) |
| Mobile Home / Other | 28,341 (74.6%) | 9,633 (25.4%) |
| Total | 341,434 (72.4%) | 130,207 (27.6%) |
Housing Structures by Number of Rooms in Area Code 618
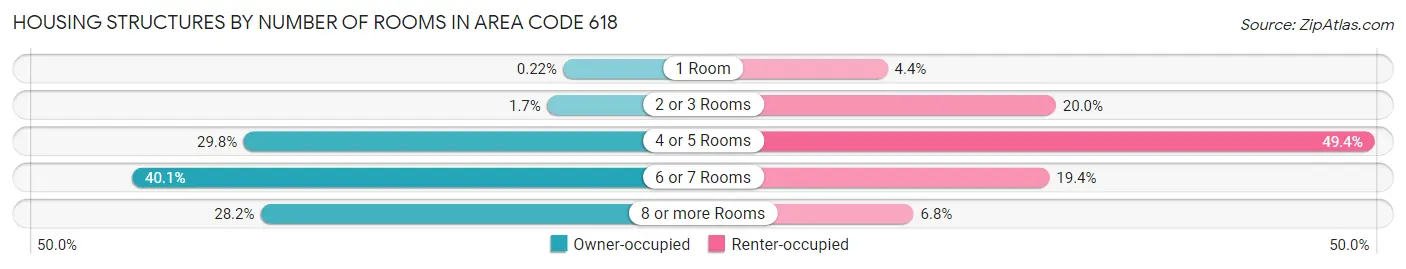
| Number of Rooms | Owner-occupied | Renter-occupied |
| 1 Room | 745 (0.2%) | 5,748 (4.4%) |
| 2 or 3 Rooms | 5,869 (1.7%) | 26,007 (20.0%) |
| 4 or 5 Rooms | 101,760 (29.8%) | 64,368 (49.4%) |
| 6 or 7 Rooms | 136,786 (40.1%) | 25,216 (19.4%) |
| 8 or more Rooms | 96,274 (28.2%) | 8,868 (6.8%) |
| Total | 341,434 (100.0%) | 130,207 (100.0%) |
Housing Structure by Heating Type in Area Code 618
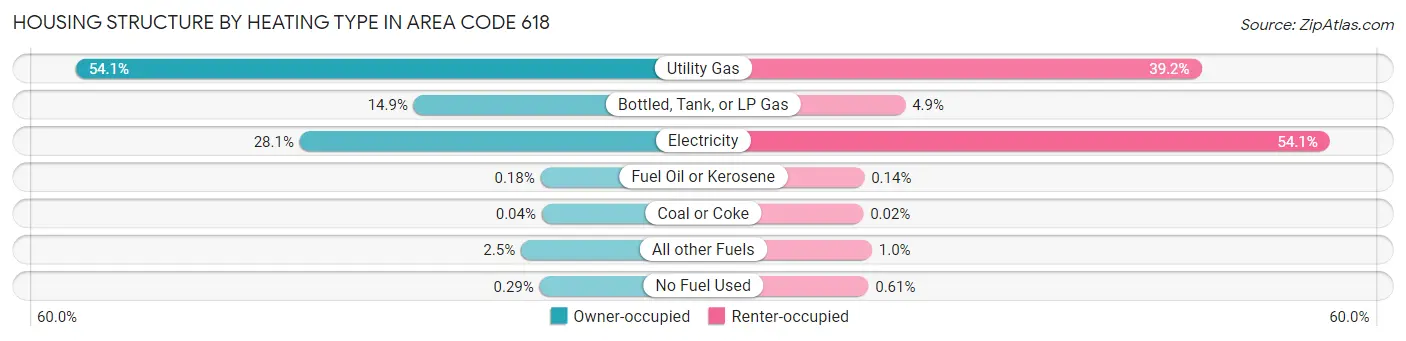
| Heating Type | Owner-occupied | Renter-occupied |
| Utility Gas | 184,601 (54.1%) | 51,073 (39.2%) |
| Bottled, Tank, or LP Gas | 50,804 (14.9%) | 6,364 (4.9%) |
| Electricity | 95,936 (28.1%) | 70,435 (54.1%) |
| Fuel Oil or Kerosene | 608 (0.2%) | 184 (0.1%) |
| Coal or Coke | 121 (0.0%) | 29 (0.0%) |
| All other Fuels | 8,374 (2.5%) | 1,326 (1.0%) |
| No Fuel Used | 990 (0.3%) | 796 (0.6%) |
| Total | 341,434 (100.0%) | 130,207 (100.0%) |
Household Vehicle Usage in Area Code 618
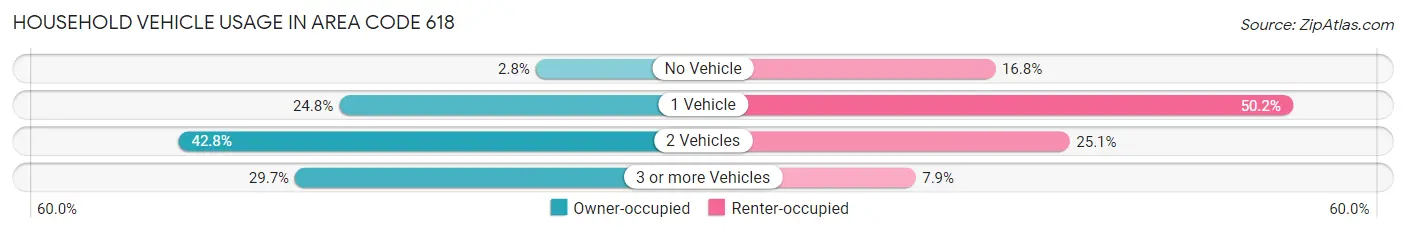
| Vehicles per Household | Owner-occupied | Renter-occupied |
| No Vehicle | 9,378 (2.8%) | 21,887 (16.8%) |
| 1 Vehicle | 84,606 (24.8%) | 65,318 (50.2%) |
| 2 Vehicles | 145,959 (42.7%) | 32,738 (25.1%) |
| 3 or more Vehicles | 101,491 (29.7%) | 10,264 (7.9%) |
| Total | 341,434 (100.0%) | 130,207 (100.0%) |
Real Estate & Mortgages in Area Code 618
Real Estate and Mortgage Overview in Area Code 618
| Characteristic | Without Mortgage | With Mortgage |
| Housing Units | 156,934 | 184,500 |
| Median Property Value | $30,306,100 | $37,716,900 |
| Median Household Income | $16,849,971 | $42,823 |
| Monthly Housing Costs | $150,039 | $8,373 |
| Real Estate Taxes | $475,137 | $6,053 |
Property Value by Mortgage Status in Area Code 618
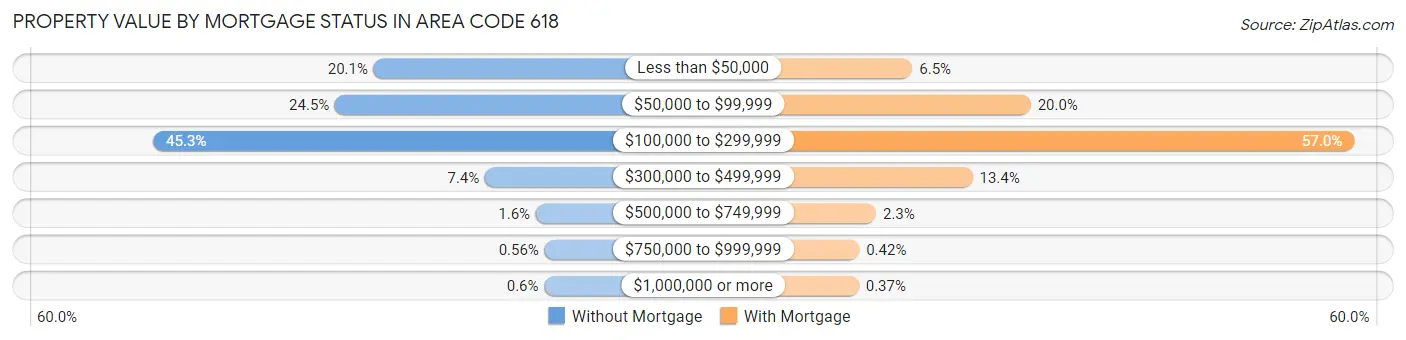
| Property Value | Without Mortgage | With Mortgage |
| Less than $50,000 | 31,534 (20.1%) | 11,970 (6.5%) |
| $50,000 to $99,999 | 38,458 (24.5%) | 36,943 (20.0%) |
| $100,000 to $299,999 | 71,113 (45.3%) | 105,127 (57.0%) |
| $300,000 to $499,999 | 11,573 (7.4%) | 24,673 (13.4%) |
| $500,000 to $749,999 | 2,441 (1.6%) | 4,325 (2.3%) |
| $750,000 to $999,999 | 877 (0.6%) | 778 (0.4%) |
| $1,000,000 or more | 938 (0.6%) | 684 (0.4%) |
| Total | 156,934 (100.0%) | 184,500 (100.0%) |
Household Income by Mortgage Status in Area Code 618
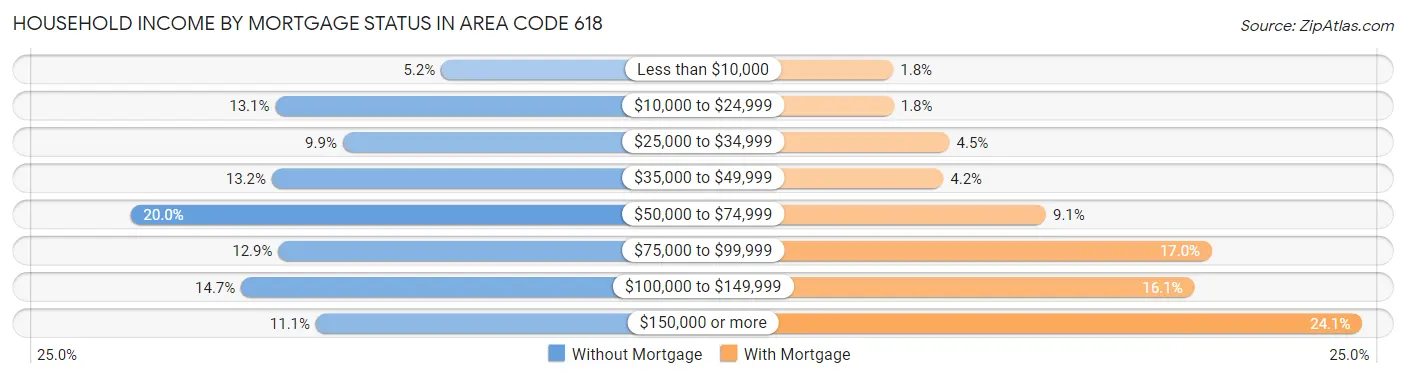
| Household Income | Without Mortgage | With Mortgage |
| Less than $10,000 | 8,111 (5.2%) | 3,325 (1.8%) |
| $10,000 to $24,999 | 20,492 (13.1%) | 3,353 (1.8%) |
| $25,000 to $34,999 | 15,454 (9.9%) | 8,266 (4.5%) |
| $35,000 to $49,999 | 20,765 (13.2%) | 7,721 (4.2%) |
| $50,000 to $74,999 | 31,330 (20.0%) | 16,734 (9.1%) |
| $75,000 to $99,999 | 20,273 (12.9%) | 31,302 (17.0%) |
| $100,000 to $149,999 | 23,046 (14.7%) | 29,780 (16.1%) |
| $150,000 or more | 17,463 (11.1%) | 44,521 (24.1%) |
| Total | 156,934 (100.0%) | 184,500 (100.0%) |
Property Value to Household Income Ratio in Area Code 618
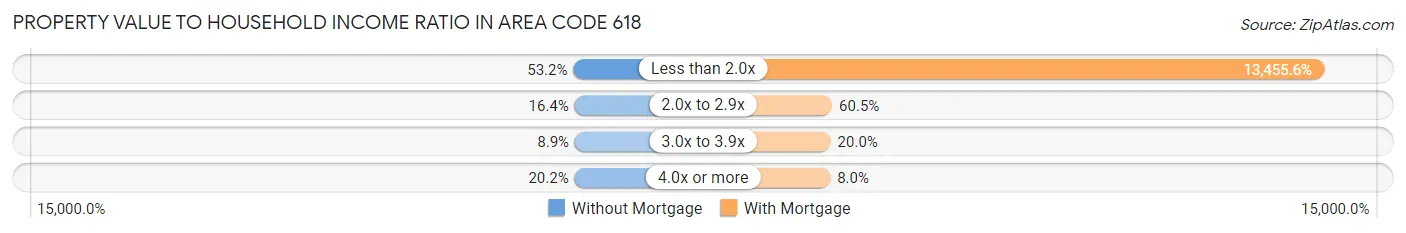
| Value-to-Income Ratio | Without Mortgage | With Mortgage |
| Less than 2.0x | 83,534 (53.2%) | 24,825,538 (13,455.6%) |
| 2.0x to 2.9x | 25,705 (16.4%) | 111,642 (60.5%) |
| 3.0x to 3.9x | 13,891 (8.8%) | 36,841 (20.0%) |
| 4.0x or more | 31,661 (20.2%) | 14,798 (8.0%) |
| Total | 156,934 (100.0%) | 184,500 (100.0%) |
Real Estate Taxes by Mortgage Status in Area Code 618
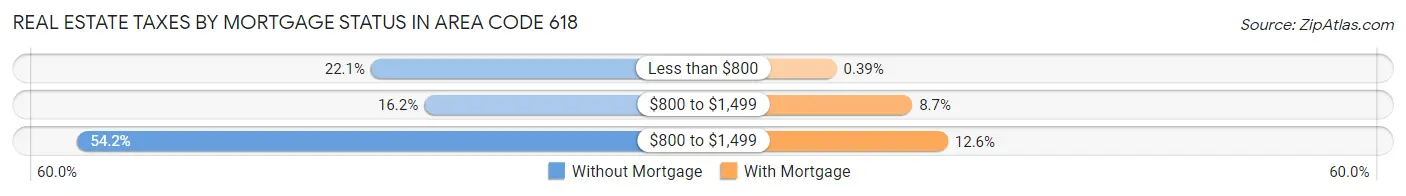
| Property Taxes | Without Mortgage | With Mortgage |
| Less than $800 | 34,616 (22.1%) | 722 (0.4%) |
| $800 to $1,499 | 25,466 (16.2%) | 16,012 (8.7%) |
| $800 to $1,499 | 85,076 (54.2%) | 23,206 (12.6%) |
| Total | 156,934 (100.0%) | 184,500 (100.0%) |
Health & Disability in Area Code 618
Health Insurance Coverage by Age in Area Code 618
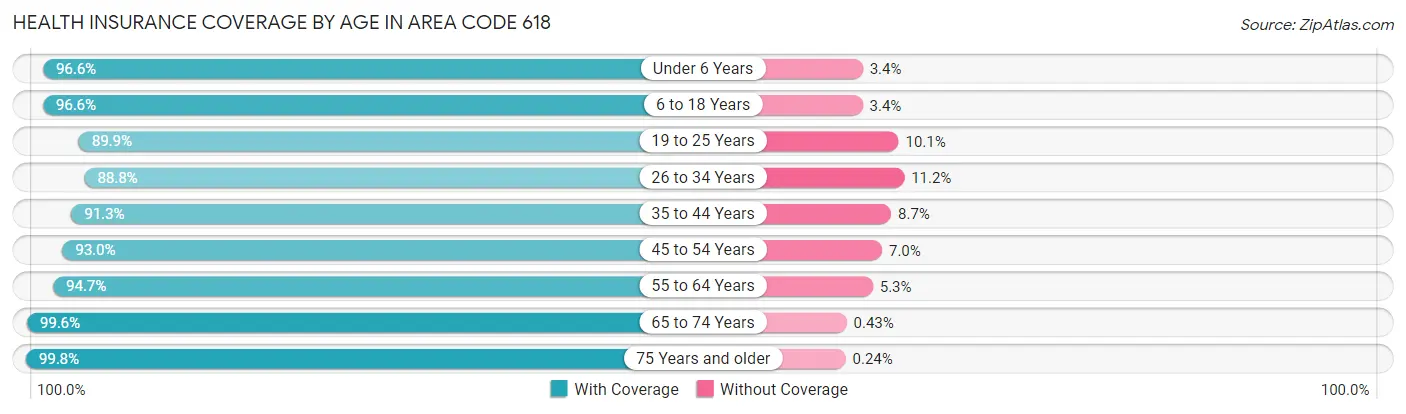
| Age Bracket | With Coverage | Without Coverage |
| Under 6 Years | 75,873 (96.6%) | 2,691 (3.4%) |
| 6 to 18 Years | 184,786 (96.6%) | 6,521 (3.4%) |
| 19 to 25 Years | 87,412 (89.9%) | 9,845 (10.1%) |
| 26 to 34 Years | 110,612 (88.8%) | 13,911 (11.2%) |
| 35 to 44 Years | 127,509 (91.3%) | 12,175 (8.7%) |
| 45 to 54 Years | 130,159 (93.0%) | 9,851 (7.0%) |
| 55 to 64 Years | 154,156 (94.7%) | 8,643 (5.3%) |
| 65 to 74 Years | 123,357 (99.6%) | 530 (0.4%) |
| 75 Years and older | 86,589 (99.8%) | 204 (0.2%) |
| Total | 1,080,453 (94.4%) | 64,371 (5.6%) |
Health Insurance Coverage by Citizenship Status in Area Code 618
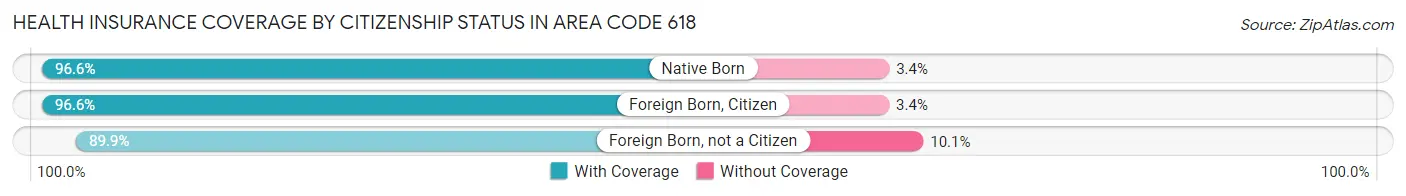
| Citizenship Status | With Coverage | Without Coverage |
| Native Born | 75,873 (96.6%) | 2,691 (3.4%) |
| Foreign Born, Citizen | 184,786 (96.6%) | 6,521 (3.4%) |
| Foreign Born, not a Citizen | 87,412 (89.9%) | 9,845 (10.1%) |
Health Insurance Coverage by Household Income in Area Code 618
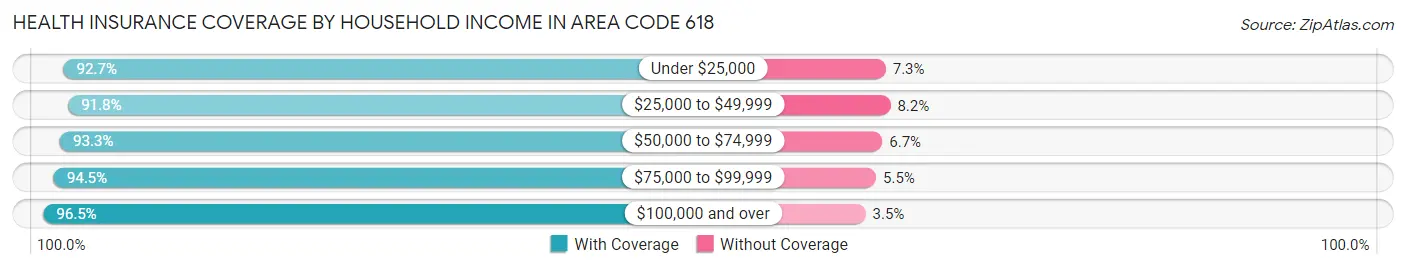
| Household Income | With Coverage | Without Coverage |
| Under $25,000 | 137,806 (92.7%) | 10,874 (7.3%) |
| $25,000 to $49,999 | 177,234 (91.8%) | 15,784 (8.2%) |
| $50,000 to $74,999 | 181,575 (93.3%) | 12,961 (6.7%) |
| $75,000 to $99,999 | 155,933 (94.5%) | 9,052 (5.5%) |
| $100,000 and over | 417,715 (96.5%) | 15,263 (3.5%) |
Public vs Private Health Insurance Coverage by Age in Area Code 618
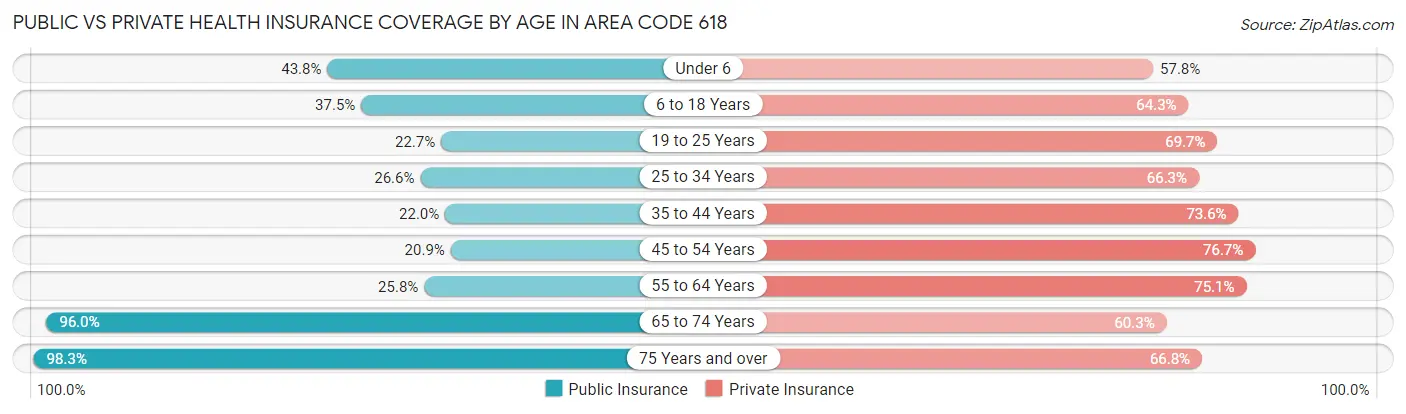
| Age Bracket | Public Insurance | Private Insurance |
| Under 6 | 34,420 (43.8%) | 45,406 (57.8%) |
| 6 to 18 Years | 71,798 (37.5%) | 123,066 (64.3%) |
| 19 to 25 Years | 22,078 (22.7%) | 67,784 (69.7%) |
| 25 to 34 Years | 33,055 (26.6%) | 82,525 (66.3%) |
| 35 to 44 Years | 30,663 (22.0%) | 102,831 (73.6%) |
| 45 to 54 Years | 29,289 (20.9%) | 107,403 (76.7%) |
| 55 to 64 Years | 42,067 (25.8%) | 122,212 (75.1%) |
| 65 to 74 Years | 118,886 (96.0%) | 74,657 (60.3%) |
| 75 Years and over | 85,356 (98.3%) | 58,010 (66.8%) |
| Total | 467,612 (40.8%) | 783,894 (68.5%) |
Disability Status by Sex by Age in Area Code 618
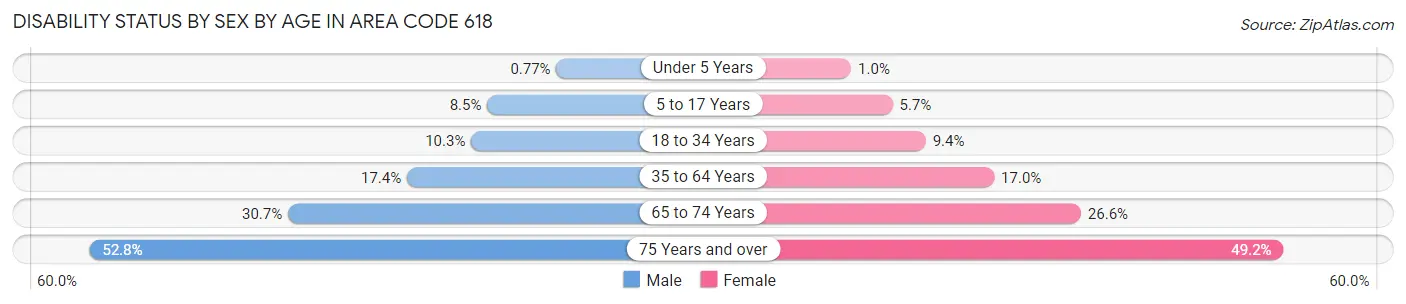
| Age Bracket | Male | Female |
| Under 5 Years | 259 (0.8%) | 325 (1.0%) |
| 5 to 17 Years | 8,207 (8.5%) | 5,187 (5.7%) |
| 18 to 34 Years | 12,368 (10.3%) | 10,997 (9.3%) |
| 35 to 64 Years | 38,124 (17.4%) | 37,928 (17.0%) |
| 65 to 74 Years | 18,141 (30.7%) | 17,234 (26.6%) |
| 75 Years and over | 18,794 (52.8%) | 25,174 (49.2%) |
Disability Class by Sex by Age in Area Code 618
Disability Class: Hearing Difficulty
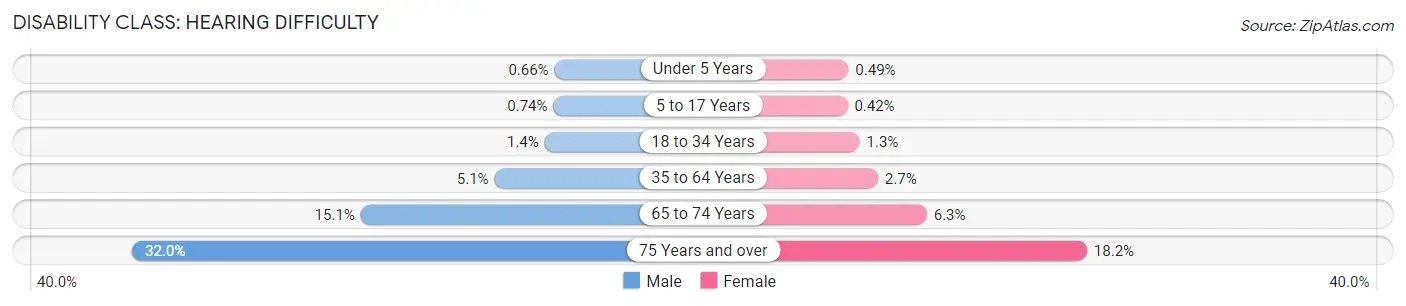
| Age Bracket | Male | Female |
| Under 5 Years | 223 (0.7%) | 152 (0.5%) |
| 5 to 17 Years | 715 (0.7%) | 385 (0.4%) |
| 18 to 34 Years | 1,681 (1.4%) | 1,551 (1.3%) |
| 35 to 64 Years | 11,207 (5.1%) | 5,985 (2.7%) |
| 65 to 74 Years | 8,904 (15.0%) | 4,083 (6.3%) |
| 75 Years and over | 11,400 (32.0%) | 9,314 (18.2%) |
Disability Class: Vision Difficulty
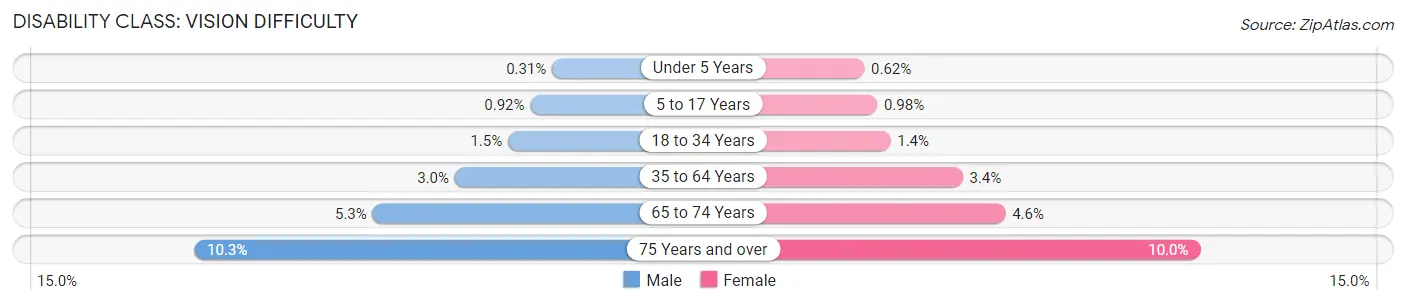
| Age Bracket | Male | Female |
| Under 5 Years | 104 (0.3%) | 193 (0.6%) |
| 5 to 17 Years | 895 (0.9%) | 900 (1.0%) |
| 18 to 34 Years | 1,858 (1.5%) | 1,593 (1.3%) |
| 35 to 64 Years | 6,614 (3.0%) | 7,502 (3.4%) |
| 65 to 74 Years | 3,140 (5.3%) | 2,947 (4.5%) |
| 75 Years and over | 3,660 (10.3%) | 5,109 (10.0%) |
Disability Class: Cognitive Difficulty
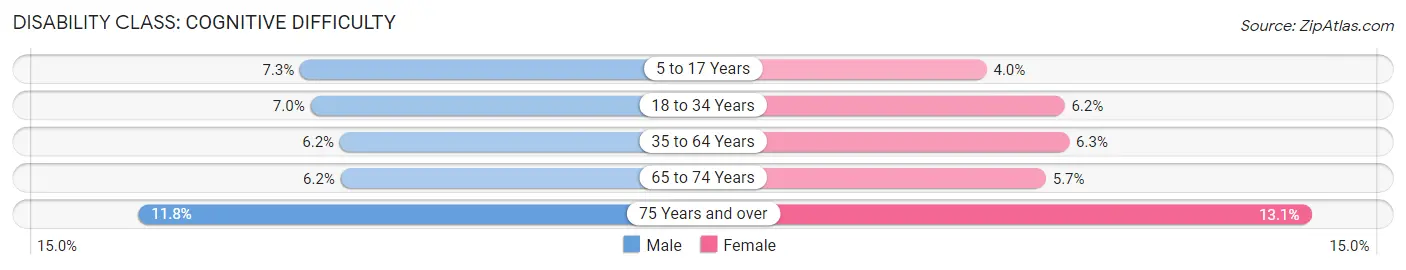
| Age Bracket | Male | Female |
| 5 to 17 Years | 7,098 (7.3%) | 3,695 (4.0%) |
| 18 to 34 Years | 8,489 (7.0%) | 7,292 (6.2%) |
| 35 to 64 Years | 13,621 (6.2%) | 14,142 (6.3%) |
| 65 to 74 Years | 3,666 (6.2%) | 3,679 (5.7%) |
| 75 Years and over | 4,212 (11.8%) | 6,689 (13.1%) |
Disability Class: Ambulatory Difficulty
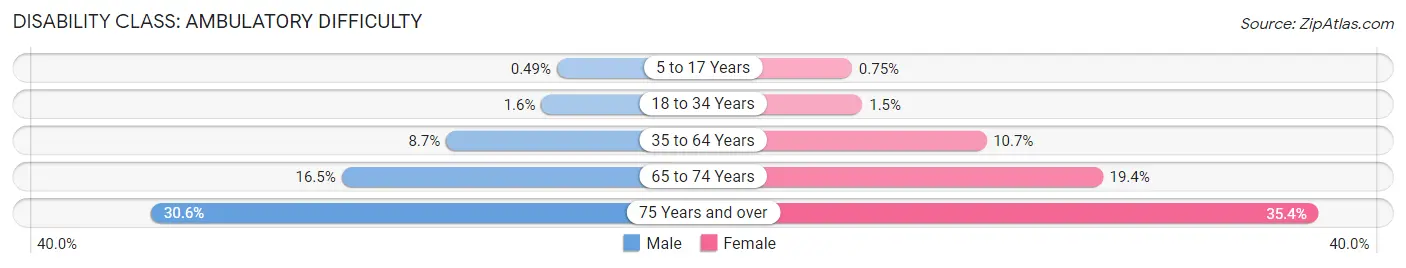
| Age Bracket | Male | Female |
| 5 to 17 Years | 471 (0.5%) | 685 (0.7%) |
| 18 to 34 Years | 1,976 (1.6%) | 1,782 (1.5%) |
| 35 to 64 Years | 19,060 (8.7%) | 23,962 (10.7%) |
| 65 to 74 Years | 9,748 (16.5%) | 12,530 (19.4%) |
| 75 Years and over | 10,903 (30.6%) | 18,115 (35.4%) |
Disability Class: Self-Care Difficulty
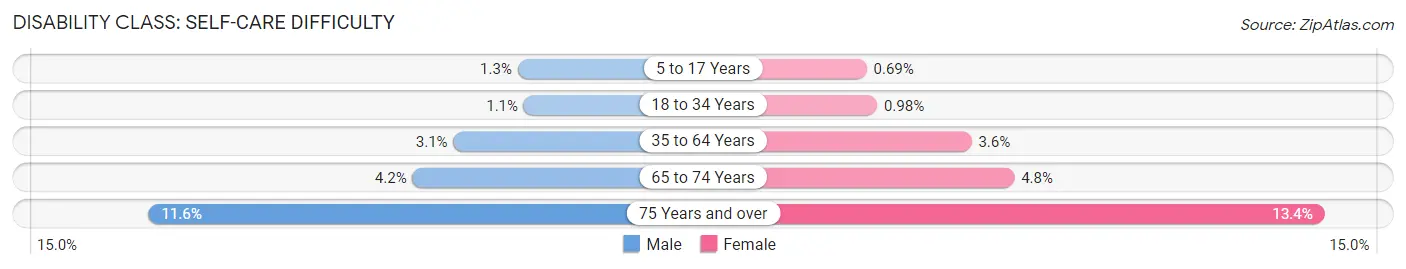
| Age Bracket | Male | Female |
| 5 to 17 Years | 1,229 (1.3%) | 635 (0.7%) |
| 18 to 34 Years | 1,330 (1.1%) | 1,150 (1.0%) |
| 35 to 64 Years | 6,705 (3.1%) | 8,070 (3.6%) |
| 65 to 74 Years | 2,485 (4.2%) | 3,108 (4.8%) |
| 75 Years and over | 4,114 (11.6%) | 6,880 (13.4%) |
Technology Access in Area Code 618
Computing Device Access in Area Code 618
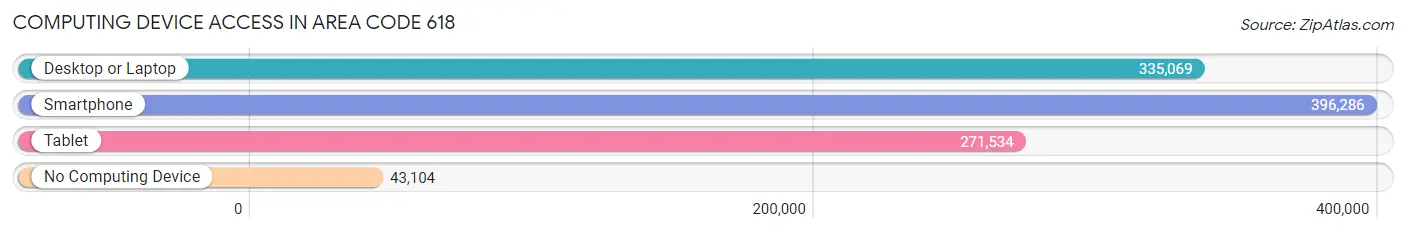
| Device Type | # Households | % Households |
| Desktop or Laptop | 335,069 | 71.0% |
| Smartphone | 396,286 | 84.0% |
| Tablet | 271,534 | 57.6% |
| No Computing Device | 43,104 | 9.1% |
| Total | 471,641 | 100.0% |
Internet Access in Area Code 618
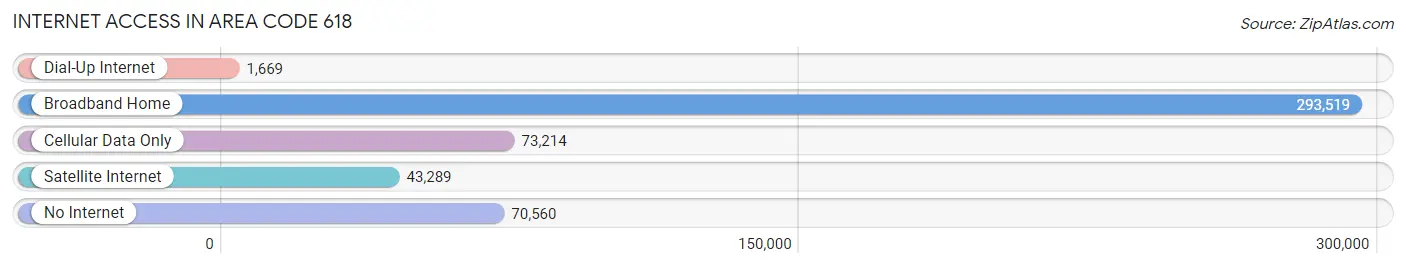
| Internet Type | # Households | % Households |
| Dial-Up Internet | 1,669 | 0.4% |
| Broadband Home | 293,519 | 62.2% |
| Cellular Data Only | 73,214 | 15.5% |
| Satellite Internet | 43,289 | 9.2% |
| No Internet | 70,560 | 15.0% |
| Total | 471,641 | 100.0% |
Area Code 618 Summary
Geography
Area code 618 is located in the southern portion of Illinois, covering the Metro East region of the state. It includes the cities of Belleville, East St. Louis, Alton, Granite City, and Carbondale. It also covers the counties of Madison, St. Clair, Monroe, and Jackson.
Social
Area code 618 is home to a diverse population, with a mix of urban and rural communities. The area is known for its vibrant music and art scene, as well as its strong sense of community. It is also home to a number of universities and colleges, including Southern Illinois University and McKendree University.
Economics
Area code 618 is an important economic hub for the state of Illinois. It is home to a number of major industries, including manufacturing, healthcare, and technology. The area is also home to a number of Fortune 500 companies, such as Monsanto and Express Scripts.
Demographics
Area code 618 is home to a population of over 1.2 million people. The population is largely white, with African Americans making up the largest minority group. The median household income is around $50,000, and the unemployment rate is slightly higher than the national average.
Common Questions
What is Per Capita Income in Area Code 618?
Per Capita income in Area Code 618 is $31,955.
What is the Median Family Income in Area Code 618?
Median Family Income in Area Code 618 is $79,447.
What is the Median Household income in Area Code 618?
Median Household Income in Area Code 618 is $64,170.
What is Income or Wage Gap in Area Code 618?
Income or Wage Gap in Area Code 618 is 32.5%.
Women in Area Code 618 earn 67.5 cents for every dollar earned by a man.
What is Family Income Deficit in Area Code 618?
Family Income Deficit in Area Code 618 is $10,806.
Families that are below poverty line in Area Code 618 earn $10,806 less on average than the poverty threshold level.
What is Inequality or Gini Index in Area Code 618?
Inequality or Gini Index in Area Code 618 is 123.02.
What is the Total Population of Area Code 618?
Total Population of Area Code 618 is 1,177,395.
What is the Total Male Population of Area Code 618?
Total Male Population of Area Code 618 is 589,915.
What is the Total Female Population of Area Code 618?
Total Female Population of Area Code 618 is 587,480.
What is the Ratio of Males per 100 Females in Area Code 618?
There are 100.41 Males per 100 Females in Area Code 618.
What is the Ratio of Females per 100 Males in Area Code 618?
There are 99.59 Females per 100 Males in Area Code 618.
What is the Median Population Age in Area Code 618?
Median Population Age in Area Code 618 is 43.1 Years.
What is the Average Family Size in Area Code 618
Average Family Size in Area Code 618 is 3.1 People.
What is the Average Household Size in Area Code 618
Average Household Size in Area Code 618 is 2.5 People.
How Large is the Labor Force in Area Code 618?
There are 547,790 People in the Labor Forcein in Area Code 618.
What is the Percentage of People in the Labor Force in Area Code 618?
57.4% of People are in the Labor Force in Area Code 618.
What is the Unemployment Rate in Area Code 618?
Unemployment Rate in Area Code 618 is 6.4%.