Area Code 816 Map & Demographics
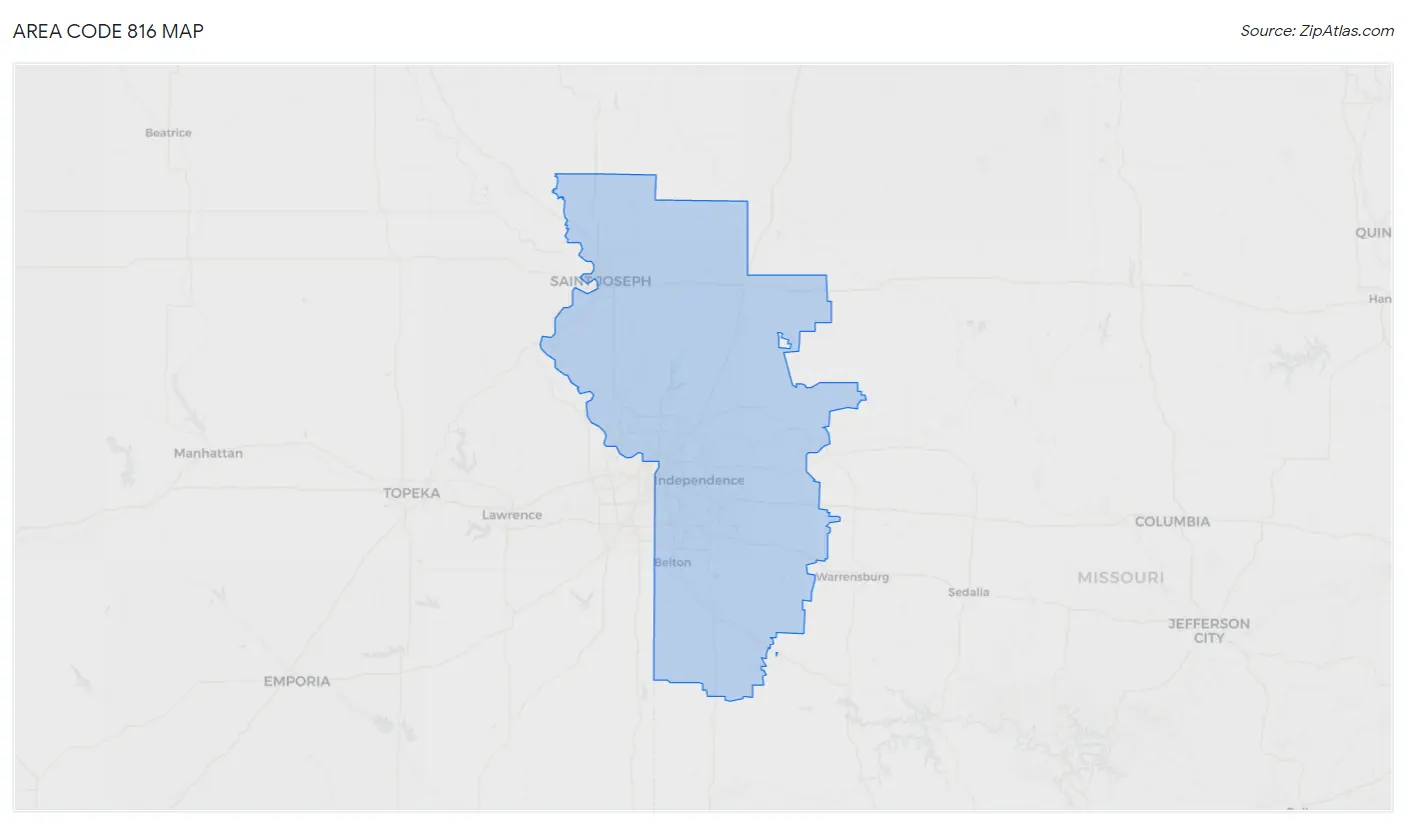
Area Code 816 Map
Area Code 816 Overview
$36,474
PER CAPITA INCOME
$90,650
AVG FAMILY INCOME
$75,202
AVG HOUSEHOLD INCOME
28.4%
WAGE / INCOME GAP [ % ]
71.6¢/ $1
WAGE / INCOME GAP [ $ ]
$11,872
FAMILY INCOME DEFICIT
57.49
INEQUALITY / GINI INDEX
1,352,184
TOTAL POPULATION
666,404
MALE POPULATION
685,780
FEMALE POPULATION
97.17
MALES / 100 FEMALES
102.91
FEMALES / 100 MALES
39.2
MEDIAN AGE
3.1
AVG FAMILY SIZE
2.6
AVG HOUSEHOLD SIZE
697,619
LABOR FORCE [ PEOPLE ]
65.0%
PERCENT IN LABOR FORCE
4.9%
UNEMPLOYMENT RATE
Income in Area Code 816
Income Overview in Area Code 816
Per Capita Income in Area Code 816 is $36,474, while median incomes of families and households are $90,650 and $75,202 respectively.
| Characteristic | Number | Measure |
| Per Capita Income | 1,352,184 | $36,474 |
| Median Family Income | 335,275 | $90,650 |
| Mean Family Income | 335,275 | $15,059,057 |
| Median Household Income | 546,661 | $75,202 |
| Mean Household Income | 546,661 | $13,233,637 |
| Income Deficit | 335,275 | $11,872 |
| Wage / Income Gap (%) | 1,352,184 | 28.42% |
| Wage / Income Gap ($) | 1,352,184 | 71.58¢ per $1 |
| Gini / Inequality Index | 1,352,184 | 57.49 |
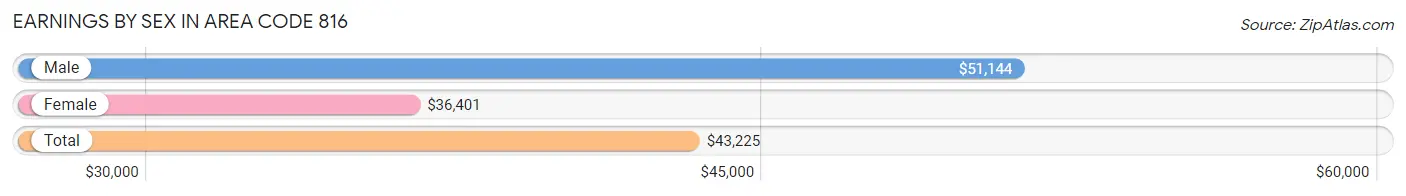
Earnings by Sex in Area Code 816
Average Earnings in Area Code 816 are $43,225, $51,144 for men and $36,401 for women, a difference of 28.8%.
| Sex | Number | Average Earnings |
| Male | 387,883 (52.1%) | $51,144 |
| Female | 357,194 (47.9%) | $36,401 |
| Total | 745,077 (100.0%) | $43,225 |
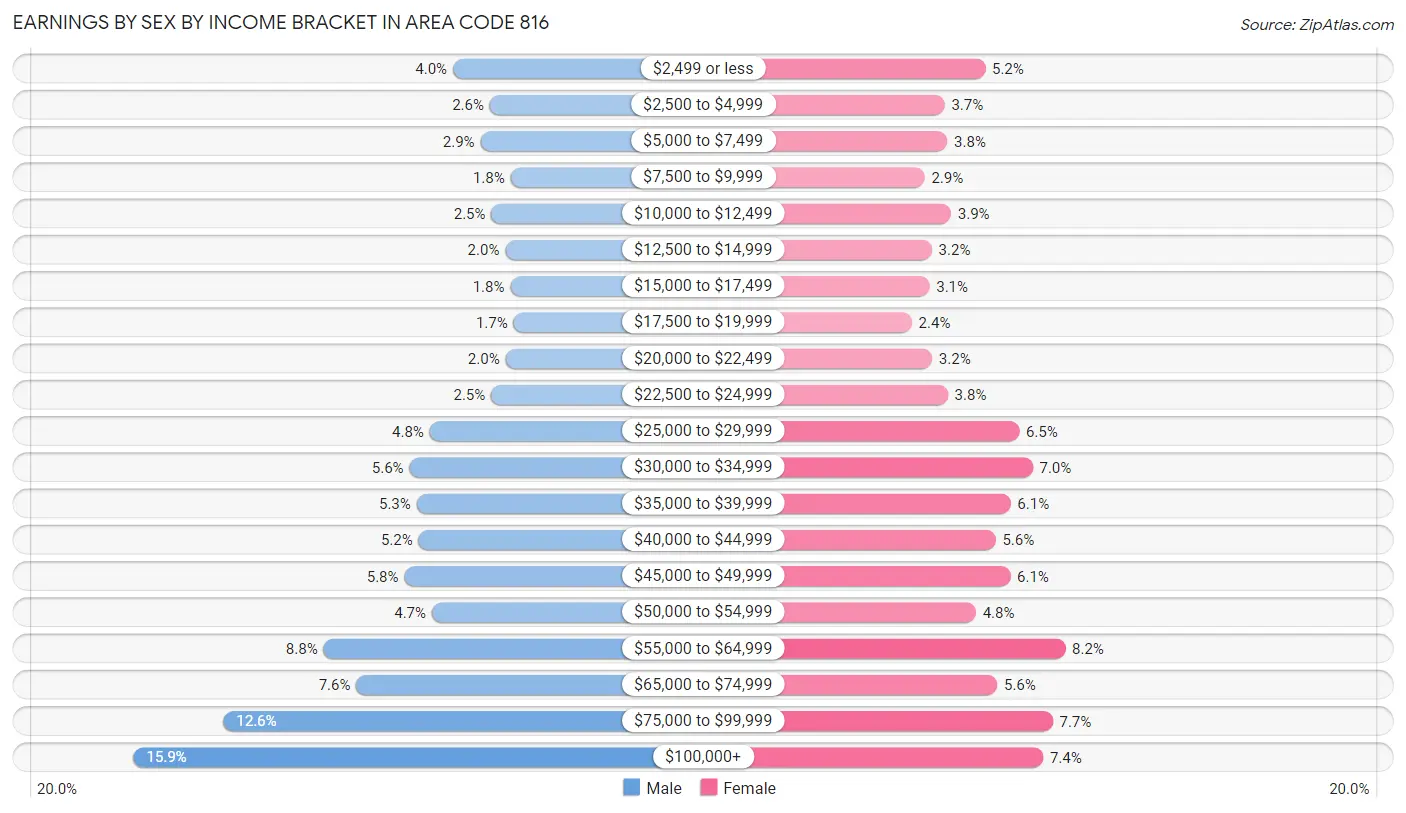
Earnings by Sex by Income Bracket in Area Code 816
The most common earnings brackets in Area Code 816 are $100,000+ for men (61,754 | 15.9%) and $55,000 to $64,999 for women (29,231 | 8.2%).
| Income | Male | Female |
| $2,499 or less | 15,319 (4.0%) | 18,518 (5.2%) |
| $2,500 to $4,999 | 9,982 (2.6%) | 13,057 (3.7%) |
| $5,000 to $7,499 | 11,342 (2.9%) | 13,415 (3.8%) |
| $7,500 to $9,999 | 6,950 (1.8%) | 10,388 (2.9%) |
| $10,000 to $12,499 | 9,724 (2.5%) | 13,945 (3.9%) |
| $12,500 to $14,999 | 7,708 (2.0%) | 11,373 (3.2%) |
| $15,000 to $17,499 | 6,977 (1.8%) | 11,037 (3.1%) |
| $17,500 to $19,999 | 6,499 (1.7%) | 8,663 (2.4%) |
| $20,000 to $22,499 | 7,664 (2.0%) | 11,397 (3.2%) |
| $22,500 to $24,999 | 9,780 (2.5%) | 13,503 (3.8%) |
| $25,000 to $29,999 | 18,681 (4.8%) | 23,040 (6.5%) |
| $30,000 to $34,999 | 21,631 (5.6%) | 24,858 (7.0%) |
| $35,000 to $39,999 | 20,601 (5.3%) | 21,889 (6.1%) |
| $40,000 to $44,999 | 20,306 (5.2%) | 19,881 (5.6%) |
| $45,000 to $49,999 | 22,379 (5.8%) | 21,850 (6.1%) |
| $50,000 to $54,999 | 18,405 (4.7%) | 17,246 (4.8%) |
| $55,000 to $64,999 | 34,128 (8.8%) | 29,231 (8.2%) |
| $65,000 to $74,999 | 29,380 (7.6%) | 20,107 (5.6%) |
| $75,000 to $99,999 | 48,673 (12.6%) | 27,556 (7.7%) |
| $100,000+ | 61,754 (15.9%) | 26,240 (7.3%) |
| Total | 387,883 (100.0%) | 357,194 (100.0%) |
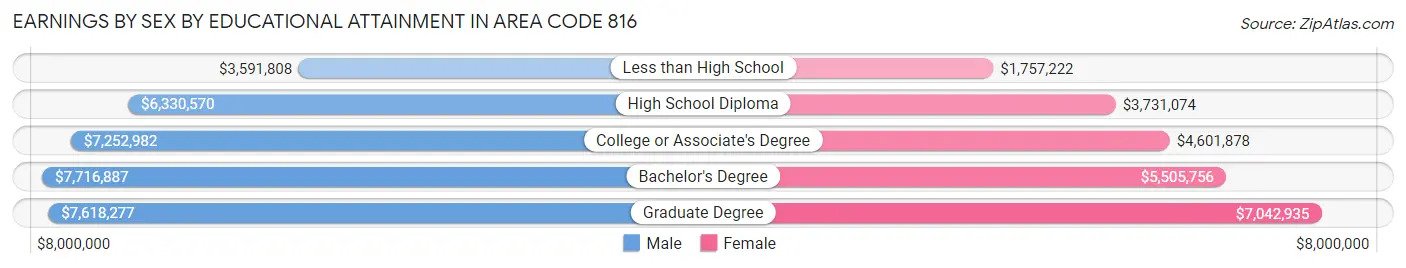
Earnings by Sex by Educational Attainment in Area Code 816
Average earnings in Area Code 816 are $7,782,686 for men and $5,544,725 for women, a difference of 28.8%. Men with an educational attainment of bachelor's degree enjoy the highest average annual earnings of $7,716,887, while those with less than high school education earn the least with $3,591,808. Women with an educational attainment of graduate degree earn the most with the average annual earnings of $7,042,935, while those with less than high school education have the smallest earnings of $1,757,222.
| Educational Attainment | Male Income | Female Income |
| Less than High School | $3,591,808 | $1,757,222 |
| High School Diploma | $6,330,570 | $3,731,074 |
| College or Associate's Degree | $7,252,982 | $4,601,878 |
| Bachelor's Degree | $7,716,887 | $5,505,756 |
| Graduate Degree | $7,618,277 | $7,042,935 |
| Total | $7,782,686 | $5,544,725 |
Family Income in Area Code 816
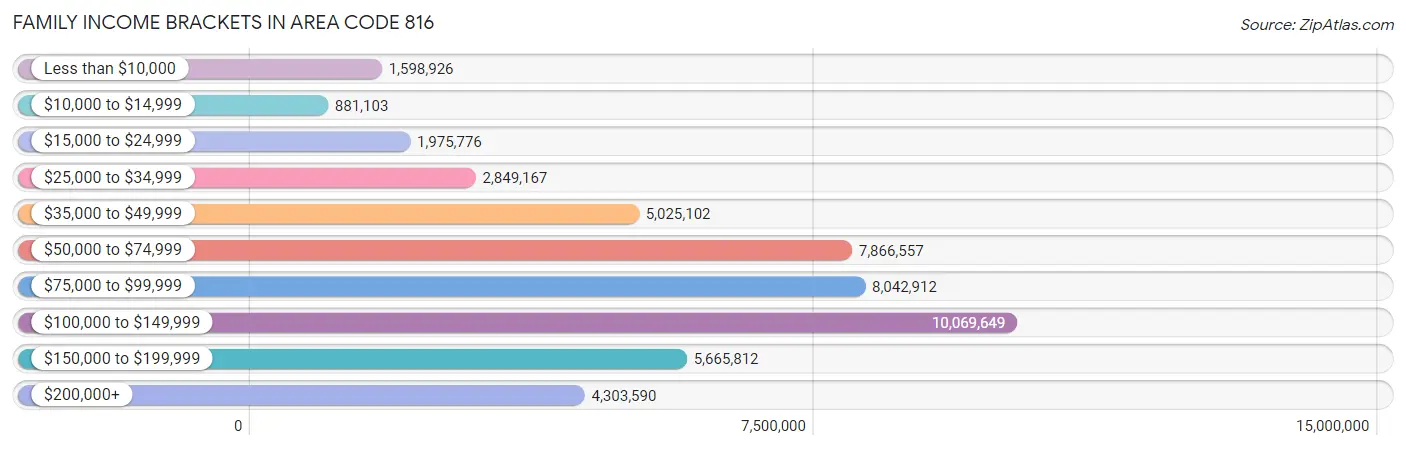
Family Income Brackets in Area Code 816
According to the Area Code 816 family income data, there are 10,069,649 families falling into the $100,000 to $149,999 income range, which is the most common income bracket and makes up 3,003.4% of all families. Conversely, the $10,000 to $14,999 income bracket is the least frequent group with only 881,103 families (262.8%) belonging to this category.
| Income Bracket | # Families | % Families |
| Less than $10,000 | 1,598,926 | 476.9% |
| $10,000 to $14,999 | 881,103 | 262.8% |
| $15,000 to $24,999 | 1,975,776 | 589.3% |
| $25,000 to $34,999 | 2,849,167 | 849.8% |
| $35,000 to $49,999 | 5,025,102 | 1,498.8% |
| $50,000 to $74,999 | 7,866,557 | 2,346.3% |
| $75,000 to $99,999 | 8,042,912 | 2,398.9% |
| $100,000 to $149,999 | 10,069,649 | 3,003.4% |
| $150,000 to $199,999 | 5,665,812 | 1,689.9% |
| $200,000+ | 4,303,590 | 1,283.6% |
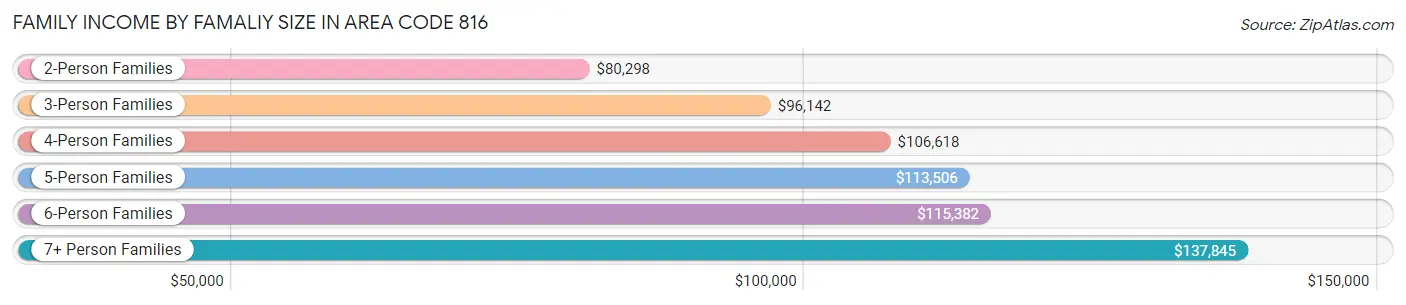
Family Income by Famaliy Size in Area Code 816
7+ person families (5,344 | 1.6%) account for the highest median family income in Area Code 816 with $137,845 per family, while 2-person families (162,016 | 48.3%) have the highest median income of $40,149 per family member.
| Income Bracket | # Families | Median Income |
| 2-Person Families | 162,016 (48.3%) | $80,298 |
| 3-Person Families | 72,021 (21.5%) | $96,142 |
| 4-Person Families | 59,328 (17.7%) | $106,618 |
| 5-Person Families | 25,887 (7.7%) | $113,506 |
| 6-Person Families | 10,679 (3.2%) | $115,382 |
| 7+ Person Families | 5,344 (1.6%) | $137,845 |
| Total | 335,275 (100.0%) | $90,650 |
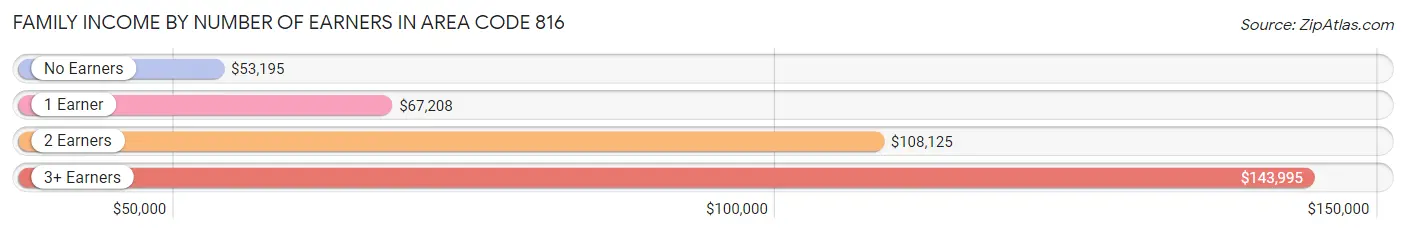
Family Income by Number of Earners in Area Code 816
The median family income in Area Code 816 is $90,650, with families comprising 3+ earners (39,059) having the highest median family income of $143,995, while families with no earners (44,892) have the lowest median family income of $53,195, accounting for 11.7% and 13.4% of families, respectively.
| Number of Earners | # Families | Median Income |
| No Earners | 44,892 (13.4%) | $53,195 |
| 1 Earner | 107,506 (32.1%) | $67,208 |
| 2 Earners | 143,818 (42.9%) | $108,125 |
| 3+ Earners | 39,059 (11.7%) | $143,995 |
| Total | 335,275 (100.0%) | $90,650 |
Household Income in Area Code 816
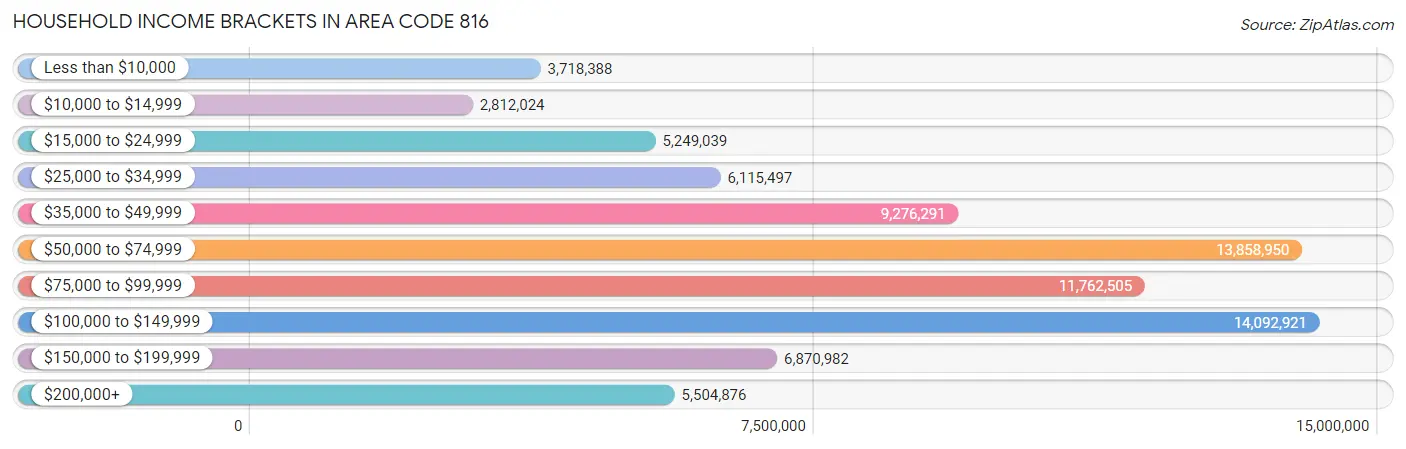
Household Income Brackets in Area Code 816
With 14,092,921 households falling in the category, the $100,000 to $149,999 income range is the most frequent in Area Code 816, accounting for 2,578.0% of all households. In contrast, only 2,812,024 households (514.4%) fall into the $10,000 to $14,999 income bracket, making it the least populous group.
| Income Bracket | # Households | % Households |
| Less than $10,000 | 3,718,388 | 680.2% |
| $10,000 to $14,999 | 2,812,024 | 514.4% |
| $15,000 to $24,999 | 5,249,039 | 960.2% |
| $25,000 to $34,999 | 6,115,497 | 1,118.7% |
| $35,000 to $49,999 | 9,276,291 | 1,696.9% |
| $50,000 to $74,999 | 13,858,950 | 2,535.2% |
| $75,000 to $99,999 | 11,762,505 | 2,151.7% |
| $100,000 to $149,999 | 14,092,921 | 2,578.0% |
| $150,000 to $199,999 | 6,870,982 | 1,256.9% |
| $200,000+ | 5,504,876 | 1,007.0% |
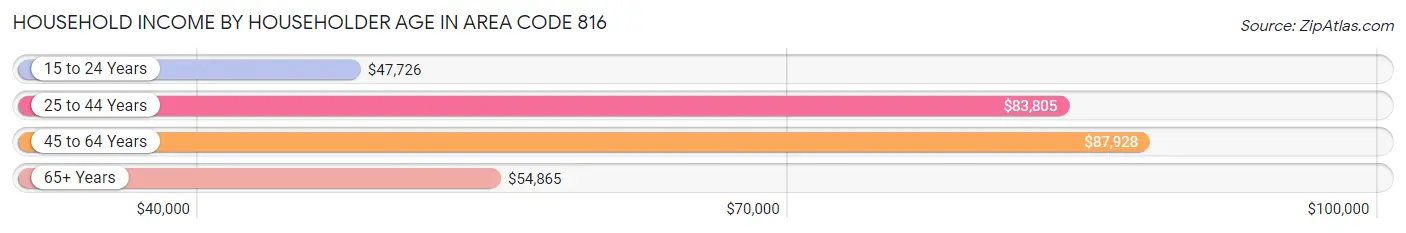
Household Income by Householder Age in Area Code 816
The median household income in Area Code 816 is $75,202, with the highest median household income of $87,928 found in the 45 to 64 years age bracket for the primary householder. A total of 196,584 households (36.0%) fall into this category. Meanwhile, the 15 to 24 years age bracket for the primary householder has the lowest median household income of $47,726, with 23,494 households (4.3%) in this group.
| Income Bracket | # Households | Median Income |
| 15 to 24 Years | 23,494 (4.3%) | $47,726 |
| 25 to 44 Years | 192,425 (35.2%) | $83,805 |
| 45 to 64 Years | 196,584 (36.0%) | $87,928 |
| 65+ Years | 134,158 (24.5%) | $54,865 |
| Total | 546,661 (100.0%) | $75,202 |
Poverty in Area Code 816
Income Below Poverty by Sex and Age in Area Code 816
With 10.5% poverty level for males and 12.9% for females among the residents of Area Code 816, 5 year old males and 18 to 24 year old females are the most vulnerable to poverty, with 1,624 males (19.7%) and 10,588 females (19.7%) in their respective age groups living below the poverty level.
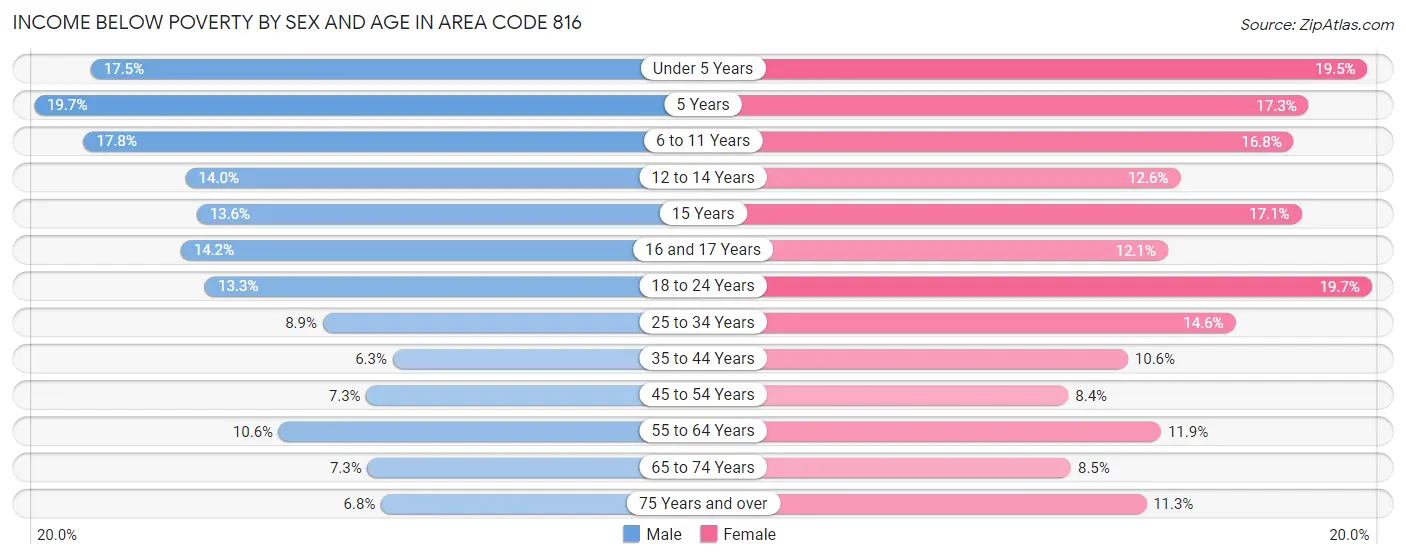
| Age Bracket | Male | Female |
| Under 5 Years | 7,293 (17.5%) | 7,733 (19.5%) |
| 5 Years | 1,624 (19.7%) | 1,424 (17.3%) |
| 6 to 11 Years | 9,569 (17.8%) | 8,412 (16.8%) |
| 12 to 14 Years | 3,765 (14.0%) | 3,407 (12.6%) |
| 15 Years | 1,202 (13.6%) | 1,492 (17.1%) |
| 16 and 17 Years | 2,606 (14.2%) | 2,149 (12.1%) |
| 18 to 24 Years | 7,243 (13.3%) | 10,588 (19.7%) |
| 25 to 34 Years | 8,540 (8.9%) | 14,117 (14.6%) |
| 35 to 44 Years | 5,554 (6.3%) | 9,420 (10.6%) |
| 45 to 54 Years | 6,011 (7.3%) | 6,902 (8.4%) |
| 55 to 64 Years | 8,909 (10.6%) | 10,474 (11.8%) |
| 65 to 74 Years | 4,163 (7.3%) | 5,647 (8.5%) |
| 75 Years and over | 2,246 (6.8%) | 5,470 (11.3%) |
| Total | 68,725 (10.5%) | 87,235 (12.9%) |
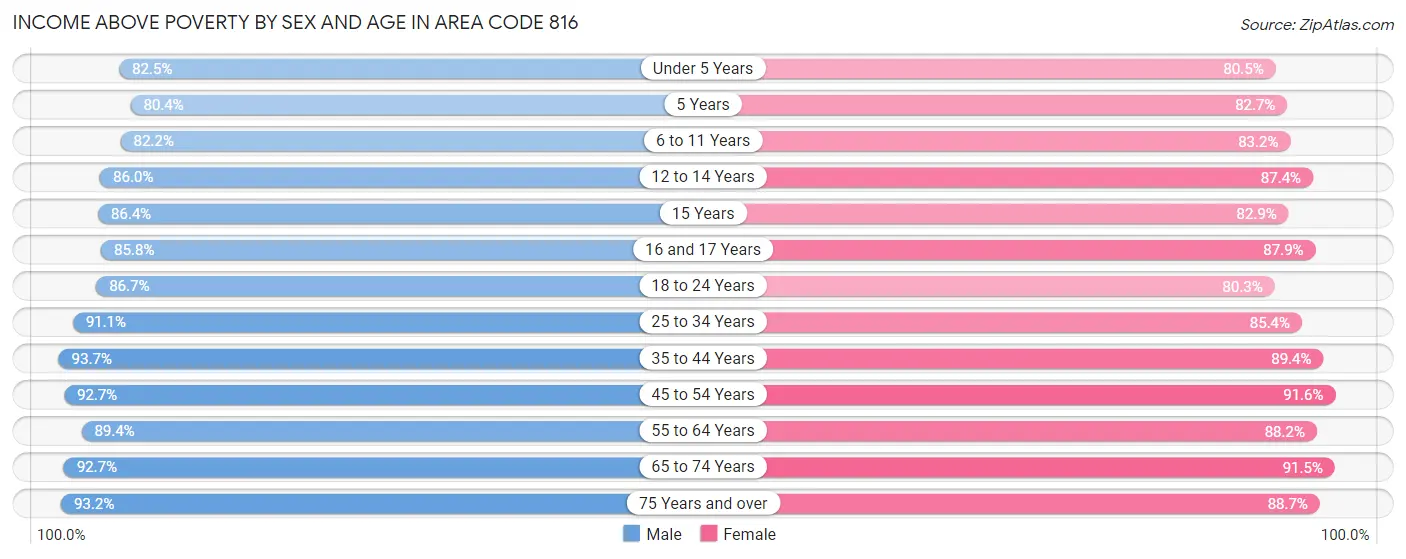
Income Above Poverty by Sex and Age in Area Code 816
According to the poverty statistics in Area Code 816, males aged 35 to 44 years and females aged 45 to 54 years are the age groups that are most secure financially, with 93.7% of males and 91.6% of females in these age groups living above the poverty line.
| Age Bracket | Male | Female |
| Under 5 Years | 34,282 (82.5%) | 31,907 (80.5%) |
| 5 Years | 6,641 (80.3%) | 6,794 (82.7%) |
| 6 to 11 Years | 44,159 (82.2%) | 41,750 (83.2%) |
| 12 to 14 Years | 23,080 (86.0%) | 23,716 (87.4%) |
| 15 Years | 7,629 (86.4%) | 7,256 (82.9%) |
| 16 and 17 Years | 15,749 (85.8%) | 15,614 (87.9%) |
| 18 to 24 Years | 47,233 (86.7%) | 43,227 (80.3%) |
| 25 to 34 Years | 87,121 (91.1%) | 82,521 (85.4%) |
| 35 to 44 Years | 82,252 (93.7%) | 79,254 (89.4%) |
| 45 to 54 Years | 76,200 (92.7%) | 75,201 (91.6%) |
| 55 to 64 Years | 75,445 (89.4%) | 77,922 (88.1%) |
| 65 to 74 Years | 53,109 (92.7%) | 60,729 (91.5%) |
| 75 Years and over | 30,962 (93.2%) | 42,938 (88.7%) |
| Total | 583,862 (89.5%) | 588,829 (87.1%) |
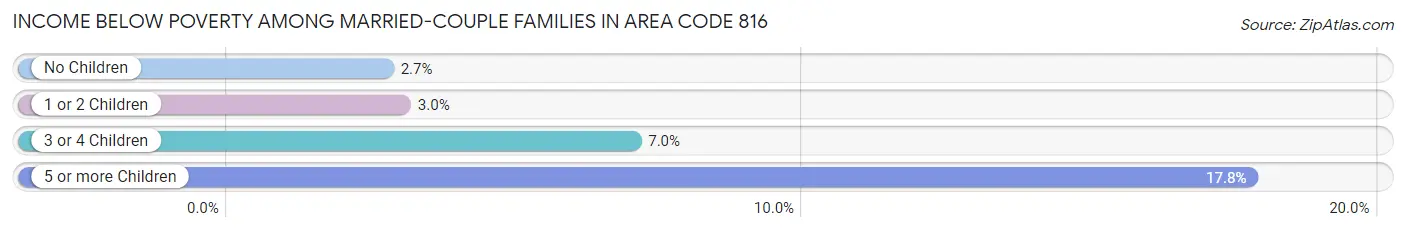
Income Below Poverty Among Married-Couple Families in Area Code 816
The poverty statistics for married-couple families in Area Code 816 show that 3.3% or 8,096 of the total 242,091 families live below the poverty line. Families with 5 or more children have the highest poverty rate of 17.8%, comprising of 410 families. On the other hand, families with no children have the lowest poverty rate of 2.7%, which includes 3,846 families.
| Children | Above Poverty | Below Poverty |
| No Children | 137,856 (97.3%) | 3,846 (2.7%) |
| 1 or 2 Children | 73,595 (97.0%) | 2,281 (3.0%) |
| 3 or 4 Children | 20,646 (93.0%) | 1,559 (7.0%) |
| 5 or more Children | 1,898 (82.2%) | 410 (17.8%) |
| Total | 233,995 (96.7%) | 8,096 (3.3%) |
Income Below Poverty Among Single-Parent Households in Area Code 816
According to the poverty data in Area Code 816, 9.8% or 2,502 single-father households and 24.1% or 16,292 single-mother households are living below the poverty line. Among single-father households, those with 5 or more children have the highest poverty rate, with 144 households (61.0%) experiencing poverty. Likewise, among single-mother households, those with 5 or more children have the highest poverty rate, with 682 households (74.4%) falling below the poverty line.
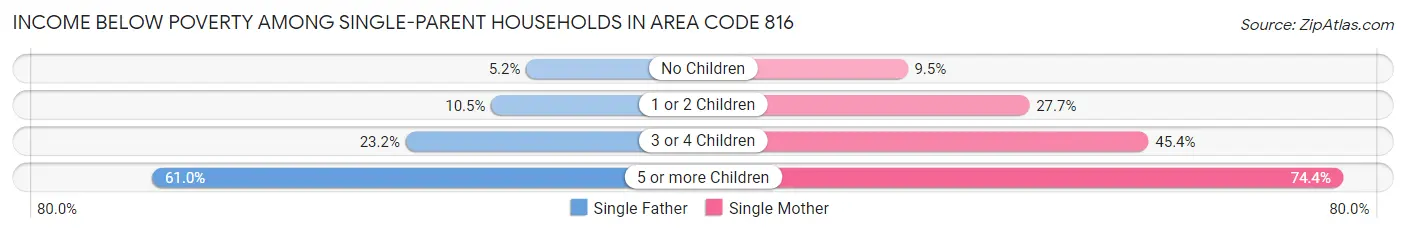
| Children | Single Father | Single Mother |
| No Children | 563 (5.2%) | 2,268 (9.5%) |
| 1 or 2 Children | 1,318 (10.5%) | 9,456 (27.7%) |
| 3 or 4 Children | 477 (23.2%) | 3,886 (45.4%) |
| 5 or more Children | 144 (61.0%) | 682 (74.4%) |
| Total | 2,502 (9.8%) | 16,292 (24.1%) |
Income Below Poverty Among Married-Couple vs Single-Parent Households in Area Code 816
The poverty data for Area Code 816 shows that 8,096 of the married-couple family households (3.3%) and 18,794 of the single-parent households (20.2%) are living below the poverty level. Within the married-couple family households, those with 5 or more children have the highest poverty rate, with 410 households (17.8%) falling below the poverty line. Among the single-parent households, those with 5 or more children have the highest poverty rate, with 826 household (71.6%) living below poverty.
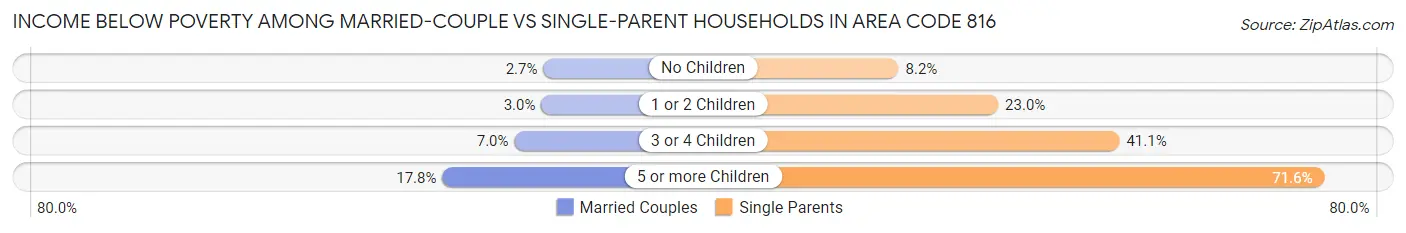
| Children | Married-Couple Families | Single-Parent Households |
| No Children | 3,846 (2.7%) | 2,831 (8.2%) |
| 1 or 2 Children | 2,281 (3.0%) | 10,774 (23.0%) |
| 3 or 4 Children | 1,559 (7.0%) | 4,363 (41.1%) |
| 5 or more Children | 410 (17.8%) | 826 (71.6%) |
| Total | 8,096 (3.3%) | 18,794 (20.2%) |
Race in Area Code 816
The most populous races in Area Code 816 are White / Caucasian (999,686 | 73.9%), Black / African American (196,944 | 14.6%), and Hispanic or Latino (107,077 | 7.9%).
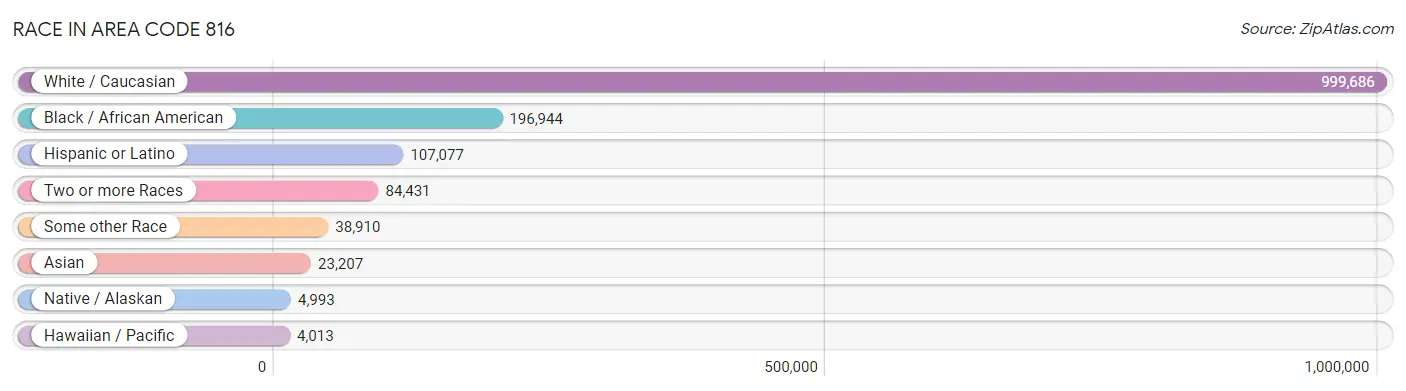
| Race | # Population | % Population |
| Asian | 23,207 | 1.7% |
| Black / African American | 196,944 | 14.6% |
| Hawaiian / Pacific | 4,013 | 0.3% |
| Hispanic or Latino | 107,077 | 7.9% |
| Native / Alaskan | 4,993 | 0.4% |
| White / Caucasian | 999,686 | 73.9% |
| Two or more Races | 84,431 | 6.2% |
| Some other Race | 38,910 | 2.9% |
| Total | 1,352,184 | 100.0% |
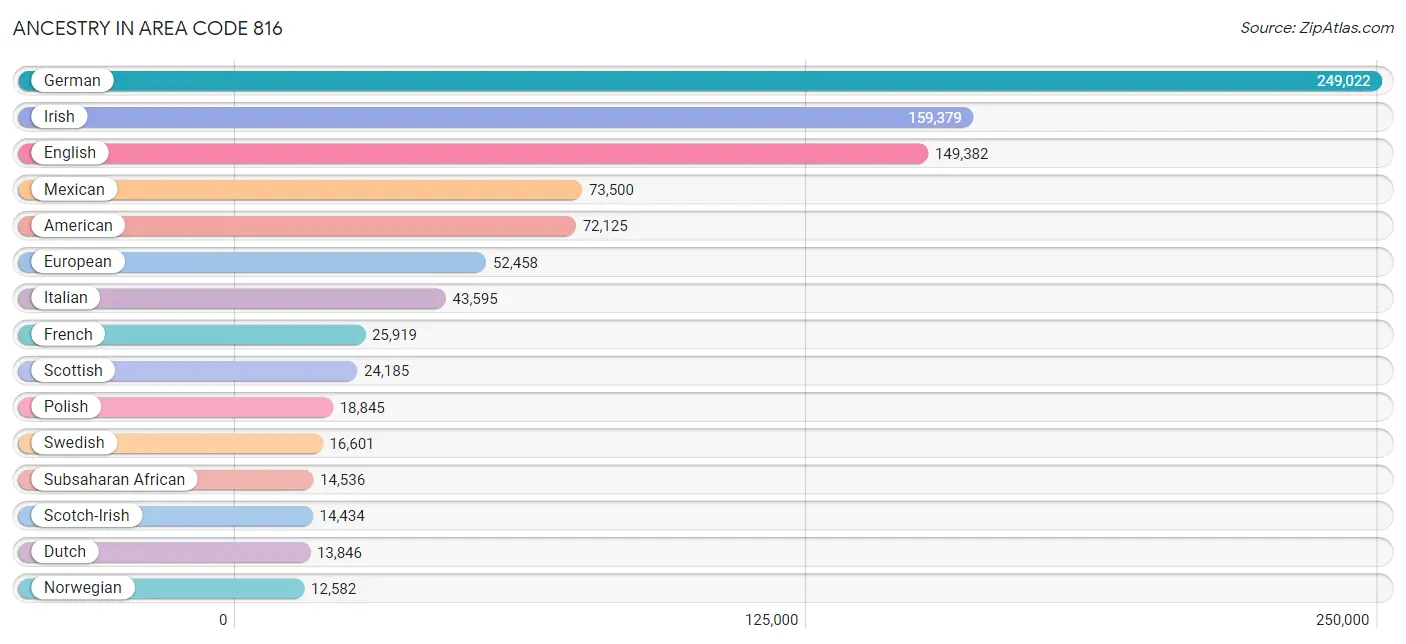
Ancestry in Area Code 816
The most populous ancestries reported in Area Code 816 are German (249,022 | 18.4%), Irish (159,379 | 11.8%), English (149,382 | 11.1%), Mexican (73,500 | 5.4%), and American (72,125 | 5.3%), together accounting for 52.0% of all Area Code 816 residents.
| Ancestry | # Population | % Population |
| Afghan | 272 | 0.0% |
| African | 7,978 | 0.6% |
| Alaska Native | 43 | 0.0% |
| Albanian | 30 | 0.0% |
| Aleut | 8 | 0.0% |
| Alsatian | 19 | 0.0% |
| American | 72,125 | 5.3% |
| Apache | 263 | 0.0% |
| Arab | 7,906 | 0.6% |
| Argentinean | 152 | 0.0% |
| Armenian | 332 | 0.0% |
| Assyrian / Chaldean / Syriac | 10 | 0.0% |
| Australian | 331 | 0.0% |
| Austrian | 1,702 | 0.1% |
| Bahamian | 155 | 0.0% |
| Bangladeshi | 72 | 0.0% |
| Barbadian | 20 | 0.0% |
| Basque | 10 | 0.0% |
| Belgian | 2,021 | 0.2% |
| Belizean | 25 | 0.0% |
| Bhutanese | 2,997 | 0.2% |
| Blackfeet | 1,436 | 0.1% |
| Bolivian | 181 | 0.0% |
| Brazilian | 262 | 0.0% |
| British | 7,661 | 0.6% |
| British West Indian | 21 | 0.0% |
| Bulgarian | 131 | 0.0% |
| Burmese | 3,062 | 0.2% |
| Cajun | 63 | 0.0% |
| Cambodian | 36 | 0.0% |
| Canadian | 1,360 | 0.1% |
| Cape Verdean | 4 | 0.0% |
| Celtic | 49 | 0.0% |
| Central American | 11,738 | 0.9% |
| Central American Indian | 776 | 0.1% |
| Cherokee | 6,621 | 0.5% |
| Cheyenne | 84 | 0.0% |
| Chickasaw | 223 | 0.0% |
| Chilean | 236 | 0.0% |
| Chinese | 88 | 0.0% |
| Chippewa | 333 | 0.0% |
| Choctaw | 1,190 | 0.1% |
| Colombian | 1,931 | 0.1% |
| Colville | 12 | 0.0% |
| Comanche | 87 | 0.0% |
| Costa Rican | 141 | 0.0% |
| Cree | 43 | 0.0% |
| Creek | 354 | 0.0% |
| Croatian | 2,386 | 0.2% |
| Crow | 173 | 0.0% |
| Cuban | 3,811 | 0.3% |
| Cypriot | 2 | 0.0% |
| Czech | 5,212 | 0.4% |
| Czechoslovakian | 1,112 | 0.1% |
| Danish | 4,337 | 0.3% |
| Delaware | 64 | 0.0% |
| Dominican | 755 | 0.1% |
| Dutch | 13,846 | 1.0% |
| Dutch West Indian | 287 | 0.0% |
| Eastern European | 2,411 | 0.2% |
| Ecuadorian | 259 | 0.0% |
| Egyptian | 803 | 0.1% |
| English | 149,382 | 11.1% |
| Estonian | 11 | 0.0% |
| Ethiopian | 1,156 | 0.1% |
| European | 52,458 | 3.9% |
| Fijian | 39 | 0.0% |
| Filipino | 166 | 0.0% |
| Finnish | 1,126 | 0.1% |
| French | 25,919 | 1.9% |
| French American Indian | 92 | 0.0% |
| French Canadian | 2,757 | 0.2% |
| German | 249,022 | 18.4% |
| German Russian | 257 | 0.0% |
| Ghanaian | 251 | 0.0% |
| Greek | 2,886 | 0.2% |
| Guamanian / Chamorro | 560 | 0.0% |
| Guatemalan | 2,938 | 0.2% |
| Guyanese | 64 | 0.0% |
| Haitian | 1,264 | 0.1% |
| Honduran | 3,605 | 0.3% |
| Hopi | 7 | 0.0% |
| Hungarian | 1,629 | 0.1% |
| Icelander | 184 | 0.0% |
| Indian (Asian) | 4,977 | 0.4% |
| Indonesian | 614 | 0.1% |
| Inupiat | 10 | 0.0% |
| Iranian | 484 | 0.0% |
| Iraqi | 1,276 | 0.1% |
| Irish | 159,379 | 11.8% |
| Iroquois | 203 | 0.0% |
| Israeli | 80 | 0.0% |
| Italian | 43,595 | 3.2% |
| Jamaican | 1,289 | 0.1% |
| Japanese | 699 | 0.1% |
| Jordanian | 214 | 0.0% |
| Kenyan | 569 | 0.0% |
| Kiowa | 3 | 0.0% |
| Korean | 6,354 | 0.5% |
| Laotian | 191 | 0.0% |
| Latvian | 113 | 0.0% |
| Lebanese | 1,075 | 0.1% |
| Liberian | 175 | 0.0% |
| Lithuanian | 979 | 0.1% |
| Lumbee | 24 | 0.0% |
| Luxembourger | 436 | 0.0% |
| Macedonian | 7 | 0.0% |
| Malaysian | 376 | 0.0% |
| Maltese | 40 | 0.0% |
| Marshallese | 20 | 0.0% |
| Mexican | 73,500 | 5.4% |
| Mexican American Indian | 1,062 | 0.1% |
| Mongolian | 181 | 0.0% |
| Moroccan | 480 | 0.0% |
| Native Hawaiian | 1,628 | 0.1% |
| Navajo | 258 | 0.0% |
| New Zealander | 69 | 0.0% |
| Nicaraguan | 221 | 0.0% |
| Nigerian | 1,848 | 0.1% |
| Northern European | 1,647 | 0.1% |
| Norwegian | 12,582 | 0.9% |
| Osage | 199 | 0.0% |
| Ottawa | 98 | 0.0% |
| Paiute | 111 | 0.0% |
| Pakistani | 906 | 0.1% |
| Palestinian | 1,028 | 0.1% |
| Panamanian | 391 | 0.0% |
| Pennsylvania German | 358 | 0.0% |
| Peruvian | 420 | 0.0% |
| Pima | 27 | 0.0% |
| Polish | 18,845 | 1.4% |
| Portuguese | 1,352 | 0.1% |
| Potawatomi | 275 | 0.0% |
| Pueblo | 48 | 0.0% |
| Puerto Rican | 6,235 | 0.5% |
| Puget Sound Salish | 23 | 0.0% |
| Romanian | 324 | 0.0% |
| Russian | 4,006 | 0.3% |
| Salvadoran | 4,373 | 0.3% |
| Samoan | 2,359 | 0.2% |
| Scandinavian | 4,646 | 0.3% |
| Scotch-Irish | 14,434 | 1.1% |
| Scottish | 24,185 | 1.8% |
| Seminole | 216 | 0.0% |
| Senegalese | 8 | 0.0% |
| Serbian | 264 | 0.0% |
| Shoshone | 102 | 0.0% |
| Sierra Leonean | 167 | 0.0% |
| Sioux | 768 | 0.1% |
| Slavic | 368 | 0.0% |
| Slovak | 847 | 0.1% |
| Slovene | 196 | 0.0% |
| Somali | 757 | 0.1% |
| South African | 125 | 0.0% |
| South American | 3,896 | 0.3% |
| South American Indian | 30 | 0.0% |
| Spaniard | 1,750 | 0.1% |
| Spanish | 2,497 | 0.2% |
| Spanish American | 23 | 0.0% |
| Sri Lankan | 5,805 | 0.4% |
| Subsaharan African | 14,536 | 1.1% |
| Sudanese | 203 | 0.0% |
| Swedish | 16,601 | 1.2% |
| Swiss | 3,880 | 0.3% |
| Syrian | 647 | 0.1% |
| Thai | 6,113 | 0.4% |
| Tlingit-Haida | 6 | 0.0% |
| Tongan | 19 | 0.0% |
| Trinidadian and Tobagonian | 214 | 0.0% |
| Turkish | 503 | 0.0% |
| U.S. Virgin Islander | 9 | 0.0% |
| Ugandan | 308 | 0.0% |
| Ukrainian | 1,287 | 0.1% |
| Uruguayan | 60 | 0.0% |
| Ute | 5 | 0.0% |
| Venezuelan | 645 | 0.1% |
| Vietnamese | 232 | 0.0% |
| Welsh | 9,412 | 0.7% |
| West Indian | 171 | 0.0% |
| Yaqui | 11 | 0.0% |
| Yugoslavian | 598 | 0.0% |
| Zimbabwean | 21 | 0.0% | View All 182 Rows |
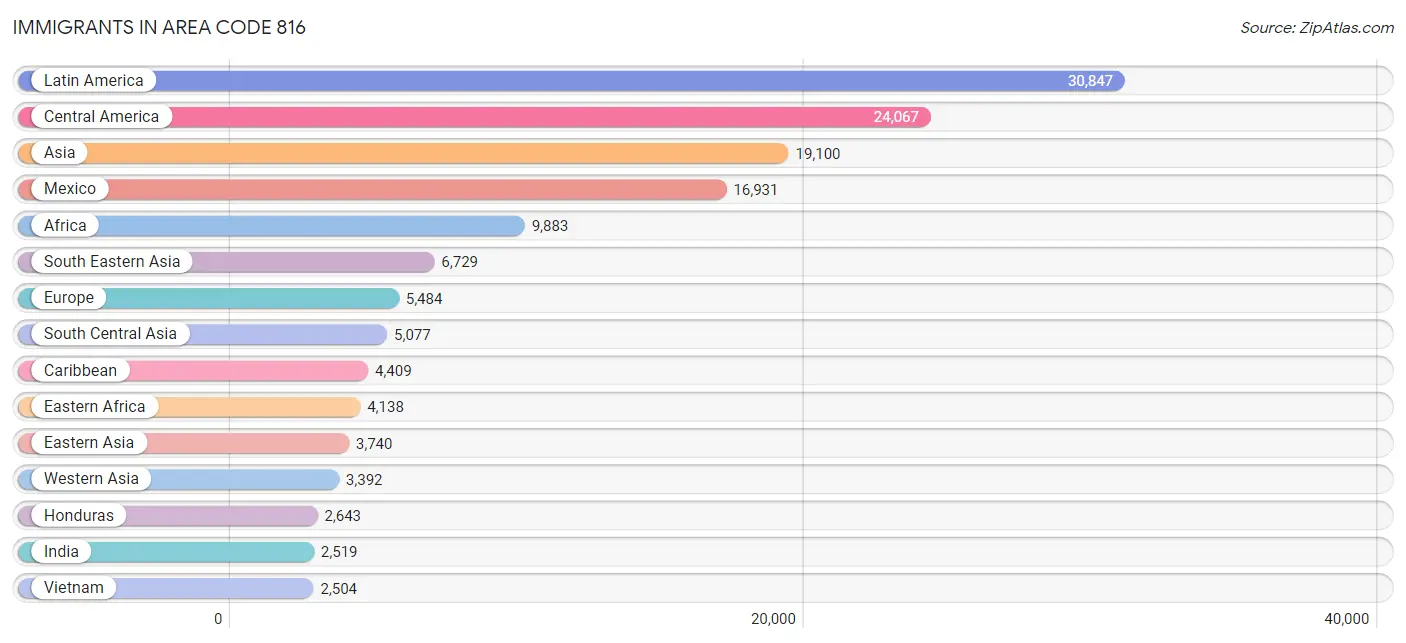
Immigrants in Area Code 816
The most numerous immigrant groups reported in Area Code 816 came from Latin America (30,847 | 2.3%), Central America (24,067 | 1.8%), Asia (19,100 | 1.4%), Mexico (16,931 | 1.3%), and Africa (9,883 | 0.7%), together accounting for 7.4% of all Area Code 816 residents.
| Immigration Origin | # Population | % Population |
| Afghanistan | 213 | 0.0% |
| Africa | 9,883 | 0.7% |
| Albania | 9 | 0.0% |
| Argentina | 129 | 0.0% |
| Asia | 19,100 | 1.4% |
| Australia | 303 | 0.0% |
| Austria | 51 | 0.0% |
| Bahamas | 75 | 0.0% |
| Bangladesh | 671 | 0.1% |
| Barbados | 21 | 0.0% |
| Belarus | 37 | 0.0% |
| Belgium | 10 | 0.0% |
| Belize | 22 | 0.0% |
| Bolivia | 151 | 0.0% |
| Bosnia and Herzegovina | 449 | 0.0% |
| Brazil | 223 | 0.0% |
| Bulgaria | 99 | 0.0% |
| Cambodia | 260 | 0.0% |
| Cameroon | 200 | 0.0% |
| Canada | 1,140 | 0.1% |
| Caribbean | 4,409 | 0.3% |
| Central America | 24,067 | 1.8% |
| Chile | 134 | 0.0% |
| China | 2,244 | 0.2% |
| Colombia | 718 | 0.1% |
| Congo | 332 | 0.0% |
| Costa Rica | 91 | 0.0% |
| Croatia | 42 | 0.0% |
| Cuba | 2,113 | 0.2% |
| Czechoslovakia | 97 | 0.0% |
| Denmark | 19 | 0.0% |
| Dominican Republic | 564 | 0.0% |
| Eastern Africa | 4,138 | 0.3% |
| Eastern Asia | 3,740 | 0.3% |
| Eastern Europe | 1,816 | 0.1% |
| Ecuador | 99 | 0.0% |
| Egypt | 472 | 0.0% |
| El Salvador | 2,078 | 0.2% |
| England | 559 | 0.0% |
| Eritrea | 153 | 0.0% |
| Ethiopia | 1,151 | 0.1% |
| Europe | 5,484 | 0.4% |
| Fiji | 38 | 0.0% |
| France | 100 | 0.0% |
| Germany | 1,211 | 0.1% |
| Ghana | 170 | 0.0% |
| Greece | 100 | 0.0% |
| Guatemala | 2,072 | 0.2% |
| Guyana | 84 | 0.0% |
| Haiti | 476 | 0.0% |
| Honduras | 2,643 | 0.2% |
| Hong Kong | 179 | 0.0% |
| Hungary | 24 | 0.0% |
| India | 2,519 | 0.2% |
| Indonesia | 69 | 0.0% |
| Iran | 397 | 0.0% |
| Iraq | 1,621 | 0.1% |
| Ireland | 147 | 0.0% |
| Israel | 76 | 0.0% |
| Italy | 451 | 0.0% |
| Jamaica | 850 | 0.1% |
| Japan | 338 | 0.0% |
| Jordan | 540 | 0.0% |
| Kazakhstan | 44 | 0.0% |
| Kenya | 1,287 | 0.1% |
| Korea | 1,128 | 0.1% |
| Kuwait | 140 | 0.0% |
| Laos | 164 | 0.0% |
| Latin America | 30,847 | 2.3% |
| Latvia | 22 | 0.0% |
| Lebanon | 45 | 0.0% |
| Liberia | 361 | 0.0% |
| Lithuania | 18 | 0.0% |
| Malaysia | 214 | 0.0% |
| Mexico | 16,931 | 1.3% |
| Micronesia | 595 | 0.0% |
| Middle Africa | 1,087 | 0.1% |
| Moldova | 46 | 0.0% |
| Morocco | 274 | 0.0% |
| Nepal | 160 | 0.0% |
| Netherlands | 72 | 0.0% |
| Nicaragua | 146 | 0.0% |
| Nigeria | 1,187 | 0.1% |
| North Macedonia | 4 | 0.0% |
| Northern Africa | 1,365 | 0.1% |
| Northern Europe | 1,385 | 0.1% |
| Oceania | 1,463 | 0.1% |
| Pakistan | 888 | 0.1% |
| Panama | 43 | 0.0% |
| Peru | 299 | 0.0% |
| Philippines | 2,422 | 0.2% |
| Poland | 227 | 0.0% |
| Portugal | 58 | 0.0% |
| Romania | 81 | 0.0% |
| Russia | 298 | 0.0% |
| Saudi Arabia | 114 | 0.0% |
| Scotland | 115 | 0.0% |
| Senegal | 30 | 0.0% |
| Serbia | 50 | 0.0% |
| Sierra Leone | 180 | 0.0% |
| Somalia | 794 | 0.1% |
| South Africa | 236 | 0.0% |
| South America | 2,371 | 0.2% |
| South Central Asia | 5,077 | 0.4% |
| South Eastern Asia | 6,729 | 0.5% |
| Southern Europe | 816 | 0.1% |
| Spain | 207 | 0.0% |
| Sri Lanka | 89 | 0.0% |
| Sudan | 494 | 0.0% |
| Sweden | 34 | 0.0% |
| Switzerland | 23 | 0.0% |
| Syria | 312 | 0.0% |
| Taiwan | 316 | 0.0% |
| Thailand | 667 | 0.1% |
| Trinidad and Tobago | 267 | 0.0% |
| Turkey | 282 | 0.0% |
| Uganda | 116 | 0.0% |
| Ukraine | 193 | 0.0% |
| Uruguay | 53 | 0.0% |
| Uzbekistan | 20 | 0.0% |
| Venezuela | 477 | 0.0% |
| Vietnam | 2,504 | 0.2% |
| West Indies | 6 | 0.0% |
| Western Africa | 1,963 | 0.2% |
| Western Asia | 3,392 | 0.3% |
| Western Europe | 1,467 | 0.1% |
| Yemen | 71 | 0.0% |
| Zaire | 555 | 0.0% |
| Zimbabwe | 101 | 0.0% | View All 129 Rows |
Sex and Age in Area Code 816
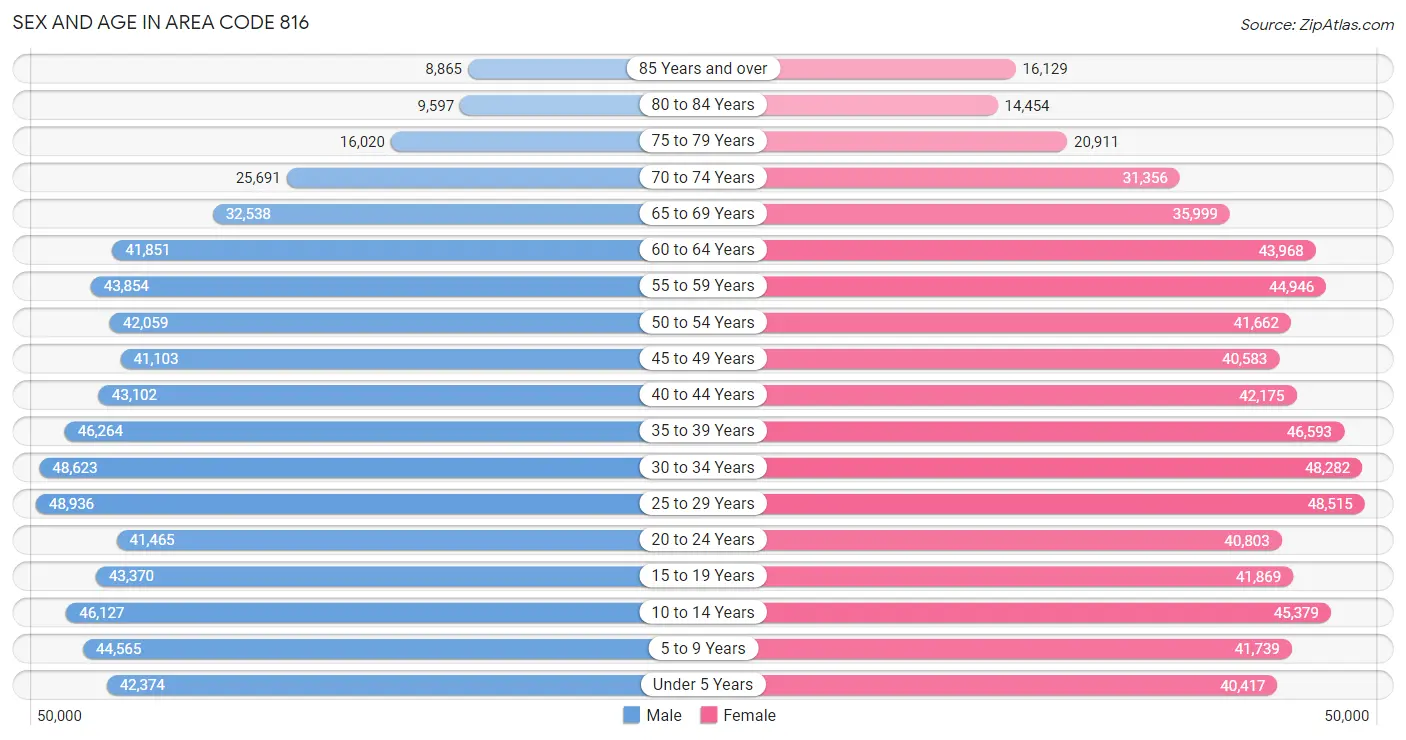
Sex and Age in Area Code 816
The most populous age groups in Area Code 816 are 25 to 29 Years (48,936 | 7.3%) for men and 25 to 29 Years (48,515 | 7.1%) for women.
| Age Bracket | Male | Female |
| Under 5 Years | 42,374 (6.4%) | 40,417 (5.9%) |
| 5 to 9 Years | 44,565 (6.7%) | 41,739 (6.1%) |
| 10 to 14 Years | 46,127 (6.9%) | 45,379 (6.6%) |
| 15 to 19 Years | 43,370 (6.5%) | 41,869 (6.1%) |
| 20 to 24 Years | 41,465 (6.2%) | 40,803 (5.9%) |
| 25 to 29 Years | 48,936 (7.3%) | 48,515 (7.1%) |
| 30 to 34 Years | 48,623 (7.3%) | 48,282 (7.0%) |
| 35 to 39 Years | 46,264 (6.9%) | 46,593 (6.8%) |
| 40 to 44 Years | 43,102 (6.5%) | 42,175 (6.1%) |
| 45 to 49 Years | 41,103 (6.2%) | 40,583 (5.9%) |
| 50 to 54 Years | 42,059 (6.3%) | 41,662 (6.1%) |
| 55 to 59 Years | 43,854 (6.6%) | 44,946 (6.6%) |
| 60 to 64 Years | 41,851 (6.3%) | 43,968 (6.4%) |
| 65 to 69 Years | 32,538 (4.9%) | 35,999 (5.2%) |
| 70 to 74 Years | 25,691 (3.9%) | 31,356 (4.6%) |
| 75 to 79 Years | 16,020 (2.4%) | 20,911 (3.0%) |
| 80 to 84 Years | 9,597 (1.4%) | 14,454 (2.1%) |
| 85 Years and over | 8,865 (1.3%) | 16,129 (2.4%) |
| Total | 666,404 (100.0%) | 685,780 (100.0%) |
Families and Households in Area Code 816
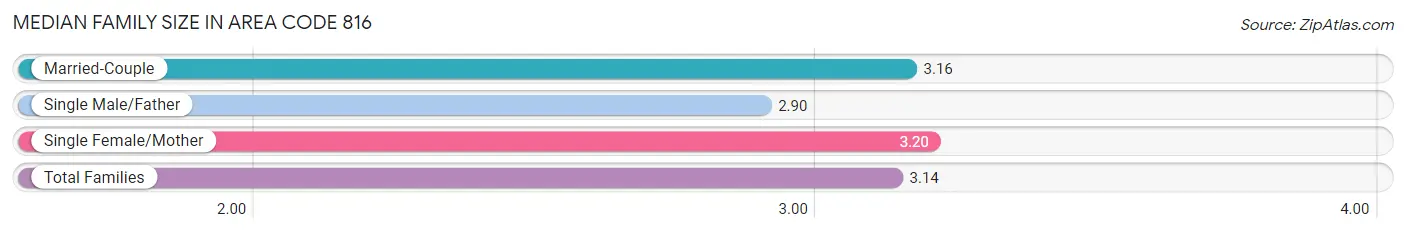
Median Family Size in Area Code 816
The median family size in Area Code 816 is 3.14 persons per family, with single female/mother families (67,547 | 20.2%) accounting for the largest median family size of 3.20437 persons per family. On the other hand, single male/father families (25,637 | 7.6%) represent the smallest median family size with 2.90 persons per family.
| Family Type | # Families | Family Size |
| Married-Couple | 242,091 (72.2%) | 3.16 |
| Single Male/Father | 25,637 (7.6%) | 2.90 |
| Single Female/Mother | 67,547 (20.2%) | 3.20 |
| Total Families | 335,275 (100.0%) | 3.14 |
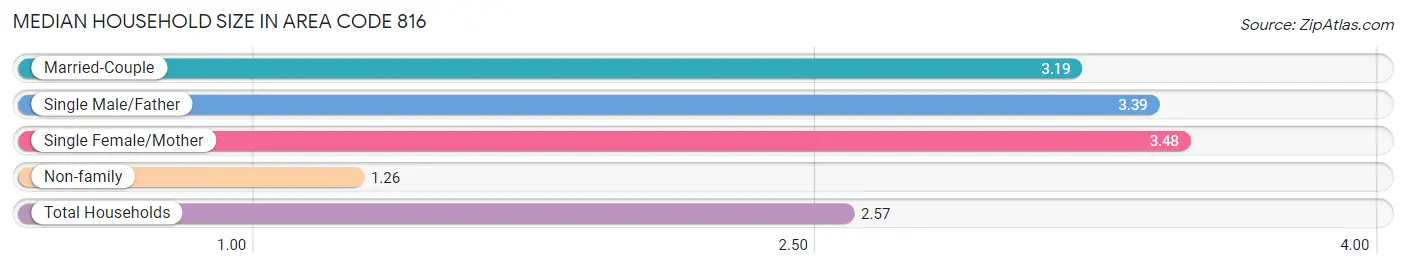
Median Household Size in Area Code 816
The median household size in Area Code 816 is 2.57 persons per household, with single female/mother households (67,547 | 12.4%) accounting for the largest median household size of 3.47569 persons per household. non-family households (211,386 | 38.7%) represent the smallest median household size with 1.26 persons per household.
| Household Type | # Households | Household Size |
| Married-Couple | 242,091 (44.3%) | 3.19 |
| Single Male/Father | 25,637 (4.7%) | 3.39 |
| Single Female/Mother | 67,547 (12.4%) | 3.48 |
| Non-family | 211,386 (38.7%) | 1.26 |
| Total Households | 546,661 (100.0%) | 2.57 |
Household Size by Marriage Status in Area Code 816
Out of a total of 546,661 households in Area Code 816, 335,275 (61.3%) are family households, while 211,386 (38.7%) are nonfamily households. The most numerous type of family households are 2-person households, comprising 150,907, and the most common type of nonfamily households are 1-person households, comprising 171,597.
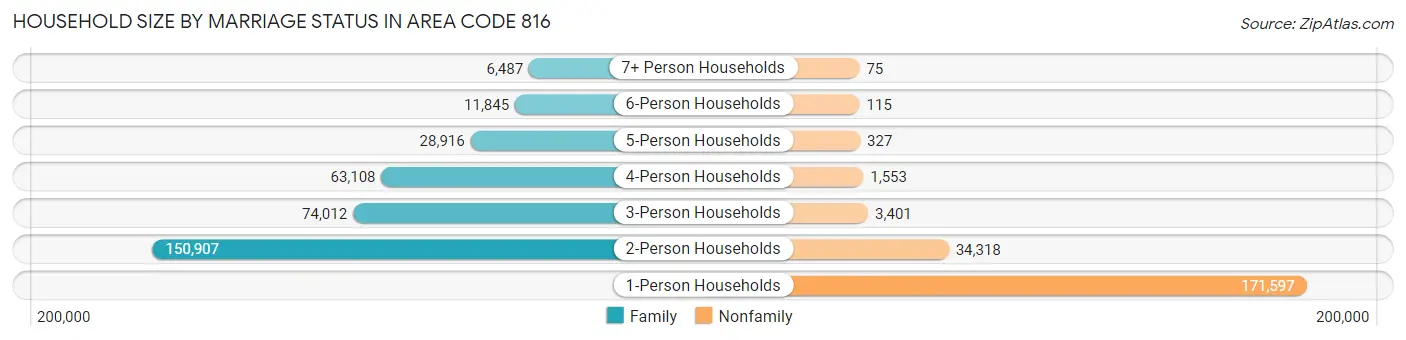
| Household Size | Family Households | Nonfamily Households |
| 1-Person Households | - | 171,597 (31.4%) |
| 2-Person Households | 150,907 (27.6%) | 34,318 (6.3%) |
| 3-Person Households | 74,012 (13.5%) | 3,401 (0.6%) |
| 4-Person Households | 63,108 (11.5%) | 1,553 (0.3%) |
| 5-Person Households | 28,916 (5.3%) | 327 (0.1%) |
| 6-Person Households | 11,845 (2.2%) | 115 (0.0%) |
| 7+ Person Households | 6,487 (1.2%) | 75 (0.0%) |
| Total | 335,275 (61.3%) | 211,386 (38.7%) |
Female Fertility in Area Code 816
Fertility by Age in Area Code 816
Average fertility rate in Area Code 816 is 68.9 births per 1,000 women. Women in the age bracket of 20 to 34 years have the highest fertility rate with 125.4 births per 1,000 women. Women in the age bracket of 20 to 34 years acount for 75.3% of all women with births.
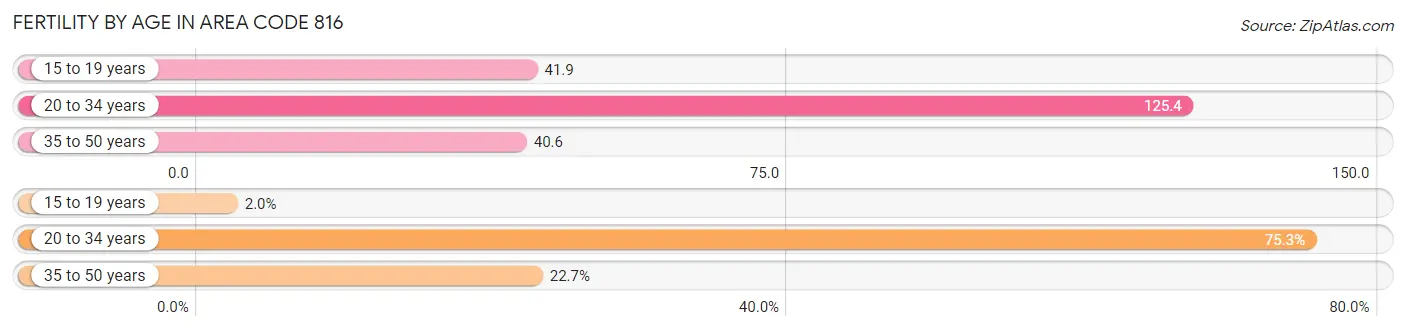
| Age Bracket | Women with Births | Births / 1,000 Women |
| 15 to 19 years | 336 (2.0%) | 41.9 |
| 20 to 34 years | 12,536 (75.3%) | 125.4 |
| 35 to 50 years | 3,784 (22.7%) | 40.6 |
| Total | 16,656 (100.0%) | 68.9 |
Fertility by Age by Marriage Status in Area Code 816
61.5% of women with births (16,656) in Area Code 816 are married. The highest percentage of unmarried women with births falls into 15 to 19 years age bracket with 96.1% of them unmarried at the time of birth, while the lowest percentage of unmarried women with births belong to 20 to 34 years age bracket with 44.8% of them unmarried.
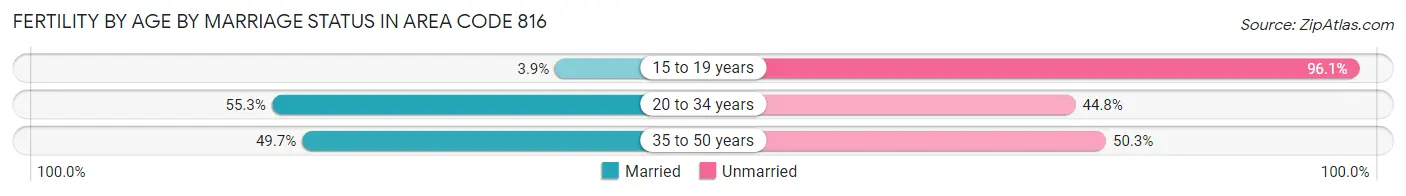
| Age Bracket | Married | Unmarried |
| 15 to 19 years | 13 (3.9%) | 323 (96.1%) |
| 20 to 34 years | 6,926 (55.2%) | 5,610 (44.8%) |
| 35 to 50 years | 1,882 (49.7%) | 1,902 (50.3%) |
| Total | 10,237 (61.5%) | 6,419 (38.5%) |
Fertility by Education in Area Code 816
Average fertility rate in Area Code 816 is 68.9 births per 1,000 women. Women with the education attainment of bachelor's degree have the highest fertility rate of 113.5 births per 1,000 women, while women with the education attainment of less than high school have the lowest fertility at 70.3 births per 1,000 women. Women with the education attainment of college or associate's degree represent 31.9% of all women with births.
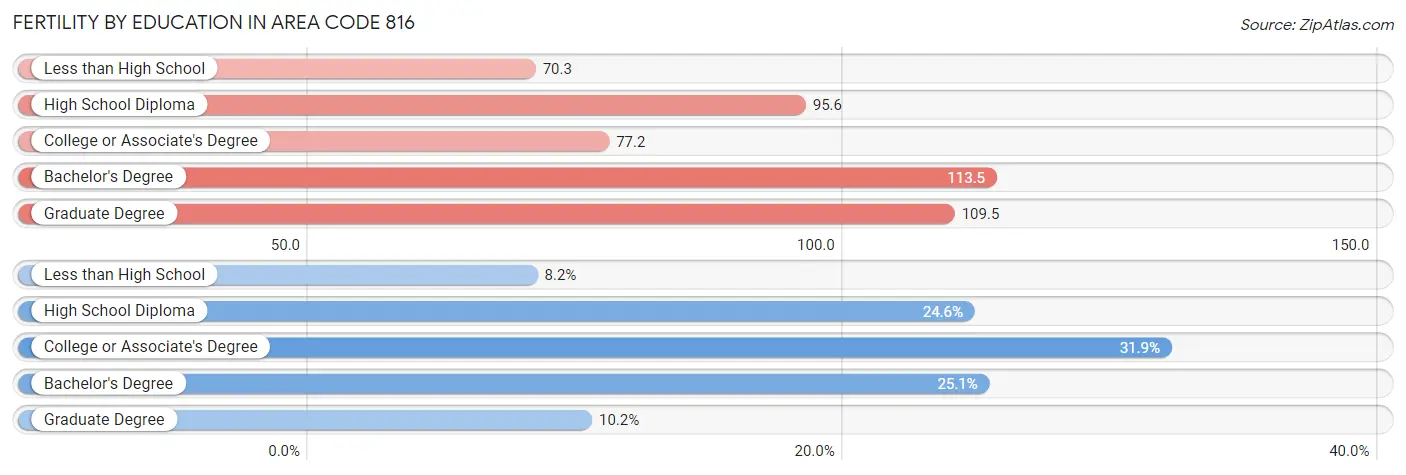
| Educational Attainment | Women with Births | Births / 1,000 Women |
| Less than High School | 1,362 (8.2%) | 70.3 |
| High School Diploma | 4,090 (24.6%) | 95.6 |
| College or Associate's Degree | 5,320 (31.9%) | 77.2 |
| Bachelor's Degree | 4,182 (25.1%) | 113.5 |
| Graduate Degree | 1,702 (10.2%) | 109.5 |
| Total | 16,656 (100.0%) | 68.9 |
Fertility by Education by Marriage Status in Area Code 816
38.5% of women with births in Area Code 816 are unmarried. Women with the educational attainment of graduate degree are most likely to be married with 54.5% of them married at childbirth, while women with the educational attainment of less than high school are least likely to be married with 73.2% of them unmarried at childbirth.
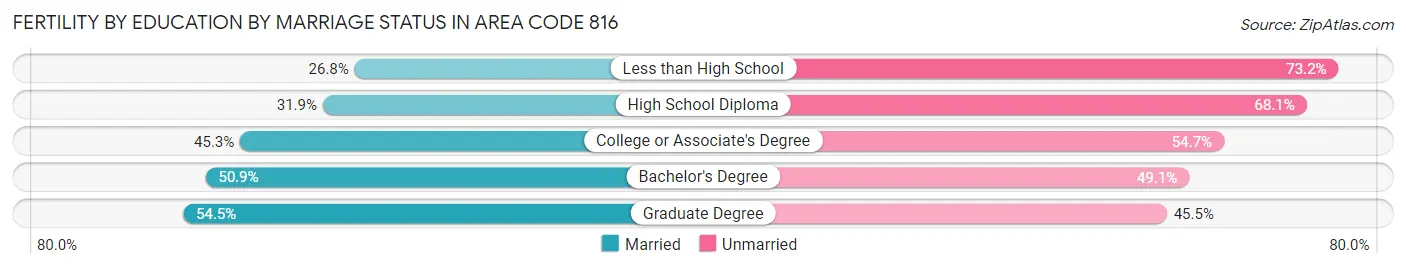
| Educational Attainment | Married | Unmarried |
| Less than High School | 365 (26.8%) | 997 (73.2%) |
| High School Diploma | 1,306 (31.9%) | 2,784 (68.1%) |
| College or Associate's Degree | 2,408 (45.3%) | 2,912 (54.7%) |
| Bachelor's Degree | 2,127 (50.9%) | 2,055 (49.1%) |
| Graduate Degree | 927 (54.5%) | 775 (45.5%) |
| Total | 10,237 (61.5%) | 6,419 (38.5%) |
Employment Characteristics in Area Code 816
Employment by Class of Employer in Area Code 816
Among the 672,115 employed individuals in Area Code 816, private company employees (472,873 | 70.4%), not-for-profit organizations (61,315 | 9.1%), and local government employees (40,968 | 6.1%) make up the most common classes of employment.
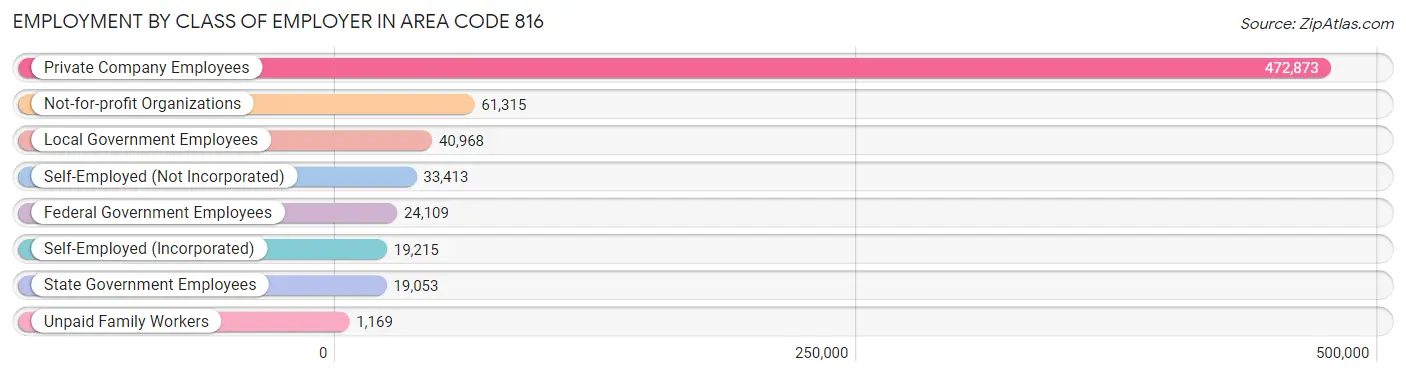
| Employer Class | # Employees | % Employees |
| Private Company Employees | 472,873 | 70.4% |
| Self-Employed (Incorporated) | 19,215 | 2.9% |
| Self-Employed (Not Incorporated) | 33,413 | 5.0% |
| Not-for-profit Organizations | 61,315 | 9.1% |
| Local Government Employees | 40,968 | 6.1% |
| State Government Employees | 19,053 | 2.8% |
| Federal Government Employees | 24,109 | 3.6% |
| Unpaid Family Workers | 1,169 | 0.2% |
| Total | 672,115 | 100.0% |
Employment Status by Age in Area Code 816
According to the labor force statistics for Area Code 816, out of the total population over 16 years of age (1,073,864), 65.0% or 697,582 individuals are in the labor force, with 4.9% or 33,833 of them unemployed. The age group with the highest labor force participation rate is 35 to 44 years, with 85.2% or 151,788 individuals in the labor force. Within the labor force, the 16 to 19 years age range has the highest percentage of unemployed individuals, with 1,470.1% or 467,521 of them being unemployed.
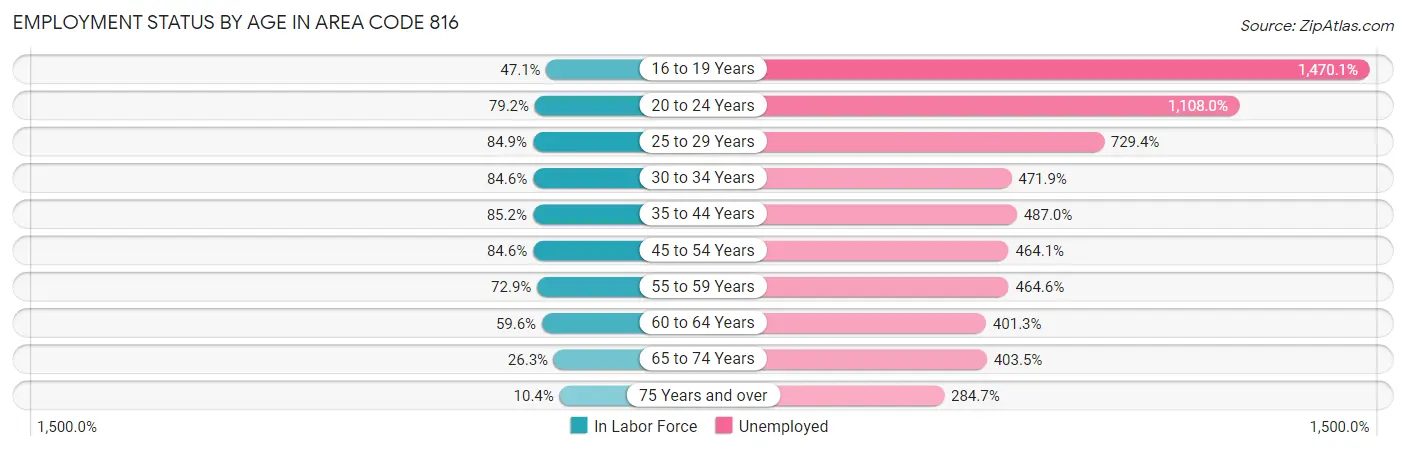
| Age Bracket | In Labor Force | Unemployed |
| 16 to 19 Years | 31,799 (47.1%) | 467,521 (1,470.1%) |
| 20 to 24 Years | 65,189 (79.2%) | 722,294 (1,108.0%) |
| 25 to 29 Years | 82,721 (84.9%) | 603,403 (729.4%) |
| 30 to 34 Years | 81,980 (84.6%) | 386,873 (471.9%) |
| 35 to 44 Years | 151,787 (85.2%) | 739,208 (487.0%) |
| 45 to 54 Years | 139,928 (84.6%) | 649,434 (464.1%) |
| 55 to 59 Years | 64,767 (72.9%) | 300,926 (464.6%) |
| 60 to 64 Years | 51,169 (59.6%) | 205,325 (401.3%) |
| 65 to 74 Years | 33,049 (26.3%) | 133,373 (403.5%) |
| 75 Years and over | 8,899 (10.3%) | 25,335 (284.7%) |
| Total | 697,619 (65.0%) | 33,843 (4.9%) |
Employment Status by Educational Attainment in Area Code 816
According to labor force statistics for Area Code 816, 80.0% of individuals (569,728) out of the total population between 25 and 64 years of age (712,516) are in the labor force, with 539.2% or 3,071,973 of them being unemployed. The group with the highest labor force participation rate are those with the educational attainment of bachelor's degree or higher, with 89.0% or 214,632 individuals in the labor force. Within the labor force, individuals with less than high school education have the highest percentage of unemployment, with 950.8% or 296,507 of them being unemployed.
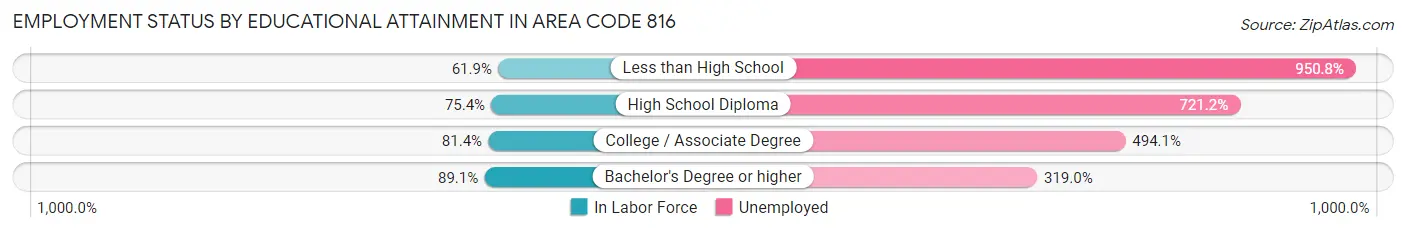
| Educational Attainment | In Labor Force | Unemployed |
| Less than High School | 31,185 (61.9%) | 478,861 (950.8%) |
| High School Diploma | 150,943 (75.4%) | 1,444,347 (721.2%) |
| College / Associate Degree | 179,867 (81.4%) | 1,091,259 (494.1%) |
| Bachelor's Degree or higher | 214,621 (89.0%) | 768,867 (319.0%) |
| Total | 569,708 (80.0%) | 3,841,886 (539.2%) |
Employment Occupations by Sex in Area Code 816
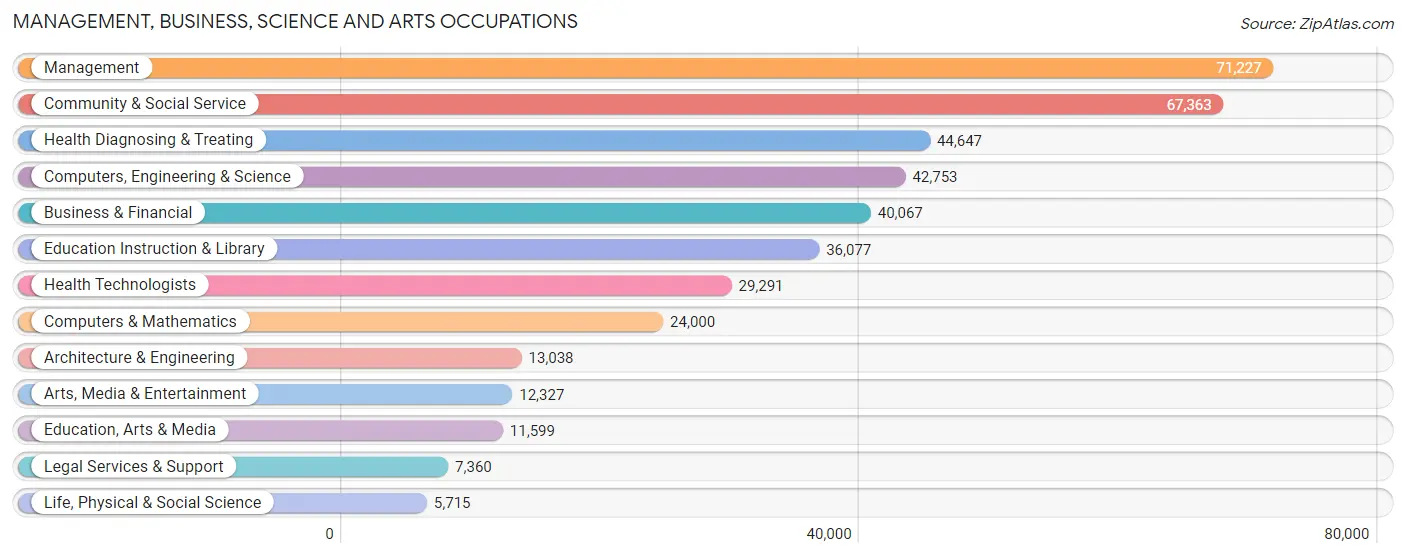
Management, Business, Science and Arts Occupations
The most common Management, Business, Science and Arts occupations in Area Code 816 are Management (71,227 | 10.4%), Community & Social Service (67,363 | 9.9%), Health Diagnosing & Treating (44,647 | 6.6%), Computers, Engineering & Science (42,753 | 6.3%), and Business & Financial (40,067 | 5.9%).
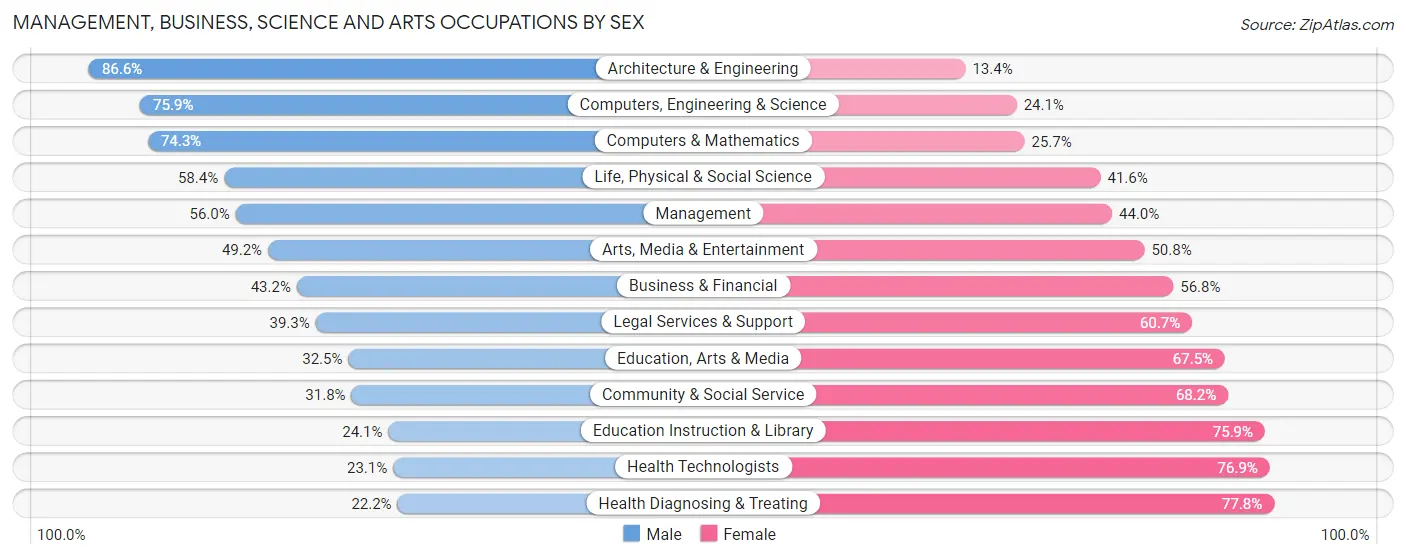
Management, Business, Science and Arts Occupations by Sex
Within the Management, Business, Science and Arts occupations in Area Code 816, the most male-oriented occupations are Architecture & Engineering (86.6%), Computers, Engineering & Science (75.9%), and Computers & Mathematics (74.3%), while the most female-oriented occupations are Health Diagnosing & Treating (77.8%), Health Technologists (76.9%), and Education Instruction & Library (75.9%).
| Occupation | Male | Female |
| Management | 39,889 (56.0%) | 31,338 (44.0%) |
| Business & Financial | 17,320 (43.2%) | 22,747 (56.8%) |
| Computers, Engineering & Science | 32,451 (75.9%) | 10,302 (24.1%) |
| Computers & Mathematics | 17,825 (74.3%) | 6,175 (25.7%) |
| Architecture & Engineering | 11,288 (86.6%) | 1,750 (13.4%) |
| Life, Physical & Social Science | 3,338 (58.4%) | 2,377 (41.6%) |
| Community & Social Service | 21,440 (31.8%) | 45,923 (68.2%) |
| Education, Arts & Media | 3,767 (32.5%) | 7,832 (67.5%) |
| Legal Services & Support | 2,893 (39.3%) | 4,467 (60.7%) |
| Education Instruction & Library | 8,710 (24.1%) | 27,367 (75.9%) |
| Arts, Media & Entertainment | 6,070 (49.2%) | 6,257 (50.8%) |
| Health Diagnosing & Treating | 9,922 (22.2%) | 34,725 (77.8%) |
| Health Technologists | 6,779 (23.1%) | 22,512 (76.9%) |
| Total (Category) | 121,022 (45.5%) | 145,035 (54.5%) |
| Total (Overall) | 355,246 (52.1%) | 326,537 (47.9%) |
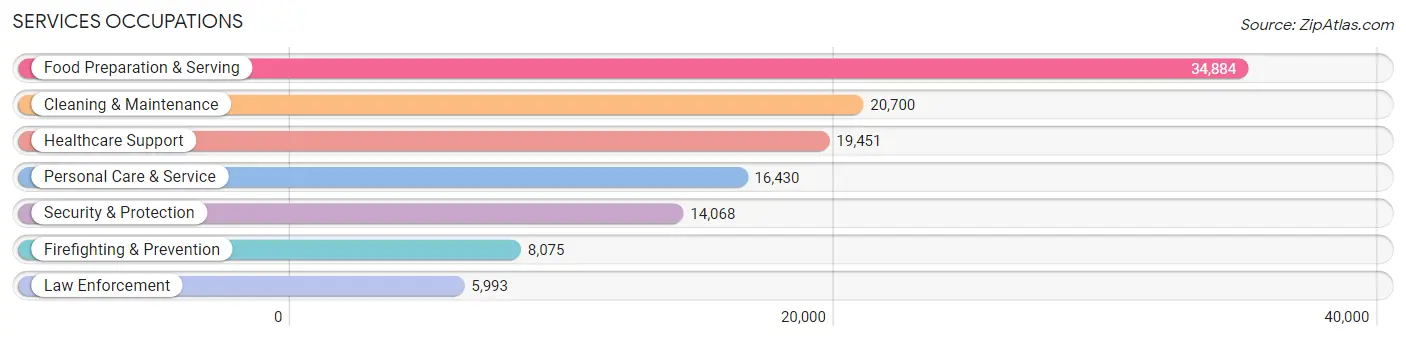
Services Occupations
The most common Services occupations in Area Code 816 are Food Preparation & Serving (34,884 | 5.1%), Cleaning & Maintenance (20,700 | 3.0%), Healthcare Support (19,451 | 2.9%), Personal Care & Service (16,430 | 2.4%), and Security & Protection (14,068 | 2.1%).
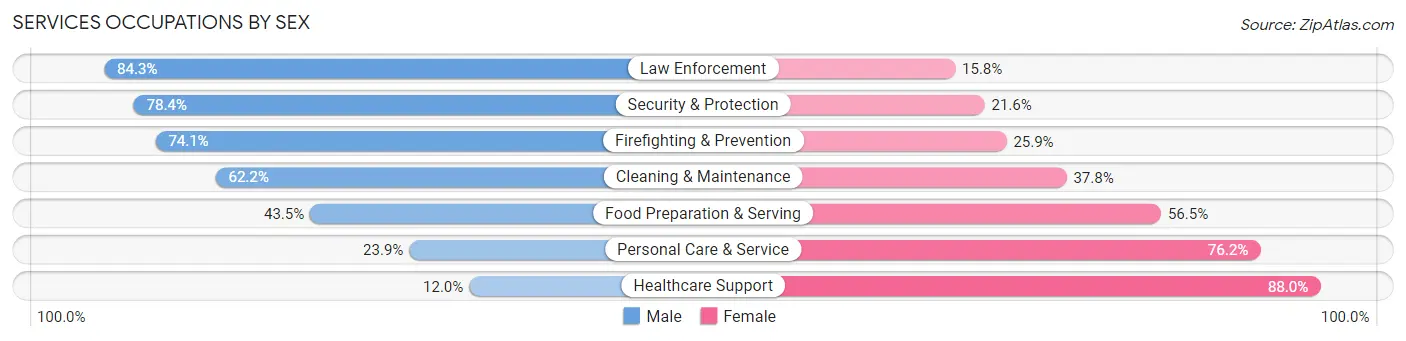
Services Occupations by Sex
Within the Services occupations in Area Code 816, the most male-oriented occupations are Law Enforcement (84.3%), Security & Protection (78.4%), and Firefighting & Prevention (74.1%), while the most female-oriented occupations are Healthcare Support (88.0%), Personal Care & Service (76.1%), and Food Preparation & Serving (56.5%).
| Occupation | Male | Female |
| Healthcare Support | 2,330 (12.0%) | 17,121 (88.0%) |
| Security & Protection | 11,031 (78.4%) | 3,037 (21.6%) |
| Firefighting & Prevention | 5,982 (74.1%) | 2,093 (25.9%) |
| Law Enforcement | 5,049 (84.3%) | 944 (15.8%) |
| Food Preparation & Serving | 15,169 (43.5%) | 19,715 (56.5%) |
| Cleaning & Maintenance | 12,874 (62.2%) | 7,826 (37.8%) |
| Personal Care & Service | 3,918 (23.8%) | 12,512 (76.1%) |
| Total (Category) | 45,322 (42.9%) | 60,211 (57.1%) |
| Total (Overall) | 355,246 (52.1%) | 326,537 (47.9%) |
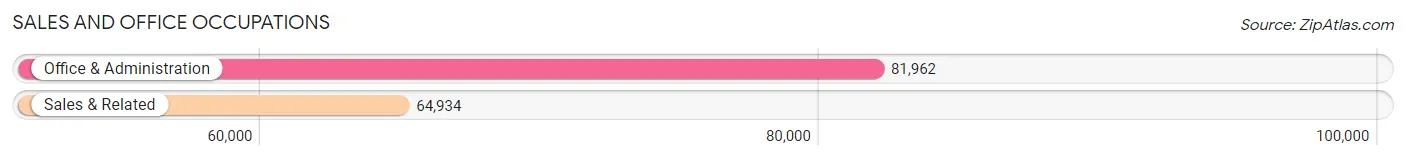
Sales and Office Occupations
The most common Sales and Office occupations in Area Code 816 are Office & Administration (81,962 | 12.0%), and Sales & Related (64,934 | 9.5%).
Sales and Office Occupations by Sex
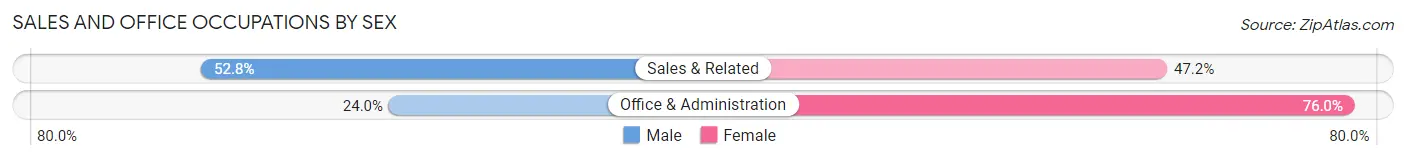
| Occupation | Male | Female |
| Sales & Related | 34,310 (52.8%) | 30,624 (47.2%) |
| Office & Administration | 19,638 (24.0%) | 62,324 (76.0%) |
| Total (Category) | 53,948 (36.7%) | 92,948 (63.3%) |
| Total (Overall) | 355,246 (52.1%) | 326,537 (47.9%) |
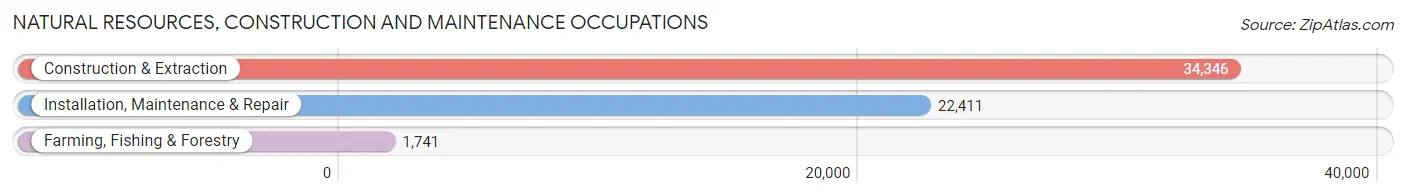
Natural Resources, Construction and Maintenance Occupations
The most common Natural Resources, Construction and Maintenance occupations in Area Code 816 are Construction & Extraction (34,346 | 5.0%), Installation, Maintenance & Repair (22,411 | 3.3%), and Farming, Fishing & Forestry (1,741 | 0.3%).
Natural Resources, Construction and Maintenance Occupations by Sex
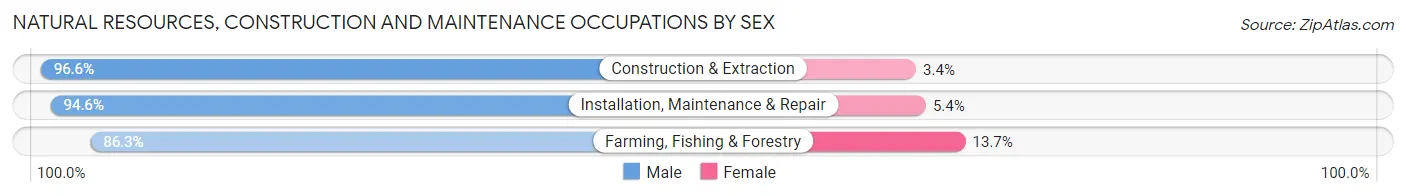
| Occupation | Male | Female |
| Farming, Fishing & Forestry | 1,503 (86.3%) | 238 (13.7%) |
| Construction & Extraction | 33,185 (96.6%) | 1,161 (3.4%) |
| Installation, Maintenance & Repair | 21,196 (94.6%) | 1,215 (5.4%) |
| Total (Category) | 55,884 (95.5%) | 2,614 (4.5%) |
| Total (Overall) | 355,246 (52.1%) | 326,537 (47.9%) |
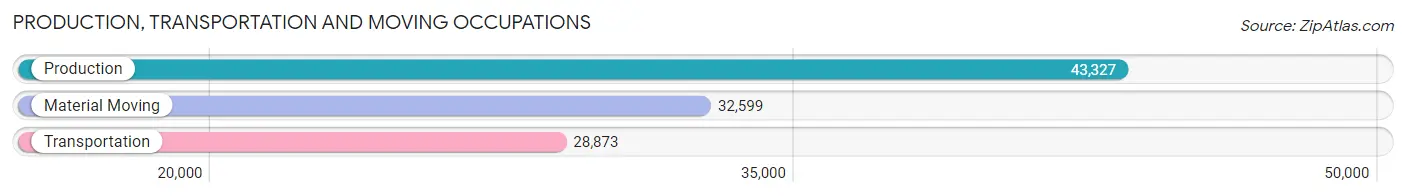
Production, Transportation and Moving Occupations
The most common Production, Transportation and Moving occupations in Area Code 816 are Production (43,327 | 6.4%), Material Moving (32,599 | 4.8%), and Transportation (28,873 | 4.2%).
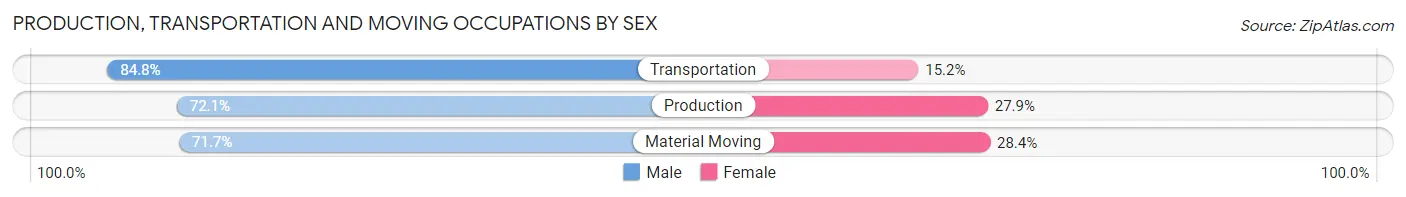
Production, Transportation and Moving Occupations by Sex
| Occupation | Male | Female |
| Production | 31,227 (72.1%) | 12,100 (27.9%) |
| Transportation | 24,486 (84.8%) | 4,387 (15.2%) |
| Material Moving | 23,357 (71.7%) | 9,242 (28.3%) |
| Total (Category) | 79,070 (75.4%) | 25,729 (24.5%) |
| Total (Overall) | 355,246 (52.1%) | 326,537 (47.9%) |
Employment Industries by Sex in Area Code 816
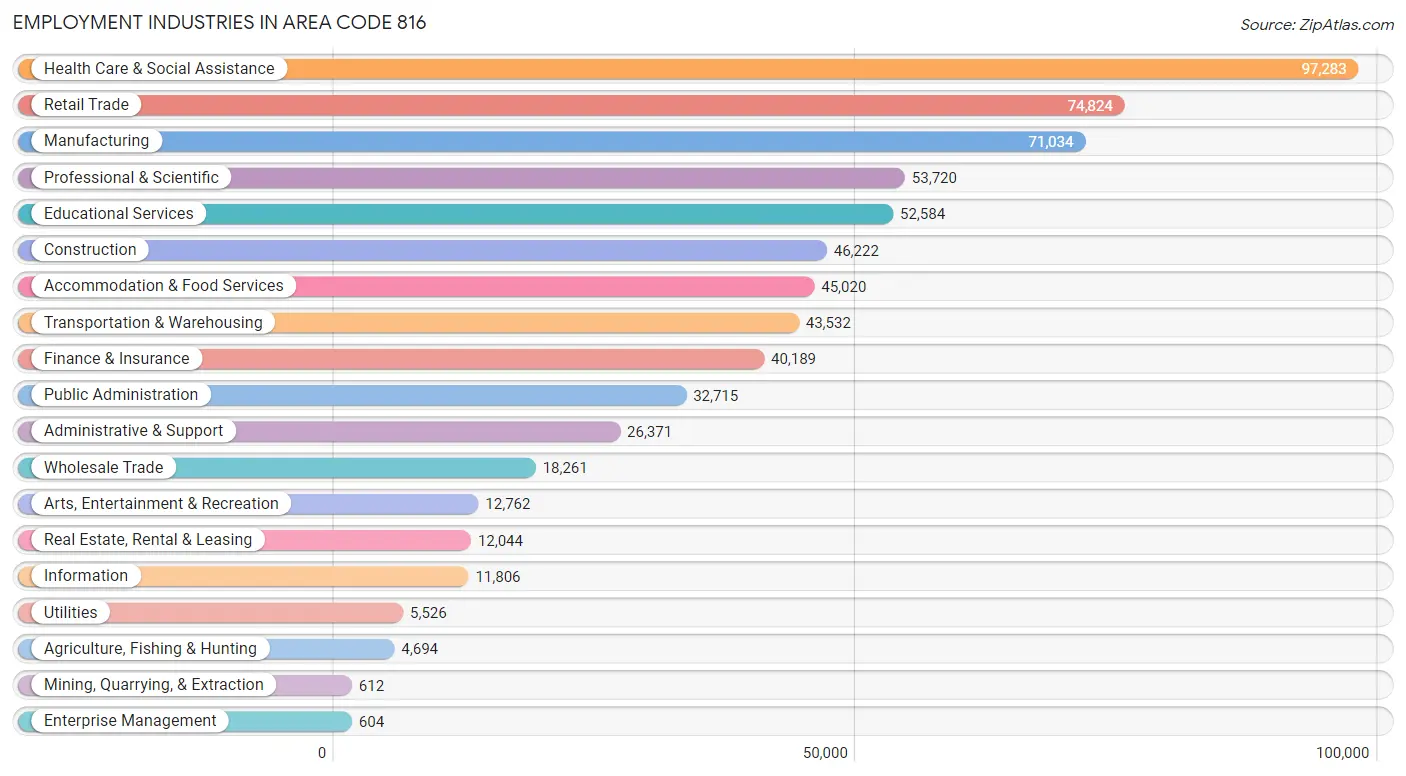
Employment Industries in Area Code 816
The major employment industries in Area Code 816 include Health Care & Social Assistance (97,283 | 14.3%), Retail Trade (74,824 | 11.0%), Manufacturing (71,034 | 10.4%), Professional & Scientific (53,720 | 7.9%), and Educational Services (52,584 | 7.7%).
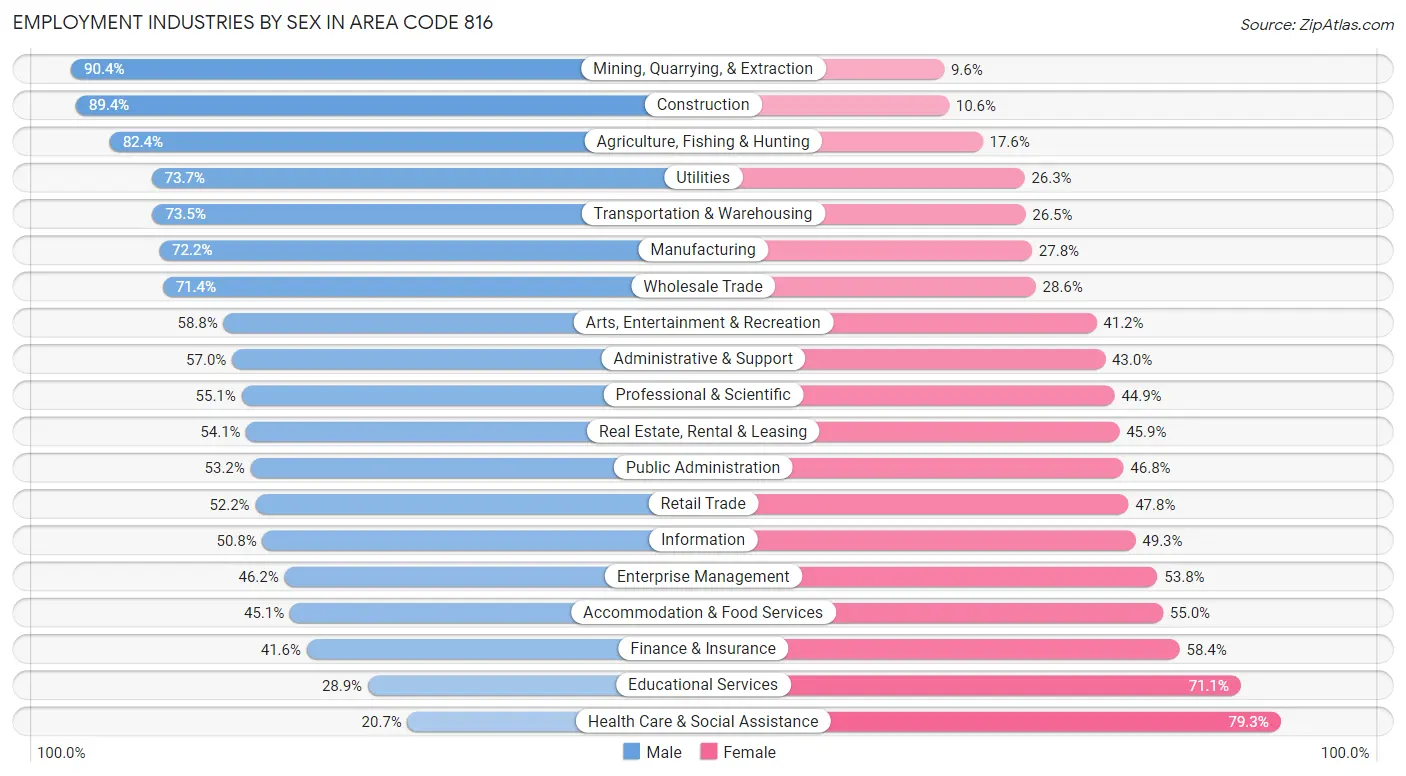
Employment Industries by Sex in Area Code 816
The Area Code 816 industries that see more men than women are Mining, Quarrying, & Extraction (90.4%), Construction (89.4%), and Agriculture, Fishing & Hunting (82.4%), whereas the industries that tend to have a higher number of women are Health Care & Social Assistance (79.3%), Educational Services (71.1%), and Finance & Insurance (58.4%).
| Industry | Male | Female |
| Agriculture, Fishing & Hunting | 3,867 (82.4%) | 827 (17.6%) |
| Mining, Quarrying, & Extraction | 553 (90.4%) | 59 (9.6%) |
| Construction | 41,308 (89.4%) | 4,914 (10.6%) |
| Manufacturing | 51,257 (72.2%) | 19,777 (27.8%) |
| Wholesale Trade | 13,039 (71.4%) | 5,222 (28.6%) |
| Retail Trade | 39,073 (52.2%) | 35,751 (47.8%) |
| Transportation & Warehousing | 32,005 (73.5%) | 11,527 (26.5%) |
| Utilities | 4,073 (73.7%) | 1,453 (26.3%) |
| Information | 5,991 (50.7%) | 5,815 (49.2%) |
| Finance & Insurance | 16,714 (41.6%) | 23,475 (58.4%) |
| Real Estate, Rental & Leasing | 6,514 (54.1%) | 5,530 (45.9%) |
| Professional & Scientific | 29,588 (55.1%) | 24,132 (44.9%) |
| Enterprise Management | 279 (46.2%) | 325 (53.8%) |
| Administrative & Support | 15,042 (57.0%) | 11,329 (43.0%) |
| Educational Services | 15,214 (28.9%) | 37,370 (71.1%) |
| Health Care & Social Assistance | 20,143 (20.7%) | 77,140 (79.3%) |
| Arts, Entertainment & Recreation | 7,507 (58.8%) | 5,255 (41.2%) |
| Accommodation & Food Services | 20,283 (45.1%) | 24,737 (54.9%) |
| Public Administration | 17,412 (53.2%) | 15,303 (46.8%) |
| Total | 355,246 (52.1%) | 326,537 (47.9%) |
Education in Area Code 816
School Enrollment in Area Code 816
The most common levels of schooling among the 312,690 students in Area Code 816 are middle school (73,186 | 23.4%), high school (69,347 | 22.2%), and elementary school (66,752 | 21.3%).
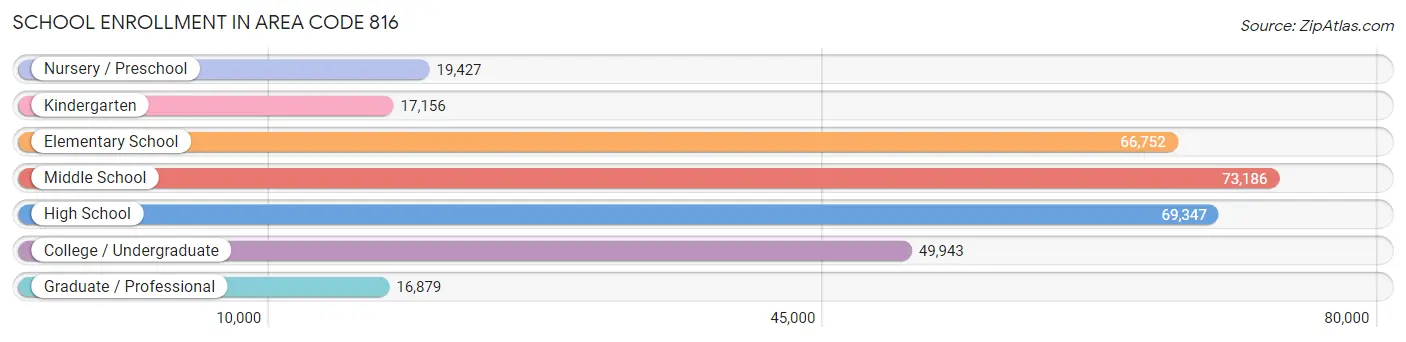
| School Level | # Students | % Students |
| Nursery / Preschool | 19,427 | 6.2% |
| Kindergarten | 17,156 | 5.5% |
| Elementary School | 66,752 | 21.3% |
| Middle School | 73,186 | 23.4% |
| High School | 69,347 | 22.2% |
| College / Undergraduate | 49,943 | 16.0% |
| Graduate / Professional | 16,879 | 5.4% |
| Total | 312,690 | 100.0% |
School Enrollment by Age by Funding Source in Area Code 816
Out of a total of 312,690 students who are enrolled in schools in Area Code 816, 49,145 (15.7%) attend a private institution, while the remaining 263,545 (84.3%) are enrolled in public schools. The age group of 3 to 4 year olds has the highest likelihood of being enrolled in private schools, with 5,182 (37.8% in the age bracket) enrolled. Conversely, the age group of 10 to 14 year olds has the lowest likelihood of being enrolled in a private school, with 78,800 (89.0% in the age bracket) attending a public institution.
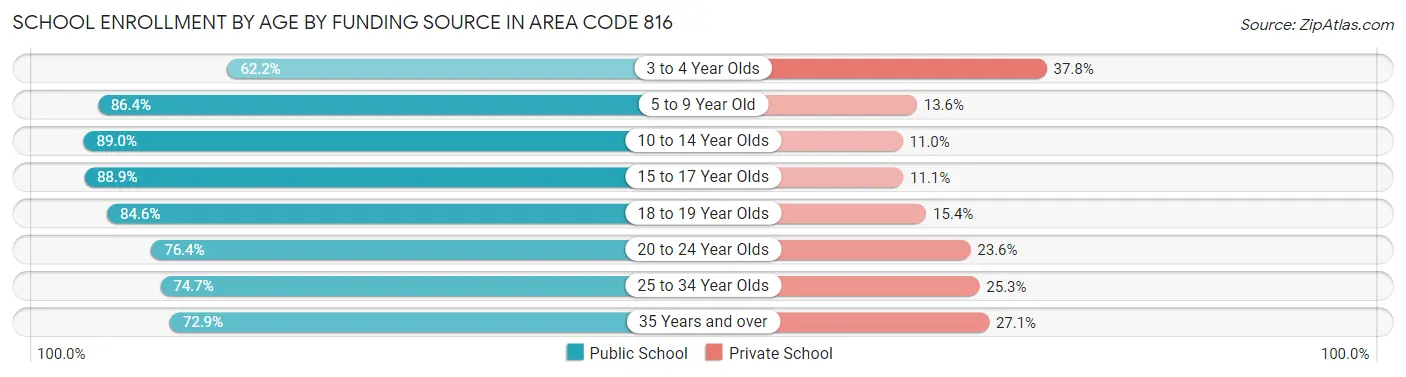
| Age Bracket | Public School | Private School |
| 3 to 4 Year Olds | 8,530 (62.2%) | 5,182 (37.8%) |
| 5 to 9 Year Old | 69,253 (86.4%) | 10,916 (13.6%) |
| 10 to 14 Year Olds | 78,800 (89.0%) | 9,724 (11.0%) |
| 15 to 17 Year Olds | 46,132 (88.9%) | 5,744 (11.1%) |
| 18 to 19 Year Olds | 17,658 (84.6%) | 3,204 (15.4%) |
| 20 to 24 Year Olds | 19,393 (76.4%) | 5,992 (23.6%) |
| 25 to 34 Year Olds | 13,571 (74.7%) | 4,592 (25.3%) |
| 35 Years and over | 10,211 (72.9%) | 3,788 (27.1%) |
| Total | 263,545 (84.3%) | 49,145 (15.7%) |
Educational Attainment by Field of Study in Area Code 816
Business (69,875 | 21.7%), education (42,874 | 13.3%), science & technology (35,618 | 11.0%), arts & humanities (23,270 | 7.2%), and bio, nature & agricultural (19,114 | 5.9%) are the most common fields of study among 322,673 individuals in Area Code 816 who have obtained a bachelor's degree or higher.
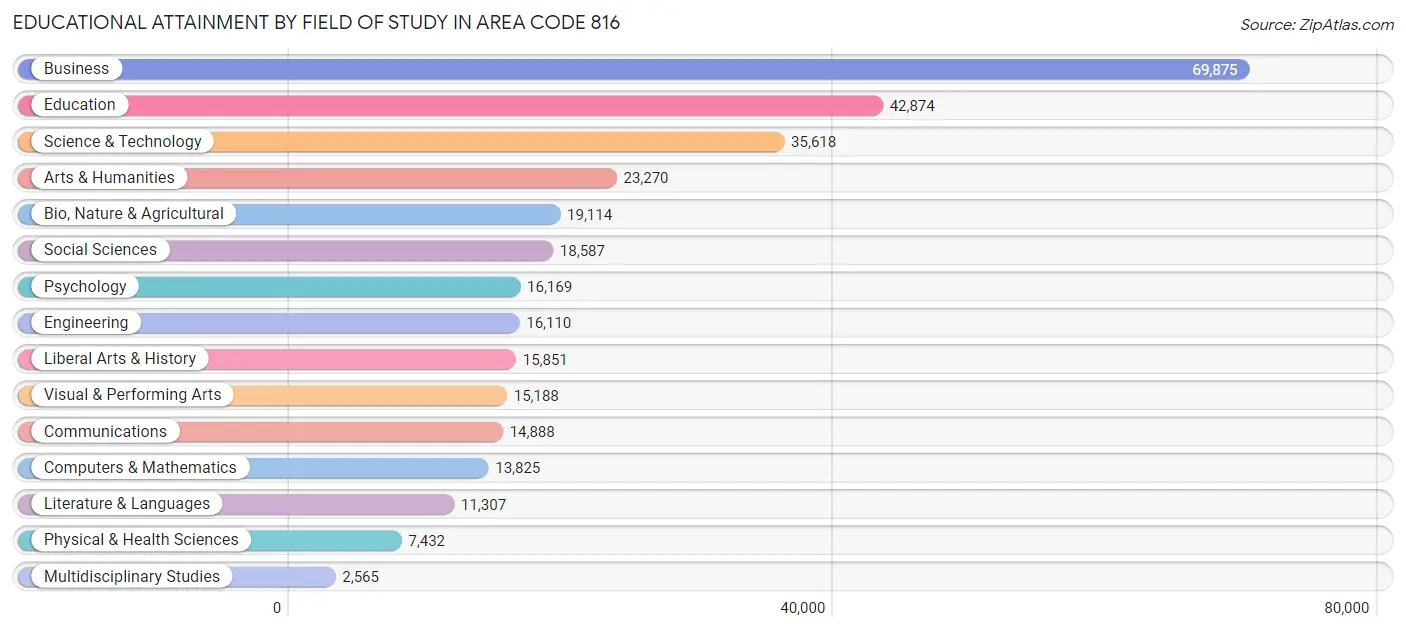
| Field of Study | # Graduates | % Graduates |
| Computers & Mathematics | 13,825 | 4.3% |
| Bio, Nature & Agricultural | 19,114 | 5.9% |
| Physical & Health Sciences | 7,432 | 2.3% |
| Psychology | 16,169 | 5.0% |
| Social Sciences | 18,587 | 5.8% |
| Engineering | 16,110 | 5.0% |
| Multidisciplinary Studies | 2,565 | 0.8% |
| Science & Technology | 35,618 | 11.0% |
| Business | 69,875 | 21.7% |
| Education | 42,874 | 13.3% |
| Literature & Languages | 11,307 | 3.5% |
| Liberal Arts & History | 15,851 | 4.9% |
| Visual & Performing Arts | 15,188 | 4.7% |
| Communications | 14,888 | 4.6% |
| Arts & Humanities | 23,270 | 7.2% |
| Total | 322,673 | 100.0% |
Transportation & Commute in Area Code 816
Vehicle Availability by Sex in Area Code 816
The most prevalent vehicle ownership categories in Area Code 816 are males with 2 vehicles (149,749, accounting for 42.7%) and females with 2 vehicles (128,783, making up 46.9%).
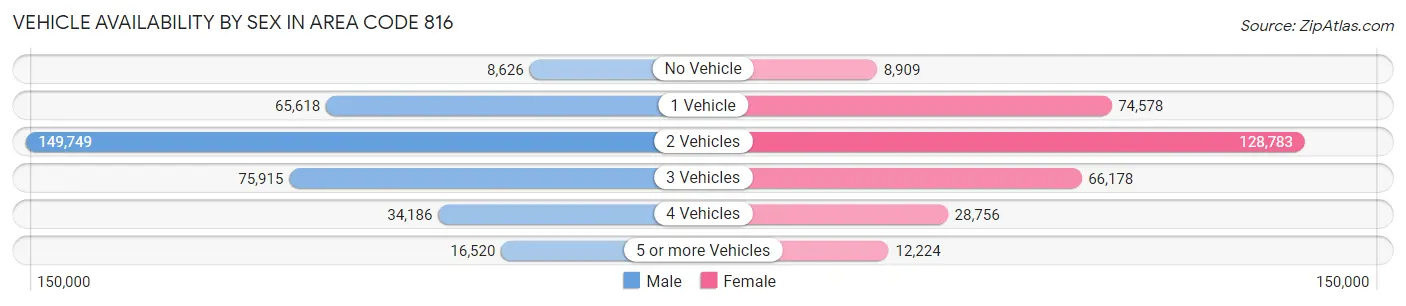
| Vehicles Available | Male | Female |
| No Vehicle | 8,626 (2.5%) | 8,909 (2.8%) |
| 1 Vehicle | 65,618 (18.7%) | 74,578 (23.4%) |
| 2 Vehicles | 149,749 (42.7%) | 128,783 (40.3%) |
| 3 Vehicles | 75,915 (21.6%) | 66,178 (20.7%) |
| 4 Vehicles | 34,186 (9.8%) | 28,756 (9.0%) |
| 5 or more Vehicles | 16,520 (4.7%) | 12,224 (3.8%) |
| Total | 350,614 (100.0%) | 319,428 (100.0%) |
Commute Time in Area Code 816
The most frequently occuring commute durations in Area Code 816 are 15 to 19 minutes (99,456 commuters, 16.7%), 20 to 24 minutes (95,305 commuters, 16.0%), and 30 to 34 minutes (85,792 commuters, 14.4%).
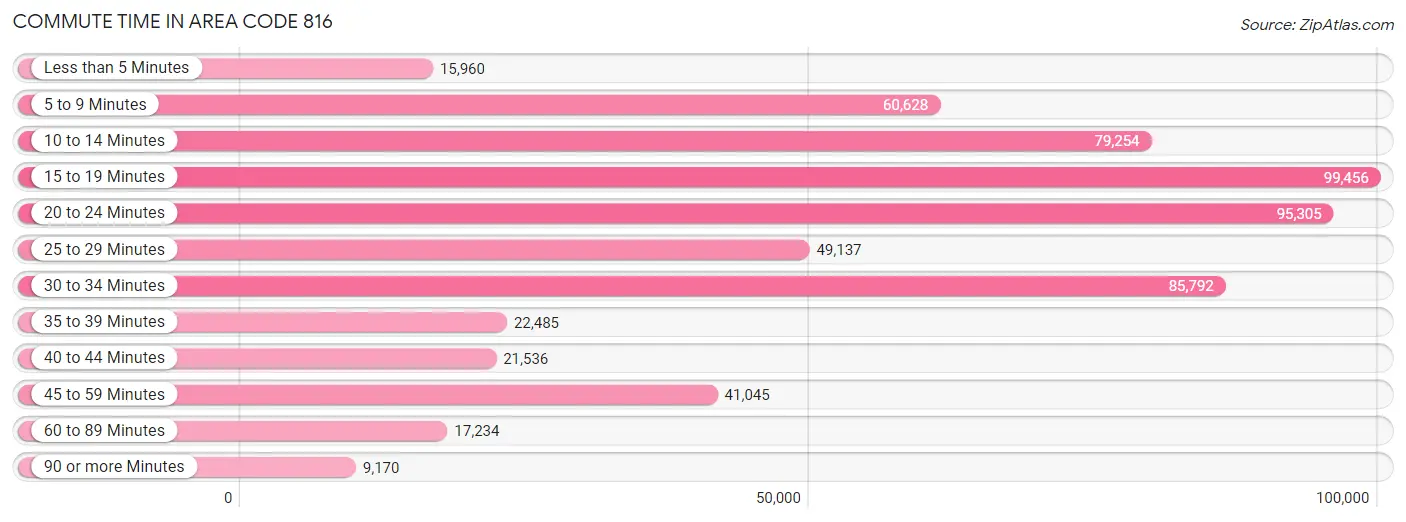
| Commute Time | # Commuters | % Commuters |
| Less than 5 Minutes | 15,960 | 2.7% |
| 5 to 9 Minutes | 60,628 | 10.2% |
| 10 to 14 Minutes | 79,254 | 13.3% |
| 15 to 19 Minutes | 99,456 | 16.7% |
| 20 to 24 Minutes | 95,305 | 16.0% |
| 25 to 29 Minutes | 49,137 | 8.2% |
| 30 to 34 Minutes | 85,792 | 14.4% |
| 35 to 39 Minutes | 22,485 | 3.8% |
| 40 to 44 Minutes | 21,536 | 3.6% |
| 45 to 59 Minutes | 41,045 | 6.9% |
| 60 to 89 Minutes | 17,234 | 2.9% |
| 90 or more Minutes | 9,170 | 1.5% |
Commute Time by Sex in Area Code 816
The most common commute times in Area Code 816 are 20 to 24 minutes (50,301 commuters, 15.9%) for males and 15 to 19 minutes (50,528 commuters, 18.0%) for females.
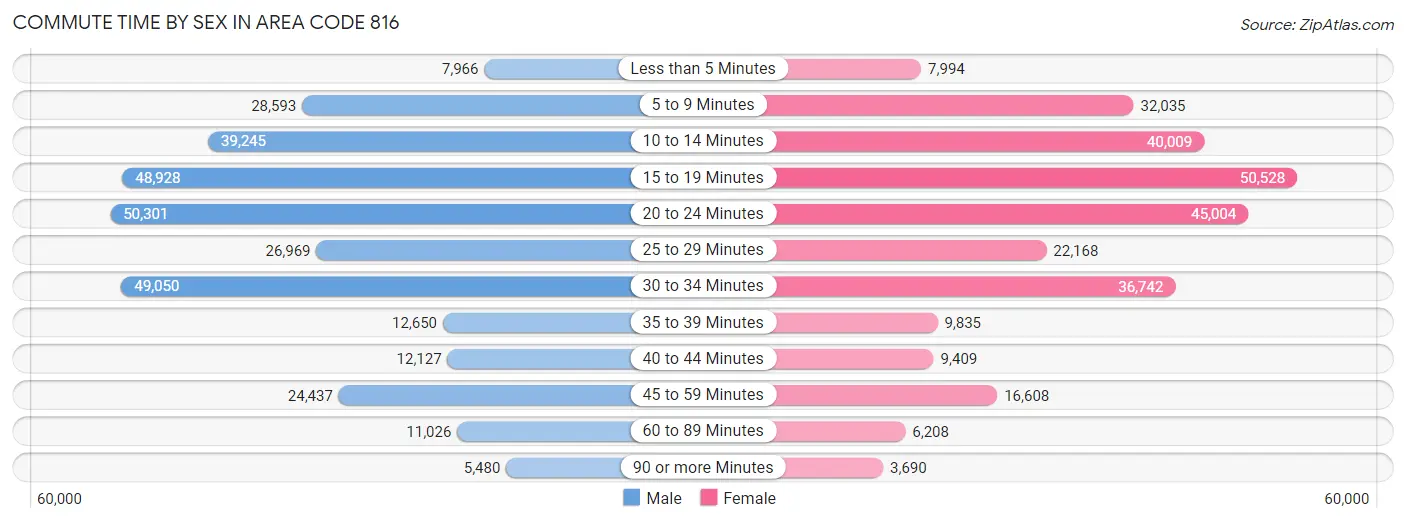
| Commute Time | Male | Female |
| Less than 5 Minutes | 7,966 (2.5%) | 7,994 (2.9%) |
| 5 to 9 Minutes | 28,593 (9.0%) | 32,035 (11.4%) |
| 10 to 14 Minutes | 39,245 (12.4%) | 40,009 (14.3%) |
| 15 to 19 Minutes | 48,928 (15.4%) | 50,528 (18.0%) |
| 20 to 24 Minutes | 50,301 (15.9%) | 45,004 (16.1%) |
| 25 to 29 Minutes | 26,969 (8.5%) | 22,168 (7.9%) |
| 30 to 34 Minutes | 49,050 (15.5%) | 36,742 (13.1%) |
| 35 to 39 Minutes | 12,650 (4.0%) | 9,835 (3.5%) |
| 40 to 44 Minutes | 12,127 (3.8%) | 9,409 (3.4%) |
| 45 to 59 Minutes | 24,437 (7.7%) | 16,608 (5.9%) |
| 60 to 89 Minutes | 11,026 (3.5%) | 6,208 (2.2%) |
| 90 or more Minutes | 5,480 (1.7%) | 3,690 (1.3%) |
Time of Departure to Work by Sex in Area Code 816
The most frequent times of departure to work in Area Code 816 are 7:00 AM to 7:29 AM (43,761, 13.8%) for males and 7:30 AM to 7:59 AM (44,573, 15.9%) for females.
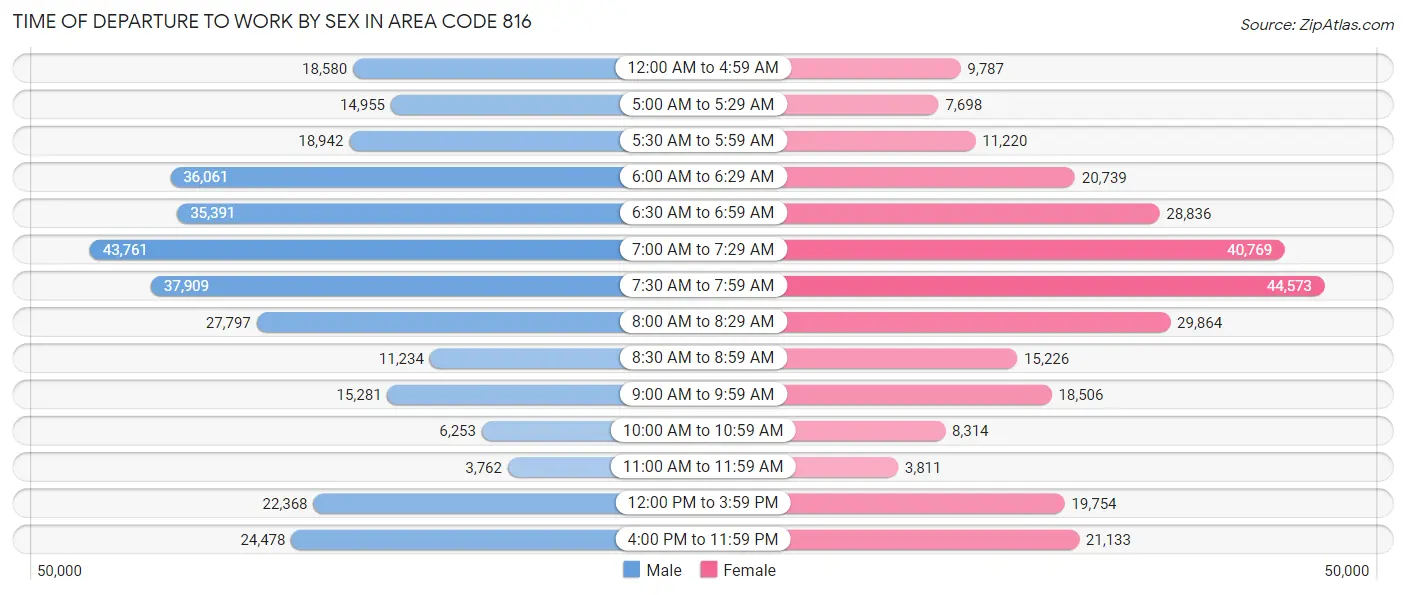
| Time of Departure | Male | Female |
| 12:00 AM to 4:59 AM | 18,580 (5.9%) | 9,787 (3.5%) |
| 5:00 AM to 5:29 AM | 14,955 (4.7%) | 7,698 (2.8%) |
| 5:30 AM to 5:59 AM | 18,942 (6.0%) | 11,220 (4.0%) |
| 6:00 AM to 6:29 AM | 36,061 (11.4%) | 20,739 (7.4%) |
| 6:30 AM to 6:59 AM | 35,391 (11.2%) | 28,836 (10.3%) |
| 7:00 AM to 7:29 AM | 43,761 (13.8%) | 40,769 (14.5%) |
| 7:30 AM to 7:59 AM | 37,909 (12.0%) | 44,573 (15.9%) |
| 8:00 AM to 8:29 AM | 27,797 (8.8%) | 29,864 (10.7%) |
| 8:30 AM to 8:59 AM | 11,234 (3.5%) | 15,226 (5.4%) |
| 9:00 AM to 9:59 AM | 15,281 (4.8%) | 18,506 (6.6%) |
| 10:00 AM to 10:59 AM | 6,253 (2.0%) | 8,314 (3.0%) |
| 11:00 AM to 11:59 AM | 3,762 (1.2%) | 3,811 (1.4%) |
| 12:00 PM to 3:59 PM | 22,368 (7.1%) | 19,754 (7.0%) |
| 4:00 PM to 11:59 PM | 24,478 (7.7%) | 21,133 (7.5%) |
| Total | 316,772 (100.0%) | 280,230 (100.0%) |
Housing Occupancy in Area Code 816
Occupancy by Ownership in Area Code 816
Of the total 546,661 dwellings in Area Code 816, owner-occupied units account for 347,877 (63.6%), while renter-occupied units make up 198,784 (36.4%).
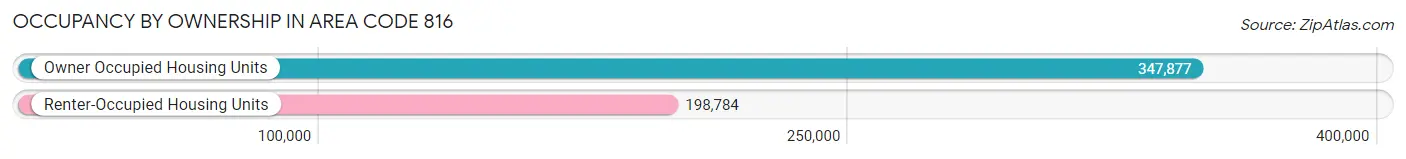
| Occupancy | # Housing Units | % Housing Units |
| Owner Occupied Housing Units | 347,877 | 63.6% |
| Renter-Occupied Housing Units | 198,784 | 36.4% |
| Total Occupied Housing Units | 546,661 | 100.0% |
Occupancy by Household Size in Area Code 816
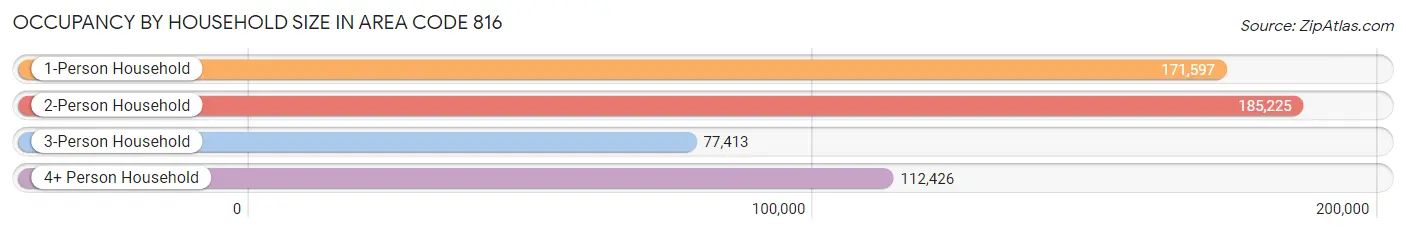
| Household Size | # Housing Units | % Housing Units |
| 1-Person Household | 171,597 | 31.4% |
| 2-Person Household | 185,225 | 33.9% |
| 3-Person Household | 77,413 | 14.2% |
| 4+ Person Household | 112,426 | 20.6% |
| Total Housing Units | 546,661 | 100.0% |
Occupancy by Ownership by Household Size in Area Code 816
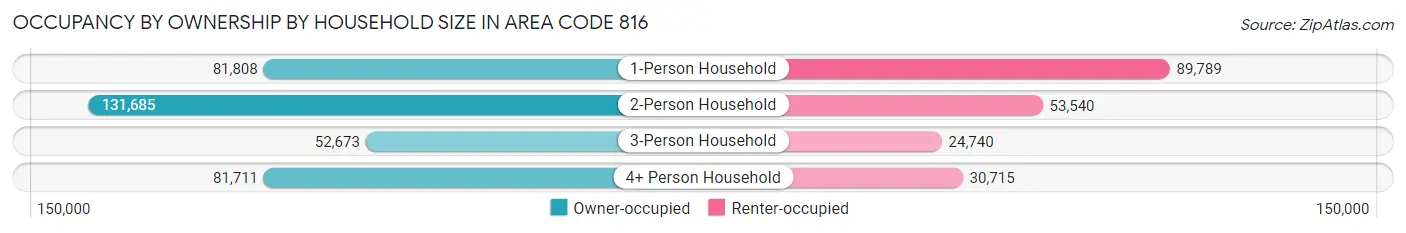
| Household Size | Owner-occupied | Renter-occupied |
| 1-Person Household | 81,808 (47.7%) | 89,789 (52.3%) |
| 2-Person Household | 131,685 (71.1%) | 53,540 (28.9%) |
| 3-Person Household | 52,673 (68.0%) | 24,740 (32.0%) |
| 4+ Person Household | 81,711 (72.7%) | 30,715 (27.3%) |
| Total Housing Units | 347,877 (63.6%) | 198,784 (36.4%) |
Occupancy by Educational Attainment in Area Code 816
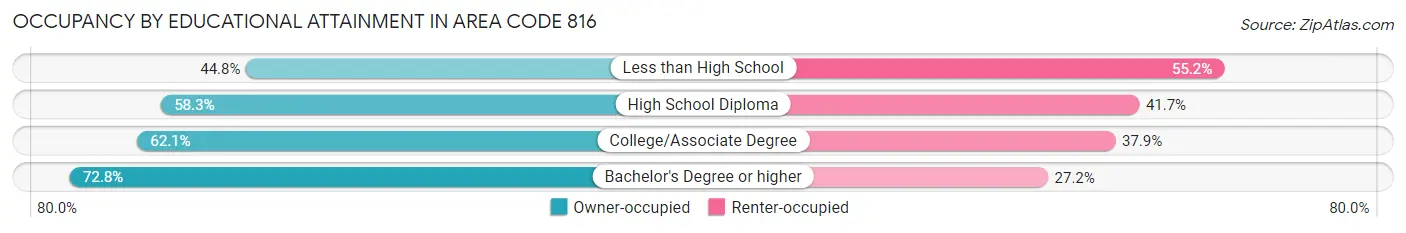
| Household Size | Owner-occupied | Renter-occupied |
| Less than High School | 15,679 (44.8%) | 19,298 (55.2%) |
| High School Diploma | 85,508 (58.3%) | 61,113 (41.7%) |
| College/Associate Degree | 110,975 (62.1%) | 67,698 (37.9%) |
| Bachelor's Degree or higher | 135,715 (72.8%) | 50,675 (27.2%) |
Occupancy by Age of Householder in Area Code 816
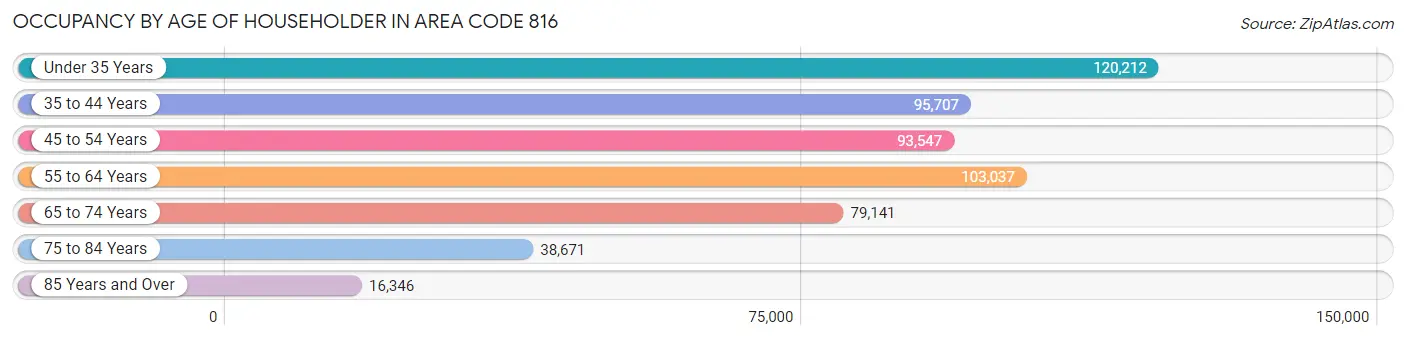
| Age Bracket | # Households | % Households |
| Under 35 Years | 120,212 | 22.0% |
| 35 to 44 Years | 95,707 | 17.5% |
| 45 to 54 Years | 93,547 | 17.1% |
| 55 to 64 Years | 103,037 | 18.9% |
| 65 to 74 Years | 79,141 | 14.5% |
| 75 to 84 Years | 38,671 | 7.1% |
| 85 Years and Over | 16,346 | 3.0% |
| Total | 546,661 | 100.0% |
Housing Finances in Area Code 816
Median Income by Occupancy in Area Code 816
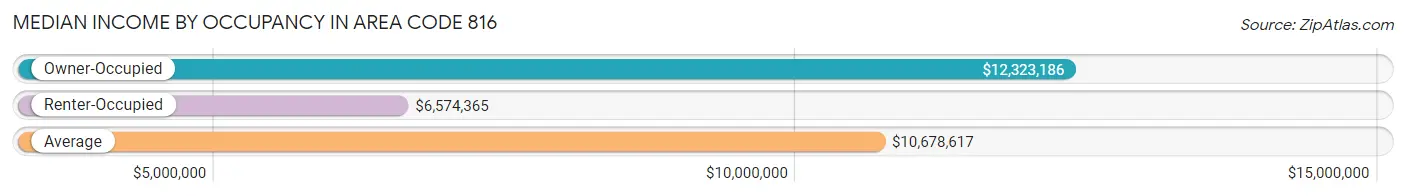
| Occupancy Type | # Households | Median Income |
| Owner-Occupied | 347,877 (63.6%) | $12,323,186 |
| Renter-Occupied | 198,784 (36.4%) | $6,574,365 |
| Average | 546,661 (100.0%) | $10,678,617 |
Occupancy by Householder Income Bracket in Area Code 816
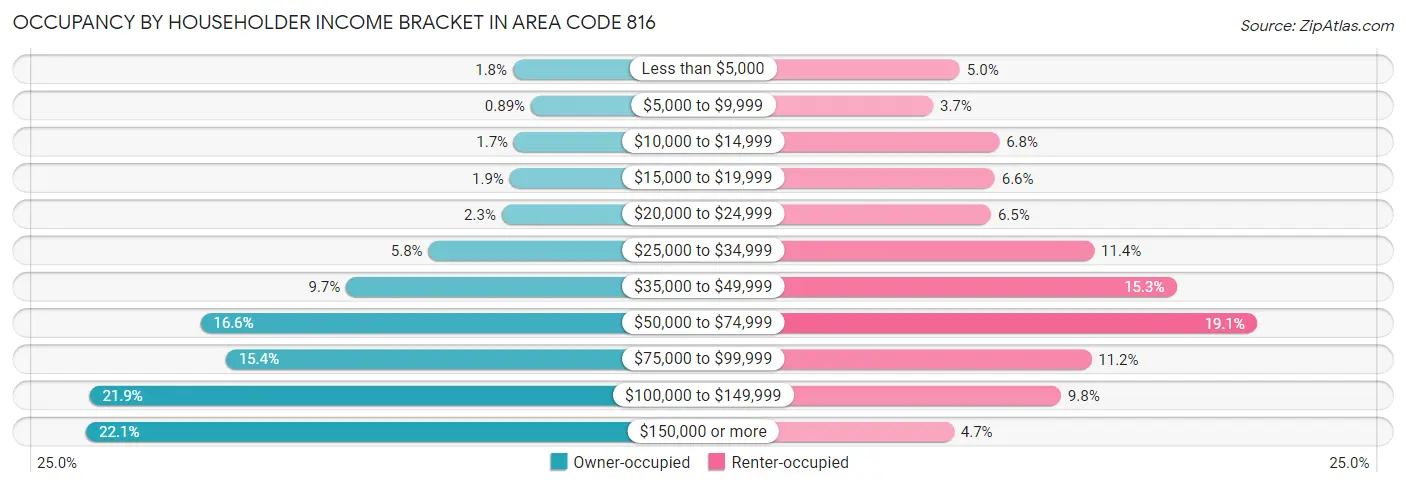
| Income Bracket | Owner-occupied | Renter-occupied |
| Less than $5,000 | 6,095 (1.8%) | 9,886 (5.0%) |
| $5,000 to $9,999 | 3,084 (0.9%) | 7,327 (3.7%) |
| $10,000 to $14,999 | 5,897 (1.7%) | 13,604 (6.8%) |
| $15,000 to $19,999 | 6,615 (1.9%) | 13,183 (6.6%) |
| $20,000 to $24,999 | 7,942 (2.3%) | 12,819 (6.5%) |
| $25,000 to $34,999 | 20,089 (5.8%) | 22,582 (11.4%) |
| $35,000 to $49,999 | 33,697 (9.7%) | 30,357 (15.3%) |
| $50,000 to $74,999 | 57,856 (16.6%) | 37,964 (19.1%) |
| $75,000 to $99,999 | 53,631 (15.4%) | 22,325 (11.2%) |
| $100,000 to $149,999 | 76,204 (21.9%) | 19,435 (9.8%) |
| $150,000 or more | 76,767 (22.1%) | 9,302 (4.7%) |
| Total | 347,877 (100.0%) | 198,784 (100.0%) |
Monthly Housing Cost Tiers in Area Code 816
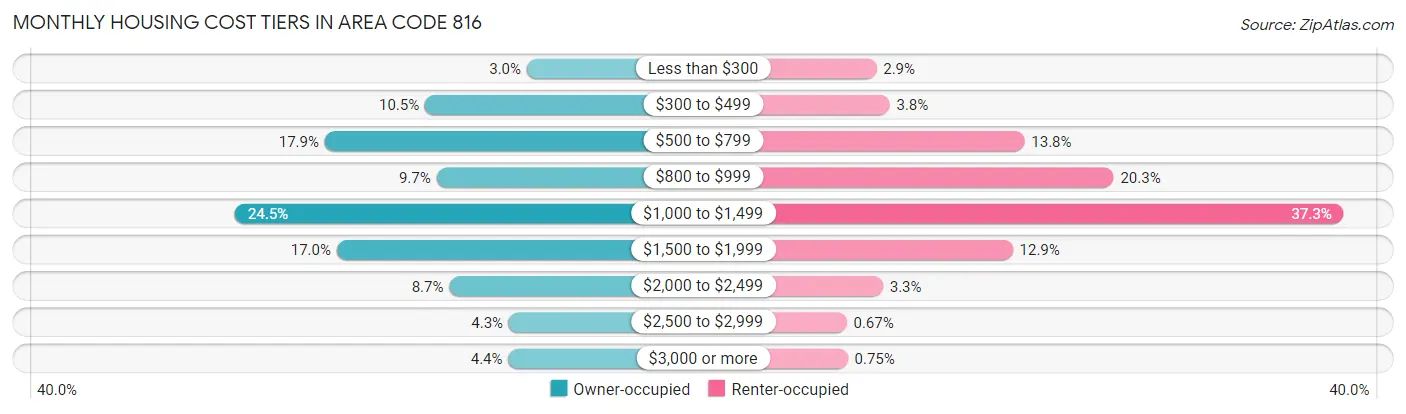
| Monthly Cost | Owner-occupied | Renter-occupied |
| Less than $300 | 10,473 (3.0%) | 5,688 (2.9%) |
| $300 to $499 | 36,552 (10.5%) | 7,635 (3.8%) |
| $500 to $799 | 62,228 (17.9%) | 27,376 (13.8%) |
| $800 to $999 | 33,601 (9.7%) | 40,413 (20.3%) |
| $1,000 to $1,499 | 85,272 (24.5%) | 74,114 (37.3%) |
| $1,500 to $1,999 | 59,174 (17.0%) | 25,646 (12.9%) |
| $2,000 to $2,499 | 30,332 (8.7%) | 6,632 (3.3%) |
| $2,500 to $2,999 | 15,058 (4.3%) | 1,333 (0.7%) |
| $3,000 or more | 15,187 (4.4%) | 1,492 (0.7%) |
| Total | 347,877 (100.0%) | 198,784 (100.0%) |
Physical Housing Characteristics in Area Code 816
Housing Structures in Area Code 816
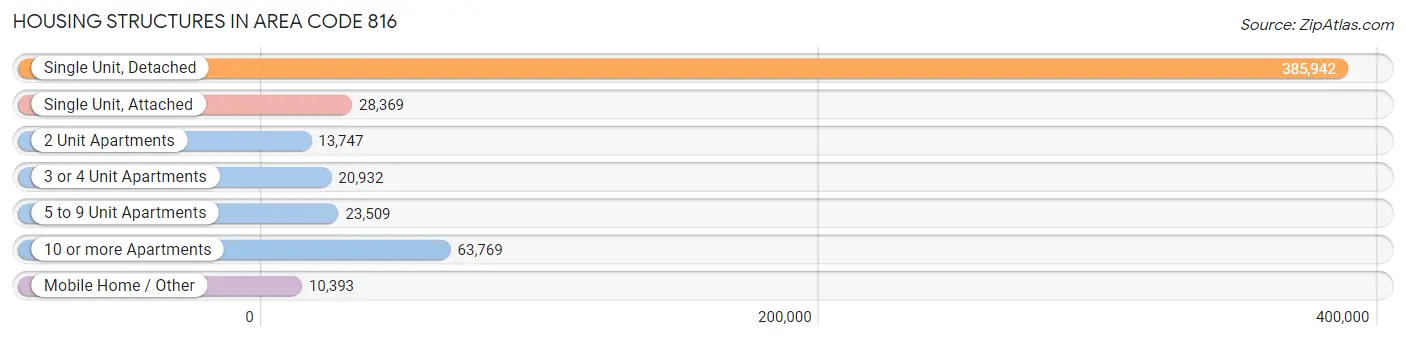
| Structure Type | # Housing Units | % Housing Units |
| Single Unit, Detached | 385,942 | 70.6% |
| Single Unit, Attached | 28,369 | 5.2% |
| 2 Unit Apartments | 13,747 | 2.5% |
| 3 or 4 Unit Apartments | 20,932 | 3.8% |
| 5 to 9 Unit Apartments | 23,509 | 4.3% |
| 10 or more Apartments | 63,769 | 11.7% |
| Mobile Home / Other | 10,393 | 1.9% |
| Total | 546,661 | 100.0% |
Housing Structures by Occupancy in Area Code 816
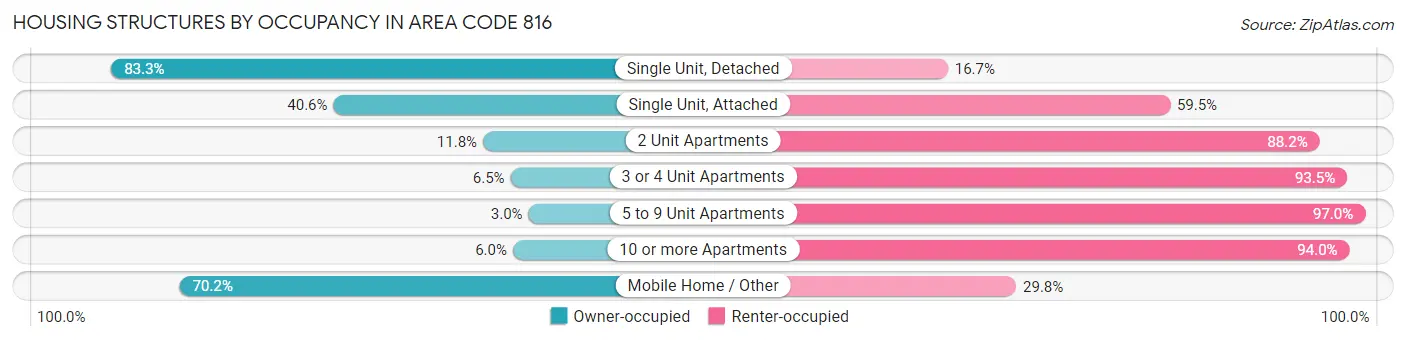
| Structure Type | Owner-occupied | Renter-occupied |
| Single Unit, Detached | 321,586 (83.3%) | 64,356 (16.7%) |
| Single Unit, Attached | 11,504 (40.6%) | 16,865 (59.5%) |
| 2 Unit Apartments | 1,616 (11.8%) | 12,131 (88.2%) |
| 3 or 4 Unit Apartments | 1,352 (6.5%) | 19,580 (93.5%) |
| 5 to 9 Unit Apartments | 703 (3.0%) | 22,806 (97.0%) |
| 10 or more Apartments | 3,823 (6.0%) | 59,946 (94.0%) |
| Mobile Home / Other | 7,293 (70.2%) | 3,100 (29.8%) |
| Total | 347,877 (63.6%) | 198,784 (36.4%) |
Housing Structures by Number of Rooms in Area Code 816
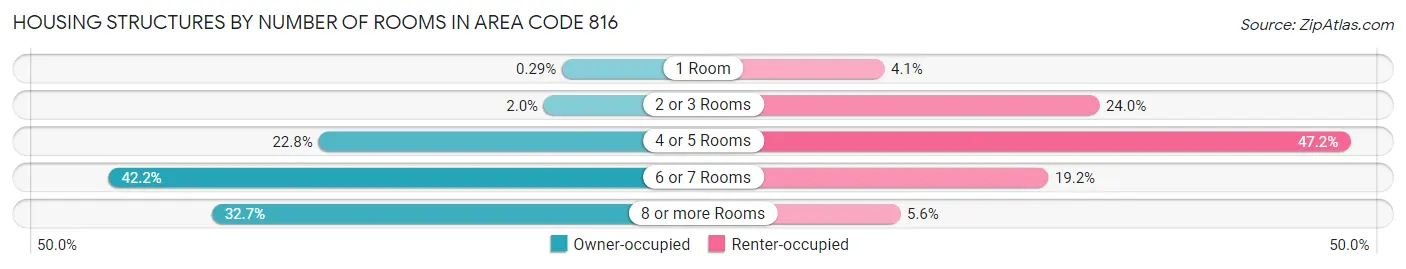
| Number of Rooms | Owner-occupied | Renter-occupied |
| 1 Room | 1,003 (0.3%) | 8,119 (4.1%) |
| 2 or 3 Rooms | 6,840 (2.0%) | 47,620 (24.0%) |
| 4 or 5 Rooms | 79,377 (22.8%) | 93,757 (47.2%) |
| 6 or 7 Rooms | 146,938 (42.2%) | 38,240 (19.2%) |
| 8 or more Rooms | 113,719 (32.7%) | 11,048 (5.6%) |
| Total | 347,877 (100.0%) | 198,784 (100.0%) |
Housing Structure by Heating Type in Area Code 816
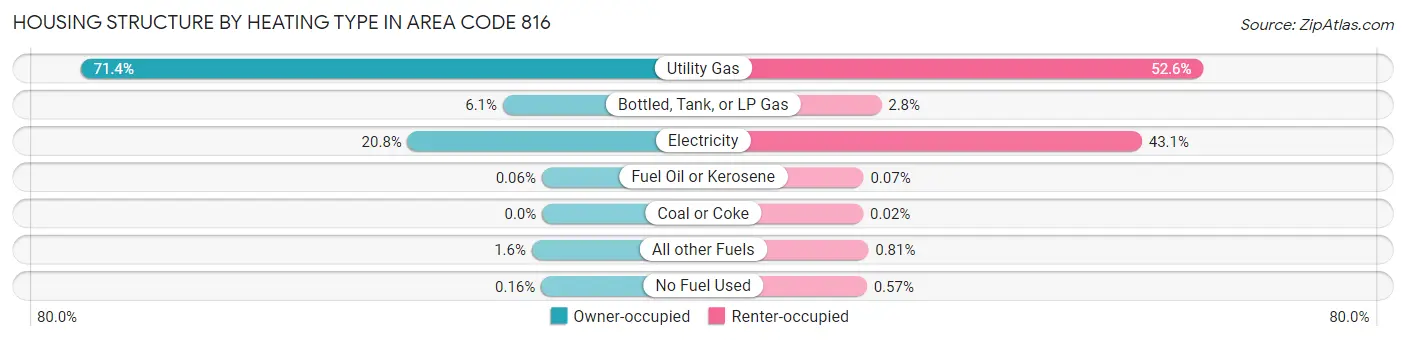
| Heating Type | Owner-occupied | Renter-occupied |
| Utility Gas | 248,213 (71.4%) | 104,569 (52.6%) |
| Bottled, Tank, or LP Gas | 21,069 (6.1%) | 5,615 (2.8%) |
| Electricity | 72,291 (20.8%) | 85,662 (43.1%) |
| Fuel Oil or Kerosene | 199 (0.1%) | 149 (0.1%) |
| Coal or Coke | 14 (0.0%) | 39 (0.0%) |
| All other Fuels | 5,518 (1.6%) | 1,616 (0.8%) |
| No Fuel Used | 573 (0.2%) | 1,134 (0.6%) |
| Total | 347,877 (100.0%) | 198,784 (100.0%) |
Household Vehicle Usage in Area Code 816
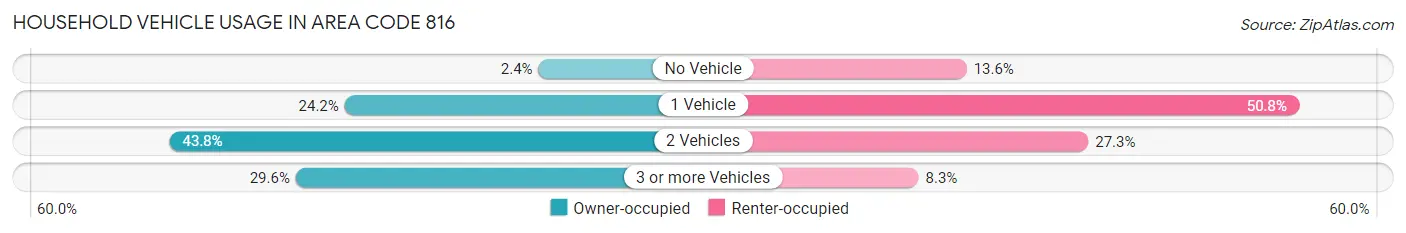
| Vehicles per Household | Owner-occupied | Renter-occupied |
| No Vehicle | 8,474 (2.4%) | 27,122 (13.6%) |
| 1 Vehicle | 84,016 (24.1%) | 101,058 (50.8%) |
| 2 Vehicles | 152,303 (43.8%) | 54,197 (27.3%) |
| 3 or more Vehicles | 103,084 (29.6%) | 16,407 (8.3%) |
| Total | 347,877 (100.0%) | 198,784 (100.0%) |
Real Estate & Mortgages in Area Code 816
Real Estate and Mortgage Overview in Area Code 816
| Characteristic | Without Mortgage | With Mortgage |
| Housing Units | 124,283 | 223,594 |
| Median Property Value | $24,749,000 | $31,174,901 |
| Median Household Income | $8,992,118 | $59,645 |
| Monthly Housing Costs | $80,768 | $14,853 |
| Real Estate Taxes | $270,251 | $4,068 |
Property Value by Mortgage Status in Area Code 816
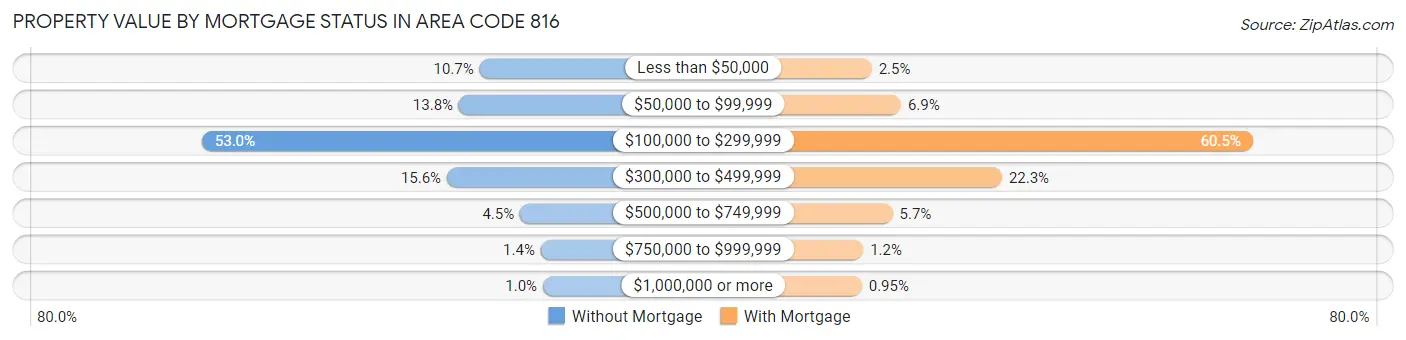
| Property Value | Without Mortgage | With Mortgage |
| Less than $50,000 | 13,272 (10.7%) | 5,516 (2.5%) |
| $50,000 to $99,999 | 17,182 (13.8%) | 15,481 (6.9%) |
| $100,000 to $299,999 | 65,845 (53.0%) | 135,318 (60.5%) |
| $300,000 to $499,999 | 19,439 (15.6%) | 49,884 (22.3%) |
| $500,000 to $749,999 | 5,598 (4.5%) | 12,641 (5.7%) |
| $750,000 to $999,999 | 1,683 (1.3%) | 2,626 (1.2%) |
| $1,000,000 or more | 1,264 (1.0%) | 2,128 (0.9%) |
| Total | 124,283 (100.0%) | 223,594 (100.0%) |
Household Income by Mortgage Status in Area Code 816
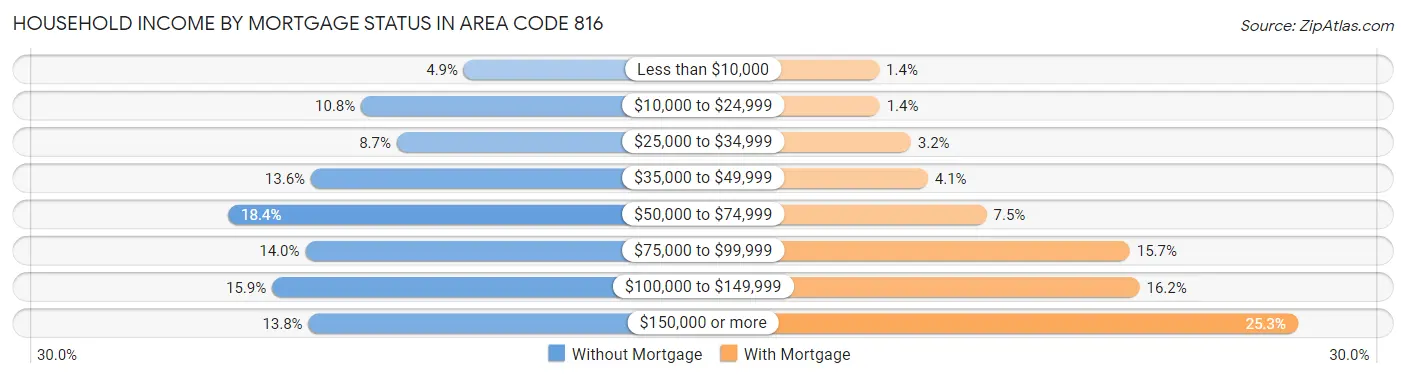
| Household Income | Without Mortgage | With Mortgage |
| Less than $10,000 | 6,092 (4.9%) | 3,013 (1.3%) |
| $10,000 to $24,999 | 13,384 (10.8%) | 3,087 (1.4%) |
| $25,000 to $34,999 | 10,847 (8.7%) | 7,070 (3.2%) |
| $35,000 to $49,999 | 16,958 (13.6%) | 9,242 (4.1%) |
| $50,000 to $74,999 | 22,829 (18.4%) | 16,739 (7.5%) |
| $75,000 to $99,999 | 17,345 (14.0%) | 35,027 (15.7%) |
| $100,000 to $149,999 | 19,706 (15.9%) | 36,286 (16.2%) |
| $150,000 or more | 17,122 (13.8%) | 56,498 (25.3%) |
| Total | 124,283 (100.0%) | 223,594 (100.0%) |
Property Value to Household Income Ratio in Area Code 816
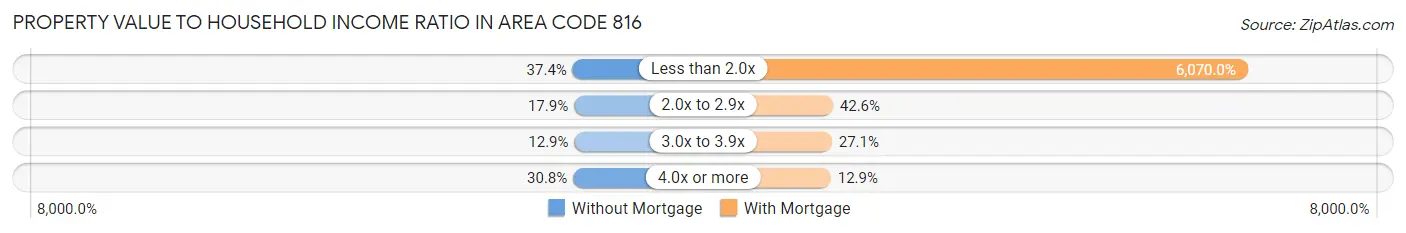
| Value-to-Income Ratio | Without Mortgage | With Mortgage |
| Less than 2.0x | 46,519 (37.4%) | 13,572,172 (6,070.0%) |
| 2.0x to 2.9x | 22,226 (17.9%) | 95,170 (42.6%) |
| 3.0x to 3.9x | 16,008 (12.9%) | 60,682 (27.1%) |
| 4.0x or more | 38,300 (30.8%) | 28,927 (12.9%) |
| Total | 124,283 (100.0%) | 223,594 (100.0%) |
Real Estate Taxes by Mortgage Status in Area Code 816
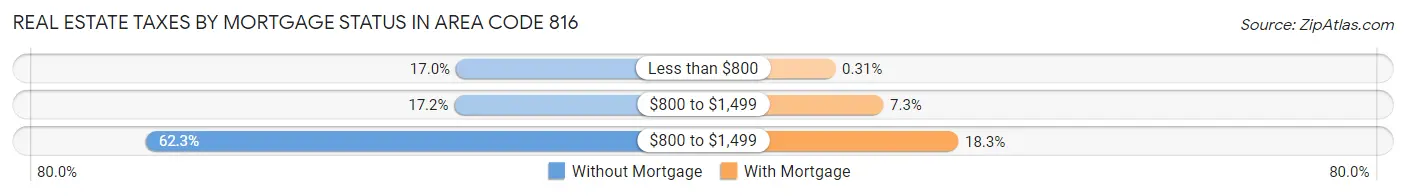
| Property Taxes | Without Mortgage | With Mortgage |
| Less than $800 | 21,100 (17.0%) | 699 (0.3%) |
| $800 to $1,499 | 21,385 (17.2%) | 16,335 (7.3%) |
| $800 to $1,499 | 77,418 (62.3%) | 40,852 (18.3%) |
| Total | 124,283 (100.0%) | 223,594 (100.0%) |
Health & Disability in Area Code 816
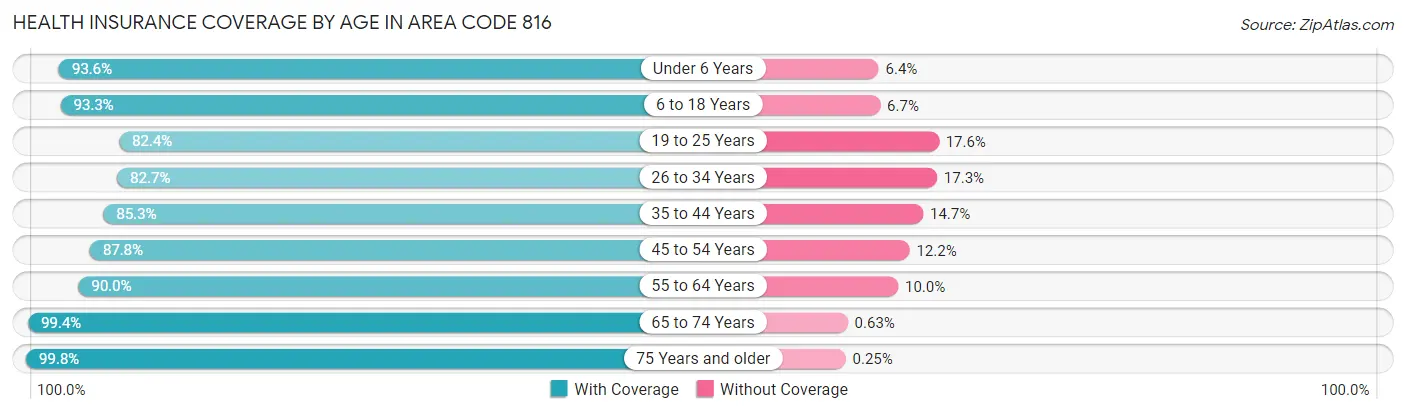
Health Insurance Coverage by Age in Area Code 816
| Age Bracket | With Coverage | Without Coverage |
| Under 6 Years | 93,235 (93.6%) | 6,369 (6.4%) |
| 6 to 18 Years | 215,084 (93.3%) | 15,412 (6.7%) |
| 19 to 25 Years | 94,518 (82.4%) | 20,182 (17.6%) |
| 26 to 34 Years | 143,244 (82.7%) | 29,893 (17.3%) |
| 35 to 44 Years | 149,924 (85.3%) | 25,802 (14.7%) |
| 45 to 54 Years | 144,079 (87.8%) | 19,953 (12.2%) |
| 55 to 64 Years | 155,414 (90.0%) | 17,302 (10.0%) |
| 65 to 74 Years | 122,871 (99.4%) | 777 (0.6%) |
| 75 Years and older | 81,408 (99.8%) | 208 (0.3%) |
| Total | 1,199,777 (89.8%) | 135,898 (10.2%) |
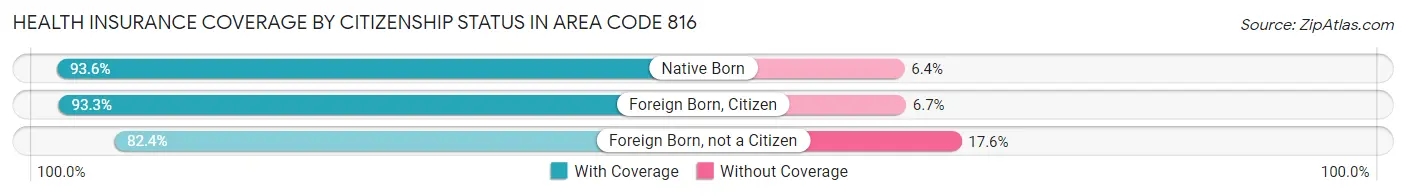
Health Insurance Coverage by Citizenship Status in Area Code 816
| Citizenship Status | With Coverage | Without Coverage |
| Native Born | 93,235 (93.6%) | 6,369 (6.4%) |
| Foreign Born, Citizen | 215,084 (93.3%) | 15,412 (6.7%) |
| Foreign Born, not a Citizen | 94,518 (82.4%) | 20,182 (17.6%) |
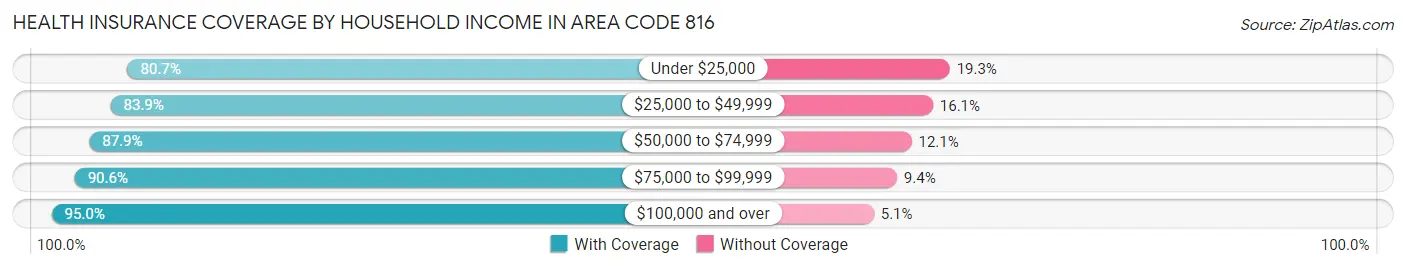
Health Insurance Coverage by Household Income in Area Code 816
| Household Income | With Coverage | Without Coverage |
| Under $25,000 | 116,806 (80.7%) | 27,892 (19.3%) |
| $25,000 to $49,999 | 173,372 (83.9%) | 33,312 (16.1%) |
| $50,000 to $74,999 | 192,545 (87.9%) | 26,590 (12.1%) |
| $75,000 to $99,999 | 182,256 (90.6%) | 18,885 (9.4%) |
| $100,000 and over | 527,436 (95.0%) | 28,065 (5.1%) |
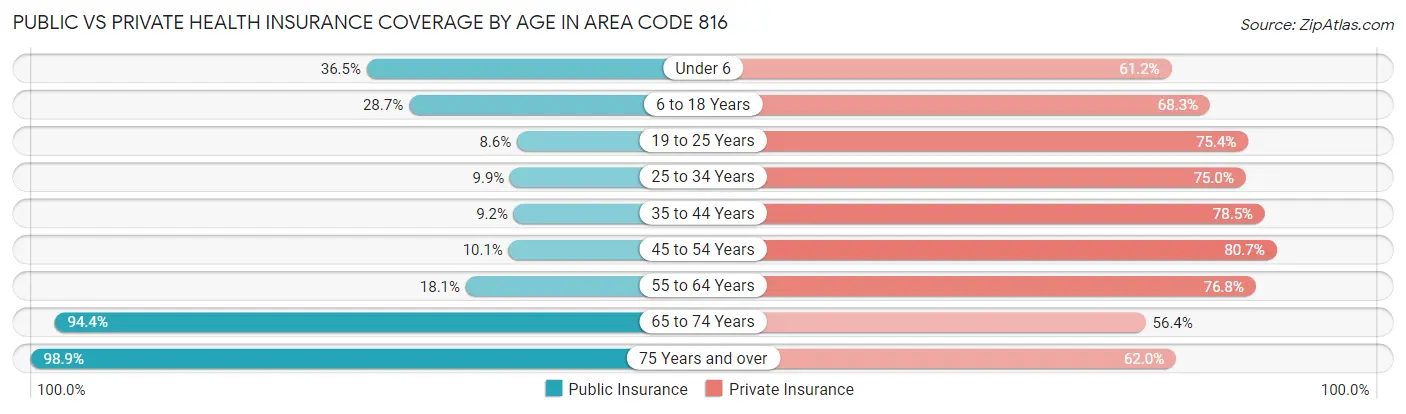
Public vs Private Health Insurance Coverage by Age in Area Code 816
| Age Bracket | Public Insurance | Private Insurance |
| Under 6 | 36,333 (36.5%) | 60,938 (61.2%) |
| 6 to 18 Years | 66,029 (28.6%) | 157,481 (68.3%) |
| 19 to 25 Years | 9,866 (8.6%) | 86,522 (75.4%) |
| 25 to 34 Years | 17,085 (9.9%) | 129,796 (75.0%) |
| 35 to 44 Years | 16,161 (9.2%) | 138,001 (78.5%) |
| 45 to 54 Years | 16,629 (10.1%) | 132,346 (80.7%) |
| 55 to 64 Years | 31,258 (18.1%) | 132,721 (76.8%) |
| 65 to 74 Years | 116,756 (94.4%) | 69,719 (56.4%) |
| 75 Years and over | 80,699 (98.9%) | 50,631 (62.0%) |
| Total | 390,816 (29.3%) | 958,155 (71.7%) |
Disability Status by Sex by Age in Area Code 816
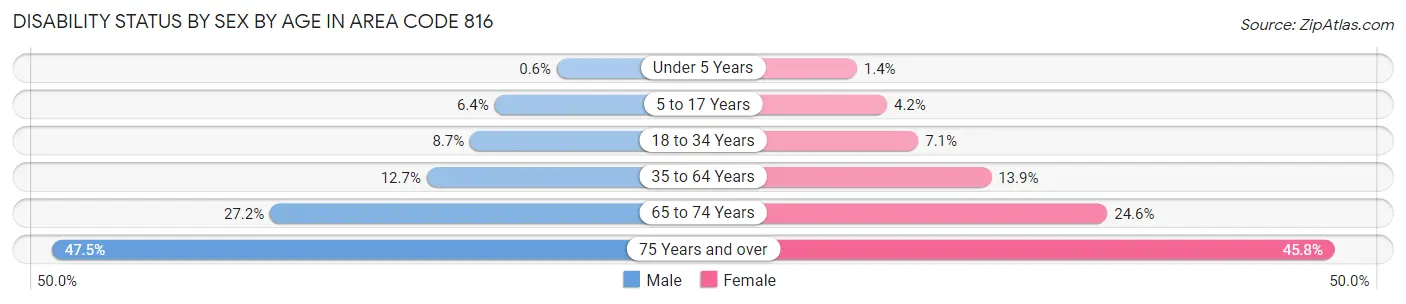
| Age Bracket | Male | Female |
| Under 5 Years | 256 (0.6%) | 566 (1.4%) |
| 5 to 17 Years | 7,517 (6.4%) | 4,772 (4.2%) |
| 18 to 34 Years | 13,103 (8.7%) | 10,830 (7.1%) |
| 35 to 64 Years | 32,154 (12.7%) | 35,911 (13.9%) |
| 65 to 74 Years | 15,592 (27.2%) | 16,353 (24.6%) |
| 75 Years and over | 15,763 (47.5%) | 22,145 (45.8%) |
Disability Class by Sex by Age in Area Code 816
Disability Class: Hearing Difficulty
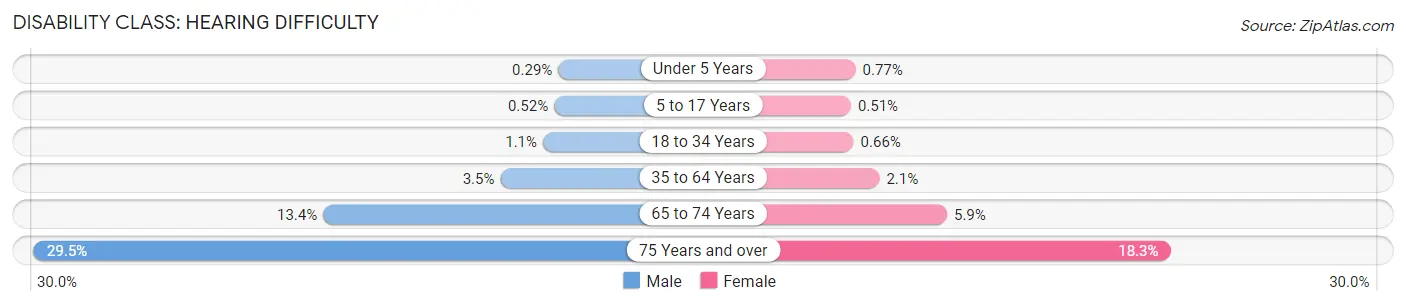
| Age Bracket | Male | Female |
| Under 5 Years | 124 (0.3%) | 310 (0.8%) |
| 5 to 17 Years | 612 (0.5%) | 583 (0.5%) |
| 18 to 34 Years | 1,731 (1.1%) | 1,008 (0.7%) |
| 35 to 64 Years | 8,903 (3.5%) | 5,435 (2.1%) |
| 65 to 74 Years | 7,664 (13.4%) | 3,887 (5.9%) |
| 75 Years and over | 9,790 (29.5%) | 8,853 (18.3%) |
Disability Class: Vision Difficulty
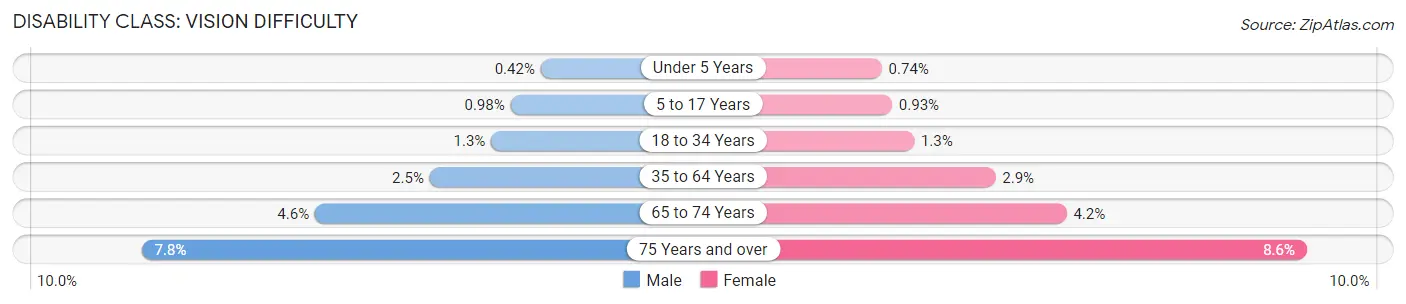
| Age Bracket | Male | Female |
| Under 5 Years | 178 (0.4%) | 299 (0.7%) |
| 5 to 17 Years | 1,157 (1.0%) | 1,057 (0.9%) |
| 18 to 34 Years | 2,029 (1.3%) | 2,037 (1.3%) |
| 35 to 64 Years | 6,291 (2.5%) | 7,389 (2.9%) |
| 65 to 74 Years | 2,642 (4.6%) | 2,767 (4.2%) |
| 75 Years and over | 2,600 (7.8%) | 4,180 (8.6%) |
Disability Class: Cognitive Difficulty
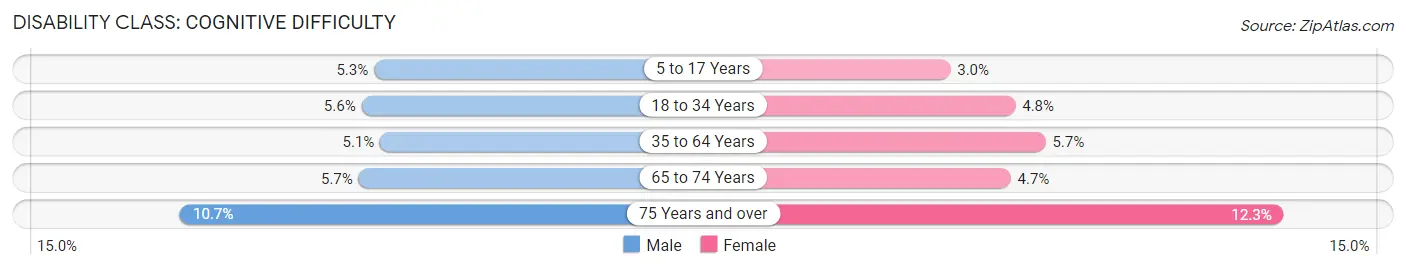
| Age Bracket | Male | Female |
| 5 to 17 Years | 6,204 (5.3%) | 3,427 (3.0%) |
| 18 to 34 Years | 8,507 (5.6%) | 7,363 (4.8%) |
| 35 to 64 Years | 12,936 (5.1%) | 14,685 (5.7%) |
| 65 to 74 Years | 3,266 (5.7%) | 3,118 (4.7%) |
| 75 Years and over | 3,544 (10.7%) | 5,952 (12.3%) |
Disability Class: Ambulatory Difficulty
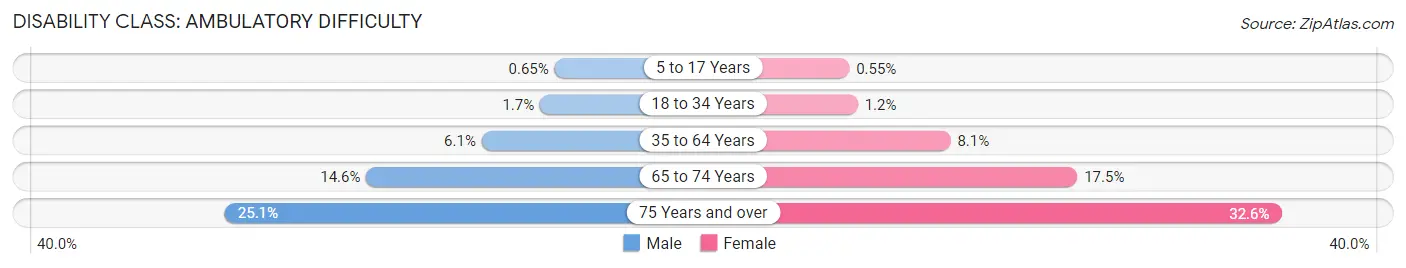
| Age Bracket | Male | Female |
| 5 to 17 Years | 763 (0.6%) | 628 (0.5%) |
| 18 to 34 Years | 2,624 (1.7%) | 1,803 (1.2%) |
| 35 to 64 Years | 15,373 (6.1%) | 20,886 (8.1%) |
| 65 to 74 Years | 8,378 (14.6%) | 11,605 (17.5%) |
| 75 Years and over | 8,344 (25.1%) | 15,796 (32.6%) |
Disability Class: Self-Care Difficulty
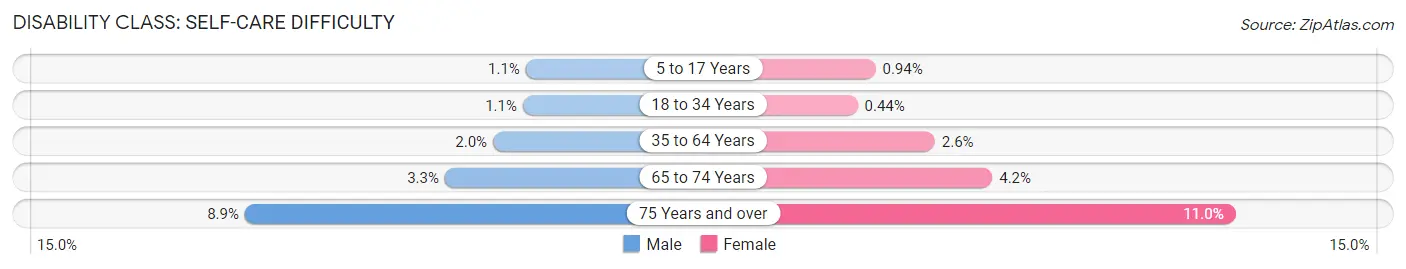
| Age Bracket | Male | Female |
| 5 to 17 Years | 1,234 (1.1%) | 1,073 (0.9%) |
| 18 to 34 Years | 1,714 (1.1%) | 675 (0.4%) |
| 35 to 64 Years | 4,979 (2.0%) | 6,701 (2.6%) |
| 65 to 74 Years | 1,888 (3.3%) | 2,782 (4.2%) |
| 75 Years and over | 2,945 (8.9%) | 5,305 (11.0%) |
Technology Access in Area Code 816
Computing Device Access in Area Code 816
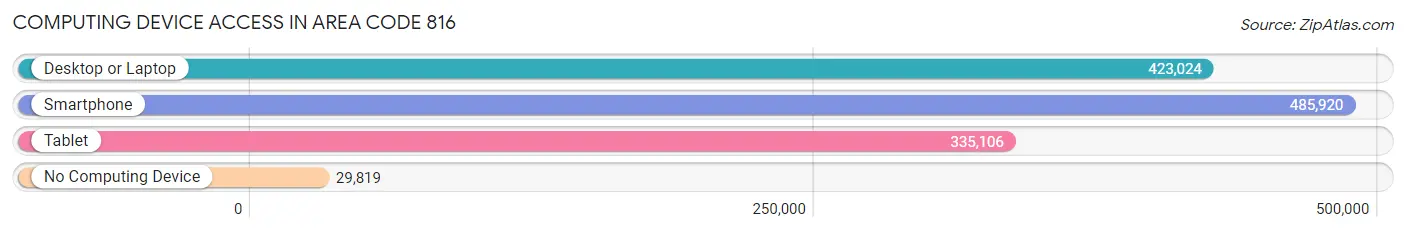
| Device Type | # Households | % Households |
| Desktop or Laptop | 423,024 | 77.4% |
| Smartphone | 485,920 | 88.9% |
| Tablet | 335,106 | 61.3% |
| No Computing Device | 29,819 | 5.4% |
| Total | 546,661 | 100.0% |
Internet Access in Area Code 816
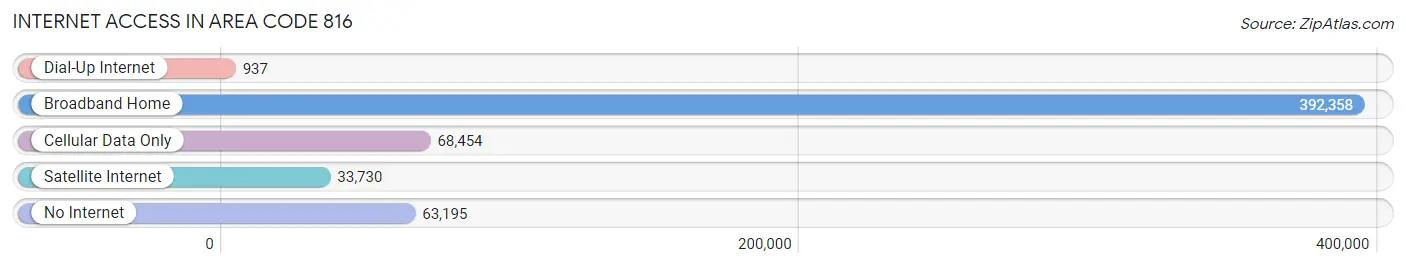
| Internet Type | # Households | % Households |
| Dial-Up Internet | 937 | 0.2% |
| Broadband Home | 392,358 | 71.8% |
| Cellular Data Only | 68,454 | 12.5% |
| Satellite Internet | 33,730 | 6.2% |
| No Internet | 63,195 | 11.6% |
| Total | 546,661 | 100.0% |
Area Code 816 Summary
Geography
Area code 816 is located in the state of Missouri and covers the Kansas City metropolitan area. It includes the counties of Jackson, Clay, Platte, and Cass.
Social
Area code 816 is home to a diverse population of people from all walks of life. The area is known for its vibrant music and art scene, as well as its many cultural attractions.
Economics
The economy of area code 816 is largely driven by the service industry, with many businesses providing services to the local population. The area is also home to a number of large corporations, such as Sprint, Hallmark, and H&R Block.
Demographics
The population of area code 816 is estimated to be around 1.7 million people. The majority of the population is white, followed by African American, Hispanic, and Asian. The median household income is around $50,000, and the median age is around 35 years old.
Common Questions
What is Per Capita Income in Area Code 816?
Per Capita income in Area Code 816 is $36,474.
What is the Median Family Income in Area Code 816?
Median Family Income in Area Code 816 is $90,650.
What is the Median Household income in Area Code 816?
Median Household Income in Area Code 816 is $75,202.
What is Income or Wage Gap in Area Code 816?
Income or Wage Gap in Area Code 816 is 28.4%.
Women in Area Code 816 earn 71.6 cents for every dollar earned by a man.
What is Family Income Deficit in Area Code 816?
Family Income Deficit in Area Code 816 is $11,872.
Families that are below poverty line in Area Code 816 earn $11,872 less on average than the poverty threshold level.
What is Inequality or Gini Index in Area Code 816?
Inequality or Gini Index in Area Code 816 is 57.49.
What is the Total Population of Area Code 816?
Total Population of Area Code 816 is 1,352,184.
What is the Total Male Population of Area Code 816?
Total Male Population of Area Code 816 is 666,404.
What is the Total Female Population of Area Code 816?
Total Female Population of Area Code 816 is 685,780.
What is the Ratio of Males per 100 Females in Area Code 816?
There are 97.17 Males per 100 Females in Area Code 816.
What is the Ratio of Females per 100 Males in Area Code 816?
There are 102.91 Females per 100 Males in Area Code 816.
What is the Median Population Age in Area Code 816?
Median Population Age in Area Code 816 is 39.2 Years.
What is the Average Family Size in Area Code 816
Average Family Size in Area Code 816 is 3.1 People.
What is the Average Household Size in Area Code 816
Average Household Size in Area Code 816 is 2.6 People.
How Large is the Labor Force in Area Code 816?
There are 697,619 People in the Labor Forcein in Area Code 816.
What is the Percentage of People in the Labor Force in Area Code 816?
65.0% of People are in the Labor Force in Area Code 816.
What is the Unemployment Rate in Area Code 816?
Unemployment Rate in Area Code 816 is 4.9%.