Independence, MO Map & Demographics
Independence Map
Independence Overview
$31,491
PER CAPITA INCOME
$74,081
AVG FAMILY INCOME
$57,415
AVG HOUSEHOLD INCOME
32.6%
WAGE / INCOME GAP [ % ]
67.4¢/ $1
WAGE / INCOME GAP [ $ ]
$10,632
FAMILY INCOME DEFICIT
0.43
INEQUALITY / GINI INDEX
122,218
TOTAL POPULATION
59,510
MALE POPULATION
62,708
FEMALE POPULATION
94.90
MALES / 100 FEMALES
105.37
FEMALES / 100 MALES
39.5
MEDIAN AGE
3.0
AVG FAMILY SIZE
2.4
AVG HOUSEHOLD SIZE
61,476
LABOR FORCE [ PEOPLE ]
63.0%
PERCENT IN LABOR FORCE
6.2%
UNEMPLOYMENT RATE
Independence Area Codes
Income in Independence
Income Overview in Independence
Per Capita Income in Independence is $31,491, while median incomes of families and households are $74,081 and $57,415 respectively.
| Characteristic | Number | Measure |
| Per Capita Income | 122,218 | $31,491 |
| Median Family Income | 30,048 | $74,081 |
| Mean Family Income | 30,048 | $88,491 |
| Median Household Income | 51,251 | $57,415 |
| Mean Household Income | 51,251 | $73,996 |
| Income Deficit | 30,048 | $10,632 |
| Wage / Income Gap (%) | 122,218 | 32.57% |
| Wage / Income Gap ($) | 122,218 | 67.43¢ per $1 |
| Gini / Inequality Index | 122,218 | 0.43 |
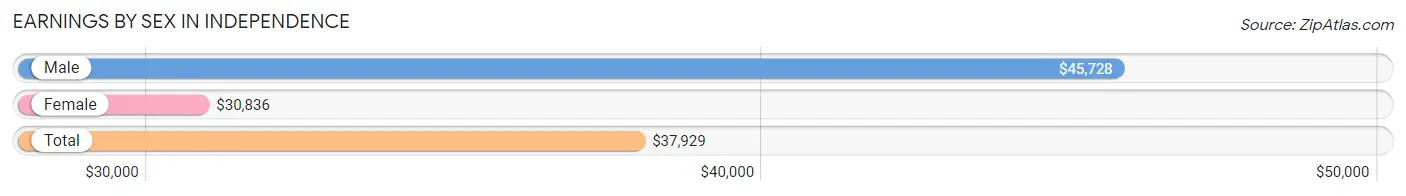
Earnings by Sex in Independence
Average Earnings in Independence are $37,929, $45,728 for men and $30,836 for women, a difference of 32.6%.
| Sex | Number | Average Earnings |
| Male | 33,066 (52.7%) | $45,728 |
| Female | 29,691 (47.3%) | $30,836 |
| Total | 62,757 (100.0%) | $37,929 |
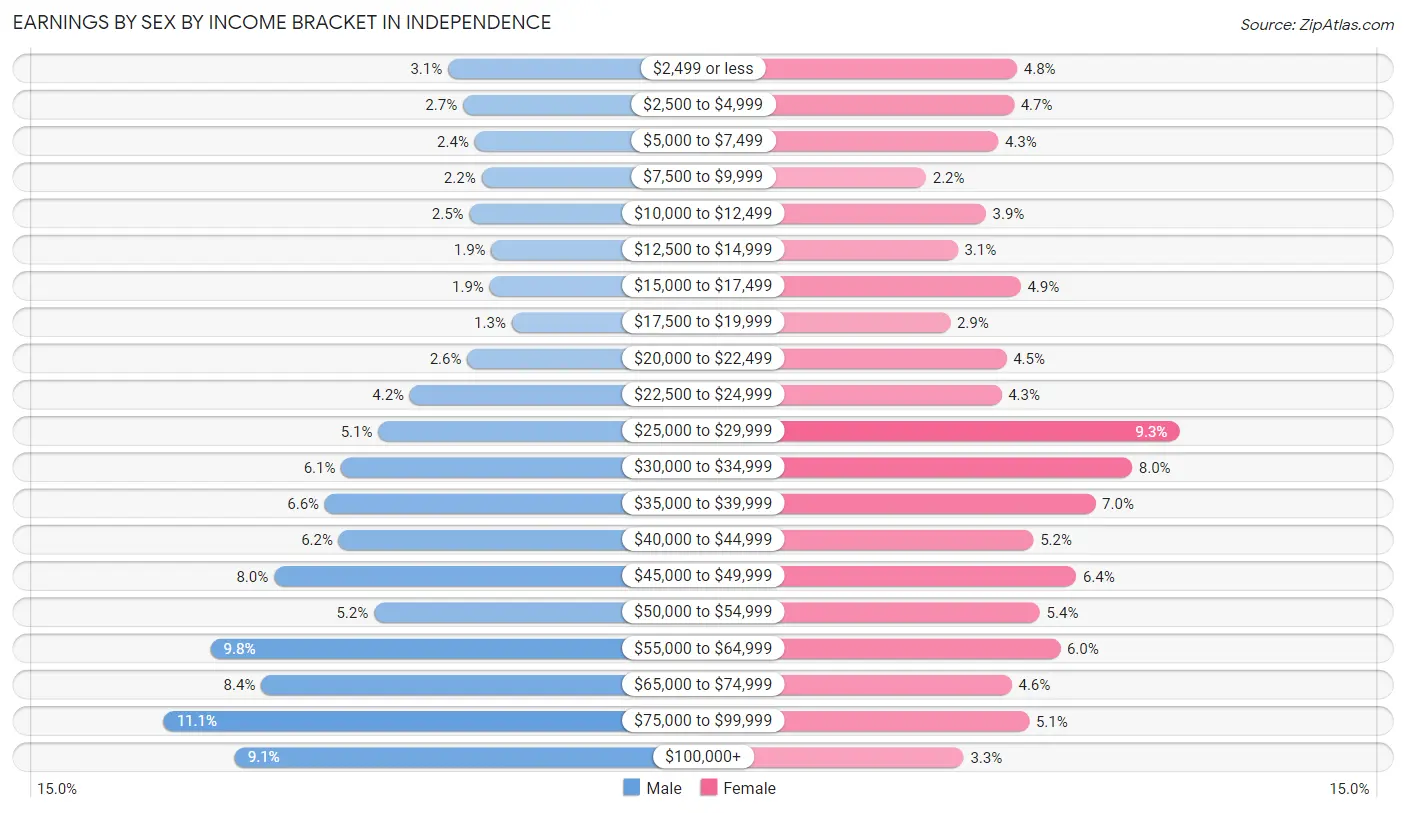
Earnings by Sex by Income Bracket in Independence
The most common earnings brackets in Independence are $75,000 to $99,999 for men (3,668 | 11.1%) and $25,000 to $29,999 for women (2,773 | 9.3%).
| Income | Male | Female |
| $2,499 or less | 1,026 (3.1%) | 1,419 (4.8%) |
| $2,500 to $4,999 | 885 (2.7%) | 1,392 (4.7%) |
| $5,000 to $7,499 | 776 (2.4%) | 1,261 (4.3%) |
| $7,500 to $9,999 | 715 (2.2%) | 660 (2.2%) |
| $10,000 to $12,499 | 828 (2.5%) | 1,159 (3.9%) |
| $12,500 to $14,999 | 622 (1.9%) | 923 (3.1%) |
| $15,000 to $17,499 | 637 (1.9%) | 1,448 (4.9%) |
| $17,500 to $19,999 | 434 (1.3%) | 860 (2.9%) |
| $20,000 to $22,499 | 848 (2.6%) | 1,331 (4.5%) |
| $22,500 to $24,999 | 1,378 (4.2%) | 1,289 (4.3%) |
| $25,000 to $29,999 | 1,674 (5.1%) | 2,773 (9.3%) |
| $30,000 to $34,999 | 2,018 (6.1%) | 2,378 (8.0%) |
| $35,000 to $39,999 | 2,168 (6.6%) | 2,072 (7.0%) |
| $40,000 to $44,999 | 2,039 (6.2%) | 1,556 (5.2%) |
| $45,000 to $49,999 | 2,641 (8.0%) | 1,912 (6.4%) |
| $50,000 to $54,999 | 1,713 (5.2%) | 1,610 (5.4%) |
| $55,000 to $64,999 | 3,231 (9.8%) | 1,779 (6.0%) |
| $65,000 to $74,999 | 2,760 (8.4%) | 1,376 (4.6%) |
| $75,000 to $99,999 | 3,668 (11.1%) | 1,520 (5.1%) |
| $100,000+ | 3,005 (9.1%) | 973 (3.3%) |
| Total | 33,066 (100.0%) | 29,691 (100.0%) |
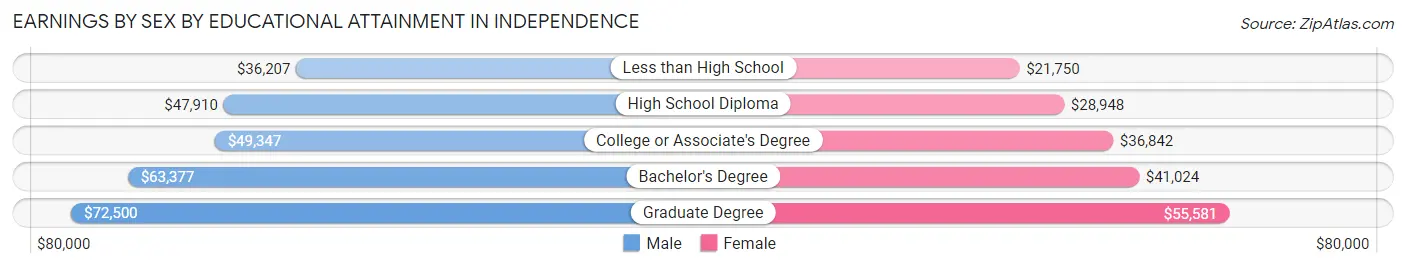
Earnings by Sex by Educational Attainment in Independence
Average earnings in Independence are $49,887 for men and $34,561 for women, a difference of 30.7%. Men with an educational attainment of graduate degree enjoy the highest average annual earnings of $72,500, while those with less than high school education earn the least with $36,207. Women with an educational attainment of graduate degree earn the most with the average annual earnings of $55,581, while those with less than high school education have the smallest earnings of $21,750.
| Educational Attainment | Male Income | Female Income |
| Less than High School | $36,207 | $21,750 |
| High School Diploma | $47,910 | $28,948 |
| College or Associate's Degree | $49,347 | $36,842 |
| Bachelor's Degree | $63,377 | $41,024 |
| Graduate Degree | $72,500 | $55,581 |
| Total | $49,887 | $34,561 |
Family Income in Independence
Family Income Brackets in Independence
According to the Independence family income data, there are 6,280 families falling into the $50,000 to $74,999 income range, which is the most common income bracket and makes up 20.9% of all families. Conversely, the $10,000 to $14,999 income bracket is the least frequent group with only 571 families (1.9%) belonging to this category.
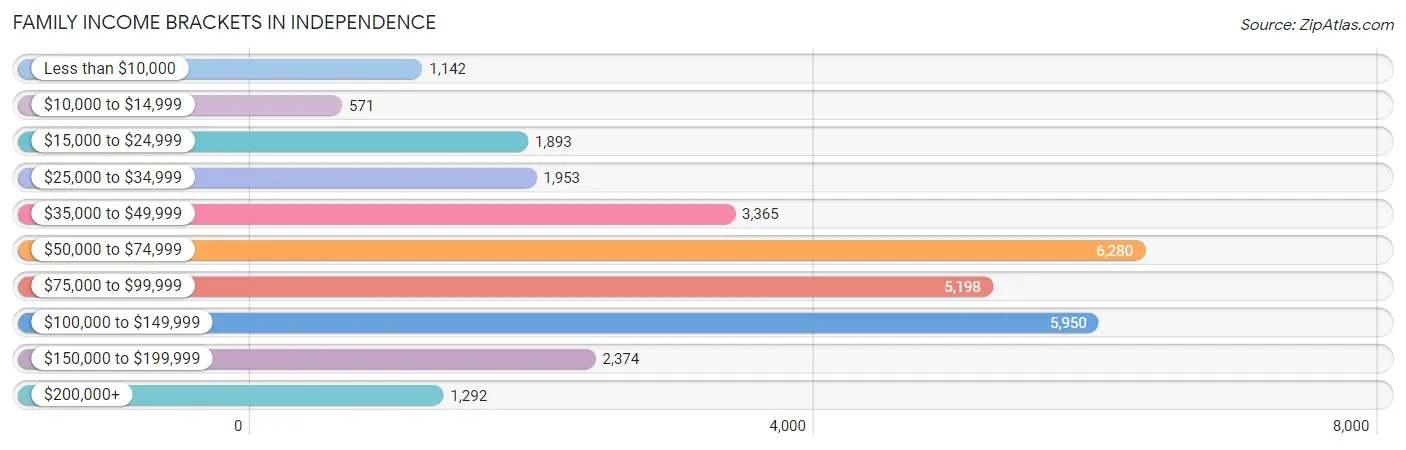
| Income Bracket | # Families | % Families |
| Less than $10,000 | 1,142 | 3.8% |
| $10,000 to $14,999 | 571 | 1.9% |
| $15,000 to $24,999 | 1,893 | 6.3% |
| $25,000 to $34,999 | 1,953 | 6.5% |
| $35,000 to $49,999 | 3,365 | 11.2% |
| $50,000 to $74,999 | 6,280 | 20.9% |
| $75,000 to $99,999 | 5,198 | 17.3% |
| $100,000 to $149,999 | 5,950 | 19.8% |
| $150,000 to $199,999 | 2,374 | 7.9% |
| $200,000+ | 1,292 | 4.3% |
Family Income by Famaliy Size in Independence
7+ person families (522 | 1.7%) account for the highest median family income in Independence with $103,235 per family, while 2-person families (15,081 | 50.2%) have the highest median income of $34,532 per family member.
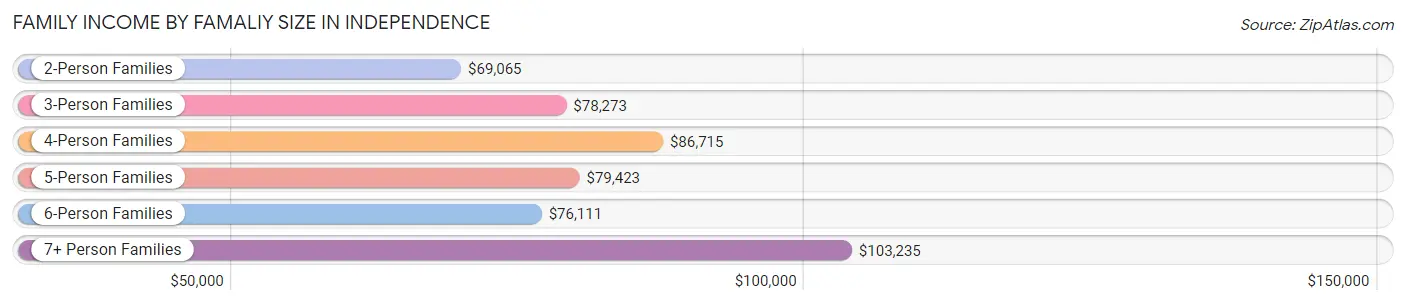
| Income Bracket | # Families | Median Income |
| 2-Person Families | 15,081 (50.2%) | $69,065 |
| 3-Person Families | 6,676 (22.2%) | $78,273 |
| 4-Person Families | 4,477 (14.9%) | $86,715 |
| 5-Person Families | 2,114 (7.0%) | $79,423 |
| 6-Person Families | 1,178 (3.9%) | $76,111 |
| 7+ Person Families | 522 (1.7%) | $103,235 |
| Total | 30,048 (100.0%) | $74,081 |
Family Income by Number of Earners in Independence
The median family income in Independence is $74,081, with families comprising 3+ earners (3,325) having the highest median family income of $123,678, while families with 1 earner (10,930) have the lowest median family income of $50,376, accounting for 11.1% and 36.4% of families, respectively.
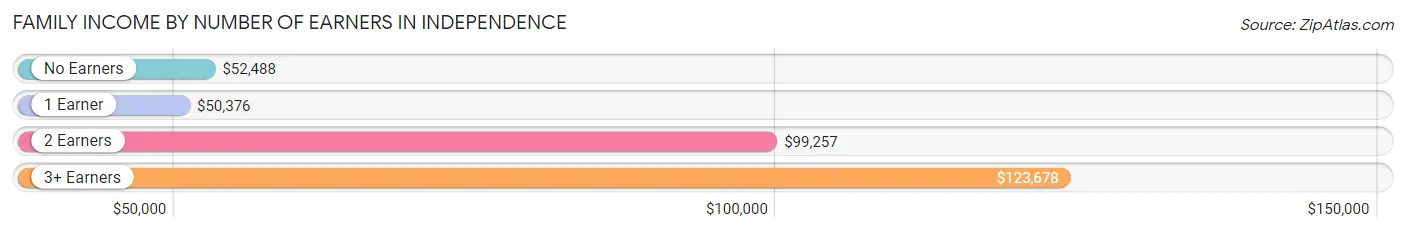
| Number of Earners | # Families | Median Income |
| No Earners | 4,634 (15.4%) | $52,488 |
| 1 Earner | 10,930 (36.4%) | $50,376 |
| 2 Earners | 11,159 (37.1%) | $99,257 |
| 3+ Earners | 3,325 (11.1%) | $123,678 |
| Total | 30,048 (100.0%) | $74,081 |
Household Income in Independence
Household Income Brackets in Independence
With 10,199 households falling in the category, the $50,000 to $74,999 income range is the most frequent in Independence, accounting for 19.9% of all households. In contrast, only 1,589 households (3.1%) fall into the $200,000+ income bracket, making it the least populous group.
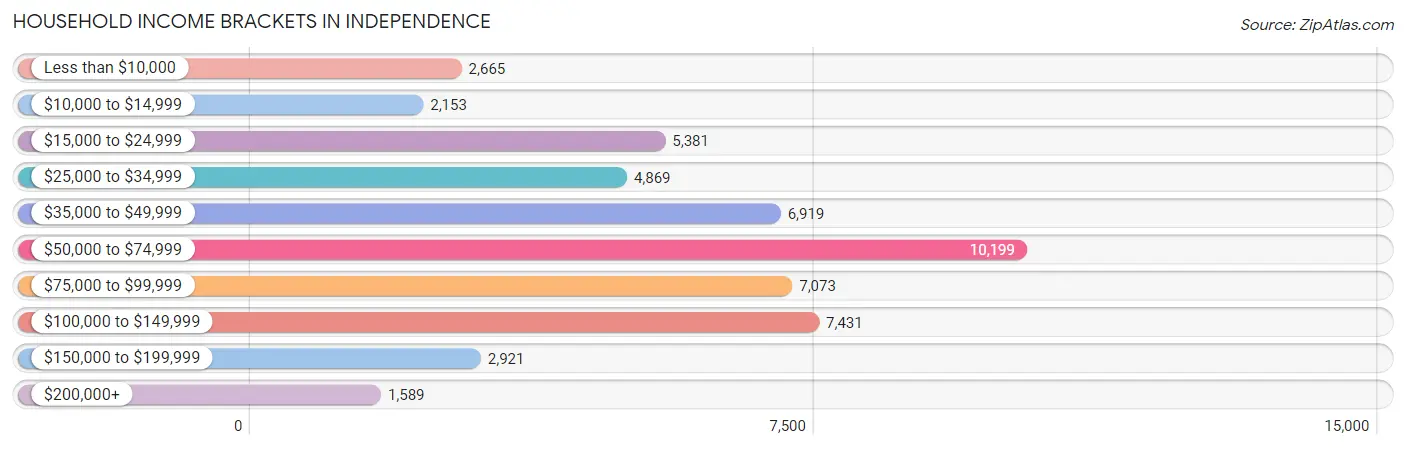
| Income Bracket | # Households | % Households |
| Less than $10,000 | 2,665 | 5.2% |
| $10,000 to $14,999 | 2,153 | 4.2% |
| $15,000 to $24,999 | 5,381 | 10.5% |
| $25,000 to $34,999 | 4,869 | 9.5% |
| $35,000 to $49,999 | 6,919 | 13.5% |
| $50,000 to $74,999 | 10,199 | 19.9% |
| $75,000 to $99,999 | 7,073 | 13.8% |
| $100,000 to $149,999 | 7,431 | 14.5% |
| $150,000 to $199,999 | 2,921 | 5.7% |
| $200,000+ | 1,589 | 3.1% |
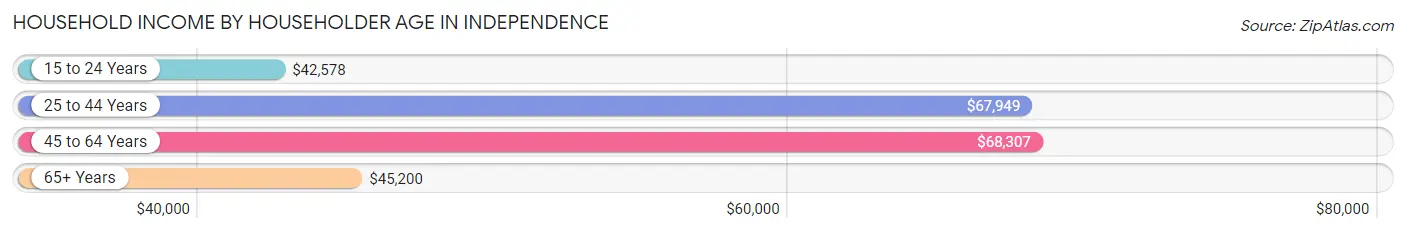
Household Income by Householder Age in Independence
The median household income in Independence is $57,415, with the highest median household income of $68,307 found in the 45 to 64 years age bracket for the primary householder. A total of 17,001 households (33.2%) fall into this category. Meanwhile, the 15 to 24 years age bracket for the primary householder has the lowest median household income of $42,578, with 2,199 households (4.3%) in this group.
| Income Bracket | # Households | Median Income |
| 15 to 24 Years | 2,199 (4.3%) | $42,578 |
| 25 to 44 Years | 17,146 (33.5%) | $67,949 |
| 45 to 64 Years | 17,001 (33.2%) | $68,307 |
| 65+ Years | 14,905 (29.1%) | $45,200 |
| Total | 51,251 (100.0%) | $57,415 |
Poverty in Independence
Income Below Poverty by Sex and Age in Independence
With 13.1% poverty level for males and 17.1% for females among the residents of Independence, 5 year old males and under 5 year old females are the most vulnerable to poverty, with 216 males (30.1%) and 1,123 females (30.4%) in their respective age groups living below the poverty level.
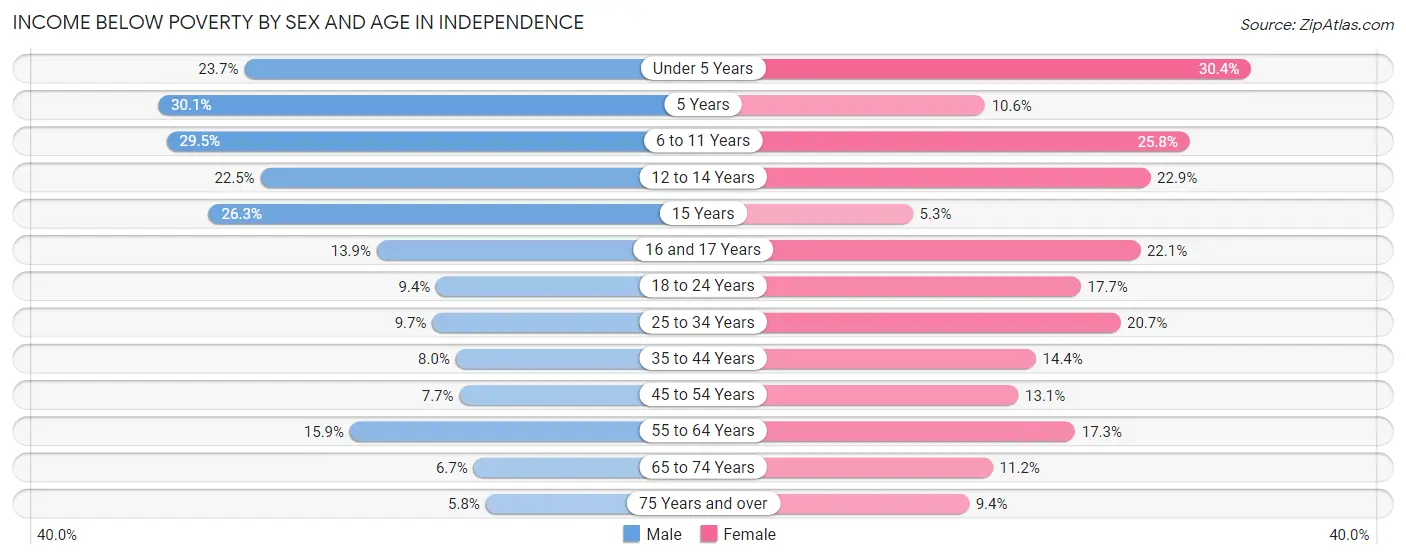
| Age Bracket | Male | Female |
| Under 5 Years | 880 (23.7%) | 1,123 (30.4%) |
| 5 Years | 216 (30.1%) | 59 (10.6%) |
| 6 to 11 Years | 1,364 (29.4%) | 1,176 (25.8%) |
| 12 to 14 Years | 555 (22.5%) | 547 (22.9%) |
| 15 Years | 203 (26.3%) | 38 (5.3%) |
| 16 and 17 Years | 192 (13.9%) | 347 (22.1%) |
| 18 to 24 Years | 468 (9.4%) | 860 (17.7%) |
| 25 to 34 Years | 822 (9.7%) | 1,721 (20.7%) |
| 35 to 44 Years | 598 (8.0%) | 1,080 (14.4%) |
| 45 to 54 Years | 540 (7.7%) | 927 (13.1%) |
| 55 to 64 Years | 1,257 (15.9%) | 1,440 (17.3%) |
| 65 to 74 Years | 373 (6.7%) | 731 (11.2%) |
| 75 Years and over | 220 (5.8%) | 538 (9.4%) |
| Total | 7,688 (13.1%) | 10,587 (17.1%) |
Income Above Poverty by Sex and Age in Independence
According to the poverty statistics in Independence, males aged 75 years and over and females aged 15 years are the age groups that are most secure financially, with 94.2% of males and 94.7% of females in these age groups living above the poverty line.
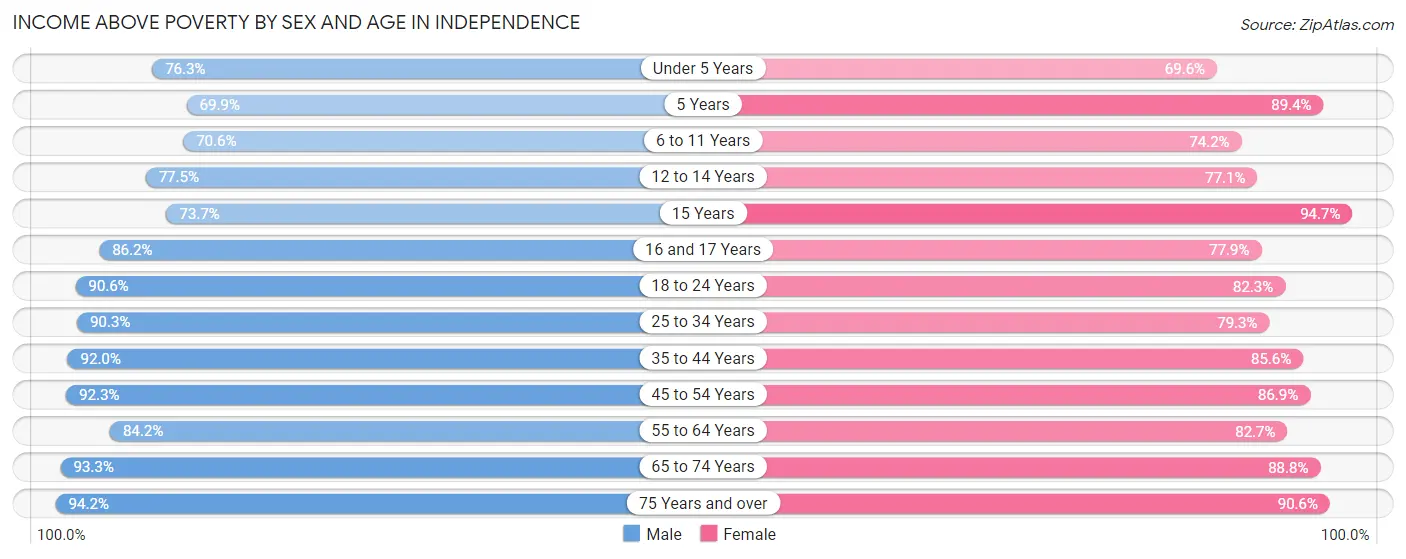
| Age Bracket | Male | Female |
| Under 5 Years | 2,835 (76.3%) | 2,574 (69.6%) |
| 5 Years | 502 (69.9%) | 497 (89.4%) |
| 6 to 11 Years | 3,267 (70.6%) | 3,377 (74.2%) |
| 12 to 14 Years | 1,913 (77.5%) | 1,843 (77.1%) |
| 15 Years | 568 (73.7%) | 684 (94.7%) |
| 16 and 17 Years | 1,194 (86.2%) | 1,220 (77.9%) |
| 18 to 24 Years | 4,492 (90.6%) | 3,991 (82.3%) |
| 25 to 34 Years | 7,626 (90.3%) | 6,609 (79.3%) |
| 35 to 44 Years | 6,889 (92.0%) | 6,423 (85.6%) |
| 45 to 54 Years | 6,451 (92.3%) | 6,154 (86.9%) |
| 55 to 64 Years | 6,676 (84.2%) | 6,886 (82.7%) |
| 65 to 74 Years | 5,218 (93.3%) | 5,797 (88.8%) |
| 75 Years and over | 3,592 (94.2%) | 5,172 (90.6%) |
| Total | 51,223 (87.0%) | 51,227 (82.9%) |
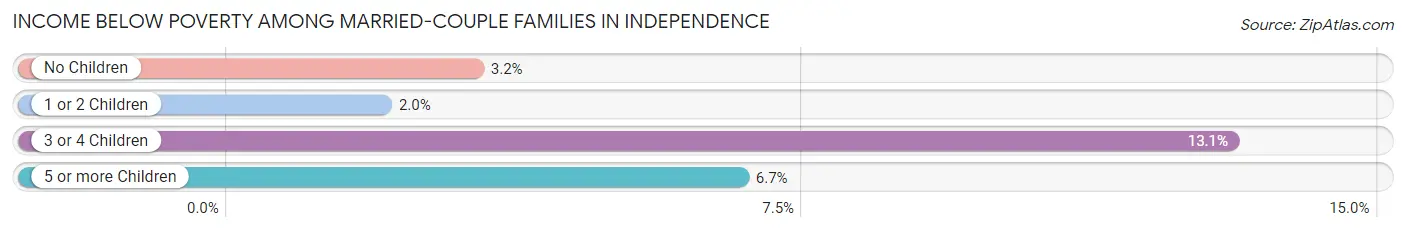
Income Below Poverty Among Married-Couple Families in Independence
The poverty statistics for married-couple families in Independence show that 3.8% or 767 of the total 20,297 families live below the poverty line. Families with 3 or 4 children have the highest poverty rate of 13.1%, comprising of 227 families. On the other hand, families with 1 or 2 children have the lowest poverty rate of 2.0%, which includes 105 families.
| Children | Above Poverty | Below Poverty |
| No Children | 12,740 (96.8%) | 423 (3.2%) |
| 1 or 2 Children | 5,113 (98.0%) | 105 (2.0%) |
| 3 or 4 Children | 1,509 (86.9%) | 227 (13.1%) |
| 5 or more Children | 168 (93.3%) | 12 (6.7%) |
| Total | 19,530 (96.2%) | 767 (3.8%) |
Income Below Poverty Among Single-Parent Households in Independence
According to the poverty data in Independence, 7.5% or 187 single-father households and 34.4% or 2,501 single-mother households are living below the poverty line. Among single-father households, those with 3 or 4 children have the highest poverty rate, with 42 households (17.1%) experiencing poverty. Likewise, among single-mother households, those with 3 or 4 children have the highest poverty rate, with 695 households (62.2%) falling below the poverty line.
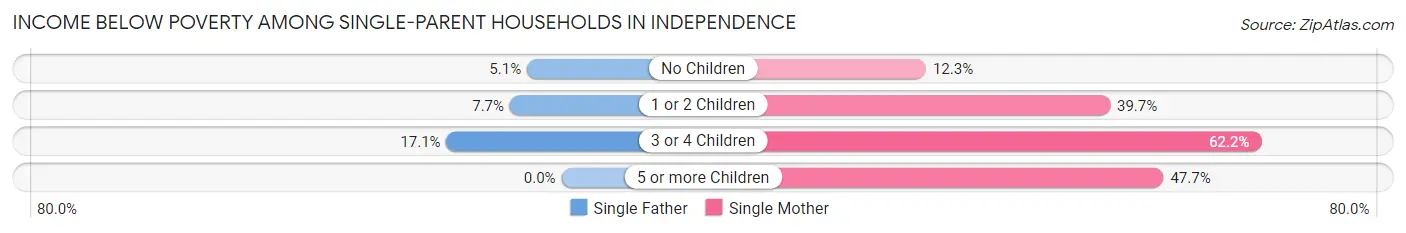
| Children | Single Father | Single Mother |
| No Children | 54 (5.1%) | 288 (12.3%) |
| 1 or 2 Children | 91 (7.7%) | 1,457 (39.7%) |
| 3 or 4 Children | 42 (17.1%) | 695 (62.2%) |
| 5 or more Children | 0 (0.0%) | 61 (47.7%) |
| Total | 187 (7.5%) | 2,501 (34.4%) |
Income Below Poverty Among Married-Couple vs Single-Parent Households in Independence
The poverty data for Independence shows that 767 of the married-couple family households (3.8%) and 2,688 of the single-parent households (27.6%) are living below the poverty level. Within the married-couple family households, those with 3 or 4 children have the highest poverty rate, with 227 households (13.1%) falling below the poverty line. Among the single-parent households, those with 3 or 4 children have the highest poverty rate, with 737 household (54.1%) living below poverty.
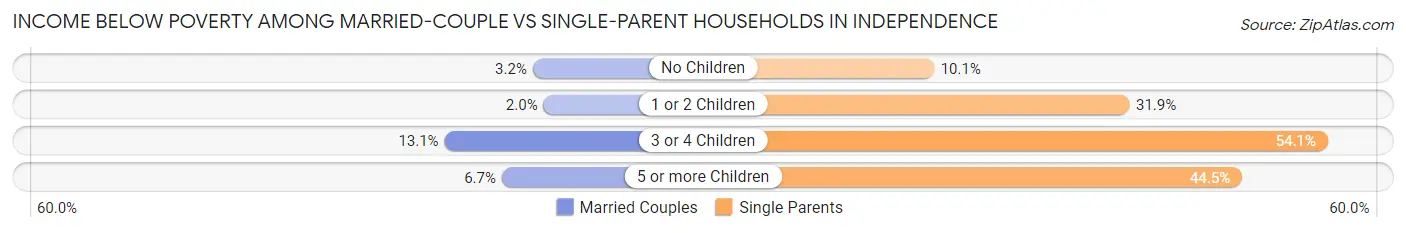
| Children | Married-Couple Families | Single-Parent Households |
| No Children | 423 (3.2%) | 342 (10.1%) |
| 1 or 2 Children | 105 (2.0%) | 1,548 (31.9%) |
| 3 or 4 Children | 227 (13.1%) | 737 (54.1%) |
| 5 or more Children | 12 (6.7%) | 61 (44.5%) |
| Total | 767 (3.8%) | 2,688 (27.6%) |
Race in Independence
The most populous races in Independence are White / Caucasian (92,606 | 75.8%), Black / African American (13,337 | 10.9%), and Hispanic or Latino (11,693 | 9.6%).
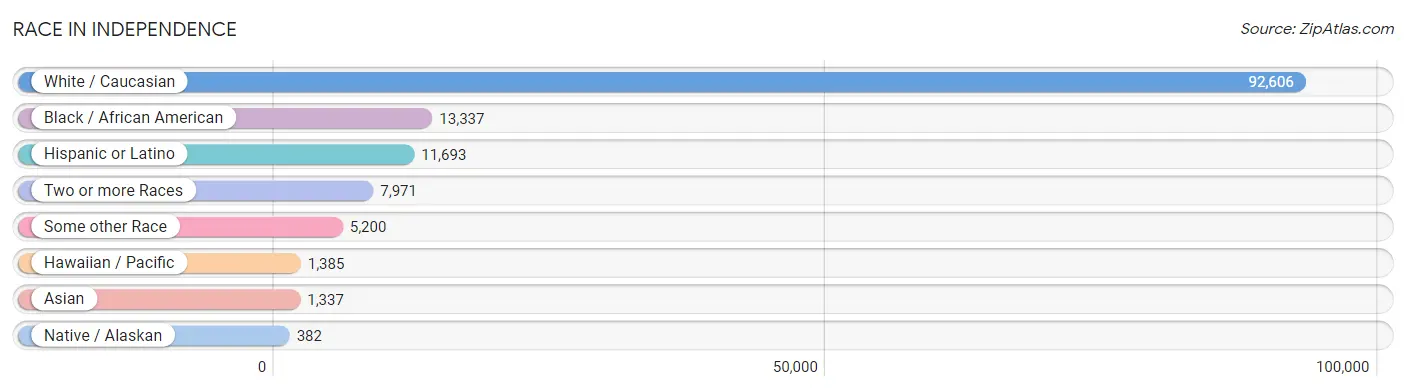
| Race | # Population | % Population |
| Asian | 1,337 | 1.1% |
| Black / African American | 13,337 | 10.9% |
| Hawaiian / Pacific | 1,385 | 1.1% |
| Hispanic or Latino | 11,693 | 9.6% |
| Native / Alaskan | 382 | 0.3% |
| White / Caucasian | 92,606 | 75.8% |
| Two or more Races | 7,971 | 6.5% |
| Some other Race | 5,200 | 4.3% |
| Total | 122,218 | 100.0% |
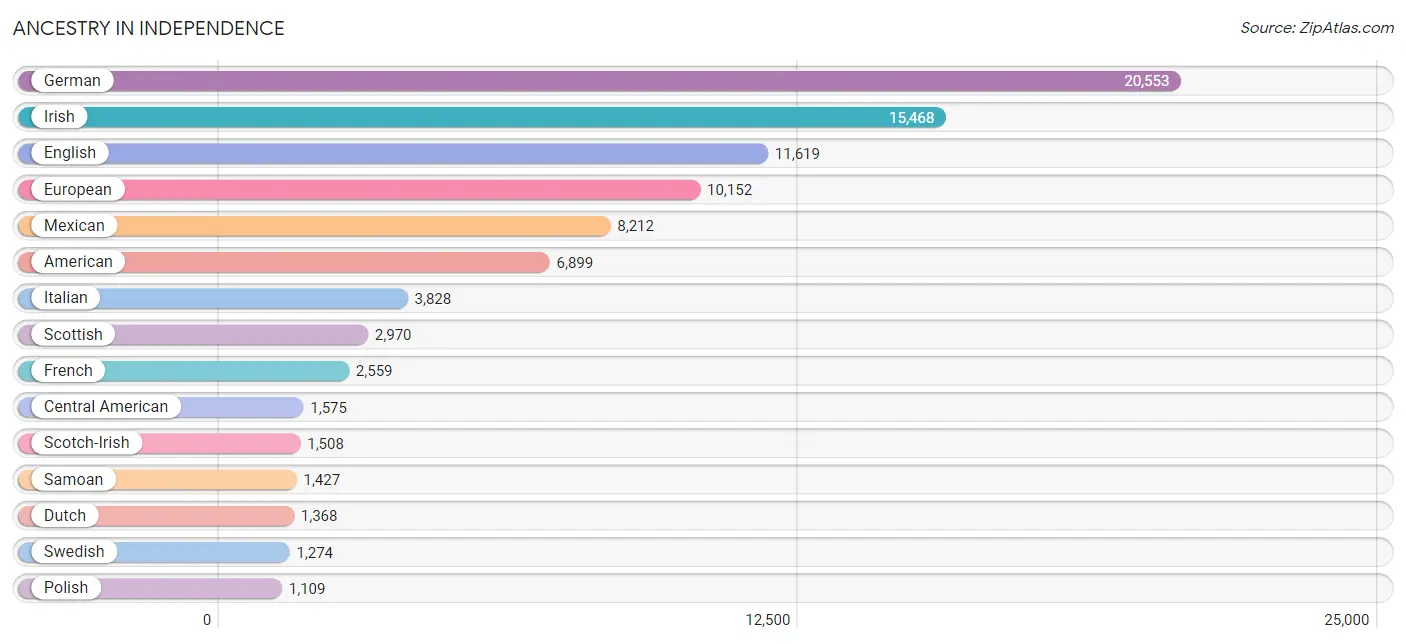
Ancestry in Independence
The most populous ancestries reported in Independence are German (20,553 | 16.8%), Irish (15,468 | 12.7%), English (11,619 | 9.5%), European (10,152 | 8.3%), and Mexican (8,212 | 6.7%), together accounting for 54.0% of all Independence residents.
| Ancestry | # Population | % Population |
| African | 318 | 0.3% |
| Alaska Native | 4 | 0.0% |
| American | 6,899 | 5.6% |
| Apache | 22 | 0.0% |
| Arab | 124 | 0.1% |
| Armenian | 7 | 0.0% |
| Australian | 26 | 0.0% |
| Austrian | 191 | 0.2% |
| Bahamian | 79 | 0.1% |
| Bangladeshi | 8 | 0.0% |
| Belgian | 93 | 0.1% |
| Bhutanese | 81 | 0.1% |
| Blackfeet | 171 | 0.1% |
| British | 848 | 0.7% |
| Burmese | 137 | 0.1% |
| Cambodian | 6 | 0.0% |
| Canadian | 264 | 0.2% |
| Central American | 1,575 | 1.3% |
| Cherokee | 503 | 0.4% |
| Chinese | 88 | 0.1% |
| Chippewa | 8 | 0.0% |
| Choctaw | 18 | 0.0% |
| Colombian | 103 | 0.1% |
| Comanche | 11 | 0.0% |
| Costa Rican | 33 | 0.0% |
| Croatian | 168 | 0.1% |
| Cuban | 466 | 0.4% |
| Czech | 433 | 0.4% |
| Czechoslovakian | 90 | 0.1% |
| Danish | 342 | 0.3% |
| Delaware | 6 | 0.0% |
| Dominican | 183 | 0.2% |
| Dutch | 1,368 | 1.1% |
| Dutch West Indian | 11 | 0.0% |
| Eastern European | 39 | 0.0% |
| Egyptian | 23 | 0.0% |
| English | 11,619 | 9.5% |
| European | 10,152 | 8.3% |
| Finnish | 43 | 0.0% |
| French | 2,559 | 2.1% |
| French American Indian | 16 | 0.0% |
| French Canadian | 222 | 0.2% |
| German | 20,553 | 16.8% |
| Greek | 130 | 0.1% |
| Guamanian / Chamorro | 11 | 0.0% |
| Guatemalan | 389 | 0.3% |
| Haitian | 39 | 0.0% |
| Honduran | 701 | 0.6% |
| Hungarian | 144 | 0.1% |
| Indian (Asian) | 249 | 0.2% |
| Iranian | 25 | 0.0% |
| Irish | 15,468 | 12.7% |
| Italian | 3,828 | 3.1% |
| Jamaican | 57 | 0.1% |
| Kenyan | 17 | 0.0% |
| Korean | 491 | 0.4% |
| Latvian | 45 | 0.0% |
| Lebanese | 43 | 0.0% |
| Lithuanian | 57 | 0.1% |
| Luxembourger | 10 | 0.0% |
| Malaysian | 28 | 0.0% |
| Marshallese | 20 | 0.0% |
| Mexican | 8,212 | 6.7% |
| Mexican American Indian | 57 | 0.1% |
| Native Hawaiian | 158 | 0.1% |
| Navajo | 4 | 0.0% |
| Nicaraguan | 16 | 0.0% |
| Nigerian | 28 | 0.0% |
| Northern European | 51 | 0.0% |
| Norwegian | 1,087 | 0.9% |
| Pakistani | 244 | 0.2% |
| Panamanian | 25 | 0.0% |
| Peruvian | 89 | 0.1% |
| Polish | 1,109 | 0.9% |
| Portuguese | 368 | 0.3% |
| Potawatomi | 38 | 0.0% |
| Puerto Rican | 708 | 0.6% |
| Romanian | 67 | 0.1% |
| Russian | 244 | 0.2% |
| Salvadoran | 392 | 0.3% |
| Samoan | 1,427 | 1.2% |
| Scandinavian | 460 | 0.4% |
| Scotch-Irish | 1,508 | 1.2% |
| Scottish | 2,970 | 2.4% |
| Seminole | 25 | 0.0% |
| Serbian | 41 | 0.0% |
| Shoshone | 29 | 0.0% |
| Sioux | 81 | 0.1% |
| Slavic | 33 | 0.0% |
| Slovak | 245 | 0.2% |
| Slovene | 23 | 0.0% |
| Somali | 8 | 0.0% |
| South African | 15 | 0.0% |
| South American | 192 | 0.2% |
| Spaniard | 193 | 0.2% |
| Spanish | 49 | 0.0% |
| Spanish American | 23 | 0.0% |
| Sri Lankan | 229 | 0.2% |
| Subsaharan African | 431 | 0.4% |
| Swedish | 1,274 | 1.0% |
| Swiss | 363 | 0.3% |
| Syrian | 50 | 0.0% |
| Thai | 356 | 0.3% |
| Ukrainian | 24 | 0.0% |
| Welsh | 956 | 0.8% |
| Yugoslavian | 26 | 0.0% |
| Zimbabwean | 14 | 0.0% | View All 107 Rows |
Immigrants in Independence
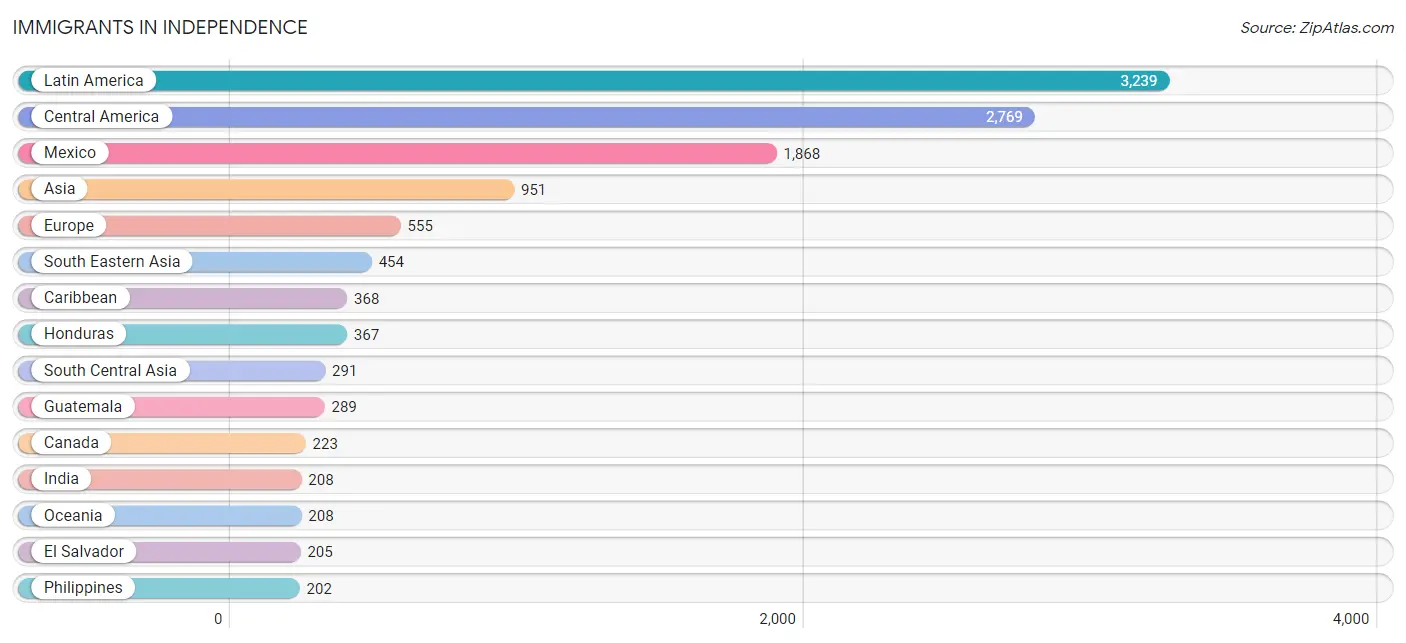
The most numerous immigrant groups reported in Independence came from Latin America (3,239 | 2.6%), Central America (2,769 | 2.3%), Mexico (1,868 | 1.5%), Asia (951 | 0.8%), and Europe (555 | 0.4%), together accounting for 7.7% of all Independence residents.
| Immigration Origin | # Population | % Population |
| Africa | 61 | 0.1% |
| Asia | 951 | 0.8% |
| Austria | 12 | 0.0% |
| Bahamas | 36 | 0.0% |
| Canada | 223 | 0.2% |
| Caribbean | 368 | 0.3% |
| Central America | 2,769 | 2.3% |
| China | 47 | 0.0% |
| Colombia | 32 | 0.0% |
| Costa Rica | 17 | 0.0% |
| Croatia | 8 | 0.0% |
| Cuba | 127 | 0.1% |
| Czechoslovakia | 11 | 0.0% |
| Dominican Republic | 155 | 0.1% |
| Eastern Africa | 12 | 0.0% |
| Eastern Asia | 143 | 0.1% |
| Eastern Europe | 187 | 0.2% |
| El Salvador | 205 | 0.2% |
| England | 23 | 0.0% |
| Europe | 555 | 0.4% |
| France | 10 | 0.0% |
| Germany | 179 | 0.2% |
| Guatemala | 289 | 0.2% |
| Honduras | 367 | 0.3% |
| India | 208 | 0.2% |
| Iran | 25 | 0.0% |
| Ireland | 9 | 0.0% |
| Italy | 7 | 0.0% |
| Jamaica | 50 | 0.0% |
| Japan | 10 | 0.0% |
| Jordan | 13 | 0.0% |
| Korea | 86 | 0.1% |
| Kuwait | 25 | 0.0% |
| Latin America | 3,239 | 2.6% |
| Latvia | 17 | 0.0% |
| Mexico | 1,868 | 1.5% |
| Moldova | 46 | 0.0% |
| Nepal | 20 | 0.0% |
| Nicaragua | 16 | 0.0% |
| Nigeria | 14 | 0.0% |
| Northern Africa | 4 | 0.0% |
| Northern Europe | 123 | 0.1% |
| Oceania | 208 | 0.2% |
| Pakistan | 38 | 0.0% |
| Panama | 7 | 0.0% |
| Peru | 70 | 0.1% |
| Philippines | 202 | 0.2% |
| Poland | 56 | 0.1% |
| Portugal | 16 | 0.0% |
| Romania | 21 | 0.0% |
| Russia | 11 | 0.0% |
| Scotland | 40 | 0.0% |
| Serbia | 17 | 0.0% |
| South Africa | 31 | 0.0% |
| South America | 102 | 0.1% |
| South Central Asia | 291 | 0.2% |
| South Eastern Asia | 454 | 0.4% |
| Southern Europe | 44 | 0.0% |
| Spain | 21 | 0.0% |
| Sudan | 4 | 0.0% |
| Syria | 25 | 0.0% |
| Thailand | 93 | 0.1% |
| Vietnam | 152 | 0.1% |
| Western Africa | 14 | 0.0% |
| Western Asia | 63 | 0.1% |
| Western Europe | 201 | 0.2% |
| Zimbabwe | 12 | 0.0% | View All 67 Rows |
Sex and Age in Independence
Sex and Age in Independence
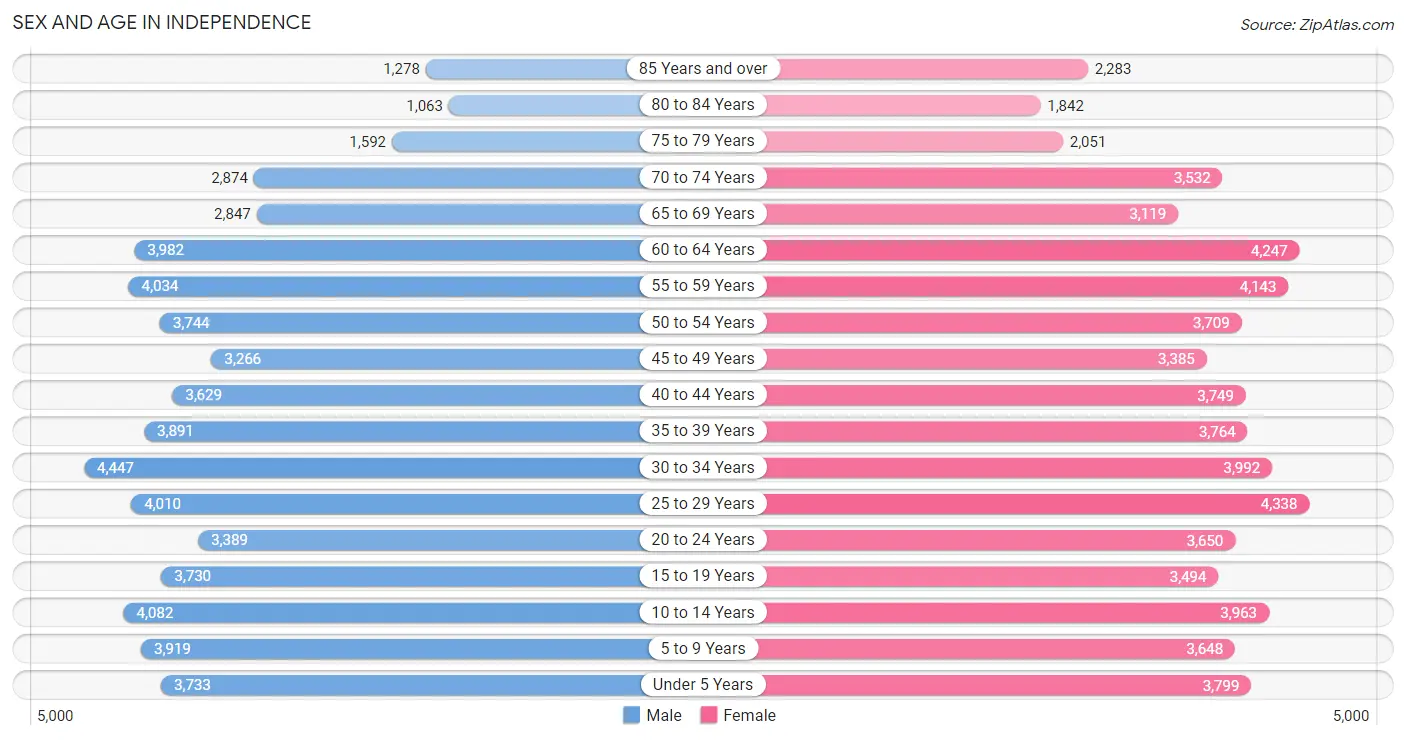
The most populous age groups in Independence are 30 to 34 Years (4,447 | 7.5%) for men and 25 to 29 Years (4,338 | 6.9%) for women.
| Age Bracket | Male | Female |
| Under 5 Years | 3,733 (6.3%) | 3,799 (6.1%) |
| 5 to 9 Years | 3,919 (6.6%) | 3,648 (5.8%) |
| 10 to 14 Years | 4,082 (6.9%) | 3,963 (6.3%) |
| 15 to 19 Years | 3,730 (6.3%) | 3,494 (5.6%) |
| 20 to 24 Years | 3,389 (5.7%) | 3,650 (5.8%) |
| 25 to 29 Years | 4,010 (6.7%) | 4,338 (6.9%) |
| 30 to 34 Years | 4,447 (7.5%) | 3,992 (6.4%) |
| 35 to 39 Years | 3,891 (6.5%) | 3,764 (6.0%) |
| 40 to 44 Years | 3,629 (6.1%) | 3,749 (6.0%) |
| 45 to 49 Years | 3,266 (5.5%) | 3,385 (5.4%) |
| 50 to 54 Years | 3,744 (6.3%) | 3,709 (5.9%) |
| 55 to 59 Years | 4,034 (6.8%) | 4,143 (6.6%) |
| 60 to 64 Years | 3,982 (6.7%) | 4,247 (6.8%) |
| 65 to 69 Years | 2,847 (4.8%) | 3,119 (5.0%) |
| 70 to 74 Years | 2,874 (4.8%) | 3,532 (5.6%) |
| 75 to 79 Years | 1,592 (2.7%) | 2,051 (3.3%) |
| 80 to 84 Years | 1,063 (1.8%) | 1,842 (2.9%) |
| 85 Years and over | 1,278 (2.1%) | 2,283 (3.6%) |
| Total | 59,510 (100.0%) | 62,708 (100.0%) |
Families and Households in Independence
Median Family Size in Independence
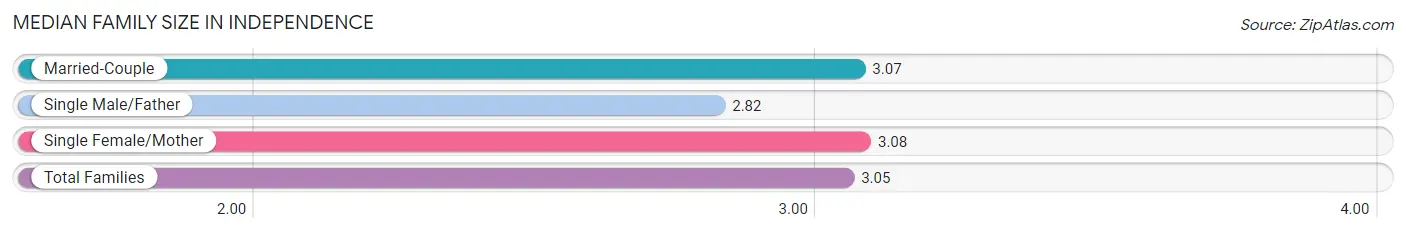
The median family size in Independence is 3.05 persons per family, with single female/mother families (7,264 | 24.2%) accounting for the largest median family size of 3.08 persons per family. On the other hand, single male/father families (2,487 | 8.3%) represent the smallest median family size with 2.82 persons per family.
| Family Type | # Families | Family Size |
| Married-Couple | 20,297 (67.5%) | 3.07 |
| Single Male/Father | 2,487 (8.3%) | 2.82 |
| Single Female/Mother | 7,264 (24.2%) | 3.08 |
| Total Families | 30,048 (100.0%) | 3.05 |
Median Household Size in Independence
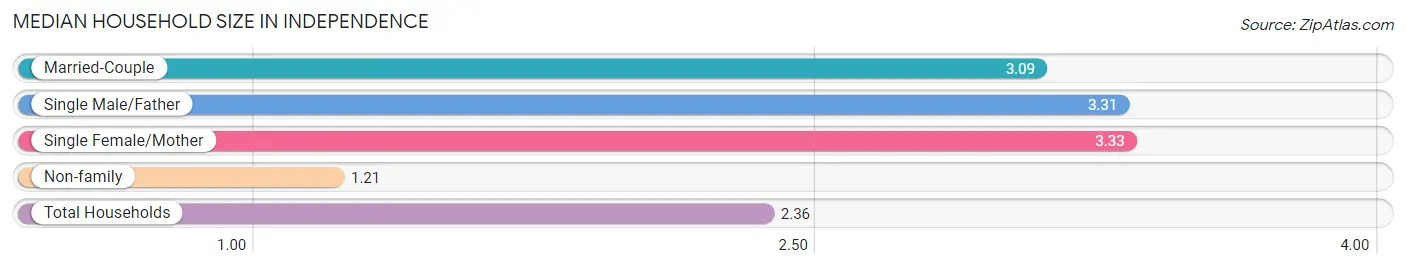
The median household size in Independence is 2.36 persons per household, with single female/mother households (7,264 | 14.2%) accounting for the largest median household size of 3.33 persons per household. non-family households (21,203 | 41.4%) represent the smallest median household size with 1.21 persons per household.
| Household Type | # Households | Household Size |
| Married-Couple | 20,297 (39.6%) | 3.09 |
| Single Male/Father | 2,487 (4.9%) | 3.31 |
| Single Female/Mother | 7,264 (14.2%) | 3.33 |
| Non-family | 21,203 (41.4%) | 1.21 |
| Total Households | 51,251 (100.0%) | 2.36 |
Household Size by Marriage Status in Independence
Out of a total of 51,251 households in Independence, 30,048 (58.6%) are family households, while 21,203 (41.4%) are nonfamily households. The most numerous type of family households are 2-person households, comprising 13,844, and the most common type of nonfamily households are 1-person households, comprising 17,480.
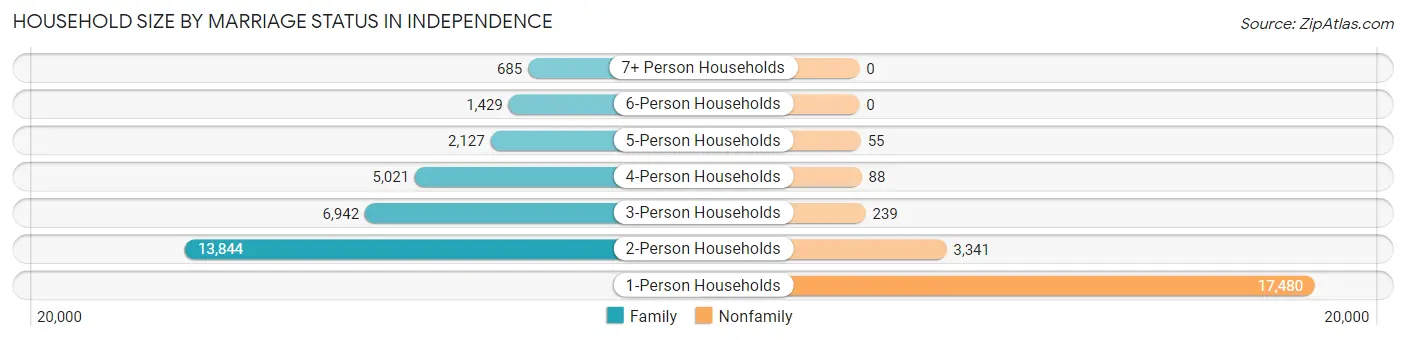
| Household Size | Family Households | Nonfamily Households |
| 1-Person Households | - | 17,480 (34.1%) |
| 2-Person Households | 13,844 (27.0%) | 3,341 (6.5%) |
| 3-Person Households | 6,942 (13.6%) | 239 (0.5%) |
| 4-Person Households | 5,021 (9.8%) | 88 (0.2%) |
| 5-Person Households | 2,127 (4.2%) | 55 (0.1%) |
| 6-Person Households | 1,429 (2.8%) | 0 (0.0%) |
| 7+ Person Households | 685 (1.3%) | 0 (0.0%) |
| Total | 30,048 (58.6%) | 21,203 (41.4%) |
Female Fertility in Independence
Fertility by Age in Independence
Average fertility rate in Independence is 38.0 births per 1,000 women. Women in the age bracket of 20 to 34 years have the highest fertility rate with 80.0 births per 1,000 women. Women in the age bracket of 20 to 34 years acount for 91.5% of all women with births.
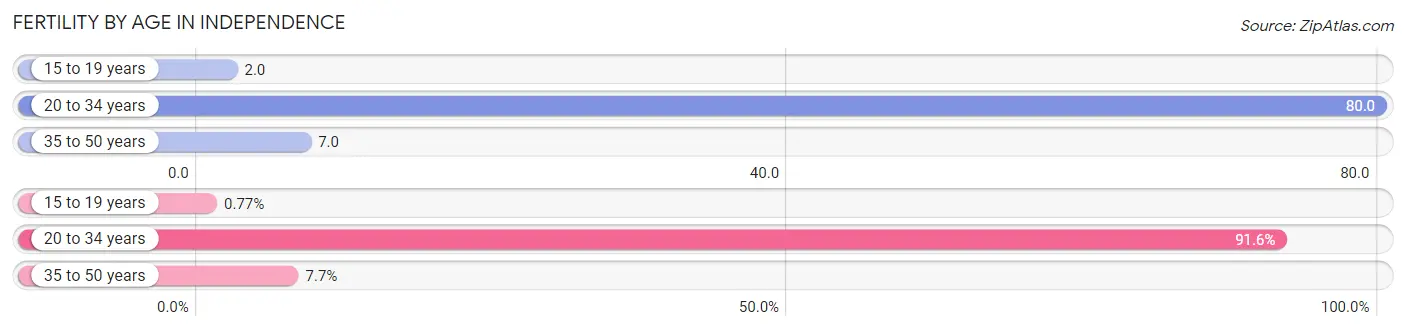
| Age Bracket | Women with Births | Births / 1,000 Women |
| 15 to 19 years | 8 (0.8%) | 2.0 |
| 20 to 34 years | 954 (91.5%) | 80.0 |
| 35 to 50 years | 80 (7.7%) | 7.0 |
| Total | 1,042 (100.0%) | 38.0 |
Fertility by Age by Marriage Status in Independence
64.4% of women with births (1,042) in Independence are married. The highest percentage of unmarried women with births falls into 20 to 34 years age bracket with 37.1% of them unmarried at the time of birth, while the lowest percentage of unmarried women with births belong to 35 to 50 years age bracket with 18.8% of them unmarried.
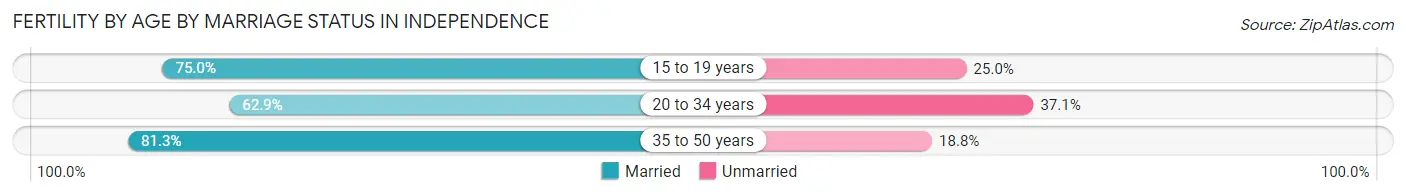
| Age Bracket | Married | Unmarried |
| 15 to 19 years | 6 (75.0%) | 2 (25.0%) |
| 20 to 34 years | 600 (62.9%) | 354 (37.1%) |
| 35 to 50 years | 65 (81.2%) | 15 (18.8%) |
| Total | 671 (64.4%) | 371 (35.6%) |
Fertility by Education in Independence
Average fertility rate in Independence is 38.0 births per 1,000 women. Women with the education attainment of college or associate's degree have the highest fertility rate of 59.0 births per 1,000 women, while women with the education attainment of graduate degree have the lowest fertility at 7.0 births per 1,000 women. Women with the education attainment of college or associate's degree represent 50.8% of all women with births.
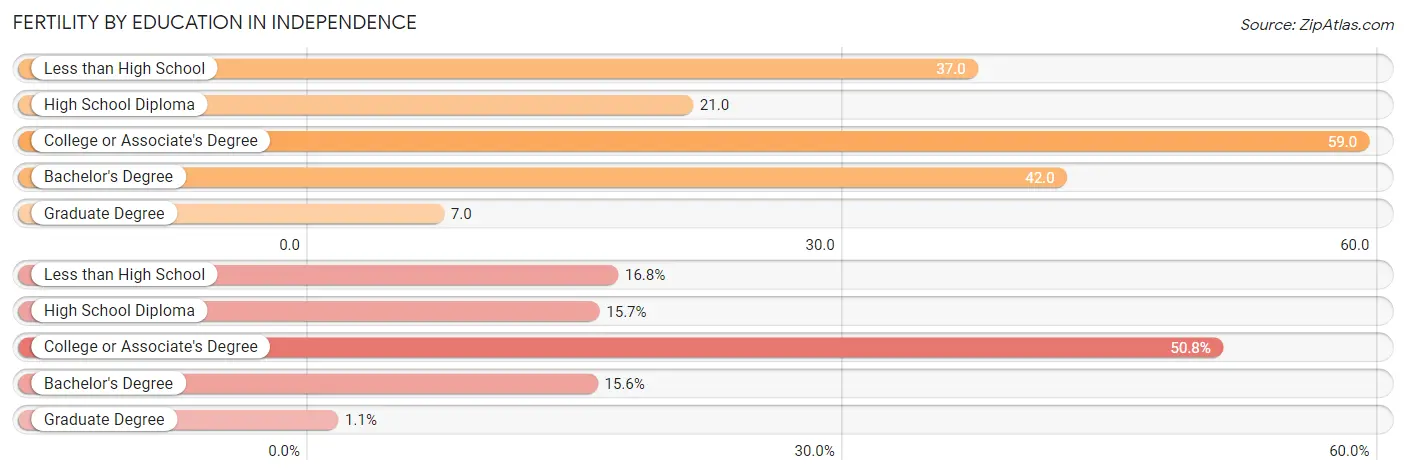
| Educational Attainment | Women with Births | Births / 1,000 Women |
| Less than High School | 175 (16.8%) | 37.0 |
| High School Diploma | 164 (15.7%) | 21.0 |
| College or Associate's Degree | 529 (50.8%) | 59.0 |
| Bachelor's Degree | 163 (15.6%) | 42.0 |
| Graduate Degree | 11 (1.1%) | 7.0 |
| Total | 1,042 (100.0%) | 38.0 |
Fertility by Education by Marriage Status in Independence
35.6% of women with births in Independence are unmarried. Women with the educational attainment of graduate degree are most likely to be married with 100.0% of them married at childbirth, while women with the educational attainment of college or associate's degree are least likely to be married with 38.8% of them unmarried at childbirth.
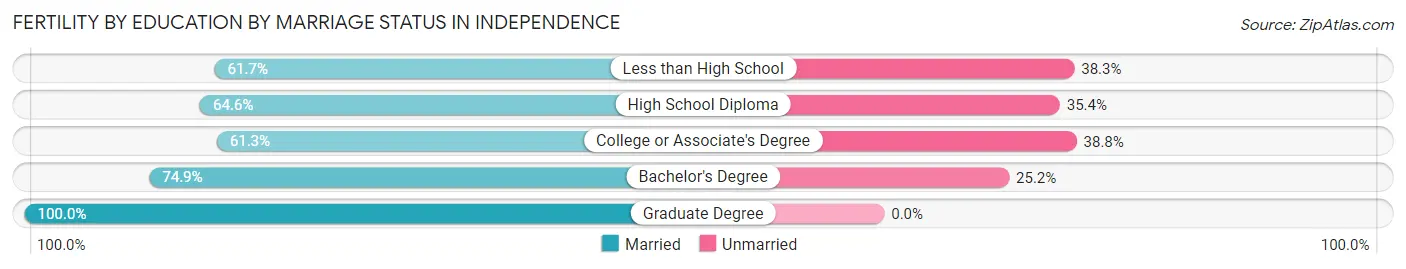
| Educational Attainment | Married | Unmarried |
| Less than High School | 108 (61.7%) | 67 (38.3%) |
| High School Diploma | 106 (64.6%) | 58 (35.4%) |
| College or Associate's Degree | 324 (61.3%) | 205 (38.8%) |
| Bachelor's Degree | 122 (74.9%) | 41 (25.2%) |
| Graduate Degree | 11 (100.0%) | 0 (0.0%) |
| Total | 671 (64.4%) | 371 (35.6%) |
Employment Characteristics in Independence
Employment by Class of Employer in Independence
Among the 56,718 employed individuals in Independence, private company employees (42,082 | 74.2%), not-for-profit organizations (4,506 | 7.9%), and local government employees (2,861 | 5.0%) make up the most common classes of employment.
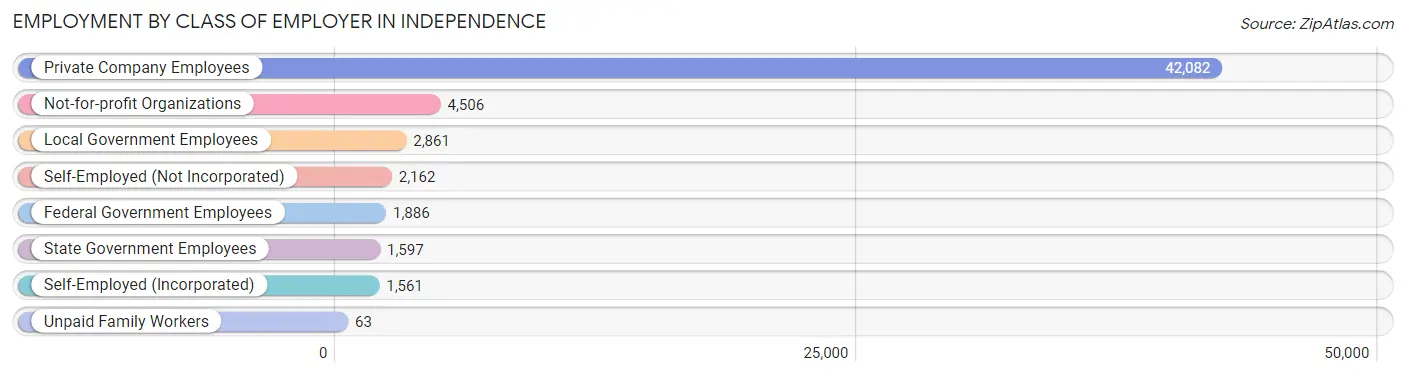
| Employer Class | # Employees | % Employees |
| Private Company Employees | 42,082 | 74.2% |
| Self-Employed (Incorporated) | 1,561 | 2.8% |
| Self-Employed (Not Incorporated) | 2,162 | 3.8% |
| Not-for-profit Organizations | 4,506 | 7.9% |
| Local Government Employees | 2,861 | 5.0% |
| State Government Employees | 1,597 | 2.8% |
| Federal Government Employees | 1,886 | 3.3% |
| Unpaid Family Workers | 63 | 0.1% |
| Total | 56,718 | 100.0% |
Employment Status by Age in Independence
According to the labor force statistics for Independence, out of the total population over 16 years of age (97,581), 63.0% or 61,476 individuals are in the labor force, with 6.2% or 3,812 of them unemployed. The age group with the highest labor force participation rate is 20 to 24 years, with 89.2% or 6,279 individuals in the labor force. Within the labor force, the 16 to 19 years age range has the highest percentage of unemployed individuals, with 13.1% or 334 of them being unemployed.
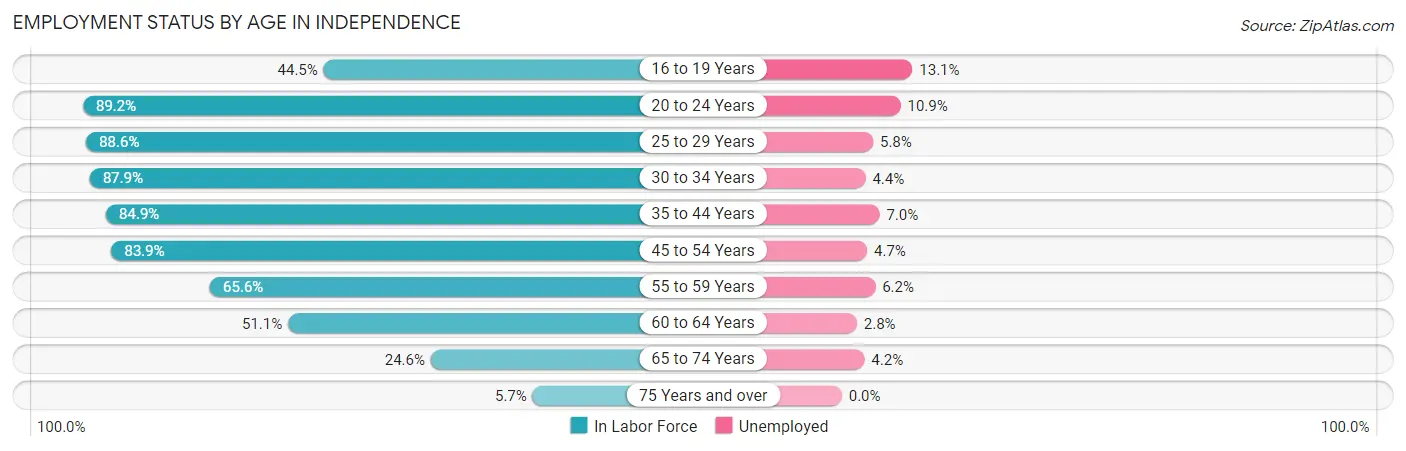
| Age Bracket | In Labor Force | Unemployed |
| 16 to 19 Years | 2,550 (44.5%) | 334 (13.1%) |
| 20 to 24 Years | 6,279 (89.2%) | 684 (10.9%) |
| 25 to 29 Years | 7,396 (88.6%) | 429 (5.8%) |
| 30 to 34 Years | 7,418 (87.9%) | 326 (4.4%) |
| 35 to 44 Years | 12,763 (84.9%) | 893 (7.0%) |
| 45 to 54 Years | 11,833 (83.9%) | 556 (4.7%) |
| 55 to 59 Years | 5,364 (65.6%) | 333 (6.2%) |
| 60 to 64 Years | 4,205 (51.1%) | 118 (2.8%) |
| 65 to 74 Years | 3,044 (24.6%) | 128 (4.2%) |
| 75 Years and over | 576 (5.7%) | 0 (0.0%) |
| Total | 61,476 (63.0%) | 3,812 (6.2%) |
Employment Status by Educational Attainment in Independence
According to labor force statistics for Independence, 78.6% of individuals (48,991) out of the total population between 25 and 64 years of age (62,330) are in the labor force, with 5.4% or 2,646 of them being unemployed. The group with the highest labor force participation rate are those with the educational attainment of bachelor's degree or higher, with 87.9% or 10,865 individuals in the labor force. Within the labor force, individuals with less than high school education have the highest percentage of unemployment, with 12.2% or 468 of them being unemployed.
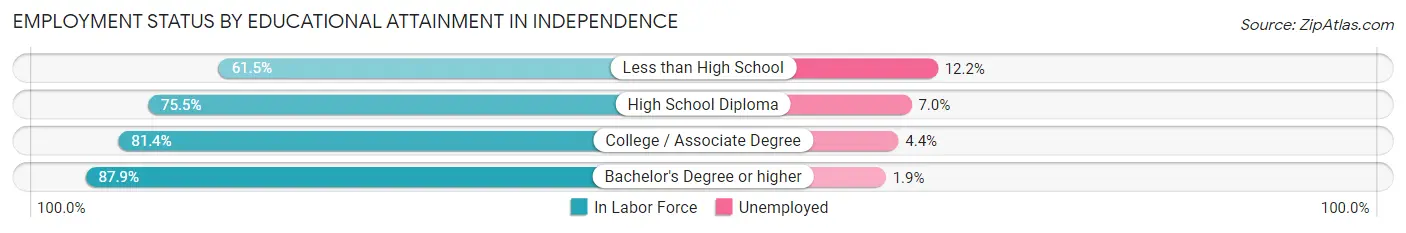
| Educational Attainment | In Labor Force | Unemployed |
| Less than High School | 3,838 (61.5%) | 761 (12.2%) |
| High School Diploma | 17,094 (75.5%) | 1,585 (7.0%) |
| College / Associate Degree | 17,166 (81.4%) | 928 (4.4%) |
| Bachelor's Degree or higher | 10,865 (87.9%) | 235 (1.9%) |
| Total | 48,991 (78.6%) | 3,366 (5.4%) |
Employment Occupations by Sex in Independence
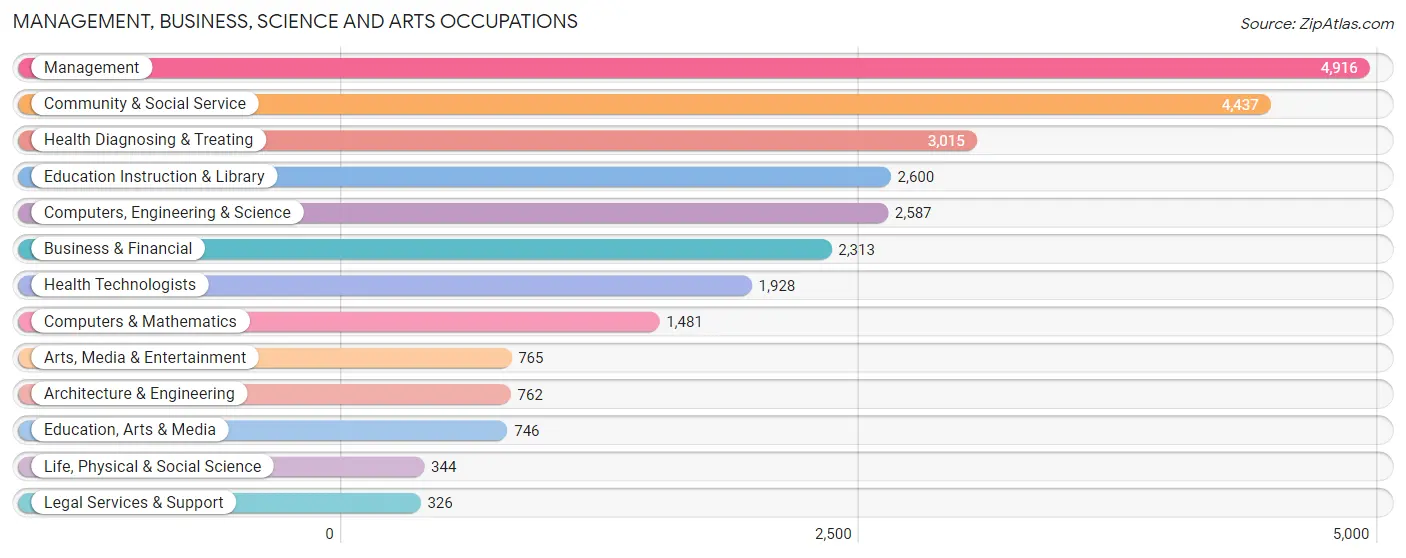
Management, Business, Science and Arts Occupations
The most common Management, Business, Science and Arts occupations in Independence are Management (4,916 | 8.5%), Community & Social Service (4,437 | 7.7%), Health Diagnosing & Treating (3,015 | 5.2%), Education Instruction & Library (2,600 | 4.5%), and Computers, Engineering & Science (2,587 | 4.5%).
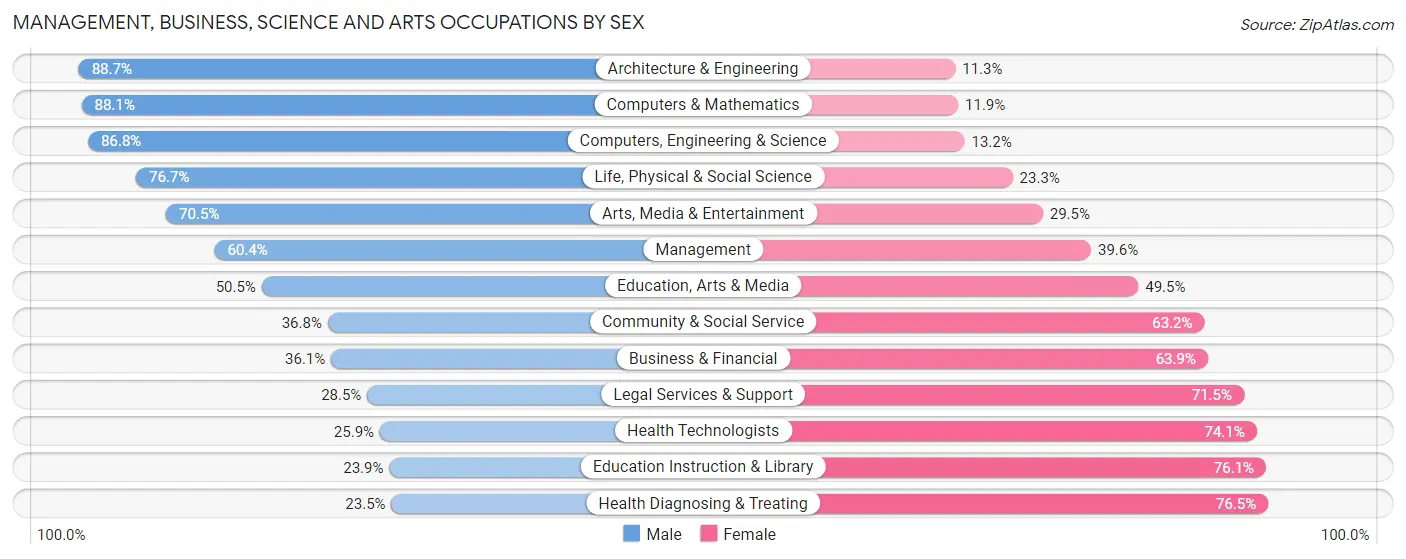
Management, Business, Science and Arts Occupations by Sex
Within the Management, Business, Science and Arts occupations in Independence, the most male-oriented occupations are Architecture & Engineering (88.7%), Computers & Mathematics (88.1%), and Computers, Engineering & Science (86.8%), while the most female-oriented occupations are Health Diagnosing & Treating (76.5%), Education Instruction & Library (76.1%), and Health Technologists (74.1%).
| Occupation | Male | Female |
| Management | 2,969 (60.4%) | 1,947 (39.6%) |
| Business & Financial | 834 (36.1%) | 1,479 (63.9%) |
| Computers, Engineering & Science | 2,245 (86.8%) | 342 (13.2%) |
| Computers & Mathematics | 1,305 (88.1%) | 176 (11.9%) |
| Architecture & Engineering | 676 (88.7%) | 86 (11.3%) |
| Life, Physical & Social Science | 264 (76.7%) | 80 (23.3%) |
| Community & Social Service | 1,631 (36.8%) | 2,806 (63.2%) |
| Education, Arts & Media | 377 (50.5%) | 369 (49.5%) |
| Legal Services & Support | 93 (28.5%) | 233 (71.5%) |
| Education Instruction & Library | 622 (23.9%) | 1,978 (76.1%) |
| Arts, Media & Entertainment | 539 (70.5%) | 226 (29.5%) |
| Health Diagnosing & Treating | 708 (23.5%) | 2,307 (76.5%) |
| Health Technologists | 499 (25.9%) | 1,429 (74.1%) |
| Total (Category) | 8,387 (48.6%) | 8,881 (51.4%) |
| Total (Overall) | 30,658 (53.2%) | 26,931 (46.8%) |
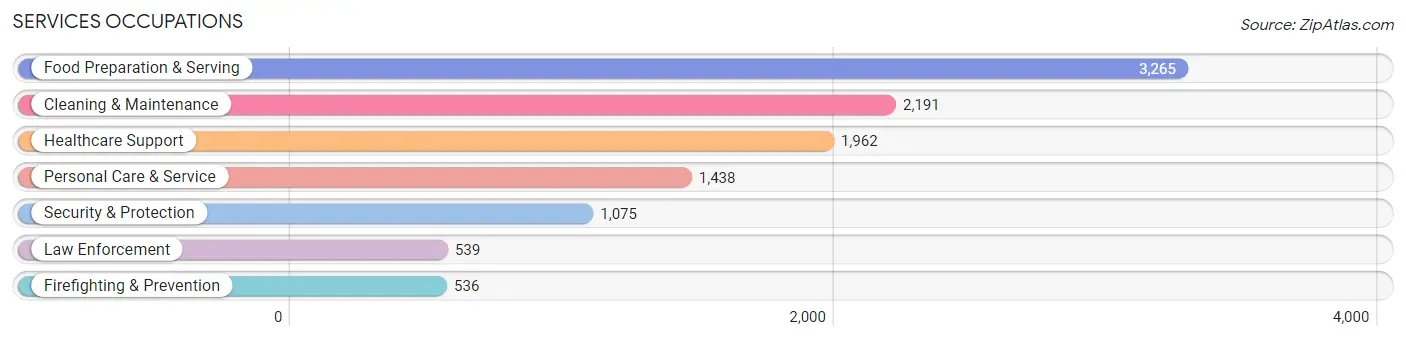
Services Occupations
The most common Services occupations in Independence are Food Preparation & Serving (3,265 | 5.7%), Cleaning & Maintenance (2,191 | 3.8%), Healthcare Support (1,962 | 3.4%), Personal Care & Service (1,438 | 2.5%), and Security & Protection (1,075 | 1.9%).
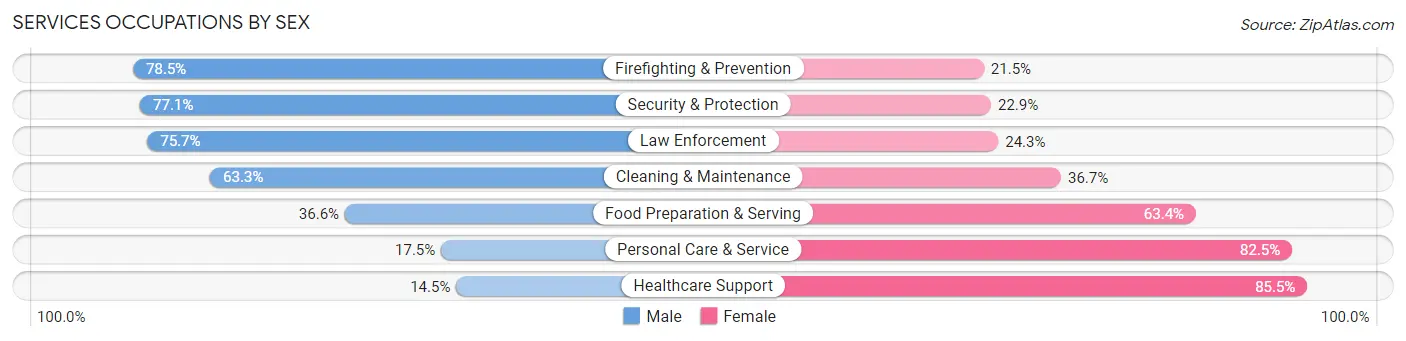
Services Occupations by Sex
Within the Services occupations in Independence, the most male-oriented occupations are Firefighting & Prevention (78.5%), Security & Protection (77.1%), and Law Enforcement (75.7%), while the most female-oriented occupations are Healthcare Support (85.5%), Personal Care & Service (82.5%), and Food Preparation & Serving (63.4%).
| Occupation | Male | Female |
| Healthcare Support | 285 (14.5%) | 1,677 (85.5%) |
| Security & Protection | 829 (77.1%) | 246 (22.9%) |
| Firefighting & Prevention | 421 (78.5%) | 115 (21.5%) |
| Law Enforcement | 408 (75.7%) | 131 (24.3%) |
| Food Preparation & Serving | 1,194 (36.6%) | 2,071 (63.4%) |
| Cleaning & Maintenance | 1,386 (63.3%) | 805 (36.7%) |
| Personal Care & Service | 252 (17.5%) | 1,186 (82.5%) |
| Total (Category) | 3,946 (39.7%) | 5,985 (60.3%) |
| Total (Overall) | 30,658 (53.2%) | 26,931 (46.8%) |
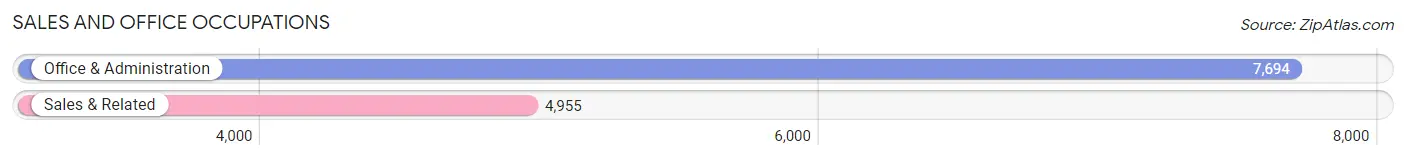
Sales and Office Occupations
The most common Sales and Office occupations in Independence are Office & Administration (7,694 | 13.4%), and Sales & Related (4,955 | 8.6%).
Sales and Office Occupations by Sex
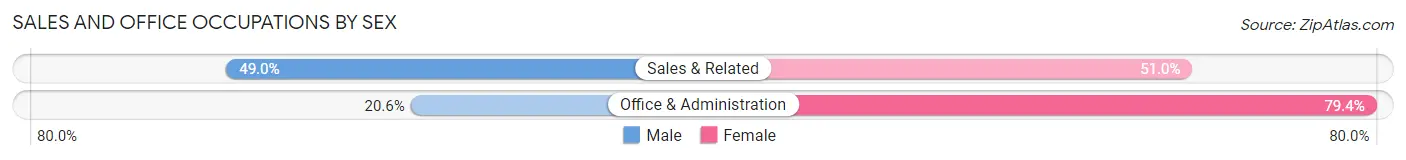
| Occupation | Male | Female |
| Sales & Related | 2,426 (49.0%) | 2,529 (51.0%) |
| Office & Administration | 1,587 (20.6%) | 6,107 (79.4%) |
| Total (Category) | 4,013 (31.7%) | 8,636 (68.3%) |
| Total (Overall) | 30,658 (53.2%) | 26,931 (46.8%) |
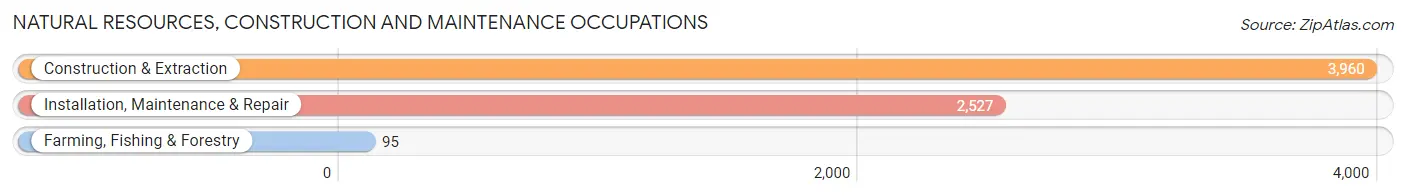
Natural Resources, Construction and Maintenance Occupations
The most common Natural Resources, Construction and Maintenance occupations in Independence are Construction & Extraction (3,960 | 6.9%), Installation, Maintenance & Repair (2,527 | 4.4%), and Farming, Fishing & Forestry (95 | 0.2%).
Natural Resources, Construction and Maintenance Occupations by Sex
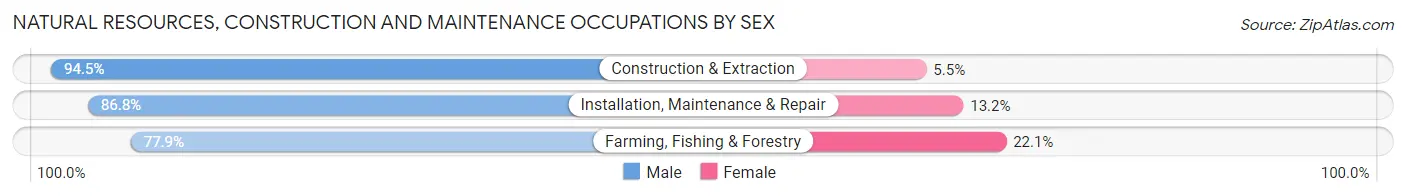
| Occupation | Male | Female |
| Farming, Fishing & Forestry | 74 (77.9%) | 21 (22.1%) |
| Construction & Extraction | 3,742 (94.5%) | 218 (5.5%) |
| Installation, Maintenance & Repair | 2,194 (86.8%) | 333 (13.2%) |
| Total (Category) | 6,010 (91.3%) | 572 (8.7%) |
| Total (Overall) | 30,658 (53.2%) | 26,931 (46.8%) |
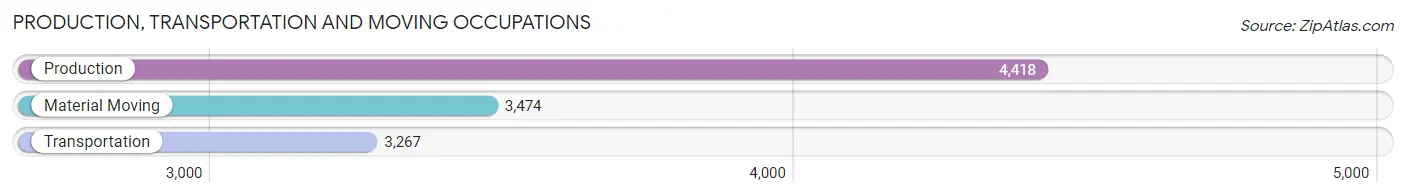
Production, Transportation and Moving Occupations
The most common Production, Transportation and Moving occupations in Independence are Production (4,418 | 7.7%), Material Moving (3,474 | 6.0%), and Transportation (3,267 | 5.7%).
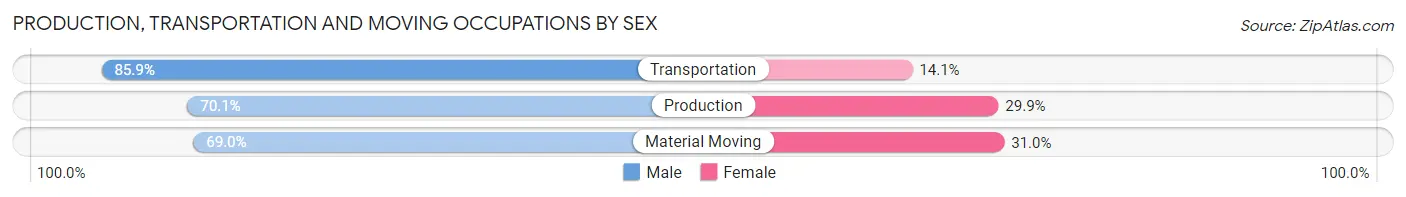
Production, Transportation and Moving Occupations by Sex
| Occupation | Male | Female |
| Production | 3,098 (70.1%) | 1,320 (29.9%) |
| Transportation | 2,806 (85.9%) | 461 (14.1%) |
| Material Moving | 2,398 (69.0%) | 1,076 (31.0%) |
| Total (Category) | 8,302 (74.4%) | 2,857 (25.6%) |
| Total (Overall) | 30,658 (53.2%) | 26,931 (46.8%) |
Employment Industries by Sex in Independence
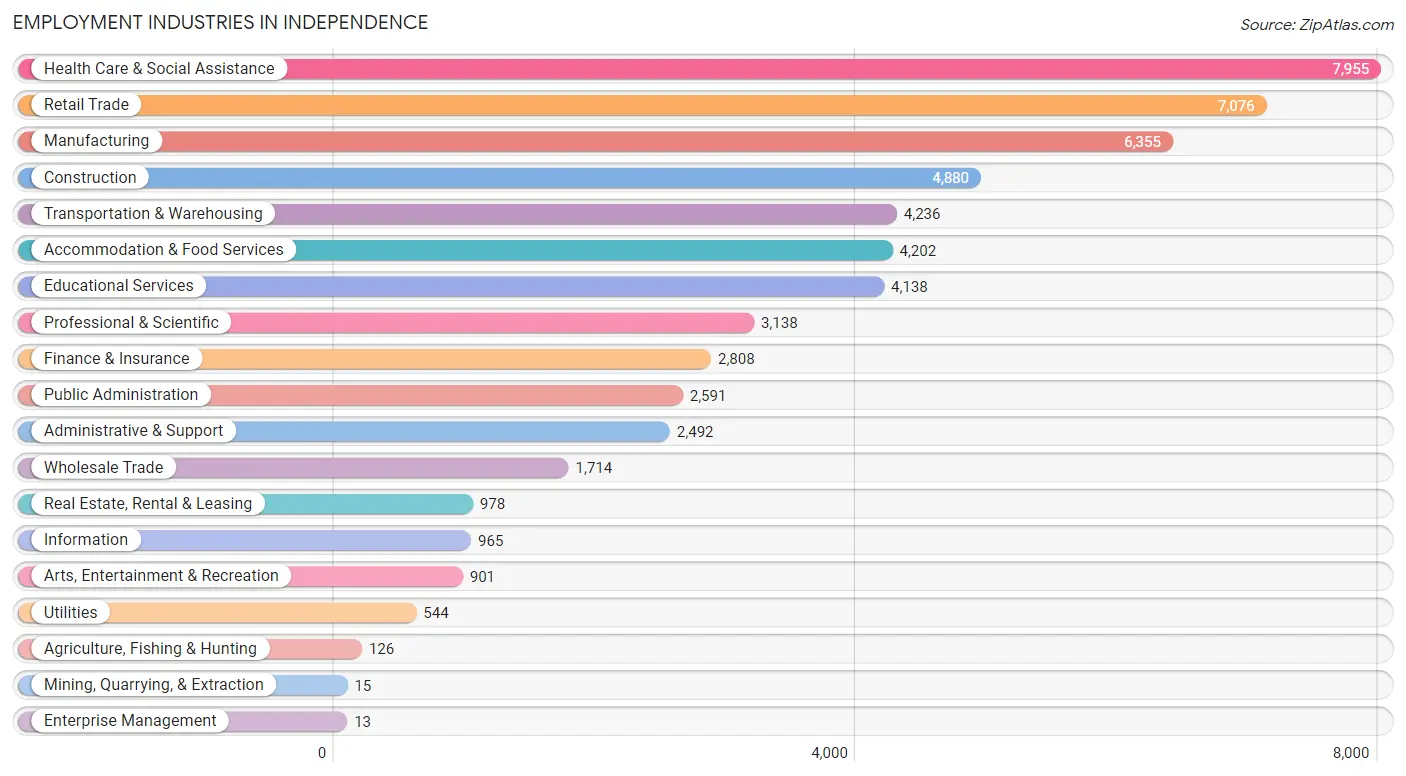
Employment Industries in Independence
The major employment industries in Independence include Health Care & Social Assistance (7,955 | 13.8%), Retail Trade (7,076 | 12.3%), Manufacturing (6,355 | 11.0%), Construction (4,880 | 8.5%), and Transportation & Warehousing (4,236 | 7.4%).
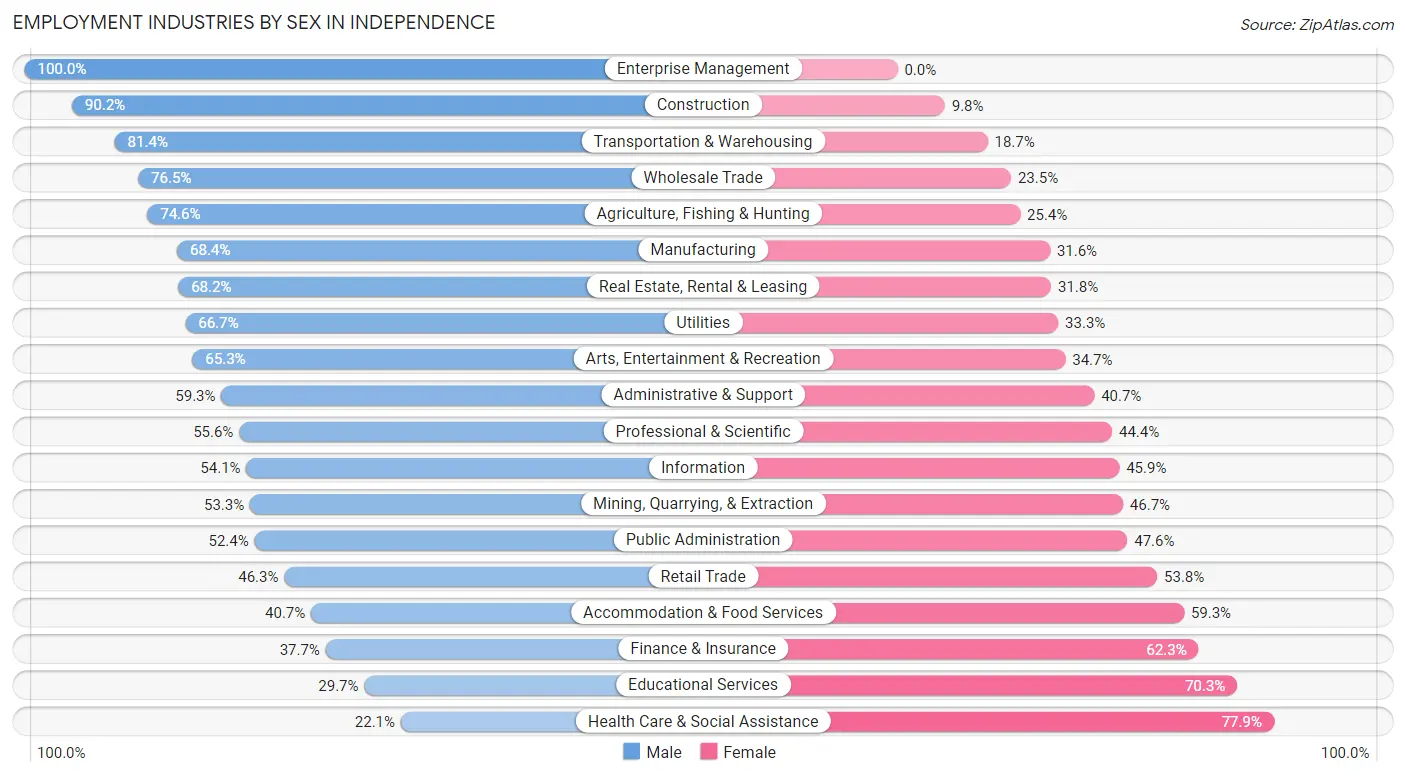
Employment Industries by Sex in Independence
The Independence industries that see more men than women are Enterprise Management (100.0%), Construction (90.2%), and Transportation & Warehousing (81.4%), whereas the industries that tend to have a higher number of women are Health Care & Social Assistance (77.9%), Educational Services (70.3%), and Finance & Insurance (62.3%).
| Industry | Male | Female |
| Agriculture, Fishing & Hunting | 94 (74.6%) | 32 (25.4%) |
| Mining, Quarrying, & Extraction | 8 (53.3%) | 7 (46.7%) |
| Construction | 4,402 (90.2%) | 478 (9.8%) |
| Manufacturing | 4,349 (68.4%) | 2,006 (31.6%) |
| Wholesale Trade | 1,311 (76.5%) | 403 (23.5%) |
| Retail Trade | 3,273 (46.3%) | 3,803 (53.7%) |
| Transportation & Warehousing | 3,446 (81.4%) | 790 (18.6%) |
| Utilities | 363 (66.7%) | 181 (33.3%) |
| Information | 522 (54.1%) | 443 (45.9%) |
| Finance & Insurance | 1,058 (37.7%) | 1,750 (62.3%) |
| Real Estate, Rental & Leasing | 667 (68.2%) | 311 (31.8%) |
| Professional & Scientific | 1,744 (55.6%) | 1,394 (44.4%) |
| Enterprise Management | 13 (100.0%) | 0 (0.0%) |
| Administrative & Support | 1,477 (59.3%) | 1,015 (40.7%) |
| Educational Services | 1,228 (29.7%) | 2,910 (70.3%) |
| Health Care & Social Assistance | 1,760 (22.1%) | 6,195 (77.9%) |
| Arts, Entertainment & Recreation | 588 (65.3%) | 313 (34.7%) |
| Accommodation & Food Services | 1,710 (40.7%) | 2,492 (59.3%) |
| Public Administration | 1,358 (52.4%) | 1,233 (47.6%) |
| Total | 30,658 (53.2%) | 26,931 (46.8%) |
Education in Independence
School Enrollment in Independence
The most common levels of schooling among the 25,347 students in Independence are middle school (6,803 | 26.8%), elementary school (5,561 | 21.9%), and high school (5,407 | 21.3%).
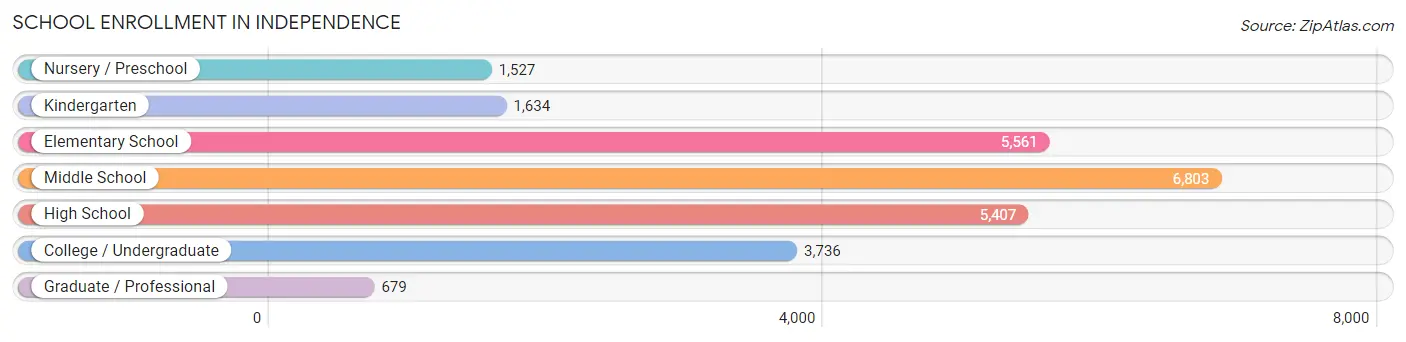
| School Level | # Students | % Students |
| Nursery / Preschool | 1,527 | 6.0% |
| Kindergarten | 1,634 | 6.5% |
| Elementary School | 5,561 | 21.9% |
| Middle School | 6,803 | 26.8% |
| High School | 5,407 | 21.3% |
| College / Undergraduate | 3,736 | 14.7% |
| Graduate / Professional | 679 | 2.7% |
| Total | 25,347 | 100.0% |
School Enrollment by Age by Funding Source in Independence
Out of a total of 25,347 students who are enrolled in schools in Independence, 2,611 (10.3%) attend a private institution, while the remaining 22,736 (89.7%) are enrolled in public schools. The age group of 35 years and over has the highest likelihood of being enrolled in private schools, with 244 (31.8% in the age bracket) enrolled. Conversely, the age group of 10 to 14 year olds has the lowest likelihood of being enrolled in a private school, with 7,377 (93.0% in the age bracket) attending a public institution.
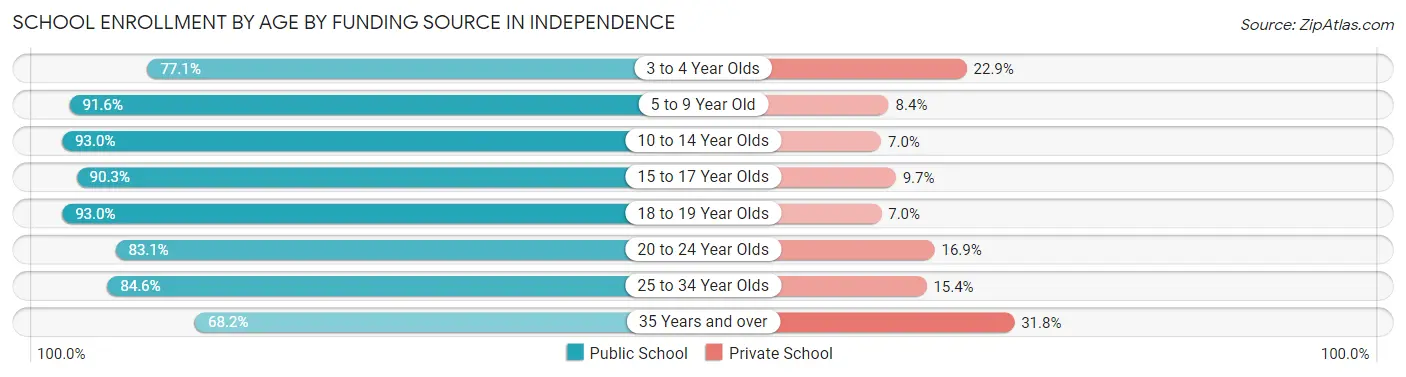
| Age Bracket | Public School | Private School |
| 3 to 4 Year Olds | 919 (77.1%) | 273 (22.9%) |
| 5 to 9 Year Old | 6,272 (91.6%) | 574 (8.4%) |
| 10 to 14 Year Olds | 7,377 (93.0%) | 553 (7.0%) |
| 15 to 17 Year Olds | 3,786 (90.3%) | 406 (9.7%) |
| 18 to 19 Year Olds | 1,592 (93.0%) | 120 (7.0%) |
| 20 to 24 Year Olds | 1,408 (83.1%) | 287 (16.9%) |
| 25 to 34 Year Olds | 856 (84.6%) | 156 (15.4%) |
| 35 Years and over | 524 (68.2%) | 244 (31.8%) |
| Total | 22,736 (89.7%) | 2,611 (10.3%) |
Educational Attainment by Field of Study in Independence
Business (3,524 | 19.7%), education (3,160 | 17.7%), science & technology (1,615 | 9.0%), arts & humanities (1,312 | 7.3%), and psychology (1,165 | 6.5%) are the most common fields of study among 17,888 individuals in Independence who have obtained a bachelor's degree or higher.
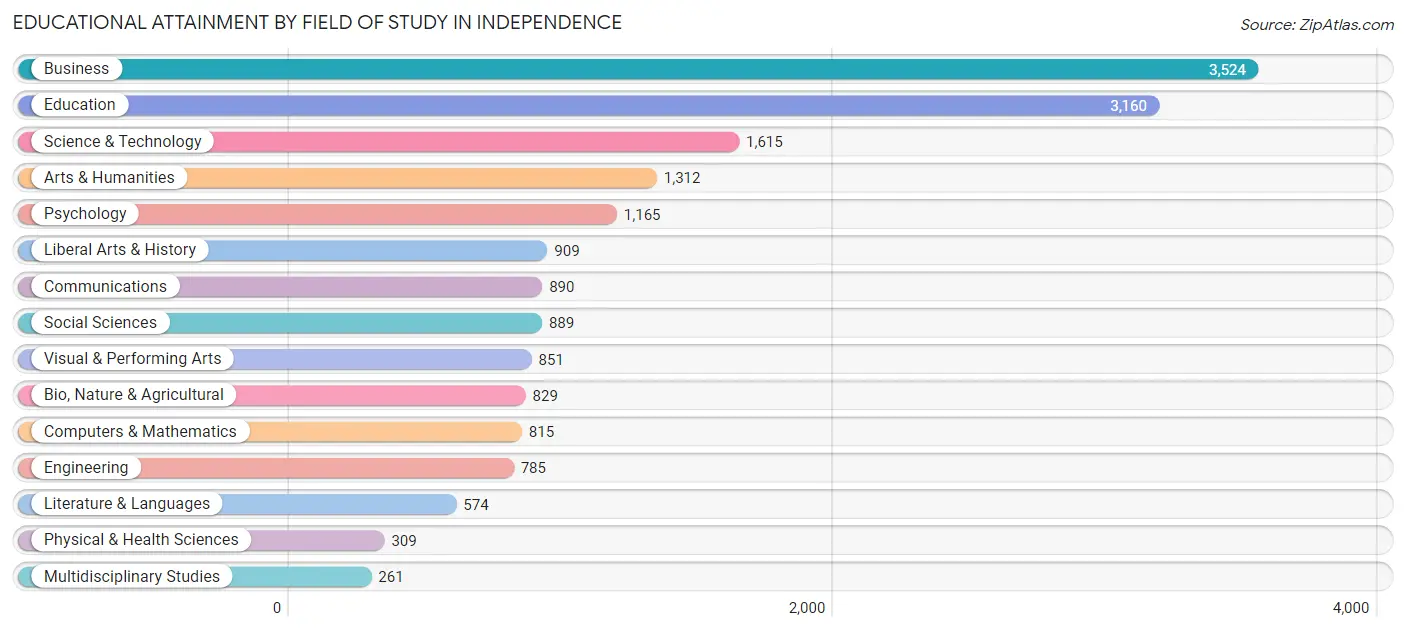
| Field of Study | # Graduates | % Graduates |
| Computers & Mathematics | 815 | 4.6% |
| Bio, Nature & Agricultural | 829 | 4.6% |
| Physical & Health Sciences | 309 | 1.7% |
| Psychology | 1,165 | 6.5% |
| Social Sciences | 889 | 5.0% |
| Engineering | 785 | 4.4% |
| Multidisciplinary Studies | 261 | 1.5% |
| Science & Technology | 1,615 | 9.0% |
| Business | 3,524 | 19.7% |
| Education | 3,160 | 17.7% |
| Literature & Languages | 574 | 3.2% |
| Liberal Arts & History | 909 | 5.1% |
| Visual & Performing Arts | 851 | 4.8% |
| Communications | 890 | 5.0% |
| Arts & Humanities | 1,312 | 7.3% |
| Total | 17,888 | 100.0% |
Transportation & Commute in Independence
Vehicle Availability by Sex in Independence
The most prevalent vehicle ownership categories in Independence are males with 2 vehicles (12,586, accounting for 41.5%) and females with 2 vehicles (10,576, making up 47.8%).
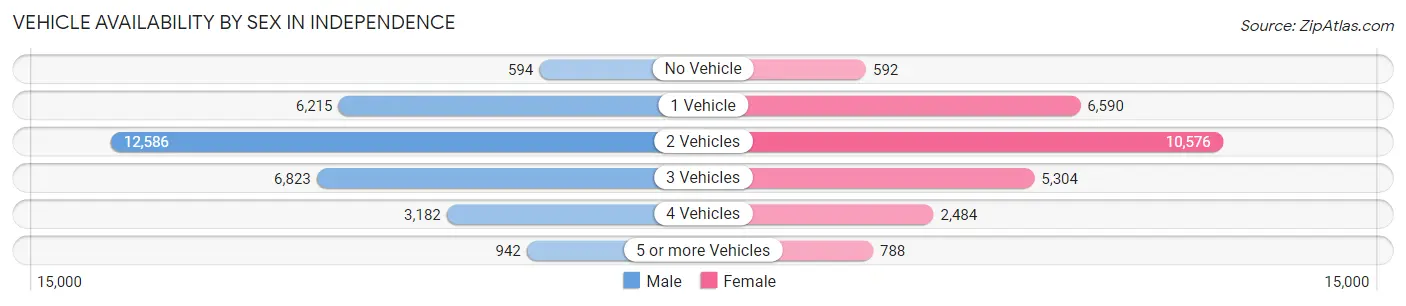
| Vehicles Available | Male | Female |
| No Vehicle | 594 (2.0%) | 592 (2.2%) |
| 1 Vehicle | 6,215 (20.5%) | 6,590 (25.0%) |
| 2 Vehicles | 12,586 (41.5%) | 10,576 (40.2%) |
| 3 Vehicles | 6,823 (22.5%) | 5,304 (20.1%) |
| 4 Vehicles | 3,182 (10.5%) | 2,484 (9.4%) |
| 5 or more Vehicles | 942 (3.1%) | 788 (3.0%) |
| Total | 30,342 (100.0%) | 26,334 (100.0%) |
Commute Time in Independence
The most frequently occuring commute durations in Independence are 30 to 34 minutes (9,686 commuters, 18.6%), 20 to 24 minutes (9,652 commuters, 18.5%), and 15 to 19 minutes (8,655 commuters, 16.6%).
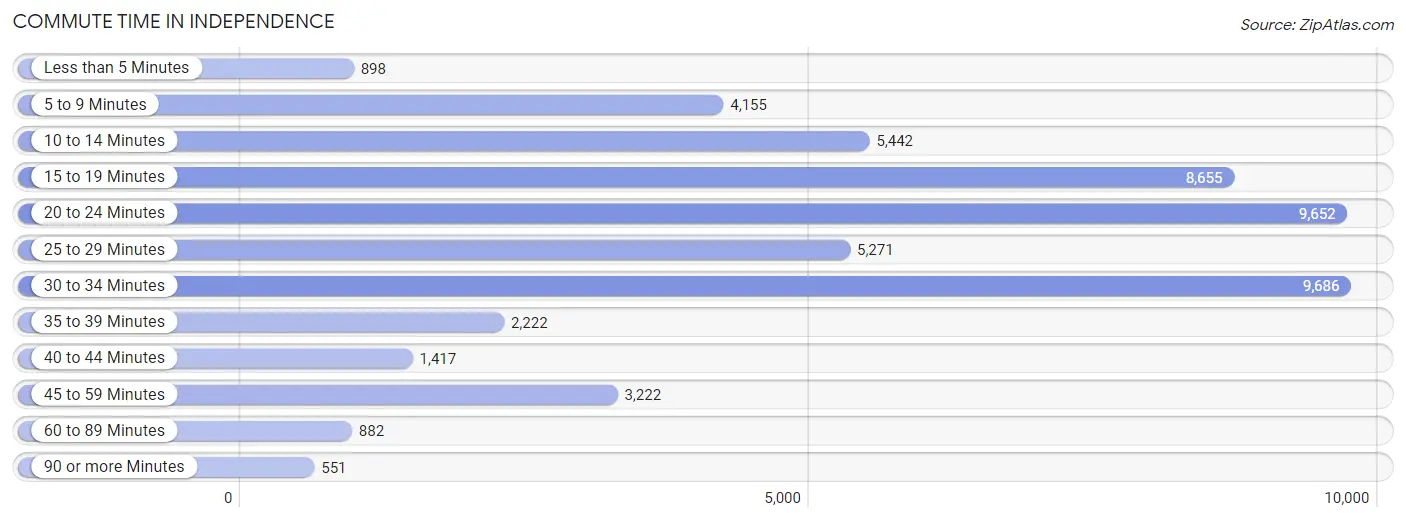
| Commute Time | # Commuters | % Commuters |
| Less than 5 Minutes | 898 | 1.7% |
| 5 to 9 Minutes | 4,155 | 8.0% |
| 10 to 14 Minutes | 5,442 | 10.4% |
| 15 to 19 Minutes | 8,655 | 16.6% |
| 20 to 24 Minutes | 9,652 | 18.5% |
| 25 to 29 Minutes | 5,271 | 10.1% |
| 30 to 34 Minutes | 9,686 | 18.6% |
| 35 to 39 Minutes | 2,222 | 4.3% |
| 40 to 44 Minutes | 1,417 | 2.7% |
| 45 to 59 Minutes | 3,222 | 6.2% |
| 60 to 89 Minutes | 882 | 1.7% |
| 90 or more Minutes | 551 | 1.1% |
Commute Time by Sex in Independence
The most common commute times in Independence are 30 to 34 minutes (5,808 commuters, 20.5%) for males and 20 to 24 minutes (4,459 commuters, 18.8%) for females.
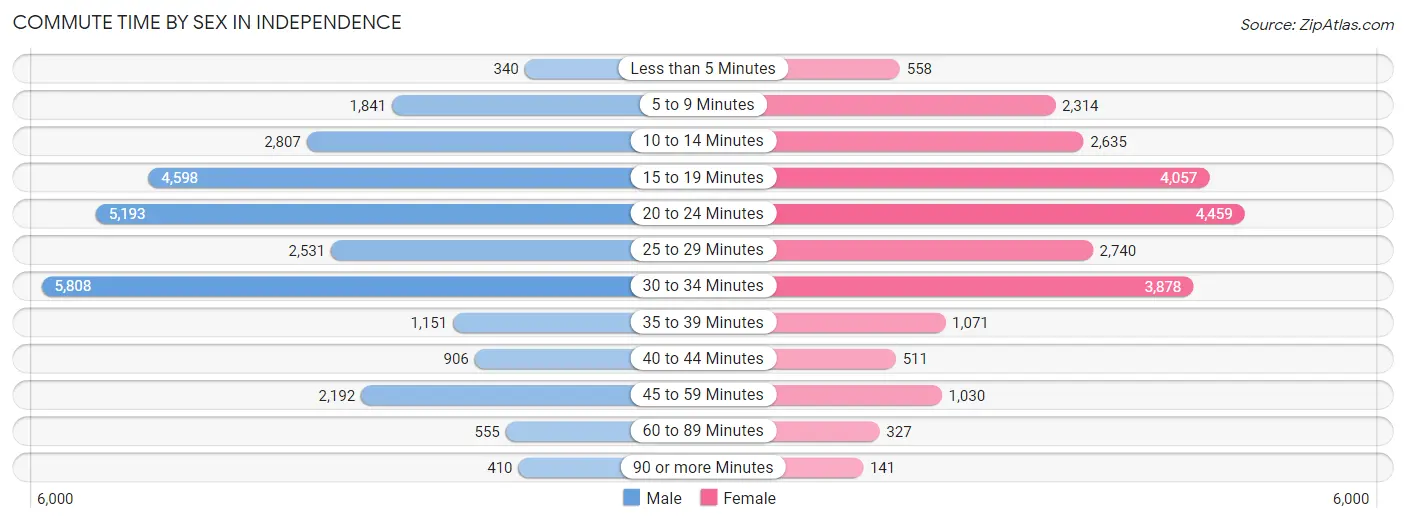
| Commute Time | Male | Female |
| Less than 5 Minutes | 340 (1.2%) | 558 (2.4%) |
| 5 to 9 Minutes | 1,841 (6.5%) | 2,314 (9.8%) |
| 10 to 14 Minutes | 2,807 (9.9%) | 2,635 (11.1%) |
| 15 to 19 Minutes | 4,598 (16.2%) | 4,057 (17.1%) |
| 20 to 24 Minutes | 5,193 (18.3%) | 4,459 (18.8%) |
| 25 to 29 Minutes | 2,531 (8.9%) | 2,740 (11.6%) |
| 30 to 34 Minutes | 5,808 (20.5%) | 3,878 (16.4%) |
| 35 to 39 Minutes | 1,151 (4.1%) | 1,071 (4.5%) |
| 40 to 44 Minutes | 906 (3.2%) | 511 (2.1%) |
| 45 to 59 Minutes | 2,192 (7.7%) | 1,030 (4.3%) |
| 60 to 89 Minutes | 555 (2.0%) | 327 (1.4%) |
| 90 or more Minutes | 410 (1.5%) | 141 (0.6%) |
Time of Departure to Work by Sex in Independence
The most frequent times of departure to work in Independence are 6:00 AM to 6:29 AM (4,003, 14.1%) for males and 7:00 AM to 7:29 AM (3,015, 12.7%) for females.
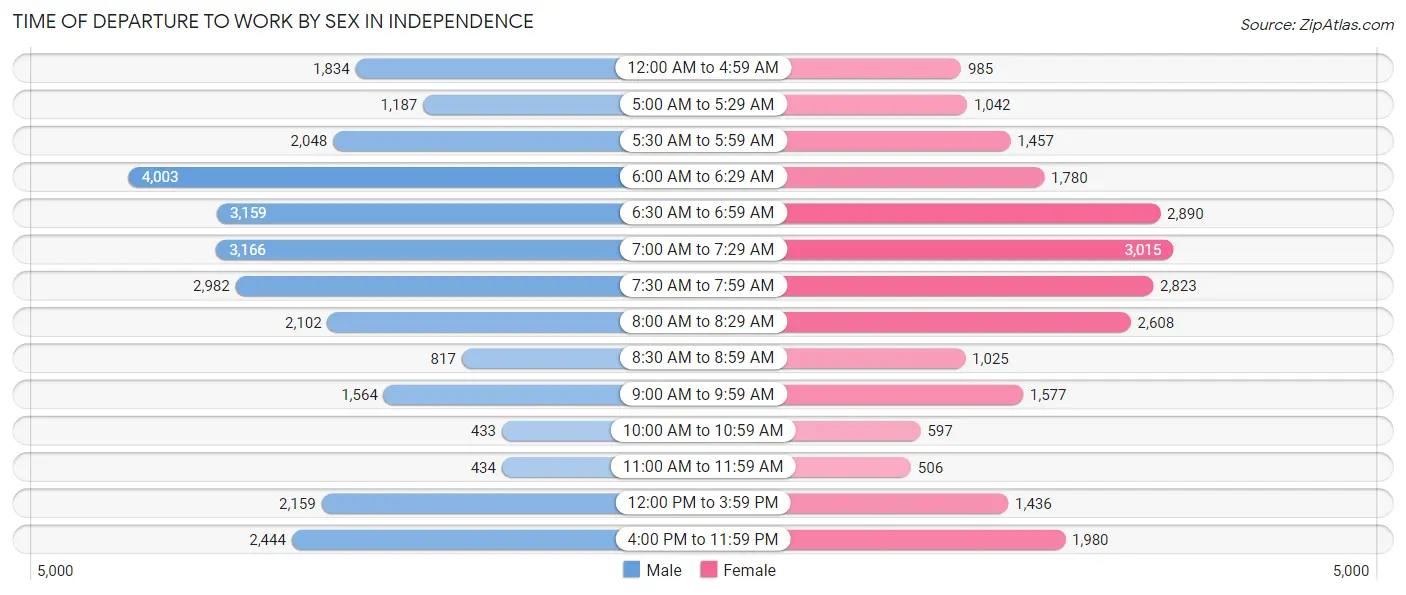
| Time of Departure | Male | Female |
| 12:00 AM to 4:59 AM | 1,834 (6.5%) | 985 (4.2%) |
| 5:00 AM to 5:29 AM | 1,187 (4.2%) | 1,042 (4.4%) |
| 5:30 AM to 5:59 AM | 2,048 (7.2%) | 1,457 (6.1%) |
| 6:00 AM to 6:29 AM | 4,003 (14.1%) | 1,780 (7.5%) |
| 6:30 AM to 6:59 AM | 3,159 (11.2%) | 2,890 (12.2%) |
| 7:00 AM to 7:29 AM | 3,166 (11.2%) | 3,015 (12.7%) |
| 7:30 AM to 7:59 AM | 2,982 (10.5%) | 2,823 (11.9%) |
| 8:00 AM to 8:29 AM | 2,102 (7.4%) | 2,608 (11.0%) |
| 8:30 AM to 8:59 AM | 817 (2.9%) | 1,025 (4.3%) |
| 9:00 AM to 9:59 AM | 1,564 (5.5%) | 1,577 (6.7%) |
| 10:00 AM to 10:59 AM | 433 (1.5%) | 597 (2.5%) |
| 11:00 AM to 11:59 AM | 434 (1.5%) | 506 (2.1%) |
| 12:00 PM to 3:59 PM | 2,159 (7.6%) | 1,436 (6.0%) |
| 4:00 PM to 11:59 PM | 2,444 (8.6%) | 1,980 (8.4%) |
| Total | 28,332 (100.0%) | 23,721 (100.0%) |
Housing Occupancy in Independence
Occupancy by Ownership in Independence
Of the total 51,251 dwellings in Independence, owner-occupied units account for 30,984 (60.5%), while renter-occupied units make up 20,267 (39.5%).
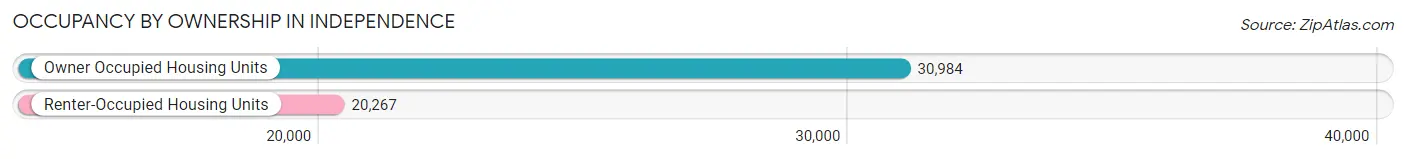
| Occupancy | # Housing Units | % Housing Units |
| Owner Occupied Housing Units | 30,984 | 60.5% |
| Renter-Occupied Housing Units | 20,267 | 39.5% |
| Total Occupied Housing Units | 51,251 | 100.0% |
Occupancy by Household Size in Independence
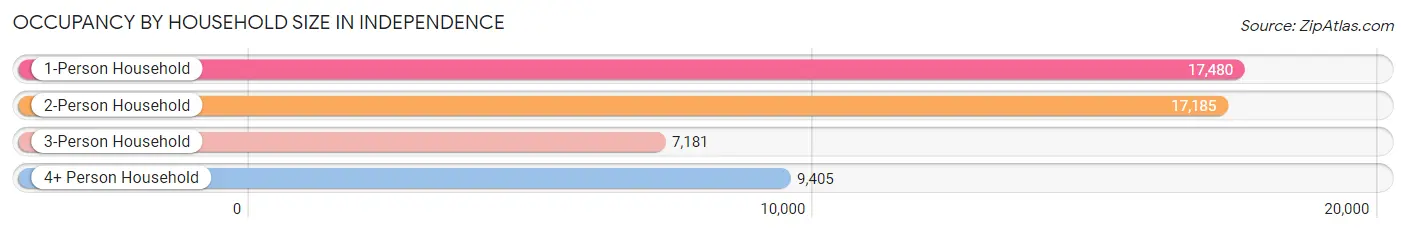
| Household Size | # Housing Units | % Housing Units |
| 1-Person Household | 17,480 | 34.1% |
| 2-Person Household | 17,185 | 33.5% |
| 3-Person Household | 7,181 | 14.0% |
| 4+ Person Household | 9,405 | 18.3% |
| Total Housing Units | 51,251 | 100.0% |
Occupancy by Ownership by Household Size in Independence
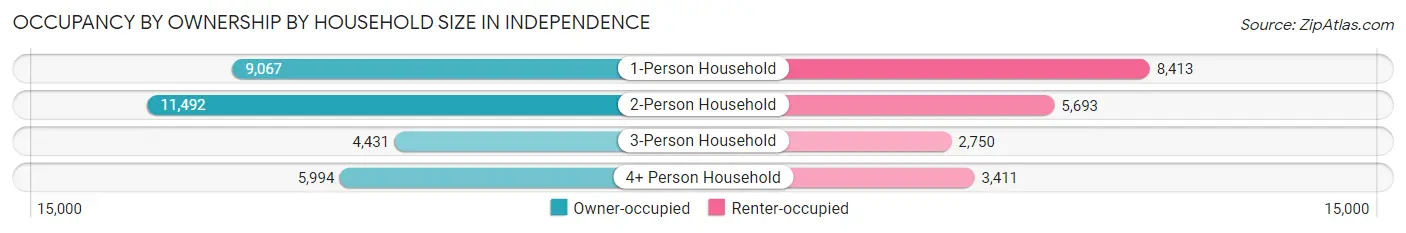
| Household Size | Owner-occupied | Renter-occupied |
| 1-Person Household | 9,067 (51.9%) | 8,413 (48.1%) |
| 2-Person Household | 11,492 (66.9%) | 5,693 (33.1%) |
| 3-Person Household | 4,431 (61.7%) | 2,750 (38.3%) |
| 4+ Person Household | 5,994 (63.7%) | 3,411 (36.3%) |
| Total Housing Units | 30,984 (60.5%) | 20,267 (39.5%) |
Occupancy by Educational Attainment in Independence
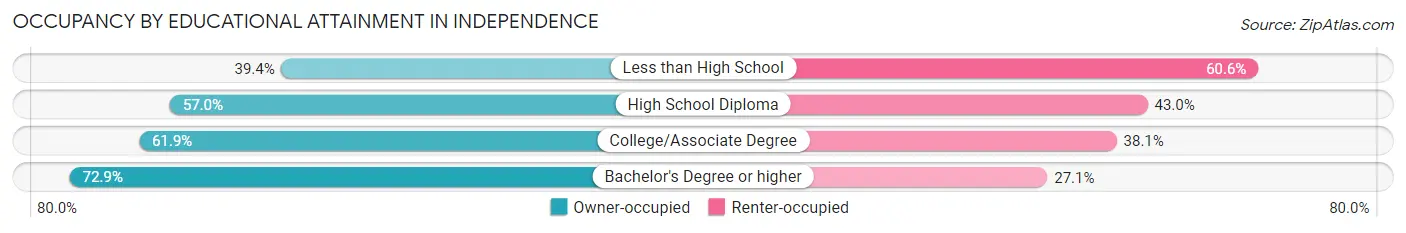
| Household Size | Owner-occupied | Renter-occupied |
| Less than High School | 1,739 (39.4%) | 2,674 (60.6%) |
| High School Diploma | 10,275 (57.0%) | 7,765 (43.0%) |
| College/Associate Degree | 11,310 (61.9%) | 6,974 (38.1%) |
| Bachelor's Degree or higher | 7,660 (72.9%) | 2,854 (27.1%) |
Occupancy by Age of Householder in Independence
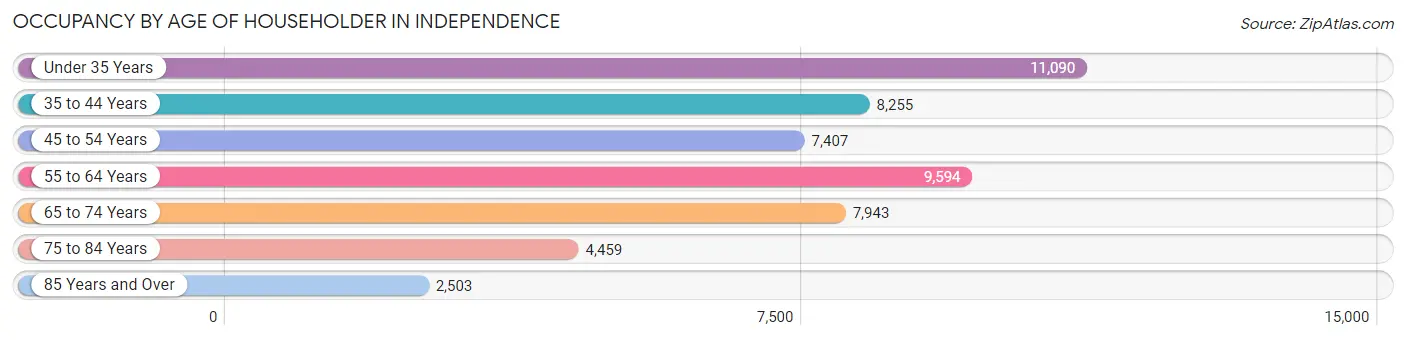
| Age Bracket | # Households | % Households |
| Under 35 Years | 11,090 | 21.6% |
| 35 to 44 Years | 8,255 | 16.1% |
| 45 to 54 Years | 7,407 | 14.4% |
| 55 to 64 Years | 9,594 | 18.7% |
| 65 to 74 Years | 7,943 | 15.5% |
| 75 to 84 Years | 4,459 | 8.7% |
| 85 Years and Over | 2,503 | 4.9% |
| Total | 51,251 | 100.0% |
Housing Finances in Independence
Median Income by Occupancy in Independence
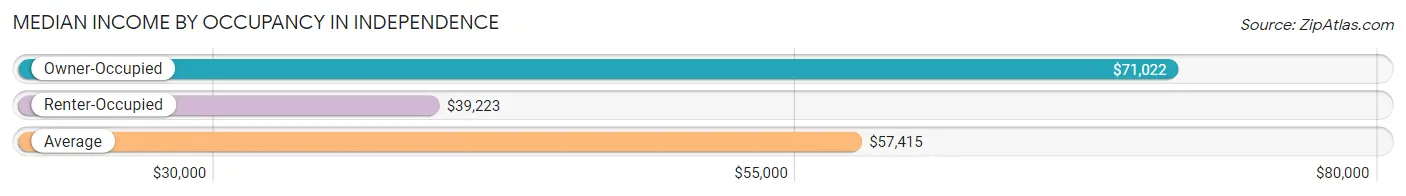
| Occupancy Type | # Households | Median Income |
| Owner-Occupied | 30,984 (60.5%) | $71,022 |
| Renter-Occupied | 20,267 (39.5%) | $39,223 |
| Average | 51,251 (100.0%) | $57,415 |
Occupancy by Householder Income Bracket in Independence
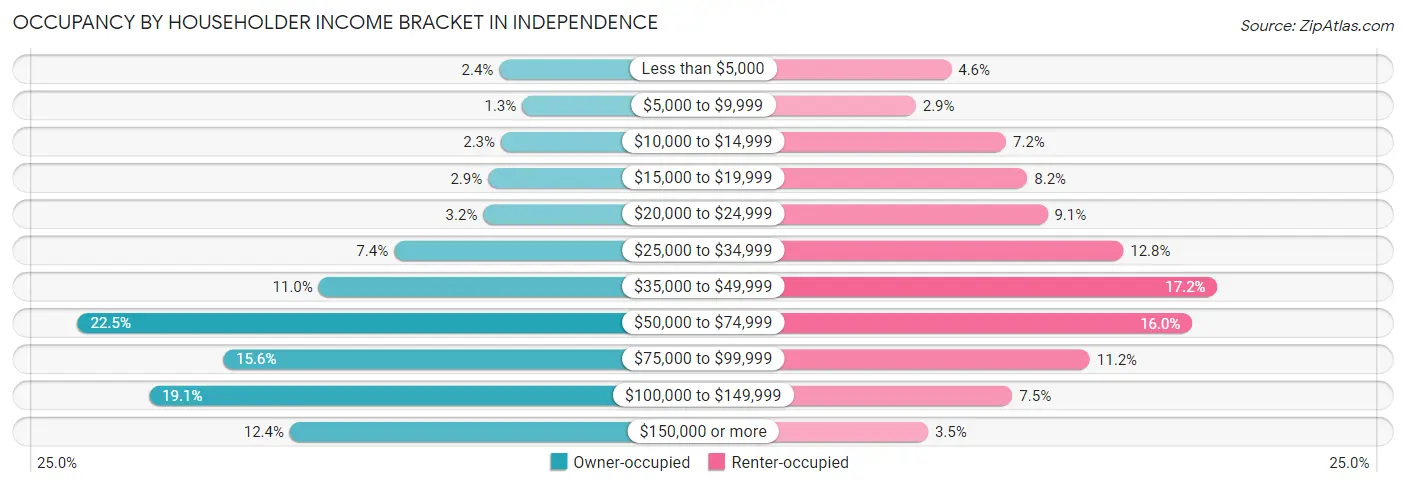
| Income Bracket | Owner-occupied | Renter-occupied |
| Less than $5,000 | 743 (2.4%) | 924 (4.6%) |
| $5,000 to $9,999 | 406 (1.3%) | 581 (2.9%) |
| $10,000 to $14,999 | 719 (2.3%) | 1,453 (7.2%) |
| $15,000 to $19,999 | 908 (2.9%) | 1,657 (8.2%) |
| $20,000 to $24,999 | 978 (3.2%) | 1,853 (9.1%) |
| $25,000 to $34,999 | 2,295 (7.4%) | 2,584 (12.8%) |
| $35,000 to $49,999 | 3,409 (11.0%) | 3,493 (17.2%) |
| $50,000 to $74,999 | 6,966 (22.5%) | 3,248 (16.0%) |
| $75,000 to $99,999 | 4,817 (15.5%) | 2,262 (11.2%) |
| $100,000 to $149,999 | 5,910 (19.1%) | 1,513 (7.5%) |
| $150,000 or more | 3,833 (12.4%) | 699 (3.5%) |
| Total | 30,984 (100.0%) | 20,267 (100.0%) |
Monthly Housing Cost Tiers in Independence
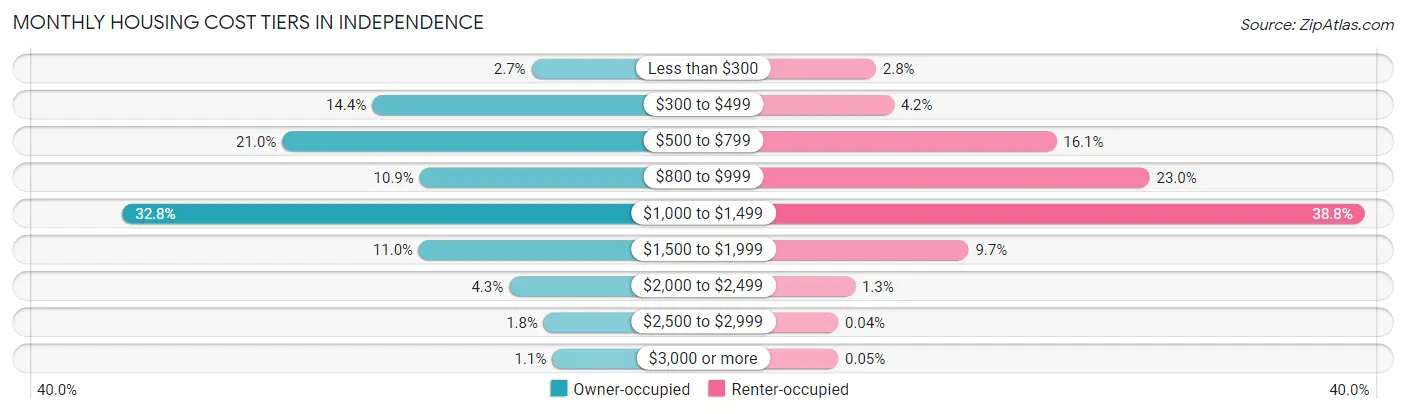
| Monthly Cost | Owner-occupied | Renter-occupied |
| Less than $300 | 828 (2.7%) | 574 (2.8%) |
| $300 to $499 | 4,465 (14.4%) | 841 (4.2%) |
| $500 to $799 | 6,515 (21.0%) | 3,267 (16.1%) |
| $800 to $999 | 3,380 (10.9%) | 4,660 (23.0%) |
| $1,000 to $1,499 | 10,162 (32.8%) | 7,868 (38.8%) |
| $1,500 to $1,999 | 3,395 (11.0%) | 1,956 (9.7%) |
| $2,000 to $2,499 | 1,339 (4.3%) | 262 (1.3%) |
| $2,500 to $2,999 | 546 (1.8%) | 9 (0.0%) |
| $3,000 or more | 354 (1.1%) | 10 (0.1%) |
| Total | 30,984 (100.0%) | 20,267 (100.0%) |
Physical Housing Characteristics in Independence
Housing Structures in Independence
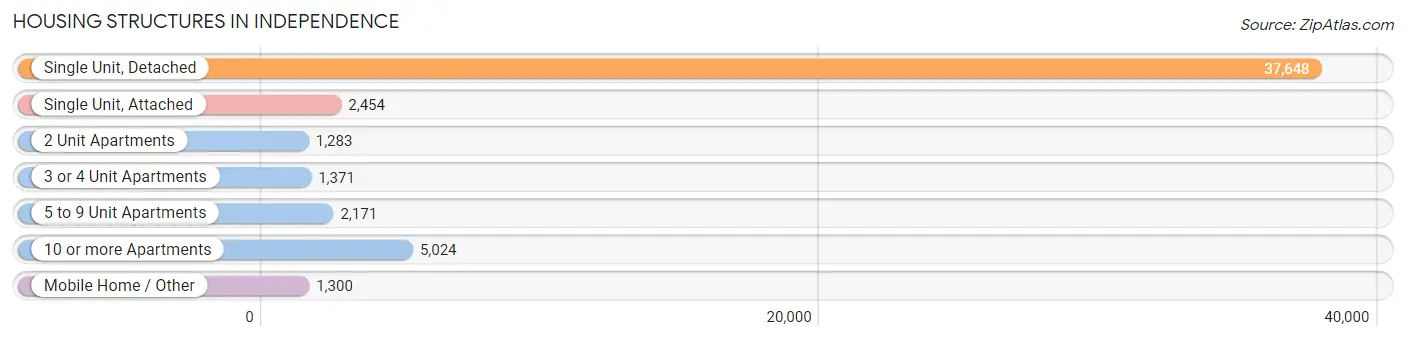
| Structure Type | # Housing Units | % Housing Units |
| Single Unit, Detached | 37,648 | 73.5% |
| Single Unit, Attached | 2,454 | 4.8% |
| 2 Unit Apartments | 1,283 | 2.5% |
| 3 or 4 Unit Apartments | 1,371 | 2.7% |
| 5 to 9 Unit Apartments | 2,171 | 4.2% |
| 10 or more Apartments | 5,024 | 9.8% |
| Mobile Home / Other | 1,300 | 2.5% |
| Total | 51,251 | 100.0% |
Housing Structures by Occupancy in Independence
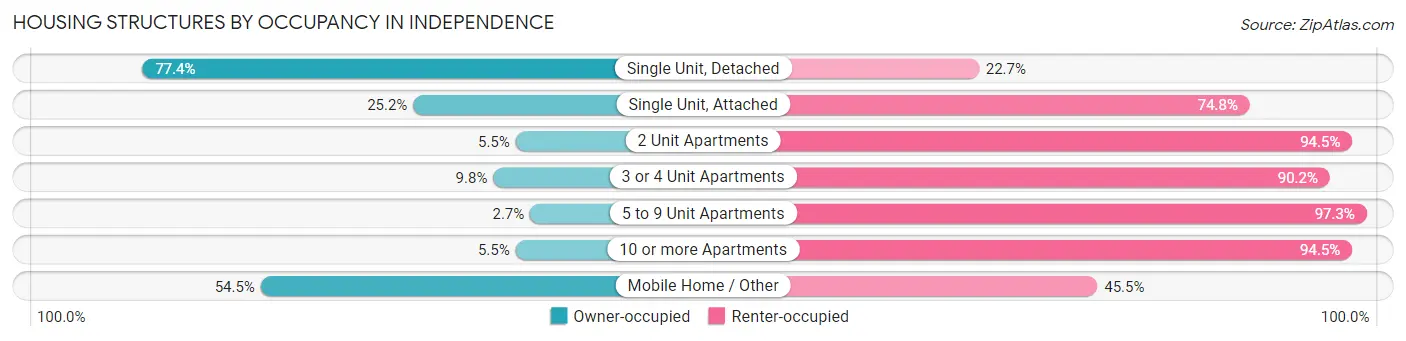
| Structure Type | Owner-occupied | Renter-occupied |
| Single Unit, Detached | 29,120 (77.3%) | 8,528 (22.7%) |
| Single Unit, Attached | 618 (25.2%) | 1,836 (74.8%) |
| 2 Unit Apartments | 70 (5.5%) | 1,213 (94.5%) |
| 3 or 4 Unit Apartments | 134 (9.8%) | 1,237 (90.2%) |
| 5 to 9 Unit Apartments | 58 (2.7%) | 2,113 (97.3%) |
| 10 or more Apartments | 275 (5.5%) | 4,749 (94.5%) |
| Mobile Home / Other | 709 (54.5%) | 591 (45.5%) |
| Total | 30,984 (60.5%) | 20,267 (39.5%) |
Housing Structures by Number of Rooms in Independence
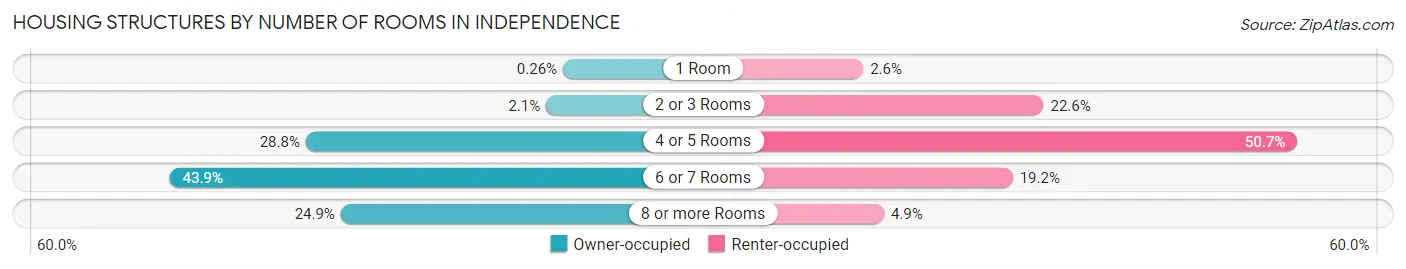
| Number of Rooms | Owner-occupied | Renter-occupied |
| 1 Room | 81 (0.3%) | 525 (2.6%) |
| 2 or 3 Rooms | 657 (2.1%) | 4,581 (22.6%) |
| 4 or 5 Rooms | 8,923 (28.8%) | 10,283 (50.7%) |
| 6 or 7 Rooms | 13,602 (43.9%) | 3,887 (19.2%) |
| 8 or more Rooms | 7,721 (24.9%) | 991 (4.9%) |
| Total | 30,984 (100.0%) | 20,267 (100.0%) |
Housing Structure by Heating Type in Independence
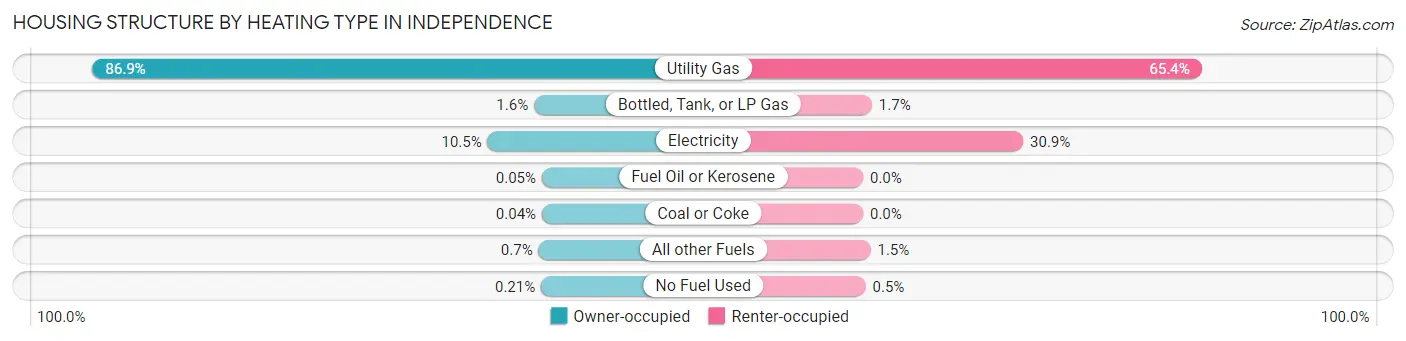
| Heating Type | Owner-occupied | Renter-occupied |
| Utility Gas | 26,922 (86.9%) | 13,256 (65.4%) |
| Bottled, Tank, or LP Gas | 487 (1.6%) | 347 (1.7%) |
| Electricity | 3,266 (10.5%) | 6,268 (30.9%) |
| Fuel Oil or Kerosene | 15 (0.1%) | 0 (0.0%) |
| Coal or Coke | 11 (0.0%) | 0 (0.0%) |
| All other Fuels | 217 (0.7%) | 294 (1.5%) |
| No Fuel Used | 66 (0.2%) | 102 (0.5%) |
| Total | 30,984 (100.0%) | 20,267 (100.0%) |
Household Vehicle Usage in Independence
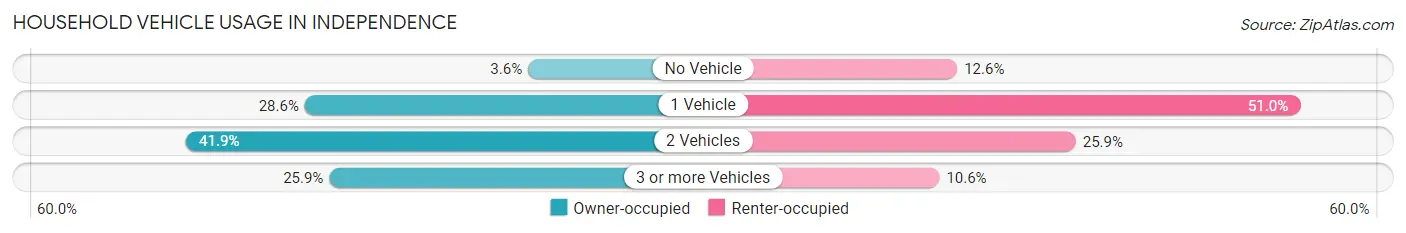
| Vehicles per Household | Owner-occupied | Renter-occupied |
| No Vehicle | 1,117 (3.6%) | 2,549 (12.6%) |
| 1 Vehicle | 8,868 (28.6%) | 10,331 (51.0%) |
| 2 Vehicles | 12,981 (41.9%) | 5,241 (25.9%) |
| 3 or more Vehicles | 8,018 (25.9%) | 2,146 (10.6%) |
| Total | 30,984 (100.0%) | 20,267 (100.0%) |
Real Estate & Mortgages in Independence
Real Estate and Mortgage Overview in Independence
| Characteristic | Without Mortgage | With Mortgage |
| Housing Units | 12,168 | 18,816 |
| Median Property Value | $140,500 | $156,300 |
| Median Household Income | $56,589 | $2,805 |
| Monthly Housing Costs | $539 | $348 |
| Real Estate Taxes | $1,754 | $552 |
Property Value by Mortgage Status in Independence
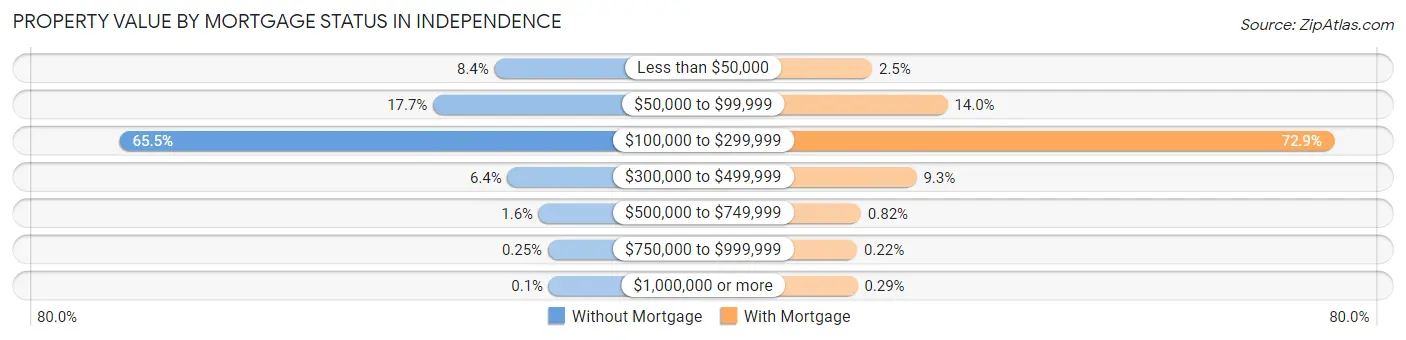
| Property Value | Without Mortgage | With Mortgage |
| Less than $50,000 | 1,020 (8.4%) | 473 (2.5%) |
| $50,000 to $99,999 | 2,158 (17.7%) | 2,634 (14.0%) |
| $100,000 to $299,999 | 7,971 (65.5%) | 13,712 (72.9%) |
| $300,000 to $499,999 | 779 (6.4%) | 1,747 (9.3%) |
| $500,000 to $749,999 | 198 (1.6%) | 154 (0.8%) |
| $750,000 to $999,999 | 30 (0.3%) | 42 (0.2%) |
| $1,000,000 or more | 12 (0.1%) | 54 (0.3%) |
| Total | 12,168 (100.0%) | 18,816 (100.0%) |
Household Income by Mortgage Status in Independence
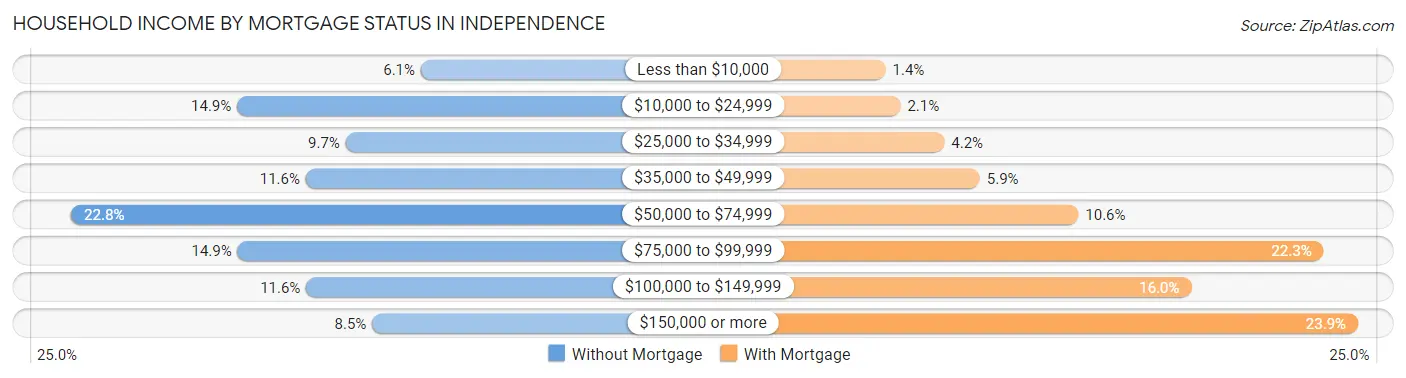
| Household Income | Without Mortgage | With Mortgage |
| Less than $10,000 | 746 (6.1%) | 269 (1.4%) |
| $10,000 to $24,999 | 1,810 (14.9%) | 403 (2.1%) |
| $25,000 to $34,999 | 1,181 (9.7%) | 795 (4.2%) |
| $35,000 to $49,999 | 1,413 (11.6%) | 1,114 (5.9%) |
| $50,000 to $74,999 | 2,772 (22.8%) | 1,996 (10.6%) |
| $75,000 to $99,999 | 1,808 (14.9%) | 4,194 (22.3%) |
| $100,000 to $149,999 | 1,410 (11.6%) | 3,009 (16.0%) |
| $150,000 or more | 1,028 (8.5%) | 4,500 (23.9%) |
| Total | 12,168 (100.0%) | 18,816 (100.0%) |
Property Value to Household Income Ratio in Independence
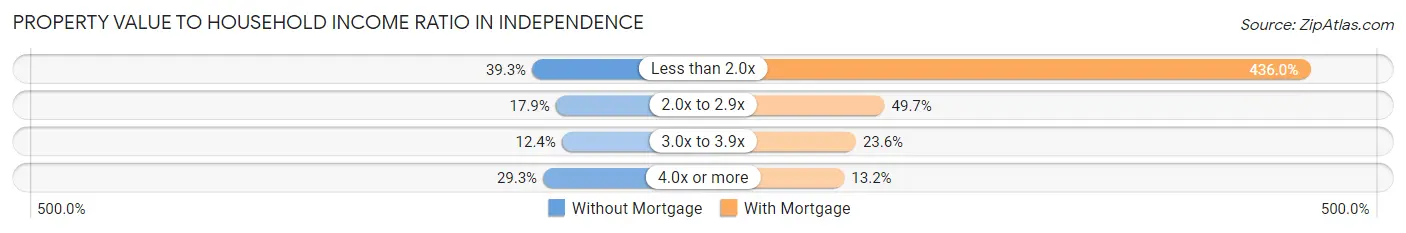
| Value-to-Income Ratio | Without Mortgage | With Mortgage |
| Less than 2.0x | 4,782 (39.3%) | 82,031 (436.0%) |
| 2.0x to 2.9x | 2,175 (17.9%) | 9,343 (49.6%) |
| 3.0x to 3.9x | 1,504 (12.4%) | 4,449 (23.6%) |
| 4.0x or more | 3,567 (29.3%) | 2,476 (13.2%) |
| Total | 12,168 (100.0%) | 18,816 (100.0%) |
Real Estate Taxes by Mortgage Status in Independence
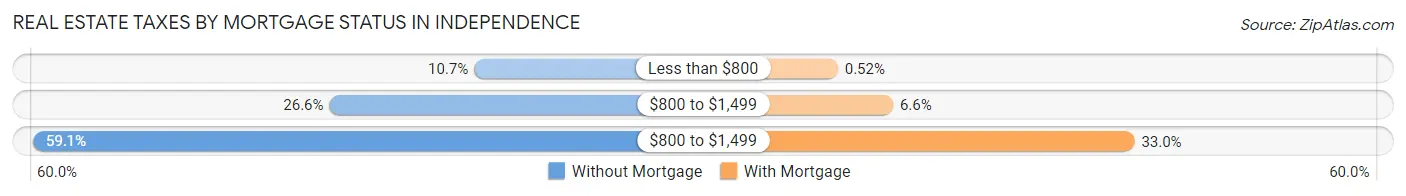
| Property Taxes | Without Mortgage | With Mortgage |
| Less than $800 | 1,307 (10.7%) | 97 (0.5%) |
| $800 to $1,499 | 3,237 (26.6%) | 1,236 (6.6%) |
| $800 to $1,499 | 7,190 (59.1%) | 6,214 (33.0%) |
| Total | 12,168 (100.0%) | 18,816 (100.0%) |
Health & Disability in Independence
Health Insurance Coverage by Age in Independence
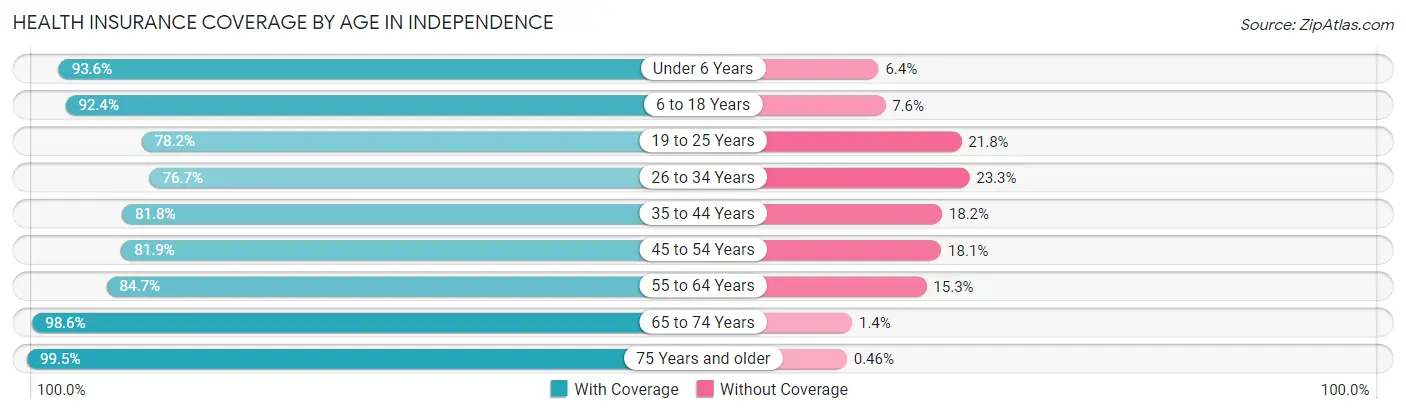
| Age Bracket | With Coverage | Without Coverage |
| Under 6 Years | 8,317 (93.6%) | 567 (6.4%) |
| 6 to 18 Years | 18,410 (92.4%) | 1,521 (7.6%) |
| 19 to 25 Years | 7,926 (78.2%) | 2,215 (21.8%) |
| 26 to 34 Years | 11,660 (76.7%) | 3,544 (23.3%) |
| 35 to 44 Years | 12,240 (81.8%) | 2,724 (18.2%) |
| 45 to 54 Years | 11,517 (81.9%) | 2,538 (18.1%) |
| 55 to 64 Years | 13,769 (84.7%) | 2,490 (15.3%) |
| 65 to 74 Years | 11,944 (98.6%) | 175 (1.4%) |
| 75 Years and older | 9,478 (99.5%) | 44 (0.5%) |
| Total | 105,261 (86.9%) | 15,818 (13.1%) |
Health Insurance Coverage by Citizenship Status in Independence
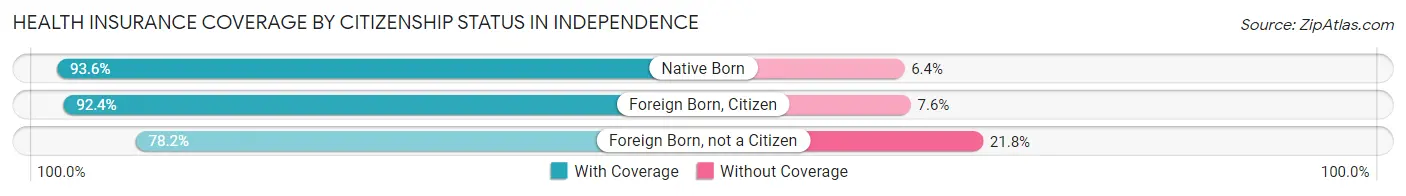
| Citizenship Status | With Coverage | Without Coverage |
| Native Born | 8,317 (93.6%) | 567 (6.4%) |
| Foreign Born, Citizen | 18,410 (92.4%) | 1,521 (7.6%) |
| Foreign Born, not a Citizen | 7,926 (78.2%) | 2,215 (21.8%) |
Health Insurance Coverage by Household Income in Independence
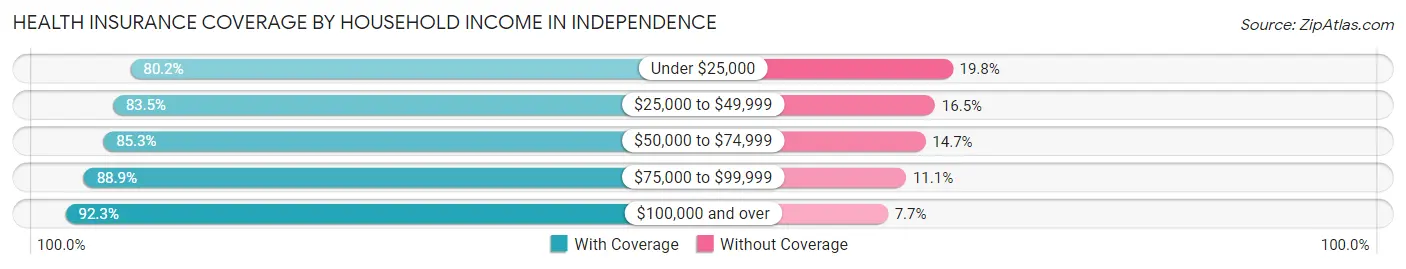
| Household Income | With Coverage | Without Coverage |
| Under $25,000 | 14,106 (80.2%) | 3,485 (19.8%) |
| $25,000 to $49,999 | 18,125 (83.5%) | 3,584 (16.5%) |
| $50,000 to $74,999 | 20,975 (85.3%) | 3,624 (14.7%) |
| $75,000 to $99,999 | 17,933 (88.9%) | 2,236 (11.1%) |
| $100,000 and over | 33,965 (92.3%) | 2,821 (7.7%) |
Public vs Private Health Insurance Coverage by Age in Independence
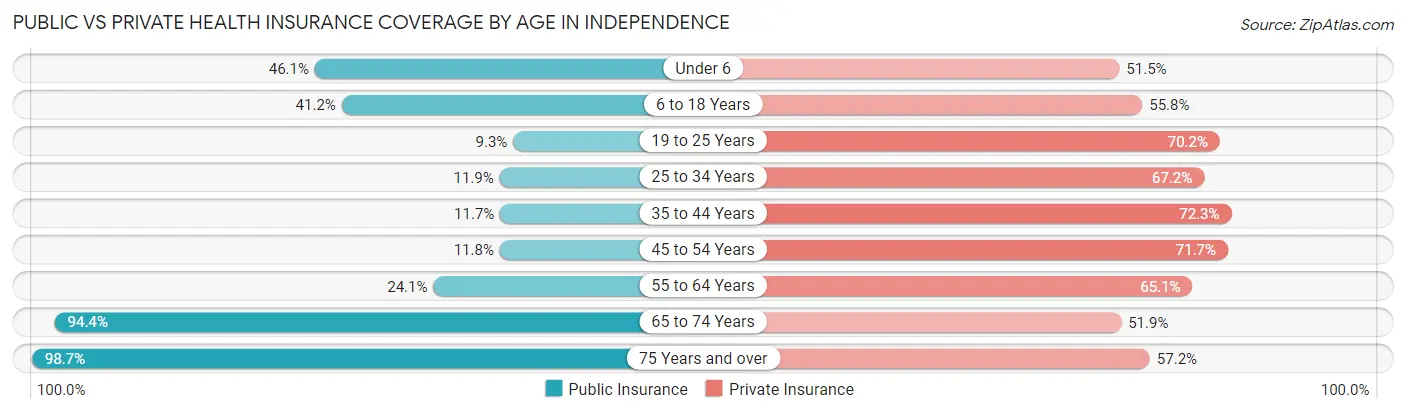
| Age Bracket | Public Insurance | Private Insurance |
| Under 6 | 4,098 (46.1%) | 4,578 (51.5%) |
| 6 to 18 Years | 8,202 (41.1%) | 11,118 (55.8%) |
| 19 to 25 Years | 945 (9.3%) | 7,114 (70.2%) |
| 25 to 34 Years | 1,802 (11.8%) | 10,222 (67.2%) |
| 35 to 44 Years | 1,756 (11.7%) | 10,819 (72.3%) |
| 45 to 54 Years | 1,660 (11.8%) | 10,071 (71.7%) |
| 55 to 64 Years | 3,925 (24.1%) | 10,581 (65.1%) |
| 65 to 74 Years | 11,443 (94.4%) | 6,286 (51.9%) |
| 75 Years and over | 9,394 (98.7%) | 5,446 (57.2%) |
| Total | 43,225 (35.7%) | 76,235 (63.0%) |
Disability Status by Sex by Age in Independence
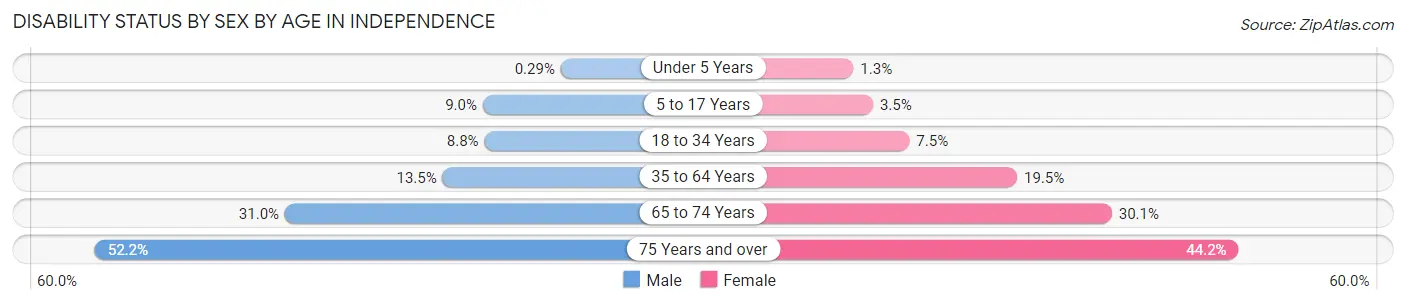
| Age Bracket | Male | Female |
| Under 5 Years | 11 (0.3%) | 49 (1.3%) |
| 5 to 17 Years | 911 (9.0%) | 343 (3.5%) |
| 18 to 34 Years | 1,178 (8.8%) | 993 (7.5%) |
| 35 to 64 Years | 3,011 (13.5%) | 4,466 (19.5%) |
| 65 to 74 Years | 1,734 (31.0%) | 1,963 (30.1%) |
| 75 Years and over | 1,989 (52.2%) | 2,522 (44.2%) |
Disability Class by Sex by Age in Independence
Disability Class: Hearing Difficulty
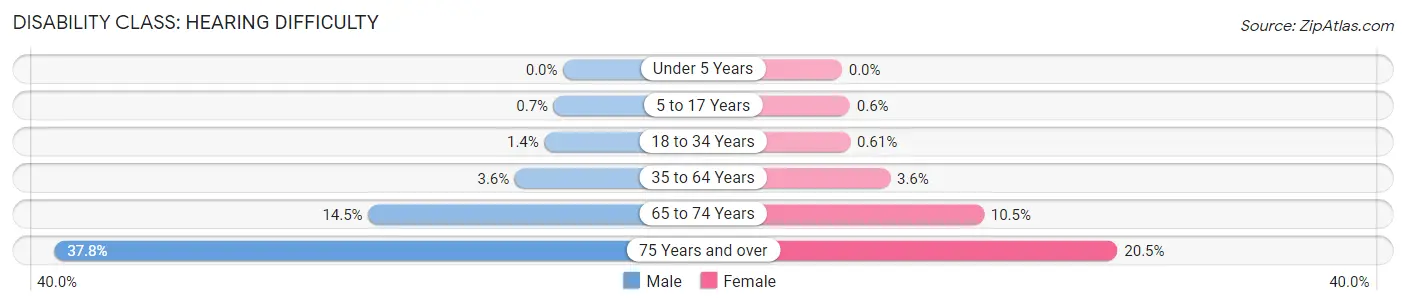
| Age Bracket | Male | Female |
| Under 5 Years | 0 (0.0%) | 0 (0.0%) |
| 5 to 17 Years | 71 (0.7%) | 59 (0.6%) |
| 18 to 34 Years | 186 (1.4%) | 80 (0.6%) |
| 35 to 64 Years | 801 (3.6%) | 819 (3.6%) |
| 65 to 74 Years | 809 (14.5%) | 688 (10.5%) |
| 75 Years and over | 1,441 (37.8%) | 1,168 (20.5%) |
Disability Class: Vision Difficulty
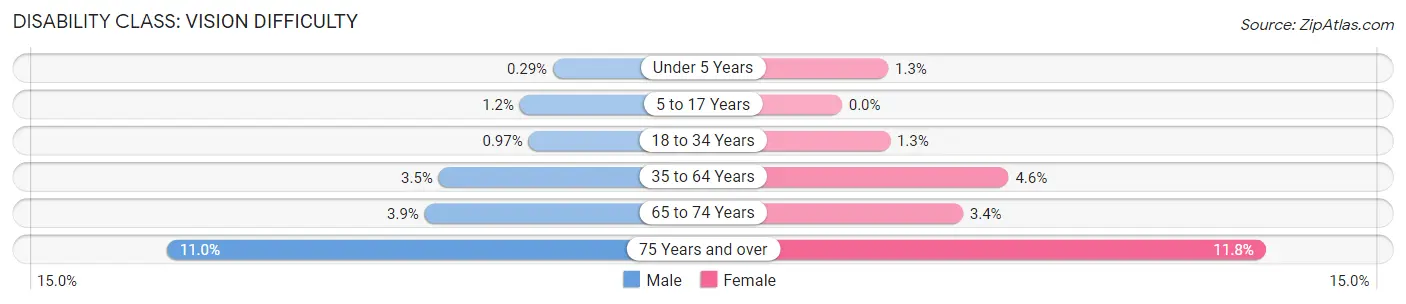
| Age Bracket | Male | Female |
| Under 5 Years | 11 (0.3%) | 49 (1.3%) |
| 5 to 17 Years | 123 (1.2%) | 0 (0.0%) |
| 18 to 34 Years | 130 (1.0%) | 176 (1.3%) |
| 35 to 64 Years | 778 (3.5%) | 1,061 (4.6%) |
| 65 to 74 Years | 216 (3.9%) | 220 (3.4%) |
| 75 Years and over | 421 (11.0%) | 674 (11.8%) |
Disability Class: Cognitive Difficulty
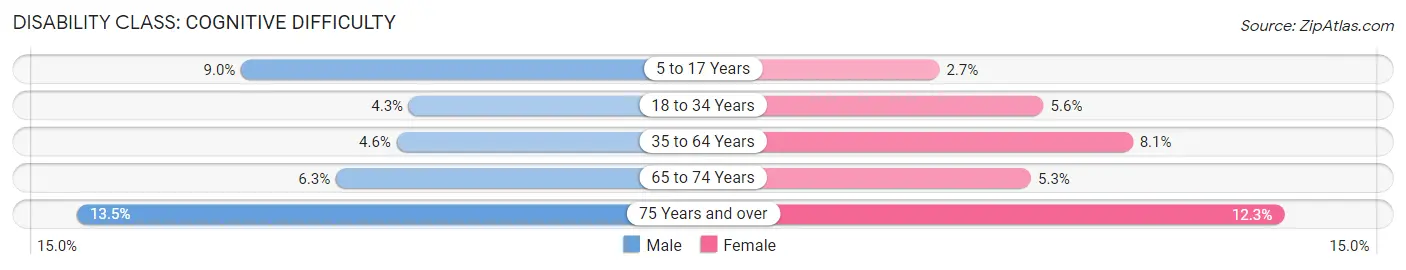
| Age Bracket | Male | Female |
| 5 to 17 Years | 911 (9.0%) | 269 (2.7%) |
| 18 to 34 Years | 576 (4.3%) | 741 (5.6%) |
| 35 to 64 Years | 1,040 (4.6%) | 1,854 (8.1%) |
| 65 to 74 Years | 354 (6.3%) | 344 (5.3%) |
| 75 Years and over | 516 (13.5%) | 703 (12.3%) |
Disability Class: Ambulatory Difficulty
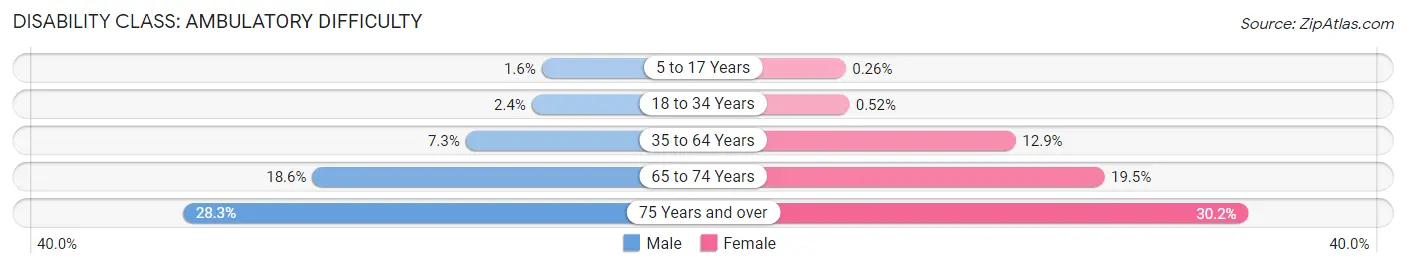
| Age Bracket | Male | Female |
| 5 to 17 Years | 164 (1.6%) | 26 (0.3%) |
| 18 to 34 Years | 315 (2.4%) | 68 (0.5%) |
| 35 to 64 Years | 1,626 (7.3%) | 2,950 (12.9%) |
| 65 to 74 Years | 1,042 (18.6%) | 1,271 (19.5%) |
| 75 Years and over | 1,077 (28.2%) | 1,724 (30.2%) |
Disability Class: Self-Care Difficulty
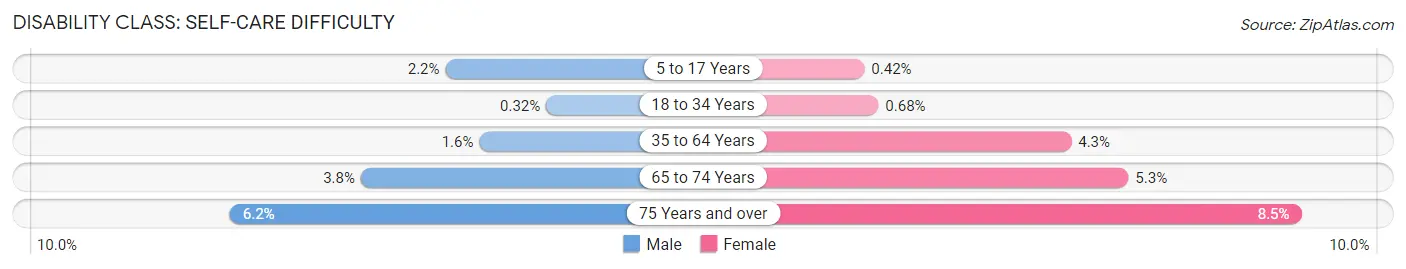
| Age Bracket | Male | Female |
| 5 to 17 Years | 222 (2.2%) | 42 (0.4%) |
| 18 to 34 Years | 43 (0.3%) | 90 (0.7%) |
| 35 to 64 Years | 349 (1.6%) | 974 (4.3%) |
| 65 to 74 Years | 210 (3.8%) | 347 (5.3%) |
| 75 Years and over | 236 (6.2%) | 487 (8.5%) |
Technology Access in Independence
Computing Device Access in Independence
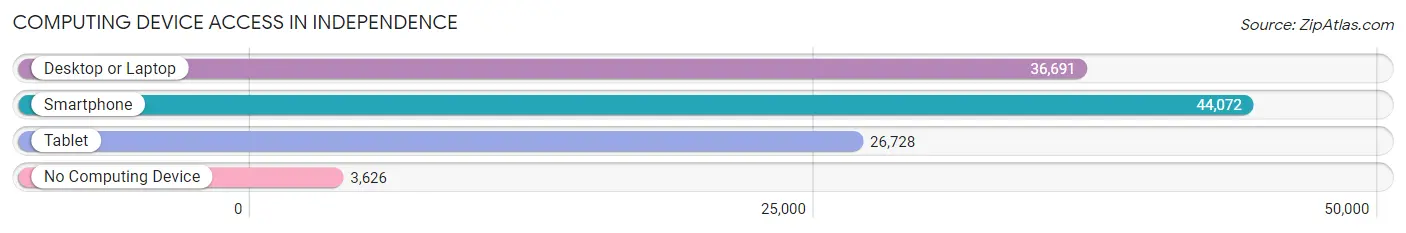
| Device Type | # Households | % Households |
| Desktop or Laptop | 36,691 | 71.6% |
| Smartphone | 44,072 | 86.0% |
| Tablet | 26,728 | 52.1% |
| No Computing Device | 3,626 | 7.1% |
| Total | 51,251 | 100.0% |
Internet Access in Independence
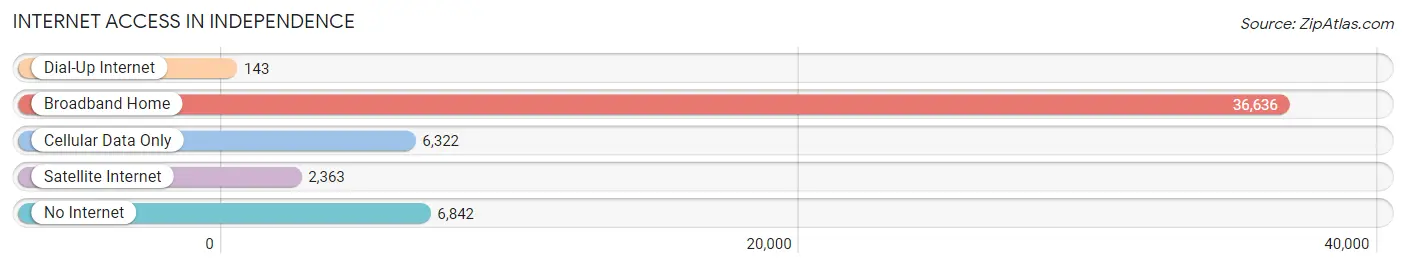
| Internet Type | # Households | % Households |
| Dial-Up Internet | 143 | 0.3% |
| Broadband Home | 36,636 | 71.5% |
| Cellular Data Only | 6,322 | 12.3% |
| Satellite Internet | 2,363 | 4.6% |
| No Internet | 6,842 | 13.4% |
| Total | 51,251 | 100.0% |
Independence Summary
Independence, Missouri is a city located in the western part of the state, just east of Kansas City. It is the fourth-largest city in Missouri, with a population of 116,830 as of the 2020 census. The city is part of the Kansas City metropolitan area, and is the county seat of Jackson County.
History
Independence was founded in 1827 by a group of settlers from the nearby town of Van Buren, Arkansas. The settlers were led by John O'Sullivan, who named the town after the Declaration of Independence. The town quickly grew, and by 1831 it had become the county seat of Jackson County.
In 1833, the town was incorporated as a city. During the Civil War, Independence was a major center of activity for the Union Army, and was the site of several battles. After the war, the city continued to grow, and by the early 20th century it had become a major industrial center.
Geography
Independence is located in western Missouri, just east of Kansas City. It is situated on the Missouri River, and is bordered by the cities of Kansas City, Raytown, and Blue Springs. The city covers an area of approximately 50 square miles, and has an elevation of 890 feet.
Climate
Independence has a humid continental climate, with hot, humid summers and cold, dry winters. The average annual temperature is 54°F, and the average annual precipitation is 40 inches.
Economy
Independence is a major economic center in the Kansas City metropolitan area. The city is home to several large companies, including Hallmark Cards, the Truman Medical Center, and the Federal Reserve Bank of Kansas City. The city also has a large retail sector, with several major shopping malls and outlets.
Demographics
As of the 2020 census, the population of Independence was 116,830. The racial makeup of the city was 79.2% White, 13.3% African American, 0.7% Native American, 2.2% Asian, and 4.6% from other races. The median household income was $50,945, and the median home value was $150,000.
Conclusion
Independence, Missouri is a vibrant city with a rich history and a strong economy. It is home to a diverse population, and is a major economic center in the Kansas City metropolitan area. With its convenient location, excellent schools, and numerous attractions, Independence is an ideal place to live and work.
Common Questions
What is Per Capita Income in Independence?
Per Capita income in Independence is $31,491.
What is the Median Family Income in Independence?
Median Family Income in Independence is $74,081.
What is the Median Household income in Independence?
Median Household Income in Independence is $57,415.
What is Income or Wage Gap in Independence?
Income or Wage Gap in Independence is 32.6%.
Women in Independence earn 67.4 cents for every dollar earned by a man.
What is Family Income Deficit in Independence?
Family Income Deficit in Independence is $10,632.
Families that are below poverty line in Independence earn $10,632 less on average than the poverty threshold level.
What is Inequality or Gini Index in Independence?
Inequality or Gini Index in Independence is 0.43.
What is the Total Population of Independence?
Total Population of Independence is 122,218.
What is the Total Male Population of Independence?
Total Male Population of Independence is 59,510.
What is the Total Female Population of Independence?
Total Female Population of Independence is 62,708.
What is the Ratio of Males per 100 Females in Independence?
There are 94.90 Males per 100 Females in Independence.
What is the Ratio of Females per 100 Males in Independence?
There are 105.37 Females per 100 Males in Independence.
What is the Median Population Age in Independence?
Median Population Age in Independence is 39.5 Years.
What is the Average Family Size in Independence
Average Family Size in Independence is 3.0 People.
What is the Average Household Size in Independence
Average Household Size in Independence is 2.4 People.
How Large is the Labor Force in Independence?
There are 61,476 People in the Labor Forcein in Independence.
What is the Percentage of People in the Labor Force in Independence?
63.0% of People are in the Labor Force in Independence.
What is the Unemployment Rate in Independence?
Unemployment Rate in Independence is 6.2%.