Area Code 636 Map & Demographics
Area Code 636 Map
Area Code 636 Overview
$43,334
PER CAPITA INCOME
$105,230
AVG FAMILY INCOME
$88,957
AVG HOUSEHOLD INCOME
33.7%
WAGE / INCOME GAP [ % ]
66.3¢/ $1
WAGE / INCOME GAP [ $ ]
$11,099
FAMILY INCOME DEFICIT
27.85
INEQUALITY / GINI INDEX
1,167,395
TOTAL POPULATION
577,765
MALE POPULATION
589,630
FEMALE POPULATION
97.99
MALES / 100 FEMALES
102.05
FEMALES / 100 MALES
41.6
MEDIAN AGE
3.0
AVG FAMILY SIZE
2.6
AVG HOUSEHOLD SIZE
600,004
LABOR FORCE [ PEOPLE ]
64.2%
PERCENT IN LABOR FORCE
4.2%
UNEMPLOYMENT RATE
Income in Area Code 636
Income Overview in Area Code 636
Per Capita Income in Area Code 636 is $43,334, while median incomes of families and households are $105,230 and $88,957 respectively.
| Characteristic | Number | Measure |
| Per Capita Income | 1,167,395 | $43,334 |
| Median Family Income | 315,760 | $105,230 |
| Mean Family Income | 315,760 | $8,873,952 |
| Median Household Income | 455,294 | $88,957 |
| Mean Household Income | 455,294 | $7,741,598 |
| Income Deficit | 315,760 | $11,099 |
| Wage / Income Gap (%) | 1,167,395 | 33.68% |
| Wage / Income Gap ($) | 1,167,395 | 66.32¢ per $1 |
| Gini / Inequality Index | 1,167,395 | 27.85 |
Earnings by Sex in Area Code 636
Average Earnings in Area Code 636 are $48,147, $59,795 for men and $38,846 for women, a difference of 35.0%.
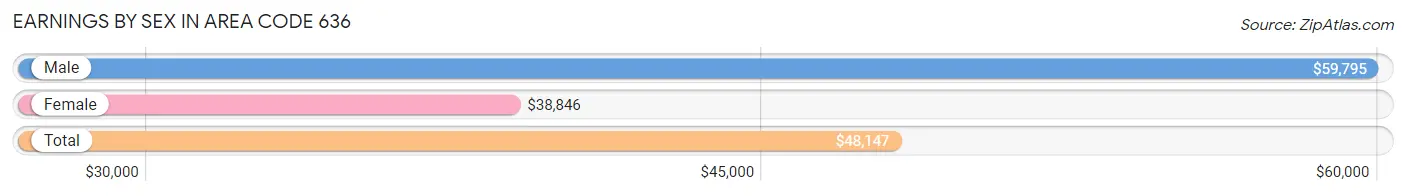
| Sex | Number | Average Earnings |
| Male | 343,659 (52.7%) | $59,795 |
| Female | 308,491 (47.3%) | $38,846 |
| Total | 652,150 (100.0%) | $48,147 |
Earnings by Sex by Income Bracket in Area Code 636
The most common earnings brackets in Area Code 636 are $100,000+ for men (85,916 | 25.0%) and $100,000+ for women (35,856 | 11.6%).
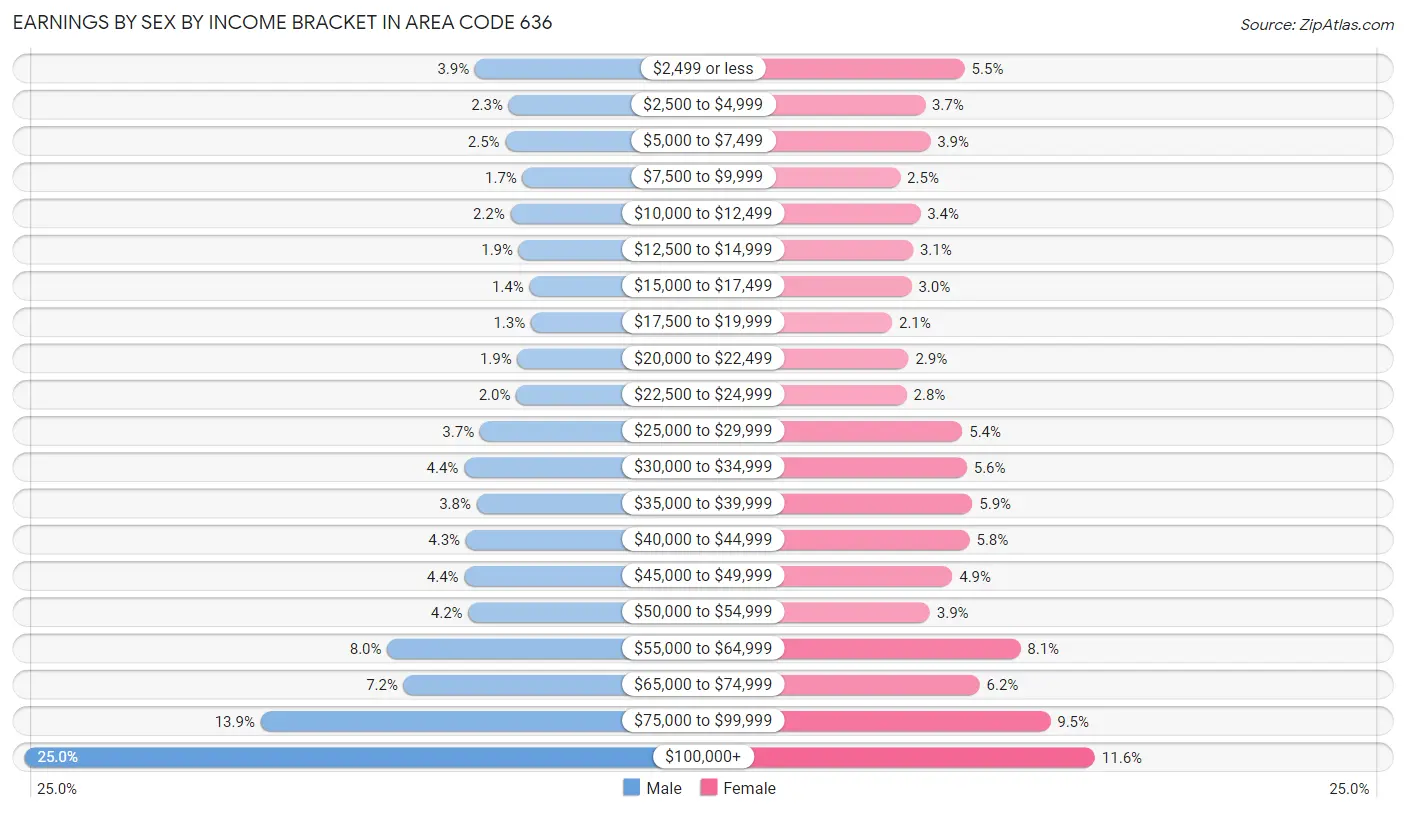
| Income | Male | Female |
| $2,499 or less | 13,405 (3.9%) | 17,016 (5.5%) |
| $2,500 to $4,999 | 7,975 (2.3%) | 11,296 (3.7%) |
| $5,000 to $7,499 | 8,512 (2.5%) | 12,074 (3.9%) |
| $7,500 to $9,999 | 5,726 (1.7%) | 7,726 (2.5%) |
| $10,000 to $12,499 | 7,704 (2.2%) | 10,623 (3.4%) |
| $12,500 to $14,999 | 6,362 (1.8%) | 9,571 (3.1%) |
| $15,000 to $17,499 | 4,633 (1.3%) | 9,360 (3.0%) |
| $17,500 to $19,999 | 4,402 (1.3%) | 6,545 (2.1%) |
| $20,000 to $22,499 | 6,579 (1.9%) | 8,914 (2.9%) |
| $22,500 to $24,999 | 6,763 (2.0%) | 8,644 (2.8%) |
| $25,000 to $29,999 | 12,620 (3.7%) | 16,703 (5.4%) |
| $30,000 to $34,999 | 15,142 (4.4%) | 17,352 (5.6%) |
| $35,000 to $39,999 | 13,123 (3.8%) | 18,147 (5.9%) |
| $40,000 to $44,999 | 14,889 (4.3%) | 17,736 (5.8%) |
| $45,000 to $49,999 | 15,132 (4.4%) | 15,240 (4.9%) |
| $50,000 to $54,999 | 14,453 (4.2%) | 12,007 (3.9%) |
| $55,000 to $64,999 | 27,517 (8.0%) | 25,077 (8.1%) |
| $65,000 to $74,999 | 24,895 (7.2%) | 19,191 (6.2%) |
| $75,000 to $99,999 | 47,911 (13.9%) | 29,413 (9.5%) |
| $100,000+ | 85,916 (25.0%) | 35,856 (11.6%) |
| Total | 343,659 (100.0%) | 308,491 (100.0%) |
Earnings by Sex by Educational Attainment in Area Code 636
Average earnings in Area Code 636 are $4,631,419 for men and $2,994,782 for women, a difference of 35.3%. Men with an educational attainment of graduate degree enjoy the highest average annual earnings of $5,234,190, while those with less than high school education earn the least with $1,791,320. Women with an educational attainment of graduate degree earn the most with the average annual earnings of $4,231,236, while those with less than high school education have the smallest earnings of $763,919.
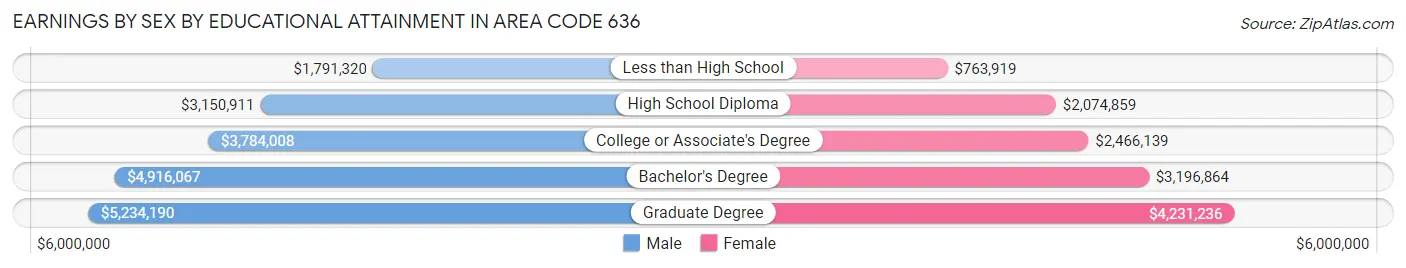
| Educational Attainment | Male Income | Female Income |
| Less than High School | $1,791,320 | $763,919 |
| High School Diploma | $3,150,911 | $2,074,859 |
| College or Associate's Degree | $3,784,008 | $2,466,139 |
| Bachelor's Degree | $4,916,067 | $3,196,864 |
| Graduate Degree | $5,234,190 | $4,231,236 |
| Total | $4,631,419 | $2,994,782 |
Family Income in Area Code 636
Family Income Brackets in Area Code 636
According to the Area Code 636 family income data, there are 5,224,881 families falling into the $100,000 to $149,999 income range, which is the most common income bracket and makes up 1,654.7% of all families. Conversely, the $10,000 to $14,999 income bracket is the least frequent group with only 332,811 families (105.4%) belonging to this category.
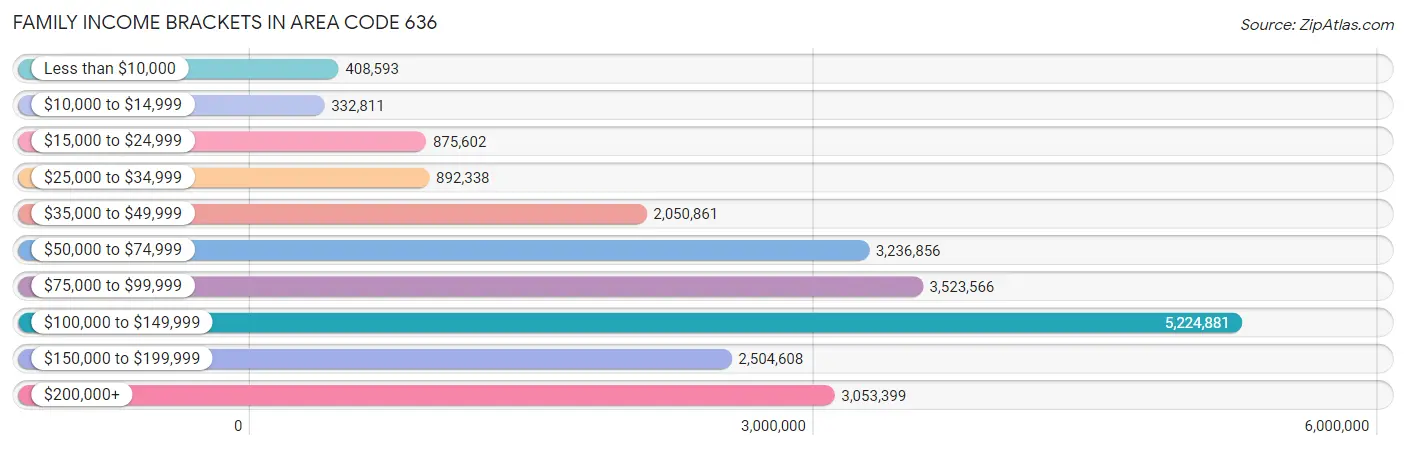
| Income Bracket | # Families | % Families |
| Less than $10,000 | 408,593 | 129.4% |
| $10,000 to $14,999 | 332,811 | 105.4% |
| $15,000 to $24,999 | 875,602 | 277.3% |
| $25,000 to $34,999 | 892,338 | 282.6% |
| $35,000 to $49,999 | 2,050,861 | 649.5% |
| $50,000 to $74,999 | 3,236,856 | 1,025.1% |
| $75,000 to $99,999 | 3,523,566 | 1,115.9% |
| $100,000 to $149,999 | 5,224,881 | 1,654.7% |
| $150,000 to $199,999 | 2,504,608 | 793.2% |
| $200,000+ | 3,053,399 | 967.0% |
Family Income by Famaliy Size in Area Code 636
7+ person families (3,194 | 1.0%) account for the highest median family income in Area Code 636 with $152,786 per family, while 2-person families (149,523 | 47.3%) have the highest median income of $45,256 per family member.
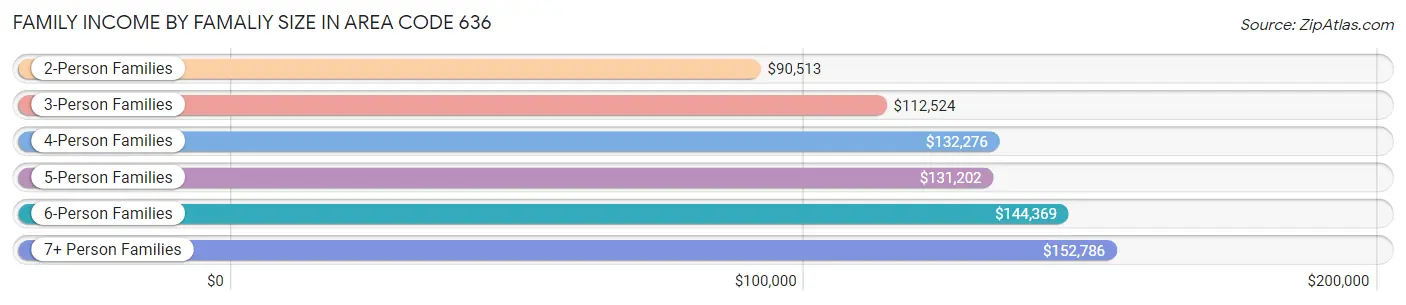
| Income Bracket | # Families | Median Income |
| 2-Person Families | 149,523 (47.3%) | $90,513 |
| 3-Person Families | 70,297 (22.3%) | $112,524 |
| 4-Person Families | 61,366 (19.4%) | $132,276 |
| 5-Person Families | 23,644 (7.5%) | $131,202 |
| 6-Person Families | 7,736 (2.5%) | $144,369 |
| 7+ Person Families | 3,194 (1.0%) | $152,786 |
| Total | 315,760 (100.0%) | $105,230 |
Family Income by Number of Earners in Area Code 636
The median family income in Area Code 636 is $105,230, with families comprising 3+ earners (39,785) having the highest median family income of $161,744, while families with no earners (42,775) have the lowest median family income of $62,896, accounting for 12.6% and 13.6% of families, respectively.
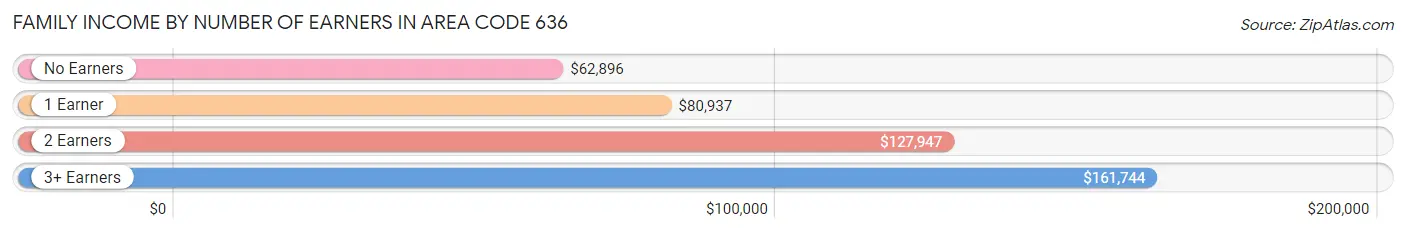
| Number of Earners | # Families | Median Income |
| No Earners | 42,775 (13.6%) | $62,896 |
| 1 Earner | 87,821 (27.8%) | $80,937 |
| 2 Earners | 145,379 (46.0%) | $127,947 |
| 3+ Earners | 39,785 (12.6%) | $161,744 |
| Total | 315,760 (100.0%) | $105,230 |
Household Income in Area Code 636
Household Income Brackets in Area Code 636
With 6,294,440 households falling in the category, the $100,000 to $149,999 income range is the most frequent in Area Code 636, accounting for 1,382.5% of all households. In contrast, only 718,909 households (157.9%) fall into the $10,000 to $14,999 income bracket, making it the least populous group.
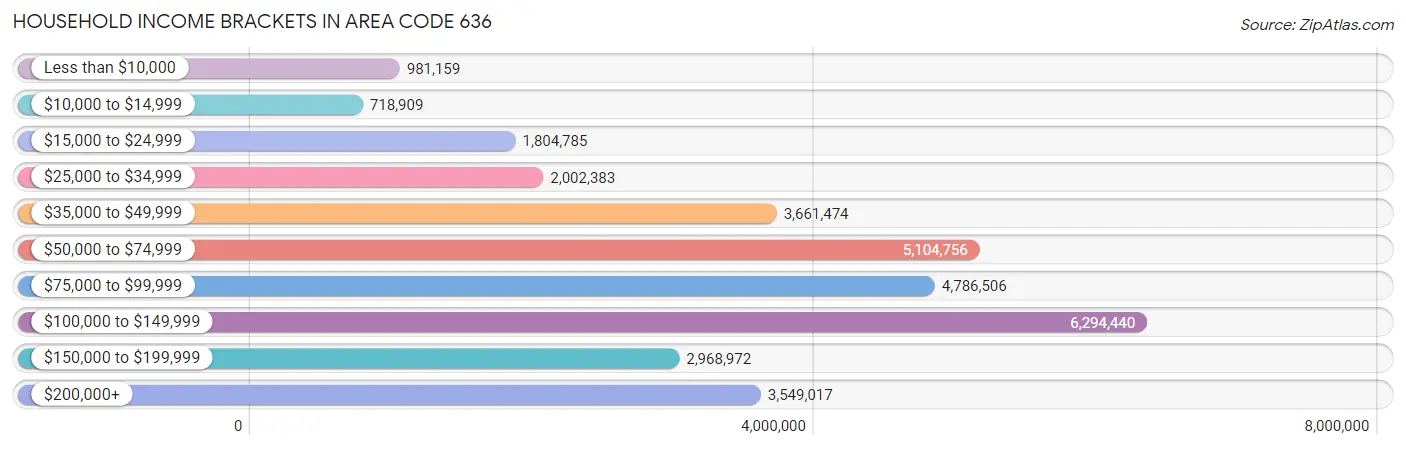
| Income Bracket | # Households | % Households |
| Less than $10,000 | 981,159 | 215.5% |
| $10,000 to $14,999 | 718,909 | 157.9% |
| $15,000 to $24,999 | 1,804,785 | 396.4% |
| $25,000 to $34,999 | 2,002,383 | 439.8% |
| $35,000 to $49,999 | 3,661,474 | 804.2% |
| $50,000 to $74,999 | 5,104,756 | 1,121.2% |
| $75,000 to $99,999 | 4,786,506 | 1,051.3% |
| $100,000 to $149,999 | 6,294,440 | 1,382.5% |
| $150,000 to $199,999 | 2,968,972 | 652.1% |
| $200,000+ | 3,549,017 | 779.5% |
Household Income by Householder Age in Area Code 636
The median household income in Area Code 636 is $88,957, with the highest median household income of $108,911 found in the 45 to 64 years age bracket for the primary householder. A total of 172,897 households (38.0%) fall into this category. Meanwhile, the 15 to 24 years age bracket for the primary householder has the lowest median household income of $53,056, with 12,875 households (2.8%) in this group.
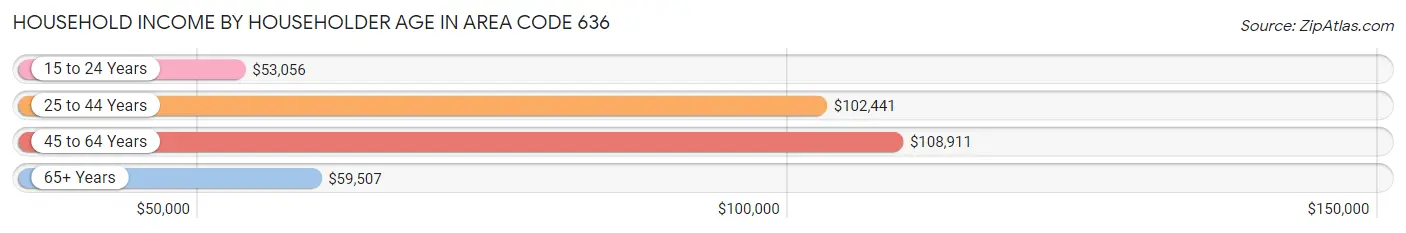
| Income Bracket | # Households | Median Income |
| 15 to 24 Years | 12,875 (2.8%) | $53,056 |
| 25 to 44 Years | 144,499 (31.7%) | $102,441 |
| 45 to 64 Years | 172,897 (38.0%) | $108,911 |
| 65+ Years | 125,023 (27.5%) | $59,507 |
| Total | 455,294 (100.0%) | $88,957 |
Poverty in Area Code 636
Income Below Poverty by Sex and Age in Area Code 636
With 5.5% poverty level for males and 6.9% for females among the residents of Area Code 636, 12 to 14 year old males and 15 year old females are the most vulnerable to poverty, with 2,041 males (8.9%) and 854 females (10.3%) in their respective age groups living below the poverty level.
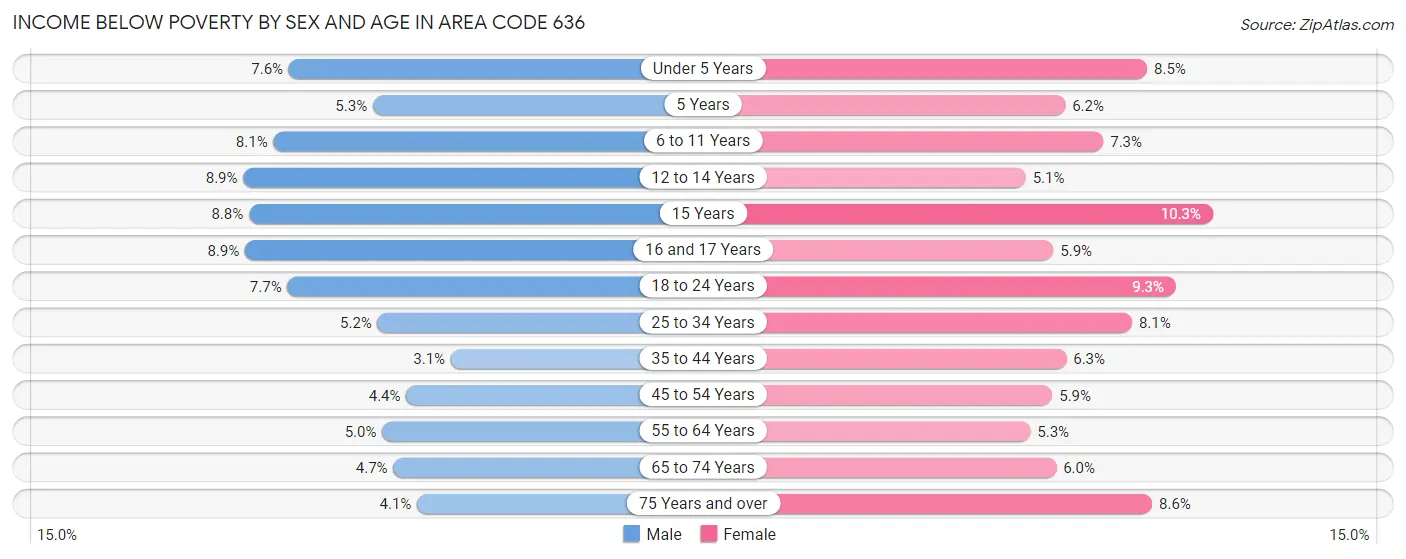
| Age Bracket | Male | Female |
| Under 5 Years | 2,483 (7.6%) | 2,699 (8.5%) |
| 5 Years | 400 (5.3%) | 443 (6.2%) |
| 6 to 11 Years | 3,586 (8.1%) | 3,120 (7.3%) |
| 12 to 14 Years | 2,041 (8.9%) | 1,089 (5.1%) |
| 15 Years | 755 (8.7%) | 854 (10.3%) |
| 16 and 17 Years | 1,453 (8.9%) | 888 (5.9%) |
| 18 to 24 Years | 3,454 (7.7%) | 3,885 (9.3%) |
| 25 to 34 Years | 3,656 (5.2%) | 5,760 (8.1%) |
| 35 to 44 Years | 2,445 (3.1%) | 4,754 (6.2%) |
| 45 to 54 Years | 3,223 (4.4%) | 4,349 (5.9%) |
| 55 to 64 Years | 4,046 (5.0%) | 4,311 (5.2%) |
| 65 to 74 Years | 2,629 (4.7%) | 3,733 (6.0%) |
| 75 Years and over | 1,326 (4.1%) | 3,927 (8.6%) |
| Total | 31,497 (5.5%) | 39,812 (6.9%) |
Income Above Poverty by Sex and Age in Area Code 636
According to the poverty statistics in Area Code 636, males aged 35 to 44 years and females aged 12 to 14 years are the age groups that are most secure financially, with 96.9% of males and 94.9% of females in these age groups living above the poverty line.
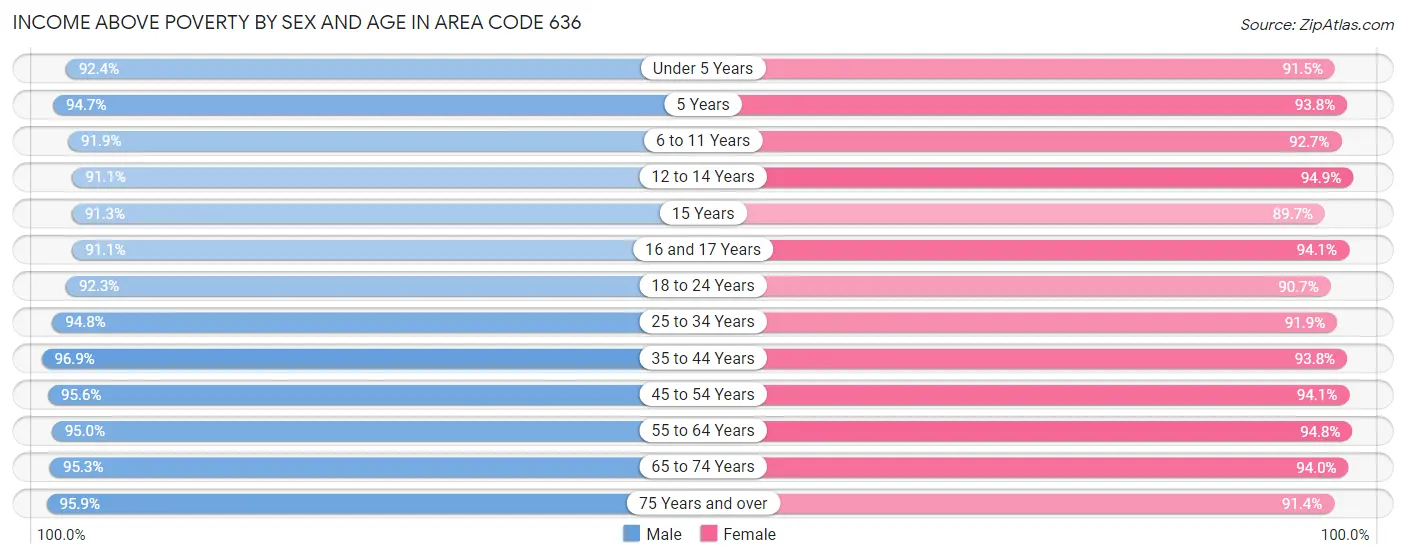
| Age Bracket | Male | Female |
| Under 5 Years | 30,023 (92.4%) | 29,069 (91.5%) |
| 5 Years | 7,142 (94.7%) | 6,682 (93.8%) |
| 6 to 11 Years | 40,845 (91.9%) | 39,737 (92.7%) |
| 12 to 14 Years | 20,855 (91.1%) | 20,181 (94.9%) |
| 15 Years | 7,872 (91.2%) | 7,415 (89.7%) |
| 16 and 17 Years | 14,945 (91.1%) | 14,201 (94.1%) |
| 18 to 24 Years | 41,541 (92.3%) | 37,870 (90.7%) |
| 25 to 34 Years | 67,007 (94.8%) | 65,540 (91.9%) |
| 35 to 44 Years | 75,635 (96.9%) | 71,364 (93.8%) |
| 45 to 54 Years | 70,523 (95.6%) | 69,908 (94.1%) |
| 55 to 64 Years | 76,229 (95.0%) | 77,805 (94.8%) |
| 65 to 74 Years | 52,961 (95.3%) | 58,828 (94.0%) |
| 75 Years and over | 31,277 (95.9%) | 41,544 (91.4%) |
| Total | 536,855 (94.5%) | 540,144 (93.1%) |
Income Below Poverty Among Married-Couple Families in Area Code 636
The poverty statistics for married-couple families in Area Code 636 show that 2.1% or 5,423 of the total 254,822 families live below the poverty line. Families with 5 or more children have the highest poverty rate of 5.6%, comprising of 69 families. On the other hand, families with 1 or 2 children have the lowest poverty rate of 1.8%, which includes 1,527 families.
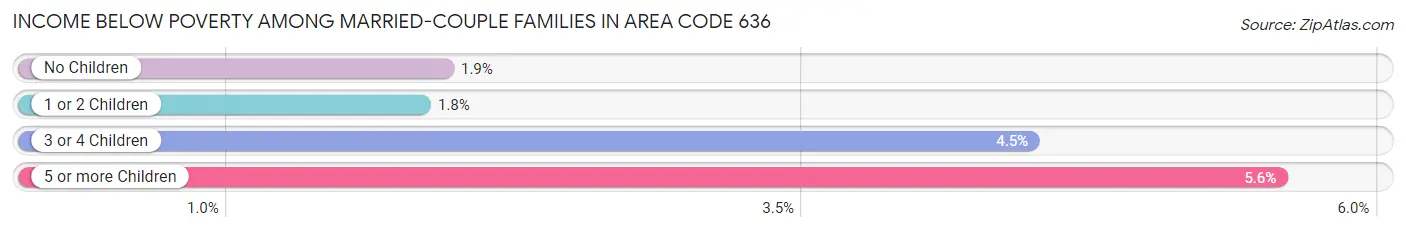
| Children | Above Poverty | Below Poverty |
| No Children | 147,140 (98.1%) | 2,913 (1.9%) |
| 1 or 2 Children | 81,663 (98.2%) | 1,527 (1.8%) |
| 3 or 4 Children | 19,427 (95.5%) | 914 (4.5%) |
| 5 or more Children | 1,169 (94.4%) | 69 (5.6%) |
| Total | 249,399 (97.9%) | 5,423 (2.1%) |
Income Below Poverty Among Single-Parent Households in Area Code 636
According to the poverty data in Area Code 636, 6.3% or 1,252 single-father households and 14.5% or 5,918 single-mother households are living below the poverty line. Among single-father households, those with 5 or more children have the highest poverty rate, with 11 households (57.9%) experiencing poverty. Likewise, among single-mother households, those with 5 or more children have the highest poverty rate, with 235 households (64.9%) falling below the poverty line.
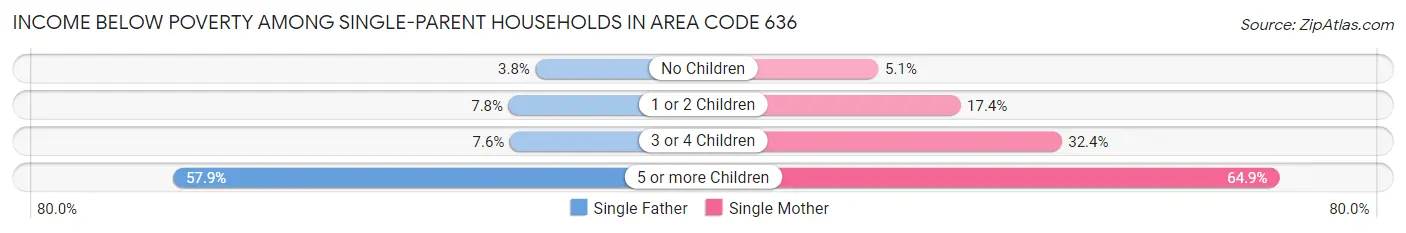
| Children | Single Father | Single Mother |
| No Children | 310 (3.8%) | 808 (5.1%) |
| 1 or 2 Children | 838 (7.8%) | 3,673 (17.3%) |
| 3 or 4 Children | 93 (7.6%) | 1,202 (32.4%) |
| 5 or more Children | 11 (57.9%) | 235 (64.9%) |
| Total | 1,252 (6.3%) | 5,918 (14.5%) |
Income Below Poverty Among Married-Couple vs Single-Parent Households in Area Code 636
The poverty data for Area Code 636 shows that 5,423 of the married-couple family households (2.1%) and 7,170 of the single-parent households (11.8%) are living below the poverty level. Within the married-couple family households, those with 5 or more children have the highest poverty rate, with 69 households (5.6%) falling below the poverty line. Among the single-parent households, those with 5 or more children have the highest poverty rate, with 246 household (64.6%) living below poverty.
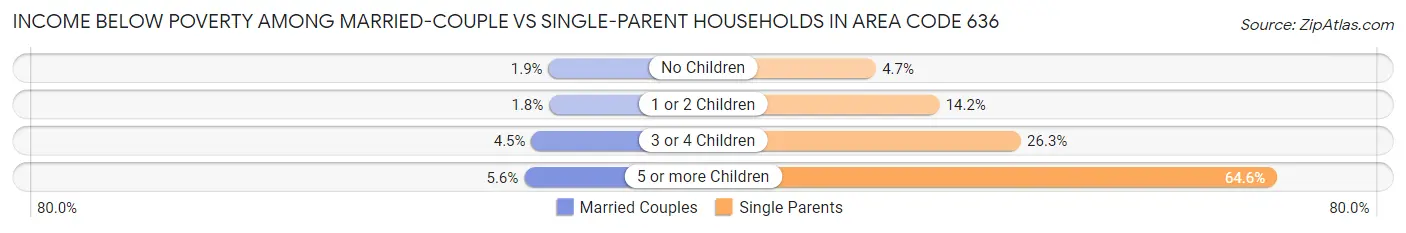
| Children | Married-Couple Families | Single-Parent Households |
| No Children | 2,913 (1.9%) | 1,118 (4.7%) |
| 1 or 2 Children | 1,527 (1.8%) | 4,511 (14.2%) |
| 3 or 4 Children | 914 (4.5%) | 1,295 (26.3%) |
| 5 or more Children | 69 (5.6%) | 246 (64.6%) |
| Total | 5,423 (2.1%) | 7,170 (11.8%) |
Race in Area Code 636
The most populous races in Area Code 636 are White / Caucasian (980,408 | 84.0%), Two or more Races (63,995 | 5.5%), and Black / African American (63,529 | 5.4%).
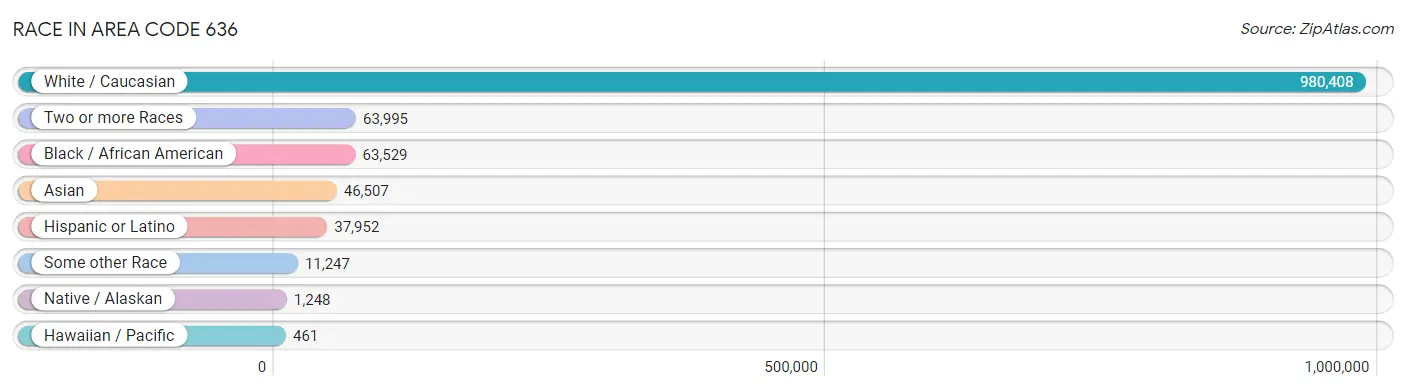
| Race | # Population | % Population |
| Asian | 46,507 | 4.0% |
| Black / African American | 63,529 | 5.4% |
| Hawaiian / Pacific | 461 | 0.0% |
| Hispanic or Latino | 37,952 | 3.3% |
| Native / Alaskan | 1,248 | 0.1% |
| White / Caucasian | 980,408 | 84.0% |
| Two or more Races | 63,995 | 5.5% |
| Some other Race | 11,247 | 1.0% |
| Total | 1,167,395 | 100.0% |
Ancestry in Area Code 636
The most populous ancestries reported in Area Code 636 are German (345,737 | 29.6%), Irish (173,929 | 14.9%), English (123,875 | 10.6%), American (67,822 | 5.8%), and Italian (60,633 | 5.2%), together accounting for 66.1% of all Area Code 636 residents.
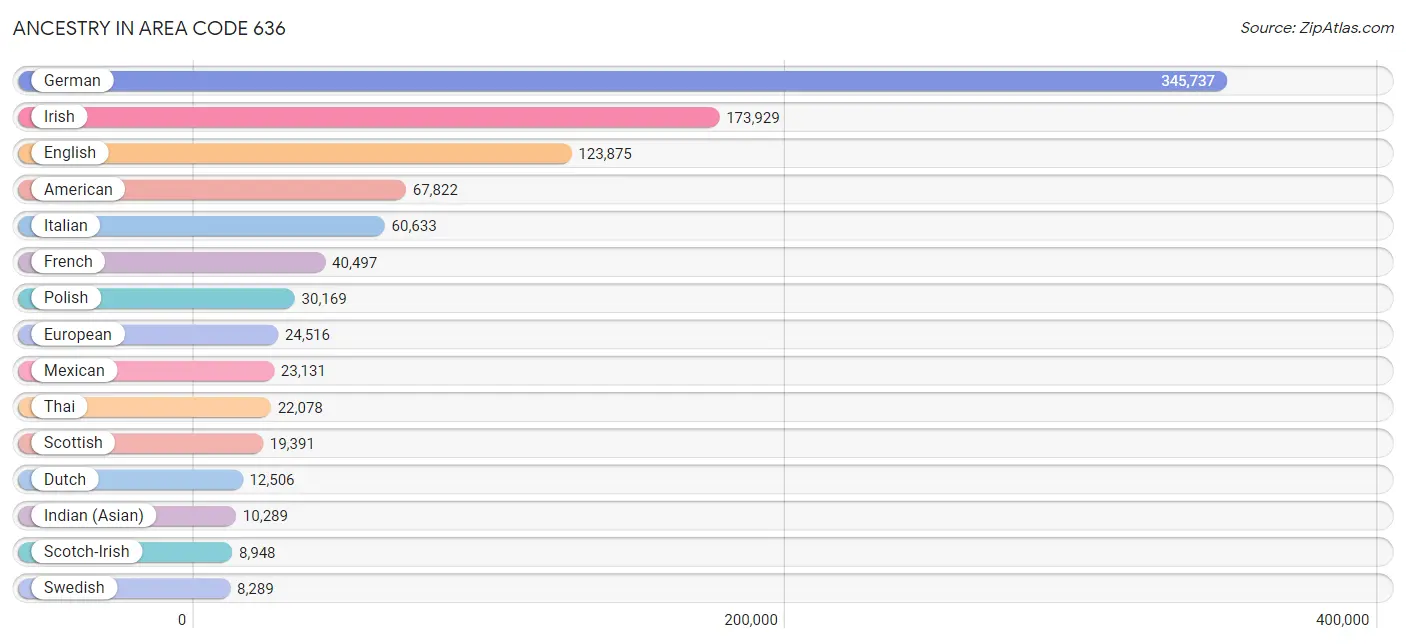
| Ancestry | # Population | % Population |
| Afghan | 229 | 0.0% |
| African | 2,277 | 0.2% |
| Alaskan Athabascan | 13 | 0.0% |
| Albanian | 348 | 0.0% |
| Aleut | 5 | 0.0% |
| Alsatian | 29 | 0.0% |
| American | 67,822 | 5.8% |
| Apache | 125 | 0.0% |
| Arab | 4,916 | 0.4% |
| Arapaho | 5 | 0.0% |
| Argentinean | 323 | 0.0% |
| Armenian | 681 | 0.1% |
| Assyrian / Chaldean / Syriac | 5 | 0.0% |
| Australian | 389 | 0.0% |
| Austrian | 2,997 | 0.3% |
| Bangladeshi | 68 | 0.0% |
| Basque | 101 | 0.0% |
| Belgian | 959 | 0.1% |
| Belizean | 28 | 0.0% |
| Bhutanese | 2,041 | 0.2% |
| Blackfeet | 379 | 0.0% |
| Bolivian | 57 | 0.0% |
| Brazilian | 706 | 0.1% |
| British | 6,253 | 0.5% |
| British West Indian | 184 | 0.0% |
| Bulgarian | 827 | 0.1% |
| Burmese | 4,423 | 0.4% |
| Cajun | 100 | 0.0% |
| Cambodian | 62 | 0.0% |
| Canadian | 1,248 | 0.1% |
| Carpatho Rusyn | 12 | 0.0% |
| Celtic | 51 | 0.0% |
| Central American | 3,330 | 0.3% |
| Central American Indian | 177 | 0.0% |
| Cherokee | 3,726 | 0.3% |
| Cheyenne | 40 | 0.0% |
| Chickasaw | 163 | 0.0% |
| Chilean | 97 | 0.0% |
| Chippewa | 13 | 0.0% |
| Choctaw | 588 | 0.1% |
| Colombian | 1,126 | 0.1% |
| Comanche | 20 | 0.0% |
| Costa Rican | 429 | 0.0% |
| Cree | 7 | 0.0% |
| Creek | 81 | 0.0% |
| Croatian | 2,637 | 0.2% |
| Crow | 24 | 0.0% |
| Cuban | 1,122 | 0.1% |
| Czech | 5,494 | 0.5% |
| Czechoslovakian | 1,053 | 0.1% |
| Danish | 2,618 | 0.2% |
| Delaware | 15 | 0.0% |
| Dominican | 524 | 0.0% |
| Dutch | 12,506 | 1.1% |
| Eastern European | 3,480 | 0.3% |
| Ecuadorian | 147 | 0.0% |
| Egyptian | 589 | 0.1% |
| English | 123,875 | 10.6% |
| Estonian | 14 | 0.0% |
| Ethiopian | 485 | 0.0% |
| European | 24,516 | 2.1% |
| Filipino | 1,210 | 0.1% |
| Finnish | 741 | 0.1% |
| French | 40,497 | 3.5% |
| French American Indian | 46 | 0.0% |
| French Canadian | 2,529 | 0.2% |
| German | 345,737 | 29.6% |
| German Russian | 70 | 0.0% |
| Ghanaian | 53 | 0.0% |
| Greek | 3,523 | 0.3% |
| Guamanian / Chamorro | 10 | 0.0% |
| Guatemalan | 1,440 | 0.1% |
| Haitian | 309 | 0.0% |
| Hmong | 10 | 0.0% |
| Honduran | 459 | 0.0% |
| Hungarian | 4,978 | 0.4% |
| Icelander | 36 | 0.0% |
| Indian (Asian) | 10,289 | 0.9% |
| Indonesian | 135 | 0.0% |
| Inupiat | 32 | 0.0% |
| Iranian | 963 | 0.1% |
| Iraqi | 259 | 0.0% |
| Irish | 173,929 | 14.9% |
| Iroquois | 80 | 0.0% |
| Israeli | 356 | 0.0% |
| Italian | 60,633 | 5.2% |
| Jamaican | 434 | 0.0% |
| Japanese | 167 | 0.0% |
| Jordanian | 220 | 0.0% |
| Kenyan | 707 | 0.1% |
| Korean | 5,545 | 0.5% |
| Laotian | 249 | 0.0% |
| Latvian | 209 | 0.0% |
| Lebanese | 1,316 | 0.1% |
| Liberian | 8 | 0.0% |
| Lithuanian | 1,720 | 0.2% |
| Lumbee | 25 | 0.0% |
| Luxembourger | 170 | 0.0% |
| Macedonian | 108 | 0.0% |
| Malaysian | 295 | 0.0% |
| Maltese | 150 | 0.0% |
| Mexican | 23,131 | 2.0% |
| Mexican American Indian | 471 | 0.0% |
| Mongolian | 149 | 0.0% |
| Moroccan | 243 | 0.0% |
| Native Hawaiian | 421 | 0.0% |
| Navajo | 70 | 0.0% |
| New Zealander | 82 | 0.0% |
| Nicaraguan | 477 | 0.0% |
| Nigerian | 922 | 0.1% |
| Northern European | 2,140 | 0.2% |
| Norwegian | 7,472 | 0.6% |
| Okinawan | 8 | 0.0% |
| Osage | 78 | 0.0% |
| Ottawa | 14 | 0.0% |
| Pakistani | 886 | 0.1% |
| Palestinian | 659 | 0.1% |
| Panamanian | 303 | 0.0% |
| Paraguayan | 37 | 0.0% |
| Pennsylvania German | 197 | 0.0% |
| Peruvian | 849 | 0.1% |
| Polish | 30,169 | 2.6% |
| Portuguese | 899 | 0.1% |
| Potawatomi | 98 | 0.0% |
| Pueblo | 36 | 0.0% |
| Puerto Rican | 3,147 | 0.3% |
| Romanian | 1,170 | 0.1% |
| Russian | 7,591 | 0.6% |
| Salvadoran | 222 | 0.0% |
| Samoan | 326 | 0.0% |
| Scandinavian | 3,600 | 0.3% |
| Scotch-Irish | 8,948 | 0.8% |
| Scottish | 19,391 | 1.7% |
| Seminole | 2 | 0.0% |
| Senegalese | 60 | 0.0% |
| Serbian | 789 | 0.1% |
| Shoshone | 3 | 0.0% |
| Sierra Leonean | 24 | 0.0% |
| Sioux | 228 | 0.0% |
| Slavic | 368 | 0.0% |
| Slovak | 1,098 | 0.1% |
| Slovene | 444 | 0.0% |
| Somali | 53 | 0.0% |
| South African | 104 | 0.0% |
| South American | 3,087 | 0.3% |
| South American Indian | 99 | 0.0% |
| Spaniard | 1,172 | 0.1% |
| Spanish | 1,360 | 0.1% |
| Sri Lankan | 3,739 | 0.3% |
| Subsaharan African | 5,100 | 0.4% |
| Sudanese | 45 | 0.0% |
| Swedish | 8,289 | 0.7% |
| Swiss | 3,678 | 0.3% |
| Syrian | 436 | 0.0% |
| Taiwanese | 10 | 0.0% |
| Thai | 22,078 | 1.9% |
| Tlingit-Haida | 5 | 0.0% |
| Tohono O'Odham | 32 | 0.0% |
| Tongan | 15 | 0.0% |
| Trinidadian and Tobagonian | 118 | 0.0% |
| Turkish | 546 | 0.1% |
| Ugandan | 85 | 0.0% |
| Ukrainian | 2,448 | 0.2% |
| Ute | 104 | 0.0% |
| Venezuelan | 434 | 0.0% |
| Vietnamese | 338 | 0.0% |
| Welsh | 5,644 | 0.5% |
| West Indian | 98 | 0.0% |
| Yugoslavian | 2,004 | 0.2% | View All 169 Rows |
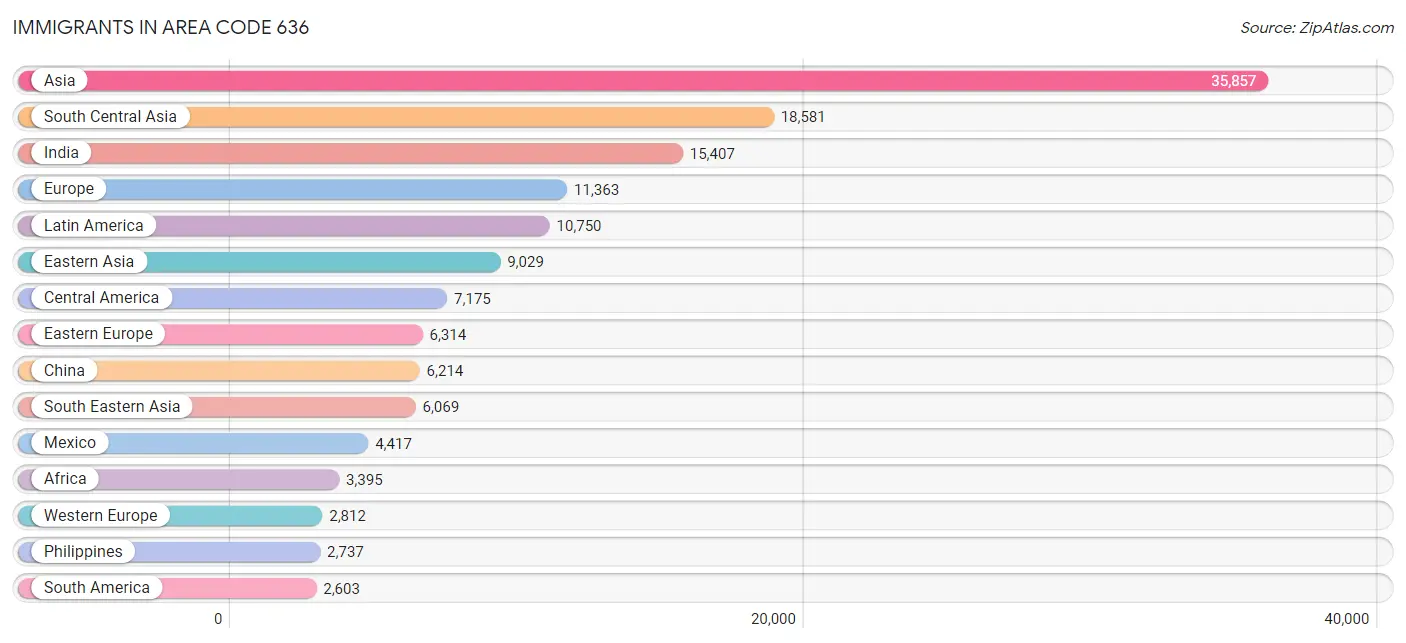
Immigrants in Area Code 636
The most numerous immigrant groups reported in Area Code 636 came from Asia (35,857 | 3.1%), South Central Asia (18,581 | 1.6%), India (15,407 | 1.3%), Europe (11,363 | 1.0%), and Latin America (10,750 | 0.9%), together accounting for 7.9% of all Area Code 636 residents.
| Immigration Origin | # Population | % Population |
| Afghanistan | 256 | 0.0% |
| Africa | 3,395 | 0.3% |
| Albania | 215 | 0.0% |
| Argentina | 178 | 0.0% |
| Armenia | 26 | 0.0% |
| Asia | 35,857 | 3.1% |
| Australia | 327 | 0.0% |
| Austria | 117 | 0.0% |
| Bahamas | 15 | 0.0% |
| Bangladesh | 269 | 0.0% |
| Belarus | 637 | 0.1% |
| Belgium | 81 | 0.0% |
| Belize | 41 | 0.0% |
| Bolivia | 59 | 0.0% |
| Bosnia and Herzegovina | 1,115 | 0.1% |
| Brazil | 656 | 0.1% |
| Bulgaria | 544 | 0.1% |
| Cambodia | 38 | 0.0% |
| Cameroon | 4 | 0.0% |
| Canada | 1,316 | 0.1% |
| Caribbean | 972 | 0.1% |
| Central America | 7,175 | 0.6% |
| Chile | 108 | 0.0% |
| China | 6,214 | 0.5% |
| Colombia | 607 | 0.1% |
| Congo | 96 | 0.0% |
| Costa Rica | 207 | 0.0% |
| Croatia | 306 | 0.0% |
| Cuba | 218 | 0.0% |
| Czechoslovakia | 86 | 0.0% |
| Denmark | 35 | 0.0% |
| Dominican Republic | 150 | 0.0% |
| Eastern Africa | 1,420 | 0.1% |
| Eastern Asia | 9,029 | 0.8% |
| Eastern Europe | 6,314 | 0.5% |
| Ecuador | 277 | 0.0% |
| Egypt | 130 | 0.0% |
| El Salvador | 44 | 0.0% |
| England | 656 | 0.1% |
| Ethiopia | 483 | 0.0% |
| Europe | 11,363 | 1.0% |
| Fiji | 15 | 0.0% |
| France | 400 | 0.0% |
| Germany | 2,047 | 0.2% |
| Ghana | 69 | 0.0% |
| Greece | 179 | 0.0% |
| Guatemala | 1,030 | 0.1% |
| Haiti | 166 | 0.0% |
| Honduras | 1,054 | 0.1% |
| Hong Kong | 377 | 0.0% |
| Hungary | 83 | 0.0% |
| India | 15,407 | 1.3% |
| Indonesia | 255 | 0.0% |
| Iran | 523 | 0.0% |
| Iraq | 264 | 0.0% |
| Ireland | 75 | 0.0% |
| Israel | 187 | 0.0% |
| Italy | 306 | 0.0% |
| Jamaica | 150 | 0.0% |
| Japan | 326 | 0.0% |
| Jordan | 156 | 0.0% |
| Kazakhstan | 26 | 0.0% |
| Kenya | 603 | 0.1% |
| Korea | 2,436 | 0.2% |
| Kuwait | 64 | 0.0% |
| Laos | 111 | 0.0% |
| Latin America | 10,750 | 0.9% |
| Latvia | 11 | 0.0% |
| Lebanon | 88 | 0.0% |
| Lithuania | 31 | 0.0% |
| Malaysia | 214 | 0.0% |
| Mexico | 4,417 | 0.4% |
| Middle Africa | 203 | 0.0% |
| Moldova | 31 | 0.0% |
| Morocco | 255 | 0.0% |
| Nepal | 312 | 0.0% |
| Netherlands | 55 | 0.0% |
| Nicaragua | 134 | 0.0% |
| Nigeria | 670 | 0.1% |
| Northern Africa | 527 | 0.1% |
| Northern Europe | 1,590 | 0.1% |
| Norway | 23 | 0.0% |
| Oceania | 482 | 0.0% |
| Pakistan | 1,583 | 0.1% |
| Panama | 248 | 0.0% |
| Peru | 444 | 0.0% |
| Philippines | 2,737 | 0.2% |
| Poland | 331 | 0.0% |
| Romania | 253 | 0.0% |
| Russia | 1,363 | 0.1% |
| Saudi Arabia | 450 | 0.0% |
| Scotland | 108 | 0.0% |
| Senegal | 92 | 0.0% |
| Serbia | 97 | 0.0% |
| Singapore | 19 | 0.0% |
| Somalia | 68 | 0.0% |
| South Africa | 237 | 0.0% |
| South America | 2,603 | 0.2% |
| South Central Asia | 18,581 | 1.6% |
| South Eastern Asia | 6,069 | 0.5% |
| Southern Europe | 615 | 0.1% |
| Spain | 112 | 0.0% |
| Sri Lanka | 44 | 0.0% |
| St. Vincent and the Grenadines | 10 | 0.0% |
| Sudan | 47 | 0.0% |
| Sweden | 111 | 0.0% |
| Switzerland | 112 | 0.0% |
| Syria | 294 | 0.0% |
| Taiwan | 691 | 0.1% |
| Thailand | 435 | 0.0% |
| Trinidad and Tobago | 143 | 0.0% |
| Turkey | 261 | 0.0% |
| Uganda | 100 | 0.0% |
| Ukraine | 762 | 0.1% |
| Uzbekistan | 80 | 0.0% |
| Venezuela | 274 | 0.0% |
| Vietnam | 2,098 | 0.2% |
| Western Africa | 930 | 0.1% |
| Western Asia | 1,940 | 0.2% |
| Western Europe | 2,812 | 0.2% |
| Zaire | 103 | 0.0% |
| Zimbabwe | 92 | 0.0% | View All 122 Rows |
Sex and Age in Area Code 636
Sex and Age in Area Code 636
The most populous age groups in Area Code 636 are 35 to 39 Years (41,613 | 7.2%) for men and 60 to 64 Years (41,599 | 7.1%) for women.
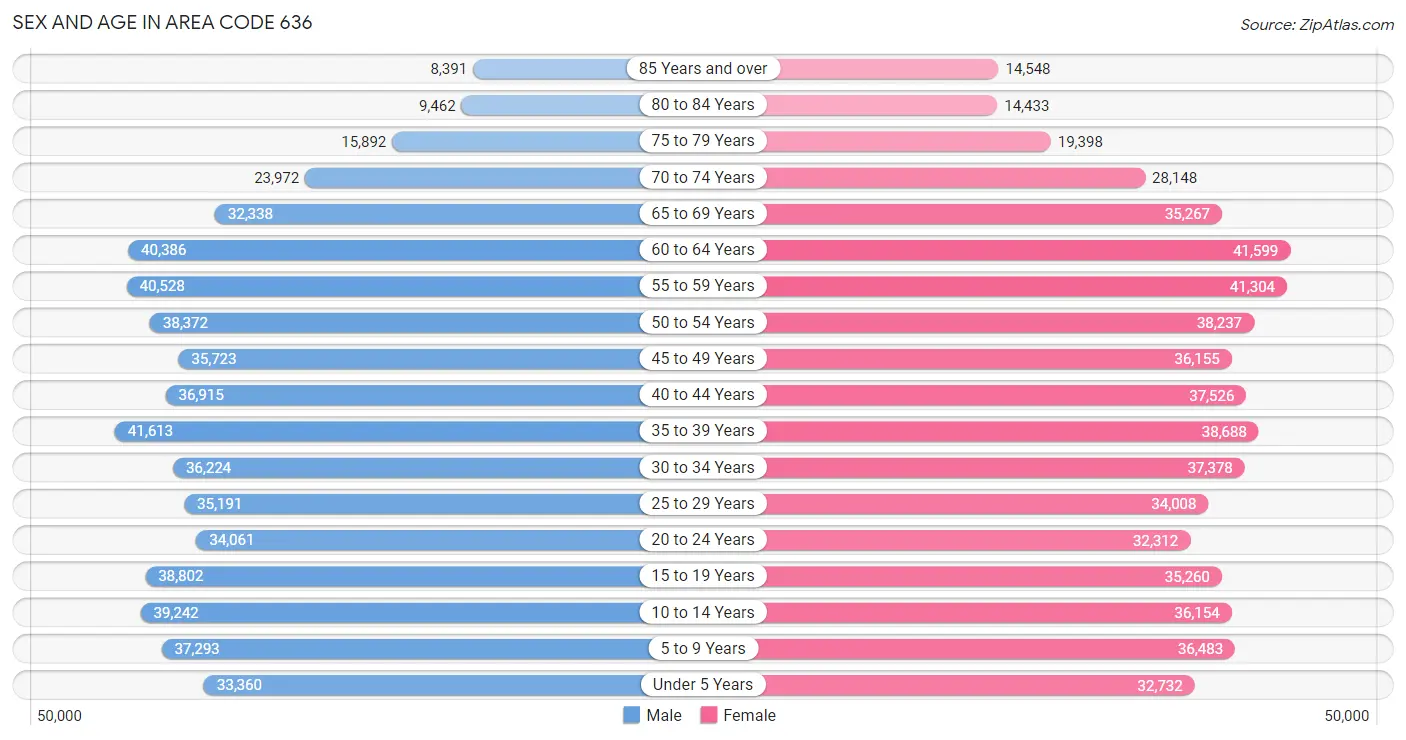
| Age Bracket | Male | Female |
| Under 5 Years | 33,360 (5.8%) | 32,732 (5.6%) |
| 5 to 9 Years | 37,293 (6.5%) | 36,483 (6.2%) |
| 10 to 14 Years | 39,242 (6.8%) | 36,154 (6.1%) |
| 15 to 19 Years | 38,802 (6.7%) | 35,260 (6.0%) |
| 20 to 24 Years | 34,061 (5.9%) | 32,312 (5.5%) |
| 25 to 29 Years | 35,191 (6.1%) | 34,008 (5.8%) |
| 30 to 34 Years | 36,224 (6.3%) | 37,378 (6.3%) |
| 35 to 39 Years | 41,613 (7.2%) | 38,688 (6.6%) |
| 40 to 44 Years | 36,915 (6.4%) | 37,526 (6.4%) |
| 45 to 49 Years | 35,723 (6.2%) | 36,155 (6.1%) |
| 50 to 54 Years | 38,372 (6.6%) | 38,237 (6.5%) |
| 55 to 59 Years | 40,528 (7.0%) | 41,304 (7.0%) |
| 60 to 64 Years | 40,386 (7.0%) | 41,599 (7.1%) |
| 65 to 69 Years | 32,338 (5.6%) | 35,267 (6.0%) |
| 70 to 74 Years | 23,972 (4.2%) | 28,148 (4.8%) |
| 75 to 79 Years | 15,892 (2.8%) | 19,398 (3.3%) |
| 80 to 84 Years | 9,462 (1.6%) | 14,433 (2.5%) |
| 85 Years and over | 8,391 (1.5%) | 14,548 (2.5%) |
| Total | 577,765 (100.0%) | 589,630 (100.0%) |
Families and Households in Area Code 636
Median Family Size in Area Code 636
The median family size in Area Code 636 is 3.04 persons per family, with married-couple families (254,822 | 80.7%) accounting for the largest median family size of 3.09557 persons per family. On the other hand, single male/father families (19,999 | 6.3%) represent the smallest median family size with 2.66 persons per family.
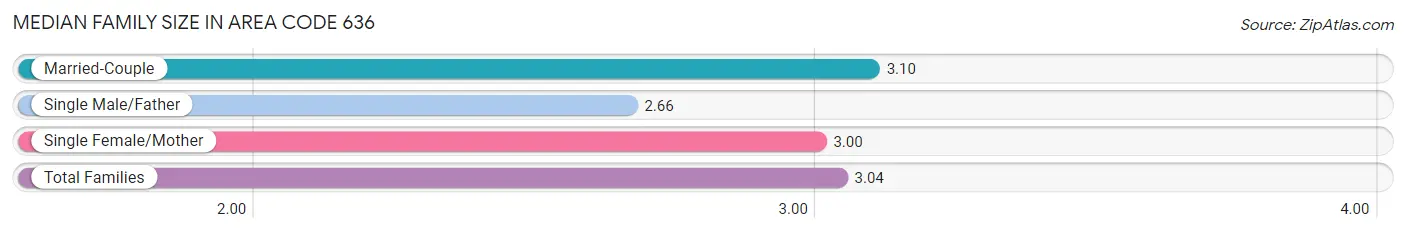
| Family Type | # Families | Family Size |
| Married-Couple | 254,822 (80.7%) | 3.10 |
| Single Male/Father | 19,999 (6.3%) | 2.66 |
| Single Female/Mother | 40,939 (13.0%) | 3.00 |
| Total Families | 315,760 (100.0%) | 3.04 |
Median Household Size in Area Code 636
The median household size in Area Code 636 is 2.59 persons per household, with single female/mother households (40,939 | 9.0%) accounting for the largest median household size of 3.31928 persons per household. non-family households (139,534 | 30.6%) represent the smallest median household size with 1.22 persons per household.
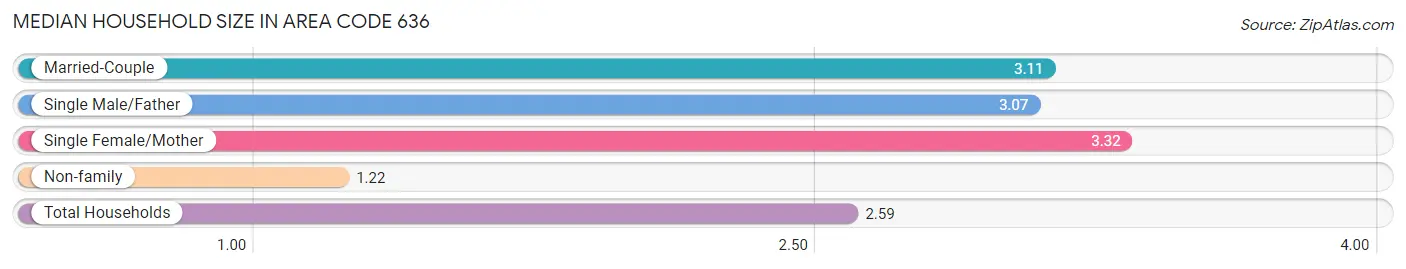
| Household Type | # Households | Household Size |
| Married-Couple | 254,822 (56.0%) | 3.11 |
| Single Male/Father | 19,999 (4.4%) | 3.07 |
| Single Female/Mother | 40,939 (9.0%) | 3.32 |
| Non-family | 139,534 (30.6%) | 1.22 |
| Total Households | 455,294 (100.0%) | 2.59 |
Household Size by Marriage Status in Area Code 636
Out of a total of 455,294 households in Area Code 636, 315,760 (69.4%) are family households, while 139,534 (30.6%) are nonfamily households. The most numerous type of family households are 2-person households, comprising 141,974, and the most common type of nonfamily households are 1-person households, comprising 114,000.
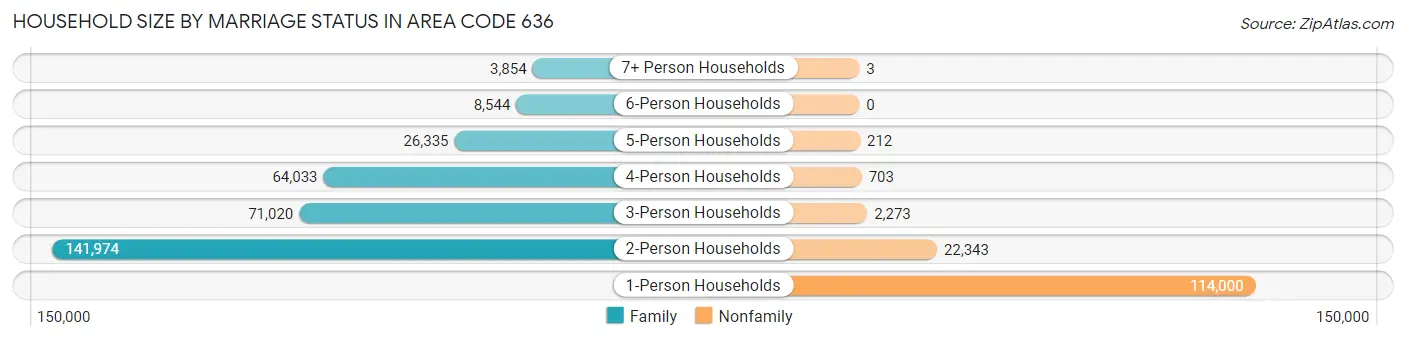
| Household Size | Family Households | Nonfamily Households |
| 1-Person Households | - | 114,000 (25.0%) |
| 2-Person Households | 141,974 (31.2%) | 22,343 (4.9%) |
| 3-Person Households | 71,020 (15.6%) | 2,273 (0.5%) |
| 4-Person Households | 64,033 (14.1%) | 703 (0.2%) |
| 5-Person Households | 26,335 (5.8%) | 212 (0.1%) |
| 6-Person Households | 8,544 (1.9%) | 0 (0.0%) |
| 7+ Person Households | 3,854 (0.9%) | 3 (0.0%) |
| Total | 315,760 (69.4%) | 139,534 (30.6%) |
Female Fertility in Area Code 636
Fertility by Age in Area Code 636
Average fertility rate in Area Code 636 is 53.0 births per 1,000 women. Women in the age bracket of 20 to 34 years have the highest fertility rate with 96.1 births per 1,000 women. Women in the age bracket of 20 to 34 years acount for 70.0% of all women with births.
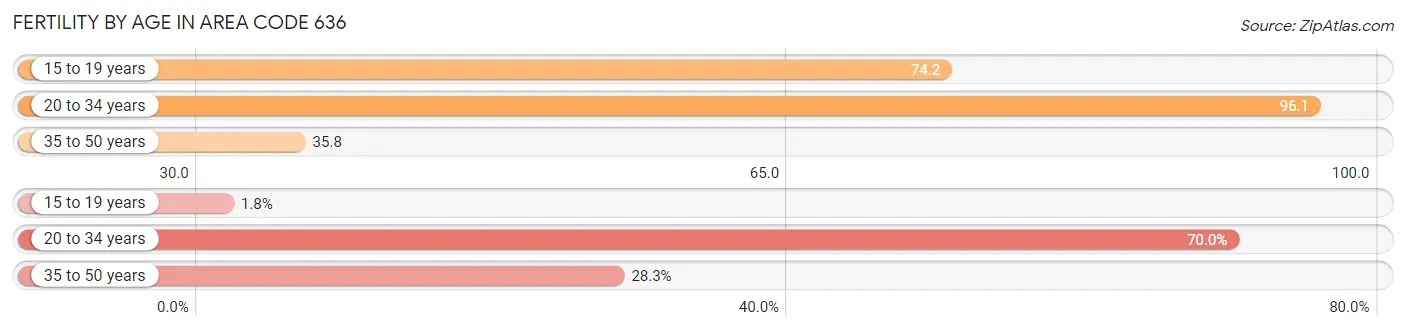
| Age Bracket | Women with Births | Births / 1,000 Women |
| 15 to 19 years | 227 (1.8%) | 74.2 |
| 20 to 34 years | 9,031 (70.0%) | 96.1 |
| 35 to 50 years | 3,647 (28.3%) | 35.8 |
| Total | 12,905 (100.0%) | 53.0 |
Fertility by Age by Marriage Status in Area Code 636
67.8% of women with births (12,905) in Area Code 636 are married. The highest percentage of unmarried women with births falls into 15 to 19 years age bracket with 100.0% of them unmarried at the time of birth, while the lowest percentage of unmarried women with births belong to 20 to 34 years age bracket with 35.7% of them unmarried.
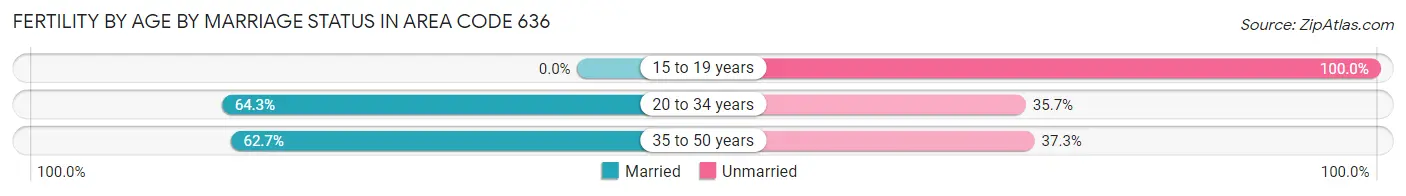
| Age Bracket | Married | Unmarried |
| 15 to 19 years | 0 (0.0%) | 227 (100.0%) |
| 20 to 34 years | 5,803 (64.3%) | 3,228 (35.7%) |
| 35 to 50 years | 2,286 (62.7%) | 1,361 (37.3%) |
| Total | 8,755 (67.8%) | 4,150 (32.2%) |
Fertility by Education in Area Code 636
Average fertility rate in Area Code 636 is 53.0 births per 1,000 women. Women with the education attainment of graduate degree have the highest fertility rate of 102.3 births per 1,000 women, while women with the education attainment of less than high school have the lowest fertility at 66.1 births per 1,000 women. Women with the education attainment of bachelor's degree represent 31.0% of all women with births.
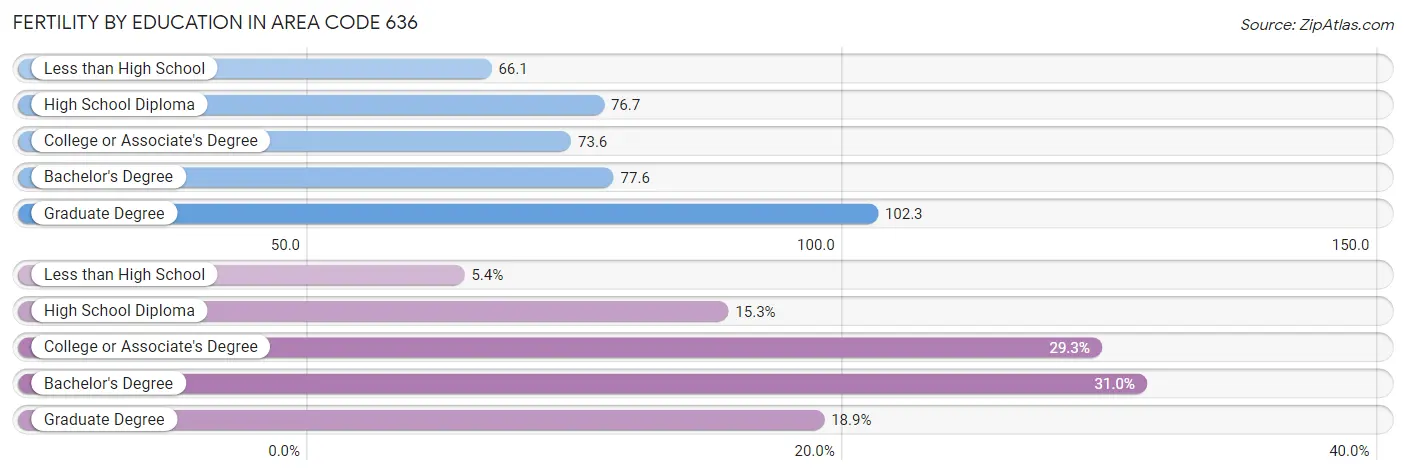
| Educational Attainment | Women with Births | Births / 1,000 Women |
| Less than High School | 702 (5.4%) | 66.1 |
| High School Diploma | 1,978 (15.3%) | 76.7 |
| College or Associate's Degree | 3,783 (29.3%) | 73.6 |
| Bachelor's Degree | 4,000 (31.0%) | 77.6 |
| Graduate Degree | 2,442 (18.9%) | 102.3 |
| Total | 12,905 (100.0%) | 53.0 |
Fertility by Education by Marriage Status in Area Code 636
32.2% of women with births in Area Code 636 are unmarried. Women with the educational attainment of bachelor's degree are most likely to be married with 82.7% of them married at childbirth, while women with the educational attainment of less than high school are least likely to be married with 80.5% of them unmarried at childbirth.
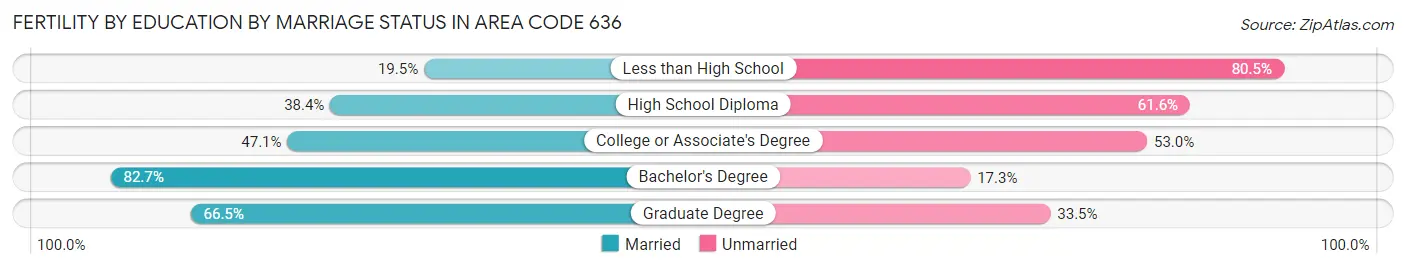
| Educational Attainment | Married | Unmarried |
| Less than High School | 137 (19.5%) | 565 (80.5%) |
| High School Diploma | 760 (38.4%) | 1,218 (61.6%) |
| College or Associate's Degree | 1,780 (47.0%) | 2,003 (52.9%) |
| Bachelor's Degree | 3,307 (82.7%) | 693 (17.3%) |
| Graduate Degree | 1,625 (66.5%) | 817 (33.5%) |
| Total | 8,755 (67.8%) | 4,150 (32.2%) |
Employment Characteristics in Area Code 636
Employment by Class of Employer in Area Code 636
Among the 592,271 employed individuals in Area Code 636, private company employees (428,699 | 72.4%), not-for-profit organizations (59,903 | 10.1%), and local government employees (35,213 | 5.9%) make up the most common classes of employment.
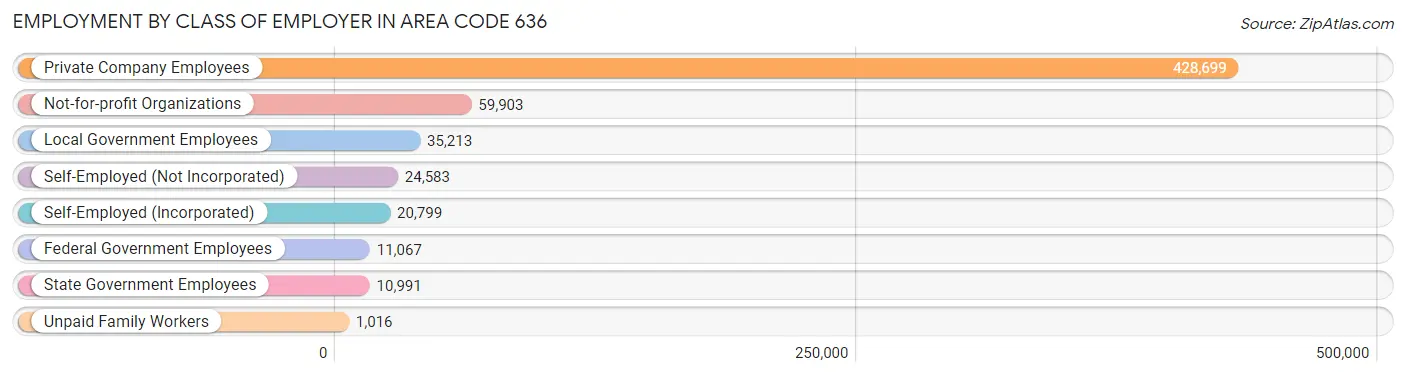
| Employer Class | # Employees | % Employees |
| Private Company Employees | 428,699 | 72.4% |
| Self-Employed (Incorporated) | 20,799 | 3.5% |
| Self-Employed (Not Incorporated) | 24,583 | 4.2% |
| Not-for-profit Organizations | 59,903 | 10.1% |
| Local Government Employees | 35,213 | 5.9% |
| State Government Employees | 10,991 | 1.9% |
| Federal Government Employees | 11,067 | 1.9% |
| Unpaid Family Workers | 1,016 | 0.2% |
| Total | 592,271 | 100.0% |
Employment Status by Age in Area Code 636
According to the labor force statistics for Area Code 636, out of the total population over 16 years of age (935,189), 64.2% or 600,017 individuals are in the labor force, with 4.2% or 25,441 of them unemployed. The age group with the highest labor force participation rate is 25 to 29 years, with 89.3% or 61,815 individuals in the labor force. Within the labor force, the 16 to 19 years age range has the highest percentage of unemployed individuals, with 966.8% or 263,086 of them being unemployed.
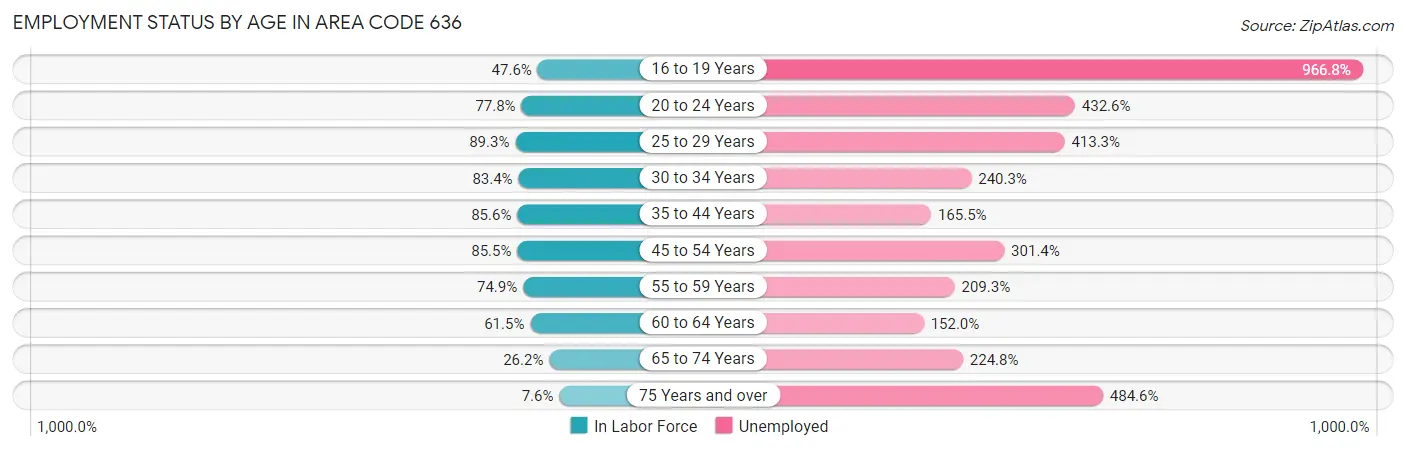
| Age Bracket | In Labor Force | Unemployed |
| 16 to 19 Years | 27,210 (47.6%) | 263,086 (966.8%) |
| 20 to 24 Years | 51,634 (77.8%) | 223,360 (432.6%) |
| 25 to 29 Years | 61,818 (89.3%) | 255,481 (413.3%) |
| 30 to 34 Years | 61,355 (83.4%) | 147,436 (240.3%) |
| 35 to 44 Years | 132,455 (85.6%) | 219,220 (165.5%) |
| 45 to 54 Years | 126,995 (85.5%) | 382,781 (301.4%) |
| 55 to 59 Years | 61,266 (74.9%) | 128,234 (209.3%) |
| 60 to 64 Years | 50,395 (61.5%) | 76,602 (152.0%) |
| 65 to 74 Years | 31,415 (26.2%) | 70,623 (224.8%) |
| 75 Years and over | 6,209 (7.6%) | 30,089 (484.6%) |
| Total | 600,004 (64.2%) | 25,451 (4.2%) |
Employment Status by Educational Attainment in Area Code 636
According to labor force statistics for Area Code 636, 80.7% of individuals (492,390) out of the total population between 25 and 64 years of age (609,847) are in the labor force, with 230.9% or 1,136,929 of them being unemployed. The group with the highest labor force participation rate are those with the educational attainment of bachelor's degree or higher, with 89.1% or 235,150 individuals in the labor force. Within the labor force, individuals with less than high school education have the highest percentage of unemployment, with 466.8% or 88,113 of them being unemployed.
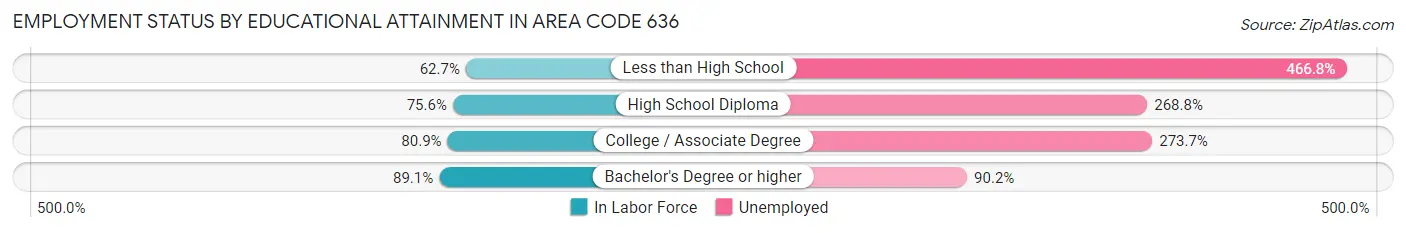
| Educational Attainment | In Labor Force | Unemployed |
| Less than High School | 18,877 (62.7%) | 140,535 (466.8%) |
| High School Diploma | 98,982 (75.6%) | 351,937 (268.8%) |
| College / Associate Degree | 149,613 (80.9%) | 506,383 (273.7%) |
| Bachelor's Degree or higher | 235,155 (89.1%) | 237,946 (90.2%) |
| Total | 492,417 (80.7%) | 1,408,137 (230.9%) |
Employment Occupations by Sex in Area Code 636
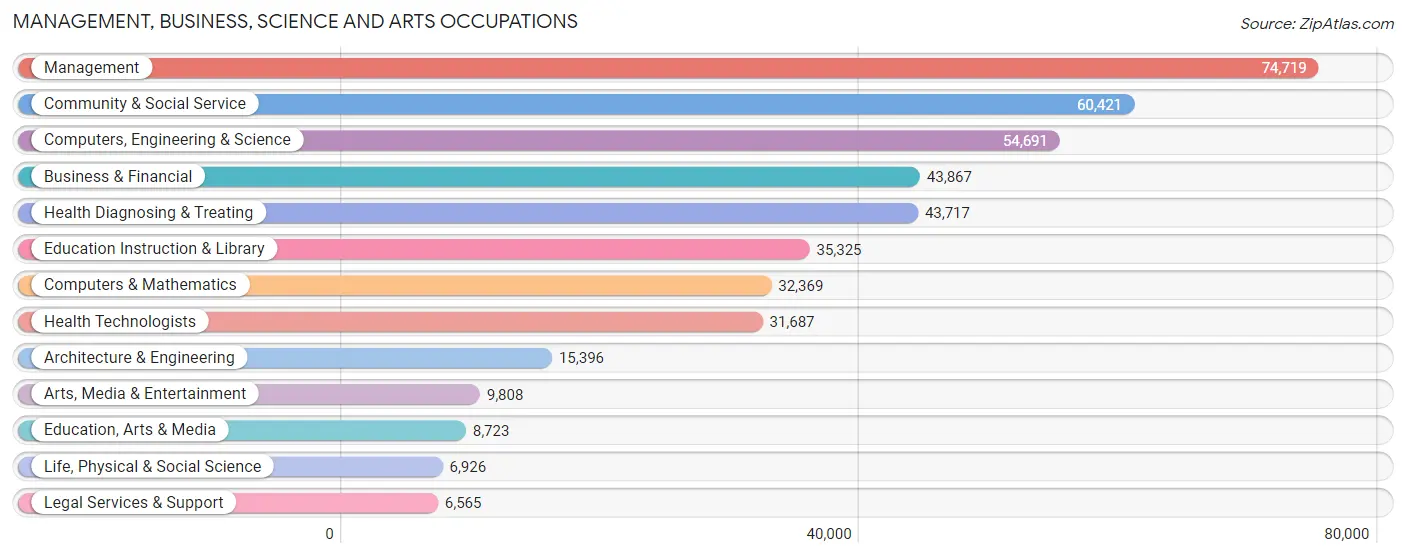
Management, Business, Science and Arts Occupations
The most common Management, Business, Science and Arts occupations in Area Code 636 are Management (74,719 | 12.4%), Community & Social Service (60,421 | 10.1%), Computers, Engineering & Science (54,691 | 9.1%), Business & Financial (43,867 | 7.3%), and Health Diagnosing & Treating (43,717 | 7.3%).
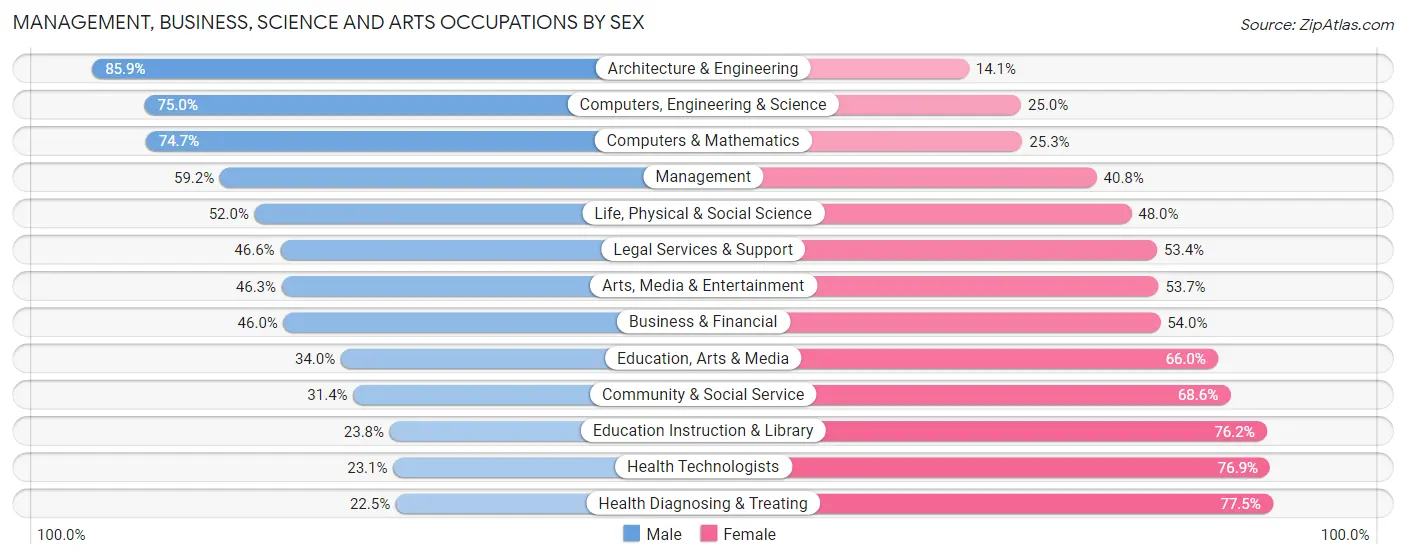
Management, Business, Science and Arts Occupations by Sex
Within the Management, Business, Science and Arts occupations in Area Code 636, the most male-oriented occupations are Architecture & Engineering (85.9%), Computers, Engineering & Science (75.0%), and Computers & Mathematics (74.7%), while the most female-oriented occupations are Health Diagnosing & Treating (77.5%), Health Technologists (76.9%), and Education Instruction & Library (76.2%).
| Occupation | Male | Female |
| Management | 44,255 (59.2%) | 30,464 (40.8%) |
| Business & Financial | 20,161 (46.0%) | 23,706 (54.0%) |
| Computers, Engineering & Science | 41,008 (75.0%) | 13,683 (25.0%) |
| Computers & Mathematics | 24,183 (74.7%) | 8,186 (25.3%) |
| Architecture & Engineering | 13,224 (85.9%) | 2,172 (14.1%) |
| Life, Physical & Social Science | 3,601 (52.0%) | 3,325 (48.0%) |
| Community & Social Service | 18,979 (31.4%) | 41,442 (68.6%) |
| Education, Arts & Media | 2,964 (34.0%) | 5,759 (66.0%) |
| Legal Services & Support | 3,062 (46.6%) | 3,503 (53.4%) |
| Education Instruction & Library | 8,409 (23.8%) | 26,916 (76.2%) |
| Arts, Media & Entertainment | 4,544 (46.3%) | 5,264 (53.7%) |
| Health Diagnosing & Treating | 9,850 (22.5%) | 33,867 (77.5%) |
| Health Technologists | 7,315 (23.1%) | 24,372 (76.9%) |
| Total (Category) | 134,253 (48.4%) | 143,162 (51.6%) |
| Total (Overall) | 318,638 (53.0%) | 282,108 (47.0%) |
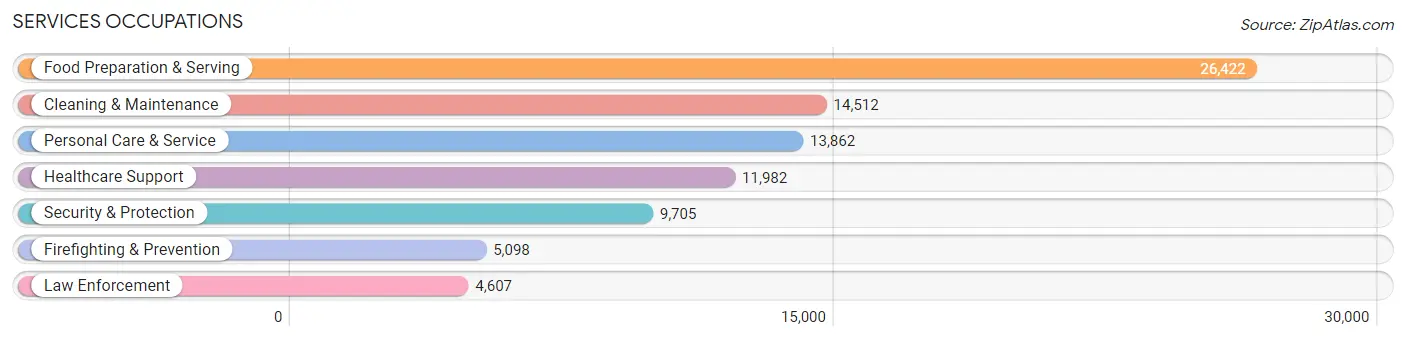
Services Occupations
The most common Services occupations in Area Code 636 are Food Preparation & Serving (26,422 | 4.4%), Cleaning & Maintenance (14,512 | 2.4%), Personal Care & Service (13,862 | 2.3%), Healthcare Support (11,982 | 2.0%), and Security & Protection (9,705 | 1.6%).
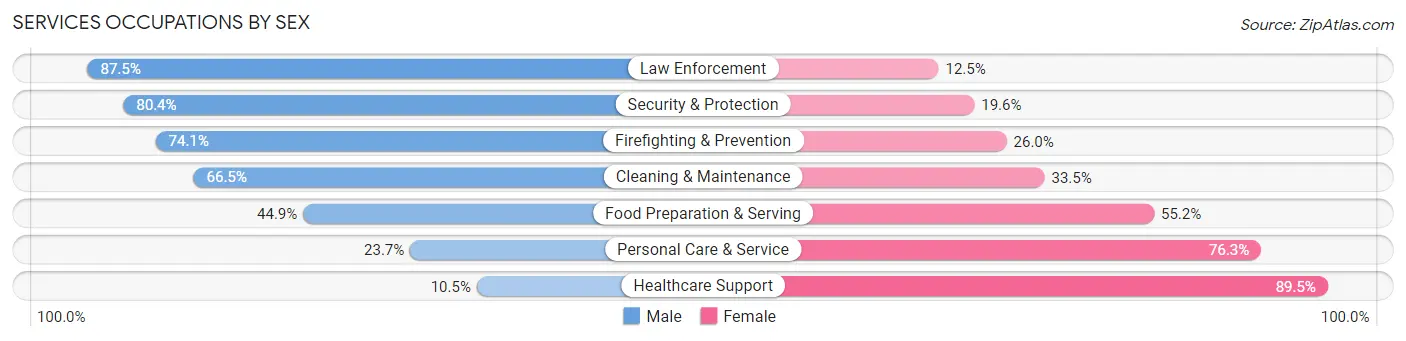
Services Occupations by Sex
Within the Services occupations in Area Code 636, the most male-oriented occupations are Law Enforcement (87.5%), Security & Protection (80.4%), and Firefighting & Prevention (74.1%), while the most female-oriented occupations are Healthcare Support (89.5%), Personal Care & Service (76.3%), and Food Preparation & Serving (55.1%).
| Occupation | Male | Female |
| Healthcare Support | 1,255 (10.5%) | 10,727 (89.5%) |
| Security & Protection | 7,807 (80.4%) | 1,898 (19.6%) |
| Firefighting & Prevention | 3,775 (74.1%) | 1,323 (26.0%) |
| Law Enforcement | 4,032 (87.5%) | 575 (12.5%) |
| Food Preparation & Serving | 11,850 (44.9%) | 14,572 (55.1%) |
| Cleaning & Maintenance | 9,655 (66.5%) | 4,857 (33.5%) |
| Personal Care & Service | 3,280 (23.7%) | 10,582 (76.3%) |
| Total (Category) | 33,847 (44.3%) | 42,636 (55.7%) |
| Total (Overall) | 318,638 (53.0%) | 282,108 (47.0%) |
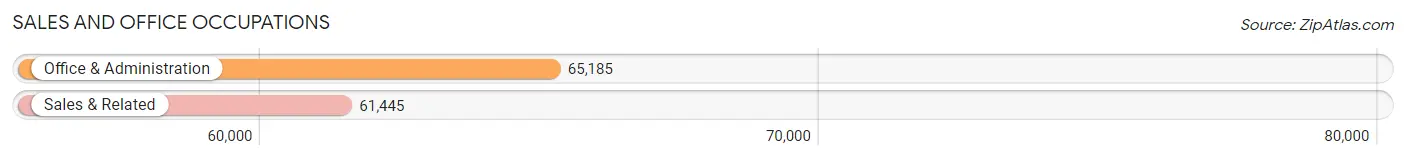
Sales and Office Occupations
The most common Sales and Office occupations in Area Code 636 are Office & Administration (65,185 | 10.8%), and Sales & Related (61,445 | 10.2%).
Sales and Office Occupations by Sex
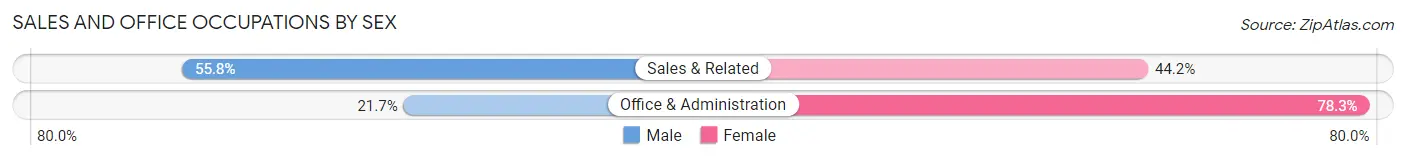
| Occupation | Male | Female |
| Sales & Related | 34,268 (55.8%) | 27,177 (44.2%) |
| Office & Administration | 14,154 (21.7%) | 51,031 (78.3%) |
| Total (Category) | 48,422 (38.2%) | 78,208 (61.8%) |
| Total (Overall) | 318,638 (53.0%) | 282,108 (47.0%) |
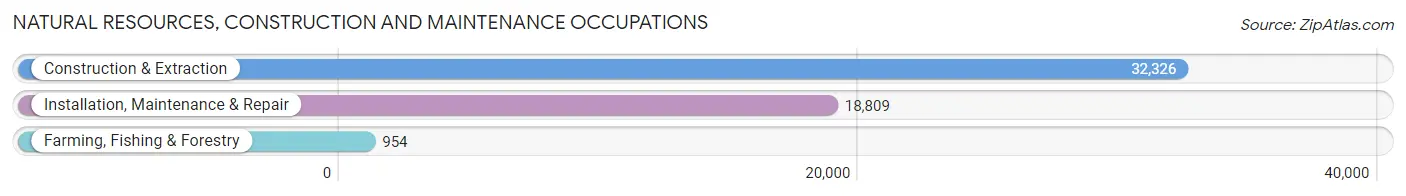
Natural Resources, Construction and Maintenance Occupations
The most common Natural Resources, Construction and Maintenance occupations in Area Code 636 are Construction & Extraction (32,326 | 5.4%), Installation, Maintenance & Repair (18,809 | 3.1%), and Farming, Fishing & Forestry (954 | 0.2%).
Natural Resources, Construction and Maintenance Occupations by Sex
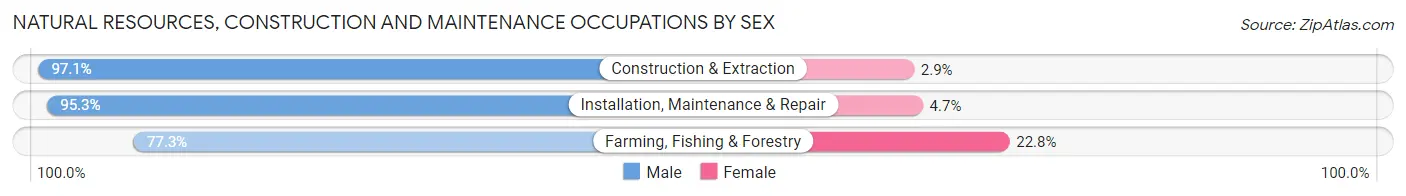
| Occupation | Male | Female |
| Farming, Fishing & Forestry | 737 (77.2%) | 217 (22.8%) |
| Construction & Extraction | 31,391 (97.1%) | 935 (2.9%) |
| Installation, Maintenance & Repair | 17,920 (95.3%) | 889 (4.7%) |
| Total (Category) | 50,048 (96.1%) | 2,041 (3.9%) |
| Total (Overall) | 318,638 (53.0%) | 282,108 (47.0%) |
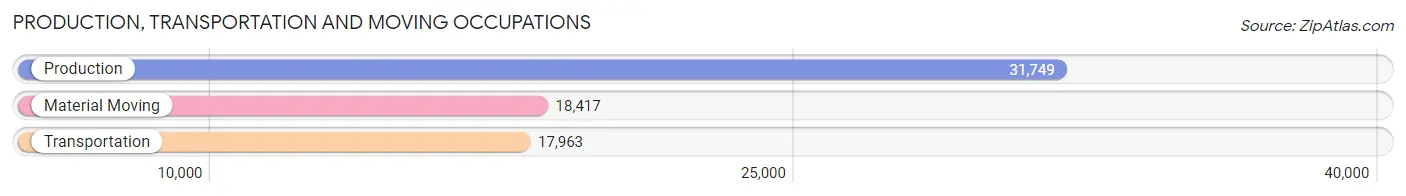
Production, Transportation and Moving Occupations
The most common Production, Transportation and Moving occupations in Area Code 636 are Production (31,749 | 5.3%), Material Moving (18,417 | 3.1%), and Transportation (17,963 | 3.0%).
Production, Transportation and Moving Occupations by Sex
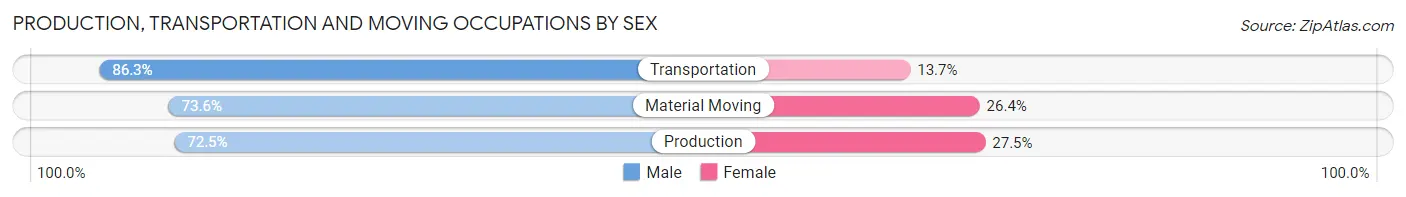
| Occupation | Male | Female |
| Production | 23,021 (72.5%) | 8,728 (27.5%) |
| Transportation | 15,499 (86.3%) | 2,464 (13.7%) |
| Material Moving | 13,548 (73.6%) | 4,869 (26.4%) |
| Total (Category) | 52,068 (76.4%) | 16,061 (23.6%) |
| Total (Overall) | 318,638 (53.0%) | 282,108 (47.0%) |
Employment Industries by Sex in Area Code 636
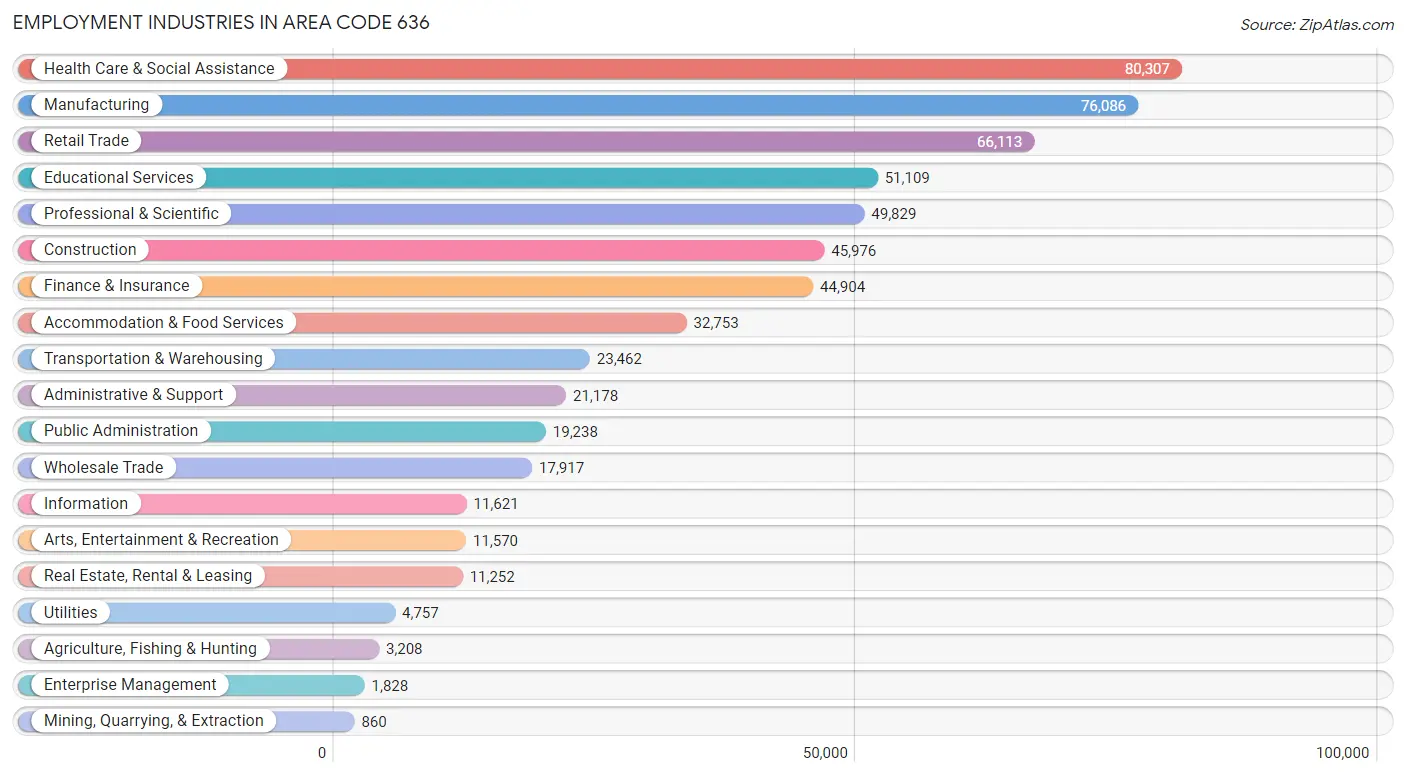
Employment Industries in Area Code 636
The major employment industries in Area Code 636 include Health Care & Social Assistance (80,307 | 13.4%), Manufacturing (76,086 | 12.7%), Retail Trade (66,113 | 11.0%), Educational Services (51,109 | 8.5%), and Professional & Scientific (49,829 | 8.3%).
Employment Industries by Sex in Area Code 636
The Area Code 636 industries that see more men than women are Construction (89.0%), Utilities (81.5%), and Transportation & Warehousing (74.8%), whereas the industries that tend to have a higher number of women are Health Care & Social Assistance (78.9%), Educational Services (71.6%), and Enterprise Management (54.5%).
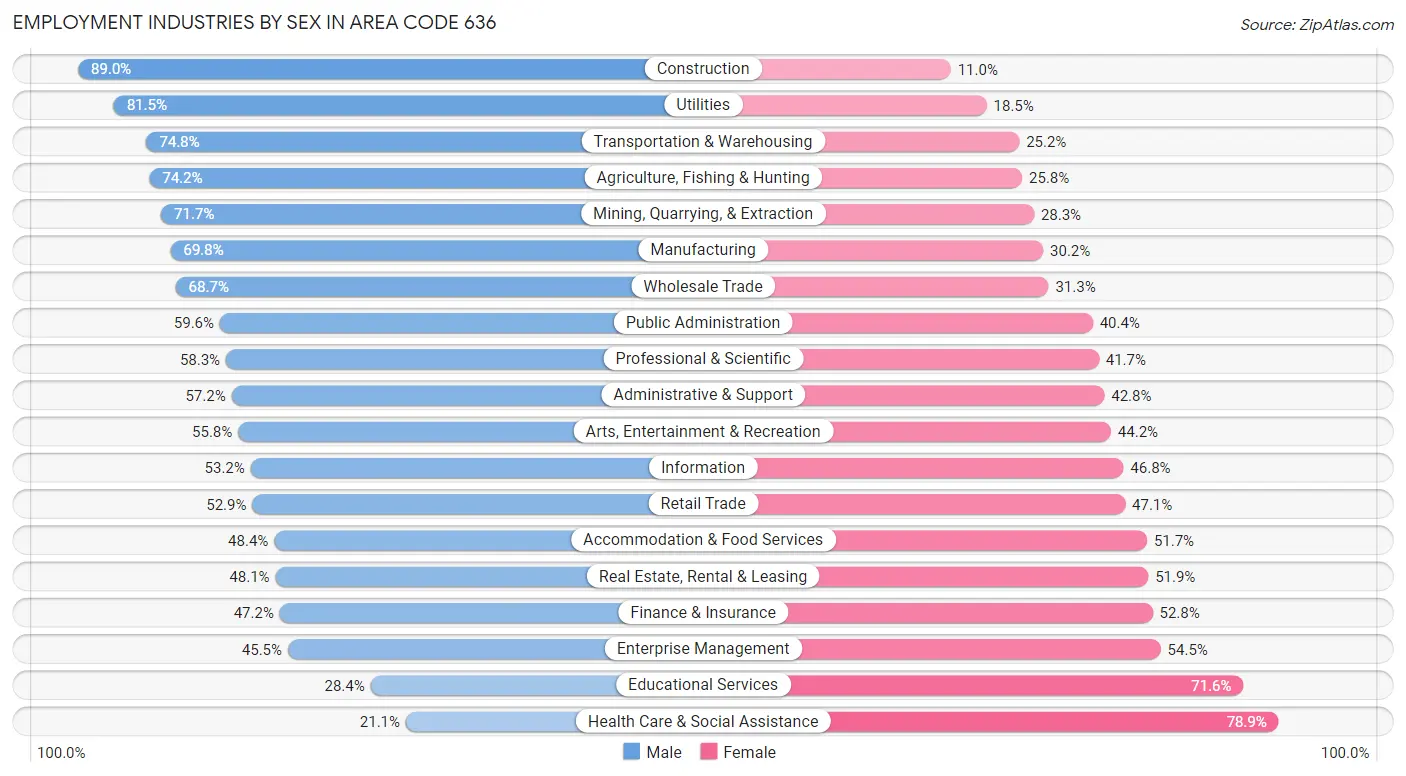
| Industry | Male | Female |
| Agriculture, Fishing & Hunting | 2,380 (74.2%) | 828 (25.8%) |
| Mining, Quarrying, & Extraction | 617 (71.7%) | 243 (28.3%) |
| Construction | 40,898 (89.0%) | 5,078 (11.0%) |
| Manufacturing | 53,139 (69.8%) | 22,947 (30.2%) |
| Wholesale Trade | 12,314 (68.7%) | 5,603 (31.3%) |
| Retail Trade | 34,954 (52.9%) | 31,159 (47.1%) |
| Transportation & Warehousing | 17,547 (74.8%) | 5,915 (25.2%) |
| Utilities | 3,879 (81.5%) | 878 (18.5%) |
| Information | 6,185 (53.2%) | 5,436 (46.8%) |
| Finance & Insurance | 21,191 (47.2%) | 23,713 (52.8%) |
| Real Estate, Rental & Leasing | 5,411 (48.1%) | 5,841 (51.9%) |
| Professional & Scientific | 29,060 (58.3%) | 20,769 (41.7%) |
| Enterprise Management | 832 (45.5%) | 996 (54.5%) |
| Administrative & Support | 12,109 (57.2%) | 9,069 (42.8%) |
| Educational Services | 14,515 (28.4%) | 36,594 (71.6%) |
| Health Care & Social Assistance | 16,938 (21.1%) | 63,369 (78.9%) |
| Arts, Entertainment & Recreation | 6,457 (55.8%) | 5,113 (44.2%) |
| Accommodation & Food Services | 15,835 (48.3%) | 16,918 (51.6%) |
| Public Administration | 11,462 (59.6%) | 7,776 (40.4%) |
| Total | 318,638 (53.0%) | 282,108 (47.0%) |
Education in Area Code 636
School Enrollment in Area Code 636
The most common levels of schooling among the 276,709 students in Area Code 636 are high school (63,279 | 22.9%), middle school (59,213 | 21.4%), and elementary school (58,389 | 21.1%).
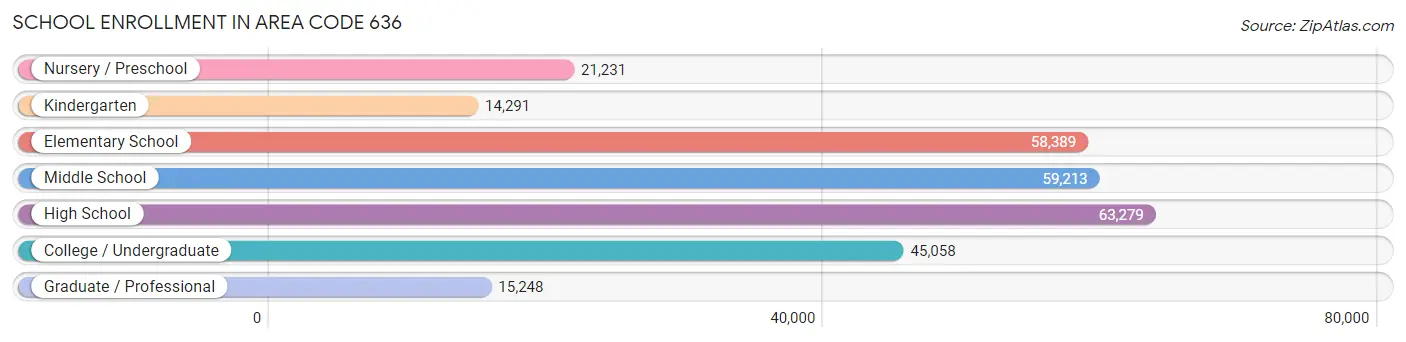
| School Level | # Students | % Students |
| Nursery / Preschool | 21,231 | 7.7% |
| Kindergarten | 14,291 | 5.2% |
| Elementary School | 58,389 | 21.1% |
| Middle School | 59,213 | 21.4% |
| High School | 63,279 | 22.9% |
| College / Undergraduate | 45,058 | 16.3% |
| Graduate / Professional | 15,248 | 5.5% |
| Total | 276,709 | 100.0% |
School Enrollment by Age by Funding Source in Area Code 636
Out of a total of 276,709 students who are enrolled in schools in Area Code 636, 64,802 (23.4%) attend a private institution, while the remaining 211,907 (76.6%) are enrolled in public schools. The age group of 3 to 4 year olds has the highest likelihood of being enrolled in private schools, with 8,100 (52.8% in the age bracket) enrolled. Conversely, the age group of 15 to 17 year olds has the lowest likelihood of being enrolled in a private school, with 40,398 (85.2% in the age bracket) attending a public institution.
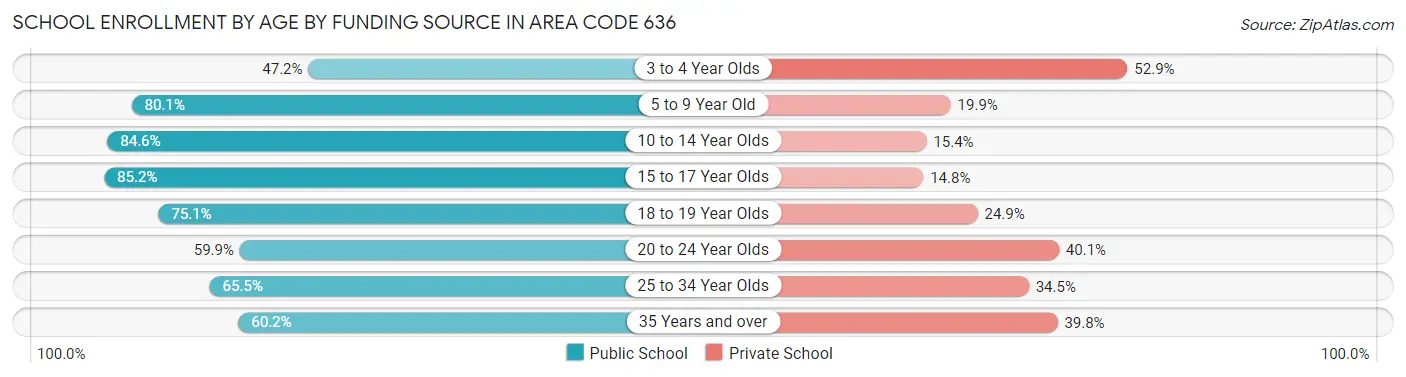
| Age Bracket | Public School | Private School |
| 3 to 4 Year Olds | 7,225 (47.1%) | 8,100 (52.8%) |
| 5 to 9 Year Old | 56,018 (80.1%) | 13,944 (19.9%) |
| 10 to 14 Year Olds | 62,633 (84.6%) | 11,417 (15.4%) |
| 15 to 17 Year Olds | 40,398 (85.2%) | 7,030 (14.8%) |
| 18 to 19 Year Olds | 14,572 (75.1%) | 4,840 (24.9%) |
| 20 to 24 Year Olds | 15,124 (59.9%) | 10,120 (40.1%) |
| 25 to 34 Year Olds | 8,835 (65.5%) | 4,647 (34.5%) |
| 35 Years and over | 7,105 (60.2%) | 4,701 (39.8%) |
| Total | 211,907 (76.6%) | 64,802 (23.4%) |
Educational Attainment by Field of Study in Area Code 636
Business (85,722 | 24.4%), education (43,883 | 12.5%), science & technology (36,793 | 10.5%), engineering (29,404 | 8.4%), and computers & mathematics (21,374 | 6.1%) are the most common fields of study among 351,376 individuals in Area Code 636 who have obtained a bachelor's degree or higher.
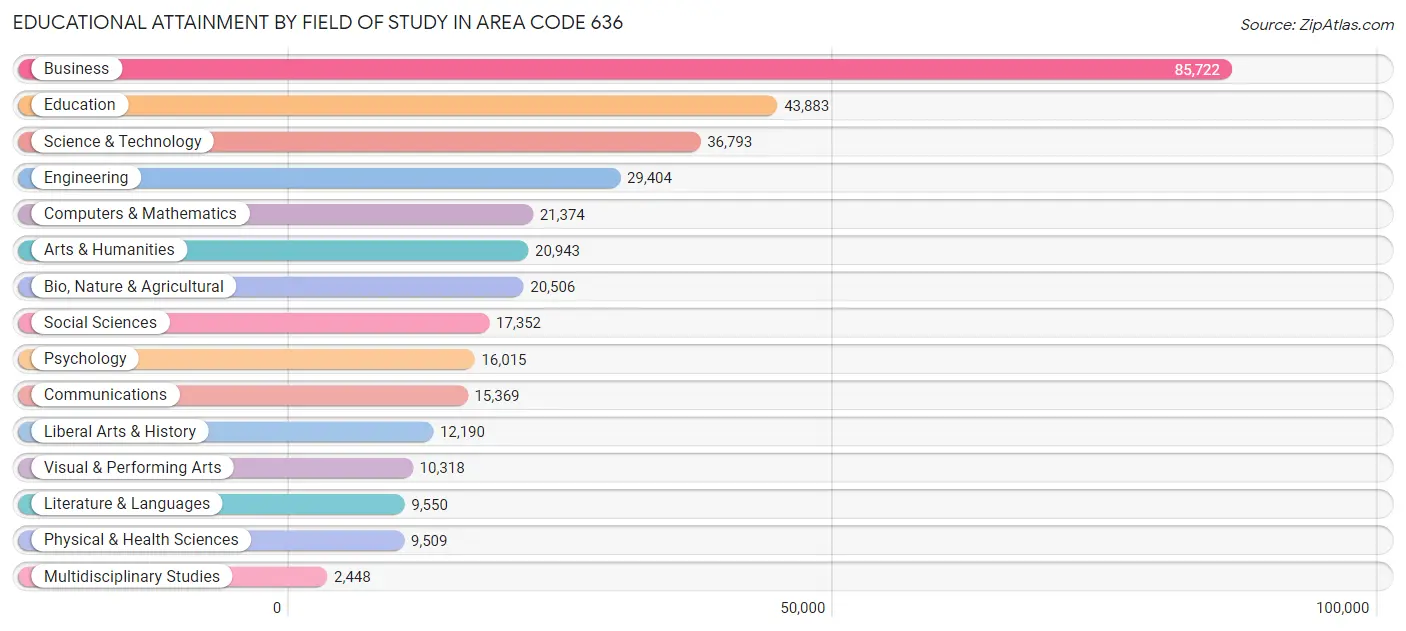
| Field of Study | # Graduates | % Graduates |
| Computers & Mathematics | 21,374 | 6.1% |
| Bio, Nature & Agricultural | 20,506 | 5.8% |
| Physical & Health Sciences | 9,509 | 2.7% |
| Psychology | 16,015 | 4.6% |
| Social Sciences | 17,352 | 4.9% |
| Engineering | 29,404 | 8.4% |
| Multidisciplinary Studies | 2,448 | 0.7% |
| Science & Technology | 36,793 | 10.5% |
| Business | 85,722 | 24.4% |
| Education | 43,883 | 12.5% |
| Literature & Languages | 9,550 | 2.7% |
| Liberal Arts & History | 12,190 | 3.5% |
| Visual & Performing Arts | 10,318 | 2.9% |
| Communications | 15,369 | 4.4% |
| Arts & Humanities | 20,943 | 6.0% |
| Total | 351,376 | 100.0% |
Transportation & Commute in Area Code 636
Vehicle Availability by Sex in Area Code 636
The most prevalent vehicle ownership categories in Area Code 636 are males with 2 vehicles (143,828, accounting for 45.7%) and females with 2 vehicles (119,893, making up 52.1%).
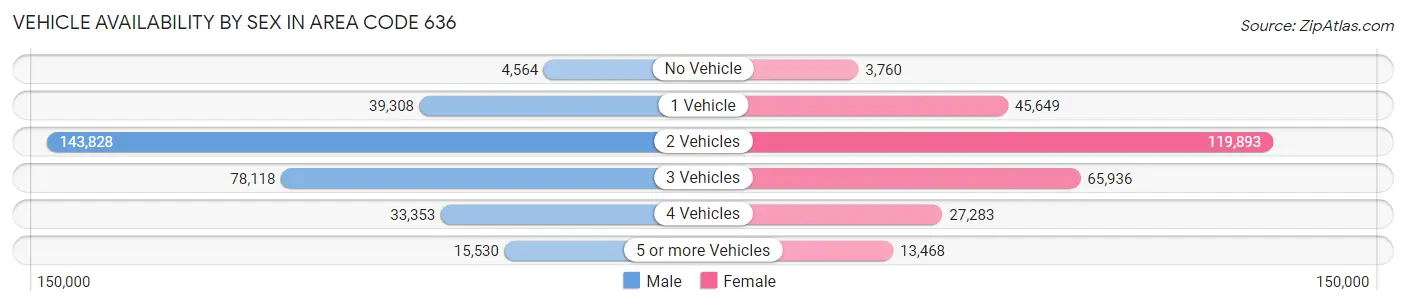
| Vehicles Available | Male | Female |
| No Vehicle | 4,564 (1.5%) | 3,760 (1.4%) |
| 1 Vehicle | 39,308 (12.5%) | 45,649 (16.5%) |
| 2 Vehicles | 143,828 (45.7%) | 119,893 (43.4%) |
| 3 Vehicles | 78,118 (24.8%) | 65,936 (23.9%) |
| 4 Vehicles | 33,353 (10.6%) | 27,283 (9.9%) |
| 5 or more Vehicles | 15,530 (4.9%) | 13,468 (4.9%) |
| Total | 314,701 (100.0%) | 275,989 (100.0%) |
Commute Time in Area Code 636
The most frequently occuring commute durations in Area Code 636 are 30 to 34 minutes (80,974 commuters, 15.7%), 20 to 24 minutes (78,411 commuters, 15.2%), and 15 to 19 minutes (75,055 commuters, 14.5%).
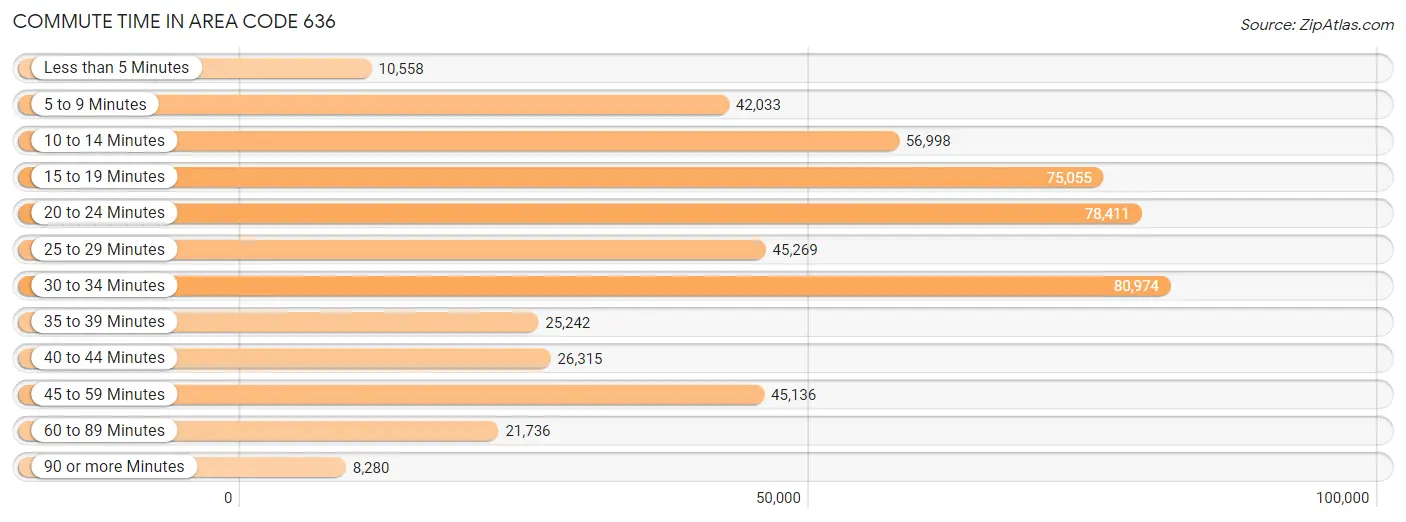
| Commute Time | # Commuters | % Commuters |
| Less than 5 Minutes | 10,558 | 2.1% |
| 5 to 9 Minutes | 42,033 | 8.2% |
| 10 to 14 Minutes | 56,998 | 11.1% |
| 15 to 19 Minutes | 75,055 | 14.5% |
| 20 to 24 Minutes | 78,411 | 15.2% |
| 25 to 29 Minutes | 45,269 | 8.8% |
| 30 to 34 Minutes | 80,974 | 15.7% |
| 35 to 39 Minutes | 25,242 | 4.9% |
| 40 to 44 Minutes | 26,315 | 5.1% |
| 45 to 59 Minutes | 45,136 | 8.7% |
| 60 to 89 Minutes | 21,736 | 4.2% |
| 90 or more Minutes | 8,280 | 1.6% |
Commute Time by Sex in Area Code 636
The most common commute times in Area Code 636 are 30 to 34 minutes (46,476 commuters, 16.6%) for males and 15 to 19 minutes (37,666 commuters, 15.9%) for females.
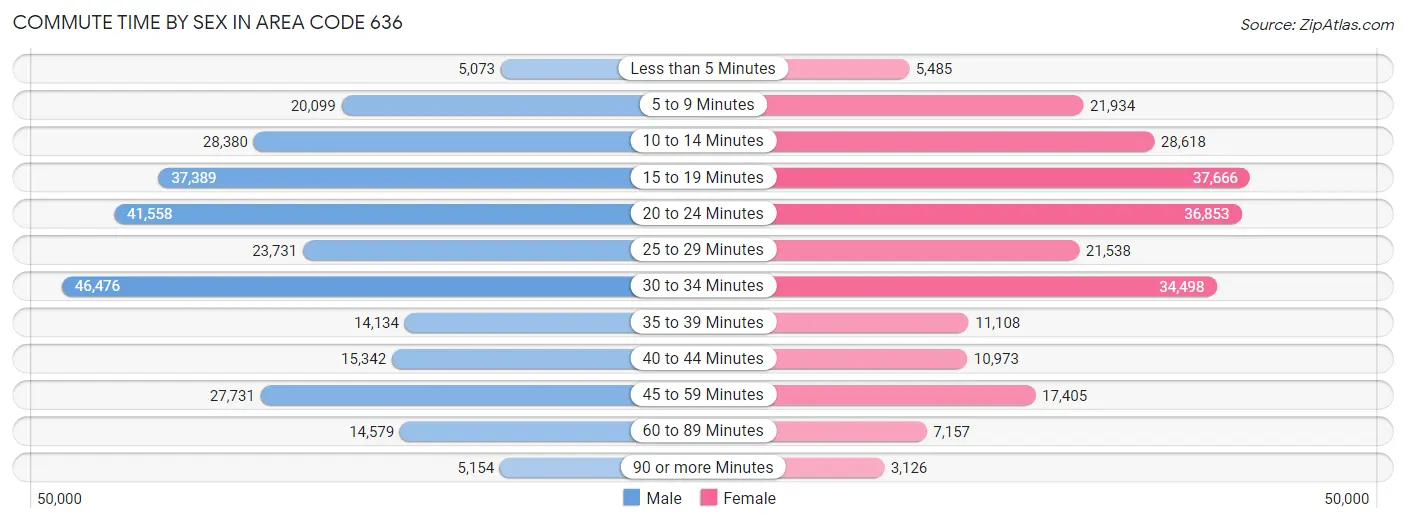
| Commute Time | Male | Female |
| Less than 5 Minutes | 5,073 (1.8%) | 5,485 (2.3%) |
| 5 to 9 Minutes | 20,099 (7.2%) | 21,934 (9.3%) |
| 10 to 14 Minutes | 28,380 (10.2%) | 28,618 (12.1%) |
| 15 to 19 Minutes | 37,389 (13.4%) | 37,666 (15.9%) |
| 20 to 24 Minutes | 41,558 (14.9%) | 36,853 (15.6%) |
| 25 to 29 Minutes | 23,731 (8.5%) | 21,538 (9.1%) |
| 30 to 34 Minutes | 46,476 (16.6%) | 34,498 (14.6%) |
| 35 to 39 Minutes | 14,134 (5.1%) | 11,108 (4.7%) |
| 40 to 44 Minutes | 15,342 (5.5%) | 10,973 (4.6%) |
| 45 to 59 Minutes | 27,731 (9.9%) | 17,405 (7.4%) |
| 60 to 89 Minutes | 14,579 (5.2%) | 7,157 (3.0%) |
| 90 or more Minutes | 5,154 (1.8%) | 3,126 (1.3%) |
Time of Departure to Work by Sex in Area Code 636
The most frequent times of departure to work in Area Code 636 are 7:00 AM to 7:29 AM (39,382, 14.1%) for males and 7:00 AM to 7:29 AM (37,860, 16.0%) for females.
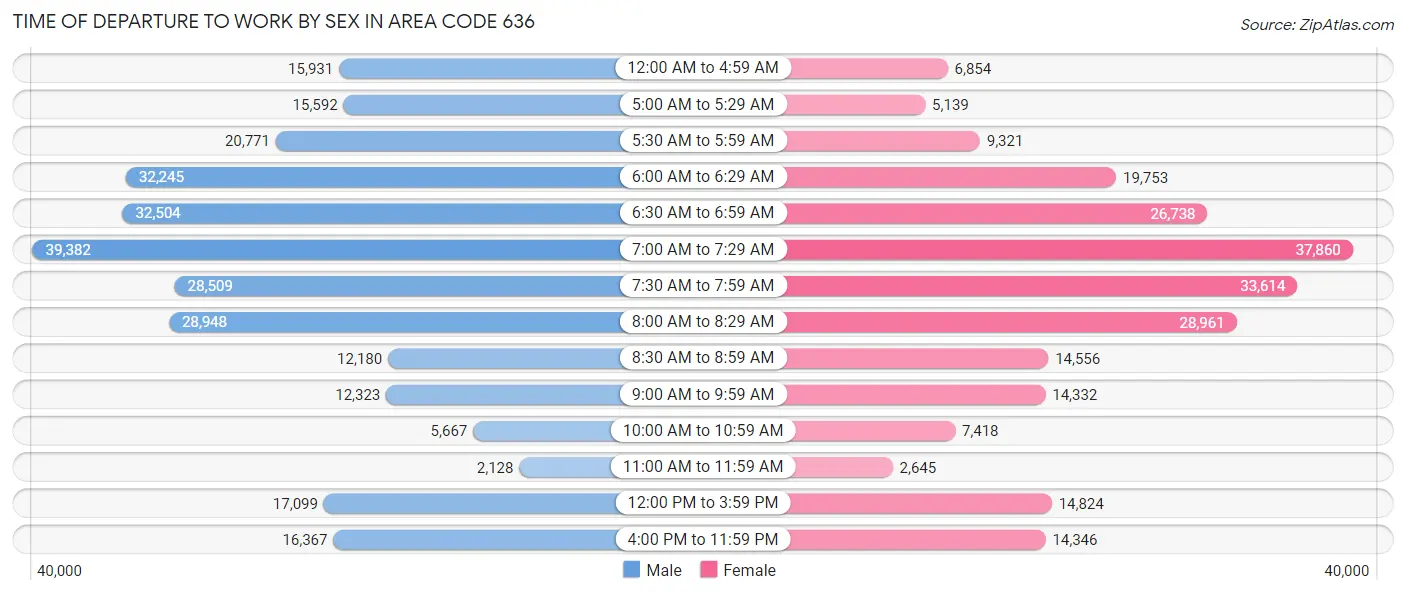
| Time of Departure | Male | Female |
| 12:00 AM to 4:59 AM | 15,931 (5.7%) | 6,854 (2.9%) |
| 5:00 AM to 5:29 AM | 15,592 (5.6%) | 5,139 (2.2%) |
| 5:30 AM to 5:59 AM | 20,771 (7.4%) | 9,321 (3.9%) |
| 6:00 AM to 6:29 AM | 32,245 (11.5%) | 19,753 (8.4%) |
| 6:30 AM to 6:59 AM | 32,504 (11.6%) | 26,738 (11.3%) |
| 7:00 AM to 7:29 AM | 39,382 (14.1%) | 37,860 (16.0%) |
| 7:30 AM to 7:59 AM | 28,509 (10.2%) | 33,614 (14.2%) |
| 8:00 AM to 8:29 AM | 28,948 (10.3%) | 28,961 (12.2%) |
| 8:30 AM to 8:59 AM | 12,180 (4.4%) | 14,556 (6.2%) |
| 9:00 AM to 9:59 AM | 12,323 (4.4%) | 14,332 (6.1%) |
| 10:00 AM to 10:59 AM | 5,667 (2.0%) | 7,418 (3.1%) |
| 11:00 AM to 11:59 AM | 2,128 (0.8%) | 2,645 (1.1%) |
| 12:00 PM to 3:59 PM | 17,099 (6.1%) | 14,824 (6.3%) |
| 4:00 PM to 11:59 PM | 16,367 (5.9%) | 14,346 (6.1%) |
| Total | 279,646 (100.0%) | 236,361 (100.0%) |
Housing Occupancy in Area Code 636
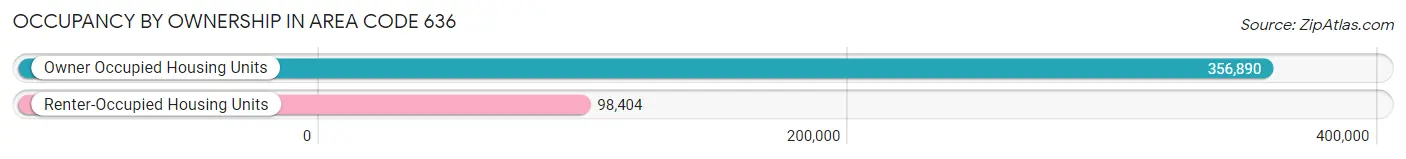
Occupancy by Ownership in Area Code 636
Of the total 455,294 dwellings in Area Code 636, owner-occupied units account for 356,890 (78.4%), while renter-occupied units make up 98,404 (21.6%).
| Occupancy | # Housing Units | % Housing Units |
| Owner Occupied Housing Units | 356,890 | 78.4% |
| Renter-Occupied Housing Units | 98,404 | 21.6% |
| Total Occupied Housing Units | 455,294 | 100.0% |
Occupancy by Household Size in Area Code 636
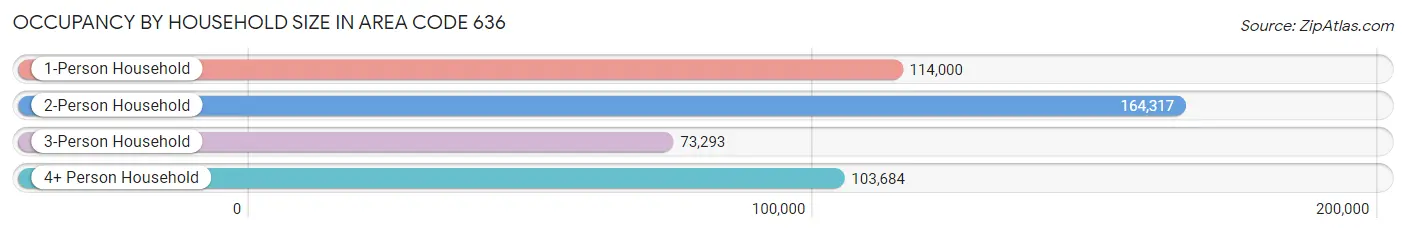
| Household Size | # Housing Units | % Housing Units |
| 1-Person Household | 114,000 | 25.0% |
| 2-Person Household | 164,317 | 36.1% |
| 3-Person Household | 73,293 | 16.1% |
| 4+ Person Household | 103,684 | 22.8% |
| Total Housing Units | 455,294 | 100.0% |
Occupancy by Ownership by Household Size in Area Code 636
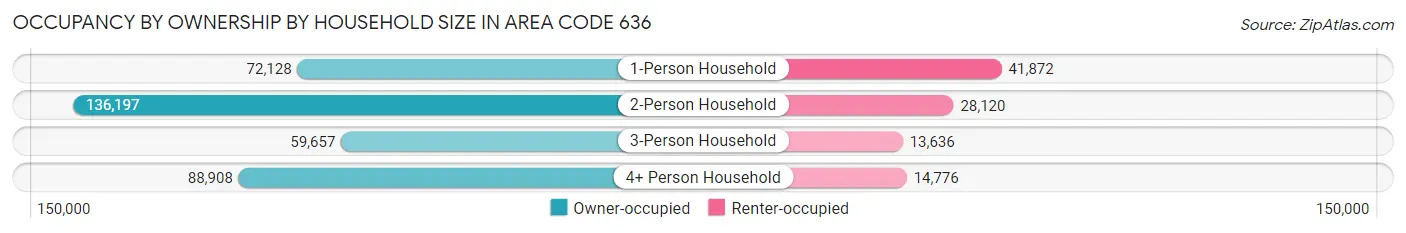
| Household Size | Owner-occupied | Renter-occupied |
| 1-Person Household | 72,128 (63.3%) | 41,872 (36.7%) |
| 2-Person Household | 136,197 (82.9%) | 28,120 (17.1%) |
| 3-Person Household | 59,657 (81.4%) | 13,636 (18.6%) |
| 4+ Person Household | 88,908 (85.8%) | 14,776 (14.2%) |
| Total Housing Units | 356,890 (78.4%) | 98,404 (21.6%) |
Occupancy by Educational Attainment in Area Code 636
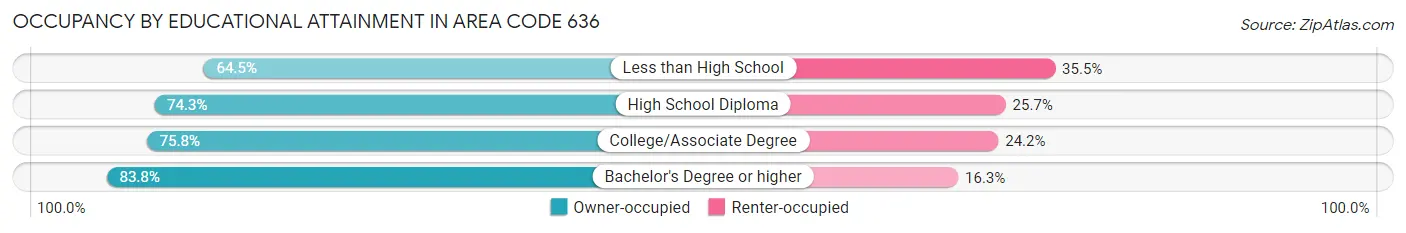
| Household Size | Owner-occupied | Renter-occupied |
| Less than High School | 13,792 (64.5%) | 7,586 (35.5%) |
| High School Diploma | 72,085 (74.3%) | 24,900 (25.7%) |
| College/Associate Degree | 106,320 (75.8%) | 33,968 (24.2%) |
| Bachelor's Degree or higher | 164,693 (83.8%) | 31,950 (16.3%) |
Occupancy by Age of Householder in Area Code 636
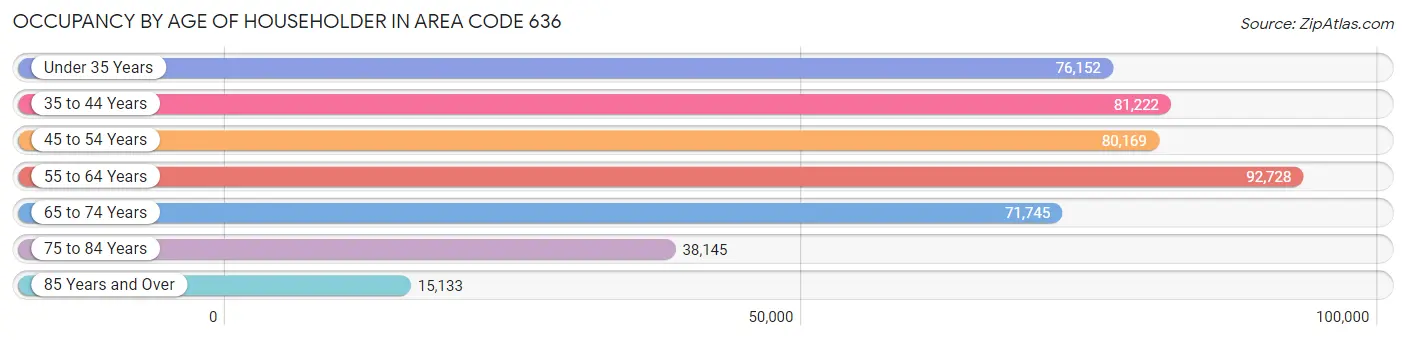
| Age Bracket | # Households | % Households |
| Under 35 Years | 76,152 | 16.7% |
| 35 to 44 Years | 81,222 | 17.8% |
| 45 to 54 Years | 80,169 | 17.6% |
| 55 to 64 Years | 92,728 | 20.4% |
| 65 to 74 Years | 71,745 | 15.8% |
| 75 to 84 Years | 38,145 | 8.4% |
| 85 Years and Over | 15,133 | 3.3% |
| Total | 455,294 | 100.0% |
Housing Finances in Area Code 636
Median Income by Occupancy in Area Code 636
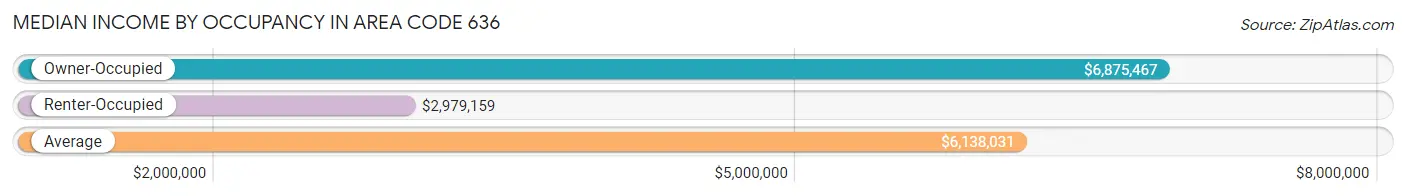
| Occupancy Type | # Households | Median Income |
| Owner-Occupied | 356,890 (78.4%) | $6,875,467 |
| Renter-Occupied | 98,404 (21.6%) | $2,979,159 |
| Average | 455,294 (100.0%) | $6,138,031 |
Occupancy by Householder Income Bracket in Area Code 636
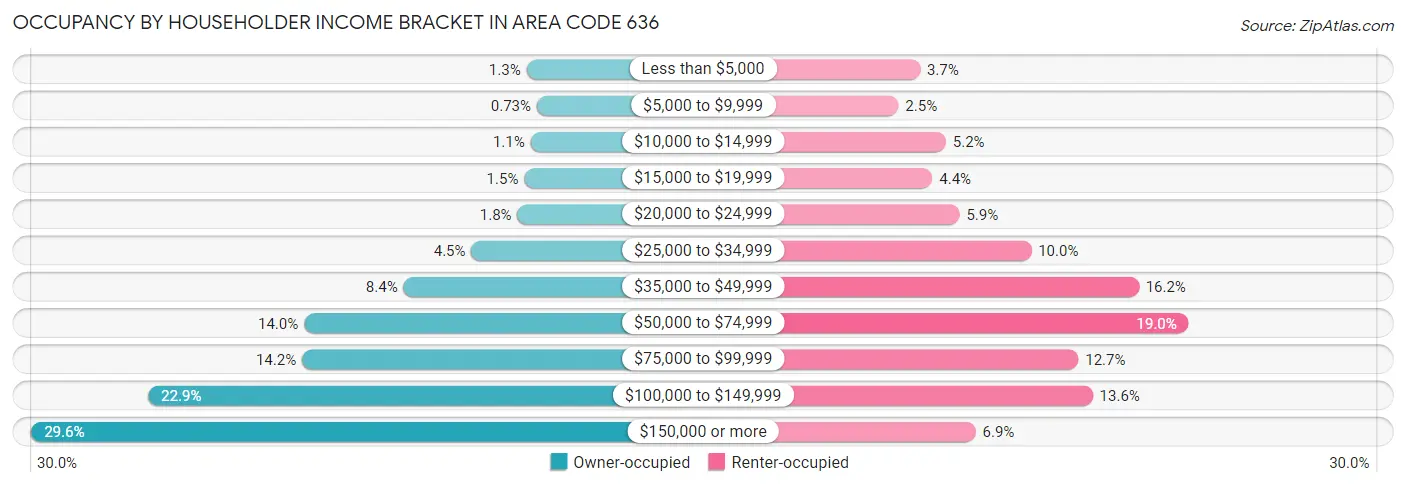
| Income Bracket | Owner-occupied | Renter-occupied |
| Less than $5,000 | 4,716 (1.3%) | 3,618 (3.7%) |
| $5,000 to $9,999 | 2,612 (0.7%) | 2,411 (2.5%) |
| $10,000 to $14,999 | 3,906 (1.1%) | 5,080 (5.2%) |
| $15,000 to $19,999 | 5,185 (1.5%) | 4,317 (4.4%) |
| $20,000 to $24,999 | 6,564 (1.8%) | 5,844 (5.9%) |
| $25,000 to $34,999 | 15,951 (4.5%) | 9,877 (10.0%) |
| $35,000 to $49,999 | 29,788 (8.4%) | 15,925 (16.2%) |
| $50,000 to $74,999 | 50,060 (14.0%) | 18,725 (19.0%) |
| $75,000 to $99,999 | 50,512 (14.1%) | 12,527 (12.7%) |
| $100,000 to $149,999 | 81,874 (22.9%) | 13,329 (13.6%) |
| $150,000 or more | 105,722 (29.6%) | 6,751 (6.9%) |
| Total | 356,890 (100.0%) | 98,404 (100.0%) |
Monthly Housing Cost Tiers in Area Code 636
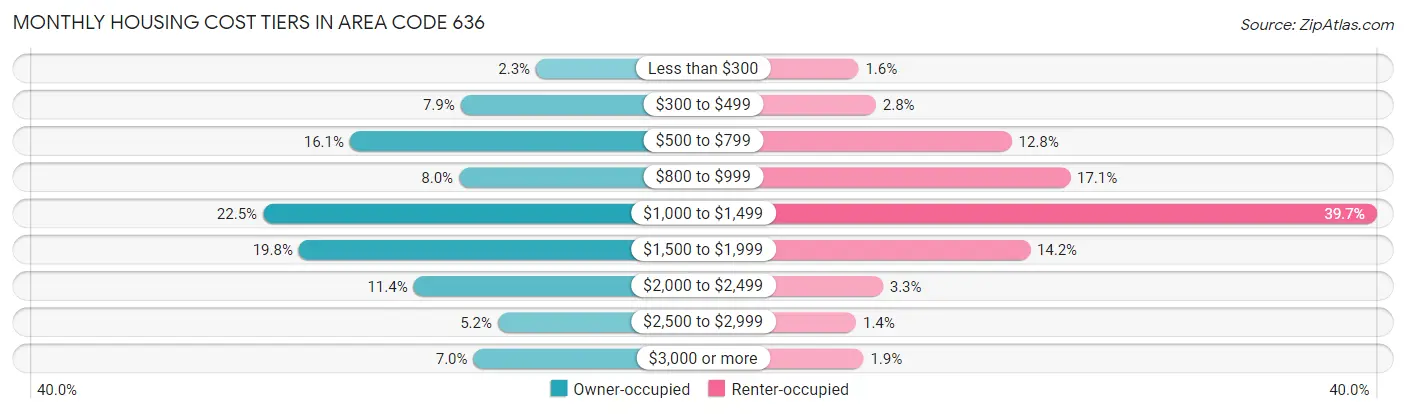
| Monthly Cost | Owner-occupied | Renter-occupied |
| Less than $300 | 8,334 (2.3%) | 1,526 (1.5%) |
| $300 to $499 | 28,162 (7.9%) | 2,788 (2.8%) |
| $500 to $799 | 57,295 (16.1%) | 12,622 (12.8%) |
| $800 to $999 | 28,573 (8.0%) | 16,857 (17.1%) |
| $1,000 to $1,499 | 80,106 (22.5%) | 39,065 (39.7%) |
| $1,500 to $1,999 | 70,694 (19.8%) | 13,952 (14.2%) |
| $2,000 to $2,499 | 40,541 (11.4%) | 3,285 (3.3%) |
| $2,500 to $2,999 | 18,373 (5.1%) | 1,353 (1.4%) |
| $3,000 or more | 24,812 (7.0%) | 1,886 (1.9%) |
| Total | 356,890 (100.0%) | 98,404 (100.0%) |
Physical Housing Characteristics in Area Code 636
Housing Structures in Area Code 636
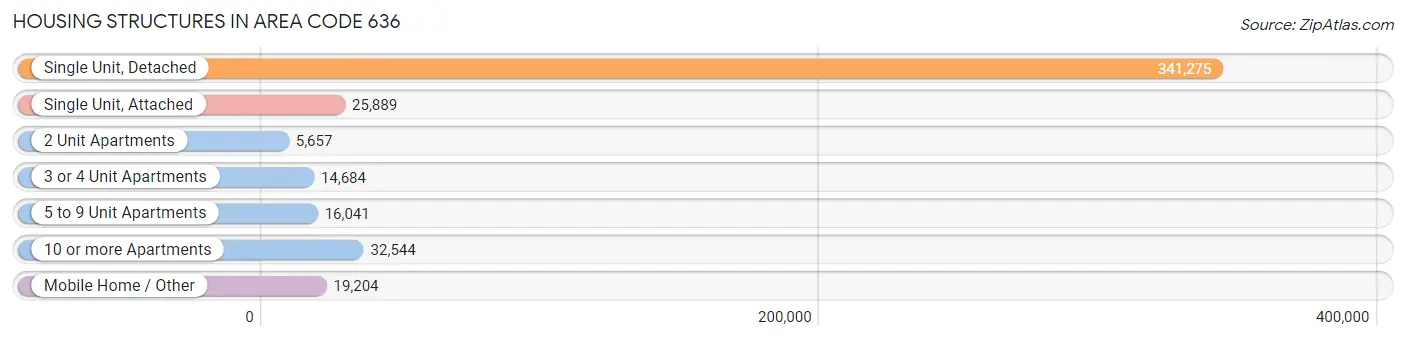
| Structure Type | # Housing Units | % Housing Units |
| Single Unit, Detached | 341,275 | 75.0% |
| Single Unit, Attached | 25,889 | 5.7% |
| 2 Unit Apartments | 5,657 | 1.2% |
| 3 or 4 Unit Apartments | 14,684 | 3.2% |
| 5 to 9 Unit Apartments | 16,041 | 3.5% |
| 10 or more Apartments | 32,544 | 7.1% |
| Mobile Home / Other | 19,204 | 4.2% |
| Total | 455,294 | 100.0% |
Housing Structures by Occupancy in Area Code 636
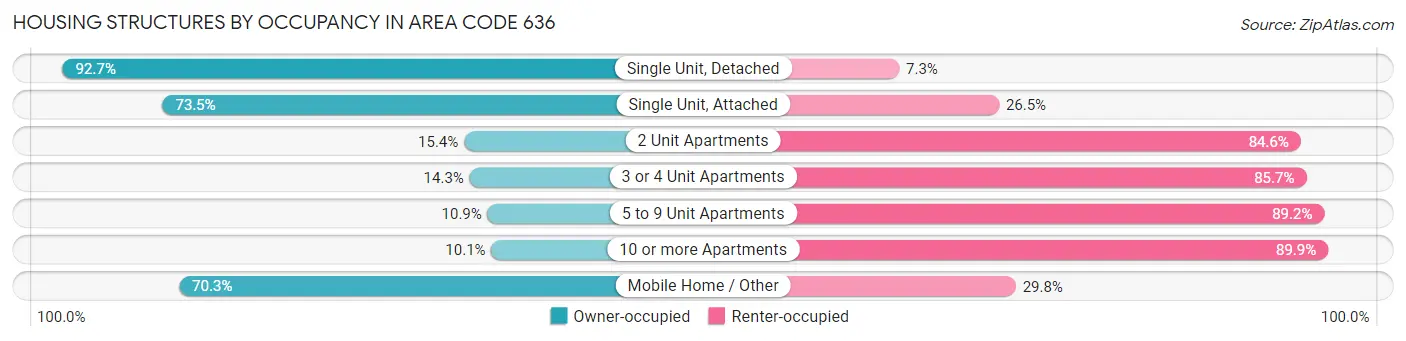
| Structure Type | Owner-occupied | Renter-occupied |
| Single Unit, Detached | 316,372 (92.7%) | 24,903 (7.3%) |
| Single Unit, Attached | 19,020 (73.5%) | 6,869 (26.5%) |
| 2 Unit Apartments | 870 (15.4%) | 4,787 (84.6%) |
| 3 or 4 Unit Apartments | 2,102 (14.3%) | 12,582 (85.7%) |
| 5 to 9 Unit Apartments | 1,741 (10.8%) | 14,300 (89.1%) |
| 10 or more Apartments | 3,295 (10.1%) | 29,249 (89.9%) |
| Mobile Home / Other | 13,490 (70.3%) | 5,714 (29.7%) |
| Total | 356,890 (78.4%) | 98,404 (21.6%) |
Housing Structures by Number of Rooms in Area Code 636
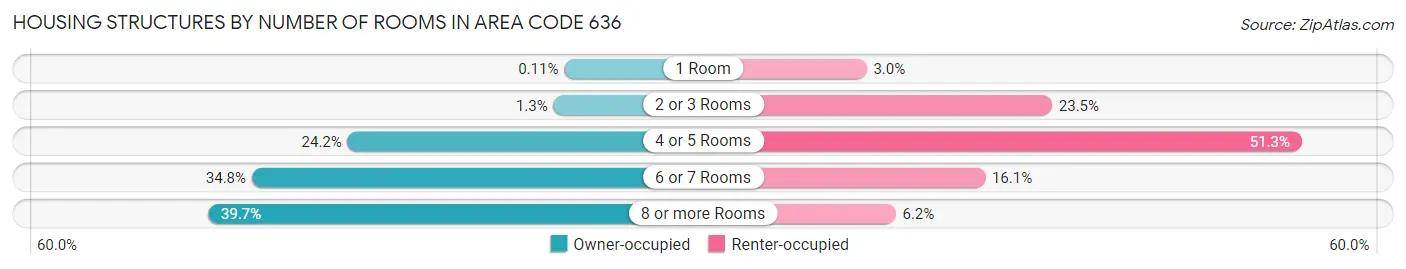
| Number of Rooms | Owner-occupied | Renter-occupied |
| 1 Room | 390 (0.1%) | 2,907 (2.9%) |
| 2 or 3 Rooms | 4,651 (1.3%) | 23,148 (23.5%) |
| 4 or 5 Rooms | 86,174 (24.1%) | 50,437 (51.3%) |
| 6 or 7 Rooms | 124,118 (34.8%) | 15,842 (16.1%) |
| 8 or more Rooms | 141,557 (39.7%) | 6,070 (6.2%) |
| Total | 356,890 (100.0%) | 98,404 (100.0%) |
Housing Structure by Heating Type in Area Code 636
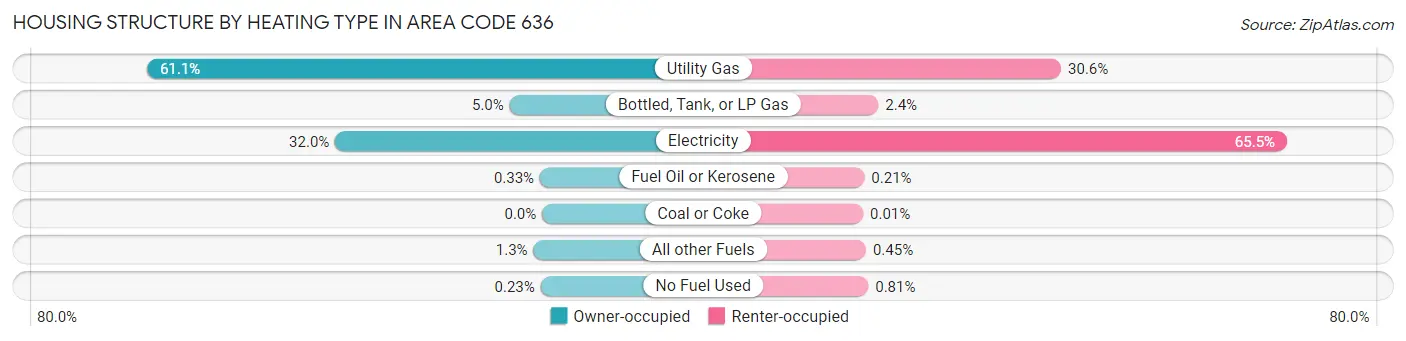
| Heating Type | Owner-occupied | Renter-occupied |
| Utility Gas | 218,003 (61.1%) | 30,130 (30.6%) |
| Bottled, Tank, or LP Gas | 17,930 (5.0%) | 2,334 (2.4%) |
| Electricity | 114,173 (32.0%) | 64,474 (65.5%) |
| Fuel Oil or Kerosene | 1,165 (0.3%) | 209 (0.2%) |
| Coal or Coke | 17 (0.0%) | 12 (0.0%) |
| All other Fuels | 4,766 (1.3%) | 447 (0.4%) |
| No Fuel Used | 836 (0.2%) | 798 (0.8%) |
| Total | 356,890 (100.0%) | 98,404 (100.0%) |
Household Vehicle Usage in Area Code 636
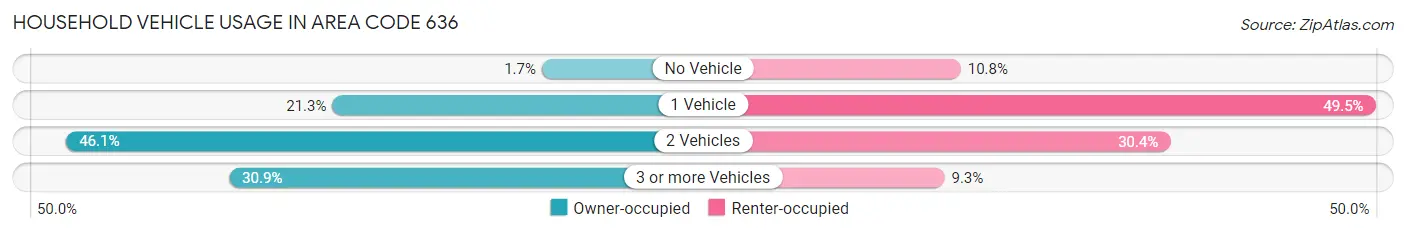
| Vehicles per Household | Owner-occupied | Renter-occupied |
| No Vehicle | 6,133 (1.7%) | 10,644 (10.8%) |
| 1 Vehicle | 75,943 (21.3%) | 48,726 (49.5%) |
| 2 Vehicles | 164,545 (46.1%) | 29,879 (30.4%) |
| 3 or more Vehicles | 110,269 (30.9%) | 9,155 (9.3%) |
| Total | 356,890 (100.0%) | 98,404 (100.0%) |
Real Estate & Mortgages in Area Code 636
Real Estate and Mortgage Overview in Area Code 636
| Characteristic | Without Mortgage | With Mortgage |
| Housing Units | 114,912 | 241,978 |
| Median Property Value | $16,740,900 | $18,845,500 |
| Median Household Income | $4,868,252 | $83,287 |
| Monthly Housing Costs | $40,596 | $24,211 |
| Real Estate Taxes | $170,367 | $3,718 |
Property Value by Mortgage Status in Area Code 636
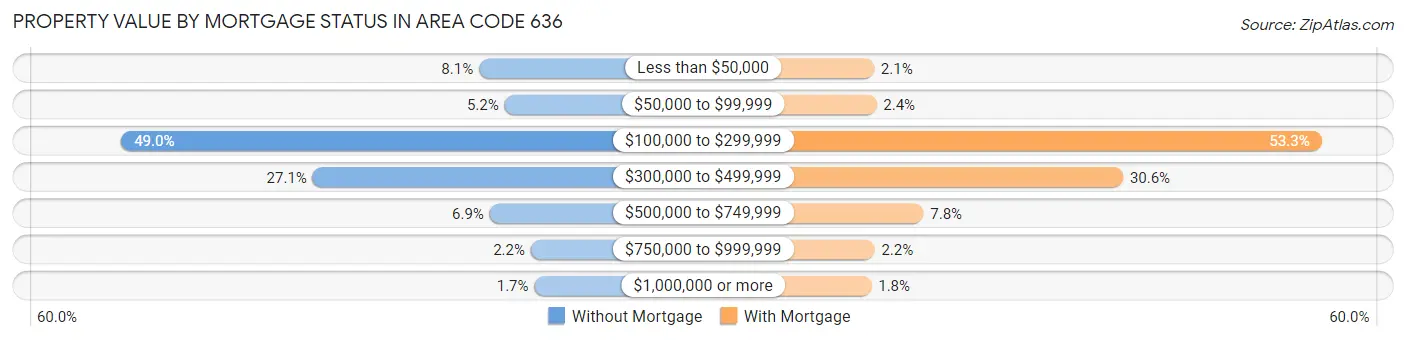
| Property Value | Without Mortgage | With Mortgage |
| Less than $50,000 | 9,278 (8.1%) | 5,082 (2.1%) |
| $50,000 to $99,999 | 5,915 (5.1%) | 5,764 (2.4%) |
| $100,000 to $299,999 | 56,253 (48.9%) | 128,865 (53.2%) |
| $300,000 to $499,999 | 31,116 (27.1%) | 73,949 (30.6%) |
| $500,000 to $749,999 | 7,874 (6.9%) | 18,747 (7.7%) |
| $750,000 to $999,999 | 2,475 (2.1%) | 5,217 (2.2%) |
| $1,000,000 or more | 2,001 (1.7%) | 4,354 (1.8%) |
| Total | 114,912 (100.0%) | 241,978 (100.0%) |
Household Income by Mortgage Status in Area Code 636
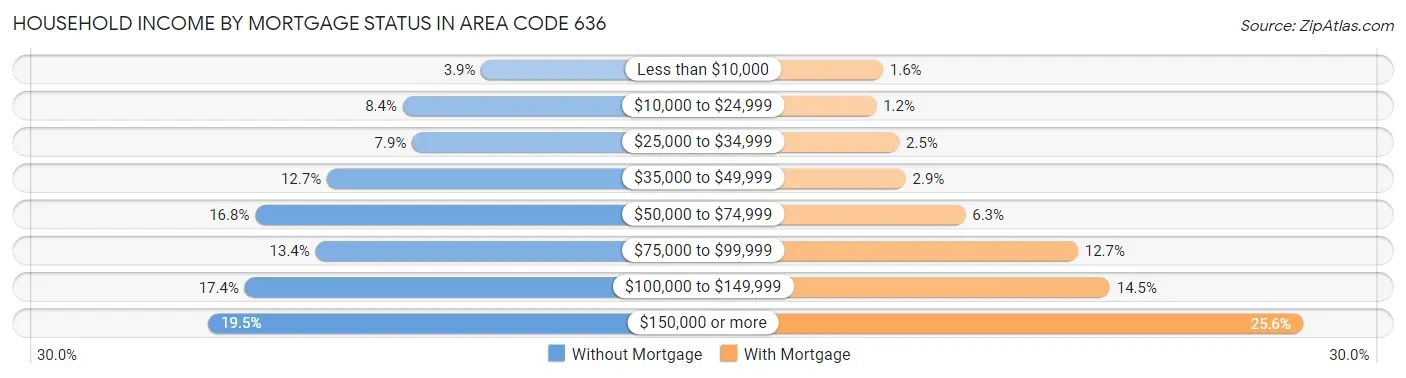
| Household Income | Without Mortgage | With Mortgage |
| Less than $10,000 | 4,483 (3.9%) | 3,773 (1.6%) |
| $10,000 to $24,999 | 9,641 (8.4%) | 2,845 (1.2%) |
| $25,000 to $34,999 | 9,020 (7.9%) | 6,014 (2.5%) |
| $35,000 to $49,999 | 14,622 (12.7%) | 6,931 (2.9%) |
| $50,000 to $74,999 | 19,331 (16.8%) | 15,166 (6.3%) |
| $75,000 to $99,999 | 15,362 (13.4%) | 30,729 (12.7%) |
| $100,000 to $149,999 | 20,018 (17.4%) | 35,150 (14.5%) |
| $150,000 or more | 22,435 (19.5%) | 61,856 (25.6%) |
| Total | 114,912 (100.0%) | 241,978 (100.0%) |
Property Value to Household Income Ratio in Area Code 636
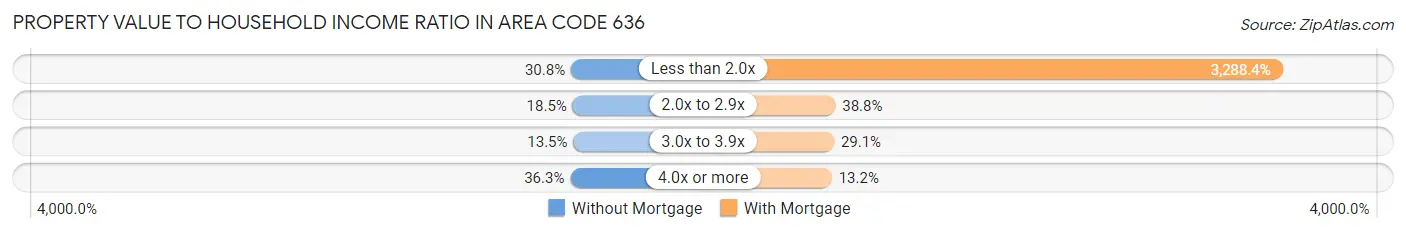
| Value-to-Income Ratio | Without Mortgage | With Mortgage |
| Less than 2.0x | 35,371 (30.8%) | 7,957,256 (3,288.4%) |
| 2.0x to 2.9x | 21,238 (18.5%) | 93,958 (38.8%) |
| 3.0x to 3.9x | 15,491 (13.5%) | 70,391 (29.1%) |
| 4.0x or more | 41,762 (36.3%) | 32,015 (13.2%) |
| Total | 114,912 (100.0%) | 241,978 (100.0%) |
Real Estate Taxes by Mortgage Status in Area Code 636
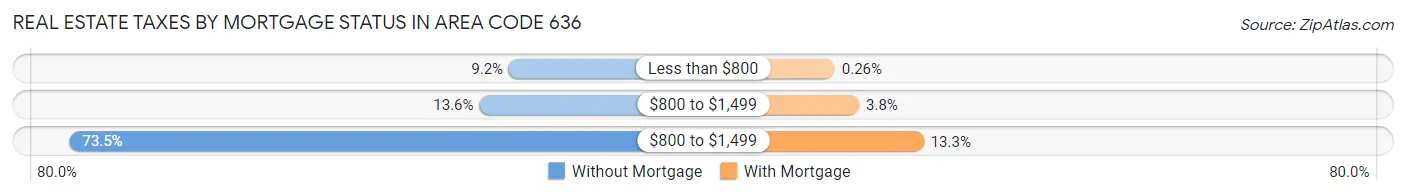
| Property Taxes | Without Mortgage | With Mortgage |
| Less than $800 | 10,609 (9.2%) | 630 (0.3%) |
| $800 to $1,499 | 15,571 (13.6%) | 9,213 (3.8%) |
| $800 to $1,499 | 84,404 (73.5%) | 32,074 (13.3%) |
| Total | 114,912 (100.0%) | 241,978 (100.0%) |
Health & Disability in Area Code 636
Health Insurance Coverage by Age in Area Code 636
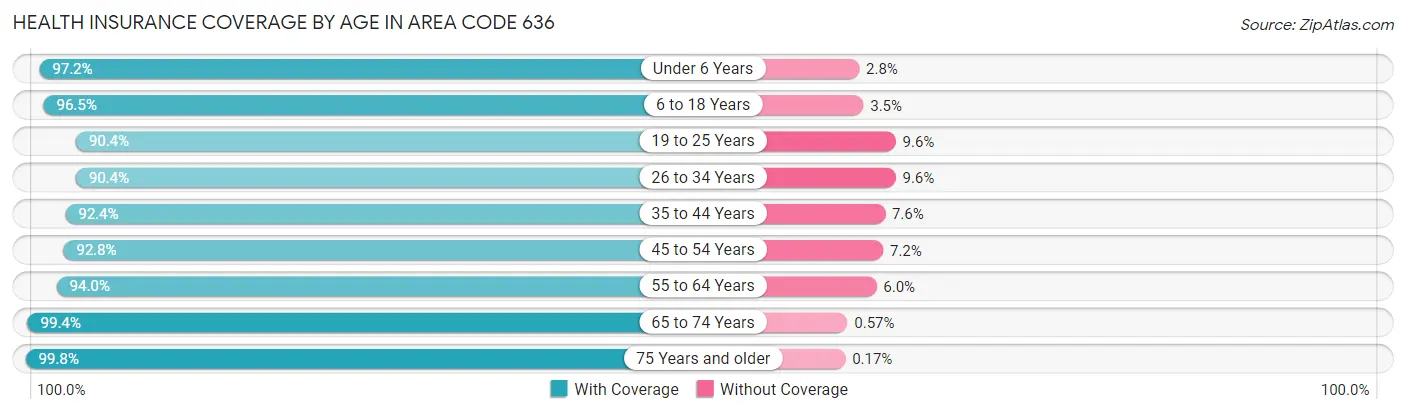
| Age Bracket | With Coverage | Without Coverage |
| Under 6 Years | 78,868 (97.2%) | 2,241 (2.8%) |
| 6 to 18 Years | 189,875 (96.5%) | 6,972 (3.5%) |
| 19 to 25 Years | 82,079 (90.4%) | 8,689 (9.6%) |
| 26 to 34 Years | 115,996 (90.4%) | 12,256 (9.6%) |
| 35 to 44 Years | 142,196 (92.4%) | 11,673 (7.6%) |
| 45 to 54 Years | 137,174 (92.8%) | 10,674 (7.2%) |
| 55 to 64 Years | 152,664 (94.0%) | 9,712 (6.0%) |
| 65 to 74 Years | 117,475 (99.4%) | 676 (0.6%) |
| 75 Years and older | 77,939 (99.8%) | 135 (0.2%) |
| Total | 1,094,266 (94.6%) | 63,028 (5.4%) |
Health Insurance Coverage by Citizenship Status in Area Code 636
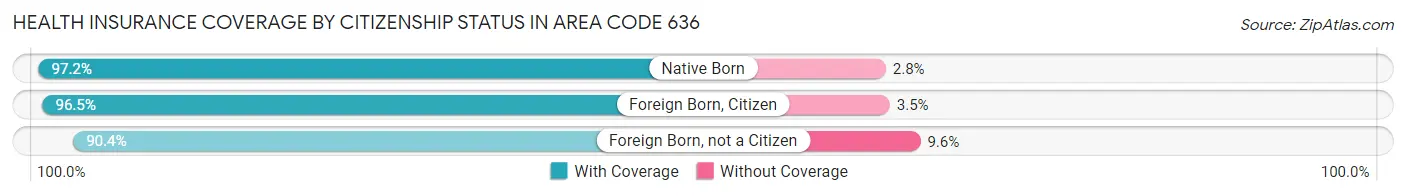
| Citizenship Status | With Coverage | Without Coverage |
| Native Born | 78,868 (97.2%) | 2,241 (2.8%) |
| Foreign Born, Citizen | 189,875 (96.5%) | 6,972 (3.5%) |
| Foreign Born, not a Citizen | 82,079 (90.4%) | 8,689 (9.6%) |
Health Insurance Coverage by Household Income in Area Code 636
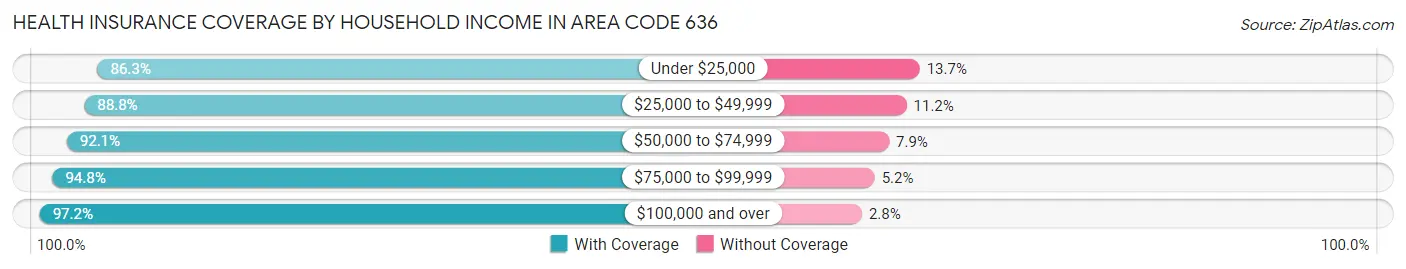
| Household Income | With Coverage | Without Coverage |
| Under $25,000 | 60,569 (86.3%) | 9,585 (13.7%) |
| $25,000 to $49,999 | 115,925 (88.8%) | 14,637 (11.2%) |
| $50,000 to $74,999 | 138,556 (92.1%) | 11,925 (7.9%) |
| $75,000 to $99,999 | 153,163 (94.8%) | 8,452 (5.2%) |
| $100,000 and over | 619,641 (97.2%) | 18,110 (2.8%) |
Public vs Private Health Insurance Coverage by Age in Area Code 636
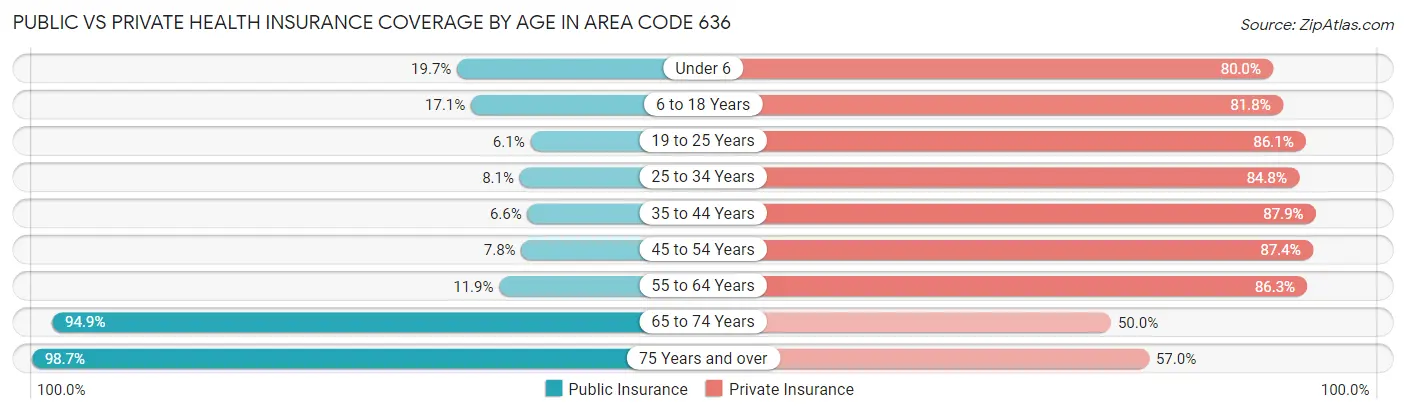
| Age Bracket | Public Insurance | Private Insurance |
| Under 6 | 15,989 (19.7%) | 64,883 (80.0%) |
| 6 to 18 Years | 33,706 (17.1%) | 160,999 (81.8%) |
| 19 to 25 Years | 5,536 (6.1%) | 78,122 (86.1%) |
| 25 to 34 Years | 10,371 (8.1%) | 108,767 (84.8%) |
| 35 to 44 Years | 10,216 (6.6%) | 135,249 (87.9%) |
| 45 to 54 Years | 11,503 (7.8%) | 129,186 (87.4%) |
| 55 to 64 Years | 19,302 (11.9%) | 140,173 (86.3%) |
| 65 to 74 Years | 112,123 (94.9%) | 59,036 (50.0%) |
| 75 Years and over | 77,041 (98.7%) | 44,518 (57.0%) |
| Total | 295,787 (25.6%) | 920,933 (79.6%) |
Disability Status by Sex by Age in Area Code 636
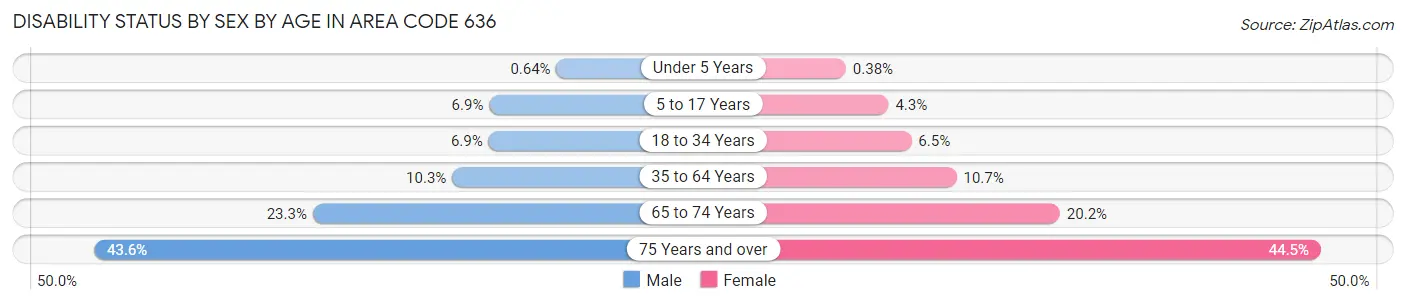
| Age Bracket | Male | Female |
| Under 5 Years | 212 (0.6%) | 123 (0.4%) |
| 5 to 17 Years | 6,991 (6.9%) | 4,153 (4.3%) |
| 18 to 34 Years | 8,187 (6.9%) | 7,459 (6.5%) |
| 35 to 64 Years | 23,916 (10.3%) | 24,752 (10.6%) |
| 65 to 74 Years | 12,932 (23.3%) | 12,663 (20.2%) |
| 75 Years and over | 14,203 (43.6%) | 20,218 (44.5%) |
Disability Class by Sex by Age in Area Code 636
Disability Class: Hearing Difficulty
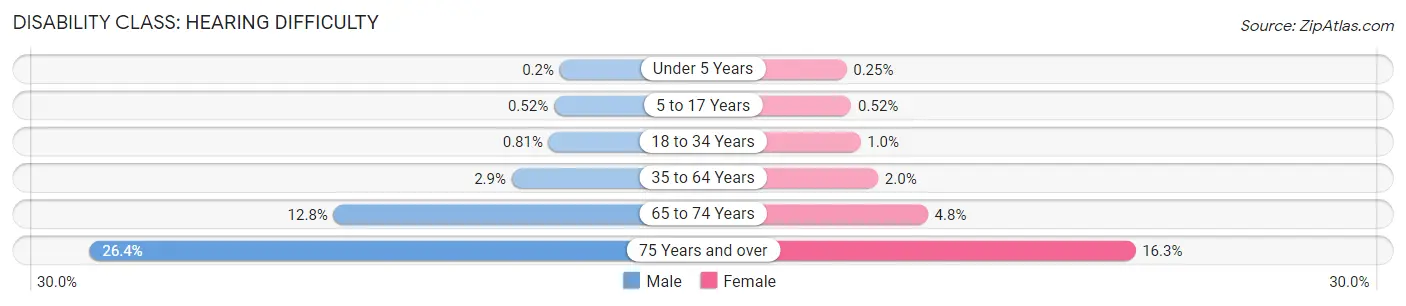
| Age Bracket | Male | Female |
| Under 5 Years | 68 (0.2%) | 83 (0.3%) |
| 5 to 17 Years | 533 (0.5%) | 500 (0.5%) |
| 18 to 34 Years | 960 (0.8%) | 1,194 (1.0%) |
| 35 to 64 Years | 6,651 (2.9%) | 4,676 (2.0%) |
| 65 to 74 Years | 7,112 (12.8%) | 2,993 (4.8%) |
| 75 Years and over | 8,603 (26.4%) | 7,431 (16.3%) |
Disability Class: Vision Difficulty
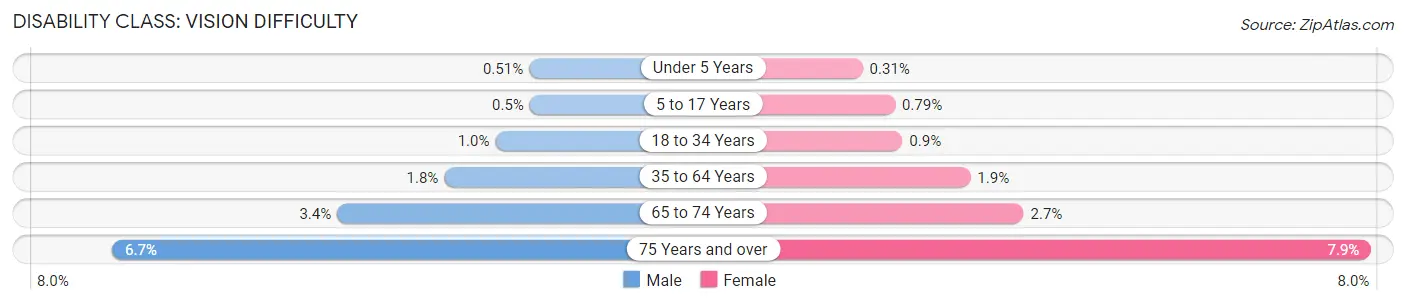
| Age Bracket | Male | Female |
| Under 5 Years | 170 (0.5%) | 100 (0.3%) |
| 5 to 17 Years | 508 (0.5%) | 757 (0.8%) |
| 18 to 34 Years | 1,197 (1.0%) | 1,033 (0.9%) |
| 35 to 64 Years | 4,109 (1.8%) | 4,435 (1.9%) |
| 65 to 74 Years | 1,866 (3.4%) | 1,689 (2.7%) |
| 75 Years and over | 2,185 (6.7%) | 3,573 (7.9%) |
Disability Class: Cognitive Difficulty
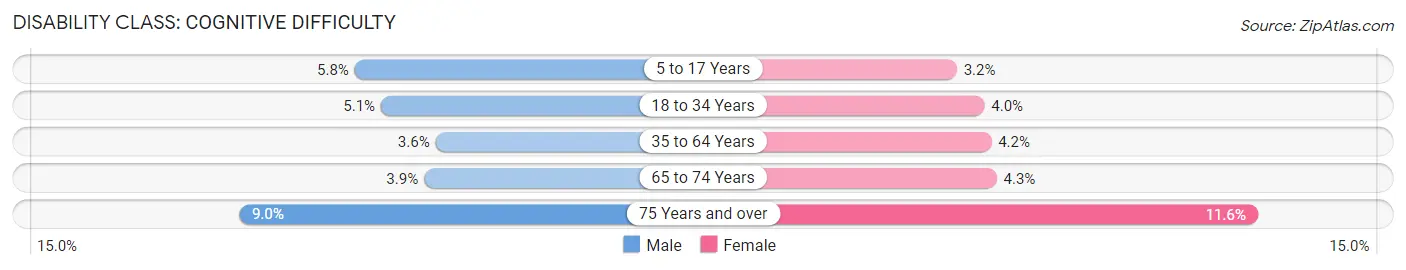
| Age Bracket | Male | Female |
| 5 to 17 Years | 5,897 (5.8%) | 3,074 (3.2%) |
| 18 to 34 Years | 5,988 (5.1%) | 4,575 (4.0%) |
| 35 to 64 Years | 8,247 (3.6%) | 9,680 (4.2%) |
| 65 to 74 Years | 2,155 (3.9%) | 2,699 (4.3%) |
| 75 Years and over | 2,945 (9.0%) | 5,265 (11.6%) |
Disability Class: Ambulatory Difficulty
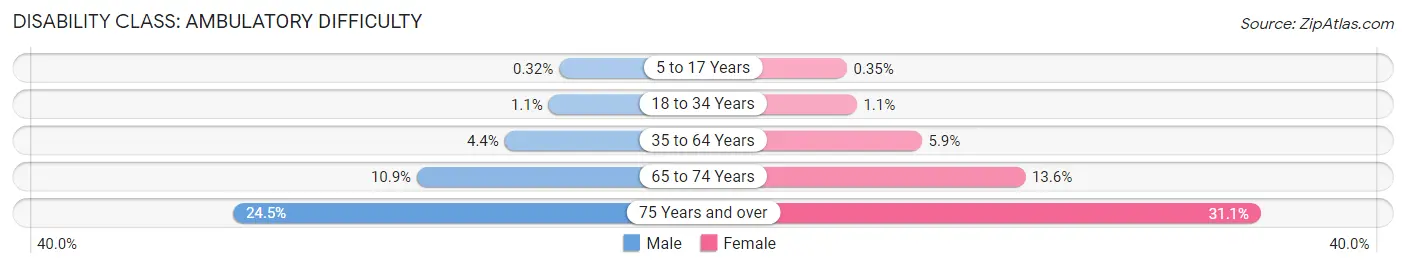
| Age Bracket | Male | Female |
| 5 to 17 Years | 327 (0.3%) | 333 (0.4%) |
| 18 to 34 Years | 1,298 (1.1%) | 1,258 (1.1%) |
| 35 to 64 Years | 10,111 (4.4%) | 13,751 (5.9%) |
| 65 to 74 Years | 6,043 (10.9%) | 8,508 (13.6%) |
| 75 Years and over | 7,996 (24.5%) | 14,147 (31.1%) |
Disability Class: Self-Care Difficulty
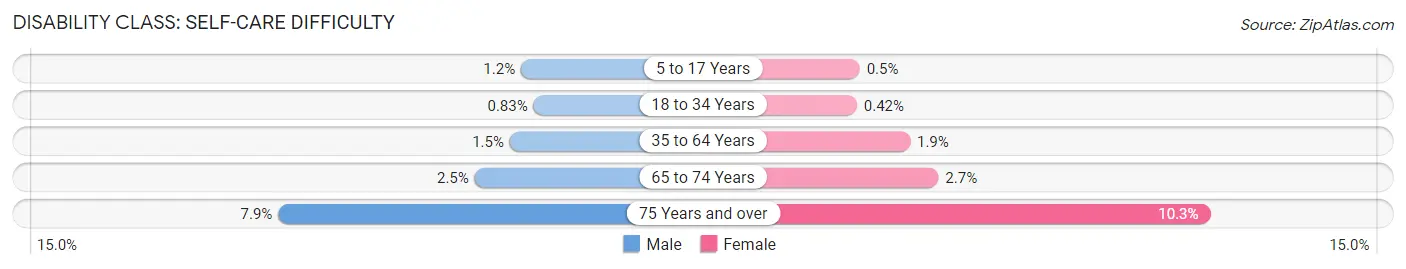
| Age Bracket | Male | Female |
| 5 to 17 Years | 1,200 (1.2%) | 483 (0.5%) |
| 18 to 34 Years | 974 (0.8%) | 489 (0.4%) |
| 35 to 64 Years | 3,454 (1.5%) | 4,415 (1.9%) |
| 65 to 74 Years | 1,371 (2.5%) | 1,685 (2.7%) |
| 75 Years and over | 2,590 (7.9%) | 4,664 (10.3%) |
Technology Access in Area Code 636
Computing Device Access in Area Code 636
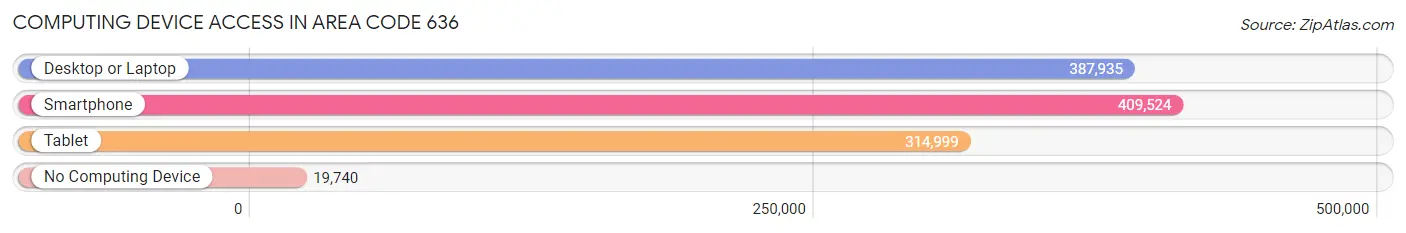
| Device Type | # Households | % Households |
| Desktop or Laptop | 387,935 | 85.2% |
| Smartphone | 409,524 | 89.9% |
| Tablet | 314,999 | 69.2% |
| No Computing Device | 19,740 | 4.3% |
| Total | 455,294 | 100.0% |
Internet Access in Area Code 636
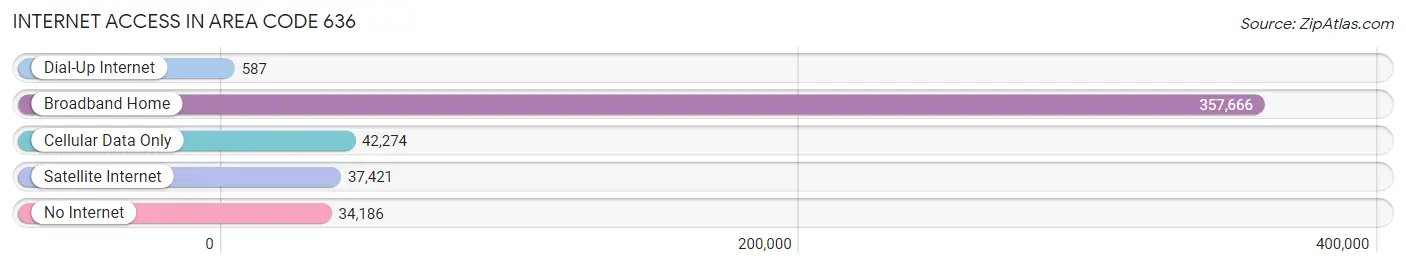
| Internet Type | # Households | % Households |
| Dial-Up Internet | 587 | 0.1% |
| Broadband Home | 357,666 | 78.6% |
| Cellular Data Only | 42,274 | 9.3% |
| Satellite Internet | 37,421 | 8.2% |
| No Internet | 34,186 | 7.5% |
| Total | 455,294 | 100.0% |
Area Code 636 Summary
Geography
Area code 636 is located in the state of Missouri and covers the eastern and western parts of the St. Louis metropolitan area. It includes the cities of St. Charles, O'Fallon, St. Peters, Wentzville, and Lake St. Louis. It also covers parts of Jefferson, Franklin, and St. Louis counties.
Social
Area code 636 is home to a diverse population of people from all walks of life. The area is known for its vibrant nightlife, with a variety of bars, restaurants, and entertainment venues. It is also home to a number of universities and colleges, including Washington University in St. Louis, St. Louis University, and Lindenwood University.
Economics
Area code 636 is a major economic hub in the St. Louis metropolitan area. It is home to a number of large corporations, including Express Scripts, Monsanto, and Edward Jones. The area also has a thriving small business community, with a variety of locally owned shops and restaurants.
Demographics
Area code 636 is home to a diverse population of people from all walks of life. According to the 2010 census, the population of the area was approximately 590,000 people. The median household income was $60,000, and the median age was 37. The area is also home to a large number of immigrants, with approximately 10% of the population being foreign-born.
Common Questions
What is Per Capita Income in Area Code 636?
Per Capita income in Area Code 636 is $43,334.
What is the Median Family Income in Area Code 636?
Median Family Income in Area Code 636 is $105,230.
What is the Median Household income in Area Code 636?
Median Household Income in Area Code 636 is $88,957.
What is Income or Wage Gap in Area Code 636?
Income or Wage Gap in Area Code 636 is 33.7%.
Women in Area Code 636 earn 66.3 cents for every dollar earned by a man.
What is Family Income Deficit in Area Code 636?
Family Income Deficit in Area Code 636 is $11,099.
Families that are below poverty line in Area Code 636 earn $11,099 less on average than the poverty threshold level.
What is Inequality or Gini Index in Area Code 636?
Inequality or Gini Index in Area Code 636 is 27.85.
What is the Total Population of Area Code 636?
Total Population of Area Code 636 is 1,167,395.
What is the Total Male Population of Area Code 636?
Total Male Population of Area Code 636 is 577,765.
What is the Total Female Population of Area Code 636?
Total Female Population of Area Code 636 is 589,630.
What is the Ratio of Males per 100 Females in Area Code 636?
There are 97.99 Males per 100 Females in Area Code 636.
What is the Ratio of Females per 100 Males in Area Code 636?
There are 102.05 Females per 100 Males in Area Code 636.
What is the Median Population Age in Area Code 636?
Median Population Age in Area Code 636 is 41.6 Years.
What is the Average Family Size in Area Code 636
Average Family Size in Area Code 636 is 3.0 People.
What is the Average Household Size in Area Code 636
Average Household Size in Area Code 636 is 2.6 People.
How Large is the Labor Force in Area Code 636?
There are 600,004 People in the Labor Forcein in Area Code 636.
What is the Percentage of People in the Labor Force in Area Code 636?
64.2% of People are in the Labor Force in Area Code 636.
What is the Unemployment Rate in Area Code 636?
Unemployment Rate in Area Code 636 is 4.2%.